

Vestibular Schwannoma Volume and Tumor Growth Correlates with Macrophage Marker Expression
 ,
,  , , and
Abstract
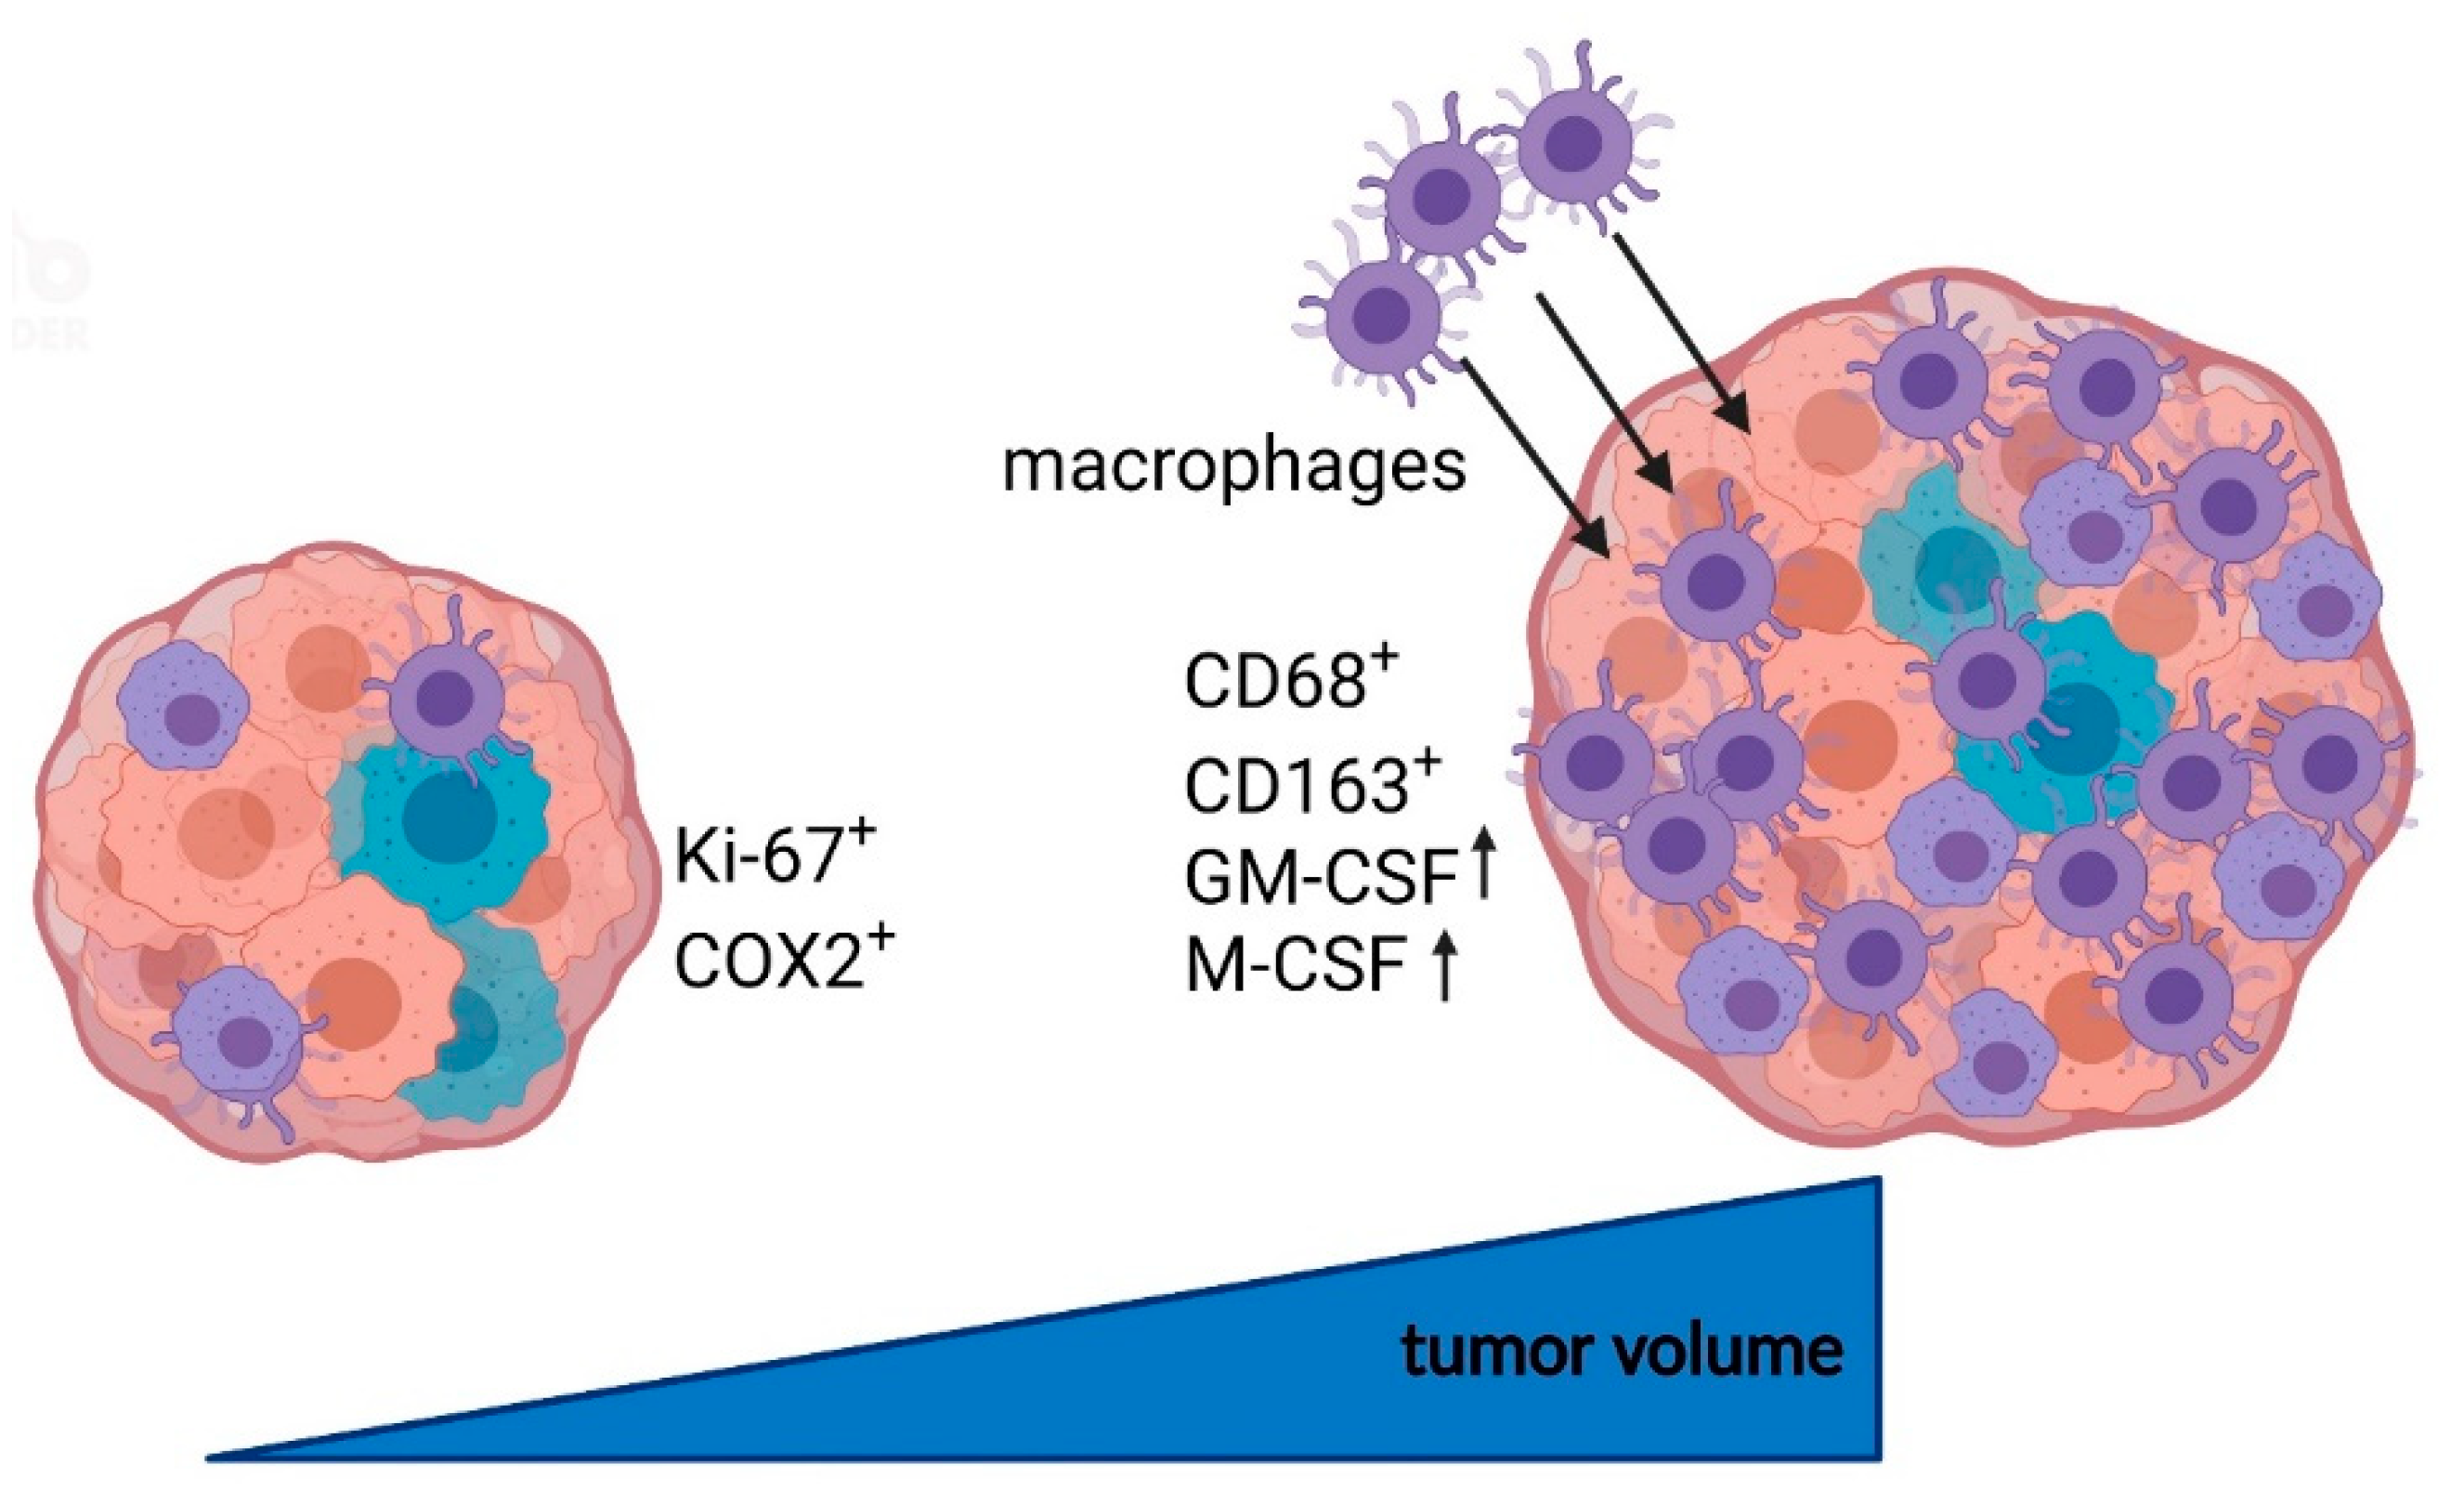
:Simple Summary
Abstract
1. Introduction
2. Materials and Methods
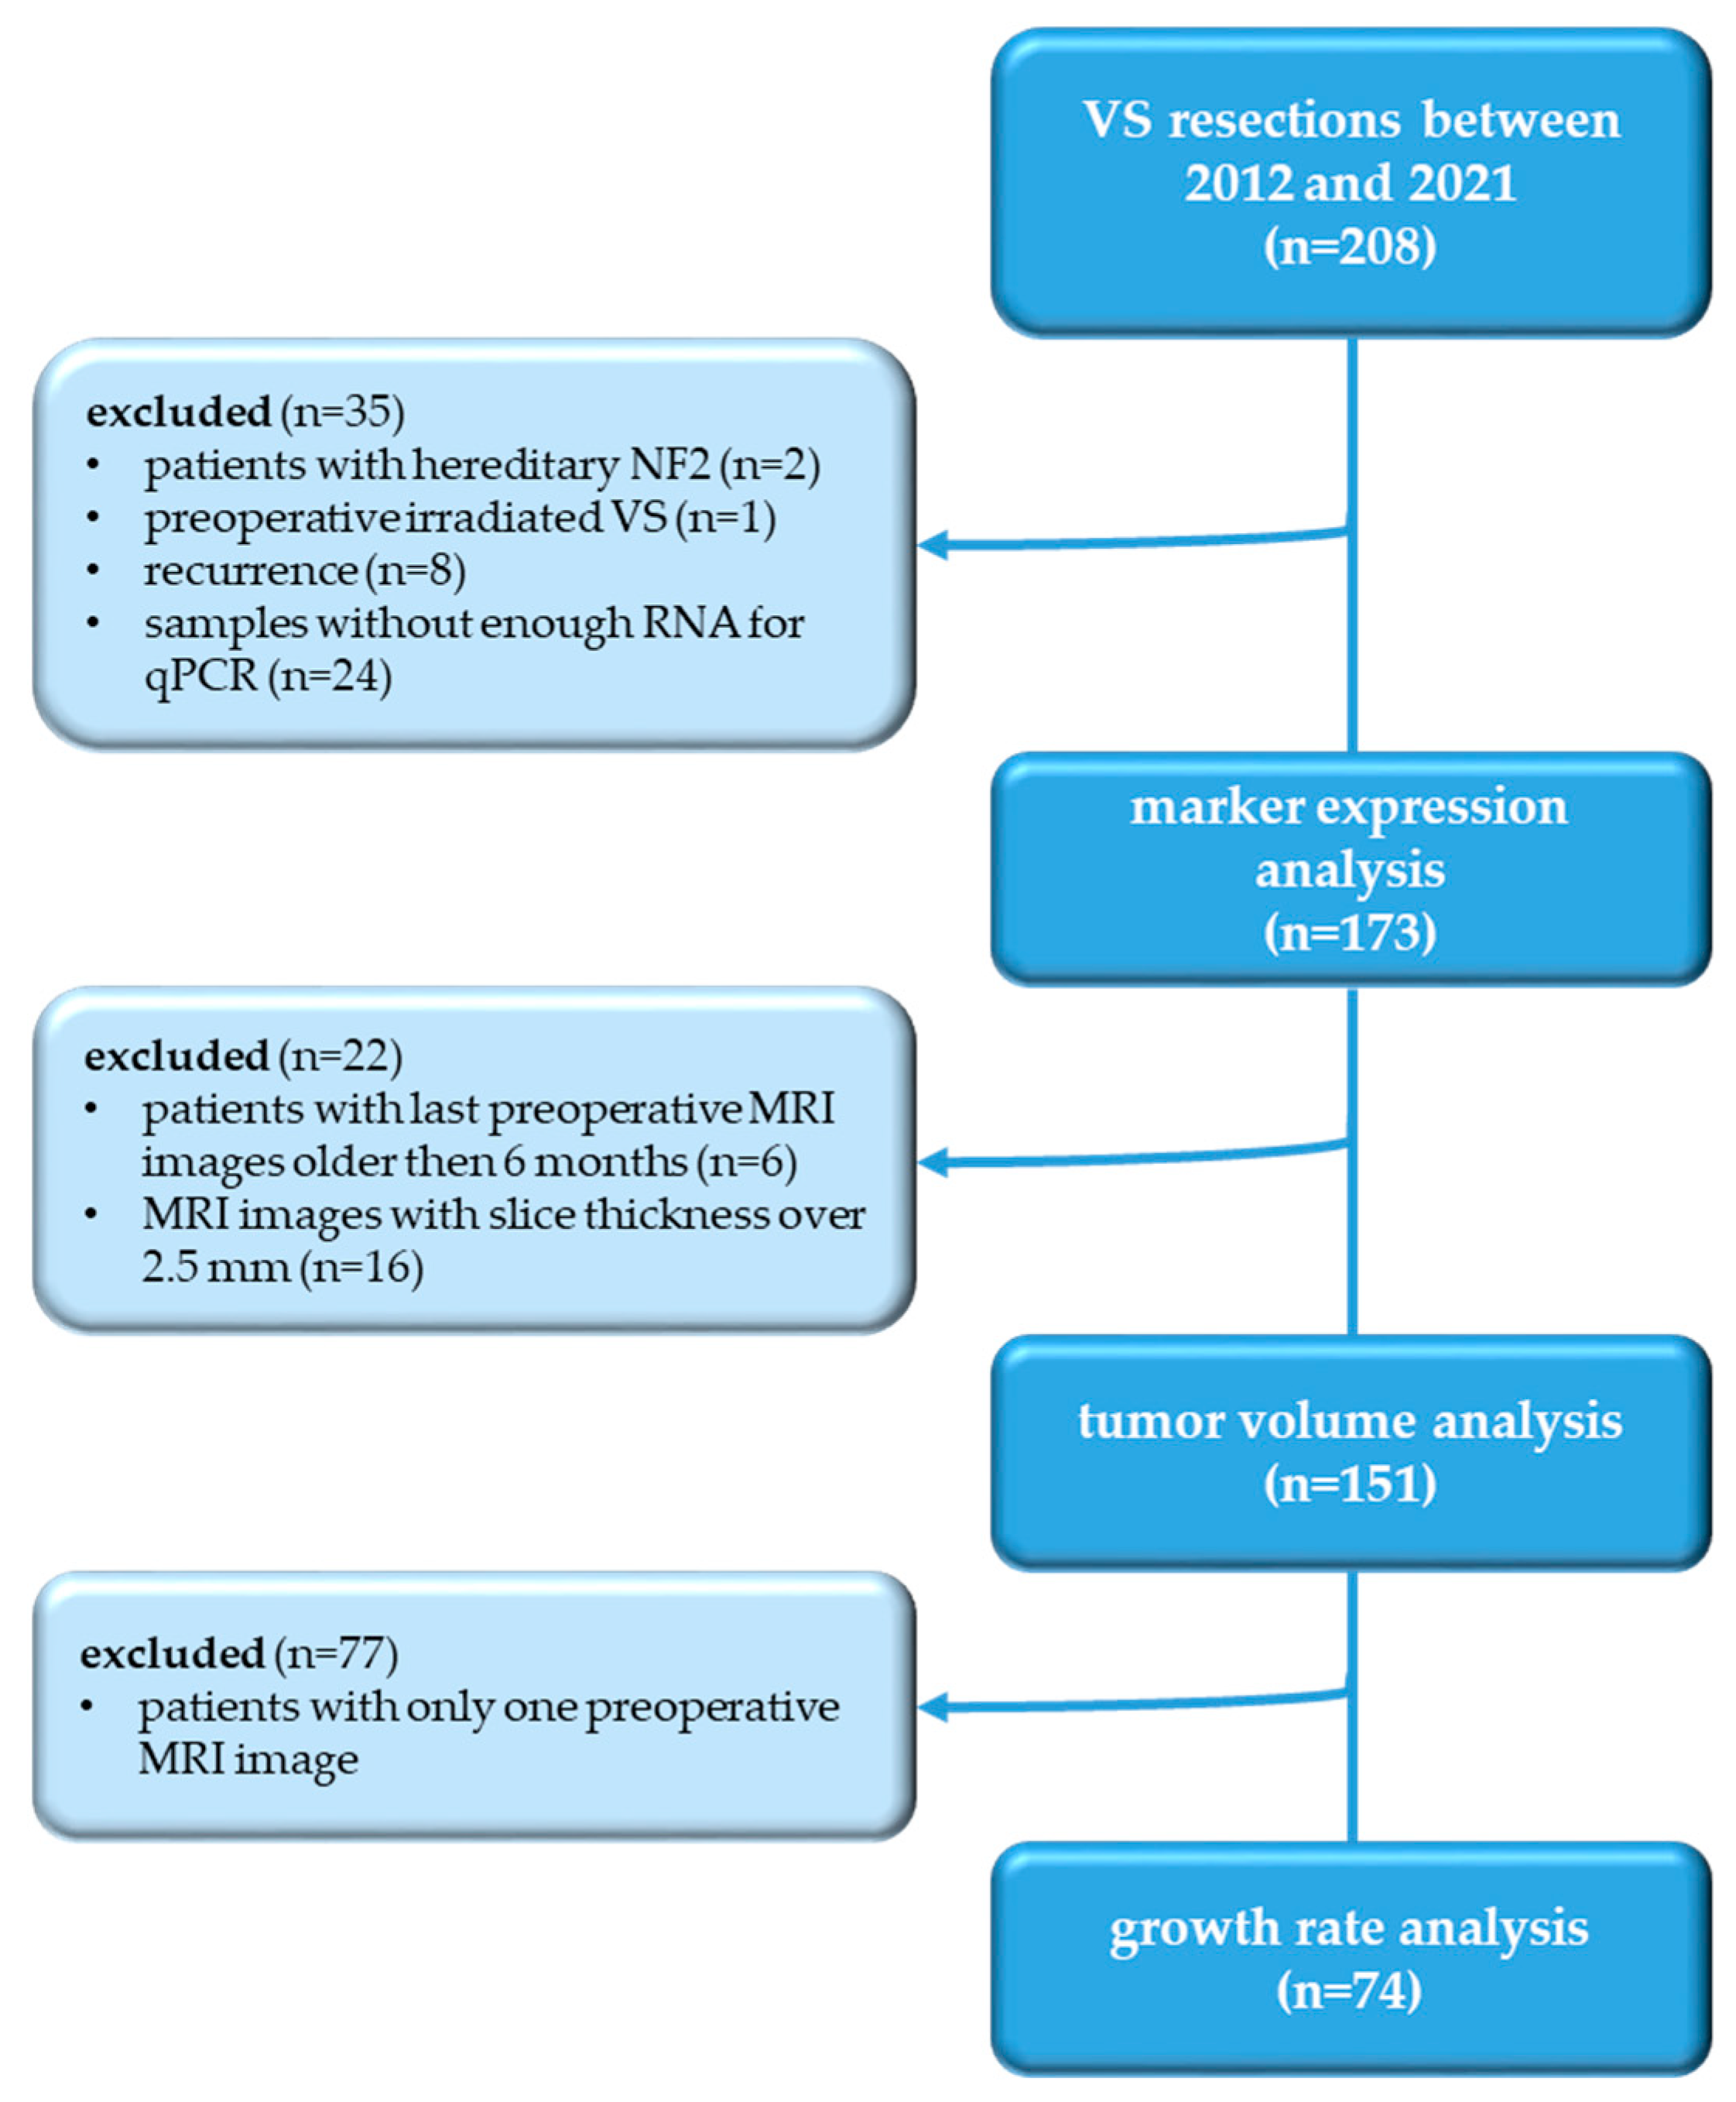
2.1. Study Design
2.2. Tumor Volumetry
2.3. RNA Isolation and Reverse Transcription
2.4. Quantitative Real-Time PCR
2.5. Immunohistochemistry
2.6. Statistical Analysis
3. Results
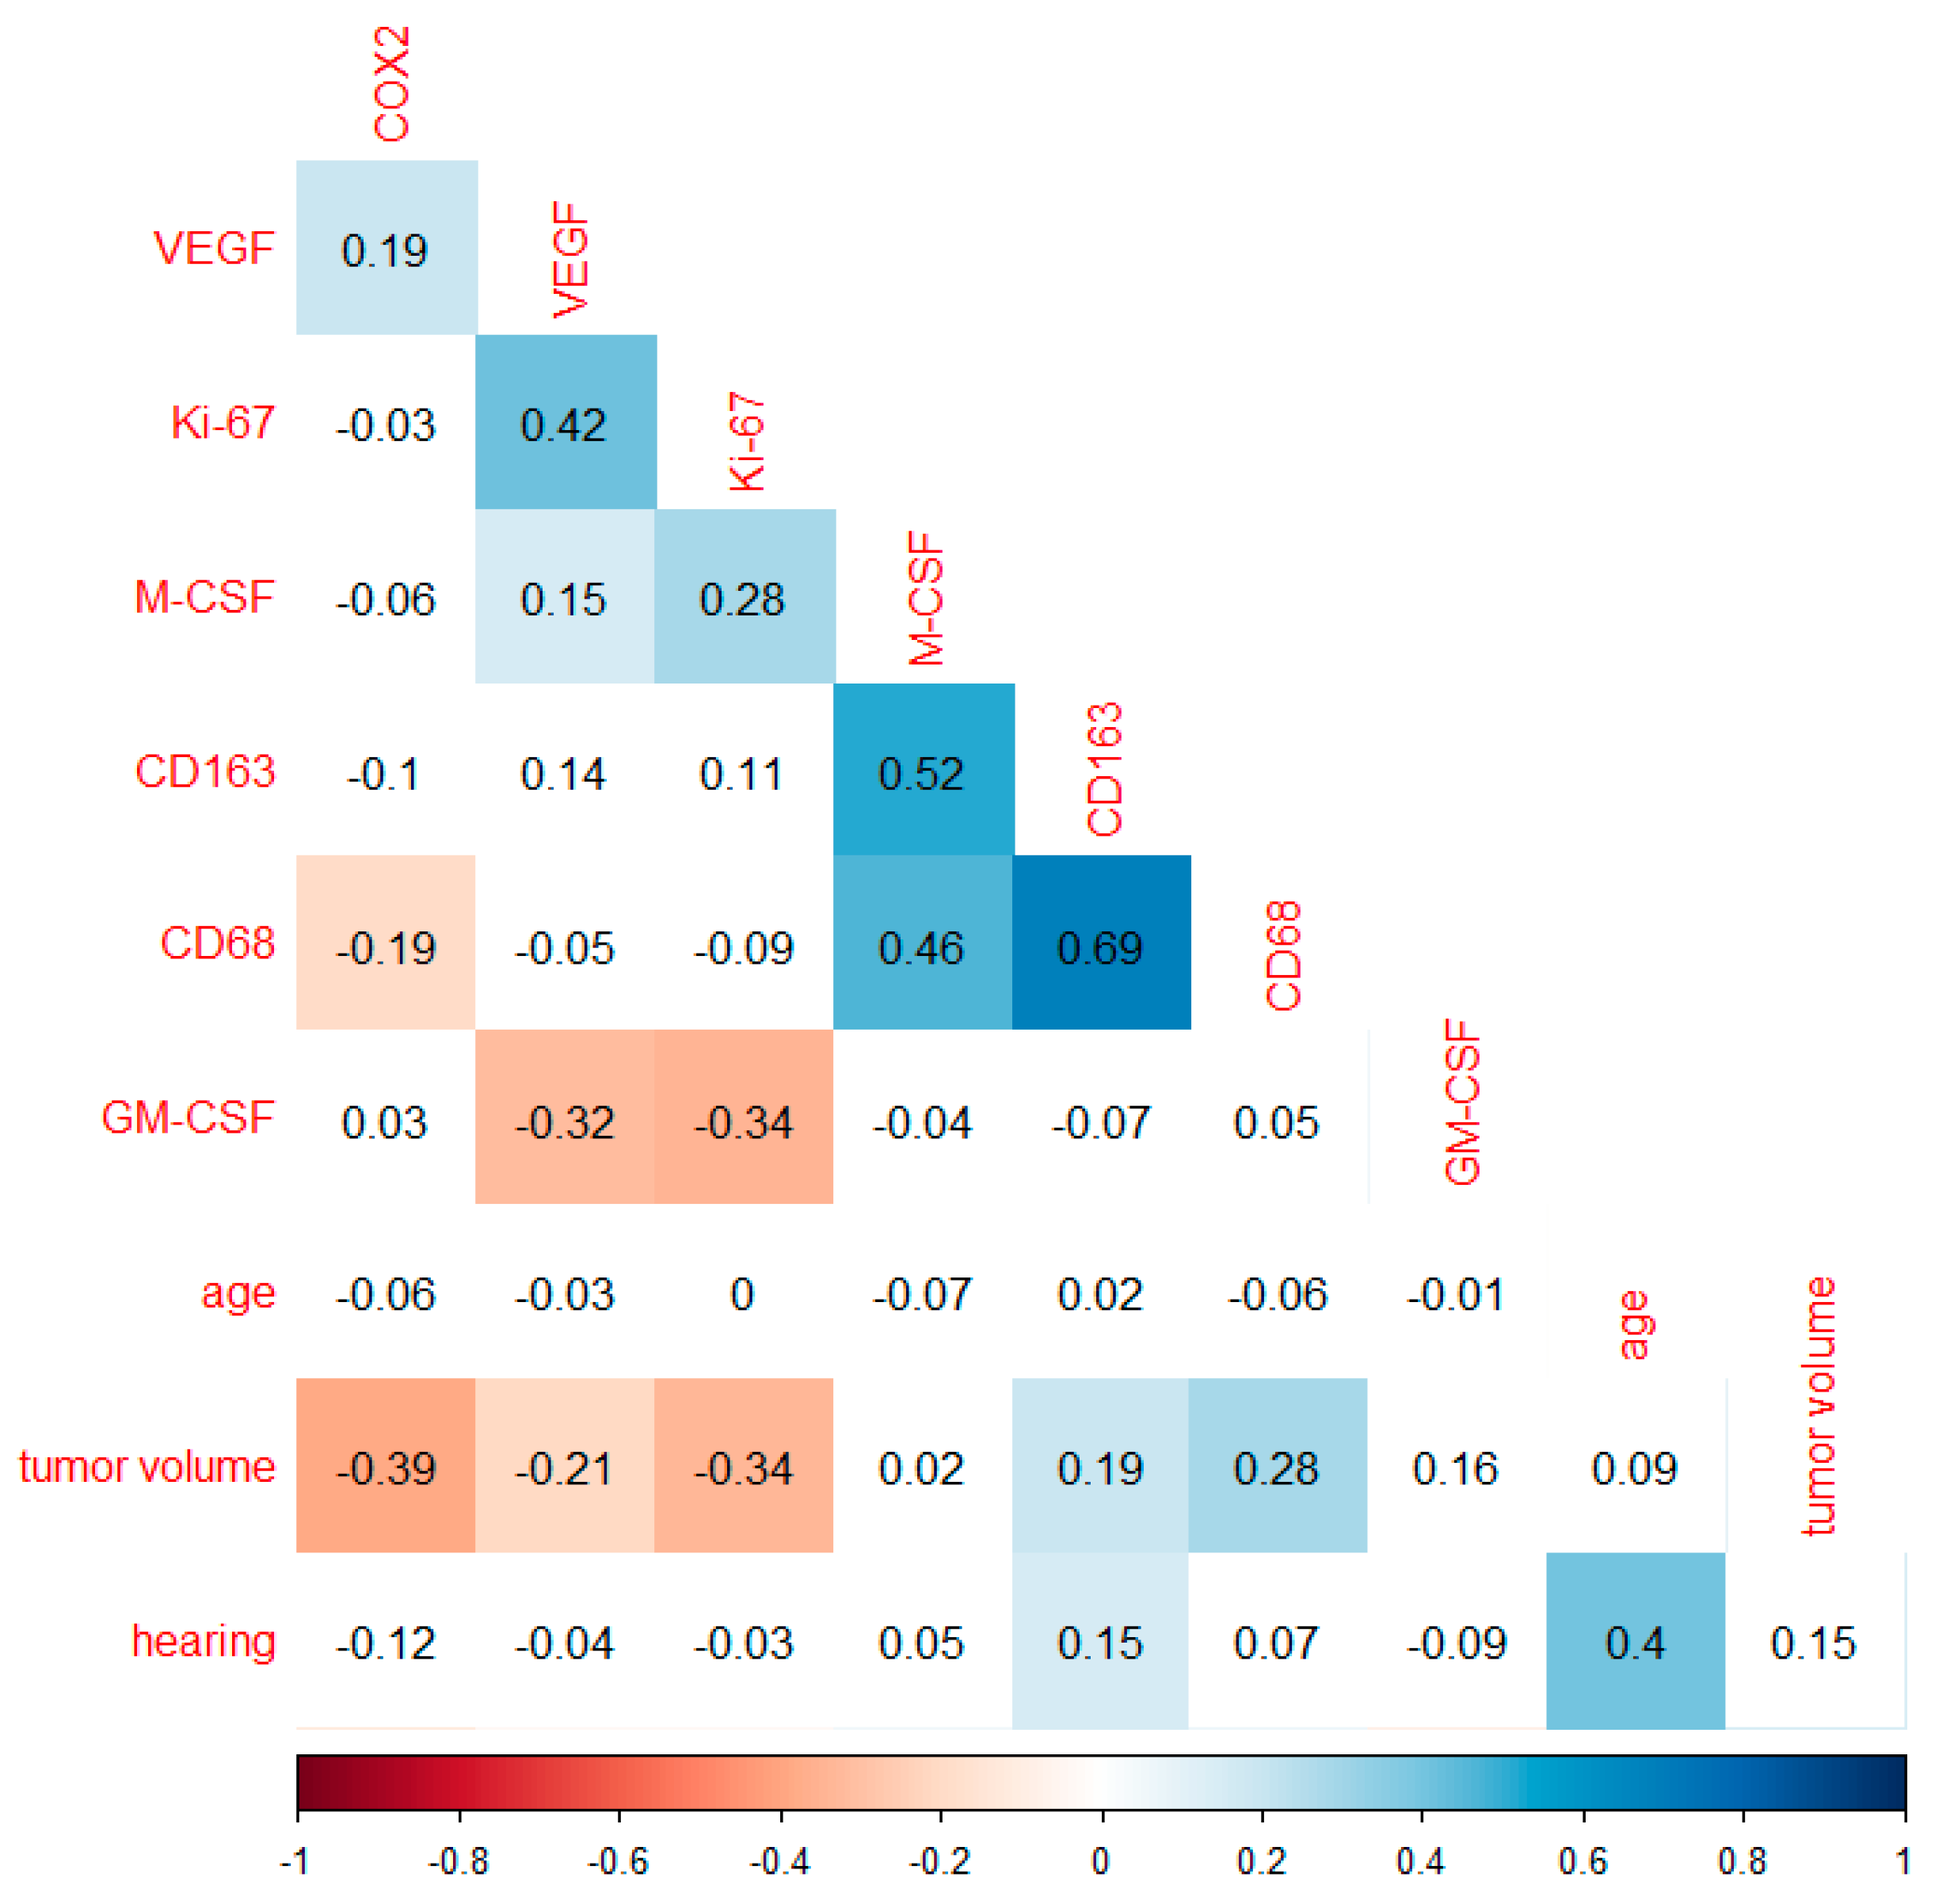
3.1. Correlation Analysis of Markers Investigated and Tumor Volume
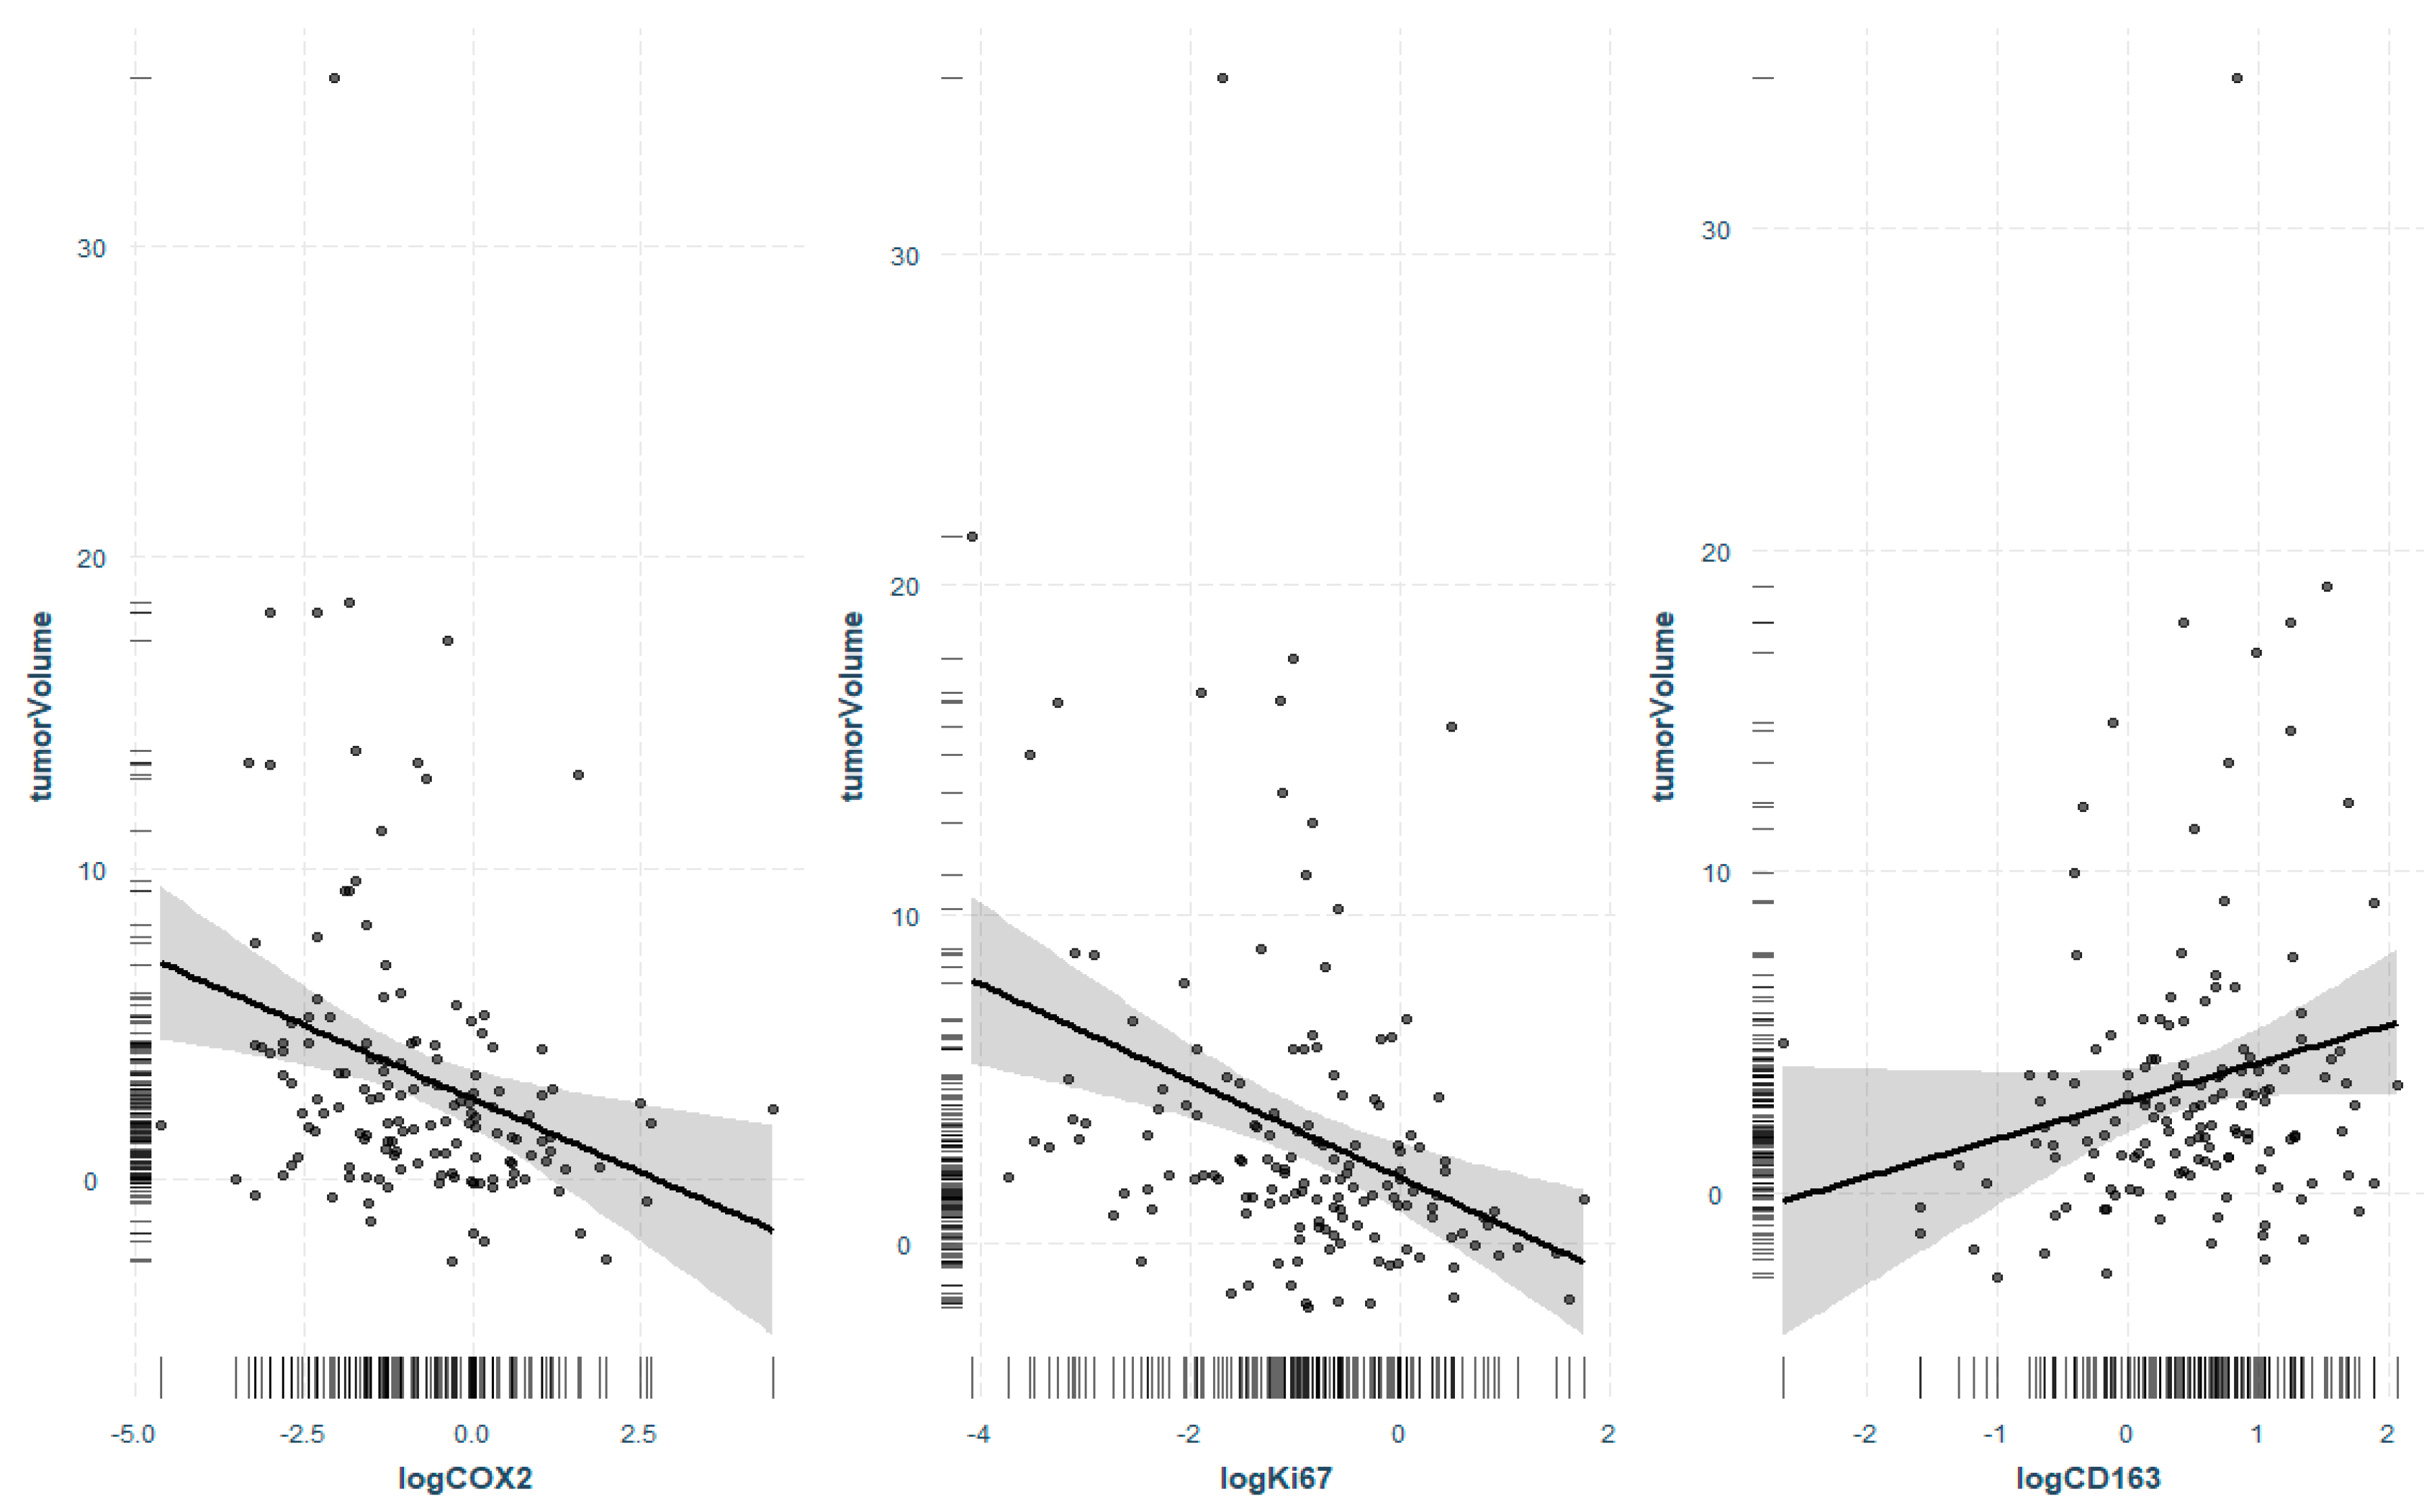
3.2. Regression Analysis of Significant Markers and Tumor Volume
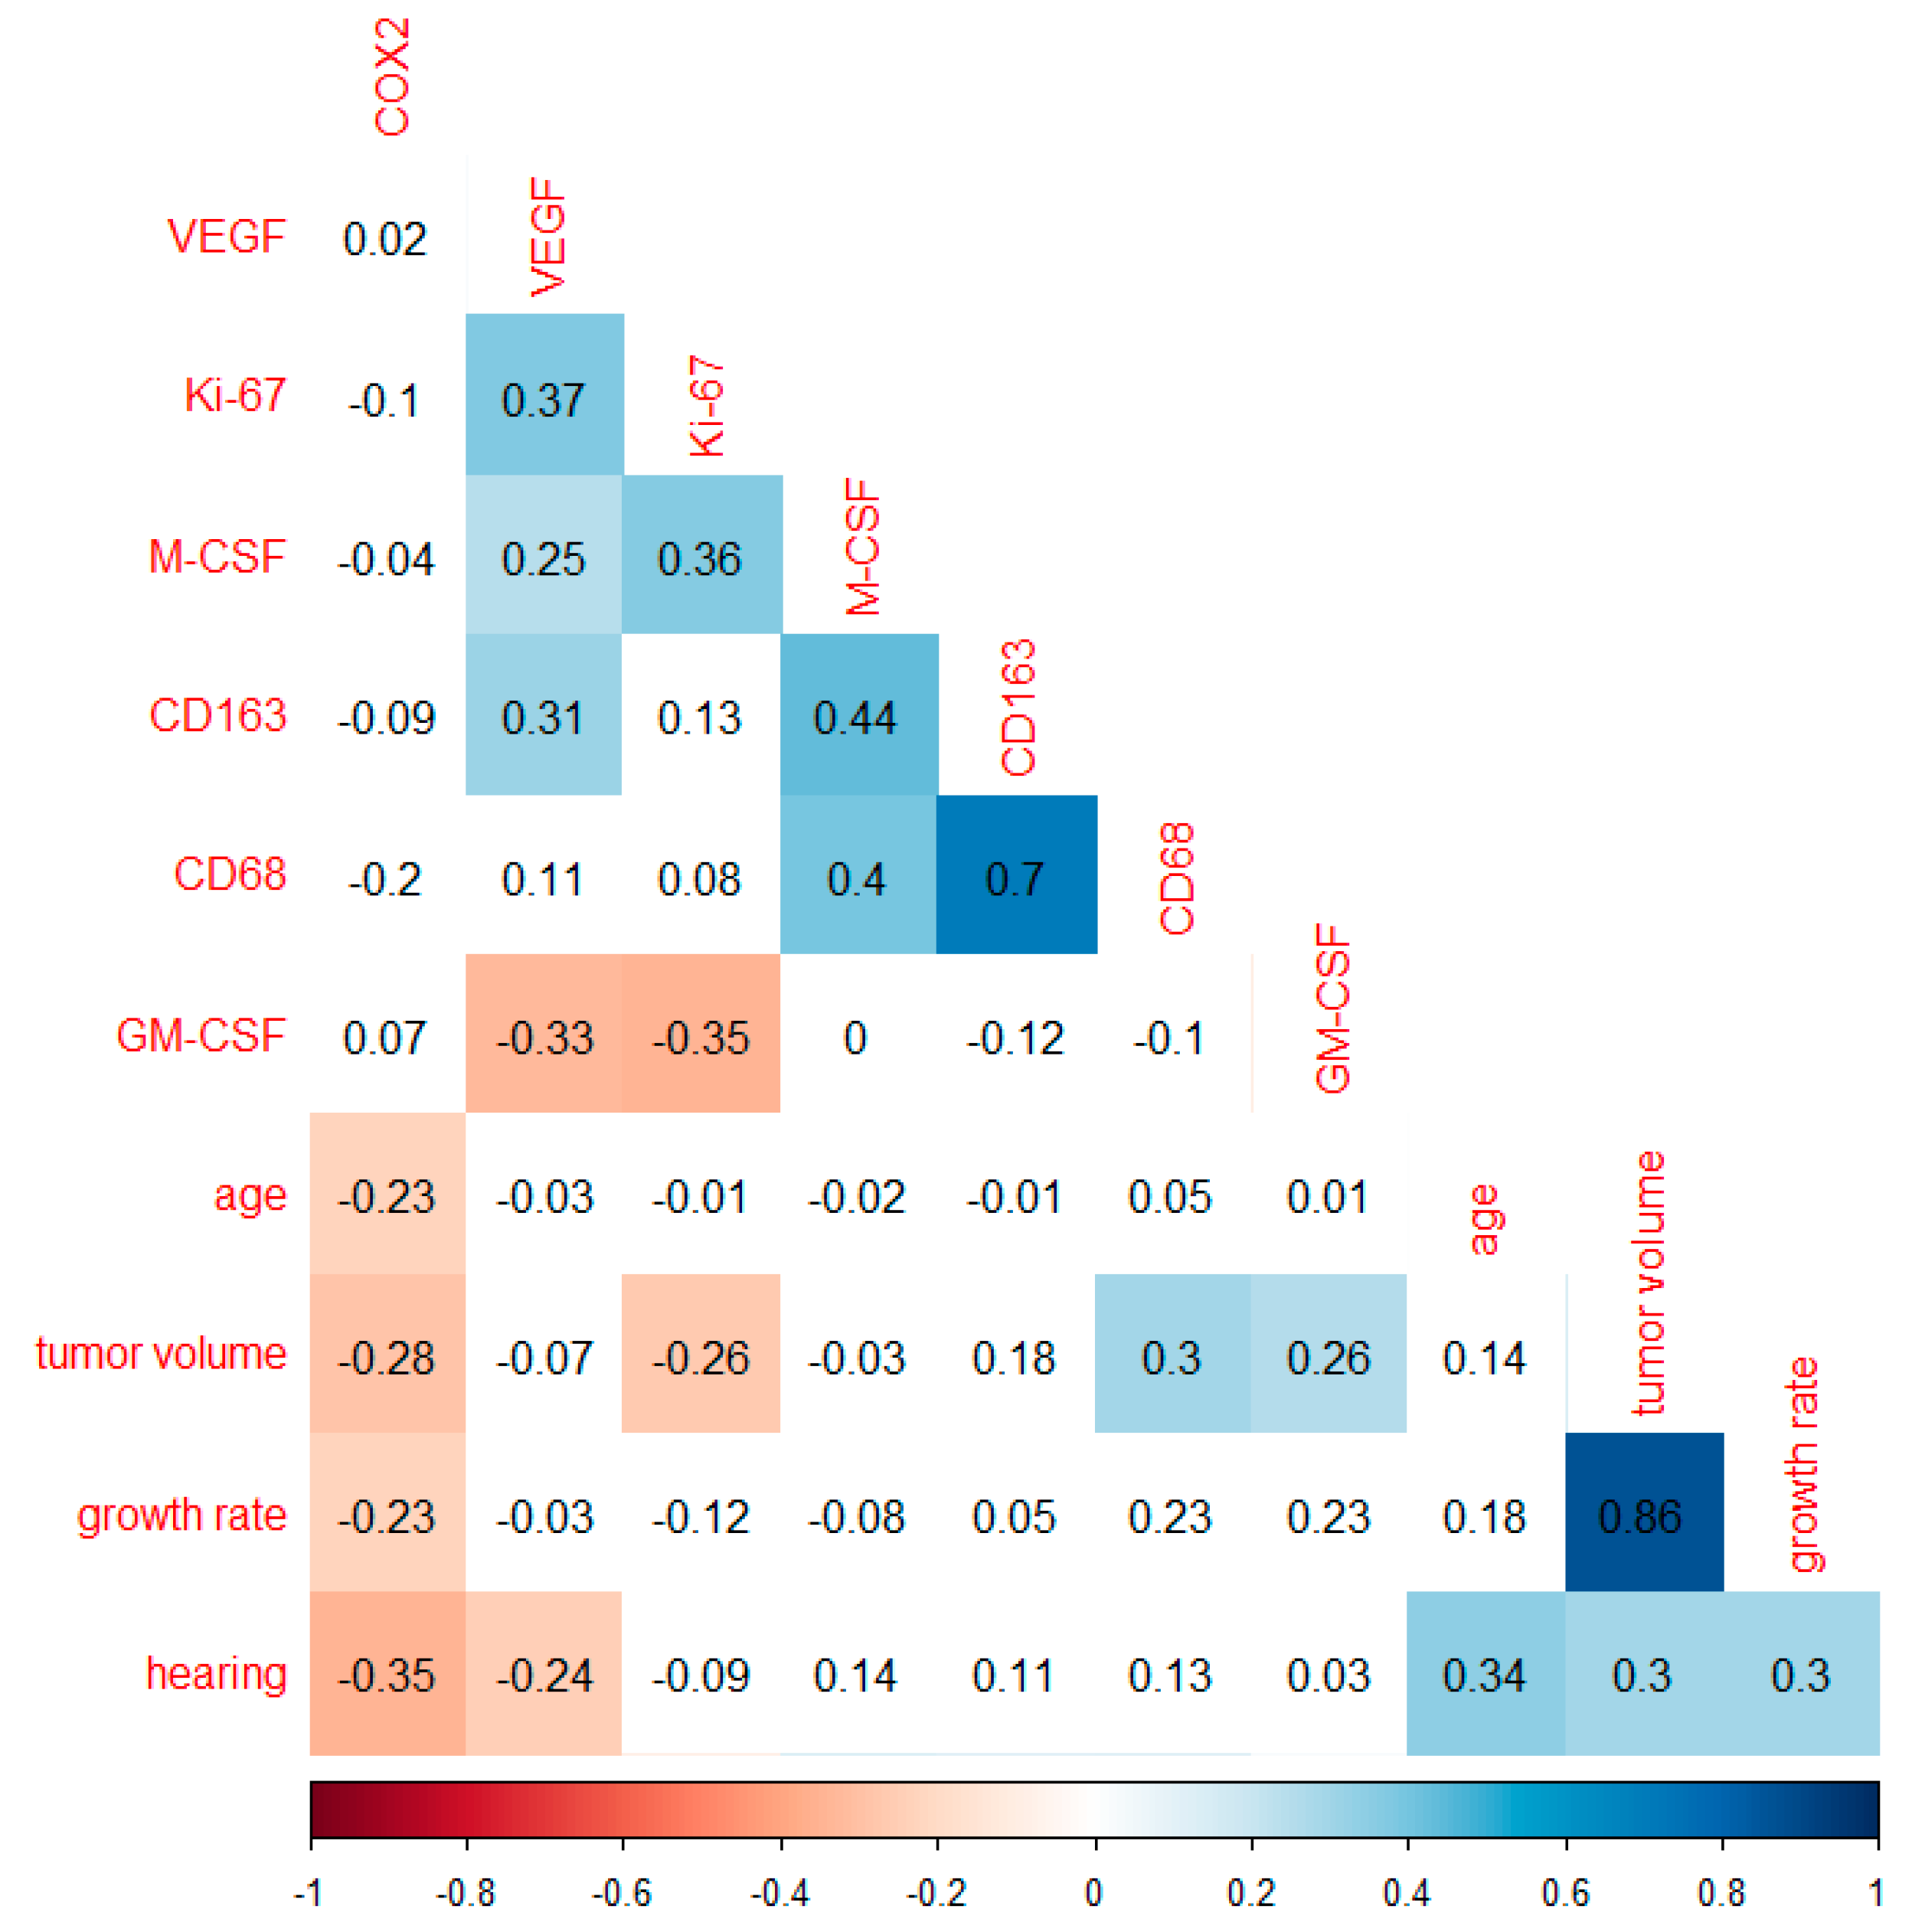
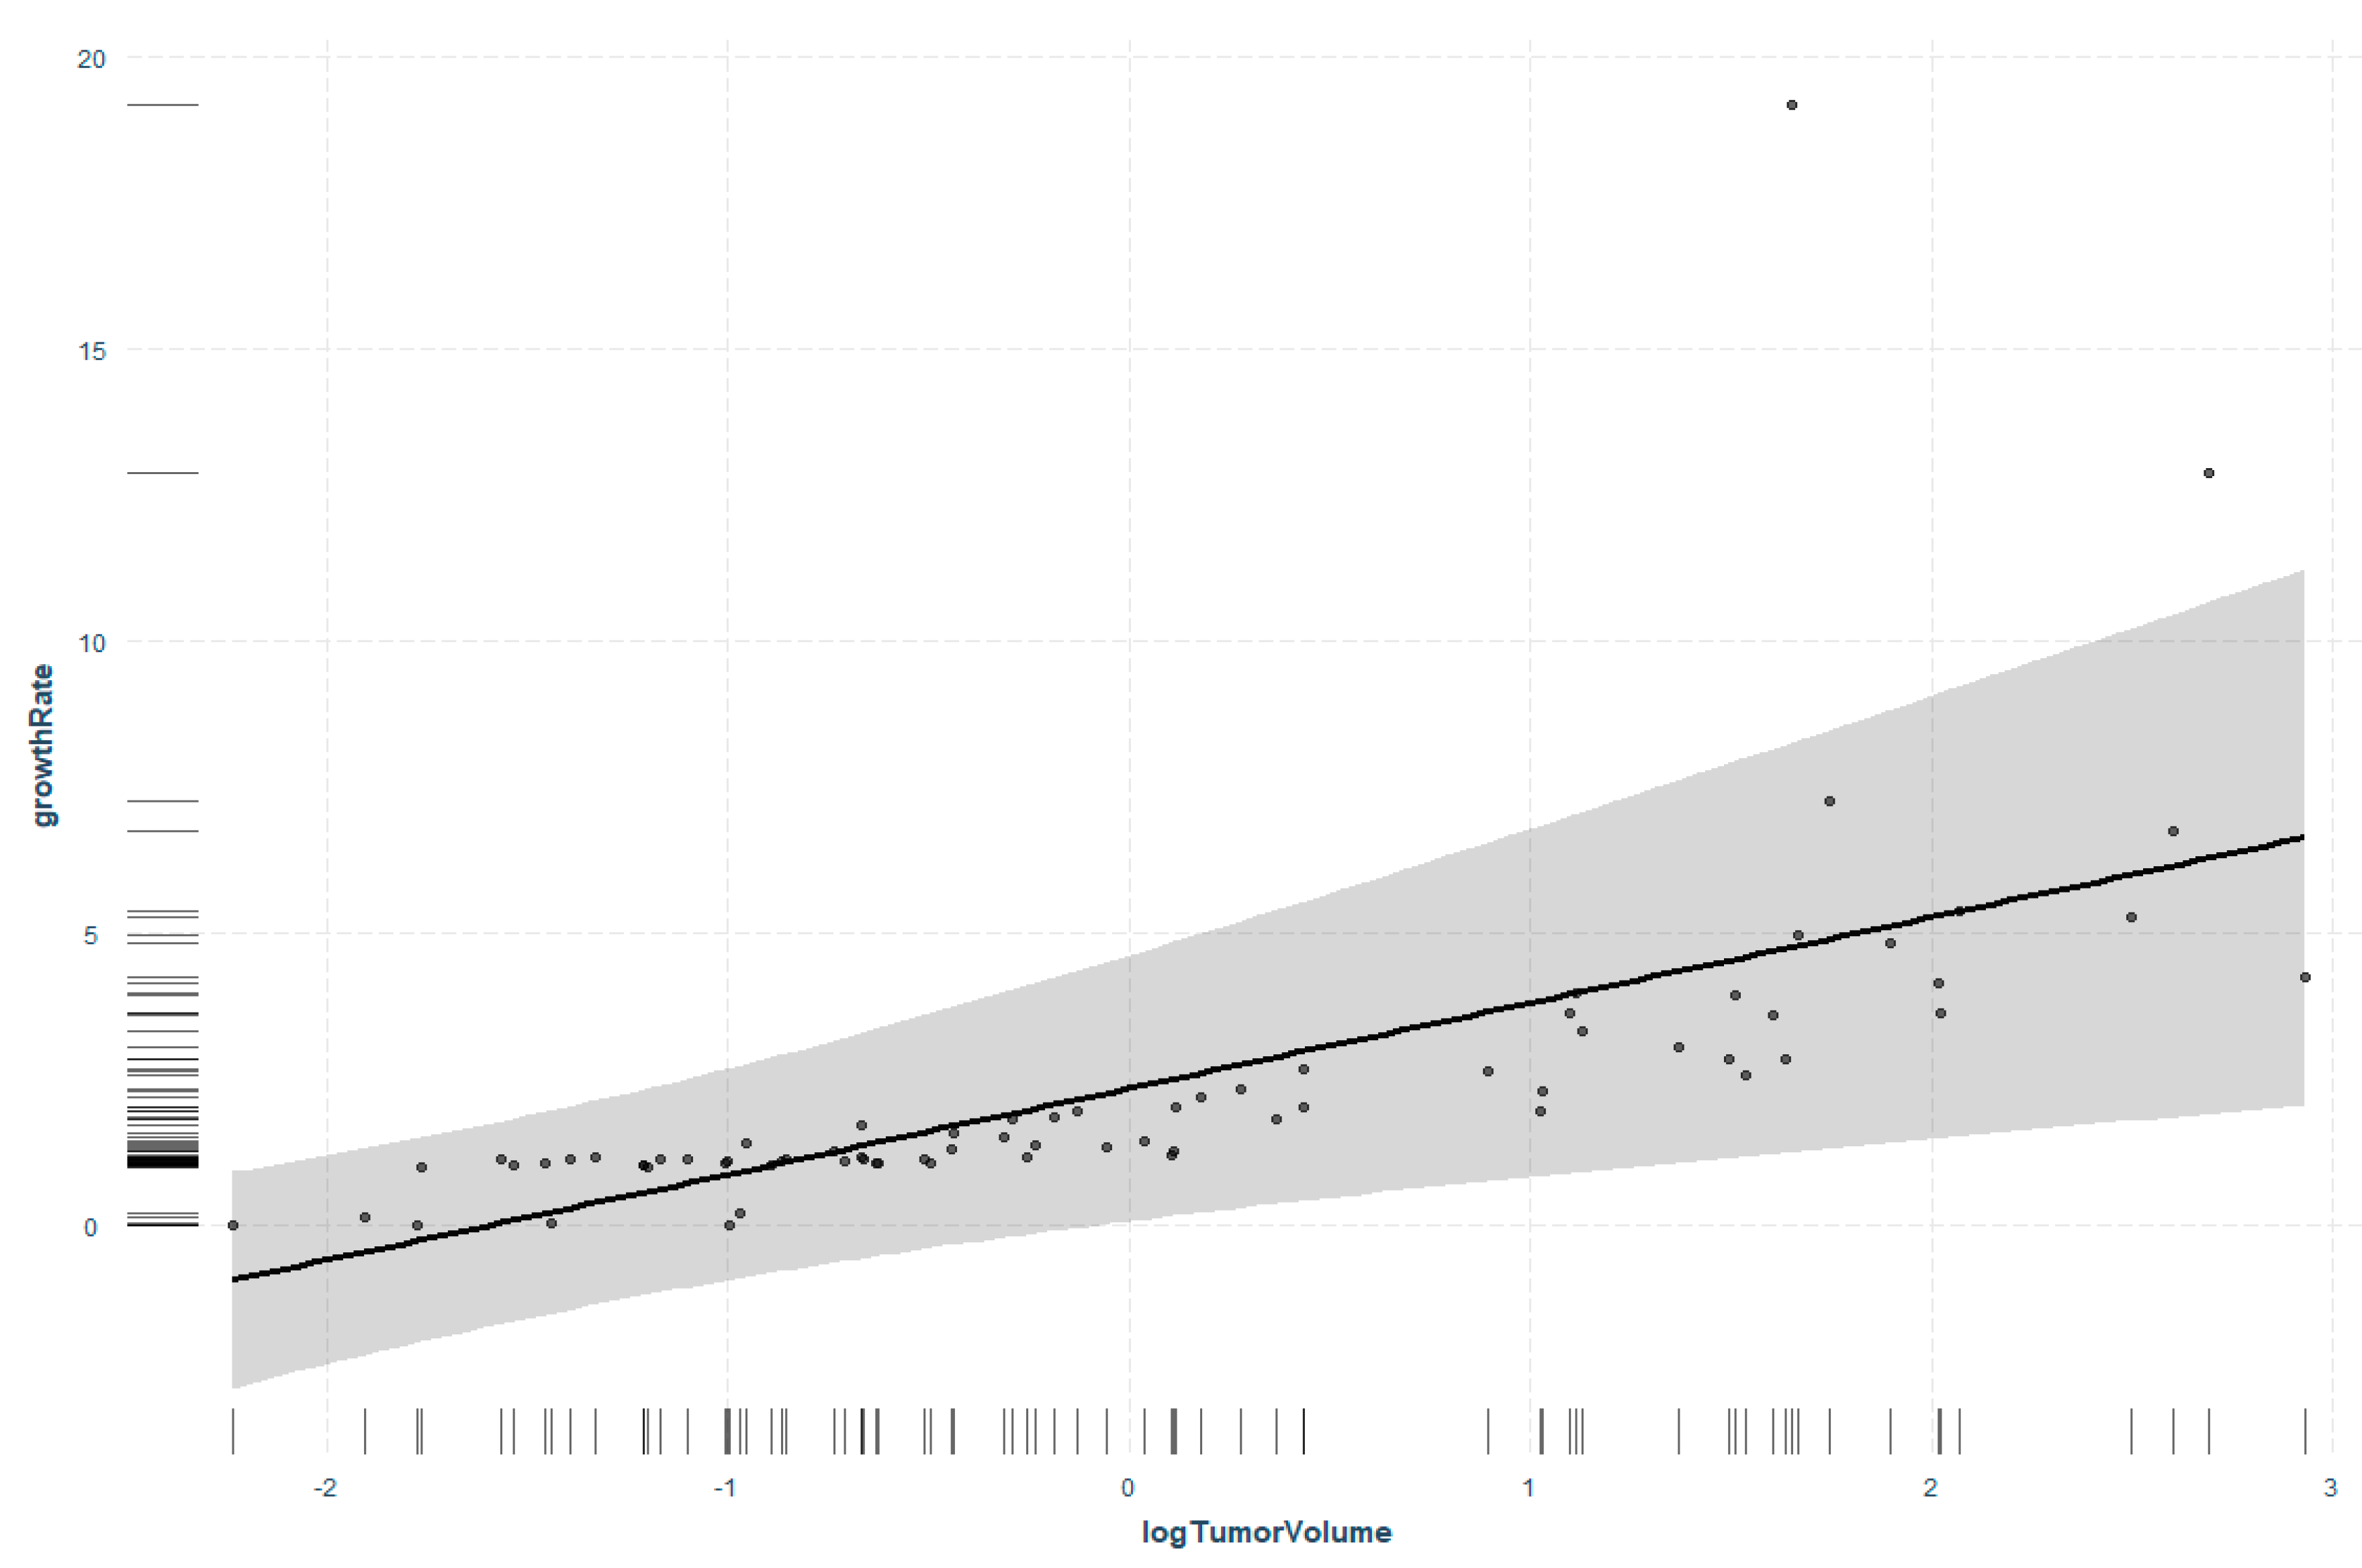
3.3. Correlation Analysis of Markers Investigated and Tumor Growth Rate
3.4. Regression Analysis of Tumor Volume and Tumor Growth Rate
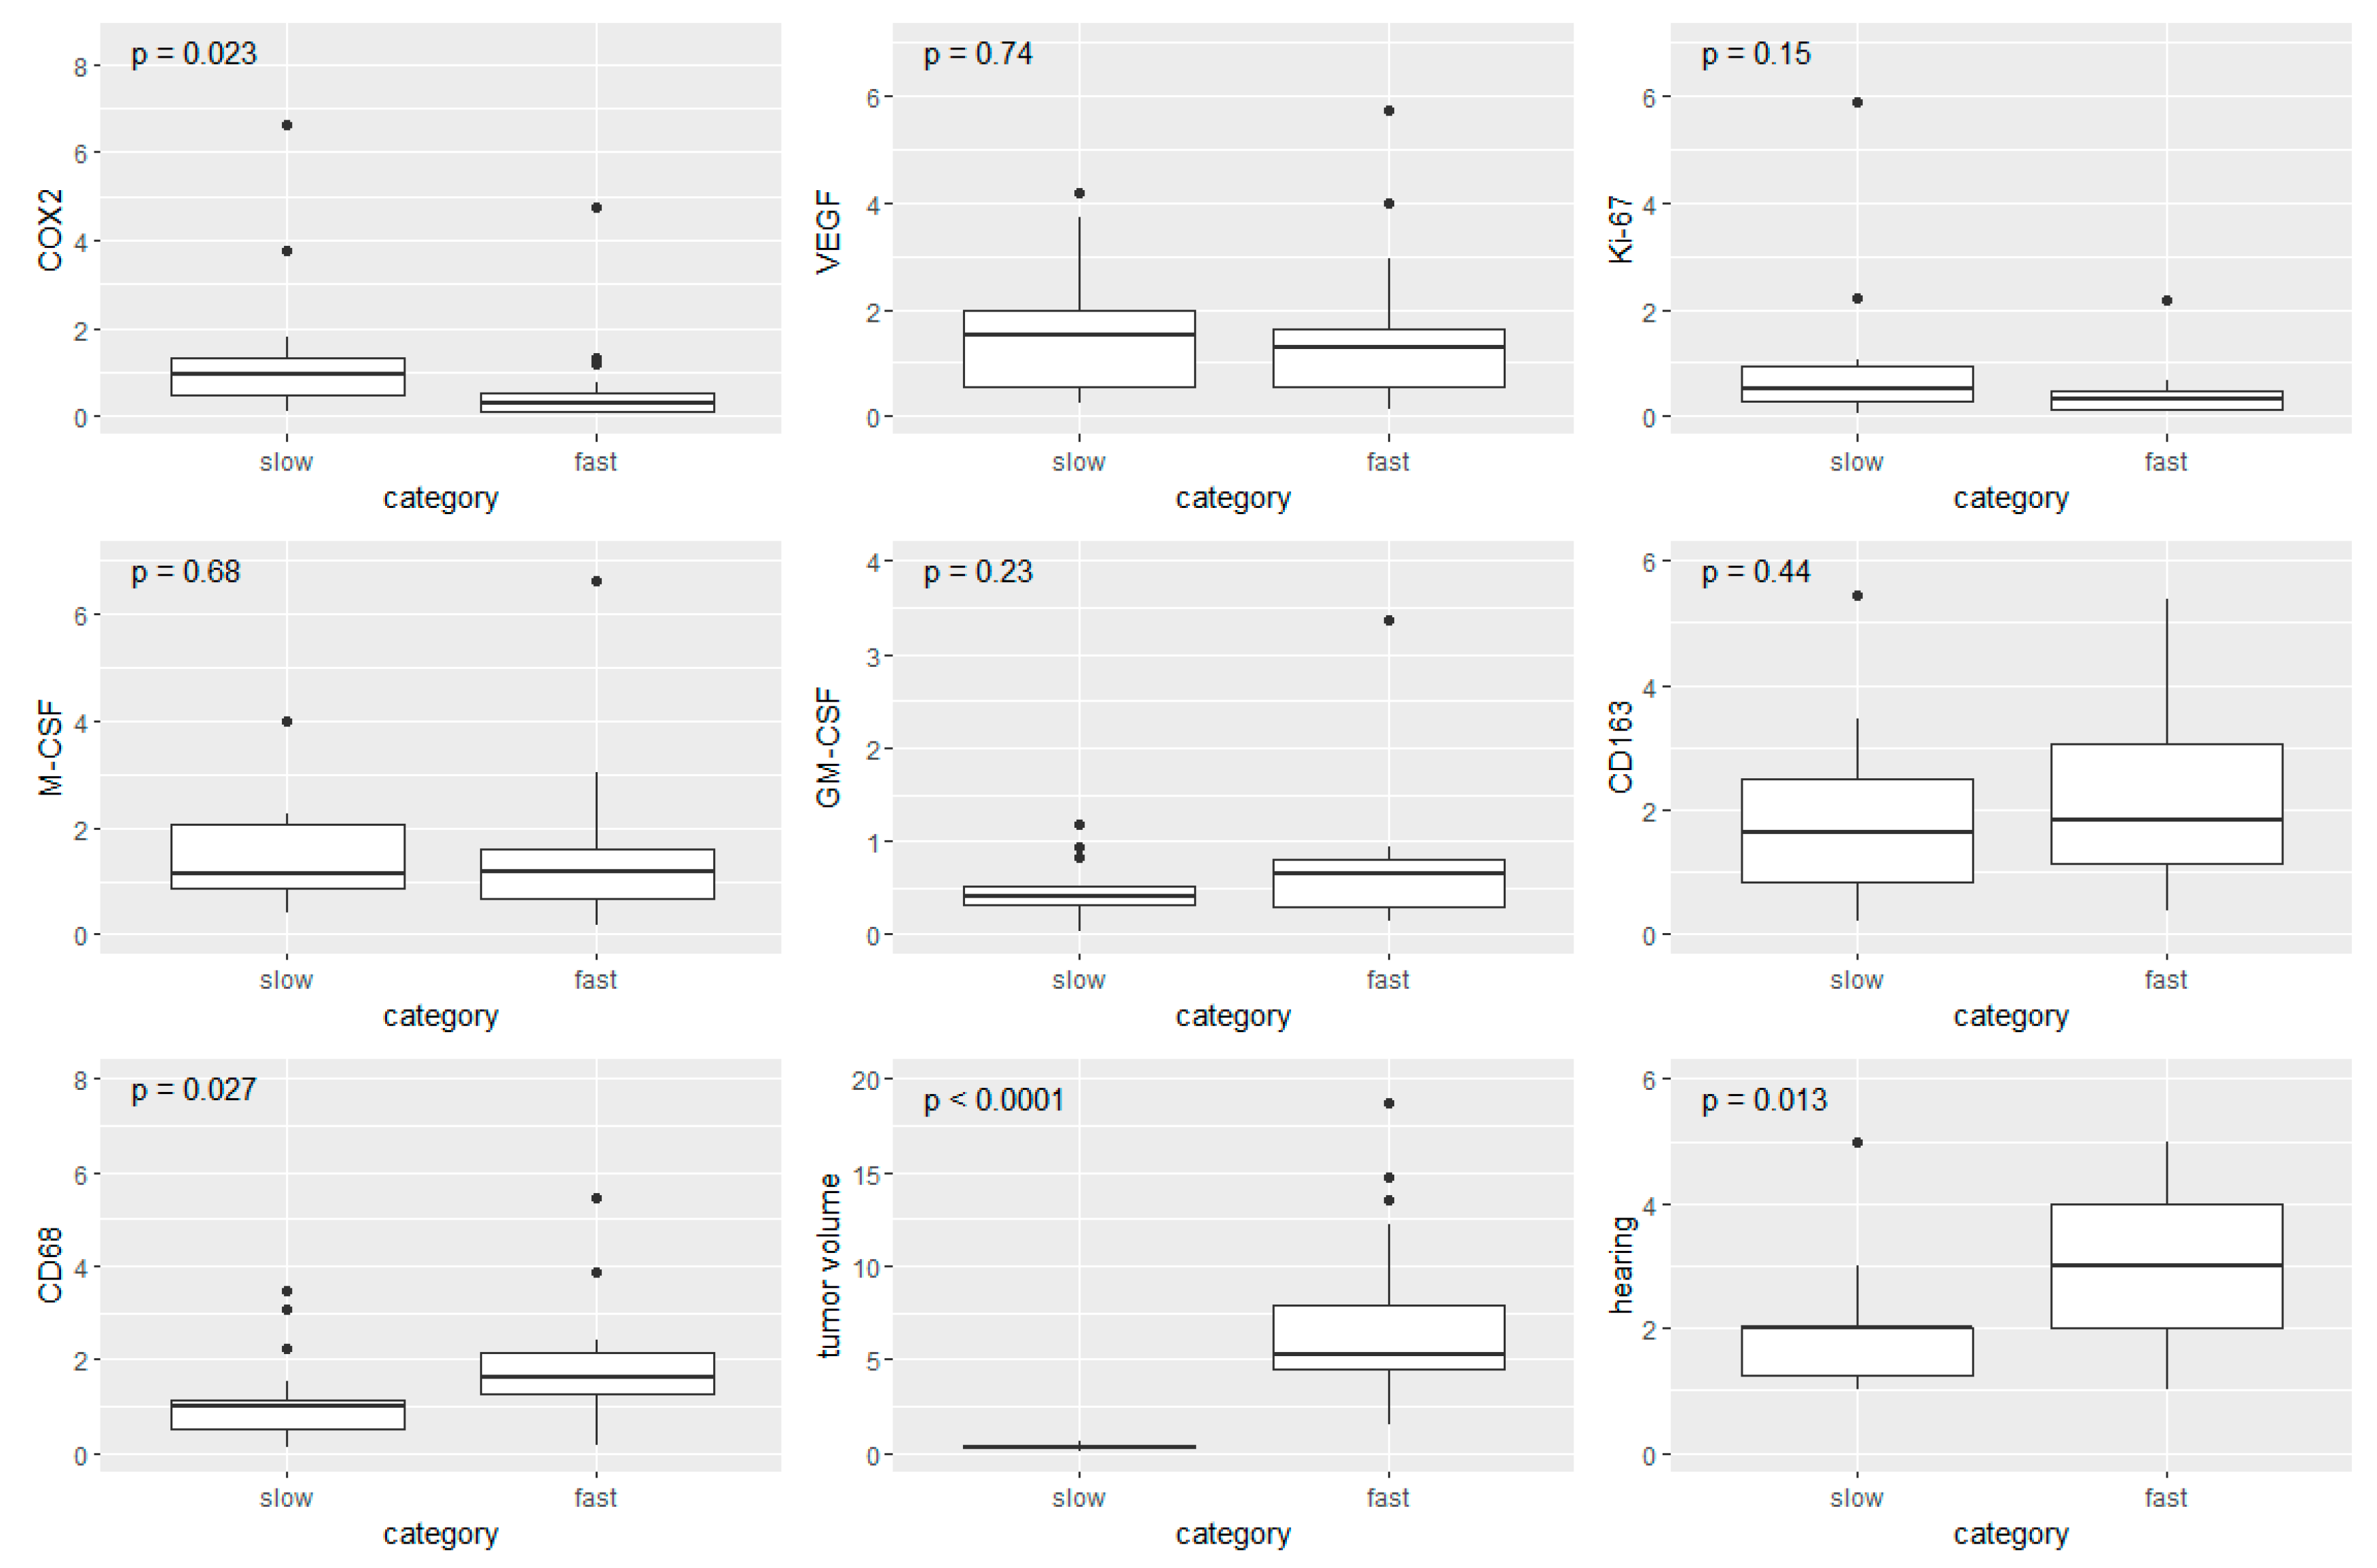
3.5. Boxplot Analysis in Fast- and Slow-Growing VS
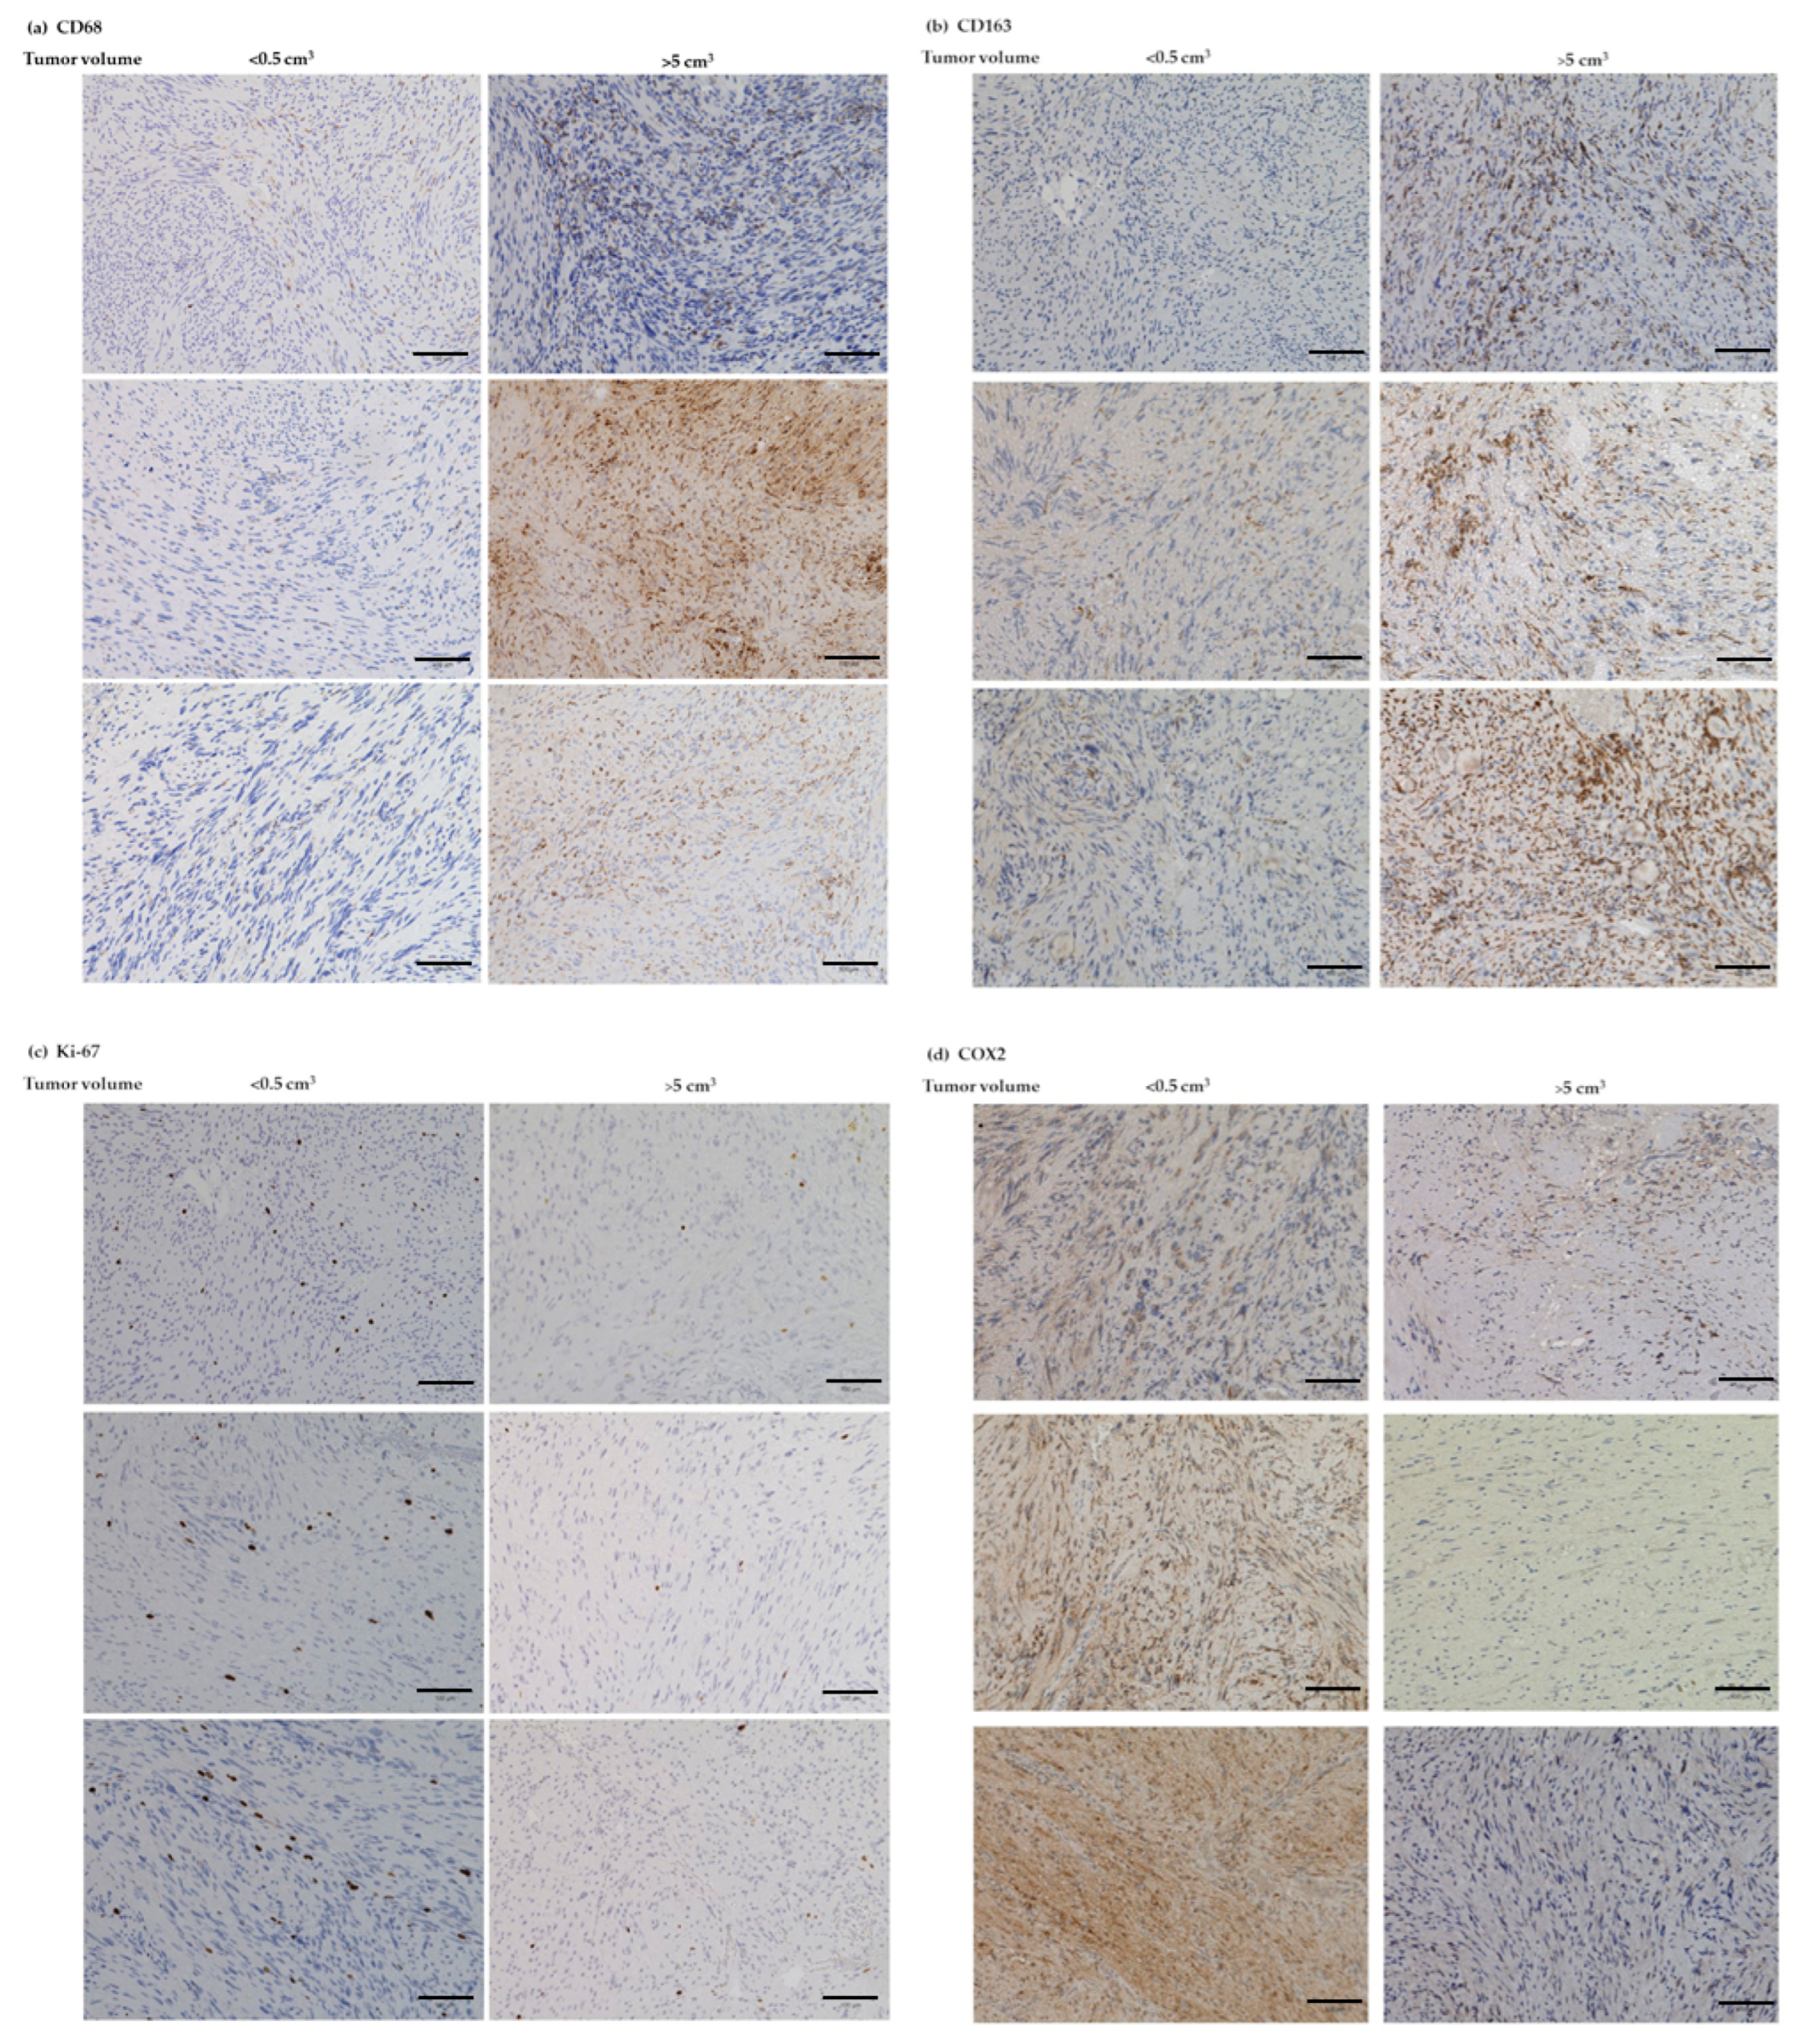
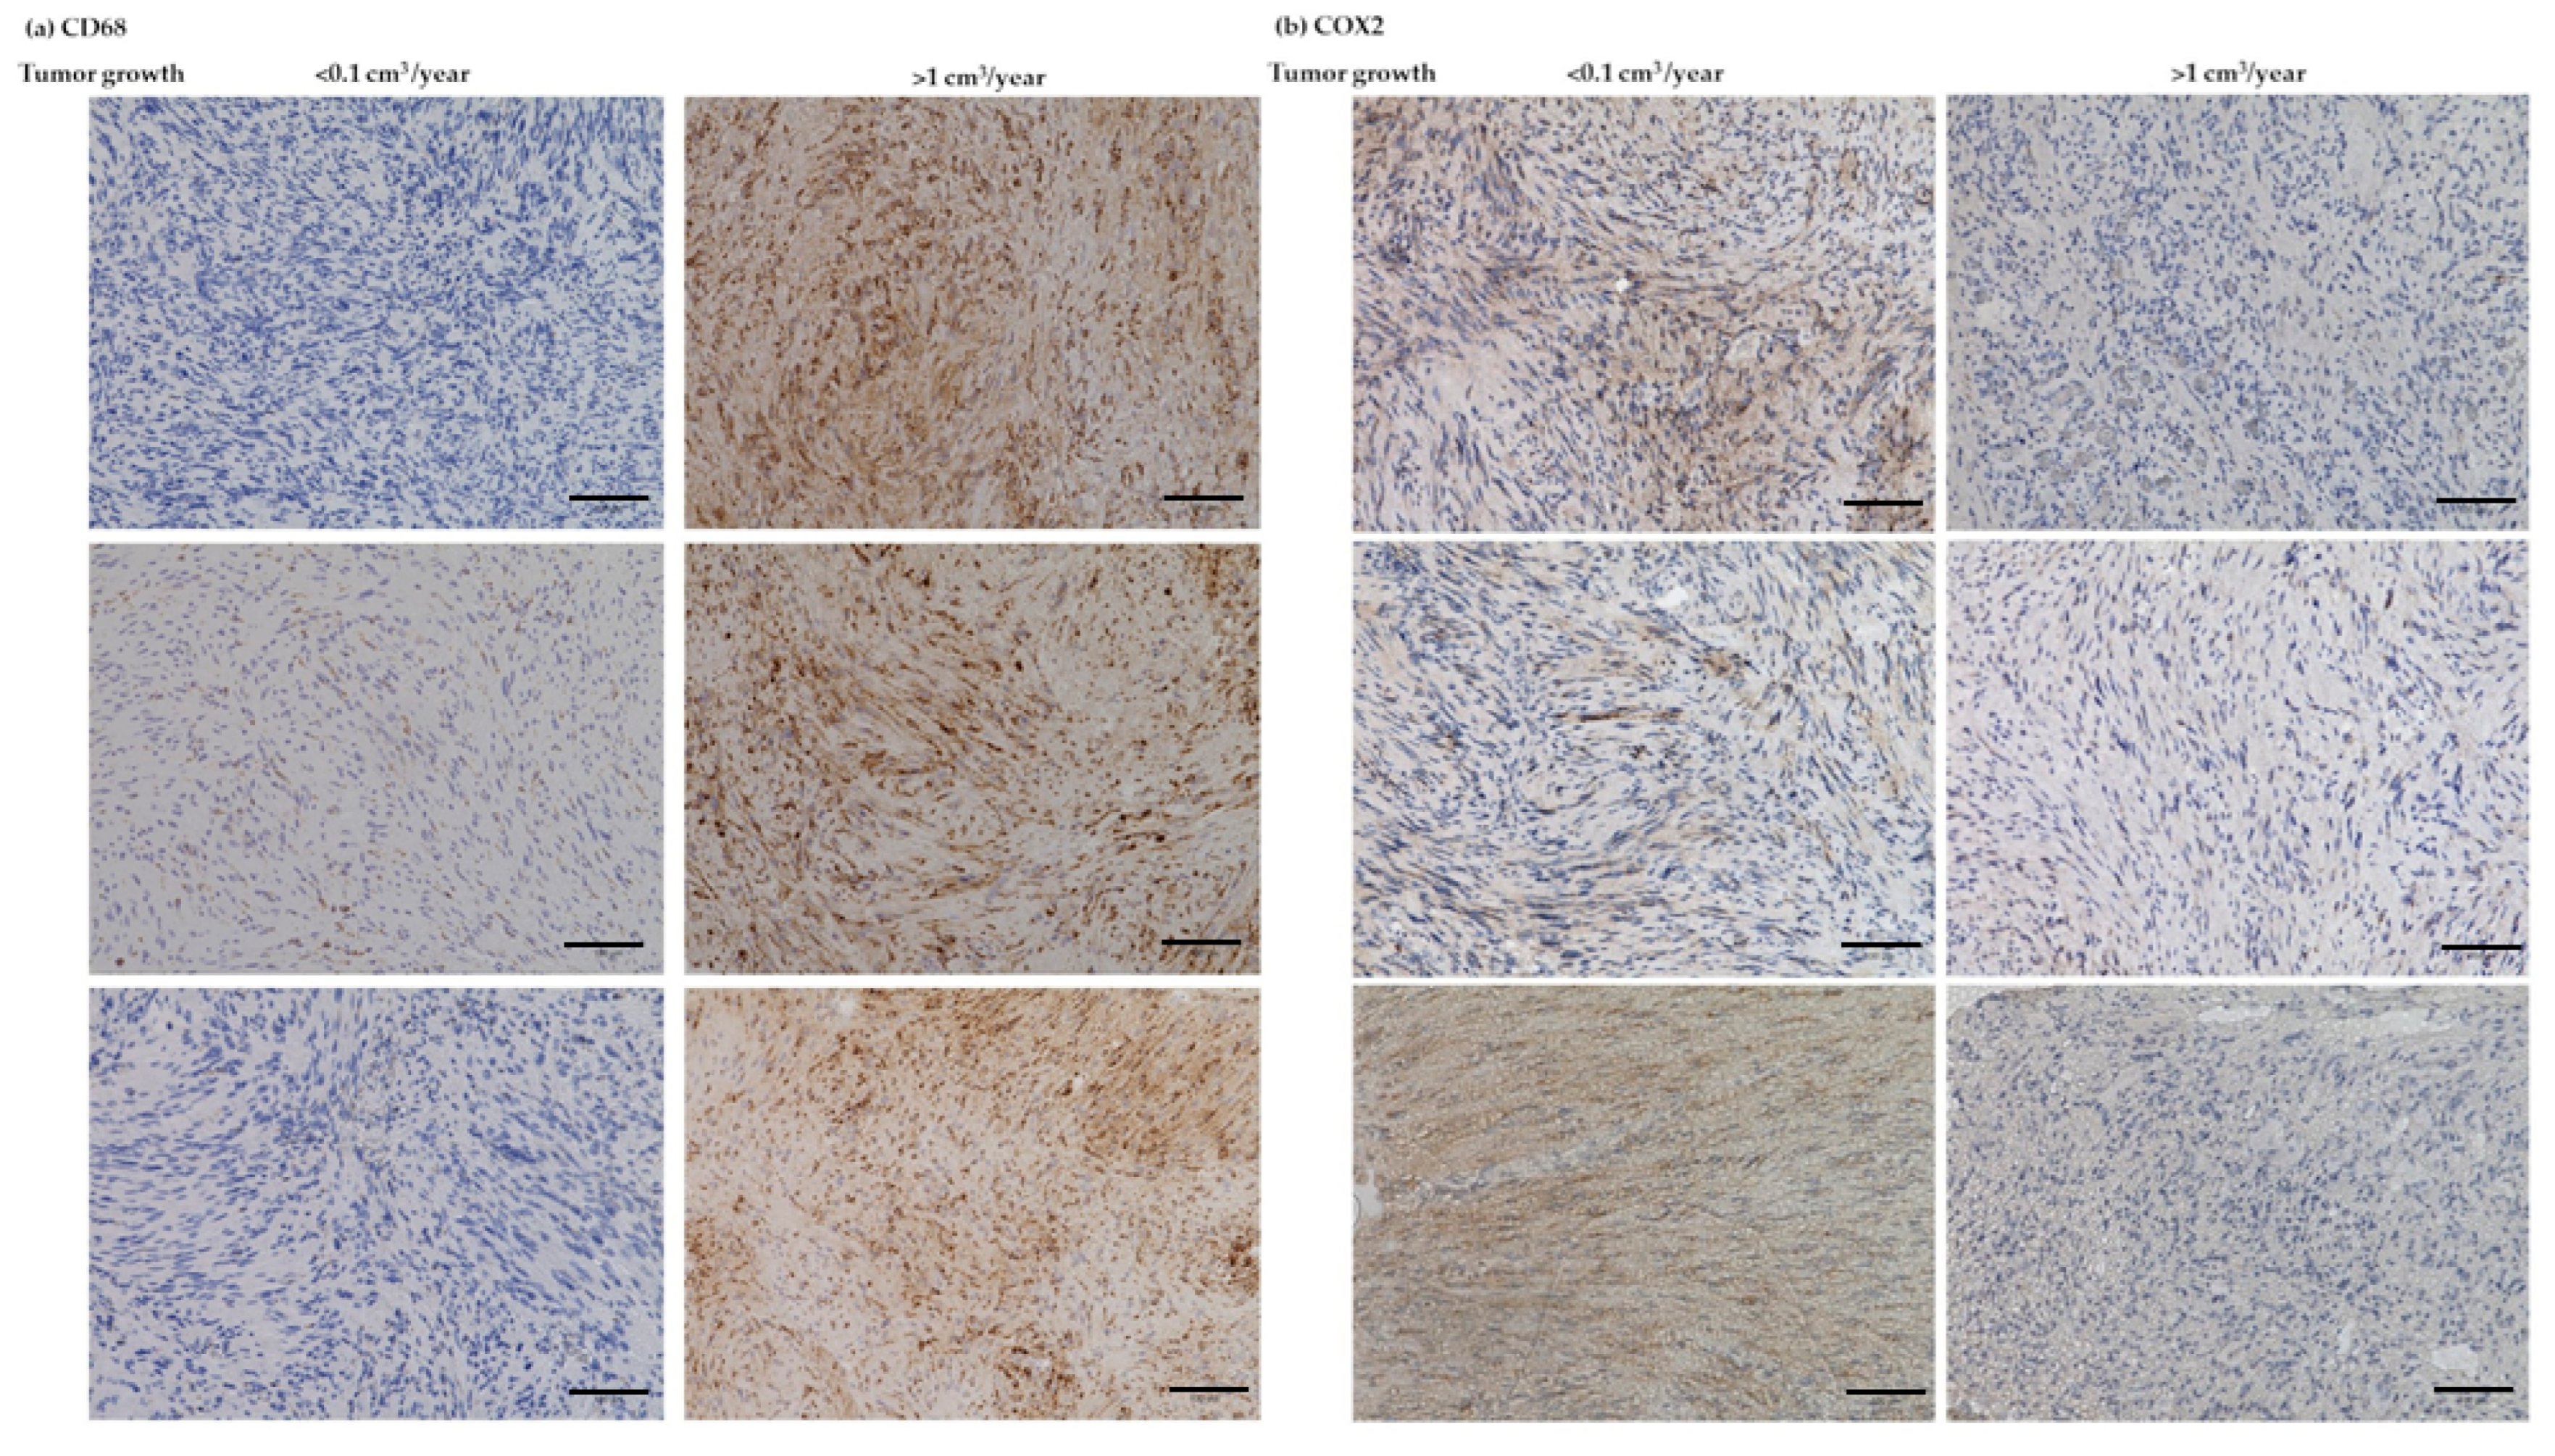
3.6. IHC Analyses of CD68, CD163, Ki-67, and COX2
4. Discussion
Limitations
5. Conclusions
Supplementary Materials
Author Contributions
Funding
Institutional Review Board Statement
Informed Consent Statement
Data Availability Statement
Acknowledgments
Conflicts of Interest
References
- Brodhun, M.; Stahn, V.; Harder, A. Pathogenesis and molecular pathology of vestibular schwannoma. HNO 2017, 65, 362–372. [Google Scholar] [CrossRef] [PubMed]
- Irving, R.M.; Moffat, D.A.; Hardy, D.G.; Barton, D.E.; Xuereb, J.H.; Maher, E.R. Somatic NF2 gene mutations in familial and non-familial vestibular schwannoma. Hum. Mol. Genet. 1994, 3, 347–350. [Google Scholar] [CrossRef] [PubMed]
- Hassepass, F.; Bulla, S.B.; Aschendorff, A.; Maier, W. Vestibular schwannoma: Part I: Epidemiology and diagnostics. HNO 2012, 60, 837–844. [Google Scholar] [CrossRef] [PubMed]
- Matthies, C.; Samii, M. Management of 1000 vestibular schwannomas (acoustic neuromas): Clinical presentation. Neurosurgery 1997, 40, 1–9. [Google Scholar] [CrossRef] [PubMed]
- Stangerup, S.E.; Caye-Thomasen, P. Epidemiology and natural history of vestibular schwannomas. Otolaryngol. Clin. N. Am. 2012, 45, 257–268. [Google Scholar] [CrossRef]
- Zhou, L.; Hanemann, C.O. Merlin, a multi-suppressor from cell membrane to the nucleus. FEBS Lett. 2012, 586, 1403–1408. [Google Scholar] [CrossRef]
- Goldbrunner, R.; Weller, M.; Regis, J.; Lund-Johansen, M.; Stavrinou, P.; Reuss, D.; Evans, D.G.; Lefranc, F.; Sallabanda, K.; Falini, A.; et al. EANO guideline on the diagnosis and treatment of vestibular schwannoma. Neuro-Oncol. 2020, 22, 31–45. [Google Scholar] [CrossRef]
- Paldor, I.; Chen, A.S.; Kaye, A.H. Growth rate of vestibular schwannoma. J. Clin. Neurosci. 2016, 32, 1–8. [Google Scholar] [CrossRef]
- Gupta, V.K.; Thakker, A.; Gupta, K.K. Vestibular Schwannoma: What We Know and Where We are Heading. Head Neck Pathol. 2020, 14, 1058–1066. [Google Scholar] [CrossRef]
- Cayé-Thomasen, P.; Werther, K.; Nalla, A.; Bøg-Hansen, T.C.; Nielsen, H.J.; Stangerup, S.E.; Thomsen, J. VEGF and VEGF receptor-1 concentration in vestibular schwannoma homogenates correlates to tumor growth rate. Otol. Neurotol. 2005, 26, 98–101. [Google Scholar] [CrossRef]
- Skytthe, M.K.; Graversen, J.H.; Moestrup, S.K. Targeting of CD163+ Macrophages in Inflammatory and Malignant Diseases. Int. J. Mol. Sci. 2020, 21, 5497. [Google Scholar] [CrossRef] [PubMed]
- Chistiakov, D.A.; Killingsworth, M.C.; Myasoedova, V.A.; Orekhov, A.N.; Bobryshev, Y.V. CD68/macrosialin: Not just a histochemical marker. Lab. Investig. 2017, 97, 4–13. [Google Scholar] [CrossRef] [PubMed]
- Cassetta, L.; Pollard, J.W. Tumor-associated macrophages. Curr. Biol. 2020, 30, R246–R248. [Google Scholar] [CrossRef] [PubMed]
- de Vries, W.M.; Briaire-de Bruijn, I.H.; van Benthem, P.P.G.; van der Mey, A.G.L.; Hogendoorn, P.C.W. M-CSF and IL-34 expression as indicators for growth in sporadic vestibular schwannoma. Virchows Arch. 2019, 474, 375–381. [Google Scholar] [CrossRef]
- de Vries, M.; Hogendoorn, P.C.; Briaire-de Bruyn, I.; Malessy, M.J.; van der Mey, A.G. Intratumoral hemorrhage, vessel density, and the inflammatory reaction contribute to volume increase of sporadic vestibular schwannomas. Virchows Arch. 2012, 460, 629–636. [Google Scholar] [CrossRef]
- Kumar, A.; Taghi Khani, A.; Sanchez Ortiz, A.; Swaminathan, S. GM-CSF: A Double-Edged Sword in Cancer Immunotherapy. Front. Immunol. 2022, 13, 901277. [Google Scholar] [CrossRef]
- Becher, B.; Tugues, S.; Greter, M. GM-CSF: From Growth Factor to Central Mediator of Tissue Inflammation. Immunity 2016, 45, 963–973. [Google Scholar] [CrossRef]
- Koutsimpelas, D.; Bjelopavlovic, M.; Yetis, R.; Frauenknecht, K.; Adryan, B.; Schmidtmann, I.; Gouveris, H.; Fruth, K.; Heinrich, U.R.; Stauber, R.H.; et al. The VEGF/VEGF-R axis in sporadic vestibular schwannomas correlates with irradiation and disease recurrence. ORL 2012, 74, 330–338. [Google Scholar] [CrossRef]
- Behling, F.; Ries, V.; Skardelly, M.; Gepfner-Tuma, I.; Schuhmann, M.; Ebner, F.H.; Tabatabai, G.; Bornemann, A.; Schittenhelm, J.; Tatagiba, M. COX2 expression is associated with proliferation and tumor extension in vestibular schwannoma but is not influenced by acetylsalicylic acid intake. Acta. Neuropathol. Commun. 2019, 7, 105. [Google Scholar] [CrossRef]
- Koos, W.T.; Day, J.D.; Matula, C.; Levy, D.I. Neurotopographic considerations in the microsurgical treatment of small acoustic neurinomas. J. Neurosurg. 1998, 88, 506–512. [Google Scholar] [CrossRef] [Green Version]
- Pachow, D.; Andrae, N.; Kliese, N.; Angenstein, F.; Stork, O.; Wilisch-Neumann, A.; Kirches, E.; Mawrin, C. mTORC1 inhibitors suppress meningioma growth in mouse models. Clin. Cancer Res. 2013, 19, 1180–1189. [Google Scholar] [CrossRef] [PubMed]
- Napitupulu, D.; Rahim, R.; Abdullah, D.; Setiawan, M.I.; Abdillah, L.A.; Ahmar, A.S.; Simarmata, J.; Hidayat, R.; Nurdiyanto, H.; Pranolo, A. Analysis of Student Satisfaction Toward Quality of Service Facility. J. Phys. Conf. Ser. 2018, 954, 012019. [Google Scholar] [CrossRef]
- Team, R.C. R: A Language and Environment for Statistical Computing; R Foundation for Statistical Computing: Vienna, Austria, 2013. [Google Scholar]
- Hong, B.; Krusche, C.A.; Schwabe, K.; Friedrich, S.; Klein, R.; Krauss, J.K.; Nakamura, M. Cyclooxygenase-2 supports tumor proliferation in vestibular schwannomas. Neurosurgery 2011, 68, 1112–1117. [Google Scholar] [CrossRef] [PubMed]
- Behling, F.; Suhm, E.; Ries, V.; Gonçalves, V.M.; Tabatabai, G.; Tatagiba, M.; Schittenhelm, J. COX2 expression is associated with preoperative tumor volume but not with volumetric tumor growth in vestibular schwannoma. Neurol. Res. Pract. 2021, 3, 11. [Google Scholar] [CrossRef]
- Kandathil, C.K.; Cunnane, M.E.; McKenna, M.J.; Curtin, H.D.; Stankovic, K.M. Correlation Between Aspirin Intake and Reduced Growth of Human Vestibular Schwannoma: Volumetric Analysis. Otol. Neurotol. 2016, 37, 1428–1434. [Google Scholar] [CrossRef]
- Kandathil, C.K.; Dilwali, S.; Wu, C.C.; Ibrahimov, M.; McKenna, M.J.; Lee, H.; Stankovic, K.M. Aspirin intake correlates with halted growth of sporadic vestibular schwannoma in vivo. Otol. Neurotol. 2014, 35, 353–357. [Google Scholar] [CrossRef]
- Dilwali, S.; Kao, S.Y.; Fujita, T.; Landegger, L.D.; Stankovic, K.M. Nonsteroidal anti-inflammatory medications are cytostatic against human vestibular schwannomas. Transl. Res. 2015, 166, 1–11. [Google Scholar] [CrossRef]
- Hashemi Goradel, N.; Najafi, M.; Salehi, E.; Farhood, B.; Mortezaee, K. Cyclooxygenase-2 in cancer: A review. J. Cell Physiol. 2019, 234, 5683–5699. [Google Scholar] [CrossRef]
- Karpisheh, V.; Nikkhoo, A.; Hojjat-Farsangi, M.; Namdar, A.; Azizi, G.; Ghalamfarsa, G.; Sabz, G.; Yousefi, M.; Yousefi, B.; Jadidi-Niaragh, F. Prostaglandin E2 as a potent therapeutic target for treatment of colon cancer. Prostaglandins Other Lipid Mediat. 2019, 144, 106338. [Google Scholar] [CrossRef]
- Kim, H.S.; Moon, H.G.; Han, W.; Yom, C.K.; Kim, W.H.; Kim, J.H.; Noh, D.Y. COX2 overexpression is a prognostic marker for Stage III breast cancer. Breast Cancer Res. Treat 2012, 132, 51–59. [Google Scholar] [CrossRef]
- Yokoyama, M.; Matsuda, M.; Nakasu, S.; Nakajima, M.; Handa, J. Clinical significance of Ki-67 staining index in acoustic neurinoma. Neurol. Med. Chir. 1996, 36, 698–702. [Google Scholar] [CrossRef] [PubMed]
- Cafer, S.; Bayramoglu, I.; Uzum, N.; Yilmaz, M.; Memis, L.; Uygur, K. Expression and clinical significance of Ki-67, oestrogen and progesterone receptors in acoustic neuroma. J. Laryngol. Otol. 2008, 122, 125–127. [Google Scholar] [CrossRef] [PubMed]
- Frezzetti, D.; Gallo, M.; Maiello, M.R.; D’Alessio, A.; Esposito, C.; Chicchinelli, N.; Normanno, N.; De Luca, A. VEGF as a potential target in lung cancer. Expert Opin. Ther. Targets 2017, 21, 959–966. [Google Scholar] [CrossRef]
- Carmeliet, P. VEGF as a key mediator of angiogenesis in cancer. Oncology 2005, 69 (Suppl. 3), 4–10. [Google Scholar] [CrossRef] [PubMed]
- Brieger, J.; Bedavanija, A.; Lehr, H.A.; Maurer, J.; Mann, W.J. Expression of angiogenic growth factors in acoustic neurinoma. Acta Otolaryngol. 2003, 123, 1040–1045. [Google Scholar] [CrossRef] [PubMed]
- Dilwali, S.; Roberts, D.; Stankovic, K.M. Interplay between VEGF-A and cMET signaling in human vestibular schwannomas and schwann cells. Cancer Biol. Ther. 2015, 16, 170–175. [Google Scholar] [CrossRef]
- Schulz, A.; Büttner, R.; Hagel, C.; Baader, S.L.; Kluwe, L.; Salamon, J.; Mautner, V.F.; Mindos, T.; Parkinson, D.B.; Gehlhausen, J.R.; et al. The importance of nerve microenvironment for schwannoma development. Acta Neuropathol. 2016, 132, 289–307. [Google Scholar] [CrossRef]
- Hannan, C.J.; Lewis, D.; O’Leary, C.; Donofrio, C.A.; Evans, D.G.; Roncaroli, F.; Brough, D.; King, A.T.; Coope, D.; Pathmanaban, O.N. The inflammatory microenvironment in vestibular schwannoma. Neuro-Oncol. Adv. 2020, 2, vdaa023. [Google Scholar] [CrossRef]
- Lewis, D.; Roncaroli, F.; Agushi, E.; Mosses, D.; Williams, R.; Li, K.L.; Zhu, X.; Hinz, R.; Atkinson, R.; Wadeson, A.; et al. Inflammation and vascular permeability correlate with growth in sporadic vestibular schwannoma. Neuro-Oncol. 2019, 21, 314–325. [Google Scholar] [CrossRef]
- Shi, J.; Lu, D.; Gu, R.; Xu, Y.; Pan, R.; Bo, F.; Zhang, Y. Identification of key biomarkers and immune infiltration in sporadic vestibular schwannoma basing transcriptome-wide profiling. World Neurosurg. 2022, 160, e591–e600. [Google Scholar] [CrossRef]
- Bi, W.L.; Gupta, S.; Mei, Y.; Abdulmohsen, S.A.; Giantini Larsen, A.; Unadkat, P.; Ramkissoon, S.; Abedalthagafi, M.; Dunn, I.F. Immunophenotype of Vestibular Schwannomas. Otol. Neurotol. 2020, 41, e1290–e1296. [Google Scholar] [CrossRef] [PubMed]
- Pan, Y.; Yu, Y.; Wang, X.; Zhang, T. Tumor-Associated Macrophages in Tumor Immunity. Front. Immunol. 2020, 11, 583084. [Google Scholar] [CrossRef] [PubMed]
- Chanmee, T.; Ontong, P.; Konno, K.; Itano, N. Tumor-associated macrophages as major players in the tumor microenvironment. Cancers 2014, 6, 1670–1690. [Google Scholar] [CrossRef] [PubMed]
- Perry, A.; Graffeo, C.S.; Carlstrom, L.P.; Raghunathan, A.; Driscoll, C.L.W.; Neff, B.A.; Carlson, M.L.; Parney, I.F.; Link, M.J.; Van Gompel, J.J. Predominance of M1 subtype among tumor-associated macrophages in phenotypically aggressive sporadic vestibular schwannoma. J. Neurosurg. 2019, 133, 1637–1645. [Google Scholar] [CrossRef] [PubMed]
- de Vries, M.; Briaire-de Bruijn, I.; Malessy, M.J.; de Bruïne, S.F.; van der Mey, A.G.; Hogendoorn, P.C. Tumor-associated macrophages are related to volumetric growth of vestibular schwannomas. Otol. Neurotol. 2013, 34, 347–352. [Google Scholar] [CrossRef]
- Gonçalves, V.M.; Suhm, E.M.; Ries, V.; Skardelly, M.; Tabatabai, G.; Tatagiba, M.; Schittenhelm, J.; Behling, F. Macrophage and Lymphocyte Infiltration Is Associated with Volumetric Tumor Size but Not with Volumetric Growth in the Tübingen Schwannoma Cohort. Cancers 2021, 13, 466. [Google Scholar] [CrossRef] [PubMed]
- Chen, Y.; Song, Y.; Du, W.; Gong, L.; Chang, H.; Zou, Z. Tumor-associated macrophages: An accomplice in solid tumor progression. J. Biomed. Sci. 2019, 26, 78. [Google Scholar] [CrossRef]
- Ushach, I.; Zlotnik, A. Biological role of granulocyte macrophage colony-stimulating factor (GM-CSF) and macrophage colony-stimulating factor (M-CSF) on cells of the myeloid lineage. J. Leukoc. Biol. 2016, 100, 481–489. [Google Scholar] [CrossRef]
- Hong, I.S. Stimulatory versus suppressive effects of GM-CSF on tumor progression in multiple cancer types. Exp. Mol. Med. 2016, 48, e242. [Google Scholar] [CrossRef]
- Aliper, A.M.; Frieden-Korovkina, V.P.; Buzdin, A.; Roumiantsev, S.A.; Zhavoronkov, A. A role for G-CSF and GM-CSF in nonmyeloid cancers. Cancer Med. 2014, 3, 737–746. [Google Scholar] [CrossRef]
- Patel, N.S.; Huang, A.E.; Dowling, E.M.; Lees, K.A.; Tombers, N.M.; Lohse, C.M.; Marinelli, J.P.; Van Gompel, J.J.; Neff, B.A.; Driscoll, C.L.W.; et al. The Influence of Vestibular Schwannoma Tumor Volume and Growth on Hearing Loss. Otolaryngol. Head Neck Surg. 2020, 162, 530–537. [Google Scholar] [CrossRef] [PubMed]
- Myers, K.V.; Amend, S.R.; Pienta, K.J. Targeting Tyro3, Axl and MerTK (TAM receptors): Implications for macrophages in the tumor microenvironment. Mol. Cancer 2019, 18, 94. [Google Scholar] [CrossRef] [PubMed] [Green Version]


| Gene Name | Oligo Sequence 5′ to 3′ (Forward, Reverse) | Annealing Temperature (°C) | Product Length | Reference Sequence | Species |
|---|---|---|---|---|---|
| CD68 | CGCAGCACAGTGGACATTCT GGATCAGGCCGATGATGAGAG | 60 | 236 | NM_001251.3 | Homo sapiens |
| CD163 | AAAAAGCCACAACAGGTCGC ATGGCCTCCTTTTCCATTCCA | 60 | 322 | NM_004244.5 | |
| COX2 | CCCTTCTGCCTGACACCTTT TTCTGTACTGCGGGTGGAAC | 60 | 203 | NM_000963.3 | |
| Ki-67 | GATCGTCCCAGTGGAAGAGTT ATTGCCTCCTGCTCATGGATT | 60 | 276 | NM_002417.5 | |
| M-CSF | CCAGAAGGAGGACCAGCAAG CCAAGGGAGAATCCGCTCTC | 60 | 244 | NM_000757.6 | |
| GM-CSF | AGACACTGCTGCTGAGATGAAT AGGAAGTTTCCGGGGTTGG | 60 | 197 | NG_033024.1 | |
| VEGFA | AACCATGAACTTTCTGCTGTCTTGG ATCAGGGTACTCCTGGAAGATGTCC | 60 | 205 | NM_001171630.1 | |
| GAPDH | TCGTGGAAGGACTCATGACC TTCCCGTTCAGCTCAGGGAT | 60 | 172 | NM_002046.7 |
| Antibody | Source/Isotype | Dilution | Manufacturer |
|---|---|---|---|
| CD68 | Mouse IgG | 1:4000 | Agilent, Santa Clara, CA, USA |
| CD163 | Rabbit IgG | 1:500 | Invitrogen, ThermoFisher Scientific, Waltham, MA, USA |
| COX2 | Rabbit IgG | 1:400 | Cell signaling, Danvers, MA, USA |
| Ki-67 | Mouse IgG | Ready to use | Agilent, Santa Clara, CA, USA |
| Variable | Total (n = 173) |
|---|---|
| Male Female Mean age (years) | 71 102 51 (18–77) |
| Koos grade 1 2 3 4 | 11 63 61 38 |
| AAO-HNS 1 (hearing class) A B C D DS | 56 47 41 18 10 |
| Mean tumor volume (cm3) Median tumor volume (cm3) | 3.3 (0.1–37.0) 1.2 |
| Variable | Total (n = 74) |
| Male Female Mean age (years) | 32 42 53 (28–77) |
| Koos grade 1 2 3 4 | 8 36 17 13 |
| AAO-HNS 1 (hearing class) A B C D DS | 18 23 19 7 6 |
| Mean tumor volume (cm3) Median tumor volume (cm3) Mean growth rate (cm3/year) Median growth rate (cm3/year) | 2.44 (0.1–18.8) 0.8 1.0 (0.01–17.5) 0.3 |
| Variable | Slow-Growing VS (n = 16) | Fast-Growing VS (n = 17) |
| Male Female Mean age (years) | 6 10 49 (28–70) | 9 8 57 (31–77) |
| Koos grade 1 2 3 4 | 4 12 0 0 | 0 0 7 10 |
| AAO-HNS 1 (hearing class) A B C D DS | 5 8 2 0 1 | 1 6 4 2 3 |
| Mean tumor volume (cm3) Mean growth rate (cm3/year) | 0.3 (0.1–0.6) 0.05 (0.01–0.1) | 7.2 (1.5–18.8) 3.5 (1.0–17.5) |
Publisher’s Note: MDPI stays neutral with regard to jurisdictional claims in published maps and institutional affiliations. |
© 2022 by the authors. Licensee MDPI, Basel, Switzerland. This article is an open access article distributed under the terms and conditions of the Creative Commons Attribution (CC BY) license (https://creativecommons.org/licenses/by/4.0/).
Share and Cite
Leisz, S.; Klause, C.H.; Vital Dos Santos, T.; Haenel, P.; Scheer, M.; Simmermacher, S.; Mawrin, C.; Strauss, C.; Scheller, C.; Rampp, S. Vestibular Schwannoma Volume and Tumor Growth Correlates with Macrophage Marker Expression. Cancers 2022, 14, 4429. https://doi.org/10.3390/cancers14184429
Leisz S, Klause CH, Vital Dos Santos T, Haenel P, Scheer M, Simmermacher S, Mawrin C, Strauss C, Scheller C, Rampp S. Vestibular Schwannoma Volume and Tumor Growth Correlates with Macrophage Marker Expression. Cancers. 2022; 14(18):4429. https://doi.org/10.3390/cancers14184429
Chicago/Turabian StyleLeisz, Sandra, Clara Helene Klause, Tania Vital Dos Santos, Pia Haenel, Maximilian Scheer, Sebastian Simmermacher, Christian Mawrin, Christian Strauss, Christian Scheller, and Stefan Rampp. 2022. "Vestibular Schwannoma Volume and Tumor Growth Correlates with Macrophage Marker Expression" Cancers 14, no. 18: 4429. https://doi.org/10.3390/cancers14184429