Differential Transcriptomic Profiles Following Stimulation with Lipopolysaccharide in Intestinal Organoids from Dogs with Inflammatory Bowel Disease and Intestinal Mast Cell Tumor

 ,
,  , ,
, , 
Abstract
:Simple Summary
Abstract
1. Introduction
2. Materials and Methods
2.1. Ethical Animal Use
2.2. Crypt Cell Isolation and Enrichment for Enteroid and Colonoid Culture
2.3. LPS Stimulation of Canine Enteroids and Colonoids
2.4. RNA Extraction and Affymetrix Canine Genome 2.0 Array Microarray Processing
2.5. Assessment of Proliferation
2.6. Analysis of Microarray Data
- Sample 2 vs. Sample 1
- Sample 4 vs. Sample 3
- Sample 6 vs. Sample 5
- Sample 5 vs. Sample 3
- Sample 3 vs. Sample 1
- Sample 6 vs. Sample 4
- Sample 4 vs. Sample 2
2.7. BLAST Search and KEGG Pathway Analyses
3. Results
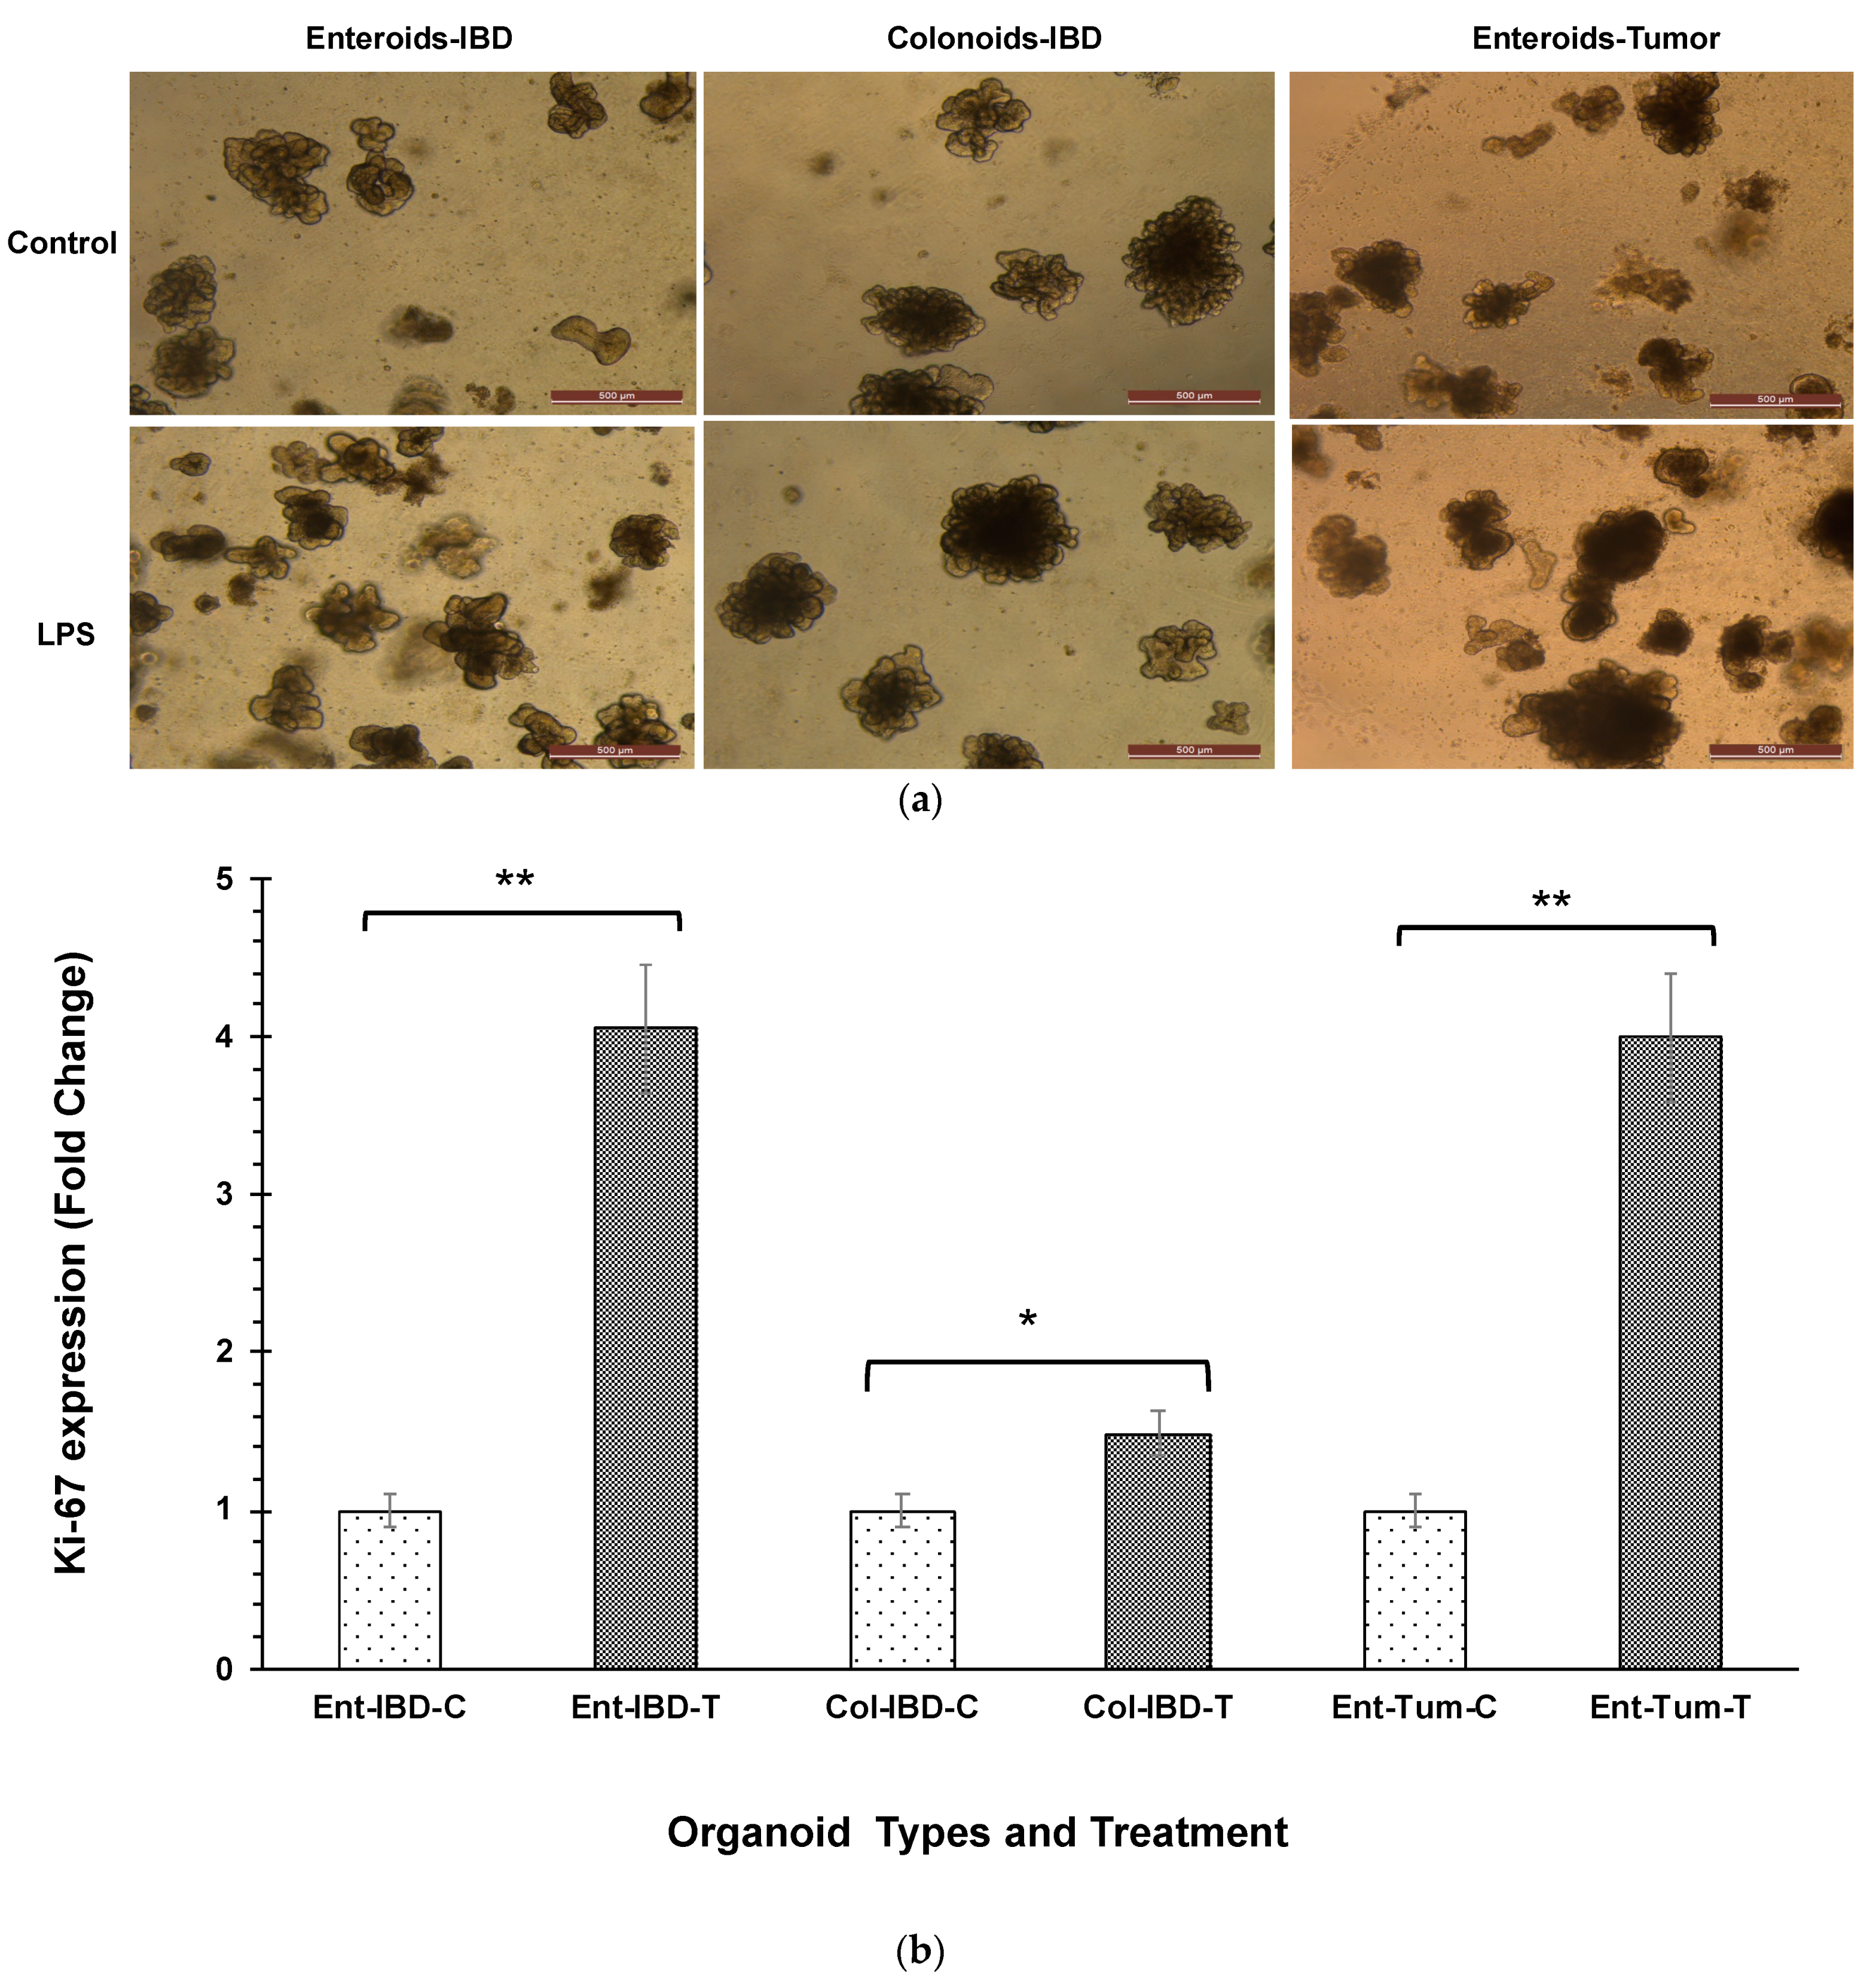
3.1. LPS Stimulates Higher Intestinal Epithelial Cell Proliferation
3.2. Microarray Analysis Reveals Differential Expression of Genes Stimulated by LPS in IBD Intestinal Organoids and Tumor Enteroids
3.3. Gene Expression Profiles and Pathway Enrichment Analysis
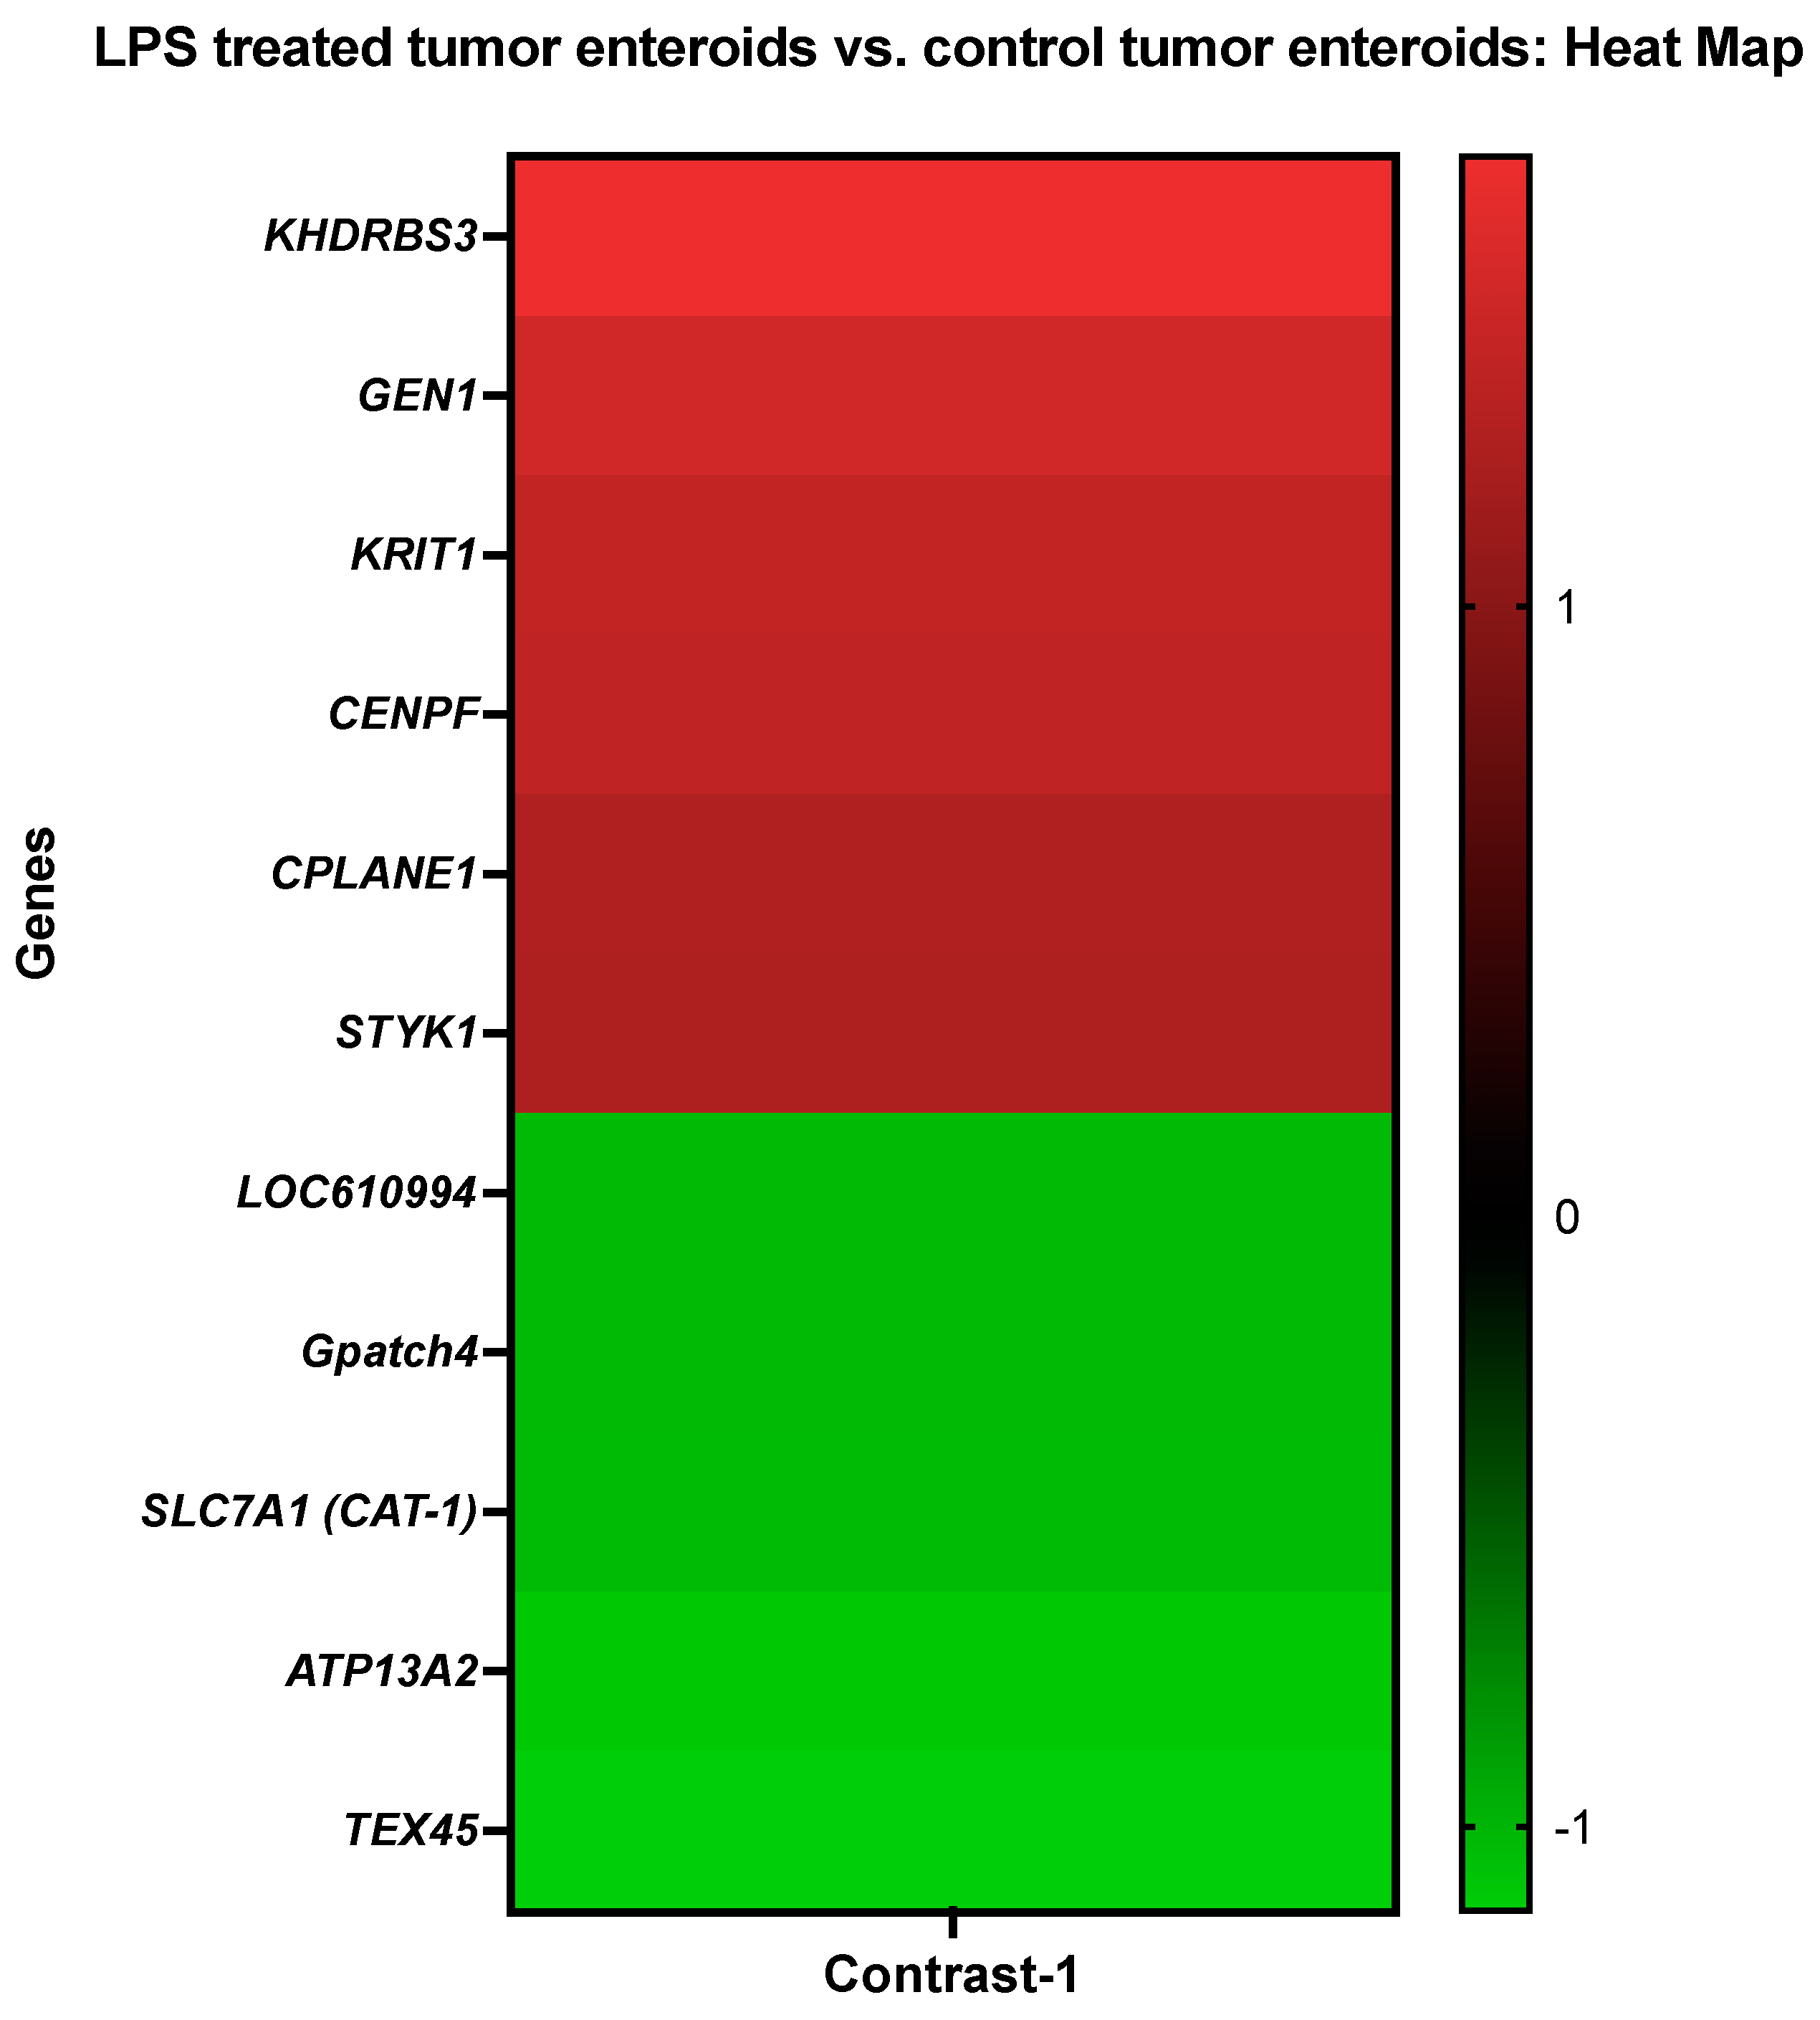
3.3.1. The LPS Treated Tumor Enteroids vs. the Control Tumor Enteroids
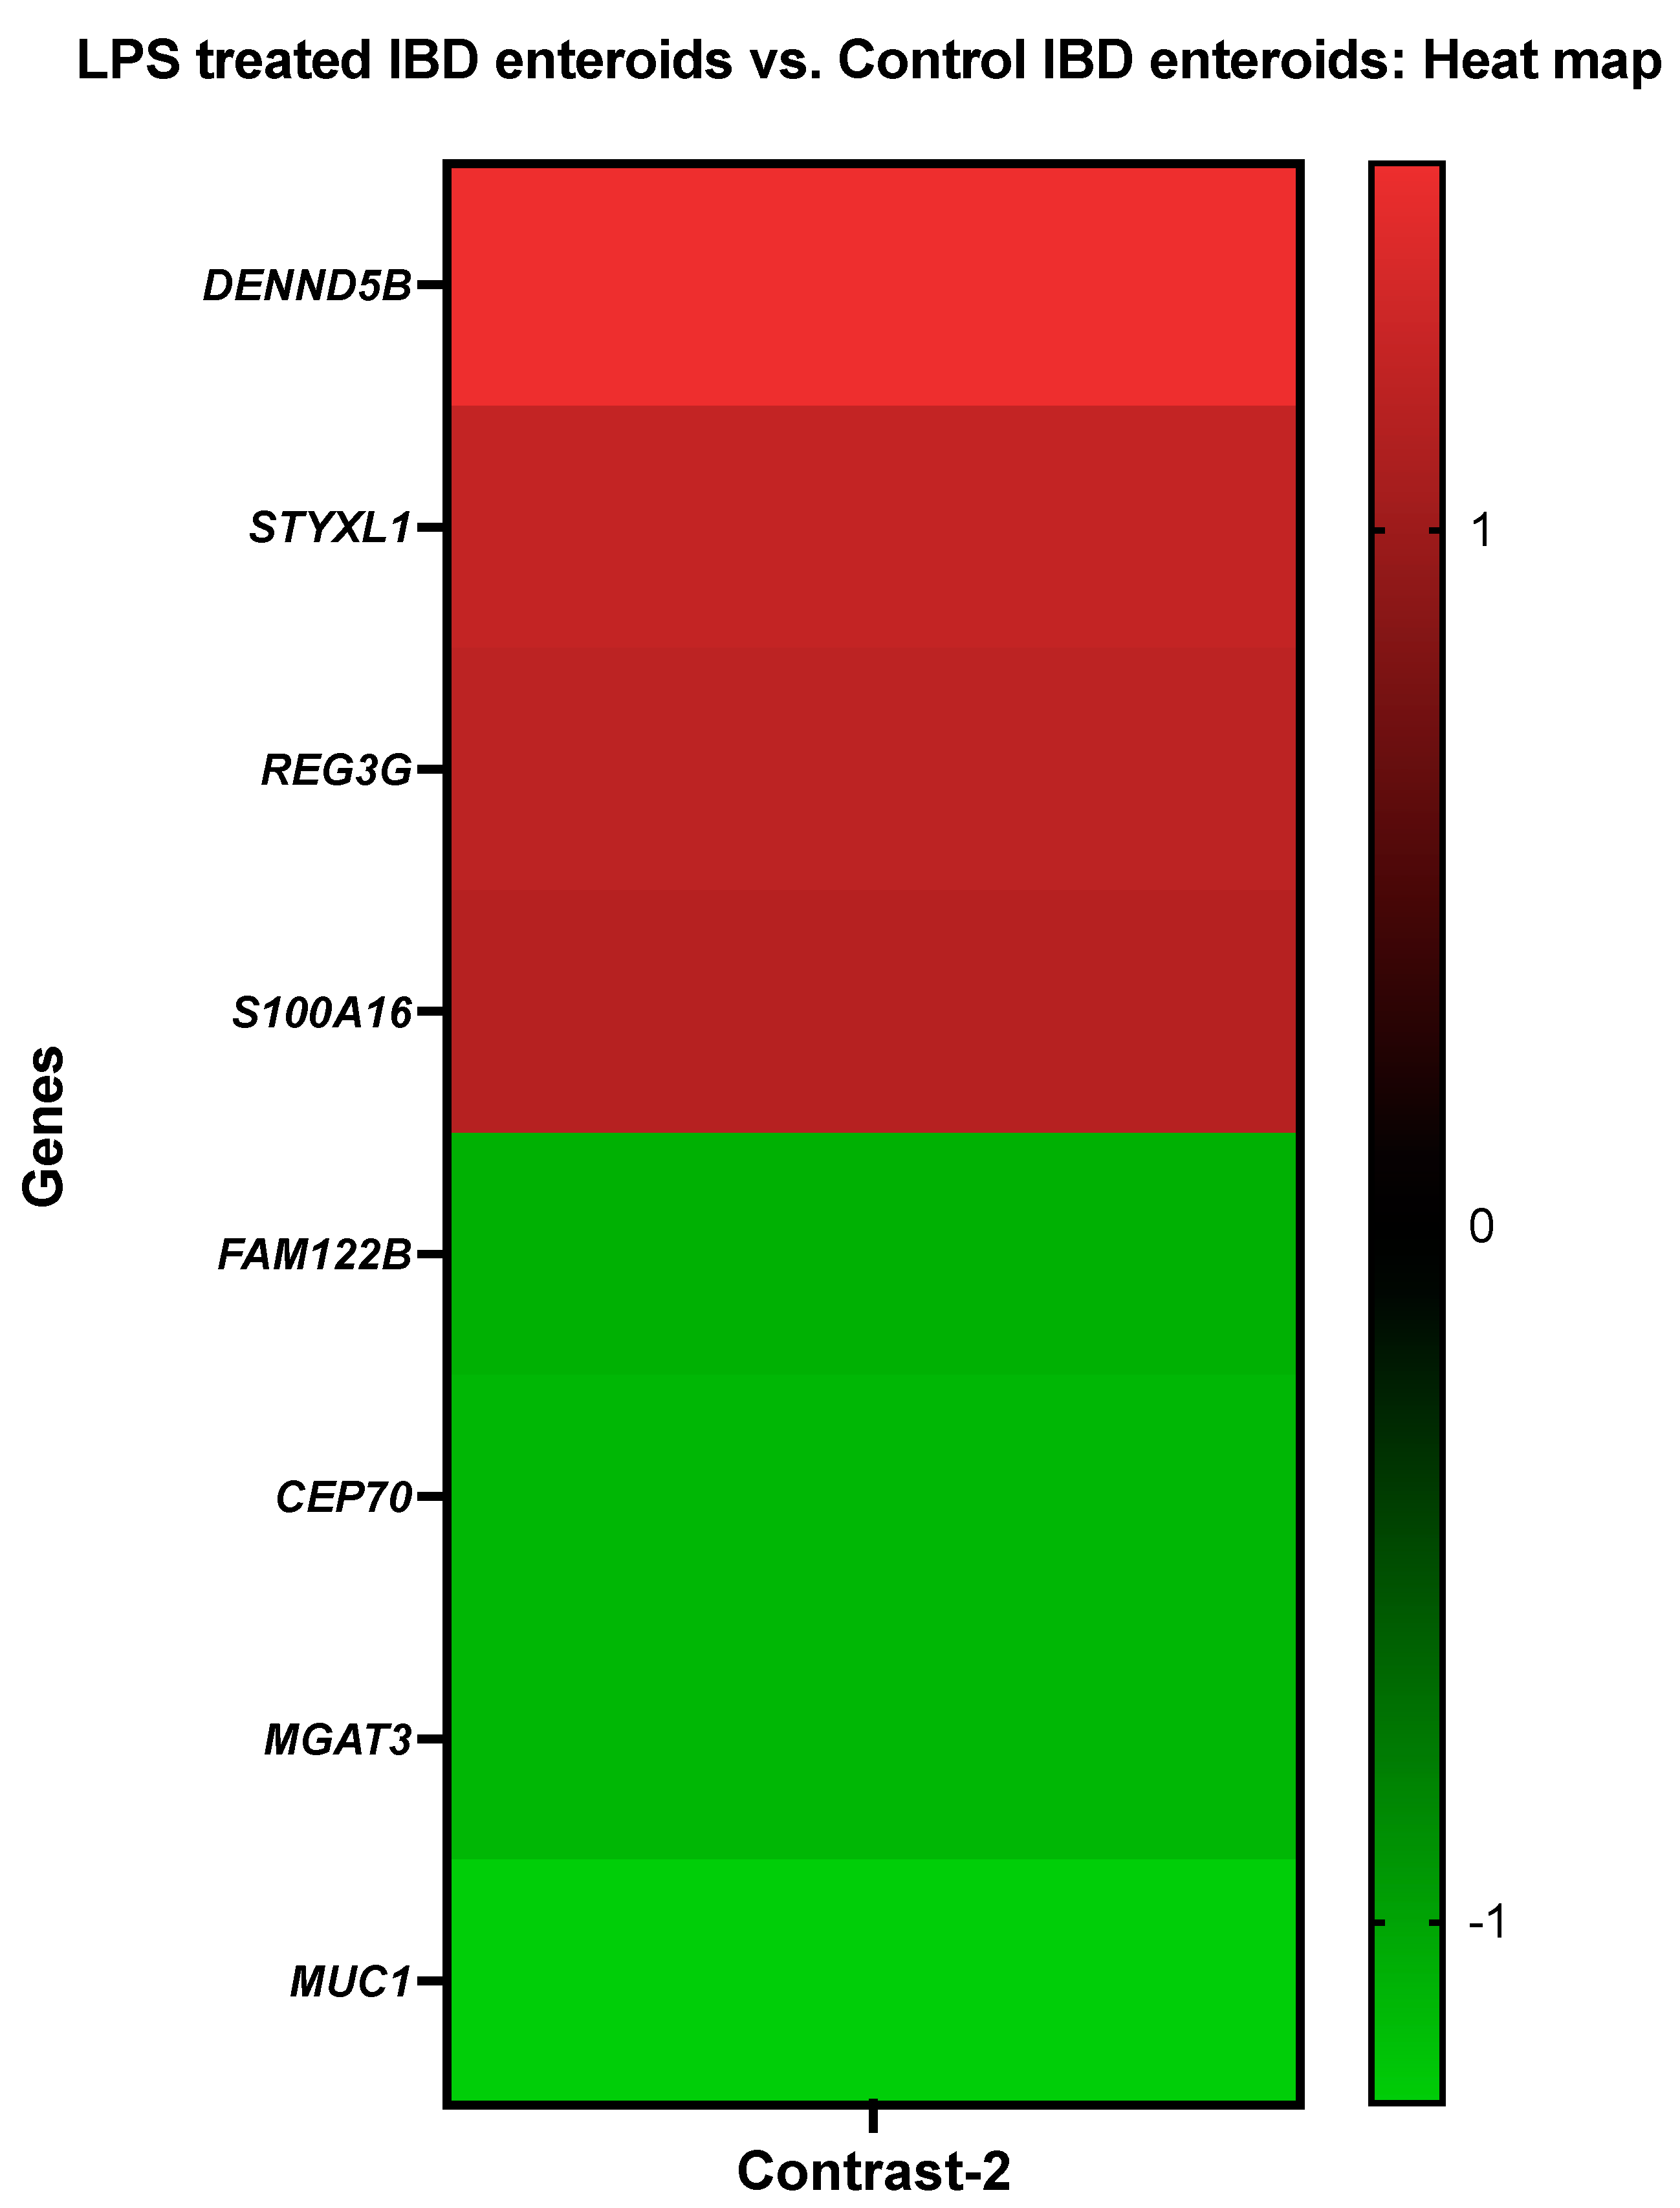
3.3.2. The LPS Treated IBD Enteroids vs. the Control IBD Enteroids
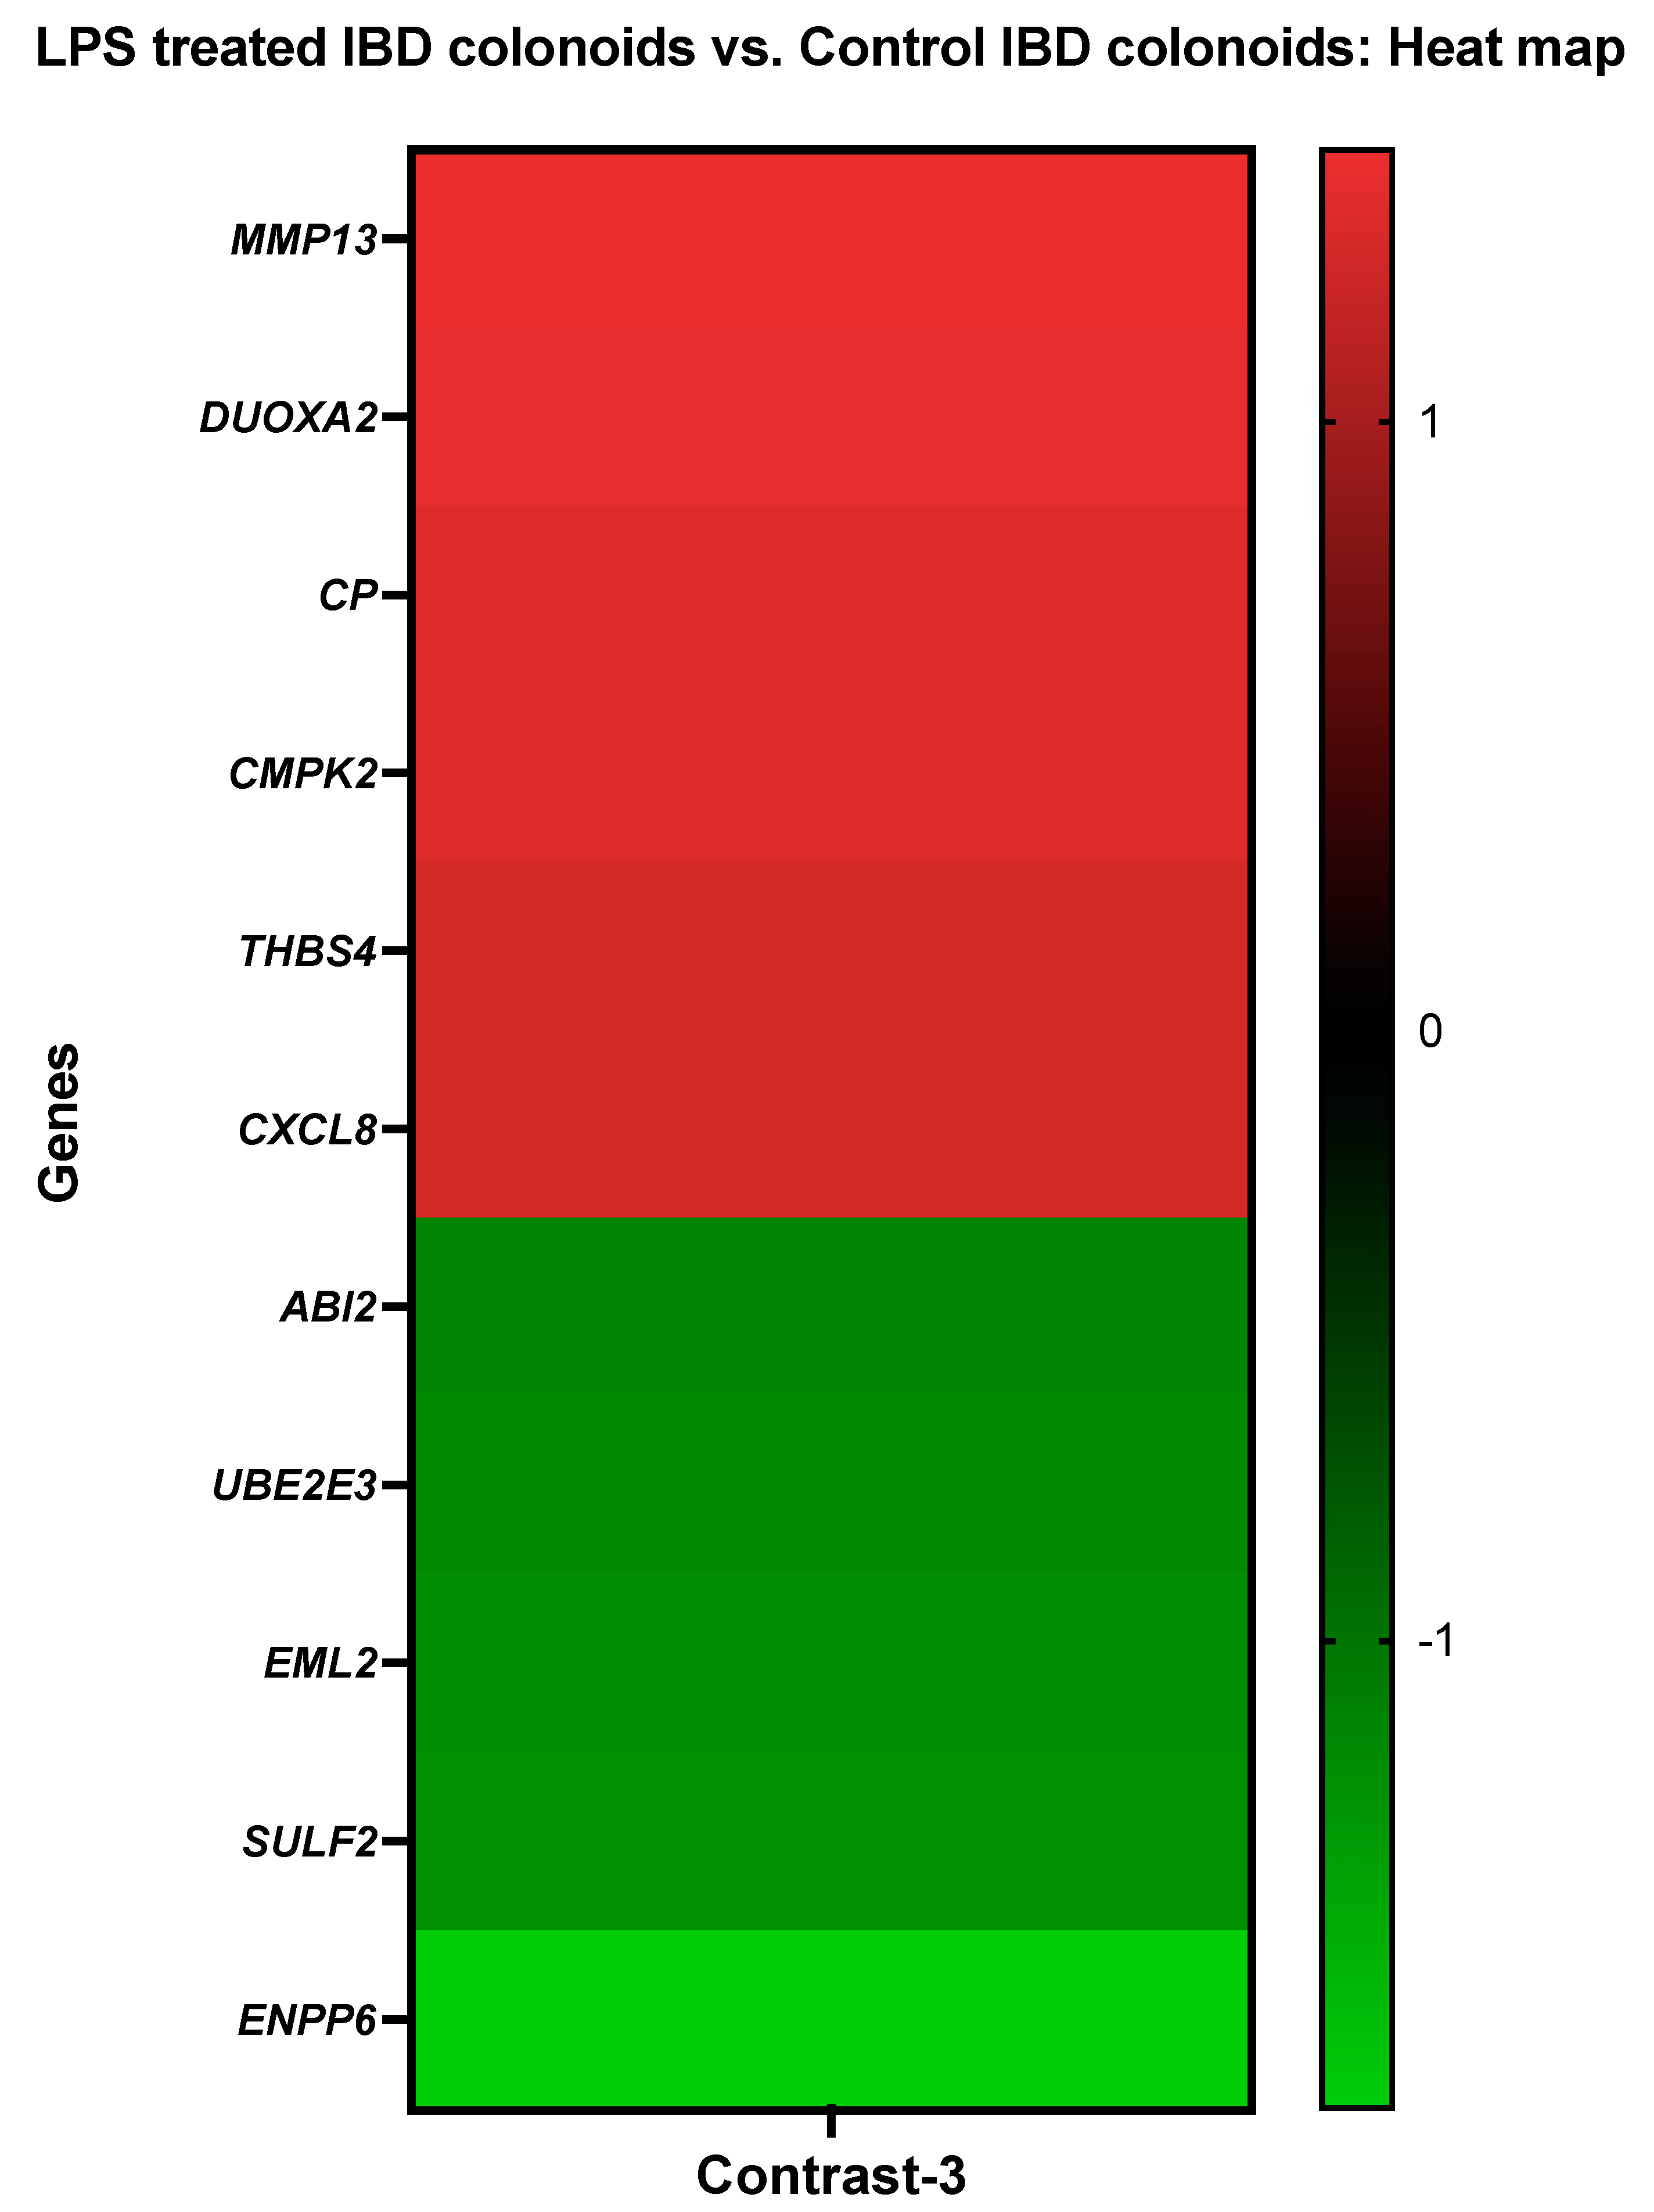
3.3.3. The LPS Treated IBD Colonoids vs. the Control IBD Colonoids
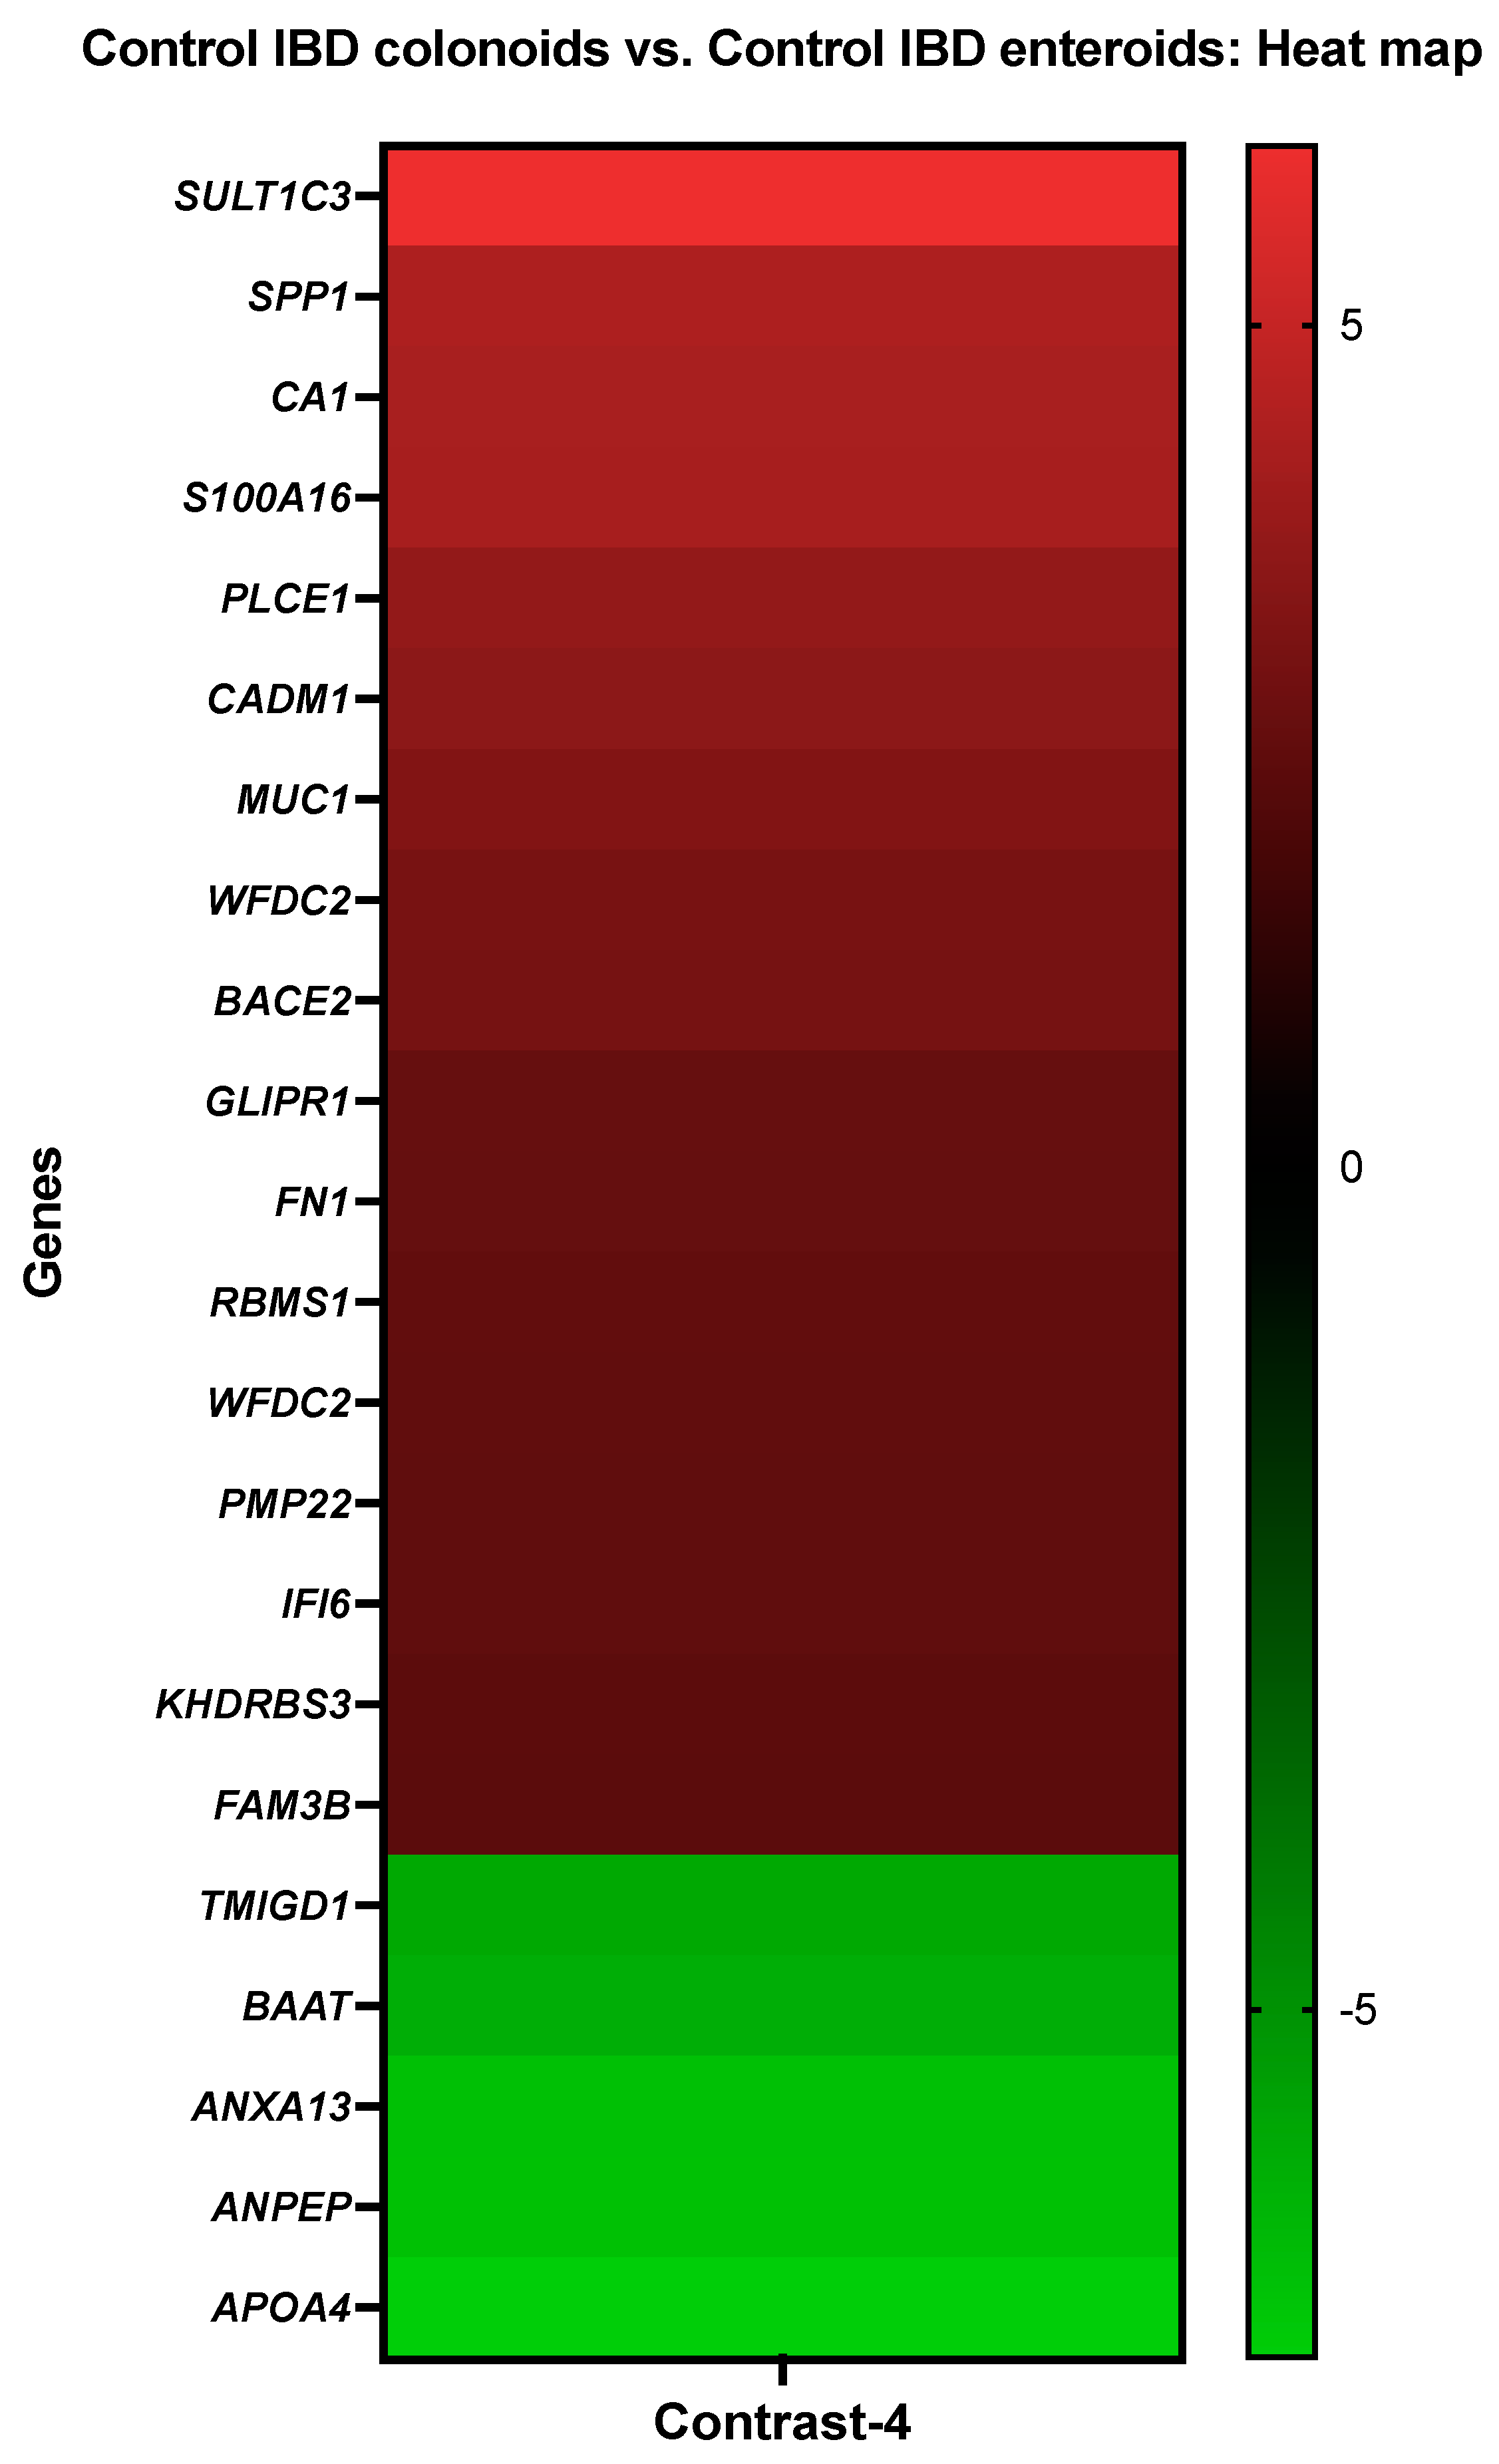
3.3.4. The Control IBD Colonoids vs. the Control IBD Enteroids
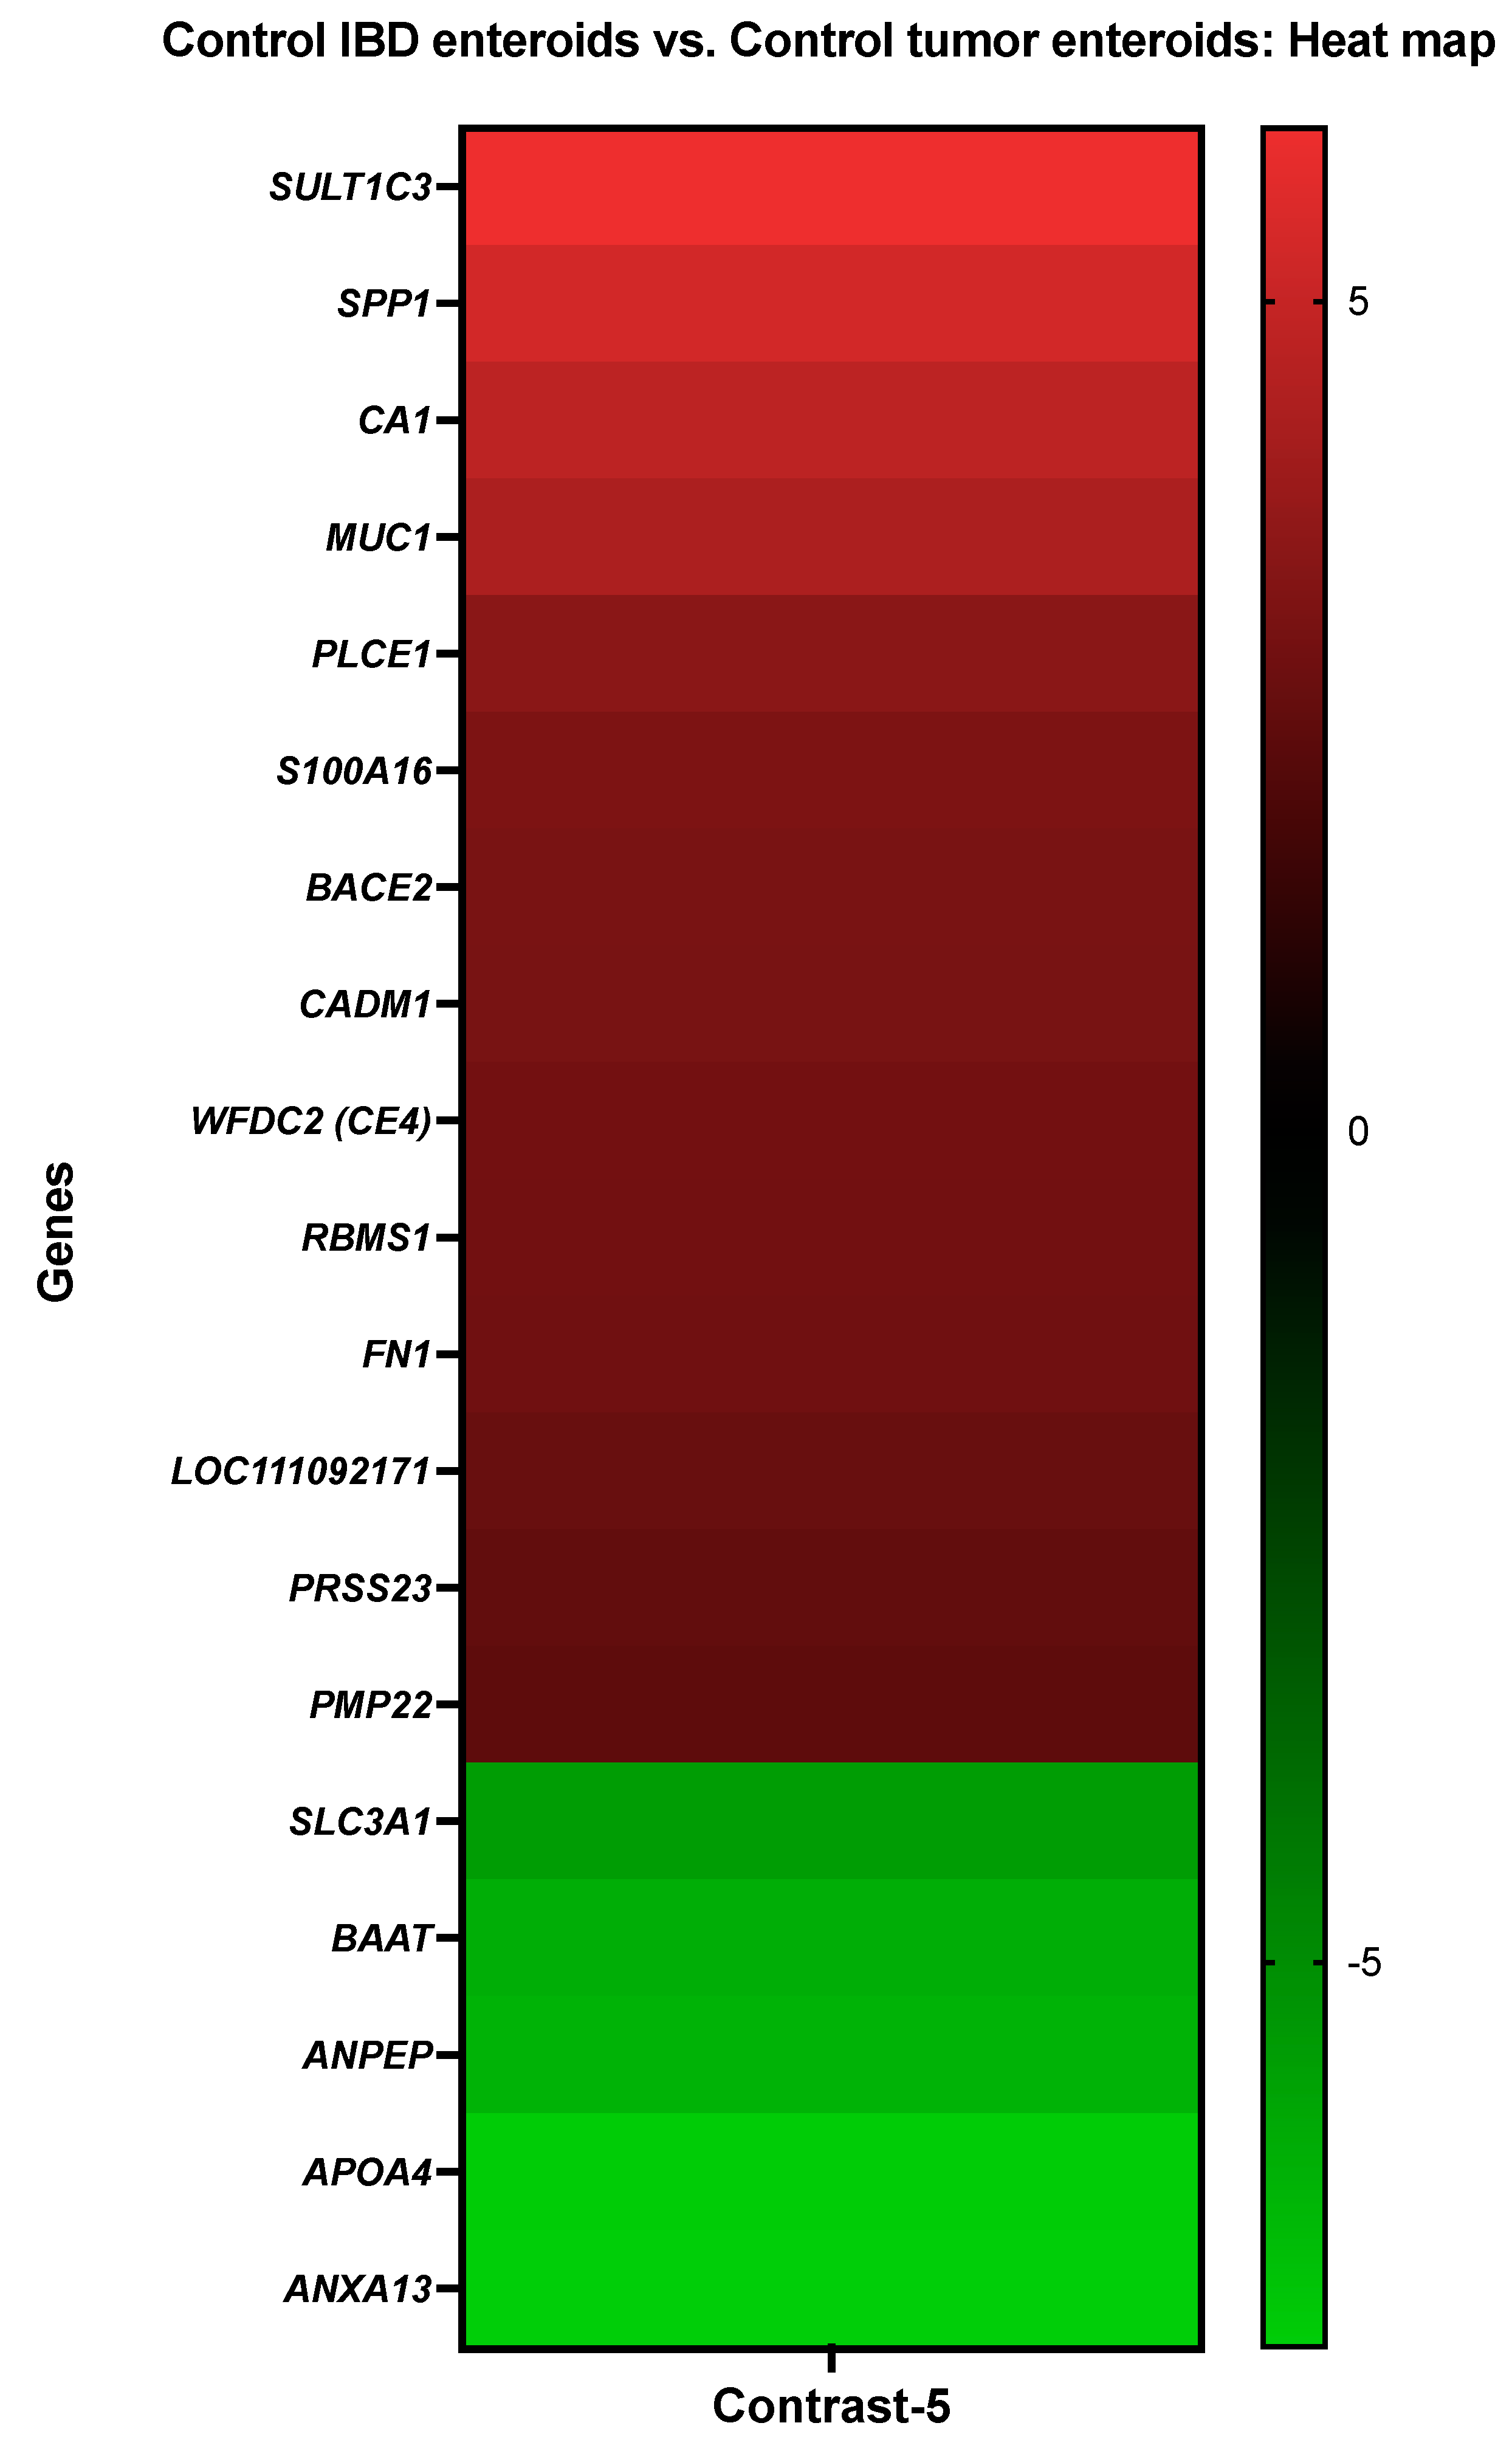
3.3.5. The Control IBD Enteroids vs. the Control Tumor Enteroids
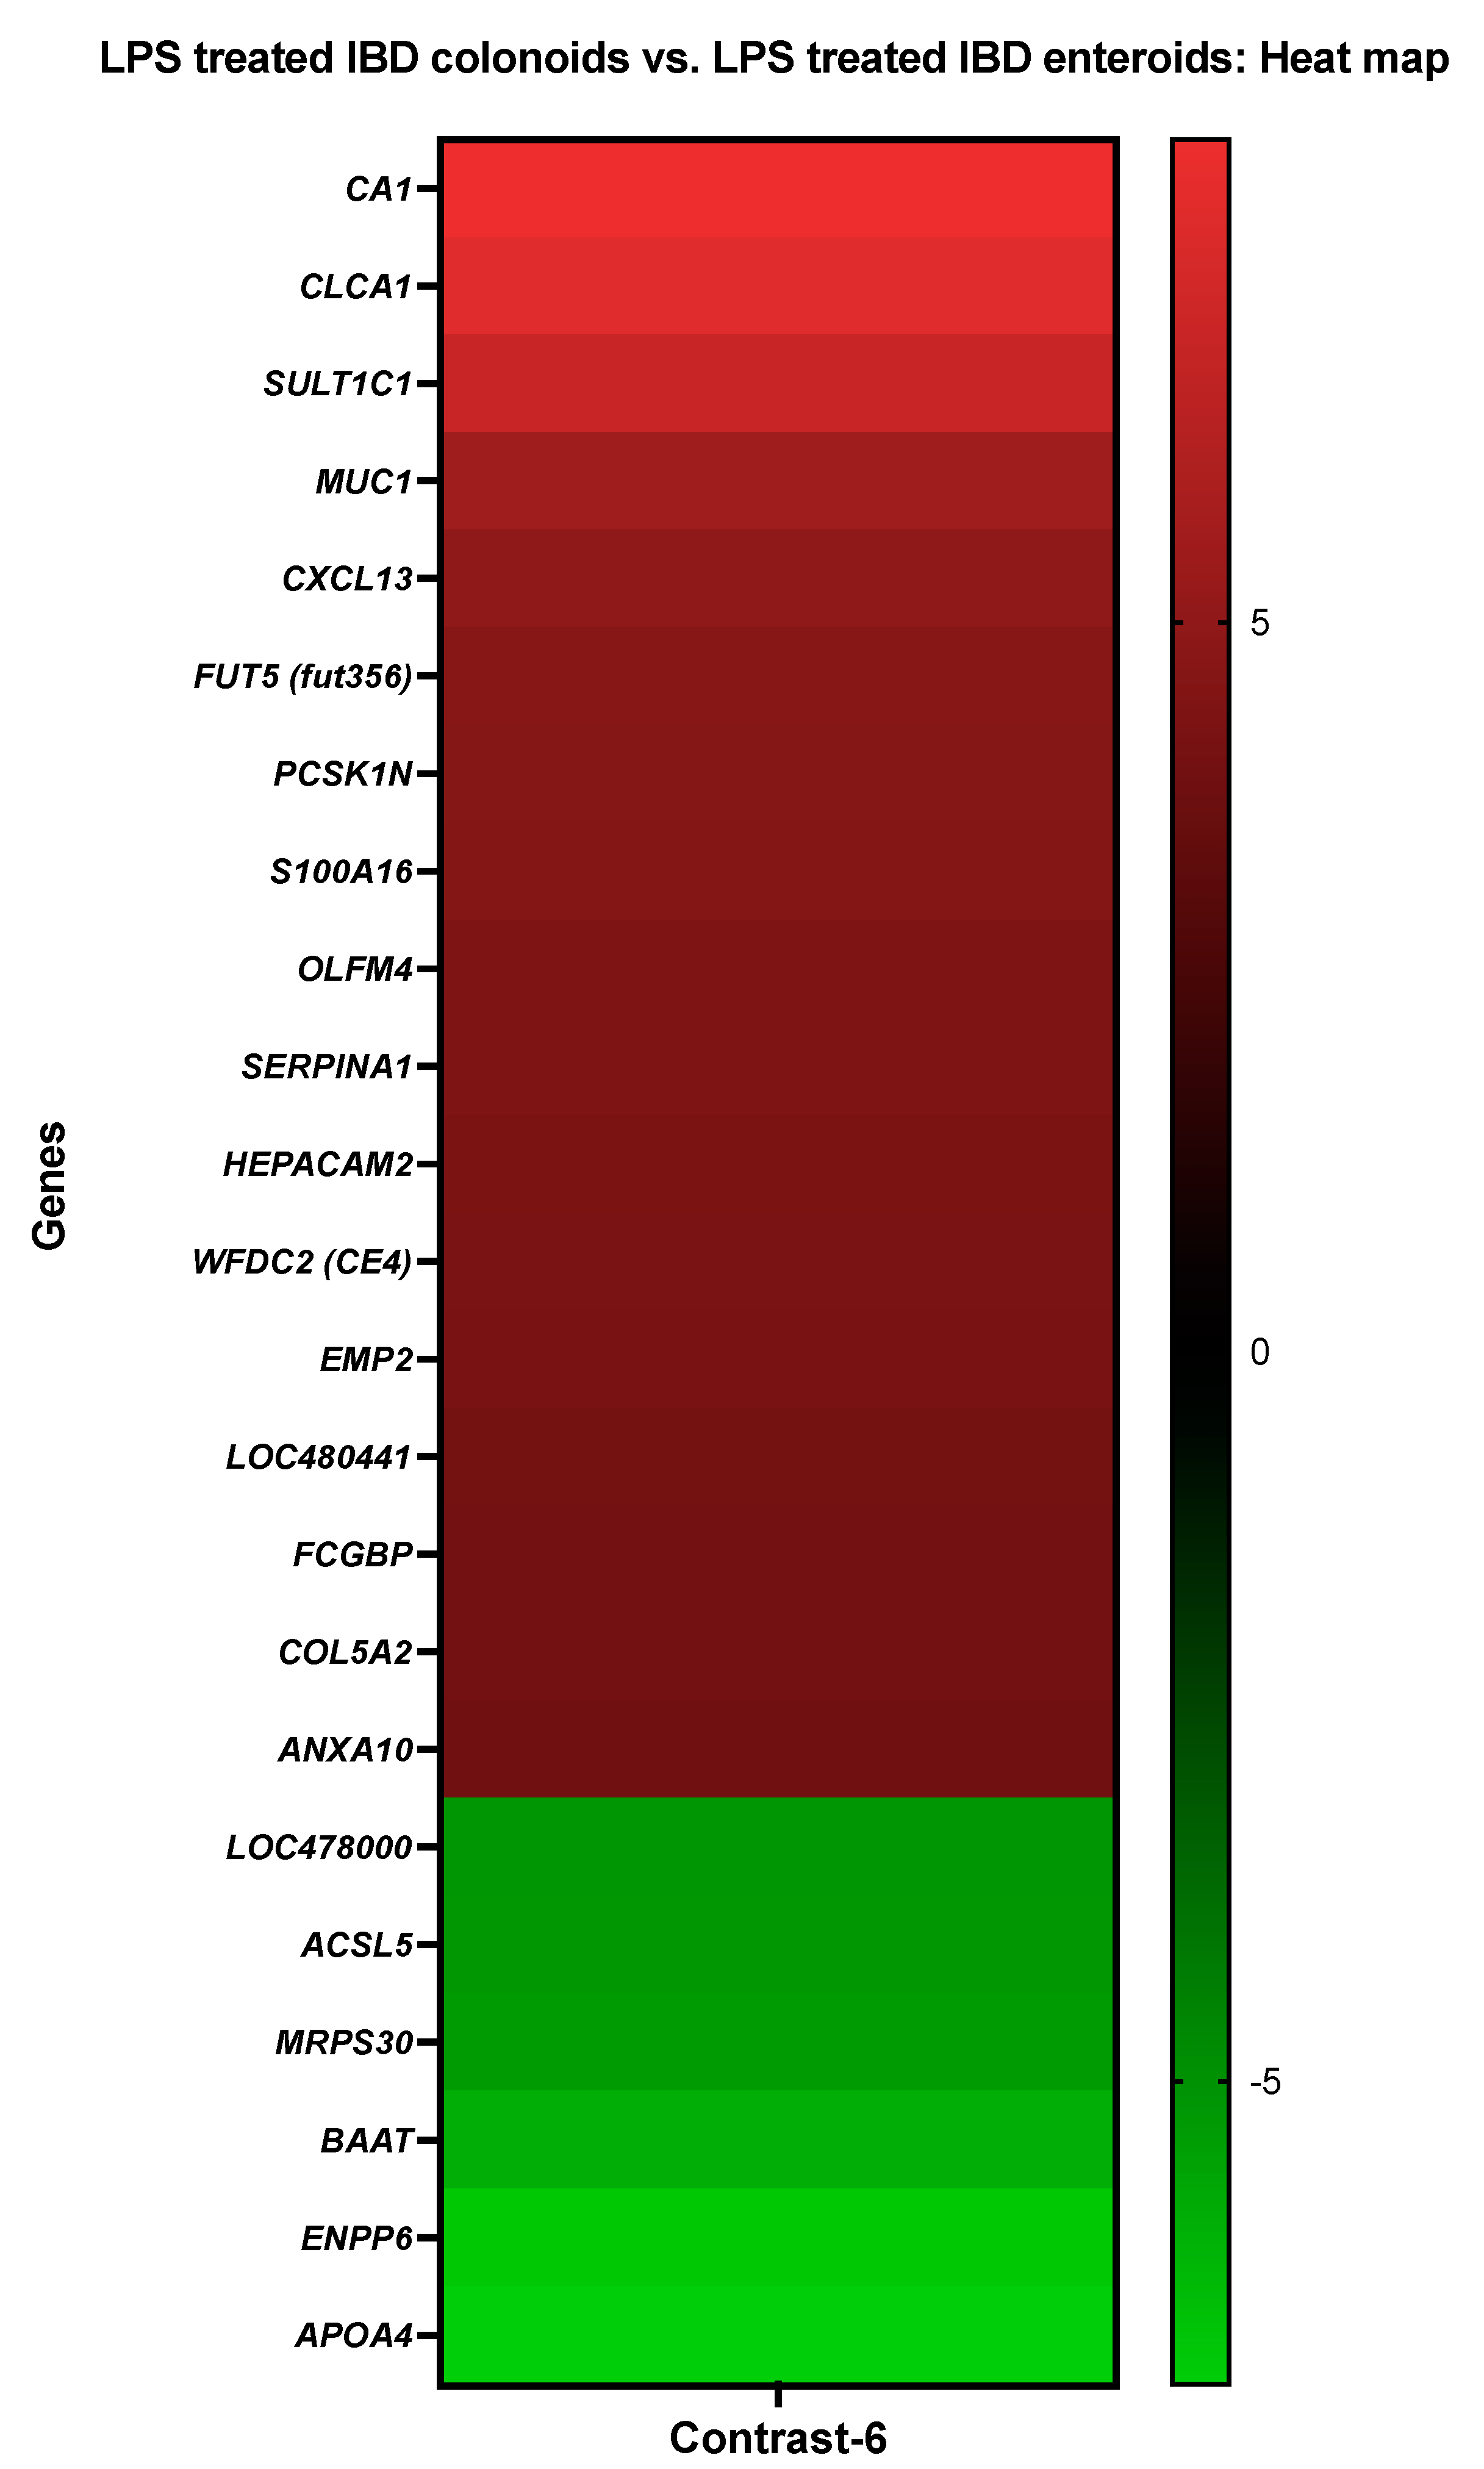
3.3.6. The LPS Treated IBD Colonoids vs. the LPS Treated IBD Enteroids
3.3.7. The LPS Treated IBD Enteroids vs. the LPS Treated Tumor Enteroids
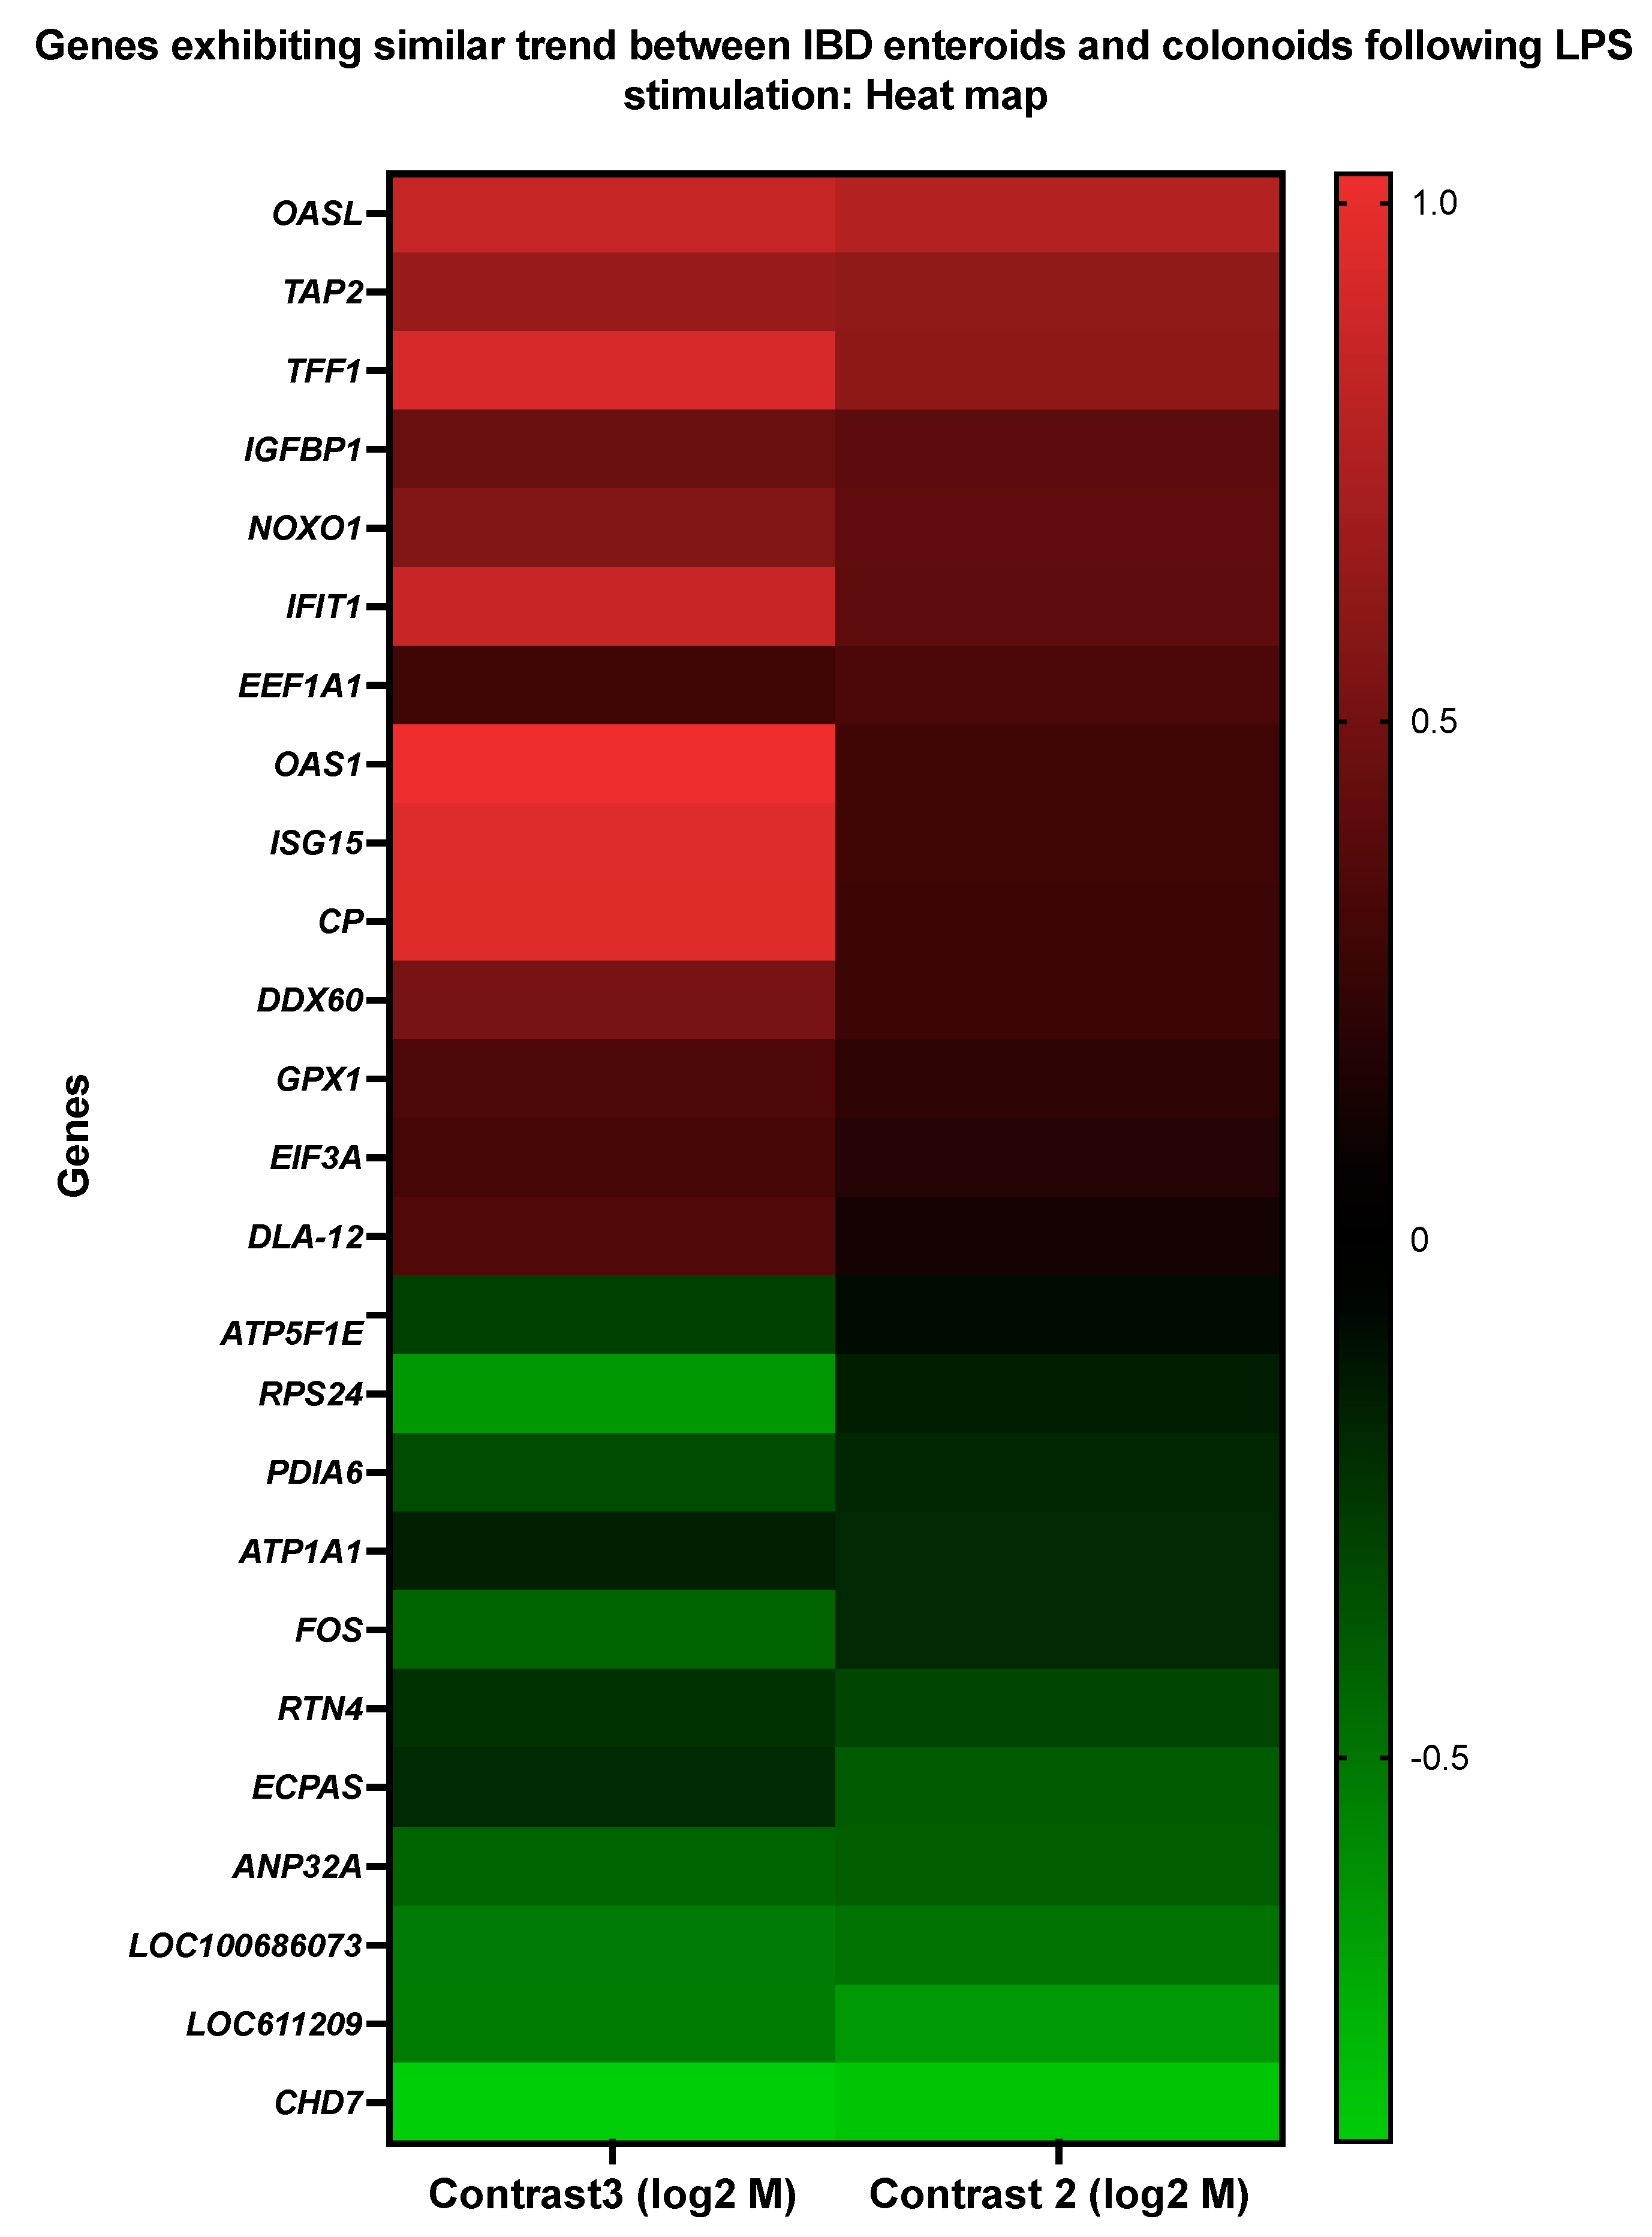
3.4. Genes Showing Similar Expression Patterns between IBD Enteroids and Colonoids Following LPS Stimulation
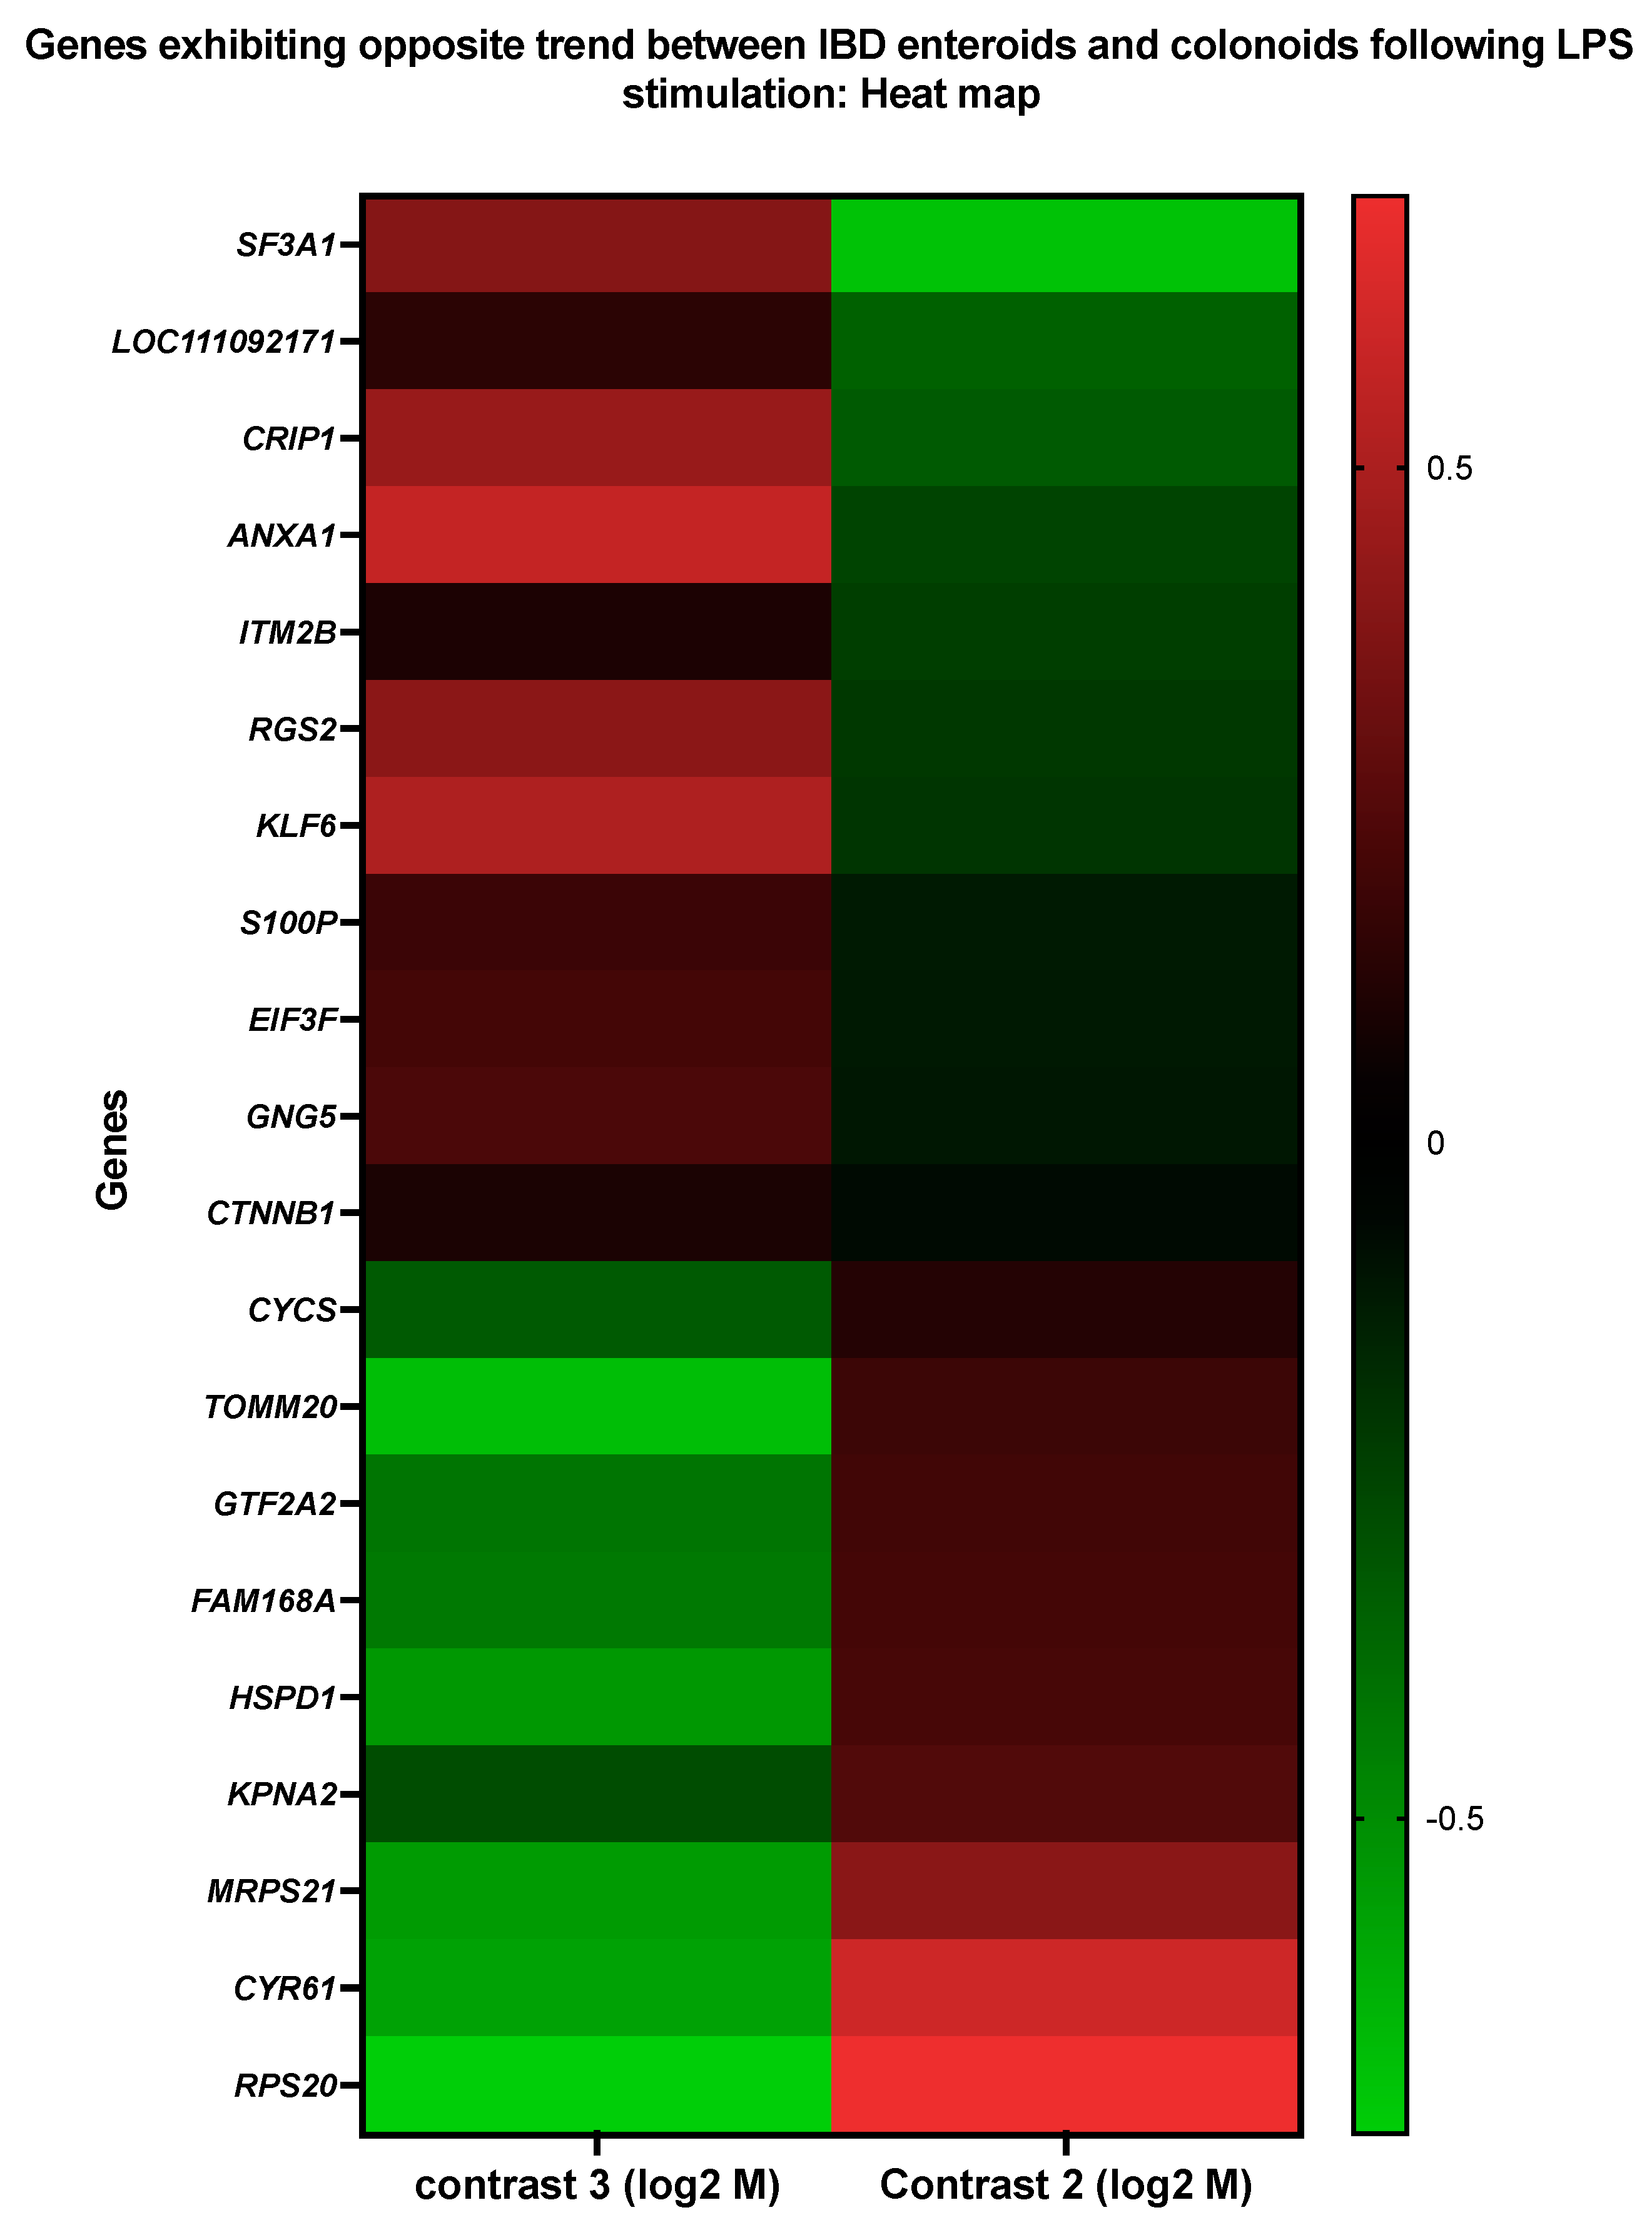
3.5. Genes Upregulated in IBD Enteroids and Downregulated in IBD Colonoids (and Vice Versa) Following LPS Stimulation
3.6. KEGG Pathway Analyses
4. Discussion
5. Conclusions
Supplementary Materials
Author Contributions
Funding
Institutional Review Board Statement
Informed Consent Statement
Data Availability Statement
Acknowledgments
Conflicts of Interest
References
- Heinbockel, L.; Weindl, G.; Martinez-de-Tejada, G.; Correa, W.; Sanchez-Gomez, S.; Bárcena-Varela, S.; Goldmann, T.; Garidel, P.; Gutsmann, T.; Brandenburg, K. Inhibition of Lipopolysaccharide- and Lipoprotein-Induced Inflammation by Antitoxin Peptide Pep19-2.5. Front. Immunol. 2018, 9, 1704. [Google Scholar] [CrossRef] [PubMed] [Green Version]
- Im, E.; Riegler, F.M.; Pothoulakis, C.; Rhee, S.H. Elevated Lipopolysaccharide in the Colon Evokes Intestinal Inflammation, Aggravated in Immune Modulator-Impaired Mice. Am. J. Physiol.-Gastrointest. Liver Physiol. 2012, 303, G490–G497. [Google Scholar] [CrossRef] [PubMed] [Green Version]
- Schoultz, I.; Keita, Å.V. The Intestinal Barrier and Current Techniques for the Assessment of Gut Permeability. Cells 2020, 9, 1909. [Google Scholar] [CrossRef]
- Ghosh, S.S.; Wang, J.; Yannie, P.J.; Ghosh, S. Intestinal Barrier Dysfunction, LPS Translocation, and Disease Development. J. Endocr. Soc. 2020, 4, bvz039. [Google Scholar] [CrossRef] [Green Version]
- Chin, A.C.; Flynn, A.N.; Fedwick, J.P.; Buret, A.G. The Role of Caspase-3 in Lipopolysaccharide-Mediated Disruption of Intestinal Epithelial Tight Junctions. Can. J. Physiol. Pharmacol. 2006, 84, 1043–1050. [Google Scholar] [CrossRef]
- Liu, T.; Zhang, L.; Joo, D.; Sun, S.-C. NF-ΚB Signaling in Inflammation. Signal Transduct. Target. Ther. 2017, 2, 17023. [Google Scholar] [CrossRef] [Green Version]
- Grimstad, O. Tumor Necrosis Factor and the Tenacious α. JAMA Dermatol. 2016, 152, 557. [Google Scholar] [CrossRef] [PubMed] [Green Version]
- Nighot, M.; Al-Sadi, R.; Guo, S.; Rawat, M.; Nighot, P.; Watterson, M.D.; Ma, T.Y. Lipopolysaccharide-Induced Increase in Intestinal Epithelial Tight Permeability Is Mediated by Toll-Like Receptor 4/Myeloid Differentiation Primary Response 88 (MyD88) Activation of Myosin Light Chain Kinase Expression. Am. J. Pathol. 2017, 187, 2698–2710. [Google Scholar] [CrossRef] [Green Version]
- Guo, S.; Nighot, M.; Al-Sadi, R.; Alhmoud, T.; Nighot, P.; Ma, T.Y. Lipopolysaccharide Regulation of Intestinal Tight Junction Permeability Is Mediated by TLR-4 Signal Transduction Pathway Activation of FAK and MyD88. J. Immunol. 2015, 195, 4999. [Google Scholar] [CrossRef]
- Rossol, M.; Heine, H.; Meusch, U.; Quandt, D.; Klein, C.; Sweet, M.J.; Hauschildt, S. LPS-Induced Cytokine Production in Human Monocytes and Macrophages. Crit. Rev. Immunol. 2011, 31, 379–446. [Google Scholar] [CrossRef]
- Ueda, Y.; Kayama, H.; Jeon, S.G.; Kusu, T.; Isaka, Y.; Rakugi, H.; Yamamoto, M.; Takeda, K. Commensal Microbiota Induce LPS Hyporesponsiveness in Colonic Macrophages via the Production of IL-10. Int. Immunol. 2010, 22, 953–962. [Google Scholar] [CrossRef] [PubMed] [Green Version]
- Kayama, H.; Takeda, K. Functions of Innate Immune Cells and Commensal Bacteria in Gut Homeostasis. J. Biochem. 2016, 159, 141–149. [Google Scholar] [CrossRef] [PubMed]
- Baldelli, V.; Scaldaferri, F.; Putignani, L.; del Chierico, F. The Role of Enterobacteriaceae in Gut Microbiota Dysbiosis in Inflammatory Bowel Diseases. Microorganisms 2021, 9, 697. [Google Scholar] [CrossRef] [PubMed]
- Lee, J.H.; Jeon, Y.D.; Xin, M.; ye Lim, J.; Lee, Y.M.; Kim, D.K. Mast Cell Modulates Tumorigenesis Caused by Repeated Bowel Inflammation Condition in Azoxymethane/Dextran Sodium Sulfate-Induced Colon Cancer Mouse Model. Biochem. Biophys. Rep. 2022, 30, 101253. [Google Scholar] [CrossRef]
- Crivellato, E.; Beltrami, C.A.; Mallardi, F.; Ribatti, D. Paul Ehrlich’s Doctoral Thesis: A Milestone in the Study of Mast Cells. Br. J. Haematol. 2003, 123, 19–21. [Google Scholar] [CrossRef]
- Sakalauskaitė, S.; Riškevičienė, V.; Šengaut, J.; Juodžiukynienė, N. Association of Mast Cell Density, Microvascular Density and Endothelial Area with Clinicopathological Parameters and Prognosis in Canine Mammary Gland Carcinomas. Acta Vet. Scand. 2022, 64, 14. [Google Scholar] [CrossRef]
- Sammarco, G.; Gallo, G.; Vescio, G.; Picciariello, A.; de Paola, G.; Trompetto, M.; Currò, G.; Ammendola, M. Mast Cells, MicroRNAs and Others: The Role of Translational Research on Colorectal Cancer in the Forthcoming Era of Precision Medicine. J. Clin. Med. 2020, 9, 2852. [Google Scholar] [CrossRef]
- Hand, T.W.; Vujkovic-Cvijin, I.; Ridaura, V.K.; Belkaid, Y. Linking the Microbiota, Chronic Disease, and the Immune System. Trends Endocrinol. Metab. 2016, 27, 831–843. [Google Scholar] [CrossRef] [Green Version]
- Liu, W.-T.; Jing, Y.-Y.; Yan, F.; Han, Z.-P.; Lai, F.-B.; Zeng, J.-X.; Yu, G.-F.; Fan, Q.-M.; Li, R.; Zhao, Q.-D.; et al. LPS-Induced CXCR4-Dependent Migratory Properties and a Mesenchymal-like Phenotype of Colorectal Cancer Cells. Cell Adhes. Migr. 2017, 11, 13–23. [Google Scholar] [CrossRef] [Green Version]
- Zhu, G.; Huang, Q.; Huang, Y.; Zheng, W.; Hua, J.; Yang, S.; Zhuang, J.; Wang, J.; Ye, J. Lipopolysaccharide Increases the Release of VEGF-C That Enhances Cell Motility and Promotes Lymphangiogenesis and Lymphatic Metastasis through the TLR4-NF-ΚB/JNK Pathways in Colorectal Cancer. Oncotarget 2016, 7, 73711–73724. [Google Scholar] [CrossRef] [Green Version]
- Zhao, H.; Wu, L.; Yan, G.; Chen, Y.; Zhou, M.; Wu, Y.; Li, Y. Inflammation and Tumor Progression: Signaling Pathways and Targeted Intervention. Signal Transduct. Target. Ther. 2021, 6, 263. [Google Scholar] [CrossRef] [PubMed]
- Schreibelt, G.; Tel, J.; Sliepen, K.H.E.W.J.; Benitez-Ribas, D.; Figdor, C.G.; Adema, G.J.; de Vries, I.J.M. Toll-like Receptor Expression and Function in Human Dendritic Cell Subsets: Implications for Dendritic Cell-Based Anti-Cancer Immunotherapy. Cancer Immunol. Immunother. 2010, 59, 1573–1582. [Google Scholar] [CrossRef] [PubMed]
- Davis, M.B.; Vasquez-Dunddel, D.; Fu, J.; Albesiano, E.; Pardoll, D.; Kim, Y.J. Intratumoral Administration of TLR4 Agonist Absorbed into a Cellular Vector Improves Anti-Tumor Responses. Clin. Cancer Res. 2011, 17, 3984. [Google Scholar] [CrossRef] [PubMed] [Green Version]
- Guo, J.; Liao, M.; Wang, J. TLR4 Signaling in the Development of Colitis-Associated Cancer and Its Possible Interplay with MicroRNA-155. Cell Commun. Signal. 2021, 19, 90. [Google Scholar] [CrossRef] [PubMed]
- Narrandes, S.; Xu, W. Gene Expression Detection Assay for Cancer Clinical Use. J. Cancer 2018, 9, 2249. [Google Scholar] [CrossRef] [PubMed]
- Bertucci, F.; Houlgatte, R.; Nguyen, C.; Viens, P.; Jordan, B.R.; Birnbaum, D. Gene Expression Profiling of Cancer by Use of DNA Arrays: How Far from the Clinic? Lancet Oncol. 2001, 2, 674–682. [Google Scholar] [CrossRef]
- Gardner, H.L.; Fenger, J.M.; London, C.A. Dogs as a Model for Cancer. Annu. Rev. Anim. Biosci. 2016, 4, 199. [Google Scholar] [CrossRef]
- Shearin, A.L.; Ostrander, E.A. Leading the Way: Canine Models of Genomics and Disease. Dis. Models Mech. 2010, 3, 27. [Google Scholar] [CrossRef] [Green Version]
- Kathrani, A.; Werling, D.; Allenspach, K. Canine Breeds at High Risk of Developing Inflammatory Bowel Disease in the South-Eastern UK. Vet. Rec. 2011, 169, 635. [Google Scholar] [CrossRef] [Green Version]
- Chandra, L.; Borcherding, D.C.; Kingsbury, D.; Atherly, T.; Ambrosini, Y.M.; Bourgois-Mochel, A.; Yuan, W.; Kimber, M.; Qi, Y.; Wang, Q.; et al. Derivation of Adult Canine Intestinal Organoids for Translational Research in Gastroenterology. BMC Biol. 2019, 17, 33. [Google Scholar] [CrossRef]
- Mochel, J.P.; Jergens, A.E.; Kingsbury, D.; Kim, H.J.; Martín, M.G.; Allenspach, K. Intestinal Stem Cells to Advance Drug Development, Precision, and Regenerative Medicine: A Paradigm Shift in Translational Research. AAPS J. 2018, 20, 17. [Google Scholar] [CrossRef] [PubMed] [Green Version]
- Jergens, A.; Young, J.; Moore, D.; Wang, C.; Hostetter, J.; Augustine, L.; Allenspach, K.; Schmitz, S.; Mosher, C. Bcl-2/Caspase 3 Mucosal Imbalance Favors T Cell Resistance to Apoptosis in Dogs with Inflammatory Bowel Disease. Vet. Immunol. Immunopathol. 2014, 158, 167–174. [Google Scholar] [CrossRef] [PubMed]
- Kopper, J.; Iennarella-Servantez, C.; Jergens, A.E.; Sahoo, D.K.; Guillot, E.; Bourgois Mochel, A.; Martinez, M.; Allenspach, K.; Mochel, J.P. Harnessing the Biology of Canine Intestinal Organoids to Heighten Understanding of Inflammatory Bowel Disease Pathogenesis and Accelerate Drug Discovery: A One Health Approach. Front. Toxicol. 2021, 3, 773953. [Google Scholar] [CrossRef]
- Kraiczy, J.; Nayak, K.M.; Howell, K.J.; Ross, A.; Forbester, J.; Salvestrini, C.; Mustata, R.; Perkins, S.; Andersson-Rolf, A.; Leenen, E.; et al. DNA Methylation Defines Regional Identity of Human Intestinal Epithelial Organoids and Undergoes Dynamic Changes during Development. Gut 2019, 68, 49–61. [Google Scholar] [CrossRef] [PubMed]
- Moon, T.C.; Dean Befus, A.; Kulka, M. Mast Cell Mediators: Their Differential Release and the Secretory Pathways Involved. Front. Immunol. 2014, 5, 569. [Google Scholar] [CrossRef] [Green Version]
- Fish, R.E. How to Work with Your Institutional Animal Care and Use Committee (IACUC). 2004. Available online: https://ori.hhs.gov/education/products/ncstate/iacuc.htm (accessed on 29 November 2018).
- Blutt, S.E.; Crawford, S.E.; Ramani, S.; Zou, W.Y.; Estes, M.K. Engineered Human Gastrointestinal Cultures to Study the Microbiome and Infectious Diseases. Cell. Mol. Gastroenterol. Hepatol. 2018, 5, 241–251. [Google Scholar] [CrossRef] [Green Version]
- Chen, J.; Rao, J.N.; Zou, T.; Liu, L.; Marasa, B.S.; Xiao, L.; Zeng, X.; Turner, D.J.; Wang, J.-Y. Polyamines Are Required for Expression of Toll-like Receptor 2 Modulating Intestinal Epithelial Barrier Integrity. Am. J. Physiol. Gastrointest. Liver Physiol. 2007, 293, 568–576. [Google Scholar] [CrossRef] [Green Version]
- Yücel, G.; Zhao, Z.; El-Battrawy, I.; Lan, H.; Lang, S.; Li, X.; Buljubasic, F.; Zimmermann, W.-H.; Cyganek, L.; Utikal, J.; et al. Lipopolysaccharides Induced Inflammatory Responses and Electrophysiological Dysfunctions in Human-Induced Pluripotent Stem Cell Derived Cardiomyocytes. Sci. Rep. 2017, 7, 2935. [Google Scholar] [CrossRef]
- Yin, P.; Zou, W.; Li, J.; Jin, N.; Gao, Q.; Liu, F. Using High-Throughput Sequencing to Explore the Anti-Inflammatory Effects of α-Mangostin. Sci. Rep. 2019, 9, 15626. [Google Scholar] [CrossRef] [Green Version]
- Chandra, L.C.; Kumar, V.; Torben, W.; Van de Stouwe, C.; Winsauer, P.; Amedee, A.; Molina, P.E.; Mohan, M. Chronic Administration of Δ 9-Tetrahydrocannabinol Induces Intestinal Anti-Inflammatory MicroRNA Expression during Acute Simian Immunodeficiency Virus Infection of Rhesus Macaques. J. Virol. 2015, 89, 1168–1181. [Google Scholar] [CrossRef] [Green Version]
- Schindelin, J.; Arganda-Carreras, I.; Frise, E.; Kaynig, V.; Longair, M.; Pietzsch, T.; Preibisch, S.; Rueden, C.; Saalfeld, S.; Schmid, B.; et al. Fiji: An Open-Source Platform for Biological-Image Analysis. Nat. Methods 2012, 9, 676–682. [Google Scholar] [CrossRef] [PubMed] [Green Version]
- Wettenhall, J.M.; Simpson, K.M.; Satterley, K.; Smyth, G.K. AffylmGUI: A Graphical User Interface for Linear Modeling of Single Channel Microarray Data. Bioinformatics 2006, 22, 897–899. [Google Scholar] [CrossRef] [PubMed]
- Tarca, A.L.; Romero, R.; Draghici, S. Analysis of Microarray Experiments of Gene Expression Profiling. Am. J. Obstet. Gynecol. 2006, 195, 373. [Google Scholar] [CrossRef] [Green Version]
- Kanehisa, M.; Furumichi, M.; Sato, Y.; Ishiguro-Watanabe, M.; Tanabe, M. KEGG: Integrating Viruses and Cellular Organisms. Nucleic Acids Res. 2021, 49, D545–D551. [Google Scholar] [CrossRef] [PubMed]
- Kanehisa, M. Toward Understanding the Origin and Evolution of Cellular Organisms. Protein Sci. 2019, 28, 1947–1951. [Google Scholar] [CrossRef]
- Kanehisa, M.; Goto, S. KEGG: Kyoto Encyclopedia of Genes and Genomes. Nucleic Acids Res. 2000, 28, 27–30. [Google Scholar] [CrossRef] [PubMed]
- Conesa, A.; Götz, S.; García-Gómez, J.M.; Terol, J.; Talón, M.; Robles, M. Blast2GO: A Universal Tool for Annotation, Visualization and Analysis in Functional Genomics Research. Bioinformatics 2005, 21, 3674–3676. [Google Scholar] [CrossRef] [Green Version]
- Kanehisa, M.; Furumichi, M.; Tanabe, M.; Sato, Y.; Morishima, K. KEGG: New Perspectives on Genomes, Pathways, Diseases and Drugs. Nucleic Acids Res. 2017, 45, D353–D361. [Google Scholar] [CrossRef] [Green Version]
- BioBam Bioinformatics OmicsBox—Bioinformatics Made Easy 2019. 3 March 2019. Available online: https://www.biobam.com/omicsbox/?cn-reloaded=1 (accessed on 5 May 2020).
- Scholzen, T.; Gerdes, J. The Ki-67 Protein: From the Known and the Unknown. J. Cell. Physiol. 2000, 182, 311–322. [Google Scholar] [CrossRef]
- Affymetrix GeneChip® Canine Genome Array. Available online: http://www.affymetrix.com/products_services/arrays/specific/canine.affx#1_2 (accessed on 5 May 2020).
- Jakobsson, M.E.; Ma-Lecki, J.; Nilges, B.S.; Moen, A.; Leidel, S.A.; Falnes, P. Methylation of Human Eukaryotic Elongation Factor Alpha (EEF1A) by a Member of a Novel Protein Lysine Methyltransferase Family Modulates mRNA Translation. Nucleic Acids Res. 2017, 45, 8239–8254. [Google Scholar] [CrossRef]
- Kespohl, M.; Bredow, C.; Klingel, K.; Voß, M.; Paeschke, A.; Zickler, M.; Poller, W.; Kaya, Z.; Eckstein, J.; Fechner, H.; et al. Protein Modification with ISG15 Blocks Coxsackievirus Pathology by Antiviral and Metabolic Reprogramming. Sci. Adv. 2020, 6, eaay1109. [Google Scholar] [CrossRef] [PubMed] [Green Version]
- Grebenjuk, V.A.; Kuusksalu, A.; Kelve, M.; Schütze, J.; Schröder, H.C.; Müller, W.E.G. Induction of (2′-5′)Oligoadenylate Synthetase in the Marine Sponges Suberites Domuncula and Geodia Cydonium by the Bacterial Endotoxin Lipopolysaccharide. Eur. J. Biochem. 2002, 269, 1382–1392. [Google Scholar] [CrossRef] [PubMed]
- Yang, C.; Liu, F.; Chen, S.; Wang, M.; Jia, R.; Zhu, D.; Liu, M.; Sun, K.; Yang, Q.; Wu, Y.; et al. Identification of 2′-5′-Oligoadenylate Synthetase-Like Gene in Goose: Gene Structure, Expression Patterns, and Antiviral Activity Against Newcastle Disease Virus. J. Interferon Cytokine Res. 2016, 36, 563–572. [Google Scholar] [CrossRef] [PubMed] [Green Version]
- d’Aldebert, E.; Quaranta, M.; Sébert, M.; Bonnet, D.; Kirzin, S.; Portier, G.; Duffas, J.P.; Chabot, S.; Lluel, P.; Allart, S.; et al. Characterization of Human Colon Organoids From Inflammatory Bowel Disease Patients. Front. Cell Dev. Biol. 2020, 8, 363. [Google Scholar] [CrossRef]
- Arnauts, K.; Verstockt, B.; Ramalho, A.S.; Vermeire, S.; Verfaillie, C.; Ferrante, M. Ex Vivo Mimicking of Inflammation in Organoids Derived from Patients with Ulcerative Colitis. Gastroenterology 2020, 159, 1564–1567. [Google Scholar] [CrossRef]
- Niklinska-Schirtz, B.J.; Venkateswaran, S.; Anbazhagan, M.; Kolachala, V.L.; Prince, J.; Dodd, A.; Chinnadurai, R.; Gibson, G.; Denson, L.A.; Cutler, D.J.; et al. Ileal Derived Organoids From Crohn’s Disease Patients Show Unique Transcriptomic and Secretomic Signatures. Cell. Mol. Gastroenterol. Hepatol. 2021, 12, 1267. [Google Scholar] [CrossRef]
- Haber, A.L.; Biton, M.; Rogel, N.; Herbst, R.H.; Shekhar, K.; Smillie, C.; Burgin, G.; Delorey, T.M.; Howitt, M.R.; Katz, Y.; et al. A Single-Cell Survey of the Small Intestinal Epithelium. Nature 2017, 551, 333–339. [Google Scholar] [CrossRef]
- Middendorp, S.; Schneeberger, K.; Wiegerinck, C.L.; Mokry, M.; Akkerman, R.D.L.; van Wijngaarden, S.; Clevers, H.; Nieuwenhuis, E.E.S. Adult Stem Cells in the Small Intestine are Intrinsically Programmed with Their Location-Specific Function. Stem Cells 2014, 32, 1083–1091. [Google Scholar] [CrossRef]
- van der Hee, B.; Madsen, O.; Vervoort, J.; Smidt, H.; Wells, J.M. Congruence of Transcription Programs in Adult Stem Cell-Derived Jejunum Organoids and Original Tissue during Long-Term Culture. Front. Cell Dev. Biol. 2020, 8, 375. [Google Scholar] [CrossRef]
- Lowe, R.; Shirley, N.; Bleackley, M.; Dolan, S.; Shafee, T. Transcriptomics Technologies. PLoS Comput. Biol. 2017, 13, e1005457. [Google Scholar] [CrossRef] [Green Version]
- Sprangers, J.; Zaalberg, I.C.; Maurice, M.M. Organoid-Based Modeling of Intestinal Development, Regeneration, and Repair. Cell Death Differ. 2020, 28, 95–107. [Google Scholar] [CrossRef] [PubMed]
- Li, L.T.; Jiang, G.; Chen, Q.; Zheng, J.N. Ki67 Is a Promising Molecular Target in the Diagnosis of Cancer (Review). Mol. Med. Rep. 2015, 11, 1566–1572. [Google Scholar] [CrossRef] [PubMed] [Green Version]
- Sándor, G.O.; Soós, A.Á.; Lörincz, P.; Rojkó, L.; Harkó, T.; Bogyó, L.; Tölgyes, T.; Bursics, A.; Buzás, E.I.; Moldvay, J.; et al. Wnt Activity and Cell Proliferation Are Coupled to Extracellular Vesicle Release in Multiple Organoid Models. Front. Cell Dev. Biol. 2021, 9, 1597. [Google Scholar] [CrossRef]
- Dezfuli, B.S.; Giari, L.; Lui, A.; Squerzanti, S.; Castaldelli, G.; Shinn, A.P.; Manera, M.; Lorenzoni, M. Proliferative Cell Nuclear Antigen (PCNA) Expression in the Intestine of Salmo Trutta Trutta Naturally Infected with an Acanthocephalan. Parasites Vectors 2012, 5, 198. [Google Scholar] [CrossRef] [PubMed] [Green Version]
- Karim, B.O.; Rhee, K.J.; Liu, G.; Yun, K.; Brant, S.R. Prom1 Function in Development, Intestinal Inflammation, and Intestinal Tumorigenesis. Front. Oncol. 2014, 4, 323. [Google Scholar] [CrossRef] [PubMed] [Green Version]
- Wang, X.Y.; Chen, S.H.; Zhang, Y.N.; Xu, C.F. Olfactomedin-4 in Digestive Diseases: A Mini-Review. World J. Gastroenterol. 2018, 24, 1881. [Google Scholar] [CrossRef] [PubMed]
- Yu, L.; Wang, L.; Chen, S. Olfactomedin 4, a Novel Marker for the Differentiation and Progression of Gastrointestinal Cancers. Neoplasma 2011, 58, 9–13. [Google Scholar] [CrossRef] [Green Version]
- Ueda, S.; Kondoh, N.; Tsuda, H.; Yamamoto, S.; Asakawa, H.; Fukatsu, K.; Kobayashi, T.; Yamamoto, J.; Tamura, K.; Ishida, J.; et al. Expression of Centromere Protein F (CENP-F) Associated with Higher FDG Uptake on PET/CT, Detected by CDNA Microarray, Predicts High-Risk Patients with Primary Breast Cancer. BMC Cancer 2008, 8, 384. [Google Scholar] [CrossRef] [Green Version]
- Landberg, G.; Erlanson, M.; Roos, G.; Tan, E.M.; Casiano, C.A. Nuclear Autoantigen p330d/CENP-F: A Marker for Cell Proliferation in Human Malignancies. Cytometry 1996, 25, 90–98. [Google Scholar] [CrossRef]
- Oono, K.; Takahashi, K.; Sukehara, S.; Kurosawa, H.; Matsumura, T.; Taniguchi, S.; Ohta, S. Inhibition of PC3 Human Prostate Cancer Cell Proliferation, Invasion and Migration by Eicosapentaenoic Acid and Docosahexaenoic Acid. Mol. Clin. Oncol. 2017, 7, 217. [Google Scholar] [CrossRef] [Green Version]
- Shahid, M.; Lee, M.Y.; Piplani, H.; Andres, A.M.; Zhou, B.; Yeon, A.; Kim, M.; Kim, H.L.; Kim, J. Centromere Protein F (CENPF), a Microtubule Binding Protein, Modulates Cancer Metabolism by Regulating Pyruvate Kinase M2 Phosphorylation Signaling. Cell Cycle 2018, 17, 2802–2818. [Google Scholar] [CrossRef] [PubMed] [Green Version]
- Rass, U.; Compton, S.A.; Matos, J.; Singleton, M.R.; Ip, S.C.Y.; Blanco, M.G.; Griffith, J.D.; West, S.C. Mechanism of Holliday Junction Resolution by the Human GEN1 Protein. Genes Dev. 2010, 24, 1559–1569. [Google Scholar] [CrossRef] [PubMed] [Green Version]
- Sun, L.; Zhang, Y.; Pan, Z.; Li, B.; Sun, M.; Zhang, X. Expression and Localization of GEN1 in Mouse Mammary Epithelial Cells. J. Biochem. Mol. Toxicol. 2014, 28, 450–455. [Google Scholar] [CrossRef] [PubMed]
- Ge, Y.; Ezzell, R.M.; Warren, H.S. Localization of Endotoxin in the Rat Intestinal Epithelium. J. Infect. Dis. 2000, 182, 873–881. [Google Scholar] [CrossRef]
- Hu, Y.P.; Wu, Z.B.; Jiang, L.; Jin, Y.P.; Li, H.F.; Zhang, Y.J.; Ma, Q.; Ye, Y.Y.; Wang, Z.; Liu, Y.C.; et al. STYK1 Promotes Cancer Cell Proliferation and Malignant Transformation by Activating PI3K-AKT Pathway in Gallbladder Carcinoma. Int. J. Biochem. Cell Biol. 2018, 97, 16–27. [Google Scholar] [CrossRef]
- Song, L.; Wang, L.; Li, Y.; Xiong, H.; Wu, J.; Li, J.; Li, M. Sam68 Up-Regulation Correlates with, and Its down-Regulation Inhibits, Proliferation and Tumourigenicity of Breast Cancer Cells. J. Pathol. 2010, 222, 227–237. [Google Scholar] [CrossRef]
- Sumithra, B.; Saxena, U.; Das, A.B. A Comprehensive Study on Genome-Wide Coexpression Network of KHDRBS1/Sam68 Reveals Its Cancer and Patient-Specific Association. Sci. Rep. 2019, 9, 11083. [Google Scholar] [CrossRef] [Green Version]
- Ukai, S.; Sakamoto, N.; Taniyama, D.; Harada, K.; Honma, R.; Maruyama, R.; Naka, K.; Hinoi, T.; Takakura, Y.; Shimizu, W.; et al. KHDRBS3 Promotes Multi-Drug Resistance and Anchorage-Independent Growth in Colorectal Cancer. Cancer Sci. 2021, 112, 1196–1208. [Google Scholar] [CrossRef]
- Uhlen, M.; Zhang, C.; Lee, S.; Sjöstedt, E.; Fagerberg, L.; Bidkhori, G.; Benfeitas, R.; Arif, M.; Liu, Z.; Edfors, F.; et al. A Pathology Atlas of the Human Cancer Transcriptome. Science 2017, 357, eaan2507. [Google Scholar] [CrossRef] [Green Version]
- Lulli, M.; Nencioni, D.; Papucci, L.; Schiavone, N. Zeta-Crystallin: A Moonlighting Player in Cancer. Cell. Mol. Life Sci. 2019, 77, 965–976. [Google Scholar] [CrossRef]
- Blotta, S.; Tassone, P.; Prabhala, R.H.; Tagliaferri, P.; Cervi, D.; Amin, S.; Jakubikova, J.; Tai, Y.T.; Podar, K.; Mitsiades, C.S.; et al. Identification of Novel Antigens with Induced Immune Response in Monoclonal Gammopathy of Undetermined Significance. Blood 2009, 114, 3276–3284. [Google Scholar] [CrossRef] [PubMed]
- Lu, Y.; Wang, W.; Wang, J.; Yang, C.; Mao, H.; Fu, X.; Wu, Y.; Cai, J.; Han, J.; Xu, Z.; et al. Overexpression of Arginine Transporter CAT-1 Is Associated with Accumulation of L-Arginine and Cell Growth in Human Colorectal Cancer Tissue. PLoS ONE 2013, 8, e73866. [Google Scholar] [CrossRef] [PubMed]
- Chen, Q.; Zhong, L.; Zhou, C.; Feng, Y.; Liu, Q.-X.; Zhou, D.; Lu, X.; Du, G.-S.; Jian, D.; Luo, H.; et al. Knockdown of Parkinson’s Disease-Related Gene ATP13A2 Reduces Tumorigenesis via Blocking Autophagic Flux in Colon Cancer. Cell Biosci. 2020, 10, 144. [Google Scholar] [CrossRef] [PubMed]
- Ueda, S.; Goto, M.; Hashimoto, K.; Imazawa, M.; Takahashi, M.; Oh-Iwa, I.; Shimozato, K.; Nagao, T.; Nomoto, S. Salivary CPLANE1 Levels as a Biomarker of Oral Squamous Cell Carcinoma. Anticancer Res. 2021, 41, 765–772. [Google Scholar] [CrossRef] [PubMed]
- Otto, F.; Schmid, P.; Mackensen, A.; Wehr, U.; Seiz, A.; Braun, M.; Galanos, C.; Mertelsmann, R.; Engelhardt, R. Phase II Trial of Intravenous Endotoxin in Patients with Colorectal and Non-Small Cell Lung Cancer. Eur. J. Cancer 1996, 32, 1712–1718. [Google Scholar] [CrossRef]
- Wiemann, B.; Starnes, C.O. Coley’s Toxins, Tumor Necrosis Factor and Cancer Research: A Historical Perspective. Pharmacol. Ther. 1994, 64, 529–564. [Google Scholar] [CrossRef]
- Rega, A.; Terlizzi, M.; Luciano, A.; Forte, G.; Crother, T.R.; Arra, C.; Arditi, M.; Pinto, A.; Sorrentino, R. Plasmacytoid Dendritic Cells Play a Key Role in Tumor Progression in Lipopolysaccharide-Stimulated Lung Tumor–Bearing Mice. J. Immunol. 2013, 190, 2391–2402. [Google Scholar] [CrossRef] [Green Version]
- Rakoff-Nahoum, S.; Medzhitov, R. Toll-like Receptors and Cancer. Nat. Rev. Cancer 2009, 9, 57–63. [Google Scholar] [CrossRef]
- Kaczanowska, S.; Joseph, A.M.; Davila, E. TLR Agonists: Our Best Frenemy in Cancer Immunotherapy. J. Leukoc. Biol. 2013, 93, 847. [Google Scholar] [CrossRef] [Green Version]
- Kawasaki, T.; Kawai, T. Toll-Like Receptor Signaling Pathways. Front. Immunol. 2014, 5, 461. [Google Scholar] [CrossRef] [Green Version]
- Arya, S.; Wiatrek-Moumoulidis, D.; Synowsky, S.A.; Shirran, S.L.; Botting, C.H.; Powis, S.J.; Stewart, A.J. Quantitative Proteomic Changes in LPS-Activated Monocyte-Derived Dendritic Cells: A SWATH-MS Study. Sci. Rep. 2019, 9, 4343. [Google Scholar] [CrossRef] [PubMed] [Green Version]
- Kristiansen, H.; Scherer, C.A.; McVean, M.; Iadonato, S.P.; Vends, S.; Thavachelvam, K.; Steffensen, T.B.; Horan, K.A.; Kuri, T.; Weber, F.; et al. Extracellular 2′-5′ Oligoadenylate Synthetase Stimulates RNase L-Independent Antiviral Activity: A Novel Mechanism of Virus-Induced Innate Immunity. J. Virol. 2010, 84, 11898. [Google Scholar] [CrossRef] [PubMed] [Green Version]
- Rysiecki, G.; Gewert, D.R.; Williams, B.R. Constitutive Expression of a 2′,5′-Oligoadenylate Synthetase CDNA Results in Increased Antiviral Activity and Growth Suppression. J. Interferon Res. 1989, 9, 649–657. [Google Scholar] [CrossRef] [PubMed]
- Schiffer, R.; Baron, J.; Dagtekin, G.; Jahnen-Dechent, W.; Zwadlo-Klarwasser, G. Differential Regulation of the Expression of Transporters Associated with Antigen Processing, TAP1 and TAP2, by Cytokines and Lipopolysaccharide in Primary Human Macrophages. Inflamm. Res. 2002, 51, 403–408. [Google Scholar] [CrossRef]
- Soutto, M.; Belkhiri, A.; Piazuelo, M.B.; Schneider, B.G.; Peng, D.F.; Jiang, A.; Washington, M.K.; Kokoye, Y.; Crowe, S.E.; Zaika, A.; et al. Loss of TFF1 Is Associated with Activation of NF-ΚB-Mediated Inflammation and Gastric Neoplasia in Mice and Humans. J. Clin. Investig. 2011, 121, 1753–1767. [Google Scholar] [CrossRef]
- Eletto, D.; Vllahu, M.; Mentucci, F.; Del Gaudio, P.; Petrella, A.; Porta, A.; Tosco, A. TFF1 Induces Aggregation and Reduces Motility of Helicobacter Pylori. Int. J. Mol. Sci. 2021, 22, 1851. [Google Scholar] [CrossRef] [PubMed]
- Jiang, Y.; Yu, Y. Transgenic and Gene Knockout Mice in Gastric Cancer Research. Oncotarget 2017, 8, 3696. [Google Scholar] [CrossRef] [Green Version]
- Obermayr, E.; Sanchez-Cabo, F.; Tea, M.K.M.; Singer, C.F.; Krainer, M.; Fischer, M.B.; Sehouli, J.; Reinthaller, A.; Horvat, R.; Heinze, G.; et al. Assessment of a Six Gene Panel for the Molecular Detection of Circulating Tumor Cells in the Blood of Female Cancer Patients. BMC Cancer 2010, 10, 666. [Google Scholar] [CrossRef] [Green Version]
- Tran, C.P.; Cook, G.A.; Yeomans, N.D.; Thim, L.; Giraud, A.S. Trefoil Peptide TFF2 (Spasmolytic Polypeptide) Potently Accelerates Healing and Reduces Inflammation in a Rat Model of Colitis. Gut 1999, 44, 636–642. [Google Scholar] [CrossRef] [Green Version]
- Lee, S.H.; Kim, H.P.; Kang, J.K.; Song, S.H.; Han, S.W.; Kim, T.Y. Identification of Diverse Adenosine-to-Inosine RNA Editing Subtypes in Colorectal Cancer. Cancer Res. Treat. 2017, 49, 1077–1087. [Google Scholar] [CrossRef] [Green Version]
- Soto, L.; Martín, A.I.; Millán, S.; Vara, E.; López-Calderón, A. Effects of Endotoxin Lipopolysaccharide Administration on the Somatotropic Axis. J. Endocrinol. 1998, 159, 239–246. [Google Scholar] [CrossRef] [PubMed] [Green Version]
- Allard, J.B.; Duan, C. IGF-Binding Proteins: Why Do They Exist and Why Are There So Many? Front. Endocrinol. 2018, 9, 117. [Google Scholar] [CrossRef] [PubMed] [Green Version]
- Fan, J.; Molina, P.E.; Gelato, M.C.; Lang, C.H. Differential Tissue Regulation of Insulin-like Growth Factor-I Content and Binding Proteins after Endotoxin. Endocrinology 1994, 134, 1685–1692. [Google Scholar] [CrossRef]
- Matsumoto, M.; Liu, J.; Iwata, K.; Ibi, M.; Asaoka, N.; Zhang, X.; Katsuyama, M.; Matsuda, M.; Nabe, T.; Schröder, K.; et al. NOX1/NADPH Oxidase Is Involved in the LPS-Induced Exacerbation of Collagen-Induced Arthritis. J. Pharmacol. Sci. 2021, 146, 88–97. [Google Scholar] [CrossRef] [PubMed]
- Lipinski, S.; Petersen, B.-S.; Barann, M.; Piecyk, A.; Tran, F.; Mayr, G.; Jentzsch, M.; Aden, K.; Stengel, S.T.; Klostermeier, U.C.; et al. Missense Variants in NOX1 and P22phox in a Case of Very-Early-Onset Inflammatory Bowel Disease Are Functionally Linked to NOD2. Cold Spring Harb. Mol. Case Stud. 2019, 5, a002428. [Google Scholar] [CrossRef]
- Chainy, G.B.N.; Sahoo, D.K. Hormones and Oxidative Stress: An Overview. Free. Radic. Res. 2020, 54, 1–26. [Google Scholar] [CrossRef]
- Sahoo, D.K.; Roy, A. Compromised Rat Testicular Antioxidant Defence System by Hypothyroidism before Puberty. Int. J. Endocrinol. 2012, 2012, 637825. [Google Scholar] [CrossRef] [Green Version]
- Bozinovski, S.; Seow, H.J.; Crack, P.J.; Anderson, G.P.; Vlahos, R. Glutathione Peroxidase-1 Primes Pro-Inflammatory Cytokine Production after LPS Challenge In Vivo. PLoS ONE 2012, 7, 33172. [Google Scholar] [CrossRef]
- Lubos, E.; Mahoney, C.E.; Leopold, J.A.; Zhang, Y.; Loscalzo, J.; Handy, D.E. Glutathione Peroxidase-1 Modulates Lipopolysaccharideinduced Adhesion Molecule Expression in Endothelial Cells by Altering CD14 Expression. FASEB J. 2010, 24, 2525–2532. [Google Scholar] [CrossRef] [Green Version]
- Lazzaro, M.; Bettegazzi, B.; Barbariga, M.; Codazzi, F.; Zacchetti, D.; Alessio, M. Ceruloplasmin Potentiates Nitric Oxide Synthase Activity and Cytokine Secretion in Activated Microglia. J. Neuroinflamm. 2014, 11, 164. [Google Scholar] [CrossRef] [Green Version]
- Lee, K.H.; Yun, S.J.; Nam, K.N.; Gho, Y.S.; Lee, E.H. Activation of Microglial Cells by Ceruloplasmin. Brain Res 2007, 1171, 1–8. [Google Scholar] [CrossRef] [PubMed]
- Liu, L.; Lan, S. Interference of S100A16 Suppresses Lipid Accumulation and Inflammation in High Glucose-Induced HK-2 Cells. Int. Urol. Nephrol. 2021, 53, 1255–1263. [Google Scholar] [CrossRef] [PubMed]
- Donato, R. S100: A Multigenic Family of Calcium-Modulated Proteins of the EF-Hand Type with Intracellular and Extracellular Functional Roles. Int. J. Biochem. Cell Biol. 2001, 33, 637–668. [Google Scholar] [CrossRef]
- Manolakis, A.C.; Kapsoritakis, A.N.; Tiaka, E.K.; Potamianos, S.P. Calprotectin, Calgranulin C, and Other Members of the S100 Protein Family in Inflammatory Bowel Disease. Dig. Dis. Sci. 2011, 56, 1601–1611. [Google Scholar] [CrossRef]
- Hanifeh, M.; Sankari, S.; Rajamäki, M.M.; Syrjä, P.; Kilpinen, S.; Suchodolski, J.S.; Heilmann, R.M.; Guadiano, P.; Lidbury, J.; Steiner, J.M.; et al. S100A12 Concentrations and Myeloperoxidase Activities Are Increased in the Intestinal Mucosa of Dogs with Chronic Enteropathies. BMC Vet. Res. 2018, 14, 125. [Google Scholar] [CrossRef] [PubMed]
- Xie, Z.; Askari, A. Na+/K+-ATPase as a Signal Transducer. Eur. J. Biochem. 2002, 269, 2434–2439. [Google Scholar] [CrossRef] [PubMed] [Green Version]
- Messer, J.S.; Liechty, E.R.; Vogel, O.A.; Chang, E.B. Evolutionary and Ecological Forces That Shape the Bacterial Communities of the Human Gut. Mucosal Immunol. 2017, 10, 567–579. [Google Scholar] [CrossRef] [Green Version]
- Hillman, E.T.; Lu, H.; Yao, T.; Nakatsu, C.H. Microbial Ecology along the Gastrointestinal Tract. Microbes Environ. 2017, 32, 300. [Google Scholar] [CrossRef] [Green Version]
- Swiader, A.; Nahapetyan, H.; Faccini, J.; D’Angelo, R.; Mucher, E.; Elbaz, M.; Boya, P.; Vindis, C. Mitophagy Acts as a Safeguard Mechanism against Human Vascular Smooth Muscle Cell Apoptosis Induced by Atherogenic Lipids. Oncotarget 2016, 7, 28821–28835. [Google Scholar] [CrossRef] [Green Version]
- Luo, X.; Cai, S.; Li, Y.; Li, G.; Cao, Y.; Ai, C.; Gao, Y.; Li, T. Drp-1 as Potential Therapeutic Target for Lipopolysaccharide-Induced Vascular Hyperpermeability. Oxid. Med. Cell. Longev. 2020, 2020, 5820245. [Google Scholar] [CrossRef]
- Marchione, R.; Leibovitch, S.A.; Lenormand, J.-L. The Translational Factor EIF3f: The Ambivalent EIF3 Subunit. Cell. Mol. Life Sci. 2013, 70, 3603. [Google Scholar] [CrossRef] [PubMed] [Green Version]
- Yin, Y.; Long, J.; Sun, Y.; Li, H.; Jiang, E.; Zeng, C.; Zhu, W. The Function and Clinical Significance of EIF3 in Cancer. Gene 2018, 673, 130–133. [Google Scholar] [CrossRef] [PubMed]
- Peng, B.; Gu, Y.; Xiong, Y.; Zheng, G.; He, Z. Microarray-Assisted Pathway Analysis Identifies MT1X & NFκB as Mediators of TCRP1-Associated Resistance to Cisplatin in Oral Squamous Cell Carcinoma. PLoS ONE 2012, 7, e51413. [Google Scholar] [CrossRef] [Green Version]
- De Arras, L.; Seng, A.; Lackford, B.; Keikhaee, M.R.; Bowerman, B.; Freedman, J.H.; Schwartz, D.A.; Alper, S. An Evolutionarily Conserved Innate Immunity Protein Interaction Network. J. Biol. Chem. 2013, 288, 1967–1978. [Google Scholar] [CrossRef] [PubMed] [Green Version]
- Zhang, L.; Zhou, R.; Zhang, W.; Yao, X.; Li, W.; Xu, L.; Sun, X.; Zhao, L. Cysteine-Rich Intestinal Protein 1 Suppresses Apoptosis and Chemosensitivity to 5-Fluorouracil in Colorectal Cancer through Ubiquitin-Mediated Fas Degradation. J. Exp. Clin. Cancer Res. 2019, 38, 120. [Google Scholar] [CrossRef]
- Hallquist, N.A.; Khoo, C.; Cousins, R.J. Lipopolysaccharide Regulates Cysteine-Rich Intestinal Protein, a Zinc-Finger Protein, in Immune Cells and Plasma. J. Leukoc. Biol. 1996, 59, 172–177. [Google Scholar] [CrossRef]
- Foo, S.L.; Yap, G.; Cui, J.; Lim, L.H.K. Annexin-A1—A Blessing or a Curse in Cancer? Trends Mol. Med. 2019, 25, 315–327. [Google Scholar] [CrossRef]
- Damazo, A.S.; Yona, S.; D’Acquisto, F.; Flower, R.J.; Oliani, S.M.; Perretti, M. Critical Protective Role for Annexin 1 Gene Expression in the Endotoxemic Murine Microcirculation. Am. J. Pathol. 2005, 166, 1607–1617. [Google Scholar] [CrossRef] [Green Version]
- Scicluna, B.P.; van ’t Veer, C.; Nieuwdorp, M.; Felsmann, K.; Wlotzka, B.; Stroes, E.S.G.; Poll, T. van der Role of Tumor Necrosis Factor-α in the Human Systemic Endotoxin-Induced Transcriptome. PLoS ONE 2013, 8, e79051. [Google Scholar] [CrossRef] [Green Version]
- Jin, Y.; Kim, H.P.; Ifedigbo, E.; Lau, L.F.; Choi, A.M.K. Cyr61 Protects against Hyperoxia-Induced Cell Death via Akt Pathway in Pulmonary Epithelial Cells. Am. J. Respir. Cell Mol. Biol. 2005, 33, 297–302. [Google Scholar] [CrossRef]
- Chen, W.; Syldath, U.; Bellmann, K.; Burkart, V.; Kolb, H. Human 60-KDa Heat-Shock Protein: A Danger Signal to the Innate Immune System. J. Immunol. 1999, 162, 3212–3219. [Google Scholar] [PubMed]
- Linder, A.; Hagberg Thulin, M.; Damber, J.E.; Welén, K. Analysis of Regulator of G-Protein Signalling 2 (RGS2) Expression and Function during Prostate Cancer Progression. Sci. Rep. 2018, 8, 17259. [Google Scholar] [CrossRef] [PubMed] [Green Version]
- Panetta, R.; Guo, Y.; Magder, S.; Greenwood, M.T. Regulators of G-Protein Signaling (RGS) 1 and 16 Are Induced in Response to Bacterial Lipopolysaccharide and Stimulate c-Fos Promoter Expression. Biochem. Biophys. Res. Commun. 1999, 259, 550–556. [Google Scholar] [CrossRef]
- Kriaa, A.; Mariaule, V.; Jablaoui, A.; Rhimi, S.; Mkaouar, H.; Hernandez, J.; Korkmaz, B.; Lesner, A.; Maguin, E.; Aghdassi, A.; et al. Bile Acids: Key Players in Inflammatory Bowel Diseases? Cells 2022, 11, 901. [Google Scholar] [CrossRef] [PubMed]
- Shulpekova, Y.; Shirokova, E.; Zharkova, M.; Tkachenko, P.; Tikhonov, I.; Stepanov, A.; Sinitsyna, A.; Izotov, A.; Butkova, T.; Shulpekova, N.; et al. A Recent Ten-Year Perspective: Bile Acid Metabolism and Signaling. Molecules 2022, 27, 1983. [Google Scholar] [CrossRef] [PubMed]
- Yamashita, M.; Wada, H.; Eguchi, H.; Ogawa, H.; Yamada, D.; Noda, T.; Asaoka, T.; Kawamoto, K.; Gotoh, K.; Umeshita, K.; et al. A CD13 Inhibitor, Ubenimex, Synergistically Enhances the Effects of Anticancer Drugs in Hepatocellular Carcinoma. Int. J. Oncol. 2016, 49, 89–98. [Google Scholar] [CrossRef] [Green Version]
- Hashida, H.; Takabayashi, A.; Kanai, M.; Adachi, M.; Kondo, K.; Kohno, N.; Yamaoka, Y.; Miyake, M. Aminopeptidase N Is Involved in Cell Motility and Angiogenesis: Its Clinical Significance in Human Colon Cancer. Gastroenterology 2002, 122, 376–386. [Google Scholar] [CrossRef]
- Lu, C.; Amin, M.A.; Fox, D.A. CD13/Aminopeptidase N Is a Potential Therapeutic Target for Inflammatory Disorders. J. Immunol. 2020, 204, 3–11. [Google Scholar] [CrossRef]
- Garg, M.; Royce, S.G.; Tikellis, C.; Shallue, C.; Batu, D.; Velkoska, E.; Burrell, L.M.; Patel, S.K.; Beswick, L.; Jackson, A.; et al. Imbalance of the Renin–Angiotensin System May Contribute to Inflammation and Fibrosis in IBD: A Novel Therapeutic Target? Gut 2020, 69, 841–851. [Google Scholar] [CrossRef]
- Chen, C.; Zhou, Y.; Wang, H.; Alam, A.; Kang, S.S.; Ahn, E.H.; Liu, X.; Jia, J.; Ye, K. Gut Inflammation Triggers C/EBPβ/δ-Secretase-Dependent Gut-to-Brain Propagation of Aβ and Tau Fibrils in Alzheimer’s Disease. EMBO J. 2021, 40, e106320. [Google Scholar] [CrossRef]
- Wang, H.; Chen, Z.; Wang, S.; Gao, X.; Qian, M.; Qiu, W.; Zhang, Z.; Zhang, S.; Qi, Y.; Sun, X.; et al. TGFβ1-induced Beta-site APP-cleaving Enzyme 2 Upregulation Promotes Tumorigenesis through the NF-κB Signalling Pathway in Human Gliomas. Mol. Oncol. 2020, 14, 407. [Google Scholar] [CrossRef] [PubMed]
- Klaus, C.; Jeon, M.K.; Kaemmerer, E.; Gassler, N. Intestinal Acyl-CoA Synthetase 5: Activation of Long Chain Fatty Acids and Behind. World J. Gastroenterol. 2013, 19, 7369. [Google Scholar] [CrossRef] [PubMed]
- Geng, C.; Guo, Y.; Wang, C.; Cui, C.; Han, W.; Liao, D.; Jiang, P. Comprehensive Evaluation of Lipopolysaccharide-Induced Changes in Rats Based on Metabolomics. J. Inflamm. Res. 2020, 13, 477–486. [Google Scholar] [CrossRef]
- Waggoner, J.W.; Löest, C.A.; Turner, J.L.; Mathis, C.P.; Hallford, D.M. Effects of Dietary Protein and Bacterial Lipopolysaccharide Infusion on Nitrogen Metabolism and Hormonal Responses of Growing Beef Steers. J. Anim. Sci. 2009, 87, 3656–3668. [Google Scholar] [CrossRef] [PubMed]
- Verma, N.; Ahuja, V.; Paul, J. Profiling of ABC Transporters during Active Ulcerative Colitis and in Vitro Effect of Inflammatory Modulators. Dig. Dis. Sci. 2013, 58, 2282–2292. [Google Scholar] [CrossRef] [PubMed]
- Wang, B.; Wu, L.; Chen, J.; Dong, L.; Chen, C.; Wen, Z.; Hu, J.; Fleming, I.; Wang, D.W. Metabolism Pathways of Arachidonic Acids: Mechanisms and Potential Therapeutic Targets. Signal Transduct. Target. Ther. 2021, 6, 94. [Google Scholar] [CrossRef] [PubMed]
- Hanna, V.S.; Hafez, E.A.A. Synopsis of Arachidonic Acid Metabolism: A Review. J. Adv. Res. 2018, 11, 23. [Google Scholar] [CrossRef]
- Mak, T.W.; Grusdat, M.; Duncan, G.S.; Dostert, C.; Nonnenmacher, Y.; Cox, M.; Binsfeld, C.; Hao, Z.; Brüstle, A.; Itsumi, M.; et al. Glutathione Primes T Cell Metabolism for Inflammation. Immunity 2017, 46, 675–689. [Google Scholar] [CrossRef] [Green Version]
- Modrick, M.L.; Didion, S.P.; Lynch, C.M.; Dayal, S.; Lentz, S.R.; Faraci, F.M. Role of Hydrogen Peroxide and the Impact of Glutathione Peroxidase-1 in Regulation of Cerebral Vascular Tone. J. Cereb. Blood Flow Metab. 2009, 29, 1130. [Google Scholar] [CrossRef]
- Sahoo, D.K.; Jena, S.; Chainy, G.B.N. Thyroid Dysfunction and Testicular Redox Status: An Intriguing Association. In Book Oxidants, Antioxidants, and Impact of the Oxidative Status in Male Reproduction, 1st ed.; Elsevier: Amsterdam, The Netherlands, 2018; ISBN 9780128125014. [Google Scholar]
- Sahoo, D.K.; Roy, A.; Chainy, G.B.N. Protective Effects of Vitamin E and Curcumin on L-Thyroxine-Induced Rat Testicular Oxidative Stress. Chem. Biol. Interact. 2008, 176, 121–128. [Google Scholar] [CrossRef]
- Chattopadhyay, S.; Sahoo, D.K.; Roy, A.; Samanta, L.; Chainy, G.B.N. Thiol Redox Status Critically Influences Mitochondrial Response to Thyroid Hormone-Induced Hepatic Oxidative Injury: A Temporal Analysis. Cell Biochem. Funct. 2010, 28, 126–134. [Google Scholar] [CrossRef] [PubMed]
- Sahoo, D.K.; Roy, A.; Chattopadhyay, S.; Chainy, G.B.N. Effect of T3 Treatment on Glutathione Redox Pool and Its Metabolizing Enzymes in Mitochondrial and Post-Mitochondrial Fractions of Adult Rat Testes. Indian J. Exp. Biol. 2007, 45, 338–346. [Google Scholar] [PubMed]
- Sahoo, D.K.; Chainy, G.B.N. Tissue Specific Response of Antioxidant Defence Systems of Rat to Experimentally-Induced Hyperthyroidism. Natl. Acad. Sci. Lett. 2007, 30, 247–250. [Google Scholar]
- Chattopadhyay, S.; Sahoo, D.K.; Subudhi, U.; Chainy, G.B.N. Differential Expression Profiles of Antioxidant Enzymes and Glutathione Redox Status in Hyperthyroid Rats: A Temporal Analysis. Comp. Biochem. Physiol. C Toxicol. Pharmacol. 2007, 146, 383–391. [Google Scholar] [CrossRef] [PubMed]
- Sahoo, D.K.; Roy, A.; Chainy, G.B.N. PTU-Induced Neonatal Hypothyroidism Modulates Antioxidative Status and Population of Rat Testicular Germ Cells. Natl. Acad. Sci. Lett. 2006, 29, 133–135. [Google Scholar]
- Sahoo, D.K.; Roy, A.; Chainy, G.B.N. Rat Testicular Mitochondrial Antioxidant Defence System and Its Modulation by Aging. Acta Biol. Hung. 2008, 59, 413–424. [Google Scholar] [CrossRef]
- Sahoo, D.K.; Roy, A.; Bhanja, S.; Chainy, G.B.N. Hypothyroidism Impairs Antioxidant Defence System and Testicular Physiology during Development and Maturation. Gen. Comp. Endocrinol. 2008, 156, 63–70. [Google Scholar] [CrossRef]
- Tabbaa, M.; Golubic, M.; Roizen, M.F.; Bernstein, A.M. Docosahexaenoic Acid, Inflammation, and Bacterial Dysbiosis in Relation to Periodontal Disease, Inflammatory Bowel Disease, and the Metabolic Syndrome. Nutrients 2013, 5, 3299. [Google Scholar] [CrossRef] [PubMed] [Green Version]
- di Cara, F.; Andreoletti, P.; Trompier, D.; Vejux, A.; Bülow, M.H.; Sellin, J.; Lizard, G.; Cherkaoui-Malki, M.; Savary, S. Peroxisomes in Immune Response and Inflammation. Int. J. Mol. Sci. 2019, 20, 3877. [Google Scholar] [CrossRef] [Green Version]
- Kim, J.A. Peroxisome Metabolism in Cancer. Cells 2020, 9, 1692. [Google Scholar] [CrossRef]
- Koike, H.; Iwasawa, K.; Ouchi, R.; Maezawa, M.; Giesbrecht, K.; Saiki, N.; Ferguson, A.; Kimura, M.; Thompson, W.L.; Wells, J.M.; et al. Modelling Human Hepato-Biliary-Pancreatic Organogenesis from the Foregut-Midgut Boundary. Nature 2019, 574, 112–116. [Google Scholar] [CrossRef] [PubMed]
- Sahoo, D.K.; Mosichuk, A.P.; Lucien, F.; Frank, I.; Cheville, J.C.; Allenspach, K.; Mochel, J.P. Abstract 3092: Urine-Derived Urinary Carcinoma Organoids: A Novel Tool for Providing New Insights into Human and Canine Bladder Cancer Treatment. Cancer Res. 2022, 82, 3092. [Google Scholar] [CrossRef]


| Complete Chelating Solution (CCS) | ||
| Composition | Concentration | Supplier |
| Na2HPO4-2H2O | 0.996 mg/mL | Sigma |
| KH2PO4 | 1.08 mg/mL | Sigma |
| NaCl | 5.6 mg/mL | Fisher Chemical |
| KCl | 0.12 mg/mL | Fisher Chemical |
| Sucrose | 15 mg/mL | Fisher Chemical |
| D-Sorbitol | 10 mg/mL | Fisher Chemical |
| Dithiothreitol (DTT) | 520 μM | Promega |
| Pen Strep | Penicillin: 196 units/mL; Streptomycin: 196 μg/mL | Gibco |
| Incomplete Media without an ISC Growth Factor (IMGF-) | ||
| Composition | Concentration | Supplier |
| Advanced DMEM/F12 | Base Media | Gibco |
| FBS | 8% | Corning |
| GlutaMAX™ Supplement (200 mM L-alanyl-L-glutamine dipeptide in 0.85% NaCl) | 2 mM | Gibco |
| HEPES | 10 mM | VWR Life Science |
| Primocin | 100 µg/mL | InvivoGen |
| Complete Media with ISC Growth Factors (CMGF+) | ||
| Composition | Concentration | Supplier |
| Advanced DMEM/F12 | Base Media | Gibco |
| FBS | 8% | Corning |
| GlutaMAX™ Supplement (200 mM L-alanyl-L-glutamine dipeptide in 0.85% NaCl) | 2 mM | Gibco |
| HEPES | 10 mM | VWR Life Science |
| Primocin | 100 µg/mL | InvivoGen |
| B27 Supplement | 1x | Gibco |
| N2 Supplement | 1x | Gibco |
| N-Acetyl-L-cysteine | 1 mM | Sigma |
| Murine EGF | 50 ng/mL | PeproTech |
| Murine Noggin | 100 ng/mL | PeproTech |
| Human R-Spondin-1 | 500 ng/mL | PeproTech |
| Murine Wnt-3a | 100 ng/mL | PeproTech |
| [Leu15]-Gastrin I human | 10 nM | Sigma |
| Nicotinamide | 10 mM | Sigma |
| TGF beta 1 Recombinant Protein | 500 nM | ProSci |
| SB202190 (P38 inhibitor) | 10 µM | Sigma |
| TMS (trimethoprim sulfate) | 10 µg/mL | Sigma |
| * ROCK inhibitor (Y-27632) | 10 µM | EMD Millipore Corp. |
| * Aminopyrimidine CHIR99021 (GSK3β inhibitor) | 2.5 µM | Reprocell |
| Description of the Sample | Sample Designation |
|---|---|
| Control enteroids from the MC tumor environment (9 biological replicates (wells) pooled together) | Sample-1 |
| LPS treated enteroids from the MC tumor environment (9 biological replicates (wells) pooled together) | Sample-2 |
| Control enteroids from IBD dogs (9 biological replicates (wells) pooled together) | Sample-3 |
| LPS treated enteroids from IBD dogs (9 biological replicates (wells) pooled together) | Sample-4 |
| Control colonoids from IBD dogs (9 biological replicates (wells) pooled together) | Sample-5 |
| LPS treated colonoids from IBD dogs (9 biological replicates (wells) pooled together) | Sample-6 |
| Serial No | Group Comparison | Total Number of Differentially Expressed Genes | Upregulated Genes (%) | Downregulated Genes (%) |
|---|---|---|---|---|
| 1 (2–1) | LPS treated tumor enteroids vs. Control tumor enteroids | 677 | 56 | 44 |
| 2 (4–3) | LPS treated IBD enteroids vs. Control IBD enteroids | 639 | 49 | 51 |
| 3 (6–5) | LPS treated IBD colonoids vs. Control IBD colonoids | 684 | 48 | 52 |
| 4 (5–3) | Control IBD colonoids vs. Control IBD enteroids | 411 | 44 | 56 |
| 5 (3–1) | Control IBD enteroids vs. Control tumor enteroids | 376 | 49 | 51 |
| 6 (6–4) | LPS treated IBD colonoids vs. LPS treated IBD enteroids | 421 | 39 | 61 |
| 7 (4–2) | LPS treated IBD enteroids vs. LPS treated tumor enteroids | 314 | 51 | 49 |
| Details for Top Upregulated and Downregulated DEGs | ||
| Gene Description | Gene Symbol | Probe Set ID |
| KH domain-containing, RNA-binding, signal transduction-associated protein 3 | KHDRBS3 | CfaAffx.2644.1.S1_at |
| Flap endonuclease GEN homolog 1 | GEN1 | CfaAffx.6562.1.S1_at |
| Krev interaction trapped protein 1 | KRIT1 | CfaAffx.3865.1.S1_s_at |
| Centromere protein F | CENPF | CfaAffx.19540.1.S1_at |
| Ciliogenesis and planar polarity effector complex subunit 1 | CPLANE1 | Cfa.1768.1.A1_at |
| Tyrosine-protein kinase STYK1 | STYK1 | CfaAffx.20747.1.S1_s_at |
| Quinone oxidoreductase-like protein 2/Crystallin Zeta Like 2 | LOC610994 | Cfa.3282.1.S1_s_at |
| G patch domain-containing protein 4 isoform X1 | Gpatch4 | CfaAffx.25660.1.S1_at |
| High affinity cationic amino acid transporter 1 | SLC7A1 (CAT-1) | CfaAffx.10937.1.S1_at |
| Cation-transporting ATPase 13A2 | ATP13A2 | CfaAffx.24286.1.S1_at |
| Testis expressed 45 | TEX45 | CfaAffx.27913.1.S1_at |
| Gene Ontology (GO) Analysis of 11 DEGs (Annotated for Biological Process) | ||
| GO-Terms | Number of Genes | Genes |
| Cellular metabolic process and regulation, organic substance metabolic process, nitrogen compound metabolic process (18%) | 5 | CENPF, GEN1, STYK1, KHDRBS3, ATP13A2 |
| Regulation of metabolic process (11%) | 3 | CENPF, KHDRBS3, ATP13A2 |
| Establishment of localization (11%) | 3 | CENPF, ATP13A2, SLC7A1/CAT-1 |
| Macromolecule localization, cellular localization (7%) | 2 | CENPF, ATP13A2 |
| Regulation of molecular function, cellular homeostasis, regulation of biological quality (7%) | 2 | KRIT1, ATP13A2 |
| Biosynthetic process, cell cycle process, negative regulation of cellular process, chromosome segregation (7%) | 2 | CENPF, GEN1 |
| Positive regulation of cellular process, cellular response to stimulus, cellular component organization or biogenesis, response to stress (7%) | 2 | GEN1, ATP13A2 |
| Anatomical structure development, regulation of developmental process, multicellular organism development (7%) | 2 | CENPF, KRIT1 |
| Transmembrane transport (7%) | 2 | ATP13A2, SLC7A1/CAT-1 |
| Positive regulation of transport, export from cell, response to chemical, regulation of localization, catabolic process, process utilizing autophagic mechanism, positive regulation of metabolic process, positive regulation of establishment of protein localization, vesicle-mediated transport (4%) | 1 | ATP13A2 |
| Negative regulation of metabolic process (4%) | 1 | CENPF |
| Cell cycle checkpoint, microtubule-based process (4%) | 1 | GEN1 |
| Anatomical structure formation involved in morphogenesis, Negative regulation of developmental process, regulation of multicellular organismal process, establishment or maintenance of cell polarity, negative regulation of multicellular organismal process, anatomical structure morphogenesis (4%) | 1 | KRIT1 |
| Oxidation-reduction process (4%) | 1 | LOC610994 |
| Gene Ontology (GO) Analysis of 11 DEGs (Annotated for Molecular Function) | ||
| GO-Terms | Number of Genes | Genes |
| Identical protein binding (14%) | 3 | CENPF, GEN1, KHDRBS3 |
| Nucleic acid binding (14%) | 3 | Gpatch4, GEN1, KHDRBS3 |
| Nucleoside phosphate binding, anion binding, ribonucleotide binding (10%) | 2 | STYK1, ATP13A2 |
| Protein dimerization activity (10%) | 2 | CENPF, GEN1 |
| Cation binding (10%) | 2 | GEN1, ATP13A2 |
| Nucleotide binding (10%) | 2 | STYK1, ATP13A2 |
| Inorganic molecular entity transmembrane transporter activity (5%) | 1 | SLC7A1 (CAT-1) |
| Protein kinase activity, transferase activity, transferring phosphorus-containing groups (5%) | 1 | STYK1 |
| Transcription factor binding, protein C-terminus binding, dynein complex binding, cytoskeletal protein binding (5%) | 1 | CENPF |
| Phospholipid binding, hydrolase activity, acting on acid anhydrides (5%) | 1 | ATP13A2 |
| Hydrolase activity, acting on ester bonds, deoxyribonuclease activity (5%) | 1 | GEN1 |
| Protein domain specific binding (5%) | 1 | KHDRBS3 |
| Ion transmembrane transporter activity (5%) | 1 | SLC7A1 (CAT-1) |
| Gene Ontology (GO) Analysis of 11 DEGs (Annotated for Cellular Component) | ||
| GO-Terms | Number of Genes | Genes |
| Intracellular organelle (17%) | 5 | CENPF, GEN1, KRIT1, KHDRBS3, ATP13A2 |
| Intracellular non-membrane-bounded organelle (10%) | 3 | CENPF, GEN1, KRIT1 |
| Membrane-bounded organelle (10%) | 3 | CENPF, KHDRBS3, ATP13A2 |
| Integral component of membrane (10%) | 3 | STYK1, ATP13A2, SLC7A1 (CAT-1) |
| Non-membrane-bounded organelle (10%) | 3 | CENPF, GEN1, KRIT1 |
| Intracellular organelle lumen (7%) | 2 | CENPF, KHDRBS3 |
| Centrosome (7%) | 2 | CENPF, GEN1 |
| Plasma membrane bounded cell projection (7%) | 2 | CENPF, ATP13A2 |
| Organelle lumen (7%) | 2 | CENPF, KHDRBS3 |
| Plasma membrane (7%) | 2 | STYK1, SLC7A1 (CAT-1) |
| Intrinsic component of organelle membrane, endosome, organelle membrane, intracellular vesicle, vacuole, neuronal cell body, cytoplasmic vesicle, transport vesicle (3%) | 1 | ATP13A2 |
| Cilium, ciliary basal body, cytoplasmic region, organelle envelope, kinetochore, chromosome, centromeric region, nuclear envelope (3%) | 1 | CENPF |
| Details for Top Upregulated and Downregulated DEGs | ||
| Gene Description | Gene Symbol | Probe Set ID |
| DENN domain containing 5B | DENND5B | Cfa.19506.1.S1_at |
| Serine/threonine/tyrosine-interacting-like protein 1 | STYXL1 | Cfa.17400.1.S1_s_at |
| Regenerating islet-derived protein 3-gamma-like | REG3G | Cfa.1742.1.S1_at |
| Protein S100-A16 | S100A16 | Cfa.18759.2.S1_at |
| Protein FAM122B | FAM122B | CfaAffx.28830.1.S1_s_at |
| Centrosomal protein of 70 kda | CEP70 | Cfa.20146.1.S1_s_at |
| Beta-1,4-mannosyl-glycoprotein 4-beta-N-acetylglucosaminyltransferase | MGAT3 | Cfa.9863.1.A1_at |
| Mucin 1 | MUC1 | CfaAffx.26061.1.S1_at |
| Gene Ontology (GO) Analysis of DEGs (Annotated for Biological Process) | ||
| GO-Terms | Genes | |
| Organonitrogen compound metabolic process (25%) | STYXL1 | |
| Microtubule cytoskeleton organization, Regulation of microtubule-based process (25%) | CEP70 | |
| Cellular component biogenesis/organization and regulation (25%) | CEP70 | |
| Phosphorus/cellular macromolecule/protein metabolic process (25%) | STYXL1 | |
| Gene Ontology (GO) Analysis of DEGs (Annotated for Molecular Function) | ||
| GO-Terms | Genes | |
| Phosphoprotein phosphatase activity (25%) | STYXL1 | |
| Identical protein binding, cytoskeletal protein binding (25%) | CEP70 | |
| Hydrolase activity, acting on ester bonds (25%) | STYXL1 | |
| Cation binding (25%) | S100A16 | |
| Gene Ontology (GO) Analysis of DEGs (Annotated for Cellular Component) | ||
| GO-Terms | Genes | |
| Intracellular organelle (29%) | MUC1, CEP70 | |
| Non-membrane-bounded organelle (14%) | CEP70 | |
| Intracellular non-membrane-bounded organelle (14%) | CEP70 | |
| Centrosome (14%) | CEP70 | |
| Membrane/intrinsic component of membrane, cytoplasm (14%) | MUC1 | |
| Cell periphery/apical part of cell (14%) | MUC1 | |
| Details for Upregulated and Downregulated DEGs | ||
| Gene Description | Gene Symbol | Probe Set ID |
| Collagenase 3 | MMP13 | CfaAffx.23153.1.S1_at |
| Dual oxidase maturation factor 2 | DUOXA2 | CfaAffx.21162.1.S1_at |
| Ceruloplasmin | CP | CfaAffx.13209.1.S1_s_at |
| UMP-CMP kinase 2, mitochondrial | CMPK2 | Cfa.19154.1.S1_a_at |
| Thrombospondin-4 | THBS4 | CfaAffx.14209.1.S1_s_at |
| Interleukin-8 | CXCL8 | Cfa.3510.1.S1_s_at |
| abl Interactor 2 | ABI2 | Cfa.1679.1.A1_at |
| Ubiquitin-conjugating enzyme E2 E3 | UBE2E3 | CfaAffx.805.1.S1_s_at |
| Echinoderm microtubule-associated protein-like 2 | EML2 | Cfa.9105.1.A1_s_at |
| Extracellular sulfatase Sulf-2-like | SULF2 | Cfa.6393.1.A1_at |
| Ectonucleotide pyrophosphatase/phosphodiesterase family member 6 | ENPP6 | Cfa.6996.1.A1_at |
| Gene Ontology (GO) Analysis of DEGs (Annotated for Biological Process) | ||
| GO-Terms | Genes | |
| Primary metabolic process, organic substance/nitrogen compound metabolic process (14%) | CMPK2, ENPP6, MMP13 | |
| Cellular metabolic process (9%) | CMPK2, MMP13 | |
| Establishment of localization (9%) | DUOXA2, CP | |
| Catabolic process (9%) | ENPP6, MMP13 | |
| Biosynthetic process, small molecule metabolic process (5%) | CMPK2 | |
| Regulation of biological quality, cellular homeostasis, oxidation-reduction process (5%) | CP | |
| Taxis (5%) | CXCL8 | |
| Movement of cell or subcellular component, cell motility (5%) | CXCL8 | |
| Localization of cell, cell activation (5%) | CXCL8 | |
| Cell communication, signal transduction, response to chemical/external stimulus, cellular response to stimulus, immune response (5%) | CXCL8 | |
| Leukocyte activation/migration (5%) | CXCL8 | |
| Regulation of cellular process, response to stress (5%) | CXCL8 | |
| Macromolecule localization (5%) | DUOXA2 | |
| Developmental growth, ossification, collagen metabolic process (5%) | MMP13 | |
| Cellular component organization or biogenesis (5%) | MMP13 | |
| Multicellular organism development, anatomical structure development/morphogenesis/organ growth, biomineral tissue development (5%) | MMP13 | |
| Cell adhesion (5%) | THBS4 | |
| Gene Ontology (GO) Analysis of DEGs (Annotated for Molecular Function) | ||
| GO-Terms | Genes | |
| Metal ion binding (19%) | THBS4, CP, MMP13 | |
| Phosphotransferase activity, phosphate group as acceptor (6%) | CMPK2 | |
| Purine ribonucleoside triphosphate binding (6%) | UBE2E3 | |
| Metallopeptidase activity (6%) | MMP13 | |
| G protein-coupled receptor binding (6%) | CXCL8 | |
| Endopeptidase activity (6%) | MMP13 | |
| Receptor ligand activity (6%) | CXCL8 | |
| Cytokine receptor binding (6%) | CXCL8 | |
| Purine nucleotide binding (6%) | UBE2E3 | |
| Phosphoric ester hydrolase activity (6%) | ENPP6 | |
| Purine ribonucleotide binding (6%) | UBE2E3 | |
| Sulfuric ester hydrolase activity (6%) | SULF2 | |
| Kinase activity (6%) | CMPK2 | |
| Oxidoreductase activity, oxidizing metal ions, oxygen as acceptor (6%) | CP | |
| Gene Ontology (GO) Analysis of DEGs (Annotated for Cellular Component) | ||
| GO-Terms | Genes | |
| Extracellular region (28%) | CXCL8, THBS4, ENPP6, CP, MMP13 | |
| Membrane (17%) | EML2, DUOXA2, ENPP6 | |
| Extracellular space (11%) | CXCL8, CP | |
| Intrinsic component of membrane (11%) | EML2, DUOXA2 | |
| Cytoplasm (6%) | DUOXA2 | |
| Intracellular anatomical structure (6%) | DUOXA2 | |
| Organelle, organelle subcompartment (6%) | DUOXA2 | |
| Cell periphery (6%) | ENPP6 | |
| Extracellular matrix (6%) | MMP13 | |
| Endomembrane system (6%) | DUOXA2 | |
| Details about DEGs in Control IBD Colonoids vs. Control IBD Enteroids | ||
| Gene Description | Gene Symbol | Probe Set ID |
| Sulfotransferase family 1C member 3 | SULT1C3 | CfaAffx.4011.1.S1_at |
| Osteopontin | SPP1 | Cfa.9240.1.S1_at |
| Carbonic anhydrase 1 | CA1 | Cfa.6413.1.A1_at/CfaAffx.13785.1.S1_at |
| Protein S100-A16 | S100A16 | Cfa.18759.2.S1_at |
| Phospholipase C epsilon 1 | PLCE1 | Cfa.12506.3.S1_at |
| Cell adhesion molecule 1 | CADM1 | Cfa.11274.1.A1_at/Cfa.10739.1.A1_s_at |
| Mucin-1 | MUC1 | CfaAffx.26061.1.S1_at/Cfa.7074.1.A1_at |
| WAP four-disulfide core domain protein 2 | WFDC2 | CfaAffx.15227.1.S1_s_at |
| beta-Secretase 2 | BACE2 | Cfa.20396.1.S1_at |
| Glioma pathogenesis-related protein 1 | GLIPR1 | Cfa.5134.1.A1_s_at |
| ENSCAFT00000022799 XM_014110988.1 PREDICTED: Canis lupus familiaris fibronectin 1 | FN1 | CfaAffx.22155.1.S1_s_at |
| RNA-binding motif, single-stranded-interacting protein 1 isoform X3 | RBMS1 | Cfa.5781.1.A1_s_at |
| WAP four-disulfide core domain protein 2 | WFDC2 | Cfa.3780.1.S1_at |
| Peripheral myelin protein 22 | PMP22 | CfaAffx.27421.1.S1_at |
| Interferon alpha-inducible protein 6 | IFI6 | Cfa.20456.1.S1_s_at |
| KH domain-containing, RNA-binding, signal transduction-associated protein 3 | KHDRBS3 | Cfa.334.1.A1_s_at |
| Protein FAM3B | FAM3B | Cfa.12168.1.A1_s_at |
| Transmembrane and immunoglobulin domain-containing protein 1 | TMIGD1 | CfaAffx.29036.1.S1_at |
| Bile acid-CoA:amino acid N-acyltransferase-like | BAAT | CfaAffx.4748.1.S1_at |
| Annexin A13 | ANXA13 | Cfa.3796.1.A1_s_at |
| Aminopeptidase N | ANPEP | Cfa.3774.1.A1_s_at, Cfa.20798.1.S1_at |
| Apolipoprotein A-IV | APOA4 | Cfa.6294.1.A1_at |
| Gene Ontology (GO) Analysis of DEGs (Annotated for Biological Process) | ||
| GO-Terms | Genes | |
| Cellular metabolic process (7%) | CA1, ANPEP, PLCE1, BAAT, APOA4, WFDC2 | |
| Regulation of cellular process (6%) | ANXA13, ANPEP, TMIGD1, APOA4, WFDC2 | |
| Primary metabolic process, organic substance/nitrogen compound metabolic process (6%) | ANPEP, BAAT, APOA4, BACE2, WFDC2 | |
| Regulation of biological quality (5%) | FAM3B, ANPEP, TMIGD1, APOA4 | |
| Negative regulation of cellular process (4%) | ANXA13, TMIGD1, WFDC2 | |
| Small molecule metabolic process (4%) | CA1, BAAT, APOA4 | |
| Establishment of localization, macromolecule localization (4%) | ANXA13, FAM3B, APOA4 | |
| Cell communication (4%) | FAM3B, ANPEP, PLCE1 | |
| Regulation of localization (4%) | ANXA13, TMIGD1, APOA4 | |
| Cell death, apoptotic process (4%) | TMIGD1, PMP22, CADM1 | |
| Anatomical structure development/morphogenesis (4%) | ANPEP, PMP22 | |
| Response to stress, regulation of metabolic process/molecular function/hydrolase activity (2%) | APOA4, WFDC2 | |
| System process, catabolic process (2%) | ANPEP, APOA4 | |
| Signal transduction, cellular response to stimulus (2%) | ANPEP, PLCE1 | |
| Multicellular organism development, cellular developmental process, anatomical structure formation involved in morphogenesis (2%) | ANPEP, PMP22 | |
| Positive regulation of cellular process (2%) | ANXA13, APOA4 | |
| Cellular component organization or biogenesis (2%) | APOA4, PMP22 | |
| Biosynthetic process (2%) | BAAT, APOA4 | |
| Cell adhesion (2%) | SPP1, CADM1 | |
| Biological process involved in symbiotic interaction (1%) | ANPEP | |
| Positive/negative regulation of transport, vesicle-mediated transport (1%) | ANXA13 | |
| Cellular localization, positive/negative regulation of establishment of protein localization (1%) | ANXA13 | |
| Plasma lipoprotein particle organization, regulation of plasma lipoprotein particle levels (1%) | APOA4 | |
| Response to chemical, digestion, regulation of multicellular organismal process (1%) | APOA4 | |
| Positive regulation of metabolic process/catalytic activity (1%) | APOA4 | |
| Cell–cell signaling, export from cell (1%) | FAM3B | |
| Ensheathment of neurons (1%) | PMP22 | |
| Ossification (1%) | SPP1 | |
| Cell population proliferation (1%) | TMIGD1 | |
| Regulation of locomotion, cell motility (1%) | TMIGD1 | |
| Localization of cell, movement of cell or subcellular component (1%) | TMIGD1 | |
| Response to external stimulus/biotic stimulus/other organism (1%) | WFDC2 | |
| Immune response (1%) | WFDC2 | |
| Negative regulation of metabolic process/catalytic activity (1%) | WFDC2 | |
| Calcium-mediated signaling, positive regulation of cytosolic calcium ion concentration, epidermal growth factor receptor signaling pathway, Ras protein signal transduction, regulation of Ras protein signal transduction/G protein-coupled receptor signaling pathway, inositol phosphate-mediated signaling, phosphatidylinositol-mediated signaling, phospholipase C-activating G protein-coupled receptor signaling pathway (1%) | PLCE1 | |
| Lipid catabolic process, diacylglycerol biosynthetic process (1%) | PLCE1 | |
| Regulation of protein kinase activity, positive regulation of lamellipodium assembly/MAPK cascade (1%) | PLCE1 | |
| Regulation of cell growth, cytoskeleton organization (1%) | PLCE1 | |
| Heart development, glomerulus development, regulation of smooth muscle contraction (1%) | PLCE1 | |
| Liver/brain development, spermatogenesis (1%) | CADM1 | |
| Cell differentiation/recognition (1%) | CADM1 | |
| Detection of stimulus (1%) | CADM1 | |
| Homophilic cell adhesion/heterophilic cell–cell adhesion via plasma membrane cell adhesion molecules (1%) | CADM1 | |
| Immune system process, positive regulation of cytokine production/natural killer cell mediated cytotoxicity (1%) | CADM1 | |
| Susceptibility to natural killer cell mediated cytotoxicity (1%) | CADM1 | |
| Gene Ontology (GO) Analysis of DEGs (Annotated for Molecular Function) | ||
| GO-Terms | Genes | |
| Metal ion binding (21%) | ANXA13, CA1, ANPEP, ANPEP, CA1 | |
| RNA binding (8%) | RBMS1, KHDRBS3 | |
| Metallopeptidase activity (4%) | ANPEP | |
| Peptidase inhibitor activity, endopeptidase regulator activity (4%) | WFDC2 | |
| Exopeptidase activity (4%) | ANPEP | |
| Transferase activity, transferring acyl groups other than amino-acyl groups (4%) | BAAT | |
| Aspartic-type peptidase activity, endopeptidase activity (4%) | BACE2 | |
| Calcium-dependent phospholipid binding, phosphatidylglycerol binding (4%) | ANXA13 | |
| Sterol binding (4%) | APOA4 | |
| Thiolester hydrolase activity (4%) | BAAT | |
| SH3 Domain binding (4%) | KHDRBS3 | |
| Sulfotransferase activity (4%) | SULT1C3 | |
| Hydrolase/carboxylic ester hydrolase activity (4%) | CA1 | |
| Enzyme binding, metal ion binding (4%) | PLCE1 | |
| Phosphatidylinositol phospholipase C activity, small GTPase binding, guanyl-nucleotide exchange factor activity (4%) | PLCE1 | |
| Cholesterol binding (4%) | APOA4 | |
| Phosphatidylcholine-sterol O-acyltransferase activator activity (4%) | APOA4 | |
| Signaling receptor binding (4%) | CADM1 | |
| Cell adhesion molecule binding, PDZ domain binding, protein homodimerization activity (4%) | CADM1 | |
| Gene Ontology (GO) Analysis of DEGs (Annotated for Cellular Component) | ||
| GO-Terms | Genes | |
| Intracellular anatomical structure (14%) | ANXA13, MUC1, CA1, ANPEP, PLCE1, BAAT, TMIGD1, BACE2, KHDRBS3 | |
| Membrane, cell membrane (14%) | ANXA13, MUC1, ANPEP, PLCE1, TMIGD1, GLIPR1, BACE2, PMP22, CADM1, IFI6 | |
| Cytoplasm and cytosol (12%) | ANXA13, CA1, MUC1, ANPEP, PLCE1, BAAT, TMIGD1, BACE2 | |
| Intrinsic component of membrane (12%) | MUC1, ANPEP, TMIGD1, GLIPR1, CADM1, BACE2, PMP22, IFI6 | |
| Extracellular region (11%) | FAM3B, ANPEP, PLCE1, SPP1, APOA4, GLIPR1, WFDC2 | |
| Organelle (11%) | ANXA13, MUC1, ANPEP, PLCE1, BAAT, BACE2, KHDRBS3 | |
| Cell periphery (9%) | ANXA13, MUC1, ANPEP, TMIGD1, BACE2, PMP22 | |
| Extracellular space (8%) | ANPEP, PLCE1, GLIPR1, APOA4, WFDC2 | |
| Endomembrane system (5%) | ANXA13, PLCE1, BACE2 | |
| Apical part of cell (3%) | ANXA13, MUC1 | |
| Golgi apparatus membrane, lamellipodium (2%) | PLCE1 | |
| Basolateral plasma membrane, cell–cell junction, neuron projection, postsynaptic density (2%) | CADM1 | |
| Details about DEGs in Control IBD Enteroids vs. Control Tumor Enteroids | ||
| Gene Description | Gene Symbol | Probe Set ID |
| Sulfotransferase family 1C member 3 | SULT1C3 | CfaAffx.4011.1.S1_at |
| Osteopontin | SPP1 | Cfa.9240.1.S1_at |
| Carbonic anhydrase 1 | CA1 | CfaAffx.13785.1.S1_at/Cfa.6413.1.A1_at |
| Mucin-1 | MUC1 | CfaAffx.26061.1.S1_at/Cfa.7074.1.A1_at |
| Phospholipase C epsilon 1 | PLCE1 | Cfa.12506.3.S1_at |
| Protein S100-A16 | S100A16 | Cfa.18759.1.S1_s_at/Cfa.18759.2.S1_at |
| Beta-site APP-cleaving enzyme 2 (memapsin 1) (beta-secretase 2) | BACE2 | Cfa.20396.1.S1_at |
| Cell adhesion molecule 1 | CADM1 | Cfa.11274.1.A1_at/Cfa.10739.1.A1_s_at |
| WAP four-disulfide core domain protein 2 | WFDC2 (CE4) | CfaAffx.15227.1.S1_s_at/Cfa.3780.1.S1_at |
| RNA-binding motif, single-stranded-interacting protein 1 | RBMS1 | Cfa.5781.1.A1_s_at |
| ENSCAFT00000022799 XM_014110988.1 PREDICTED: Canis lupus familiaris fibronectin 1 (FN1) | FN1 | CfaAffx.22155.1.S1_s_at |
| Double-headed protease inhibitor, submandibular gland | LOC111092171 | Cfa.12226.1.A1_at |
| Serine protease 23 | PRSS23 | Cfa.17835.1.S1_s_at |
| Peripheral myelin protein 22 | PMP22 | CfaAffx.27421.1.S1_at |
| Neutral and basic amino acid transport protein rbat | SLC3A1 | Cfa.3561.1.S1_at |
| Bile acid-CoA:amino acid N-acyltransferase-like | BAAT | CfaAffx.4748.1.S1_at |
| Aminopeptidase N | ANPEP | Cfa.20798.1.S1_at/Cfa.3774.1.A1_s_at |
| Apolipoprotein A-IV | APOA4 | Cfa.6294.1.A1_at |
| Annexin A13 | ANXA13 | Cfa.3796.1.A1_s_at |
| Gene Ontology (GO) Analysis of DEGs (Annotated for Biological Process) | ||
| GO-Terms | Genes | |
| Primary metabolic process, organic substance metabolic process (10%) | PRSS23, anpep, BAAT, SLC3A1, LOC111092171, APOA4, BACE2, WFDC2 (CE4) | |
| Nitrogen compound metabolic process (9%) | PRSS23, ANPEP, BAAT, LOC111092171, APOA4, BACE2, WFDC2 (CE4) | |
| Cellular metabolic process (9%) | CA1, ANPEP, BAAT, LOC111092171, APOA4, BACE2, WFDC2 (CE4) | |
| Regulation of cellular process (9%) | ANXA13, ANPEP, PLCE1, CADM1, LOC111092171, APOA4, WFDC2 (CE4) | |
| Small molecule metabolic process (5%) | CA1, BAAT, APOA4, BACE2 | |
| Regulation of metabolic process (4%) | LOC111092171, APOA4, WFDC2 (CE4) | |
| Negative regulation of cellular process (4%) | ANXA13, LOC111092171, WFDC2 (CE4) | |
| Regulation of molecular function, hydrolase activity (4%) | LOC111092171, APOA4, WFDC2 (CE4) | |
| Cell communication, signal transduction, cellular response to stimulus (4%) | ANPEP, PLCE1, CADM1 | |
| Biosynthetic process (4%) | BAAT, APOA4, BACE2 | |
| Negative regulation of metabolic process (2%) | LOC111092171, WFDC2 (CE4) | |
| Negative regulation of catalytic activity (2%) | LOC111092171, WFDC2 (CE4) | |
| Response to stress (2%) | APOA4, WFDC2 (CE4) | |
| Positive regulation of cellular process, regulation and establishment of localization/macromolecule localization (2%) | ANXA13, APOA4 | |
| Cellular component organization or biogenesis (2%) | APOA4, PMP22 | |
| System process, catabolic process, regulation of biological quality (2%) | ANPEP, APOA4 | |
| Response to chemical (2%) | S100A16, APOA4 | |
| Multicellular organism development, cellular developmental process, anatomical structure development/morphogenesis (2%) | ANPEP, PMP22 | |
| Cell death, apoptotic process (2%) | PMP22, CADM1 | |
| Cell adhesion (2%) | SPP1, CADM1 | |
| Immune response, response to biotic stimulus/other organism/external stimulus (1%) | WFDC2 (CE4) | |
| Heart development, glomerulus development, regulation of smooth muscle contraction, Regulation of signaling, cell growth, cytoskeleton organization (1%) | PLCE1 | |
| Lipid catabolic process, diacylglycerol biosynthetic process (1%) | PLCE1 | |
| Ensheathment of neurons (1%) | PMP22 | |
| Biological process involved in symbiotic interaction (1%) | ANPEP | |
| Ossification (1%) | SPP1 | |
| Cellular localization, positive/negative regulation of establishment of protein localization (1%) | ANXA13 | |
| Positive/negative regulation of transport, vesicle-mediated transport (1%) | ANXA13 | |
| Regulation of multicellular organismal process, digestion (1%) | APOA4 | |
| Plasma lipoprotein particle organization, regulation of plasma lipoprotein particle levels, positive regulation of metabolic process/catalytic activity (1%) | APOA4 | |
| Immune system process, positive regulation of cytokine production/natural killer cell mediated cytotoxicity, detection of stimulus (1%) | CADM1 | |
| Liver/brain development, spermatogenesis, cell differentiation/recognition (1%) | CADM1 | |
| Response to calcium ion (1%) | S100A16 | |
| Amyloid-beta metabolic process, glucose homeostasis, membrane protein ectodomain proteolysis, negative regulation of amyloid precursor protein biosynthetic process, peptide hormone processing (1%) | BACE2 | |
| Gene Ontology (GO) Analysis of DEGs (Annotated for Molecular Function) | ||
| GO-Terms | Genes | |
| Ion binding (18%) | ANXA13, CA1, ANPEP, S100A16, APOA4 | |
| Hydrolase activity (14%) | CA1, PRSS23, ANPEP, BAAT | |
| Enzyme regulator activity (11%) | LOC111092171, APOA4, WFDC2 (CE4) | |
| Catalytic activity, acting on a protein (7%) | PRSS23, ANPEP | |
| Organic cyclic compound binding (7%) | RBMS1, APOA4 | |
| Transferase activity (7%) | BAAT, SULT1C3 | |
| Lipid binding (7%) | ANXA13, APOA4 | |
| Lyase activity (4%) | CA1 | |
| Enzyme binding, metal ion binding (4%) | PLCE1 | |
| Phosphatidylinositol phospholipase C activity, small GTPase binding, guanyl-nucleotide exchange factor activity (4%) | PLCE1 | |
| Signaling receptor binding (4%) | CADM1 | |
| Cell adhesion molecule binding, PDZ domain binding, protein homodimerization activity (4%) | CADM1 | |
| Calcium ion/calcium-dependent protein binding, protein homodimerization activity (4%) | S100A16 | |
| RNA binding (4%) | S100A16 | |
| Aspartic-type endopeptidase activity (4%) | BACE2 | |
| Gene Ontology (GO) Analysis of DEGs (Annotated for Cellular Component) | ||
| GO-Terms | Genes | |
| Intracellular anatomical structure (14%) | ANXA13, MUC1, CA1, PRSS23, ANPEP, BAAT, PLCE1, S100A16, CADM1, BACE2 | |
| Cytoplasm (13%) | ANXA13, CA1, MUC1, ANPEP, BAAT, PLCE1, S100A16, CADM1, BACE2 | |
| Membrane/plasma membrane (13%) | ANXA13, MUC1, PRSS23, ANPEP, S100A16, SLC3A1, PMP22, CADM1, BACE2 | |
| Organelle (11%) | ANXA13, MUC1, PRSS23, ANPEP, BAAT, PLCE1, S100A16, BACE2 | |
| Extracellular region (10%) | ANPEP, PLCE1, S100A16, LOC111092171, SPP1, APOA4, WFDC2 (CE4) | |
| Intrinsic component of membrane (10%) | MUC1, PRSS23, ANPEP, SLC3A1, CADM1, PMP22, BACE2 | |
| Extracellular space (7%) | ANPEP, PLCE1, S100A16, APOA4, WFDC2 (CE4) | |
| Cell periphery (7%) | ANXA13, MUC1, ANPEP, S100A16, PMP22 | |
| Apical part of cell (3%) | ANXA13, MUC1 | |
| Cytosol (3%) | BAAT, S100A16 | |
| Membrane-enclosed lumen (3%) | ANXA13, S100A16 | |
| Endomembrane system (3%) | ANXA13, PLCE1 | |
| Golgi apparatus membrane, lamellipodium (1%) | PLCE1 | |
| Basolateral plasma membrane, cell–cell junction, neuron projection, postsynaptic density (1%) | CADM1 | |
| Nucleus, nucleolus (1%) | S100A16 | |
| Endoplasmic reticulum, Golgi apparatus, endosome (1%) | BACE2 | |
| Details about DEGs in LPS Treated IBD Colonoids vs. LPS Treated IBD Enteroids | ||
| Probe Set ID | Gene Description | Gene Symbol |
| CfaAffx.13785.1.S1_at/Cfa.6413.1.A1_at | Carbonic anhydrase 1 | CA1 |
| CfaAffx.31015.1.S1_at | Chloride channel accessory 1 | CLCA1 |
| CfaAffx.4011.1.S1_at | Sulfotransferase 1C1 | SULT1C1 |
| Cfa.7074.1.A1_at/CfaAffx.26061.1.S1_at | Mucin-1 | MUC1 |
| Cfa.16455.1.S1_at | C-X-C motif chemokine 13 | CXCL13 |
| Cfa.15827.1.S1_s_at | Fucosyltransferase 5 (alpha (1,3) fucosyltransferase) | FUT5 (fut356) |
| Cfa.4456.1.S1_at | proSAAS | PCSK1N |
| Cfa.18759.2.S1_at | Protein S100-A16 | S100A16 |
| CfaAffx.8210.1.S1_at | ENSCAFT00000007801 XM_022408371.1 PREDICTED: Canis lupus familiaris olfactomedin 4 (OLFM4), mRNA | OLFM4 |
| Cfa.5989.1.A1_s_at | Alpha-1-antitrypsin-like | SERPINA1 |
| CfaAffx.3936.1.S1_at | HEPACAM family member 2 | HEPACAM2 |
| CfaAffx.15227.1.S1_s_at | WAP four-disulfide core domain protein 2 | WFDC2 (CE4) |
| Cfa.21325.1.S1_s_at | Epithelial membrane protein 2 | EMP2 |
| Cfa.12271.1.A1_at | Ras-related protein Rap-2a-like | LOC480441 |
| CfaAffx.9034.1.S1_s_at | ENSCAFT00000008689 XM_022406088.1 PREDICTED Canis lupus familiaris Fc fragment of IgG binding protein FCGBP mRNA | FCGBP |
| Cfa.496.1.A1_s_at | Collagen alpha-2(V) chain | COL5A2 |
| CfaAffx.14168.1.S1_s_at | Annexin A10 | ANXA10 |
| Cfa.11104.1.S1_at | Phytanoyl-CoA hydroxylase-like | LOC478000 |
| Cfa.18640.1.S1_at | Long-chain-fatty-acid-CoA ligase 5 | ACSL5 |
| Cfa.10909.1.A1_at | 39S ribosomal protein S30, mitochondrial | MRPS30 |
| CfaAffx.4748.1.S1_at | Bile acid-CoA:amino acid N-acyltransferase-like | BAAT |
| Cfa.6996.1.A1_at | Ectonucleotide pyrophosphatase/phosphodiesterase family member 6 | ENPP6 |
| Cfa.6294.1.A1_at | Apolipoprotein A-IV | APOA4 |
| Gene Ontology (GO) Analysis of DEGs (Annotated for Biological Process) | ||
| GO-Terms | Genes | |
| Cellular metabolic process (7%) | PCSK1N, CA1, BAAT, FUT5 (fut356), APOA4, ACSL5, WFDC2 (CE4), EMP2 | |
| Organic substance/nitrogen compound metabolic process (7%) | PCSK1N, BAAT, FUT5 (fut356), ENPP6, APOA4, ACSL5, WFDC2 (CE4), EMP2 | |
| Regulation of cellular process (7%) | PCSK1N, CLCA1, LOC480441, CXCL13, APOA4, ACSL5, WFDC2 (CE4), EMP2 | |
| Primary metabolic process (7%) | PCSK1N, BAAT, ENPP6, FUT5 (fut356), APOA4, ACSL5, WFDC2 (CE4), EMP2 | |
| Regulation of molecular function (5%) | PCSK1N, CLCA1, LOC480441, APOA4, WFDC2 (CE4), EMP2 | |
| Positive regulation of cellular process (4%) | CLCA1, CXCL13, APOA4, ACSL5, EMP2 | |
| Small molecule metabolic process (3%) | CA1, BAAT, APOA4, ACSL5 | |
| Regulation of metabolic process (3%) | PCSK1N, APOA4, WFDC2 (CE4), EMP2 | |
| Signal transduction, cell communication, cellular response to stimulus (3%) | CLCA1, LOC480441, CXCL13, EMP2 | |
| Response to stress (3%) | CLCA1, CXCL13, APOA4, WFDC2 (CE4) | |
| Biosynthetic process (3%) | BAAT, FUT5 (fut356), APOA4, ACSL5 | |
| Regulation of hydrolase activity (3%) | PCSK1N, CLCA1, APOA4, WFDC2 (CE4) | |
| Regulation of localization (3%) | CXCL13, APOA4, ACSL5, EMP2 | |
| Immune response (3%) | CXCL13, WFDC2 (CE4), EMP2 | |
| Macromolecule localization and establishment (3%) | APOA4, ACSL5, EMP2 | |
| Regulation of biological quality/multicellular organismal process (3%) | CXCL13, APOA4, EMP2 | |
| Negative regulation of cellular process (3%) | PCSK1N, CXCL13, WFDC2 (CE4) | |
| Response to other organism/external stimulus/biotic stimulus (3%) | CLCA1, CXCL13, WFDC2 (CE4) | |
| Positive regulation of catalytic activity (2%) | APOA4, EMP2 | |
| Movement of cell or subcellular component, cell motility, localization of cell, positive regulation of response to stimulus (2%) | CXCL13, EMP2 | |
| Response to chemical (2%) | CXCL13, APOA4 | |
| Negative regulation of catalytic activity (2%) | PCSK1N, WFDC2 (CE4) | |
| Taxis, leukocyte migration (2%) | CLCA1, CXCL13 | |
| Regulation of signaling (2%) | CLCA1, EMP2 | |
| System process, cellular component organization or biogenesis, positive regulation of metabolic process (2%) | APOA4, EMP2 | |
| Catabolic process (2%) | ENPP6, APOA4 | |
| Regulation of locomotion, tissue migration (2%) | CXCL13, EMP2 | |
| Negative regulation of metabolic process (2%) | PCSK1N, WFDC2 (CE4) | |
| Positive regulation of signaling (1%) | EMP2 | |
| Transmembrane transport, positive regulation of transport/lipid localization (1%) | ACSL5 | |
| Digestion, plasma lipoprotein particle organization, regulation of plasma lipoprotein particle levels (1%) | APOA4 | |
| Cell–cell signaling, cellular homeostasis, response to endogenous stimulus, positive regulation of immune system process/locomotion, negative regulation of locomotion/multicellular organismal process/response to stimulus (1%) | CXCL13 | |
| Cell population proliferation, actin filament-based process, cell adhesion, cell death/cell killing, multi-multicellular organism process/development, anatomical structure formation involved in morphogenesis, cellular developmental process, cellular localization, vesicle-mediated transport, embryo implantation, multi-organism reproductive process, immune effector process, regulation of developmental process/transferase activity (1%) | EMP2 | |
| Protein glycosylation (1%) | FUT5 (fut356) | |
| Calcium ion transport, cellular response to hypoxia, chloride transport, ion transmembrane transport (1%) | CLCA1 | |
| Actin cytoskeleton reorganization, cellular response to xenobiotic stimulus, Rap protein signal transduction, regulation of dendrite morphogenesis, JNK cascade (1%) | LOC480441 | |
| Establishment of protein localization, protein localization to plasma membrane, microvillus assembly, negative regulation of cell migration (1%) | LOC480441 | |
| Positive regulation of protein phosphorylation/autophosphorylation (1%) | LOC480441 | |
| Methyl-branched fatty acid/2-oxoglutarate/isoprenoid metabolic process, 2-oxobutyrate catabolic process (1%) | LOC478000 | |
| Oxidation-reduction process, fatty acid alpha-oxidation (1%) | LOC478000 | |
| Cell division, centrosome cycle (1%) | HEPACAM2 | |
| Gene Ontology (GO) Analysis of DEGs (Annotated for Molecular Function) | ||
| GO-Terms | Genes | |
| Cation binding (17%) | CA1, ANXA10, S100A16, COL5A2, APOA4 | |
| Hydrolase activity, acting on ester bonds (10%) | CA1, BAAT, ENPP6 | |
| Signaling receptor binding (7%) | CXCL13, EMP2 | |
| Enzyme inhibitor activity (7%) | PCSK1N, WFDC2 (CE4) | |
| Phospholipid binding (7%) | ANXA10, APOA4 | |
| Peptidase regulator activity (7%) | PCSK1N, WFDC2 (CE4) | |
| Hydrolase activity, acting on acid anhydrides, ligase activity, forming carbon-sulfur bonds (3%) | ACSL5 | |
| Phosphatidylcholine binding, enzyme activator activity, alcohol binding, steroid binding (3%) | APOA4 | |
| Transferase activity, transferring acyl groups (3%) | BAAT | |
| Carbon-oxygen lyase activity (3%) | CA1 | |
| Glycosaminoglycan binding, heparin binding, growth factor binding (3%) | CXCL13 | |
| Enzyme binding, cell adhesion molecule binding, integrin binding (3%) | EMP2 | |
| Transferase activity, transferring glycosyl groups, fucosyltransferase activity (3%) | FUT5 (fut356) | |
| Transferase activity, transferring sulfur-containing groups (3%) | SULT1C3 | |
| Intracellular calcium activated chloride channel activity, metal ion binding, metalloendopeptidase activity (3%) | CLCA1 | |
| Signaling receptor activator activity (3%) | CXCL13 | |
| GDP/GTP binding, G protein activity, GTPase activity, magnesium ion binding (3%) | LOC480441 | |
| Protein/L-ascorbic acid/carboxylic acid/ferrous iron binding (3%) | LOC478000 | |
| Phytanoyl-CoA dioxygenase activity (3%) | LOC478000 | |
| Gene Ontology (GO) Analysis of DEGs (Annotated for Cellular Component) | ||
| GO-Terms | Genes | |
| Intracellular organelle (14%) | MUC1, BAAT, FUT5 (fut356), ACSL5, EMP2, HEPACAM2 | |
| Integral component of membrane (14%) | MUC1, FUT5 (fut356), HEPACAM2, ACSL5, EMP2 | |
| Membrane-bounded organelle (14%) | MUC1, BAAT, FUT5 (fut356), ACSL5, EMP2, HEPACAM2 | |
| Plasma membrane (14%) | MUC1, ENPP6, ACSL5, EMP2, CLCA1, LOC480441 | |
| Plasma membrane region, apical plasma membrane (5%) | MUC1, EMP2 | |
| Organelle membrane, Golgi apparatus subcompartment (5%) | FUT5 (fut356), EMP2 | |
| Mitochondrion (5%) | ACSL5, LOC478000 | |
| Plasma lipoprotein particle (3%) | APOA4 | |
| Intracellular non-membrane-bounded organelle, intracellular organelle lumen/Endoplasmic reticulum (3%) | ACSL5 | |
| Lipoprotein particle (3%) | APOA4 | |
| Membrane microdomain, intracellular vesicle/cytoplasmic vesicle (3%) | EMP2 | |
| Microbody (3%) | BAAT | |
| Integral component of plasma membrane (3%) | CLCA1 | |
| Extracellular space, microvillus, zymogen granule membrane (3%) | CLCA1 | |
| Golgi cisterna membrane (3%) | FUT5 (fut356) | |
| Cytosol, recycling endosome membrane, midbody (3%) | LOC480441 | |
| Peroxisome, 9 + 0 non-motile cilium (3%) | LOC478000 | |
| Cytoskeleton, centrosome, mitotic spindle, Golgi membrane, Nucleus, nucleoplasm, midbody (3%) | HEPACAM2 | |
| Details about DEGs in LPS Treated IBD Enteroids vs. LPS Treated Tumor Enteroids | ||
| Probe Set ID | Gene Description | Gene Symbol |
| CfaAffx.13785.1.S1_at/Cfa.6413.1.A1_at | Carbonic anhydrase 1 | CA1 |
| CfaAffx.31015.1.S1_at | Chloride channel accessory 1 | CLCA1 |
| CfaAffx.4011.1.S1_at | Sulfotransferase family 1C member 3 | SULT1C3 |
| Cfa.7074.1.A1_at | Mucin-1 | MUC1 |
| Cfa.16455.1.S1_at | C-X-C motif chemokine 13 | CXCL13 |
| Cfa.15827.1.S1_s_at | Fucosyltransferase 5 (alpha (1,3) fucosyltransferase) | FUT5 (fut356) |
| Cfa.4456.1.S1_at | proSAAS | PCSK1N |
| Cfa.496.1.A1_s_at | Collagen alpha-2(V) chain | COL5A2 |
| CfaAffx.15227.1.S1_s_at/Cfa.3780.1.S1_at | WAP four-disulfide core domain protein 2 | WFDC2 (CE4) |
| CfaAffx.14168.1.S1_s_at | Annexin A10 | ANXA10 |
| CfaAffx.3936.1.S1_at | HEPACAM family member 2 isoform X1 | HEPACAM2 |
| Cfa.5989.1.A1_s_at | Alpha-1-antitrypsin-like | SERPINA1 |
| CfaAffx.16198.1.S1_s_at | Trefoil factor 1 | TFF1 |
| CfaAffx.9034.1.S1_s_at | ENSCAFT00000008689 XM_022406088.1 PREDICTED: Canis lupus familiaris Fc fragment of IgG binding protein (FCGBP) | FCGBP |
| Cfa.12271.1.A1_at | Ras-related protein Rap-2a-like | LOC480441 |
| Cfa.21325.1.S1_s_at | Epithelial membrane protein 2 | EMP2 |
| CfaAffx.8210.1.S1_at | ENSCAFT00000007801 XM_022408371.1 PREDICTED: Canis lupus familiaris olfactomedin 4 (OLFM4) | OLFM4 |
| Cfa.10909.1.A1_at | 39S Ribosomal protein S30, mitochondrial | MRPS30 |
| Cfa.15806.1.S1_at | C-C motif chemokine 25 | CCL25 |
| Cfa.18640.1.S1_at | Long-chain-fatty-acid--CoA ligase 5 | ACSL5 |
| CfaAffx.4748.1.S1_at | Bile acid-CoA:amino acid N-acyltransferase-like | BAAT |
| Cfa.6996.1.A1_at | Ectonucleotide pyrophosphatase/phosphodiesterase family member 6 | ENPP6 |
| Cfa.6294.1.A1_at | Apolipoprotein A-IV | APOA4 |
| Gene Ontology (GO) Analysis of DEGs (Annotated for Biological Process) | ||
| GO-Terms | Genes | |
| Regulation of cellular process (7%) | PCSK1N, CCL25, CLCA1, LOC480441, CXCL13, TFF1, APOA4, ACSL5, WFDC2 (CE4), EMP2 | |
| Cellular metabolic process (6%) | PCSK1N, CA1, BAAT, FUT5 (fut356), APOA4, ACSL5, WFDC2 (CE4), EMP2 | |
| Primary metabolic process, organic substance/nitrogen compound metabolic process (6%) | PCSK1N, BAAT, FUT5 (fut356), ENPP6, ACSL5, APOA4, WFDC2 (CE4), EMP2 | |
| Regulation of molecular function (5%) | PCSK1N, CCL25, CLCA1, LOC480441, APOA4, WFDC2 (CE4), EMP2 | |
| Cell communication, signal transduction, cellular response to stimulus (4%) | CCL25, CLCA1, LOC480441, CXCL13, TFF1, EMP2 | |
| Positive regulation of cellular process (4%) | CCL25, CLCA1, CXCL13, APOA4, ACSL5, EMP2 | |
| Response to stress (3%) | CCL25, CLCA1, CXCL13, APOA4, WFDC2 (CE4) | |
| Regulation of hydrolase activity (3%) | PCSK1N, CCL25, CLCA1, APOA4, WFDC2 (CE4) | |
| Immune response (3%) | CCL25, CXCL13, WFDC2 (CE4), EMP2 | |
| Regulation of metabolic process (3%) | PCSK1N, APOA4, WFDC2 (CE4), EMP2 | |
| Small molecule metabolic process (3%) | CA1, BAAT, APOA4, ACSL5 | |
| Response to biotic stimulus/external stimulus/other organism (3%) | CCL25, CLCA1, CXCL13, WFDC2 (CE4) | |
| Regulation of biological quality (3%) | CXCL13, TFF1, APOA4, EMP2 | |
| Cell motility, movement of cell or subcellular component, positive regulation of response to stimulus, localization of cell (3%) | CCL25, CLCA1, CXCL13, EMP2 | |
| Biosynthetic process (3%) | BAAT, FUT5 (fut356), APOA4, ACSL5 | |
| Response to chemical (3%) | CCL25, CLCA1, CXCL13, APOA4 | |
| Regulation of localization (3%) | CXCL13, APOA4, ACSL5, EMP2 | |
| Negative regulation of cellular process (2%) | PCSK1N, CXCL13, WFDC2 (CE4) | |
| Positive regulation of catalytic activity (2%) | CCL25, APOA4, EMP2 | |
| Negative regulation of catalytic activity (2%) | PCSK1N, LOC480441, WFDC2 (CE4) | |
| Macromolecule localization (2%) | APOA4, ACSL5, EMP2 | |
| Leukocyte migration, taxis (2%) | CCL25, CLCA1, CXCL13 | |
| Regulation of signaling (2%) | CCL25, CLCA1, EMP2 | |
| Establishment of localization (2%) | APOA4, ACSL5, EMP2 | |
| Regulation of multicellular organismal process (2%) | CXCL13, APOA4, EMP2 | |
| System process (2%) | TFF1, APOA4, EMP2 | |
| Positive regulation of signaling (2%) | CCL25, CLCA1, EMP2 | |
| Negative regulation of metabolic process (1%) | PCSK1N, WFDC2 (CE4) | |
| Cellular component organization or biogenesis (1%) | APOA4, EMP2 | |
| Catabolic process (1%) | ENPP6, APOA4 | |
| Tissue migration (1%) | CXCL13, EMP2 | |
| Digestion (1%) | TFF1, APOA4 | |
| Positive regulation of metabolic process (1%) | APOA4, EMP2 | |
| Regulation of locomotion (1%) | CXCL13, EMP2 | |
| Transmembrane transport, positive regulation of transport/lipid localization (1%) | ACSL5 | |
| Regulation of plasma lipoprotein particle levels/organization (1%) | APOA4 | |
| Cell–cell signaling, negative regulation of response to stimulus/multicellular organismal process, regulation of immune system process, pos. regulation of immune system process, response to endogenous stimulus, cellular homeostasis, pos./neg. regul. of locomotion (1%) | CXCL13 | |
| Multi-multicellular organism process, multicellular organism development, cellular developmental process and regulation, anatomical structure development/formation involved in morphogenesis, cellular localization, cell population proliferation, actin filament-based process, immune effector process, multi-organism reproductive process, cell adhesion, regulation of transferase activity, cell death/cell killing, embryo implantation, vesicle-mediated transport (1%) | EMP2 | |
| Glycosylation (1%) | FUT5 (fut356) | |
| Multicellular organismal homeostasis (1%) | TFF1 | |
| Calcium ion transport, cellular response to hypoxia, chloride transport, ion transmembrane transport (1%) | CLCA1 | |
| Actin cytoskeleton reorganization, cellular response to xenobiotic stimulus, Rap protein signal transduction, regulation of dendrite morphogenesis, JNK cascade (1%) | LOC480441 | |
| Establishment of protein localization, protein localization to plasma membrane, microvillus assembly, negative regulation of cell migration (1%) | LOC480441 | |
| Positive regulation of protein phosphorylation/autophosphorylation (1%) | LOC480441 | |
| Gene Ontology (GO) Analysis of DEGs (Annotated for Molecular Function) | ||
| GO-Terms | Genes | |
| Receptor ligand activity (14%) | CCL25, CXCL13, TFF1 | |
| Metal ion binding (14%) | CA1, ANXA10, COL5A2 | |
| Cytokine receptor binding, G protein-coupled receptor binding (9%) | CCL25, CXCL13 | |
| Peptidase inhibitor activity, endopeptidase regulator activity (9%) | PCSK1N, WFDC2 (CE4) | |
| Hydro-lyase activity, carboxylic ester hydrolase activity (5%) | CA1 | |
| Acid-thiol ligase activity, hydrolase activity, acting on acid anhydrides, in phosphorus-containing anhydrides, CoA-ligase activity (5%) | ACSL5 | |
| Calcium-dependent phospholipid binding (5%) | ANXA10 | |
| Phosphatidylcholine-sterol O-acyltransferase activator activity, sterol binding, cholesterol binding (5%) | APOA4 | |
| Thiolester hydrolase activity, transferase activity, transferring acyl groups other than amino-acyl groups (5%) | BAAT | |
| Fibroblast growth factor binding (5%) | CXCL13 | |
| Kinase binding (5%) | EMP2 | |
| Phosphoric ester hydrolase activity (5%) | ENPP6 | |
| Transferase activity, transferring hexosyl/glycosyl groups (5%) | FUT5 (fut356) | |
| Sulfotransferase activity (5%) | SULT1C3 | |
| Intracellular calcium activated chloride channel activity, metal ion binding, metalloendopeptidase activity (5%) | CLCA1 | |
| GDP/GTP binding, G protein activity, GTPase activity, magnesium ion binding (5%) | LOC480441 | |
| Gene Ontology (GO) Analysis of DEGs (Annotated for Cellular Component) | ||
| GO-Terms | Genes | |
| Plasma membrane (23%) | MUC1, ENPP6, CLCA1, ACSL5, EMP2, LOC480441 | |
| Intracellular organelle, membrane-bounded organelle (15%) | BAAT, FUT5 (fut356), ACSL5, EMP2 | |
| Integral component of membrane (15%) | FUT5 (fut356), HEPACAM2, ACSL5, EMP2 | |
| Organelle membrane, Golgi apparatus subcompartment (8%) | FUT5 (fut356), EMP2 | |
| Apical plasma membrane (8%) | MUC1, EMP2 | |
| Endoplasmic reticulum, intracellular organelle lumen, mitochondrion, intracellular non-membrane-bounded organelle (4%) | ACSL5 | |
| Plasma lipoprotein particle (4%) | APOA4 | |
| Microbody (4%) | BAAT | |
| Intracellular vesicle, membrane microdomain, cytoplasmic vesicle (4%) | EMP2 | |
| Integral component of plasma membrane (4%) | CLCA1 | |
| Extracellular space, microvillus, zymogen granule membrane (4%) | CLCA1 | |
| Golgi cisterna membrane (4%) | FUT5 (fut356) | |
| Cytosol, recycling endosome membrane, midbody (4%) | LOC480441 | |
| Details about 25 DEGs Exhibiting Same Trend of Expression between IBD Enteroids and Colonoids Following LPS Stimulation | ||||
|---|---|---|---|---|
| Probe Set ID | Gene Description | Gene Symbol | LPS Treated vs. Control IBD Colonoids (Contrast 3) (log2 M) | LPS Treated vs. Control IBD Enteroids (Contrast 2) (log2 M) |
| CfaAffx.16440.1.S1_at | 2′-5′-Oligoadenylate synthase-like protein | OASL | 0.851 | 0.770 |
| CfaAffx.2163.1.S1_at | Antigen peptide transporter 2 | TAP2 | 0.649 | 0.619 |
| CfaAffx.16198.1.S1_s_at | Trefoil factor 1 | TFF1 | 0.924 | 0.599 |
| Cfa.12501.1.A1_at/CfaAffx.19068.1.S1_at/ CfaAffx.19068.1.S1_s_at | Insulin-like growth factor-binding protein 1 | IGFBP1 | 0.453 | 0.397 |
| CfaAffx.29762.1.S1_at | NADPH oxidase organizer 1 | NOXO1 | 0.556 | 0.417 |
| CfaAffx.15121.1.S1_at | Interferon-induced protein with tetratricopeptide repeats 1 | IFIT1 | 0.855 | 0.407 |
| CfaAffx.21951.1.S1_s_at | Eukaryotic translation elongation factor 1 alpha 1 | EEF1A1 | 0.285 | 0.332 |
| Cfa.21191.2.S1_a_at | 2′-5′-Oligoadenylate synthase 1 | OAS1 | 1.028 | 0.284 |
| Cfa.10757.1.S1_at | Ubiquitin-like protein ISG15 | ISG15 | 0.953 | 0.284 |
| Cfa.2878.1.A1_s_at | Ceruloplasmin | CP | 0.965 | 0.271 |
| CfaAffx.14226.1.S1_s_at | DExD/H-box helicase 60 | DDX60 | 0.515 | 0.267 |
| CfaAffx.17868.1.S1_at | Glutathione peroxidase 1 | GPX1 | 0.343 | 0.213 |
| CfaAffx.18742.1.S1_at | Eukaryotic translation initiation factor 3 subunit A | EIF3A | 0.306 | 0.185 |
| Cfa.20996.1.S1_at | MHC class I DLA-12 | DLA-12 | 0.348 | 0.118 |
| Cfa.15976.1.S1_at | ATP synthase F1 subunit epsilon | ATP5F1E | −0.282 | −0.085 |
| CfaAffx.23922.1.S1_x_at | 40S ribosomal protein S24 | RPS24 | −0.641 | −0.155 |
| Cfa.5563.1.A1_s_at | Protein disulfide isomerase family A member 6 | PDIA6 | −0.332 | −0.180 |
| Cfa.3039.1.A1_at | ATPase Na+/K+ transporting subunit alpha 1 | ATP1A1 | −0.158 | −0.189 |
| Cfa.9039.1.A1_at | Fos proto-oncogene, AP-1 transcription factor subunit | FOS | −0.427 | −0.190 |
| Cfa.1408.1.S1_at | Reticulon 4 | RTN4 | −0.226 | −0.303 |
| Cfa.12512.1.A1_at | Ecm29 proteasome adaptor and scaffold | ECPAS | −0.196 | −0.387 |
| Cfa.31.1.S1_s_at | Acidic nuclear phosphoprotein 32 family member A | ANP32A | −0.428 | −0.396 |
| Cfa.15462.1.A1_at | Metallothionein-1 | LOC100686073 | −0.522 | −0.489 |
| Cfa.7907.2.A1_a_at | Uncharacterized LOC611209 | LOC611209 | −0.530 | −0.645 |
| CfaAffx.11648.1.S1_at | Chromodomain helicase DNA binding protein 7 | CHD7 | −0.870 | −0.834 |
| Gene Ontology (GO) Analysis of DEGs (Annotated for Biological Process) | ||||
| GO-Terms | Genes | |||
| Response to external biotic stimulus, defense response to other organism/virus, viral process, innate immune response, negative regulation of viral genome replication (6%) | OAS1, OASL, IFIT1, ISG15 | |||
| Homeostatic process (6%) | CP, TFF1, IFIT1, ISG15 | |||
| Macromolecule metabolic process (6%) | OASL, EEF1A1, RPS24, ISG15 | |||
| Cellular nitrogen compound metabolic process (6%) | OAS1, OASL, EEF1A1, RPS24 | |||
| Organonitrogen compound metabolic process (6%) | OAS1, EEF1A1, RPS24, ISG15 | |||
| Transport (6%) | TAP2, CP, ATP1A1, IFIT1 | |||
| Regulation of viral process (6%) | OAS1, OASL, IFIT1, ISG15 | |||
| Cellular macromolecule/protein metabolic process (4%) | EEF1A1, RPS24, ISG15 | |||
| Cellular/organic substance biosynthetic process (4%) | OAS1, EEF1A1, RPS24 | |||
| Response to organic substance (3%) | IFIT1, ISG15 | |||
| Regulation of cellular/primary/macromolecule/nitrogen compound metabolic process (3%) | OASL, ISG15 | |||
| Cellular aromatic/organic cyclic/nucleobase-containing/heterocycle compound metabolic process (3%) | OAS1, OASL | |||
| Cell surface receptor signaling pathway (3%) | IGFBP1, ISG15 | |||
| Cellular response to chemical stimulus (3%) | IFIT1, GPX1 | |||
| Regulation of transport, ion transmembrane transport (1%) | ATP1A1 | |||
| Cellular chemical homeostasis (1%) | CP | |||
| Negative regulation of ERK1 and ERK2 cascade, formation of cytoplasmic translation initiation complex, IRES-dependent viral translational initiation, translational initiation, translation reinitiation, viral translational termination–reinitiation (1%) | EIF3A | |||
| Response to toxic substance/oxidative stress, cellular oxidant detoxification (1%) | GPX1 | |||
| Response to nitrogen compound, establishment of protein localization (1%) | IFIT1 | |||
| Positive regulation of viral genome replication (1%) | IFIT1 | |||
| Multi-organism transport, protein localization, biological process involved in interaction with host (1%) | IFIT1 | |||
| Negative regulation of molecular function/protein binding/hydrolase activity (1%) | IFIT1 | |||
| Regulation of ATPase activity/immune effector process (1%) | IFIT1 | |||
| Regulation of response to biotic stimulus/stress/external stimulus (1%) | IFIT1 | |||
| Regulation of cell communication/signal transduction (1%) | IGFBP1 | |||
| Response to bacterium (1%) | ISG15 | |||
| Cellular/organic substance catabolic process, negative regulation of cellular/macromolecule/nitrogen compound metabolic process (1%) | ISG15 | |||
| Interferon-gamma/Interleukin-10 production, regulation of cytokine production (1%) | ISG15 | |||
| Animal organ/system/tissue development, erythrocyte homeostasis, hemopoiesis, hematopoietic or lymphoid organ development, regulation of multicellular organismal/biomineral tissue development (1%) | ISG15 | |||
| Bone mineralization, positive regulation of cell differentiation, ossification, biomineral tissue development (1%) | ISG15 | |||
| Reactive oxygen species metabolic process (1%) | NOXO1 | |||
| Positive regulation of molecular function (1%) | NOXO1 | |||
| Cellular component organization (1%) | NOXO1 | |||
| Organophosphate/phosphorus/nucleobase-containing small molecule metabolic process (1%) | OAS1 | |||
| Regulation of nuclease activity (1%) | OASL | |||
| Adaptive immune response, antigen processing and presentation of endogenous/peptide antigen (1%) | TAP2 | |||
| Tissue homeostasis, digestive system process (1%) | TFF1 | |||
| Immune response, antigen processing and presentation (1%) | DLA-12 | |||
| Cellular zinc ion homeostasis, cellular response to cadmium ion/chromate/copper ion/zinc ion, detoxification of copper ion (1%) | LOC100686073 | |||
| Negative regulation of growth/neuron apoptotic process, nitric oxide mediated signal transduction (1%) | LOC100686073 | |||
| Gene Ontology (GO) Analysis of DEGs (Annotated for Molecular Function) | ||||
| GO-Terms | Genes | |||
| Nucleic acid binding (16%) | OAS1, OASL, EEF1A1, IFIT1, EIF3A | |||
| Ribonucleotide binding, nucleoside phosphate binding, anion binding (9%) | TAP2, EEF1A1, ATP1A1 | |||
| Signaling receptor binding (9%) | TAP2, TFF1, ISG15 | |||
| Cation binding (6%) | CP, ATP1A1 | |||
| Enzyme binding (6%) | NOXO1, ISG15 | |||
| Active/ion transmembrane transporter activity (6%) | TAP2, ATP1A1 | |||
| Transferase activity, transferring phosphorus-containing groups (6%) | OAS1, OASL | |||
| Hydrolase activity, acting on acid anhydrides (6%) | TAP2, EEF1A1 | |||
| Inorganic molecular entity transmembrane transporter activity (3%) | ATP1A1 | |||
| Oxidoreductase activity, oxidizing metal ions (3%) | CP | |||
| Nucleoside binding, translation factor activity, RNA binding (3%) | EEF1A1 | |||
| mRNA binding, receptor tyrosine kinase binding, structural molecule activity, translation initiation factor activity (3%) | EIF3A | |||
| Oxidoreductase activity, glutathione peroxidase activity, acting on peroxide as acceptor (3%) | GPX1 | |||
| Growth factor binding (3%) | IGFBP1 | |||
| Integrin binding, cell adhesion molecule binding (3%) | ISG15 | |||
| Enzyme activator activity, phospholipid binding (3%) | NOXO1 | |||
| Amide transmembrane transporter activity (3%) | TAP2 | |||
| Signaling receptor activator activity (3%) | TFF1 | |||
| Metal ion (copper ion/zinc ion) binding (3%) | LOC100686073 | |||
| Gene Ontology (GO) Analysis of DEGs (Annotated for Cellular Component) | ||||
| GO-Terms | Genes | |||
| Intracellular organelle (15%) | TAP2, OASL, RPS24, IGFBP1, ISG15 | |||
| Integral component of membrane (12%) | TAP2, ATP1A1, NOXO1, DLA-12 | |||
| Membrane-bounded organelle (12%) | TAP2, OASL, IGFBP1, ISG15 | |||
| Intracellular non-membrane-bounded organelle (9%) | OASL, RPS24, ISG15 | |||
| Plasma membrane (6%) | ATP1A1, NOXO1 | |||
| Endoplasmic reticulum (6%) | DLA-12, TAP2 | |||
| Nucleus, cytosol, cytoplasm (6%) | EIF3A, LOC100686073 | |||
| Host cell (3%) | IFIT1 | |||
| Golgi apparatus (3%) | IGFBP1 | |||
| Cytosolic ribosome, ribosomal subunit (3%) | ISG15 | |||
| Intrinsic component of plasma membrane, plasma membrane protein complex (3%) | NOXO1 | |||
| Oxidoreductase complex (3%) | NOXO1 | |||
| Intracellular organelle lumen (3%) | OASL | |||
| TAP complex, MHC class I peptide loading complex (3%) | TAP2 | |||
| Endoplasmic reticulum subcompartment, nuclear outer membrane-endoplasmic reticulum membrane network, intrinsic component of organelle membrane (3%) | TAP2 | |||
| Integral component of lumenal side of endoplasmic reticulum membrane, phagocytic vesicle membrane (3%) | DLA-12 | |||
| Lysosome (3%) | LOC100686073 | |||
| Membrane, cytoskeleton, microtubule, nucleolus, nucleoplasm, postsynaptic density, multi-eIF complex, eukaryotic 43S/48S preinitiation complex, eukaryotic translation initiation factor 3 complex, eIF3e/eIF3m (3%) | EIF3A | |||
| Probe Set ID | Gene Description | Gene Symbol | LPS Treated vs. Control IBD Colonoids (Log-Ratio M) | LPS Treated vs. Control IBD Enteroids (Log-Ratio M) | LPS Treated vs. Control Tumor-Adjacent Organoids (Log-Ratio M) |
|---|---|---|---|---|---|
| CfaAffx.14226.1.S1_s_at | DEAD (Asp-Glu-Ala-Asp) box polypeptide 60 | DDX60 | 0.515 | 0.267 | 0.499 |
| CfaAffx.18742.1.S1_at | Eukaryotic translation initiation factor 3 subunit A | EIF3A | 0.306 | 0.185 | 0.215 |
| Cfa.15462.1.A1_at | Metallothionein-1 | LOC100686073 | −0.522 | −0.489 | −0.556 |
| Details about 20 DEGs Exhibiting Opposite Trend (Upregulated in IBD Enteroids and Downregulated in IBD Colonoids and Vice Versa) between IBD Enteroids and Colonoids Following LPS Stimulation | ||||
|---|---|---|---|---|
| Probe Set ID | Gene Description | Gene Symbol | LPS Treated IBD Colonoids vs. Control IBD Colonoids (Contrast 3) (log2 M) | LPS Treated IBD Enteroids vs. Control IBD Enteroids (Contrast 2) (log2 M) |
| Cfa.11069.1.A1_s_at | Splicing factor 3a subunit 1 | SF3A1 | 0.39123732 | −0.689723 |
| Cfa.12226.1.A1_at | Double-headed protease inhibitor, submandibular gland | LOC111092171 | 0.13751692 | −0.3472223 |
| Cfa.6267.3.S1_s_at | Cysteine rich protein 1 | CRIP1 | 0.43971334 | −0.3231234 |
| Cfa.758.1.S1_at | Annexin A1 | ANXA1 | 0.57352154 | −0.2534974 |
| Cfa.1341.1.S1_s_at | Integral membrane protein 2B | ITM2B | 0.09784959 | −0.2300856 |
| Cfa.11085.1.A1_at | Regulator of G-protein signaling 2 | RGS2 | 0.40545754 | −0.2130524 |
| Cfa.3290.1.S1_at | Kruppel-like factor 6 | KLF6 | 0.50830344 | −0.2017464 |
| CfaAffx.22128.1.S1_at | S100 calcium binding protein P | S100P | 0.17803743 | −0.1172426 |
| Cfa.5123.1.A1_at | Eukaryotic translation initiation factor 3, subunit F | EIF3F | 0.20471796 | −0.1131341 |
| Cfa.14421.1.S1_at | Guanine nucleotide binding protein (G protein), gamma 5 | GNG5 | 0.22490961 | −0.1044874 |
| Cfa.415.1.S1_at | Catenin (cadherin-associated protein), beta 1 | CTNNB1 | 0.09870051 | −0.0672268 |
| CfaAffx.5204.1.S1_s_at | Cytochrome c, somatic | CYCS | −0.3244678 | 0.117936 |
| CfaAffx.17908.1.S1_s_at | Mitochondrial import receptor subunit TOM20 homolog | TOMM20 | −0.6786731 | 0.18335565 |
| Cfa.9946.1.S1_at | General transcription factor IIA, 2 | GTF2A2 | −0.4167318 | 0.19831684 |
| CfaAffx.727.1.S1_x_at | FAM168A, family with sequence similarity 168, member A | FAM168A | −0.4299426 | 0.20356136 |
| CfaAffx.16356.1.S1_s_at | LOC608756, similar to 60 kDa heat shock protein, mitochondrial precursor (Hsp60) (60 kDa chaperonin) (CPN60) (Heat shock protein 60) (HSP-60) (Mitochondrial matrix protein P1) (P60 lymphocyte protein) (HuCHA60) | HSPD1 | −0.5398836 | 0.21506239 |
| Cfa.1128.1.S1_at | KPNA2, karyopherin alpha 2 (RAG cohort 1, importin alpha 1) | KPNA2 | −0.2790694 | 0.24160302 |
| Cfa.6212.1.A1_at | Mitochondrial 28S ribosomal protein S21 | MRPS21 | −0.5480801 | 0.40259764 |
| Cfa.12820.2.A1_a_at | Cysteine-rich, angiogenic inducer, 61 | CYR61 | −0.574112 | 0.60011614 |
| CfaAffx.386.1.S1_x_at | 40S Ribosomal protein S20 | RPS20 | −0.7323368 | 0.70095917 |
| Gene Ontology (GO) Analysis of DEGs (Annotated for Biological Process) | ||||
| GO-Terms | Genes | |||
| Cellular metabolic process (14%) | RPS20, CYCS, EIF3F, MRPS21, LOC111092171, ANXA1, ITM2B, GTF2A2, SF3A1, HSPD1 | |||
| Primary (nitrogen compound, organic substance) metabolic process (13%) | RPS20, EIF3F, MRPS21, LOC111092171, ANXA1, ITM2B, GTF2A2, SF3A1, HSPD1 | |||
| Biosynthetic process (7%) | RPS20, EIF3F, MRPS21, ITM2B, GTF2A2 | |||
| Regulation of cellular process (7%) | LOC111092171, ANXA1, GNG5, ITM2B, HSPD1 | |||
| Regulation of metabolic process/negative regulation of cellular process (6%) | LOC111092171, ANXA1, ITM2B, HSPD1 | |||
| Macromolecule localization and establishment (4%) | TOMM20, ANXA1, KPNA2 | |||
| Cell communication, signal transduction, cellular response to stimulus (4%) | ANXA1, GNG5, HSPD1 | |||
| Cellular component organization or biogenesis (4%) | TOMM20, ANXA1, SF3A1 | |||
| Regulation of molecular function (4%) | LOC111092171, ANXA1, HSPD1 | |||
| Negative regulation of metabolic process (4%) | LOC111092171, ANXA1, ITM2B | |||
| Cell death (4%) | CYCS, ANXA1, HSPD1 | |||
| Cell population proliferation, regulation of multicellular organismal process, cytokine production, leukocyte activation, regulation of biological quality, positive regulation of immune system process, response to stress, regulation of immune system process, immune effector process, regulation of response to stimulus, cell activation, immune response, cell adhesion, positive regulation of cellular process, multicellular organism development, positive regulation of multicellular organismal process, immune system development, positive regulation of metabolic process, anatomical structure development (3%) | ANXA1, HSPD1 | |||
| Regulation of hydrolase activity (3%) | LOC111092171, HSPD1 | |||
| Response to chemical, positive regulation of response to stimulus (3%) | ANXA1, HSPD1 | |||
| Negative regulation of catalytic activity (3%) | LOC111092171, ANXA1 | |||
| Cellular localization (3%) | TOMM20, KPNA2 | |||
| Transmembrane transport (1%) | TOMM20 | |||
| Response to endogenous stimulus/external stimulus, negative regulation of transport/response to stimulus/immune system process/multicellular organismal process (1%) | ANXA1 | |||
| Cell motility, tissue migration, movement of cell or subcellular component, anatomical structure formation involved in morphogenesis, actin filament-based process, cell cycle process, cell–cell signaling (1%) | ANXA1 | |||
| Developmental growth, cellular developmental process, export from cell, Vesicle-mediated transport, positive regulation of locomotion/transport (1%) | ANXA1 | |||
| Taxis, localization of cell, leukocyte migration/homeostasis, myeloid cell homeostasis (1%) | ANXA1 | |||
| Regulation of developmental process/localization/locomotion/signaling, positive/negative regulation of developmental process (1%) | ANXA1 | |||
| Oxidation–reduction process (1%) | CYCS | |||
| Production of molecular mediator of immune response, somatic diversification of immune receptors (1%) | HSPD1 | |||
| Protein folding, positive regulation of catalytic activity (1%) | HSPD1 | |||
| Biological process involved in symbiotic interaction, response to abiotic/biotic stimulus (1%) | HSPD1 | |||
| Gene Ontology (GO) Analysis of DEGs (Annotated for Molecular Function) | ||||
| GO-Terms | Genes | |||
| Nucleic acid binding (15%) | RPS20, EIF3F, SF3A1, HSPD1 | |||
| Cation binding (12%) | CYCS, ANXA1, S100P | |||
| Enzyme inhibitor activity (8%) | LOC111092171, ANXA1 | |||
| Nucleotide/ribonucleotide/nucleoside phosphate/anion binding (8%) | ITM2B, HSPD1 | |||
| Peptide binding (8%) | TOMM20, ITM2B | |||
| Ion transmembrane transporter activity (4%) | TOMM20 | |||
| Phospholipid binding, calcium-dependent protein binding (4%) | ANXA1 | |||
| Electron transfer activity, tetrapyrrole binding (4%) | CYCS | |||
| Translation initiation factor binding, translation factor activity, RNA binding (4%) | EIF3F | |||
| G-protein beta-subunit binding (4%) | GNG5 | |||
| Lipopolysaccharide/apolipoprotein binding (4%) | HSPD1 | |||
| Protein–lipid complex binding, enzyme binding, chaperone binding (4%) | HSPD1 | |||
| p53 binding (4%) | HSPD1 | |||
| Nuclear import signal receptor activity (4%) | KPNA2 | |||
| Peptidase regulator activity (4%) | LOC111092171 | |||
| Signaling receptor binding (4%) | S100P | |||
| Active/amide/protein transmembrane transporter activity (4%) | TOMM20 | |||
| Unfolded protein binding (4%) | TOMM20 | |||
| Gene Ontology (GO) Analysis of DEGs (Annotated for Cellular Component) | ||||
| GO-Terms | Genes | |||
| Intracellular organelle (16%) | RPS20, TOMM20, CYCS, MRPS21, ANXA1, ITM2B, GTF2A2, SF3A1, HSPD1 | |||
| Membrane-bounded organelle (13%) | TOMM20, CYCS, ANXA1, ITM2B, GTF2A2, SF3A1, HSPD1 | |||
| Intracellular organelle lumen (7%) | CYCS, ANXA1, GTF2A2, HSPD1 | |||
| Plasma membrane (7%) | ANXA1, ITM2B, GNG5, HSPD1 | |||
| Mitochondrion (5%) | TOMM20, CYCS, HSPD1 | |||
| Intracellular non-membrane-bounded organelle (5%) | RPS20, MRPS21, ANXA1 | |||
| Intracellular vesicle, cytoplasmic vesicle (5%) | ANXA1, ITM2B, HSPD1 | |||
| Integral component of membrane (5%) | TOMM20, ITM2B, HSPD1 | |||
| Organelle envelope (4%) | TOMM20, CYCS | |||
| Organelle membrane (4%) | TOMM20, ITM2B | |||
| Extracellular organelle, plasma membrane region, endosome, extracellular exosome (4%) | ANXA1, HSPD1 | |||
| Intrinsic component of organelle membrane (4%) | TOMM20, ITM2B | |||
| Extrinsic component of plasma membrane (4%) | ANXA1, GNG5 | |||
| Plasma membrane bounded cell projection, cilium, apical plasma membrane, external side of plasma membrane (2%) | ANXA1 | |||
| Supramolecular polymer (2%) | ANXA1 | |||
| Plasma membrane protein complex, extrinsic component of cytoplasmic side of plasma membrane, GTPase complex (2%) | GNG5 | |||
| Nuclear DNA-directed RNA polymerase complex, RNA polymerase complex, RNA polymerase II (holoenzyme), RNA polymerase II transcription regulator complex, transferase complex (2%) | GTF2A2 | |||
| Lipopolysaccharide receptor complex, secretory granule, Clathrin-coated pit (2%) | HSPD1 | |||
| Golgi apparatus (2%) | ITM2B | |||
| Ribosomal subunit (2%) | RPS20 | |||
| Spliceosomal complex, small nuclear ribonucleoprotein complex (2%) | SF3A1 | |||
| Outer membrane, Mitochondria-associated endoplasmic reticulum membrane, outer mitochondrial membrane protein complex (2%) | TOMM20 | |||
| Probe Set ID | Gene Description | Gene Symbol | LPS Treated vs. Control Tumor-Adjacent Organoids (Log-Ratio M) | LPS Treated vs. Control IBD Colonoids (Log-Ratio M) | LPS Treated vs. Control IBD Enteroids (Log-Ratio M) |
|---|---|---|---|---|---|
| Cfa.6267.3.S1_s_at | Cysteine rich protein 1 (CRIP1) | CRIP1 | −0.238149286 | 0.43971334 | −0.3231234 |
| Cfa.758.1.S1_at | Annexin A1 | ANXA1 | 0.309584226 | 0.57352154 | −0.2534974 |
| Cfa.11085.1.A1_at | Regulator of G-protein signaling 2 | RGS2 | −0.302506821 | 0.40545754 | −0.2130524 |
| Group Comparison * | Probe Set ID | Symbol | Name | Pathway |
|---|---|---|---|---|
| LPS Treated IBD sunek Colonoids vs. Control IBD Colonoids | CfaAffx.13209.1.S1_s_at | CP | Ceruloplasmin [EC:1.16.3.1] | Porphyrin metabolism, ferroptosis |
| Cfa.6996.1.A1_at | ENPP6 | Ectonucleotide pyrophosphatase/phosphodiesterase family member 6 [EC:3.1.4.-] | Ether lipid metabolism | |
| Control IBD Colonoids vs. Control IBD Enteroids | CfaAffx.13785.1.S1_at, Cfa.6413.1.A1_at | CA1 | Carbonic anhydrase [EC:4.2.1.1] | Nitrogen metabolism |
| Cfa.20798.1.S1_at, Cfa.3774.1.A1_s_at | ANPEP (LOC112653425) | Aminopeptidase N [EC:3.4.11.2] | Glutathione metabolism, renin–angiotensin system, hematopoietic cell lineage | |
| CfaAffx.4748.1.S1_at | BAAT | Bile acid-CoA:amino acid N-acyltransferase [EC:2.3.1.65 3.1.2.2] | Primary bile acid biosynthesis, taurine and hypotaurine metabolism, Biosynthesis of unsaturated fatty acids, Peroxisome, Bile secretion | |
| Control IBD Enteroids vs. Control Tumor Enteroids | CfaAffx.13785.1.S1_at, Cfa.6413.1.A1_at | CA1 | Carbonic anhydrase [EC:4.2.1.1] | Nitrogen metabolism |
| Cfa.20798.1.S1_at, Cfa.3774.1.A1_s_at | ANPEP (LOC112653425) | Aminopeptidase N [EC:3.4.11.2] | Glutathione metabolism, renin–angiotensin system, hematopoietic cell lineage | |
| Cfa.20396.1.S1_at | BACE2 | Beta-site APP-cleaving enzyme 2 (memapsin 1) [EC:3.4.23.45] | Alzheimer’s disease | |
| CfaAffx.4748.1.S1_at | BAAT | Bile acid-CoA:amino acid N-acyltransferase [EC:2.3.1.65 3.1.2.2] | Primary bile acid biosynthesis, taurine and hypotaurine metabolism, biosynthesis of unsaturated fatty acids, peroxisome, bile secretion | |
| LPS treated IBD colonoids vs. LPS treated IBD enteroids | CfaAffx.13785.1.S1_at, Cfa.6413.1.A1_at | CA1 | Carbonic anhydrase [EC:4.2.1.1] | Nitrogen metabolism |
| Cfa.18640.1.S1_at | ACSL5 | Acyl-CoA synthetase long chain family member 5 [EC:6.2.1.3] | Fatty acid biosynthesis, fatty acid degradation, fatty acid metabolism, PPAR signaling pathway, ferroptosis, Thermogenesis, adipocytokine signaling pathway | |
| Cfa.6996.1.A1_at | ENPP6 | Ectonucleotide pyrophosphatase/phosphodiesterase family member 6 [EC:3.1.4.-] | Ether lipid metabolism | |
| CfaAffx.4748.1.S1_at | BAAT | Bile acid-CoA:amino acid N-acyltransferase [EC:2.3.1.65 3.1.2.2] | Primary bile acid biosynthesis, taurine and hypotaurine metabolism, biosynthesis of unsaturated fatty acids, peroxisome, bile secretion | |
| LPS treated IBD enteroids vs. LPS treated tumor enteroids | CfaAffx.13785.1.S1_at, Cfa.6413.1.A1_at | CA1 | Carbonic anhydrase [EC:4.2.1.1] | Nitrogen metabolism |
| Cfa.18640.1.S1_at | ACSL5 | Acyl-CoA synthetase long chain family member 5 [EC:6.2.1.3] | Fatty acid biosynthesis, fatty acid degradation, fatty acid metabolism, PPAR signaling pathway, ferroptosis, thermogenesis, adipocytokine signaling pathway | |
| Cfa.6996.1.A1_at | ENPP6 | Ectonucleotide pyrophosphatase/phosphodiesterase family member 6 [EC:3.1.4.-] | Ether lipid metabolism | |
| CfaAffx.4748.1.S1_at | BAAT | Bile acid-CoA:amino acid N-acyltransferase [EC:2.3.1.65 3.1.2.2] | Primary bile acid biosynthesis, taurine and hypotaurine metabolism, biosynthesis of unsaturated fatty acids, peroxisome, bile secretion | |
| Common genes between IBD enteroids and colonoids following LPS stimulation | Cfa.2878.1.A1_s_at | CP | Ceruloplasmin [EC:1.16.3.1] | Porphyrin metabolism, ferroptosis |
| CfaAffx.21951.1.S1_s_at | EEF1A1 | Eukaryotic translation elongation factor 1 alpha 1 (eEF1A1) | Nucleocytoplasmic transport, legionellosis, leishmaniasis | |
| CfaAffx.2163.1.S1_at | TAP2 (ABCB3) | ATP-binding cassette, subfamily B (MDR/TAP), member 3 [EC:7.4.2.14] | ABC transporters, phagosome, antigen processing and presentation, human cytomegalovirus infection, Herpes simplex virus 1 infection, Epstein–Barr virus infection, human immunodeficiency virus 1 infection, primary immunodeficiency | |
| CfaAffx.17868.1.S1_at | GPX1 | Glutathione peroxidase 1 [EC 1.11.1.9] | Glutathione metabolism, arachidonic acid metabolism |
Publisher’s Note: MDPI stays neutral with regard to jurisdictional claims in published maps and institutional affiliations. |
© 2022 by the authors. Licensee MDPI, Basel, Switzerland. This article is an open access article distributed under the terms and conditions of the Creative Commons Attribution (CC BY) license (https://creativecommons.org/licenses/by/4.0/).
Share and Cite
Sahoo, D.K.; Borcherding, D.C.; Chandra, L.; Jergens, A.E.; Atherly, T.; Bourgois-Mochel, A.; Ellinwood, N.M.; Snella, E.; Severin, A.J.; Martin, M.; et al. Differential Transcriptomic Profiles Following Stimulation with Lipopolysaccharide in Intestinal Organoids from Dogs with Inflammatory Bowel Disease and Intestinal Mast Cell Tumor. Cancers 2022, 14, 3525. https://doi.org/10.3390/cancers14143525
Sahoo DK, Borcherding DC, Chandra L, Jergens AE, Atherly T, Bourgois-Mochel A, Ellinwood NM, Snella E, Severin AJ, Martin M, et al. Differential Transcriptomic Profiles Following Stimulation with Lipopolysaccharide in Intestinal Organoids from Dogs with Inflammatory Bowel Disease and Intestinal Mast Cell Tumor. Cancers. 2022; 14(14):3525. https://doi.org/10.3390/cancers14143525
Chicago/Turabian StyleSahoo, Dipak Kumar, Dana C. Borcherding, Lawrance Chandra, Albert E. Jergens, Todd Atherly, Agnes Bourgois-Mochel, N. Matthew Ellinwood, Elizabeth Snella, Andrew J. Severin, Martin Martin, and et al. 2022. "Differential Transcriptomic Profiles Following Stimulation with Lipopolysaccharide in Intestinal Organoids from Dogs with Inflammatory Bowel Disease and Intestinal Mast Cell Tumor" Cancers 14, no. 14: 3525. https://doi.org/10.3390/cancers14143525