
Multiphoton Microscopy Reveals DAPK1-Dependent Extracellular Matrix Remodeling in a Chorioallantoic Membrane (CAM) Model

 , , and
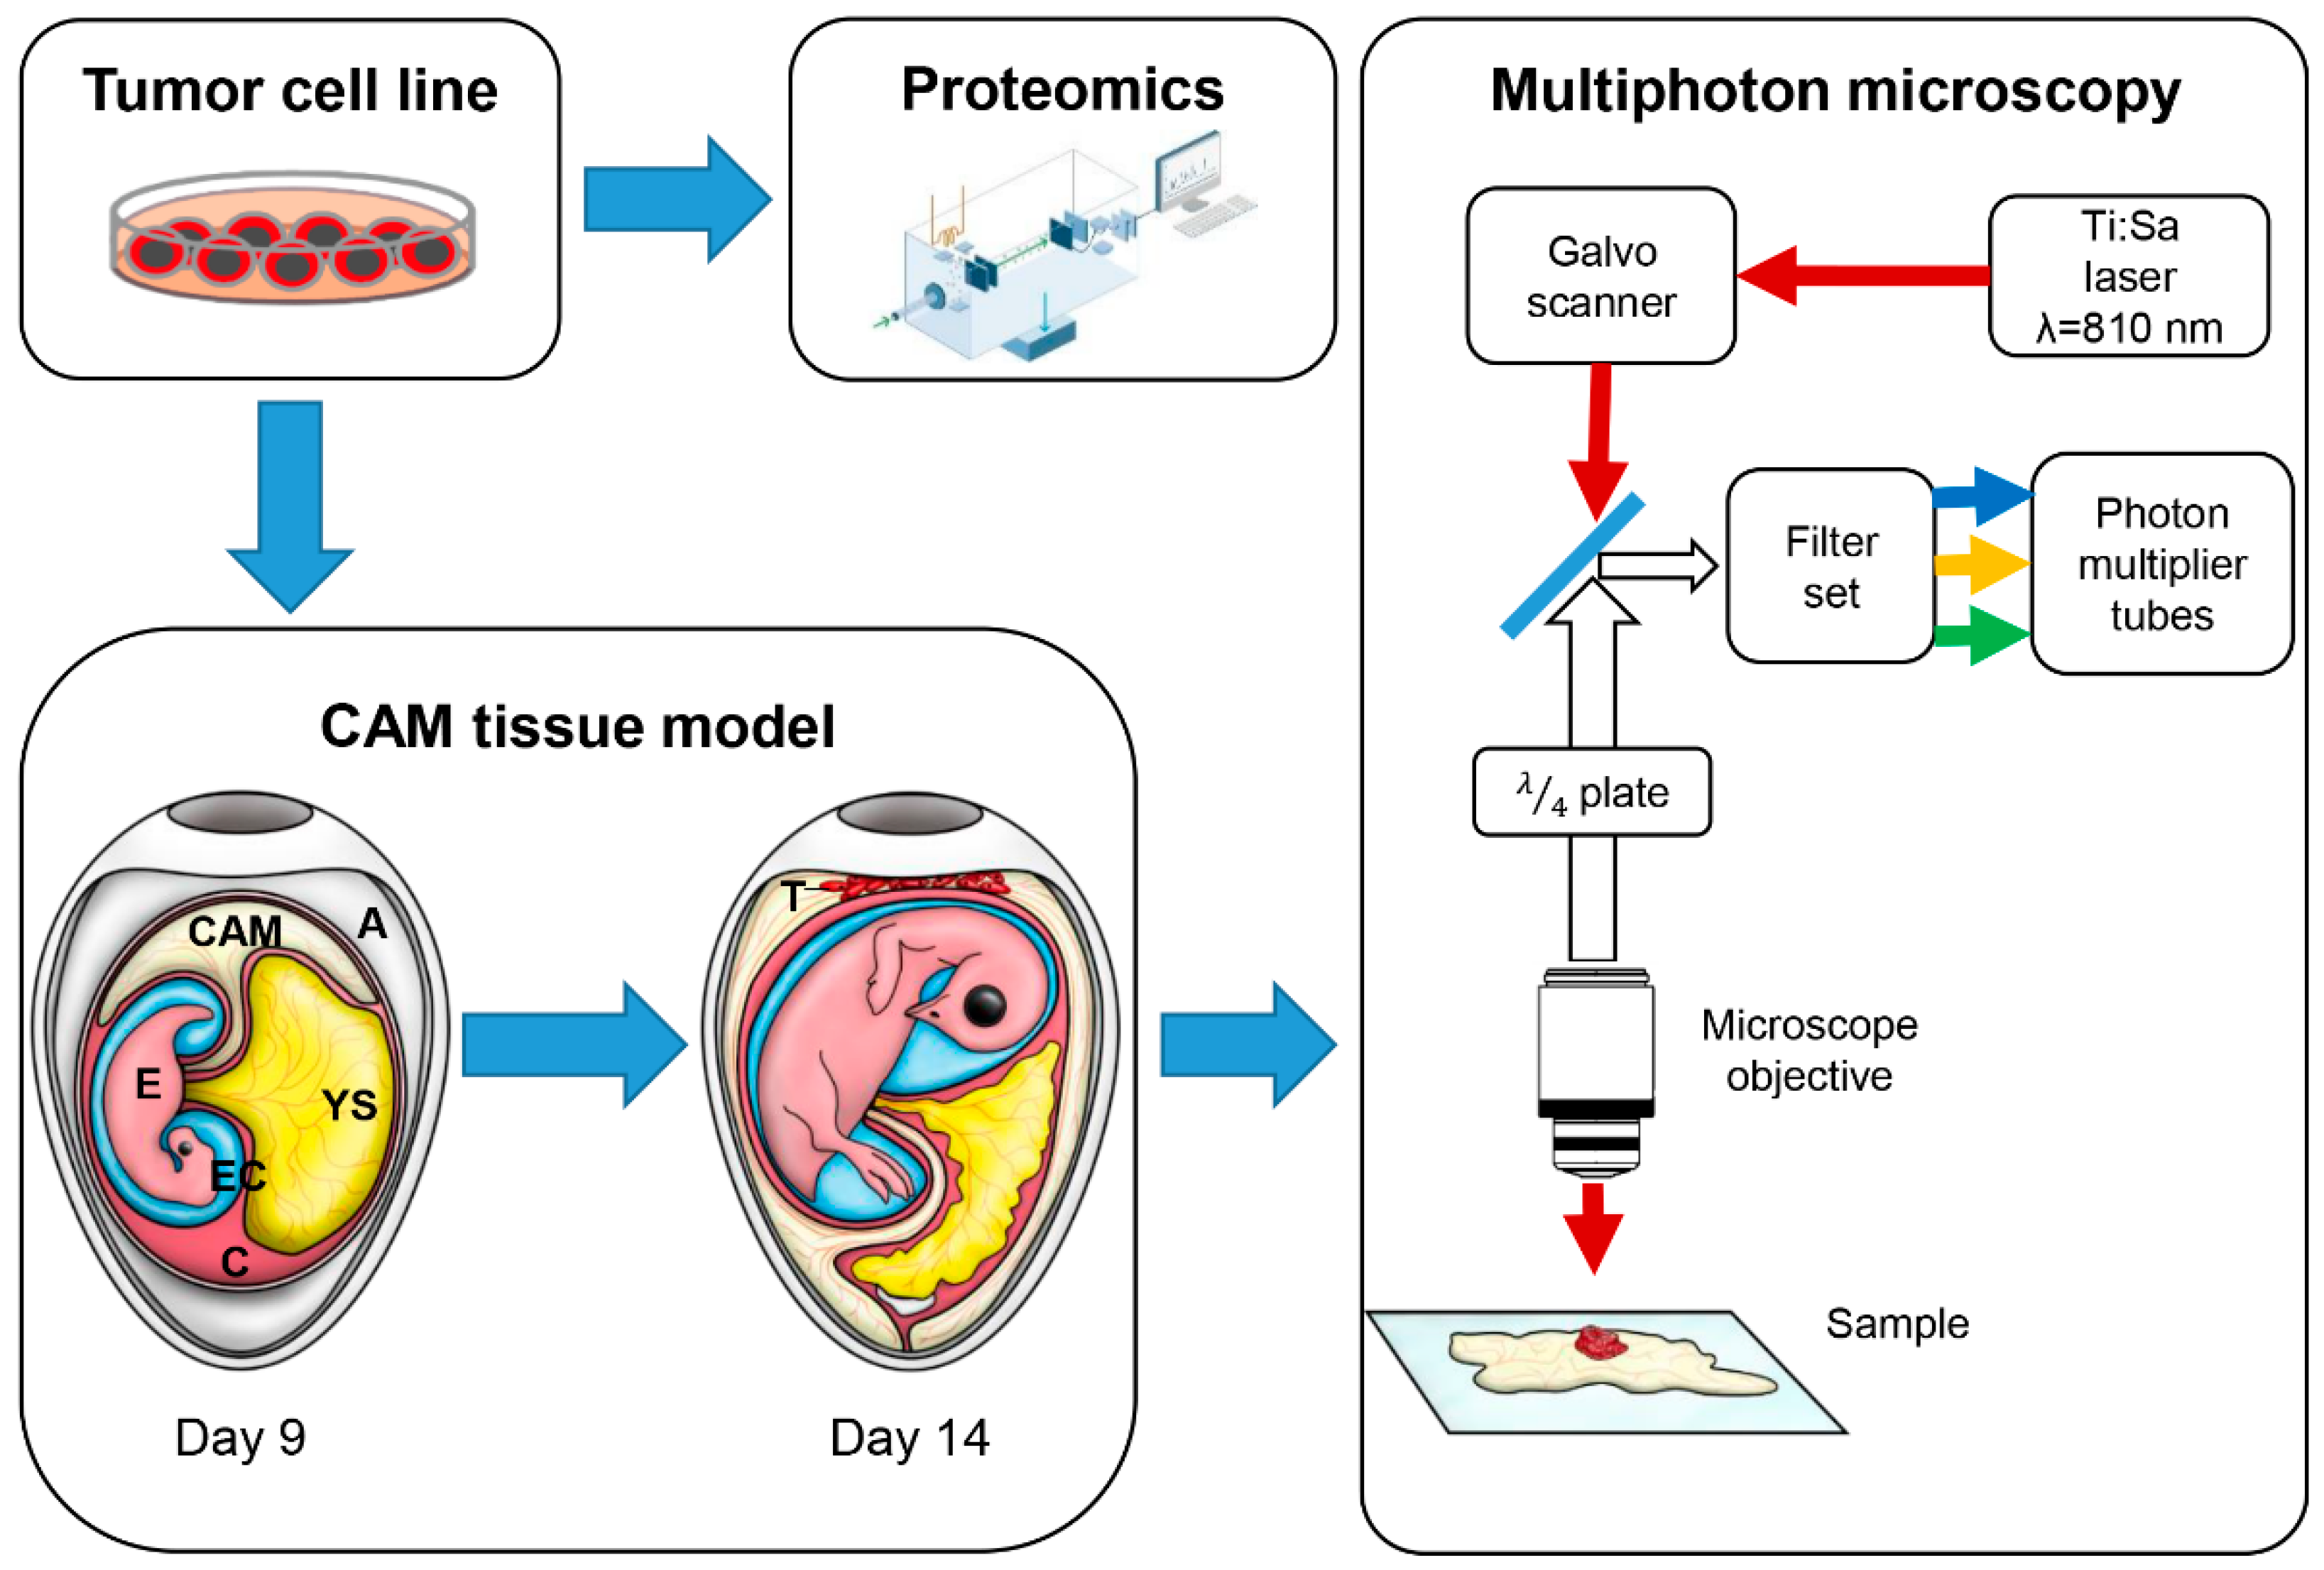
Abstract
:Simple Summary
Abstract
1. Introduction
2. Materials and Methods
2.1. Cell Lines and Cell Culture
2.2. Western Blot Analysis
2.3. Chicken CAM Assay
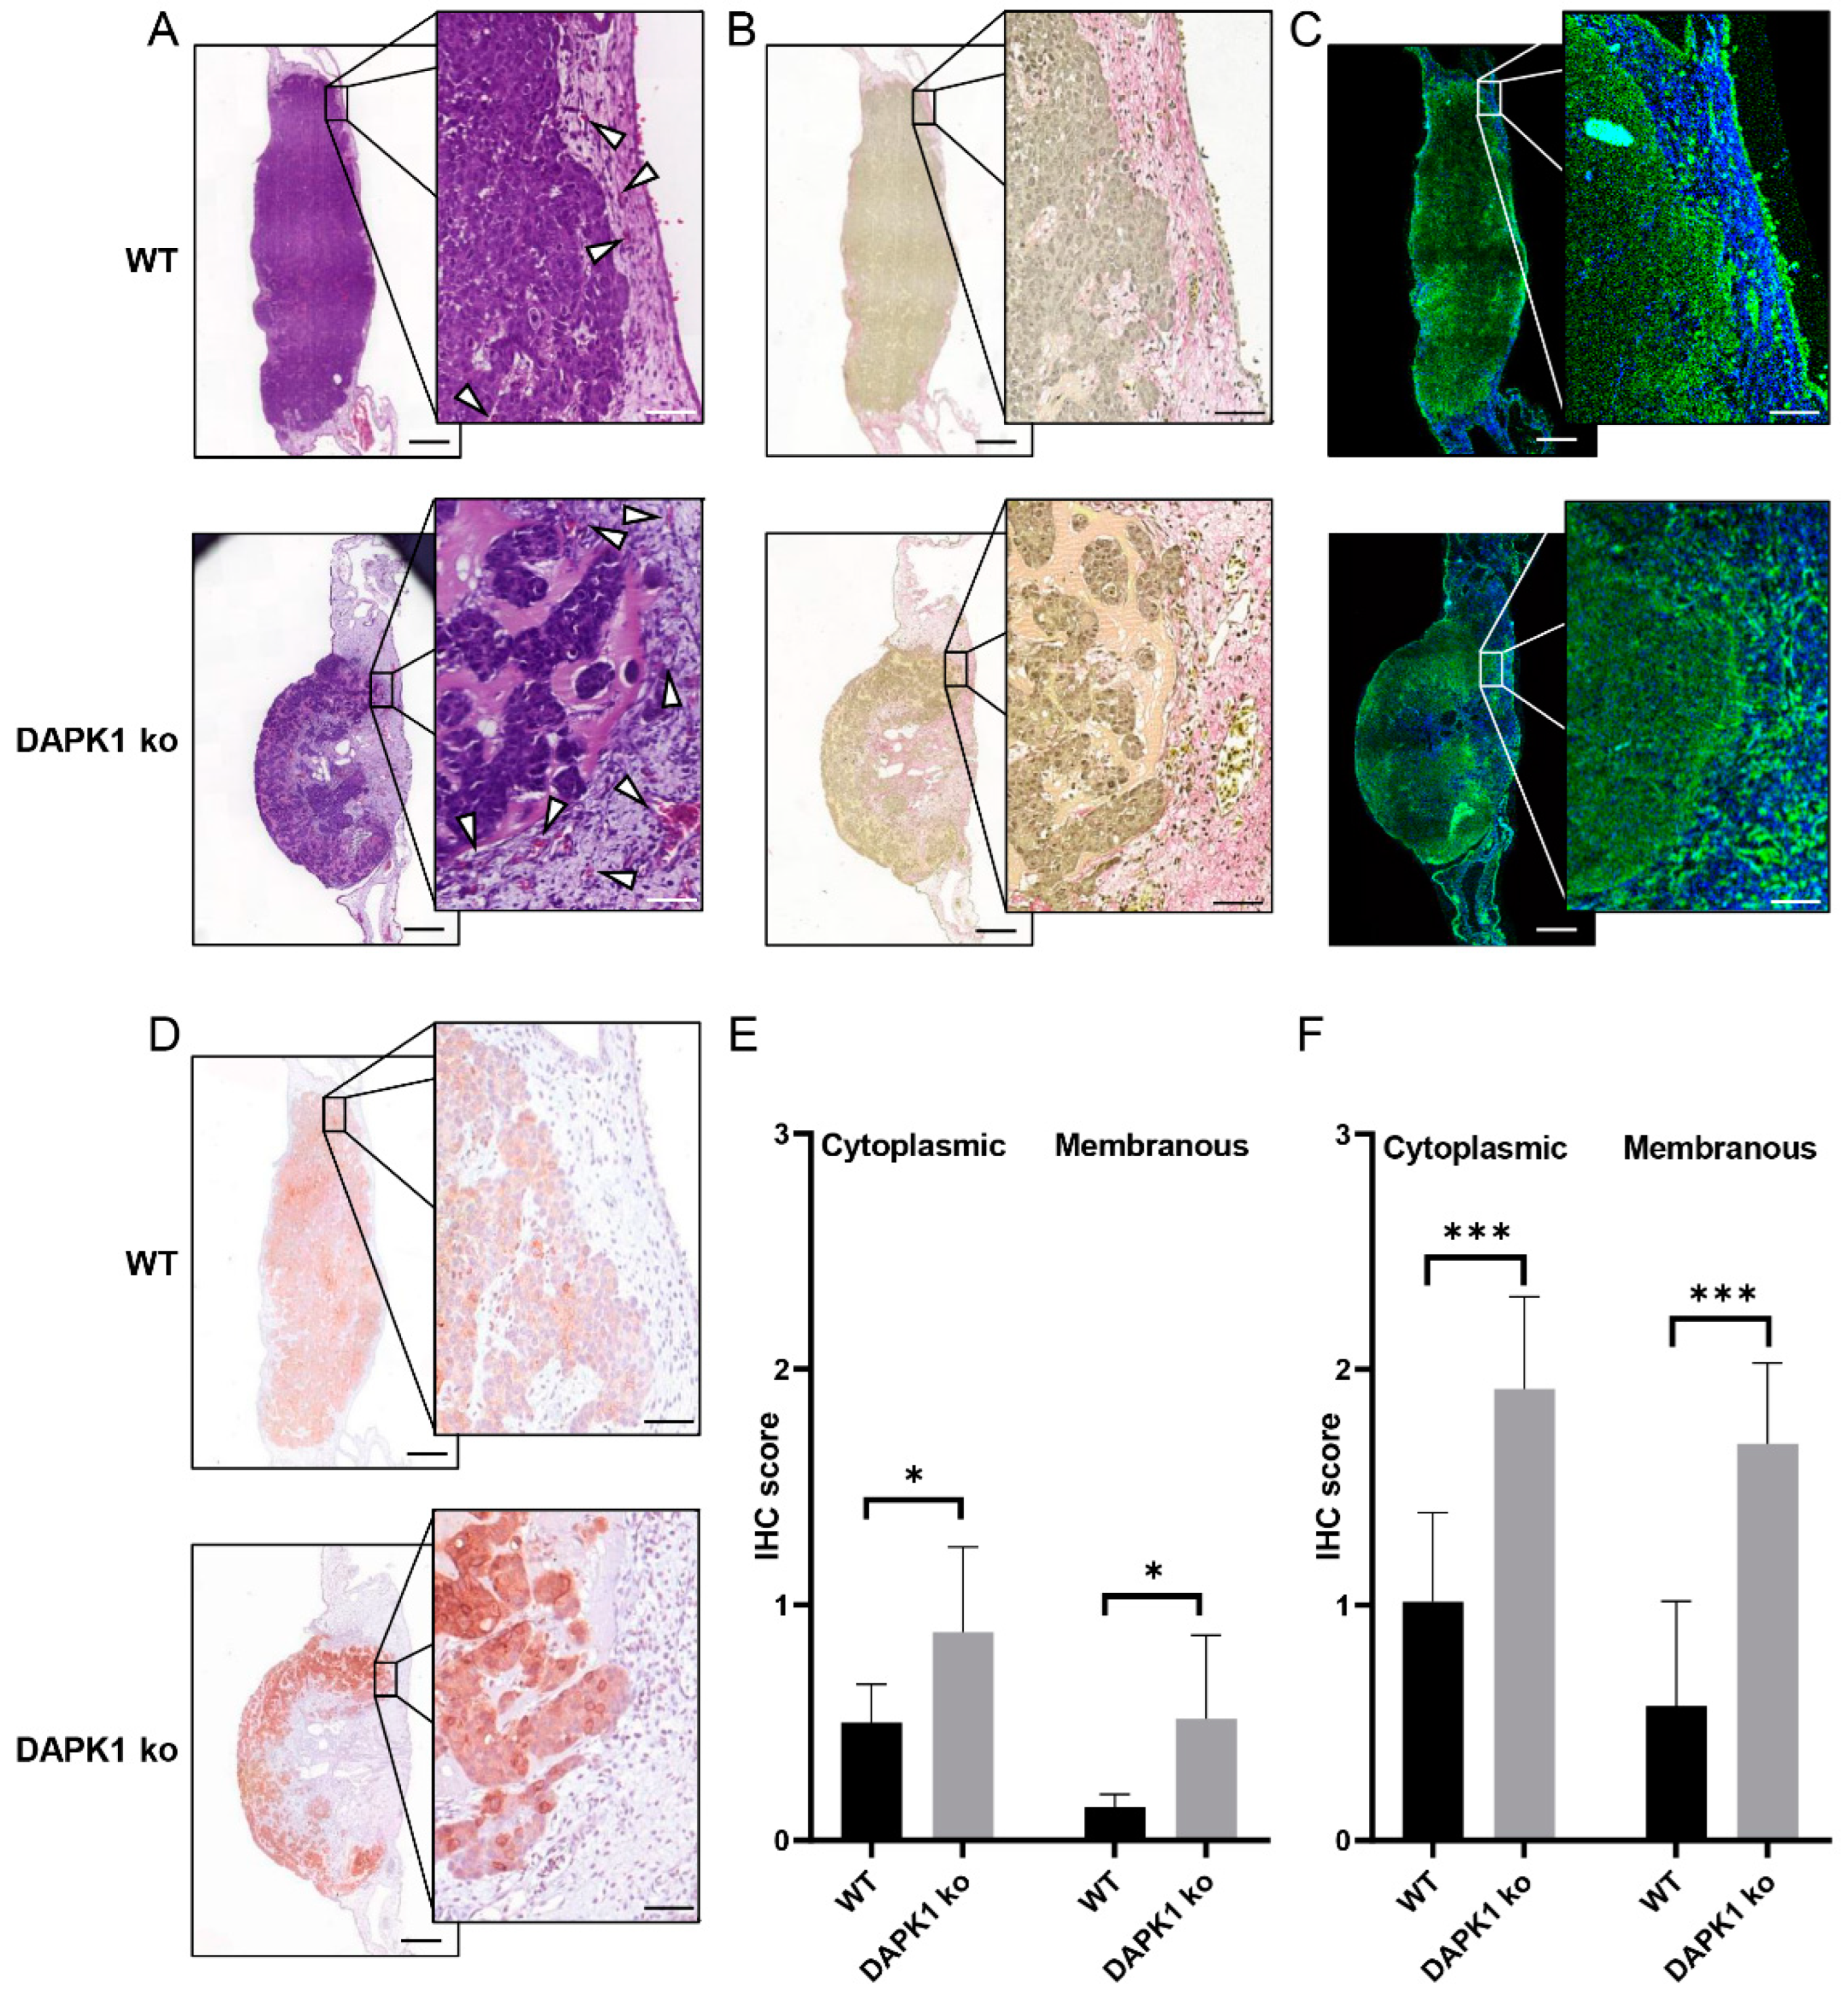
2.4. Histological Staining
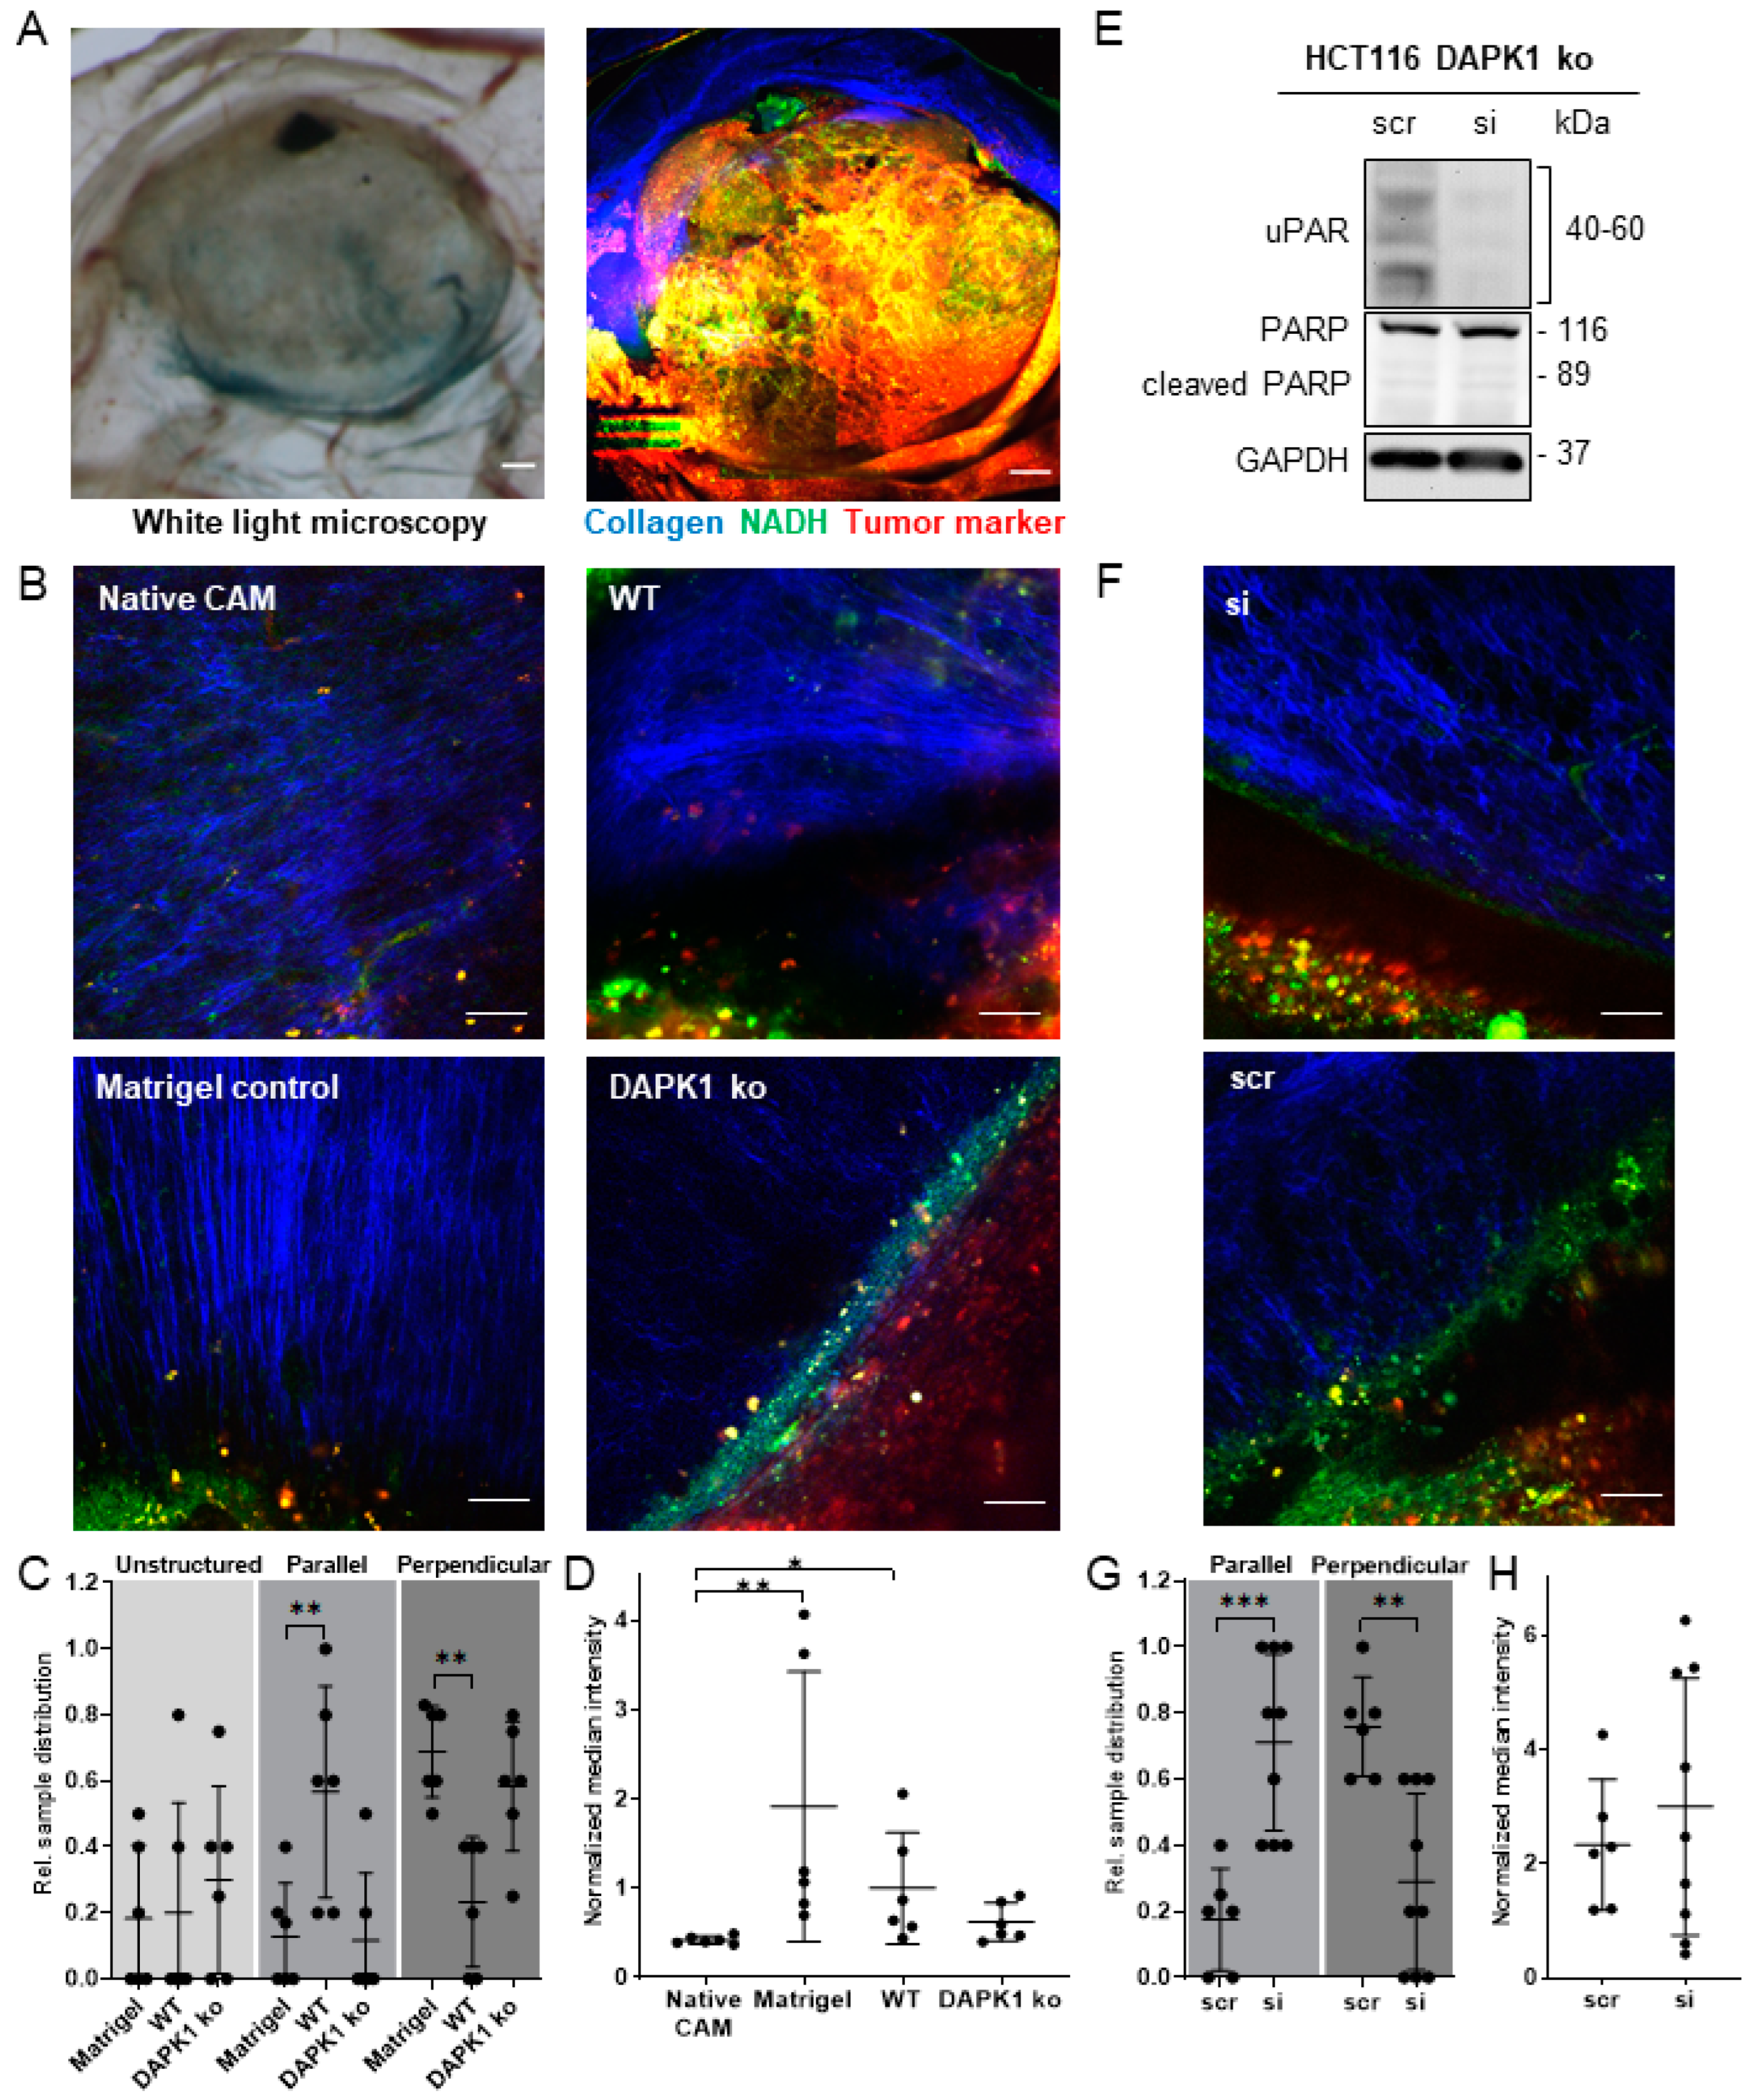
2.5. Ex Ovo Optical Imaging
2.6. In Ovo Imaging
2.7. Image Analysis/Morphometry
2.8. Protein Digestion
2.9. nLC-MS 2° Analysis
2.10. Mass Spectrometric Analysis for Proteomics
2.11. Bioinformatics
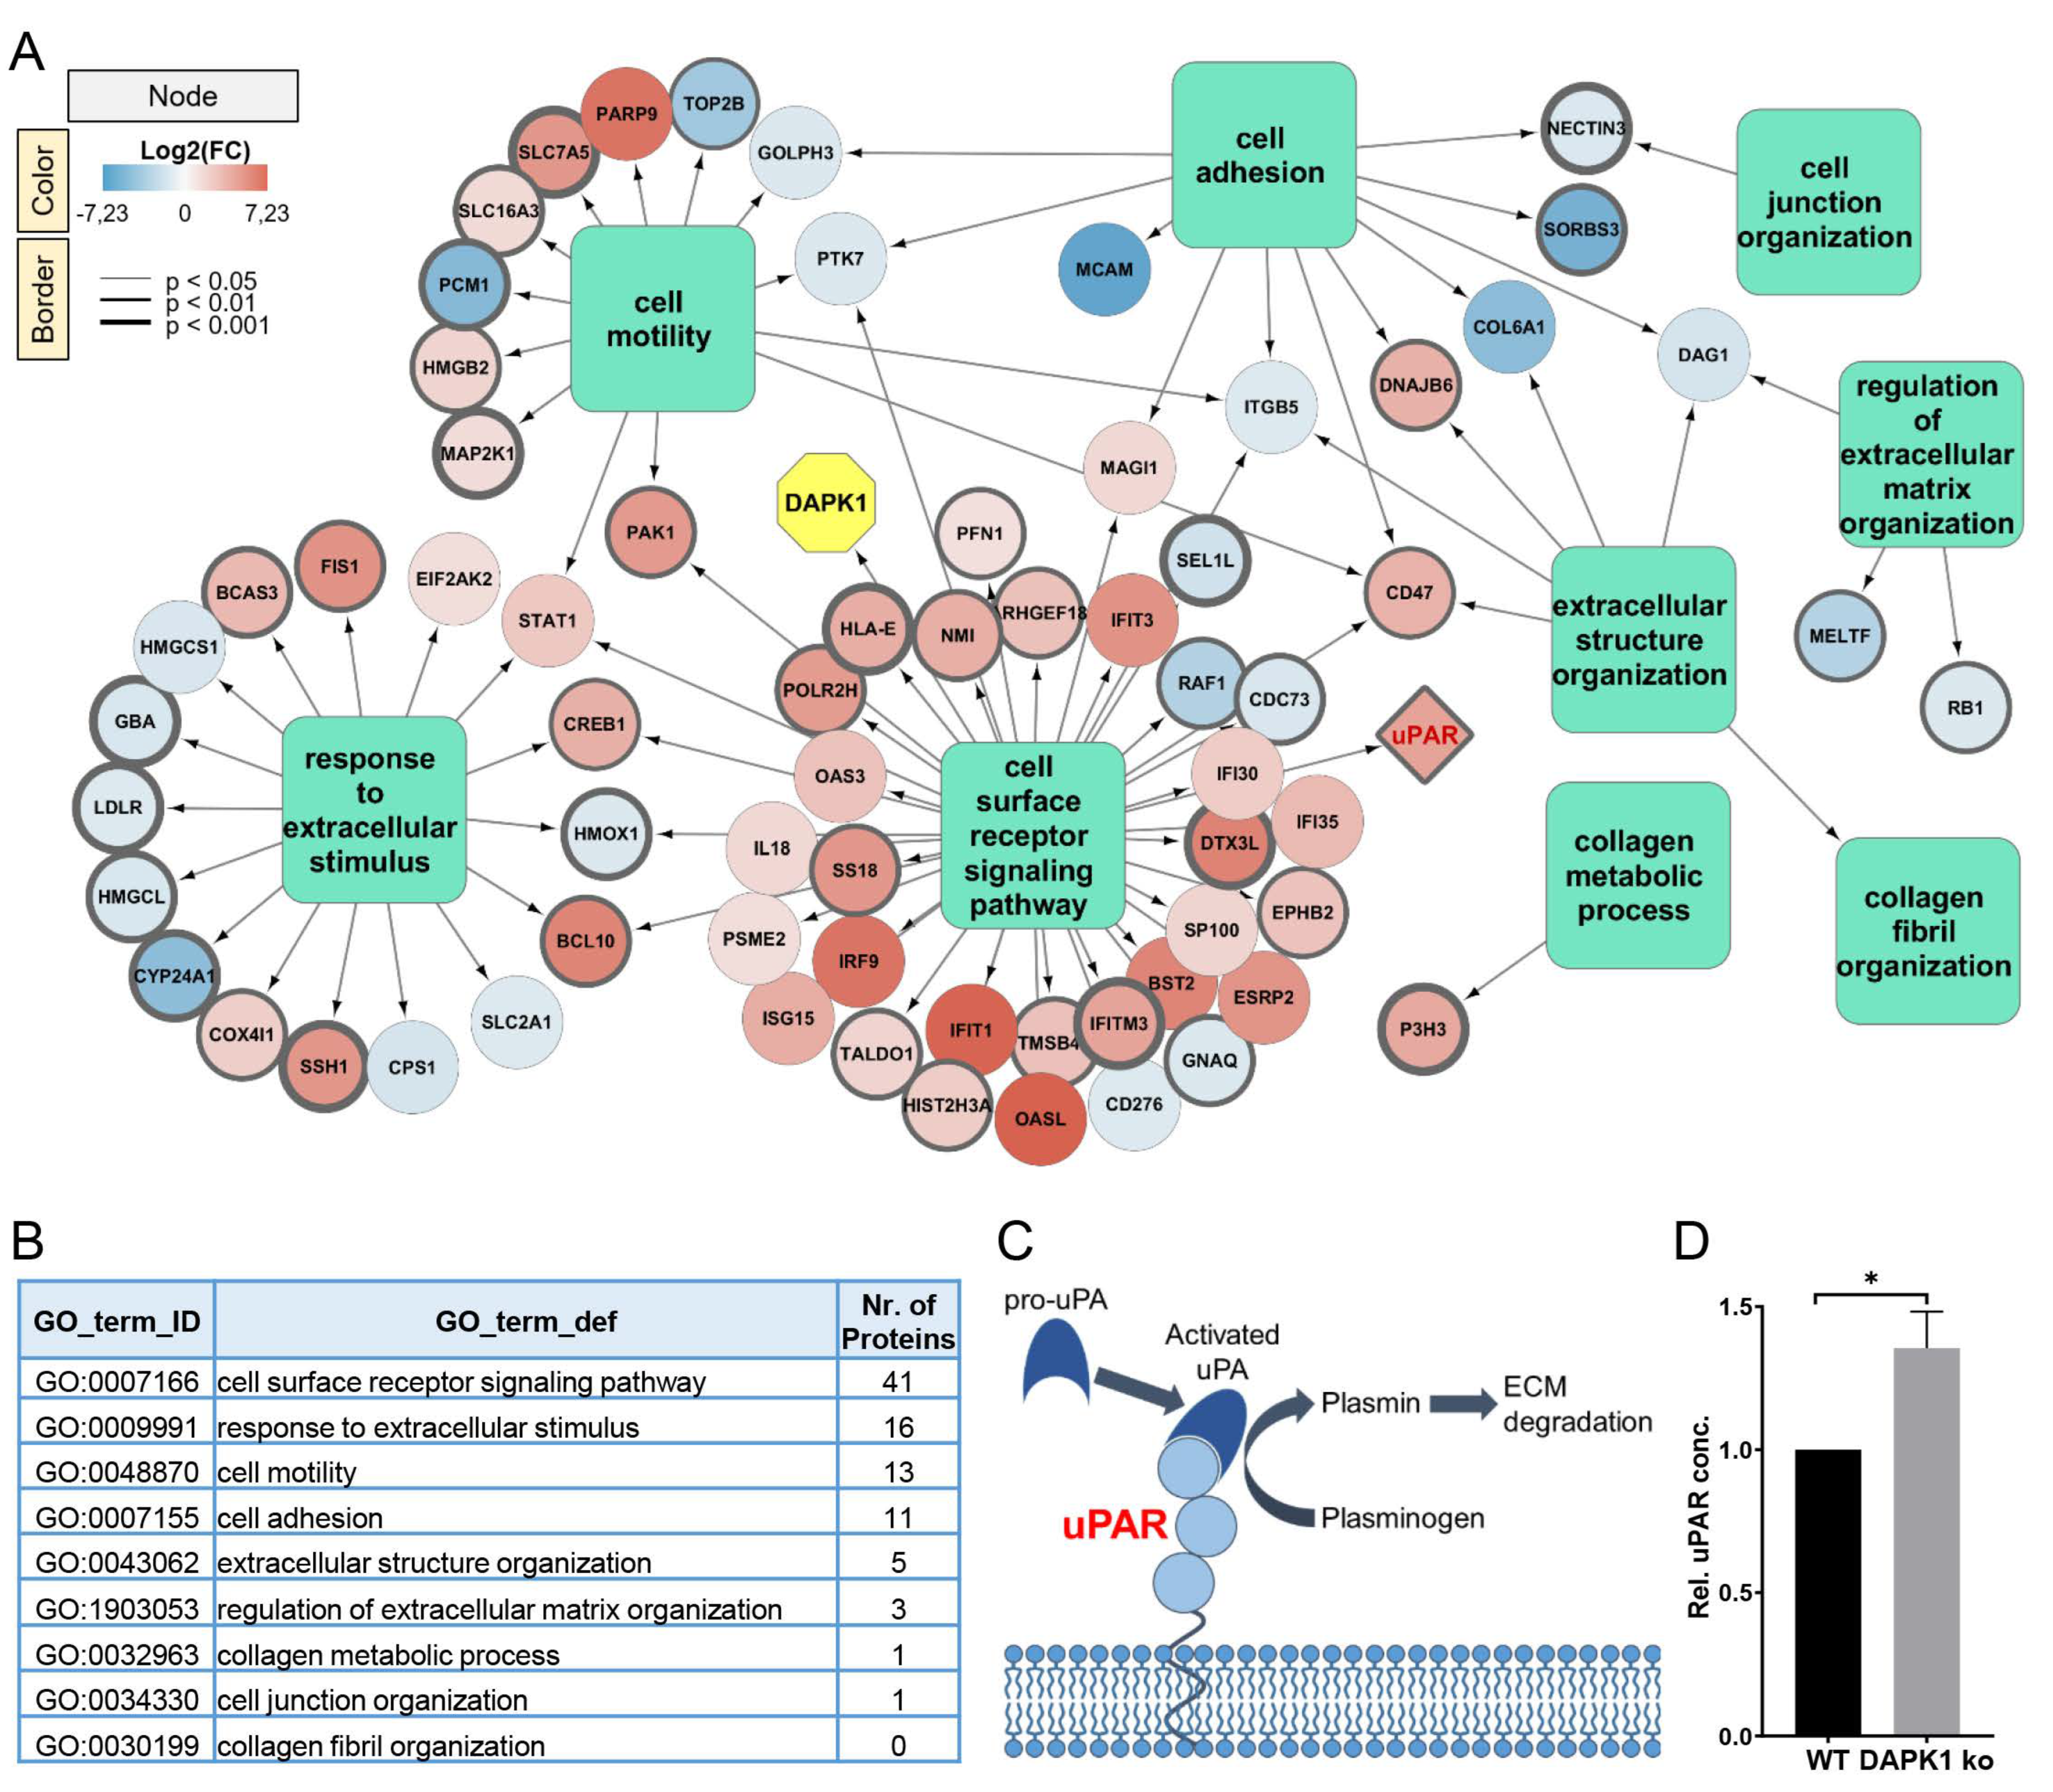
2.12. uPAR ELISA
2.13. Transient uPAR siRNA Transfection
2.14. D-Tumor Spheroid-Based Invasion Assay
2.15. Statistical Analysis
3. Results
3.1. Identification of ECM Remodelers in a Proteomic Analysis
3.2. Tumor Morphometry Using Conventional Histology and Multiphoton Microscopy
3.3. Quantitative Tumor Morphometry and Image Analysis
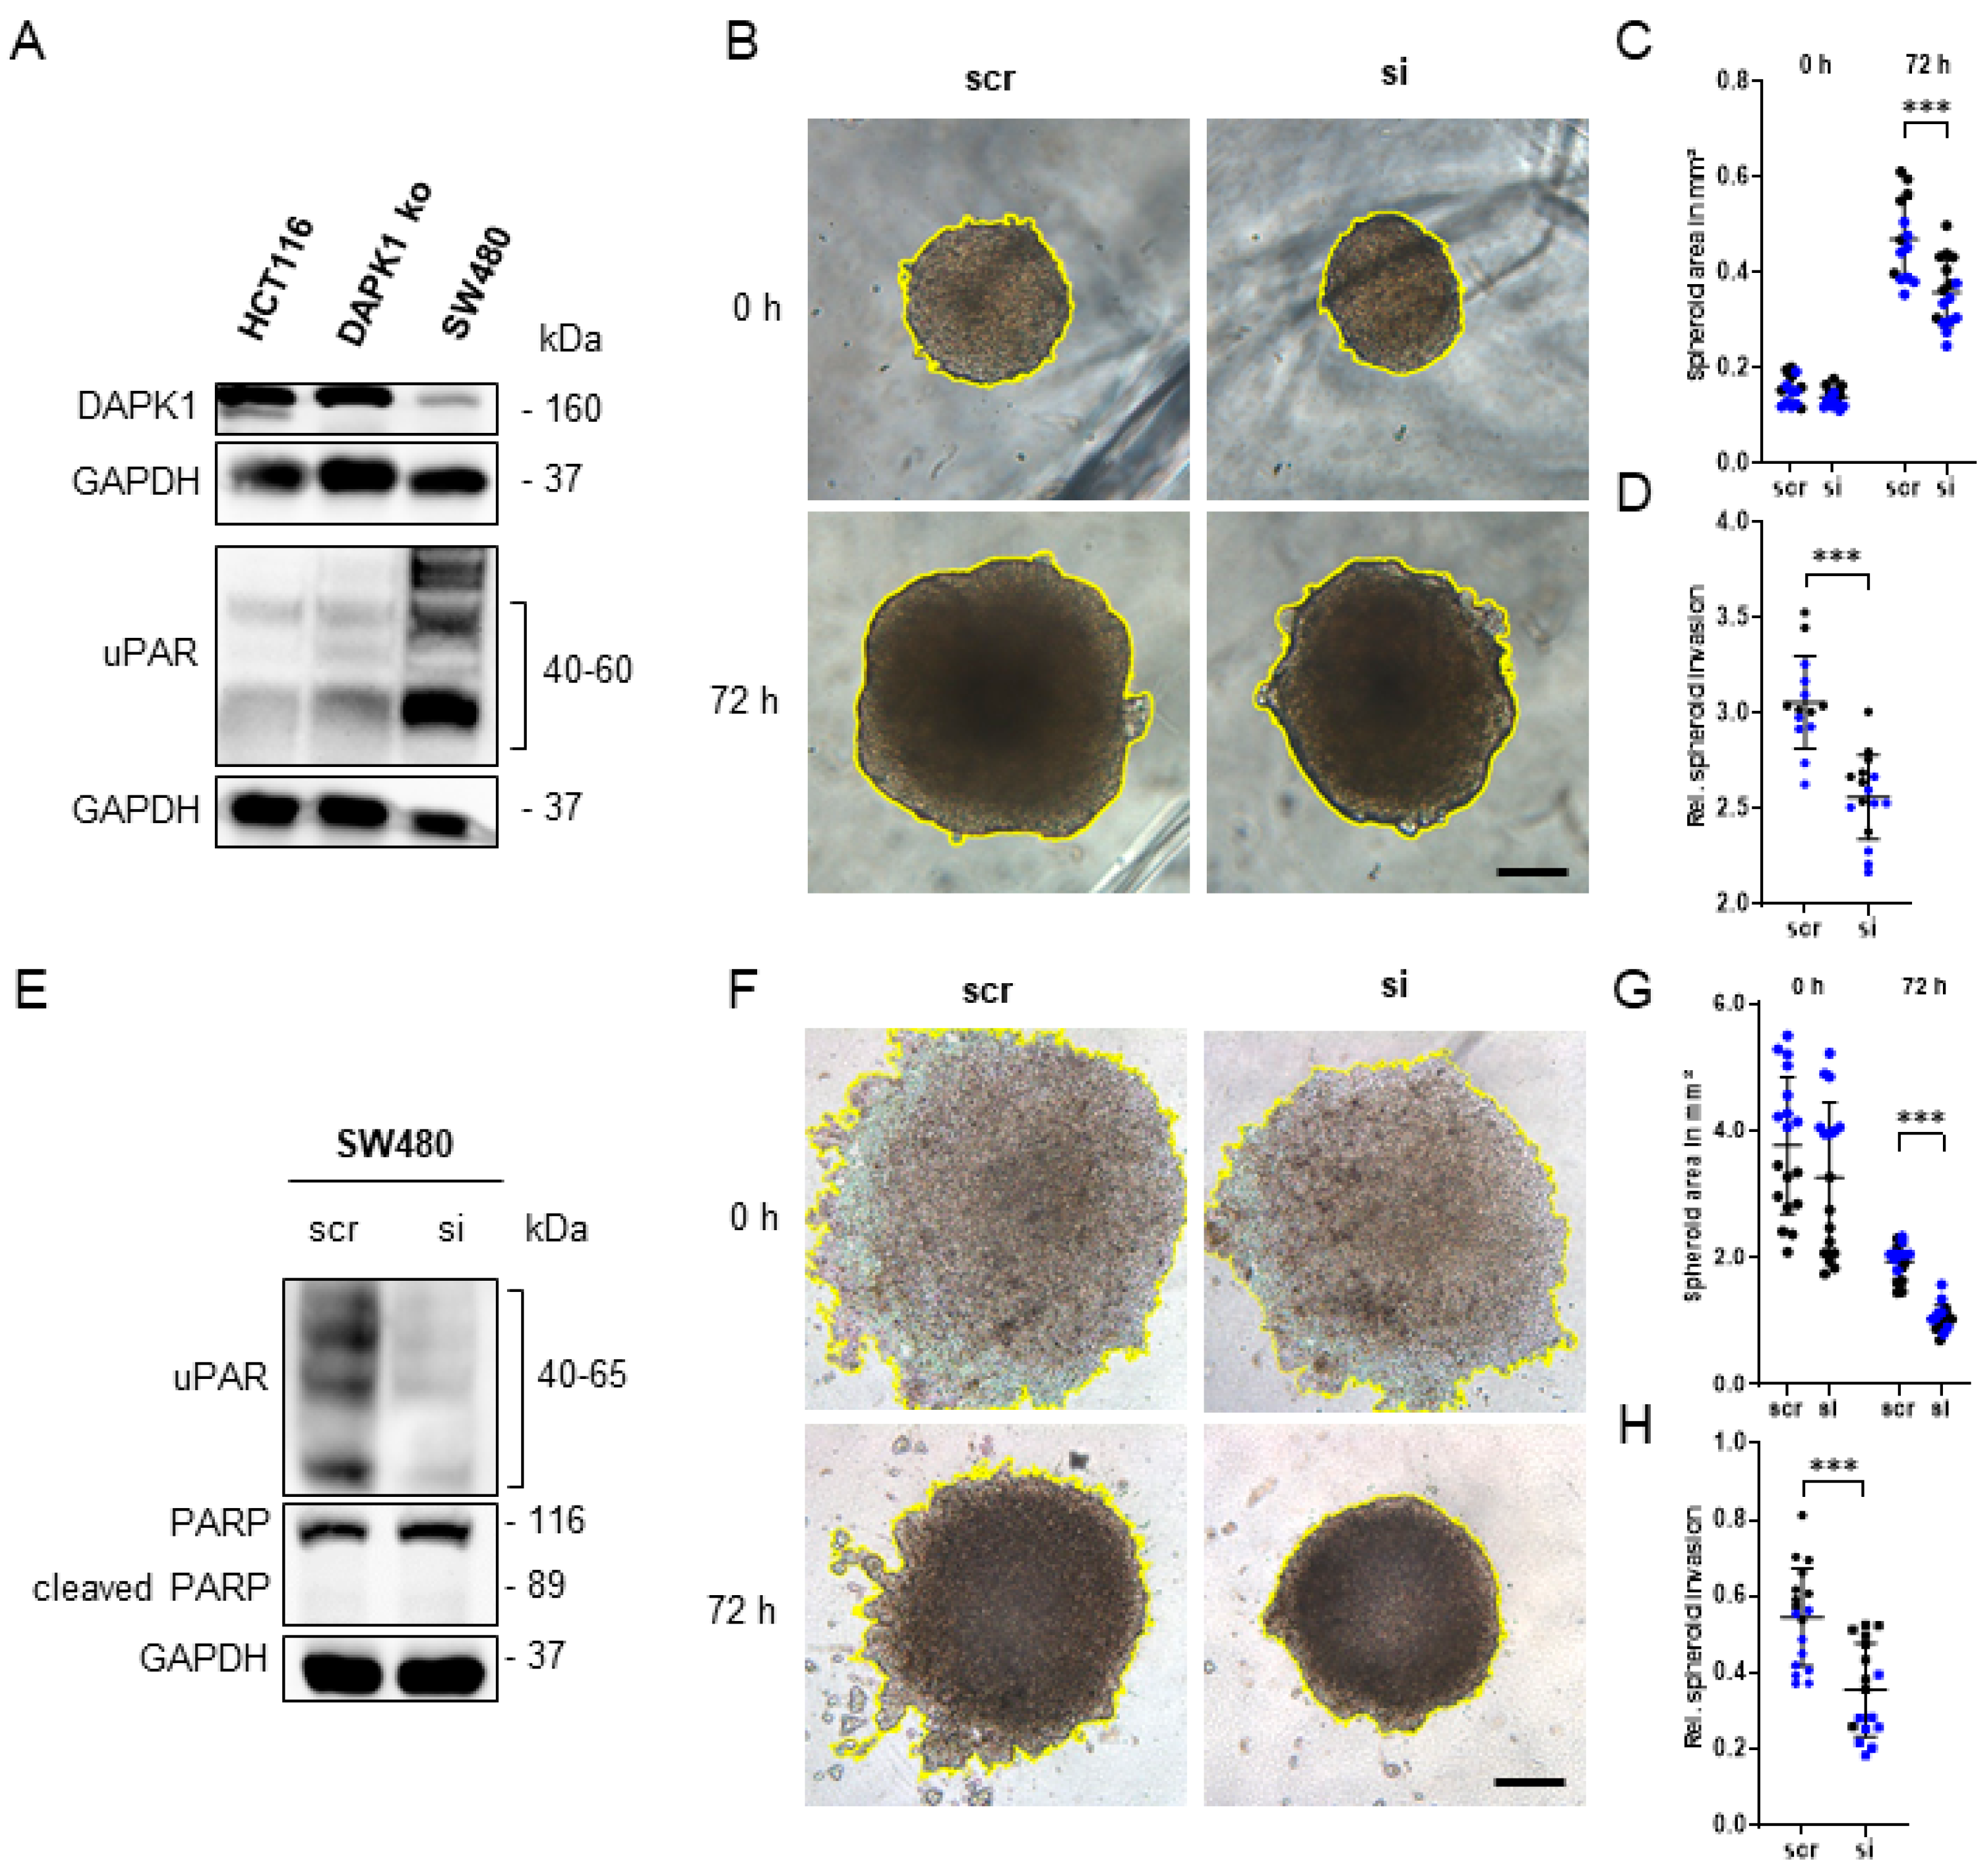
3.4. Influence of uPAR on ECM Remodelling during Tumor Cell Invasion in DAPK1 ko Cells
3.5. In Vitro Simulation of the Early Steps of the Metastatic Cascade Using 3D-Tumor Cell Invasion Assay
4. Discussion
5. Conclusions
Supplementary Materials
Author Contributions
Funding
Institutional Review Board Statement
Informed Consent Statement
Data Availability Statement
Acknowledgments
Conflicts of Interest
References
- Dillekas, H.; Rogers, M.S.; Straume, O. Are 90% of deaths from cancer caused by metastases? Cancer Med. 2019, 8, 5574–5576. [Google Scholar] [CrossRef] [PubMed] [Green Version]
- Seager, R.J.; Hajal, C.; Spill, F.; Kamm, R.D.; Zaman, M.H. Dynamic interplay between tumour, stroma and immune system can drive or prevent tumour progression. Converg. Sci. Phys. Oncol. 2017, 3, 034002. [Google Scholar] [CrossRef] [PubMed]
- Poltavets, V.; Kochetkova, M.; Pitson, S.M.; Samuel, M.S. The Role of the Extracellular Matrix and Its Molecular and Cellular Regulators in Cancer Cell Plasticity. Front. Oncol. 2018, 8, 431. [Google Scholar] [CrossRef] [Green Version]
- Jablonska-Trypuc, A.; Matejczyk, M.; Rosochacki, S. Matrix metalloproteinases (MMPs), the main extracellular matrix (ECM) enzymes in collagen degradation, as a target for anticancer drugs. J. Enzyme. Inhib. Med. Chem. 2016, 31, 177–183. [Google Scholar] [CrossRef] [Green Version]
- Ray, A.; Morford, R.K.; Ghaderi, N.; Odde, D.J.; Provenzano, P.P. Dynamics of 3D carcinoma cell invasion into aligned collagen. Integr. Biol. 2018, 10, 100–112. [Google Scholar] [CrossRef] [PubMed] [Green Version]
- Holle, A.W.; Young, J.L.; Spatz, J.P. In vitro cancer cell-ECM interactions inform in vivo cancer treatment. Adv. Drug Deliv. Rev. 2016, 97, 270–279. [Google Scholar] [CrossRef] [PubMed] [Green Version]
- Schneider-Stock, R.; Ribatti, D. The CAM Assay as an Alternative In Vivo Model for Drug Testing. Organotypic Models in Drug Development. Handb. Exp. Pharmacol. 2020, 265, 303–323. [Google Scholar]
- Winter, G.; Koch, A.B.F.; Löffler, J.; Jelezko, F.; Lindén, M.; Li, H.; Abaei, A.; Zuo, Z.; Beer, A.J.; Rasche, V. In vivo PET/MRI Imaging of the Chorioallantoic Membrane. Front. Phys. 2020, 8, 151. [Google Scholar] [CrossRef]
- Zipfel, W.R.; Williams, R.M.; Webb, W.W. Nonlinear magic: Multiphoton microscopy in the biosciences. Nat. Biotechnol. 2003, 21, 1368–1376. [Google Scholar] [CrossRef]
- Stoletov, K.; Willetts, L.; Paproski, R.J.; Bond, D.J.; Raha, S.; Jovel, J.; Adam, B.; Robertson, A.E.; Wong, F.; Woolner, E.; et al. Quantitative in vivo whole genome motility screen reveals novel therapeutic targets to block cancer metastasis. Nat. Commun. 2018, 9, 2343. [Google Scholar] [CrossRef]
- Shen, B.; Yan, J.; Wang, S.; Zhou, F.; Zhao, Y.; Hu, R.; Qu, J.; Liu, L. Label-free whole-colony imaging and metabolic analysis of metastatic pancreatic cancer by an autoregulating flexible optical system. Theranostics 2020, 10, 1849–1860. [Google Scholar] [CrossRef] [PubMed]
- Karimian-Jazi, K.; Munch, P.; Alexander, A.; Fischer, M.; Pfleiderer, K.; Piechutta, M.; Karreman, M.A.; Solecki, G.M.; Berghoff, A.S.; Friedrich, M.; et al. Monitoring innate immune cell dynamics in the glioma microenvironment by magnetic resonance imaging and multiphoton microscopy (MR-MPM). Theranostics 2020, 10, 1873–1883. [Google Scholar] [CrossRef]
- Schneidereit, D.; Bröllochs, A.; Ritter, P.; Kreiß, L.; Mokhtari, Z.; Beilhack, A.; Krönke, G.; Ackermann, J.A.; Faas, M.; Grüneboom, A.; et al. An advanced optical clearing protocol allows label-free detection of tissue necrosis via multiphoton microscopy in injured whole muscle. Theranostics 2021, 11, 2876–2891. [Google Scholar] [CrossRef] [PubMed]
- Kakkad, S.M.; Solaiyappan, M.; O’Rourke, B.; Stasinopoulos, I.; Ackerstaff, E.; Raman, V.; Bhujwalla, Z.M.; Glunde, K. Hypoxic tumor microenvironments reduce collagen I fiber density. Neoplasia 2010, 12, 608–617. [Google Scholar] [CrossRef] [PubMed] [Green Version]
- Steinmann, S.; Kunze, P.; Hampel, C.; Eckstein, M.; Bertram Bramsen, J.; Muenzner, J.K.; Carlé, B.; Ndreshkjana, B.; Kemenes, S.; Gasparini, P.; et al. DAPK1 loss triggers tumor invasion in colorectal tumor cells. Cell Death Dis. 2019, 10, 895. [Google Scholar] [CrossRef]
- Chen, H.-Y.; Lee, Y.-R.; Chen, R.-H. The functions and regulations of DAPK in cancer metastasis. Apoptosis 2014, 19, 364–370. [Google Scholar] [CrossRef]
- Yuan, W.; Ji, J.; Shu, Y.; Chen, J.; Liu, S.; Wu, L.; Zhou, Z.; Liu, Z.; Tang, Q.; Zhang, X.; et al. Downregulation of DAPK1 promotes the stemness of cancer stem cells and EMT process by activating ZEB1 in colorectal cancer. J. Mol. Med. 2019, 97, 89–102. [Google Scholar] [CrossRef]
- Remmele, W. Recommendation for Uniform Definition of an Immunoreactive Score (IRS) for Immunohistochemical Estrogen Receptor Detection (ER-ICA) in Breast Cancer Tissue. Pathologe 1987, 8, 138–140. [Google Scholar]
- Preibisch, S.; Saalfeld, S.; Tomancak, P. Globally optimal stitching of tiled 3D microscopic image acquisitions. Bioinformatics 2009, 25, 1463–1465. [Google Scholar] [CrossRef]
- Goldberg, I.G.; Allan, C.; Burel, J.-M.; Creager, D.; Falconi, A.; Hochheiser, H.; Johnston, J.; Mellen, J.; Sorger, P.K.; Swedlow, J.R. The Open Microscopy Environment (OME) Data Model and XML file: Open tools for informatics and quantitative analysis in biological imaging. Genome Biol. 2005, 6, R47. [Google Scholar] [CrossRef] [Green Version]
- Schindelin, J.; Arganda-Carreras, I.; Frise, E.; Kaynig, V.; Longair, M.; Pietzsch, T.; Preibisch, S.; Rueden, C.; Saalfeld, S.; Schmid, B.; et al. Fiji: An open-source platform for biological-image analysis. Nat. Methods 2012, 9, 676–682. [Google Scholar] [CrossRef] [PubMed] [Green Version]
- Rappsilber, J.; Mann, M.; Ishihama, Y. Protocol for micro-purification, enrichment, pre-fractionation and storage of peptides for proteomics using StageTips. Nat. Protoc. 2007, 2, 1896–1906. [Google Scholar] [CrossRef] [PubMed]
- Cox, J.; Mann, M. MaxQuant enables high peptide identification rates, individualized p.p.b.-range mass accuracies and proteome-wide protein quantification. Nat. Biotechnol. 2008, 26, 1367–1372. [Google Scholar] [CrossRef] [PubMed]
- Cox, T.R.; Erler, J.T. Molecular Pathways: Connecting Fibrosis and Solid Tumor Metastasis. Clin. Cancer Res. 2014, 20, 3637–3643. [Google Scholar] [CrossRef] [Green Version]
- Tyanova, S.; Temu, T.; Sinitcyn, P.; Carlson, A.; Hein, M.Y.; Geiger, T.; Mann, M.; Cox, J. The Perseus computational platform for comprehensive analysis of (prote)omics data. Nat. Methods 2016, 13, 731–740. [Google Scholar] [CrossRef]
- Perez-Riverol, Y.; Csordas, A.; Bai, J.; Bernal-Llinares, M.; Hewapathirana, S.; Kundu, D.J.; Inuganti, A.; Griss, J.; Mayer, G.; Eisenacher, M.; et al. The PRIDE database and related tools and resources in 2019: Improving support for quantification data. Nucleic Acids Res. 2019, 47, D442–D450. [Google Scholar] [CrossRef]
- Pomaznoy, M.; Ha, B.; Peters, B. GOnet: A tool for interactive Gene Ontology analysis. BMC Bioinform. 2018, 19, 470. [Google Scholar] [CrossRef]
- Shannon, P.; Markiel, A.; Ozier, O.; Baliga, N.S.; Wang, J.T.; Ramage, D.; Amin, N.; Schwikowski, B.; Ideker, T. Cytoscape: A software environment for integrated models of biomolecular interaction networks. Genome Res. 2003, 13, 2498–2504. [Google Scholar] [CrossRef]
- Zheng, Y.; Xia, Y.; Hawke, D.; Halle, M.; Tremblay, M.L.; Gao, X.; Zhou, X.Z.; Aldape, K.; Cobb, M.H.; Xie, K.; et al. FAK phosphorylation by ERK primes Ras-induced tyrosine dephosphorylation of FAK mediated by PIN1 and PTP-PEST. Mol. Cell 2009, 35, 11–25. [Google Scholar] [CrossRef] [Green Version]
- Zhang, Y.; Sime, W.; Juhas, M.; Sjolander, A. Crosstalk between colon cancer cells and macrophages via inflammatory mediators and CD47 promotes tumour cell migration. Eur. J. Cancer 2013, 49, 3320–3334. [Google Scholar] [CrossRef]
- Ichikawa, T.; Kita, M.; Matsui, T.S.; Nagasato, A.I.; Araki, T.; Chiang, S.H.; Sezaki, T.; Kimura, Y.; Ueda, K.; Deguchi, S.; et al. Vinexin family (SORBS) proteins play different roles in stiffness-sensing and contractile force generation. J. Cell Sci. 2017, 130, 3517–3531. [Google Scholar] [CrossRef] [PubMed] [Green Version]
- Zeng, P.; Li, H.; Lu, P.H.; Zhou, L.N.; Tang, M.; Liu, C.Y.; Chen, M.B. Prognostic value of CD146 in solid tumor: A Systematic Review and Meta-analysis. Sci. Rep. 2017, 7, 4223. [Google Scholar] [CrossRef] [PubMed]
- Martin, T.A.; Lane, J.; Harrison, G.M.; Jiang, W.G. The expression of the Nectin complex in human breast cancer and the role of Nectin-3 in the control of tight junctions during metastasis. PLoS ONE 2013, 8, e82696. [Google Scholar] [CrossRef] [PubMed] [Green Version]
- Brungs, D.; Chen, J.; Aghmesheh, M.; Vine, K.L.; Becker, T.M.; Carolan, M.G.; Ranson, M. The urokinase plasminogen activation system in gastroesophageal cancer: A systematic review and meta-analysis. Oncotarget 2017, 8, 23099. [Google Scholar] [CrossRef] [PubMed] [Green Version]
- Leibovitz, A.; Stinson, J.C.; McCombs, W.B., 3rd; McCoy, C.E.; Mazur, K.C.; Mabry, N.D. Classification of human colorectal adenocarcinoma cell lines. Cancer Res. 1976, 36, 4562–4569. [Google Scholar] [PubMed]
- Han, W.; Chen, S.; Yuan, W.; Fan, Q.; Tian, J.; Wang, X.; Chen, L.; Zhang, X.; Wei, W.; Liu, R.; et al. Oriented collagen fibers direct tumor cell intravasation. Proc. Natl. Acad. Sci. USA 2016, 113, 11208–11213. [Google Scholar] [CrossRef] [Green Version]
- Conklin, M.W.; Eickhoff, J.C.; Riching, K.M.; Pehlke, C.A.; Eliceiri, K.W.; Provenzano, P.P.; Friedl, A.; Keely, P.J. Aligned collagen is a prognostic signature for survival in human breast carcinoma. Am. J. Pathol. 2011, 178, 1221–1232. [Google Scholar] [CrossRef]
- Fang, M.; Yuan, J.; Peng, C.; Li, Y. Collagen as a double-edged sword in tumor progression. Tumour Biol. 2014, 35, 2871–2882. [Google Scholar] [CrossRef] [Green Version]
- Klingenberg, M.; Becker, J.; Eberth, S.; Kube, D.; Wilting, J. The chick chorioallantoic membrane as an in vivo xenograft model for Burkitt lymphoma. BMC Cancer 2014, 14, 339. [Google Scholar] [CrossRef] [Green Version]
- Brabrand, A.; Kariuki, I.I.; Engstrom, M.J.; Haugen, O.A.; Dyrnes, L.A.; Asvold, B.O.; Lilledahl, M.B.; Bofin, A.M. Alterations in collagen fibre patterns in breast cancer. A premise for tumour invasiveness? APMIS 2015, 123, 1–8. [Google Scholar] [CrossRef]
- Benderska, N.; Schneider-Stock, R. Transcription control of DAPK. Apoptosis 2014, 19, 298–305. [Google Scholar] [CrossRef] [PubMed]
- Guo, H.; Ling, C.; Ma, Y.Y.; Zhou, L.X.; Zhao, L. Prognostic role of urokinase plasminogen activator receptor in gastric and colorectal cancer: A systematic review and meta-analysis. OncoTargets Ther. 2015, 8, 1503–1509. [Google Scholar]


Publisher’s Note: MDPI stays neutral with regard to jurisdictional claims in published maps and institutional affiliations. |
© 2022 by the authors. Licensee MDPI, Basel, Switzerland. This article is an open access article distributed under the terms and conditions of the Creative Commons Attribution (CC BY) license (https://creativecommons.org/licenses/by/4.0/).
Share and Cite
Kunze, P.; Kreiss, L.; Novosadová, V.; Roehe, A.V.; Steinmann, S.; Prochazka, J.; Geppert, C.I.; Hartmann, A.; Schürmann, S.; Friedrich, O.; et al. Multiphoton Microscopy Reveals DAPK1-Dependent Extracellular Matrix Remodeling in a Chorioallantoic Membrane (CAM) Model. Cancers 2022, 14, 2364. https://doi.org/10.3390/cancers14102364
Kunze P, Kreiss L, Novosadová V, Roehe AV, Steinmann S, Prochazka J, Geppert CI, Hartmann A, Schürmann S, Friedrich O, et al. Multiphoton Microscopy Reveals DAPK1-Dependent Extracellular Matrix Remodeling in a Chorioallantoic Membrane (CAM) Model. Cancers. 2022; 14(10):2364. https://doi.org/10.3390/cancers14102364
Chicago/Turabian StyleKunze, Philipp, Lucas Kreiss, Vendula Novosadová, Adriana V. Roehe, Sara Steinmann, Jan Prochazka, Carol I. Geppert, Arndt Hartmann, Sebastian Schürmann, Oliver Friedrich, and et al. 2022. "Multiphoton Microscopy Reveals DAPK1-Dependent Extracellular Matrix Remodeling in a Chorioallantoic Membrane (CAM) Model" Cancers 14, no. 10: 2364. https://doi.org/10.3390/cancers14102364