
Characterization of Aberrations in DNA Damage Repair Pathways in Gastrointestinal Stromal Tumors: The Clinicopathologic Relevance of γH2AX and 53BP1 in Correlation with Heterozygous Deletions of CHEK2, BRCA2, and RB1

 , , ,
, , ,
Abstract
:Simple Summary
Abstract
1. Introduction
2. Materials and Methods
2.1. Study Cohorts
2.2. Targeted NGS
2.3. IHC Analysis for γH2AX and 53BP1 in GISTs
2.4. IF Analyses of Expression Levels and Subcellular Spatial Association of γH2AX and 53BP1 in GISTs
2.5. MLPA
2.6. Statistical Analysis
3. Results
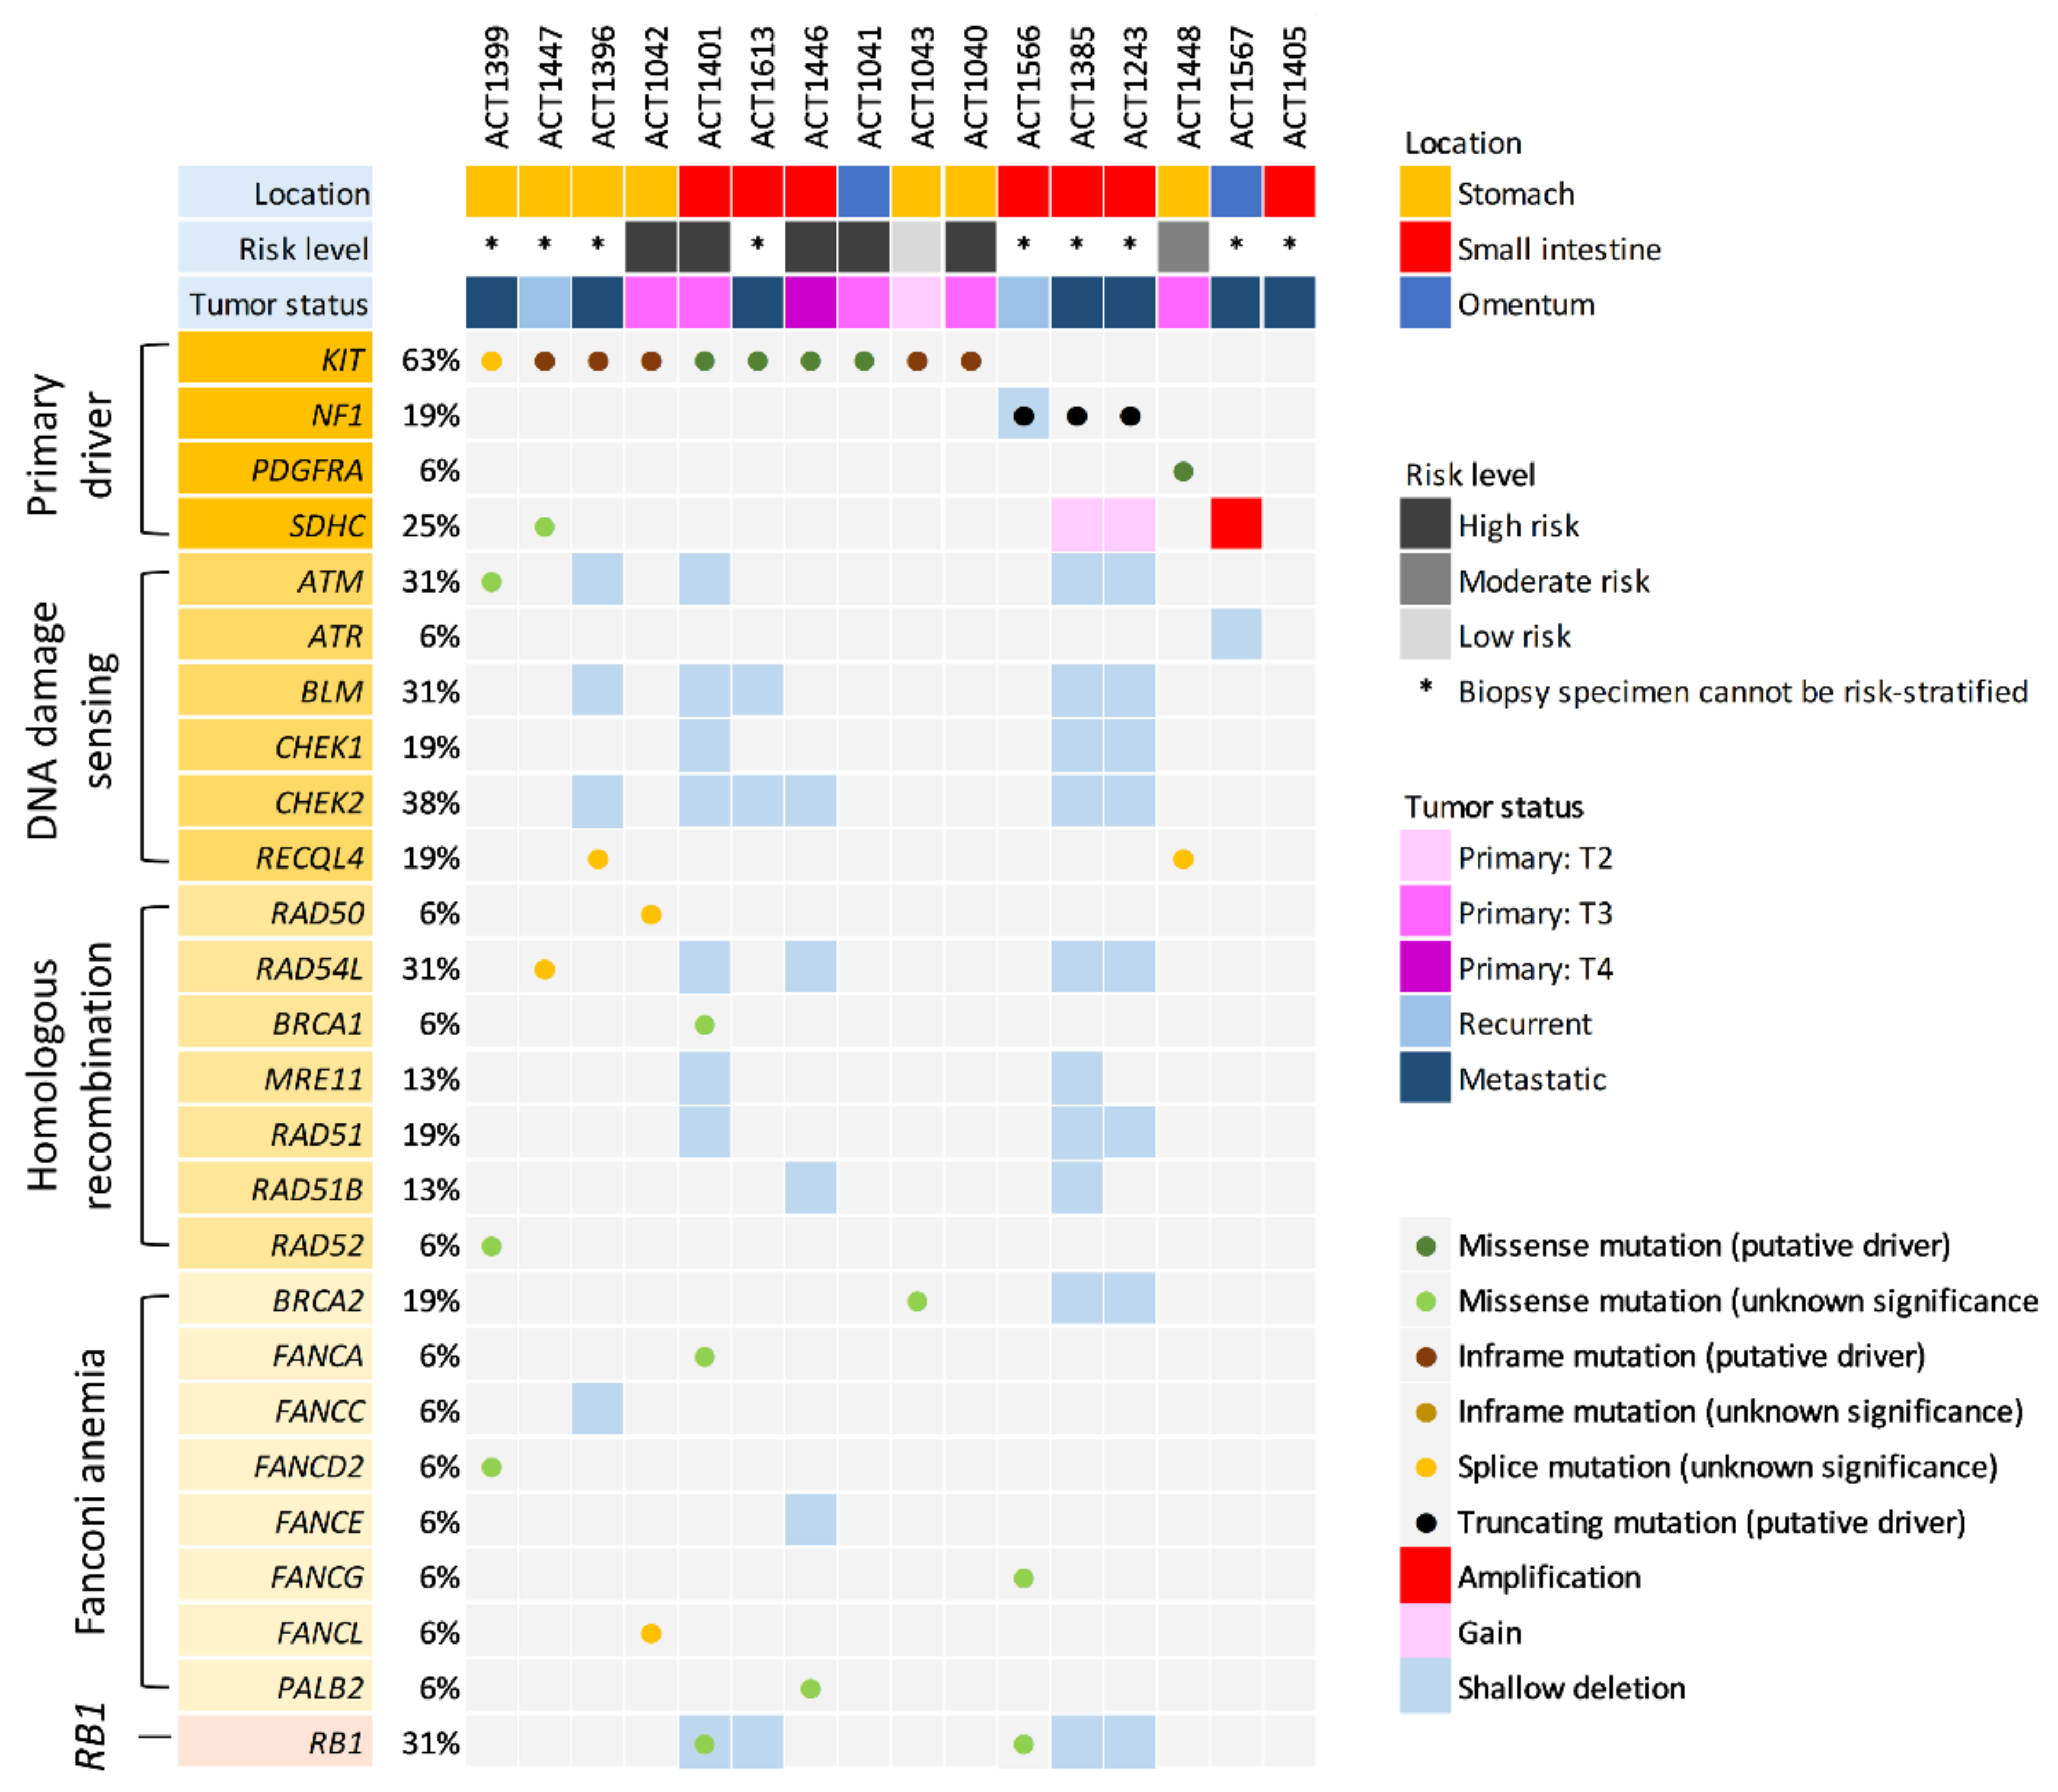
3.1. Targeted NGS for Primary Drivers and a Focused Appraisal of DDR Genes
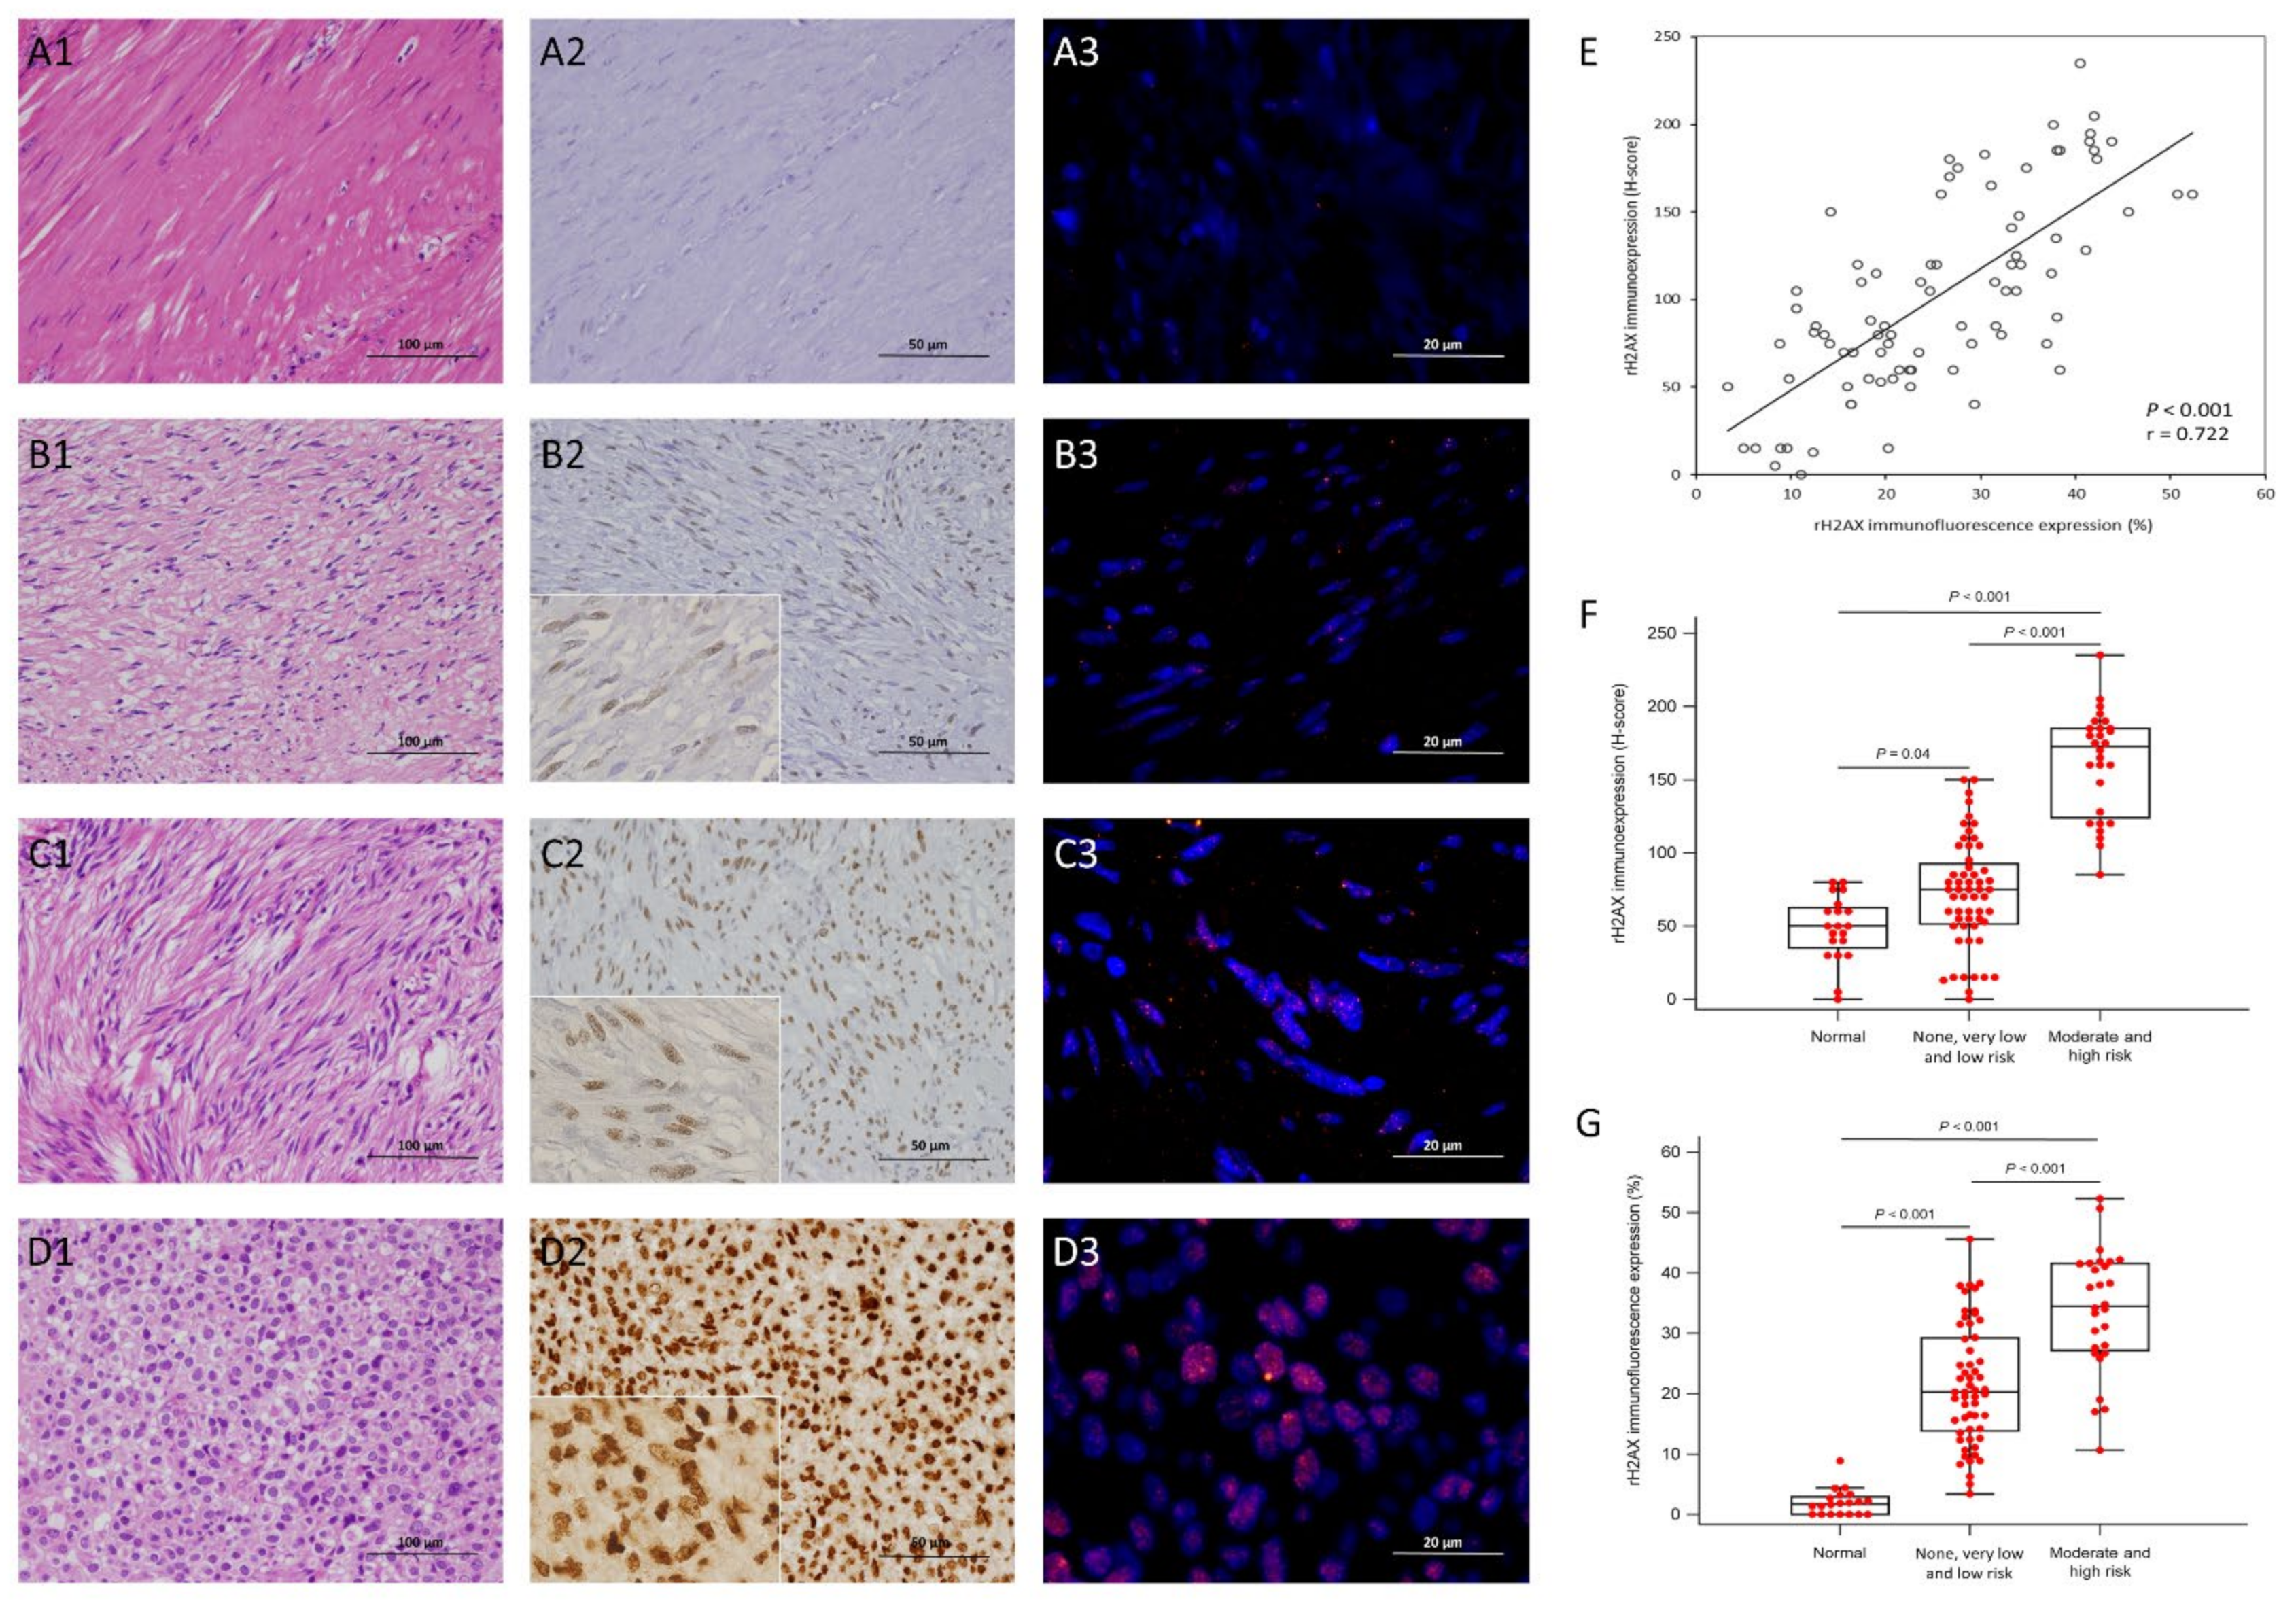
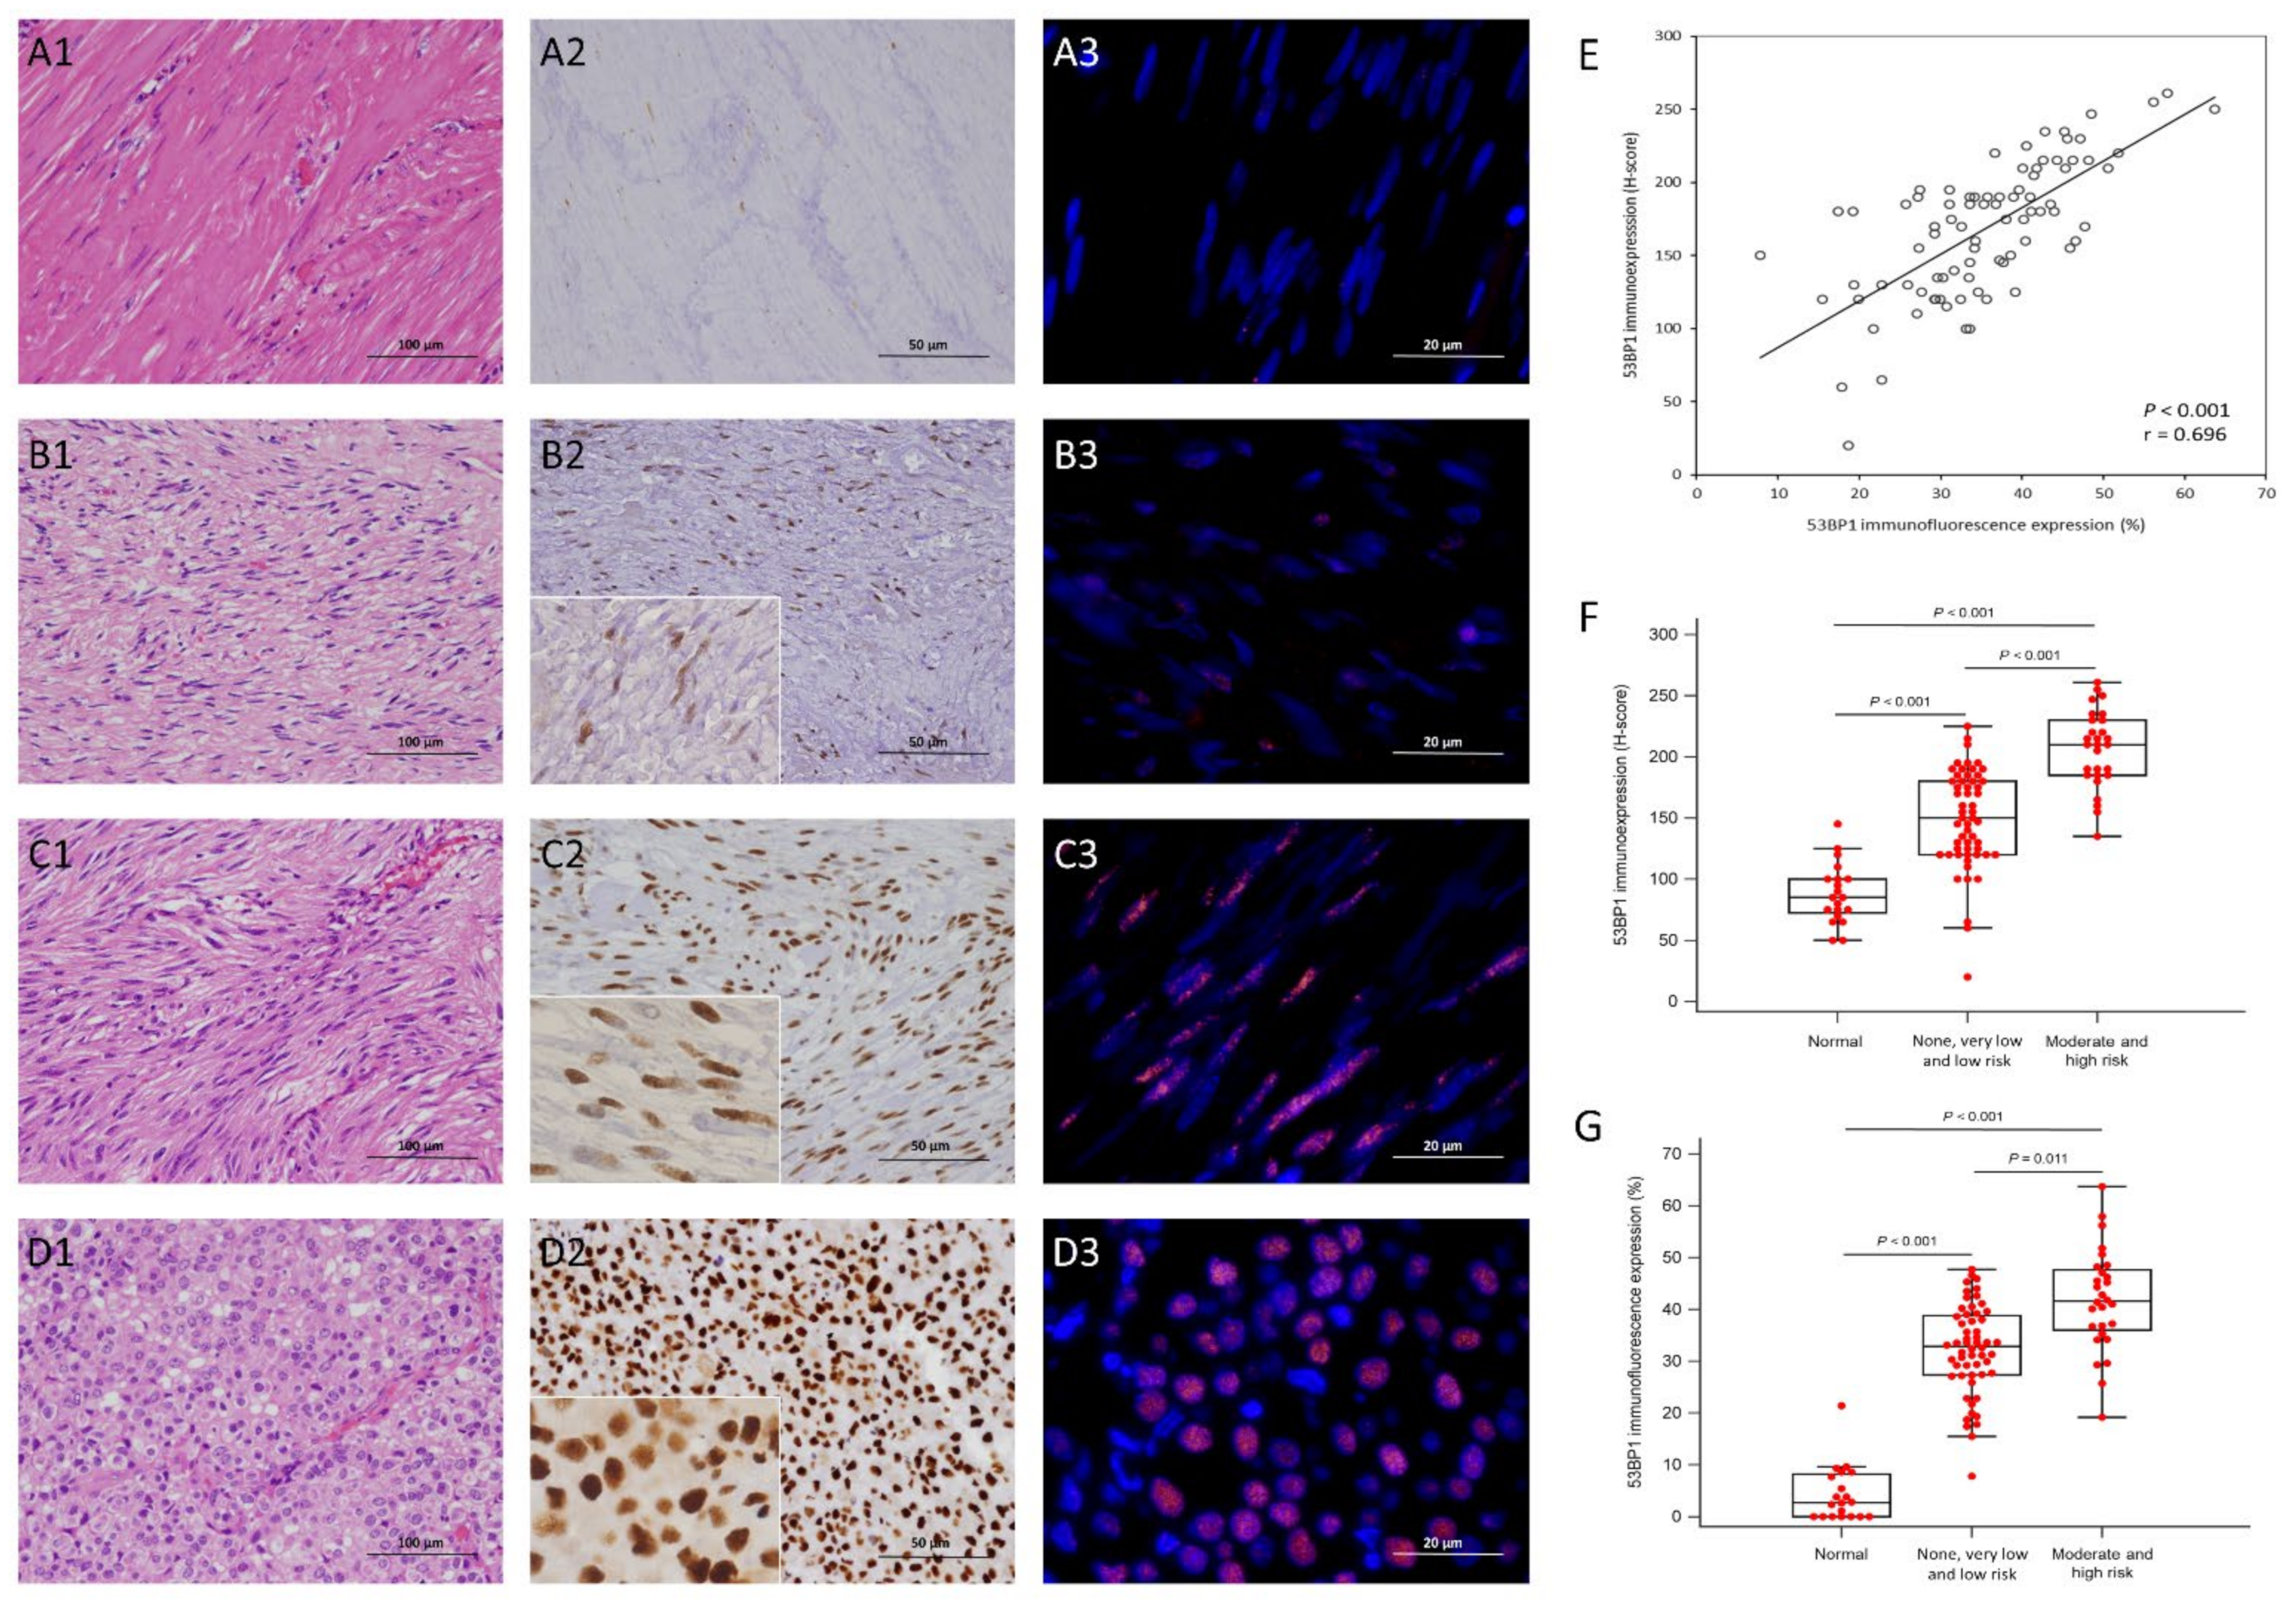
3.2. Expression Status of γ-H2AX and 53BP1 by IHC and IF in the Training Cohort
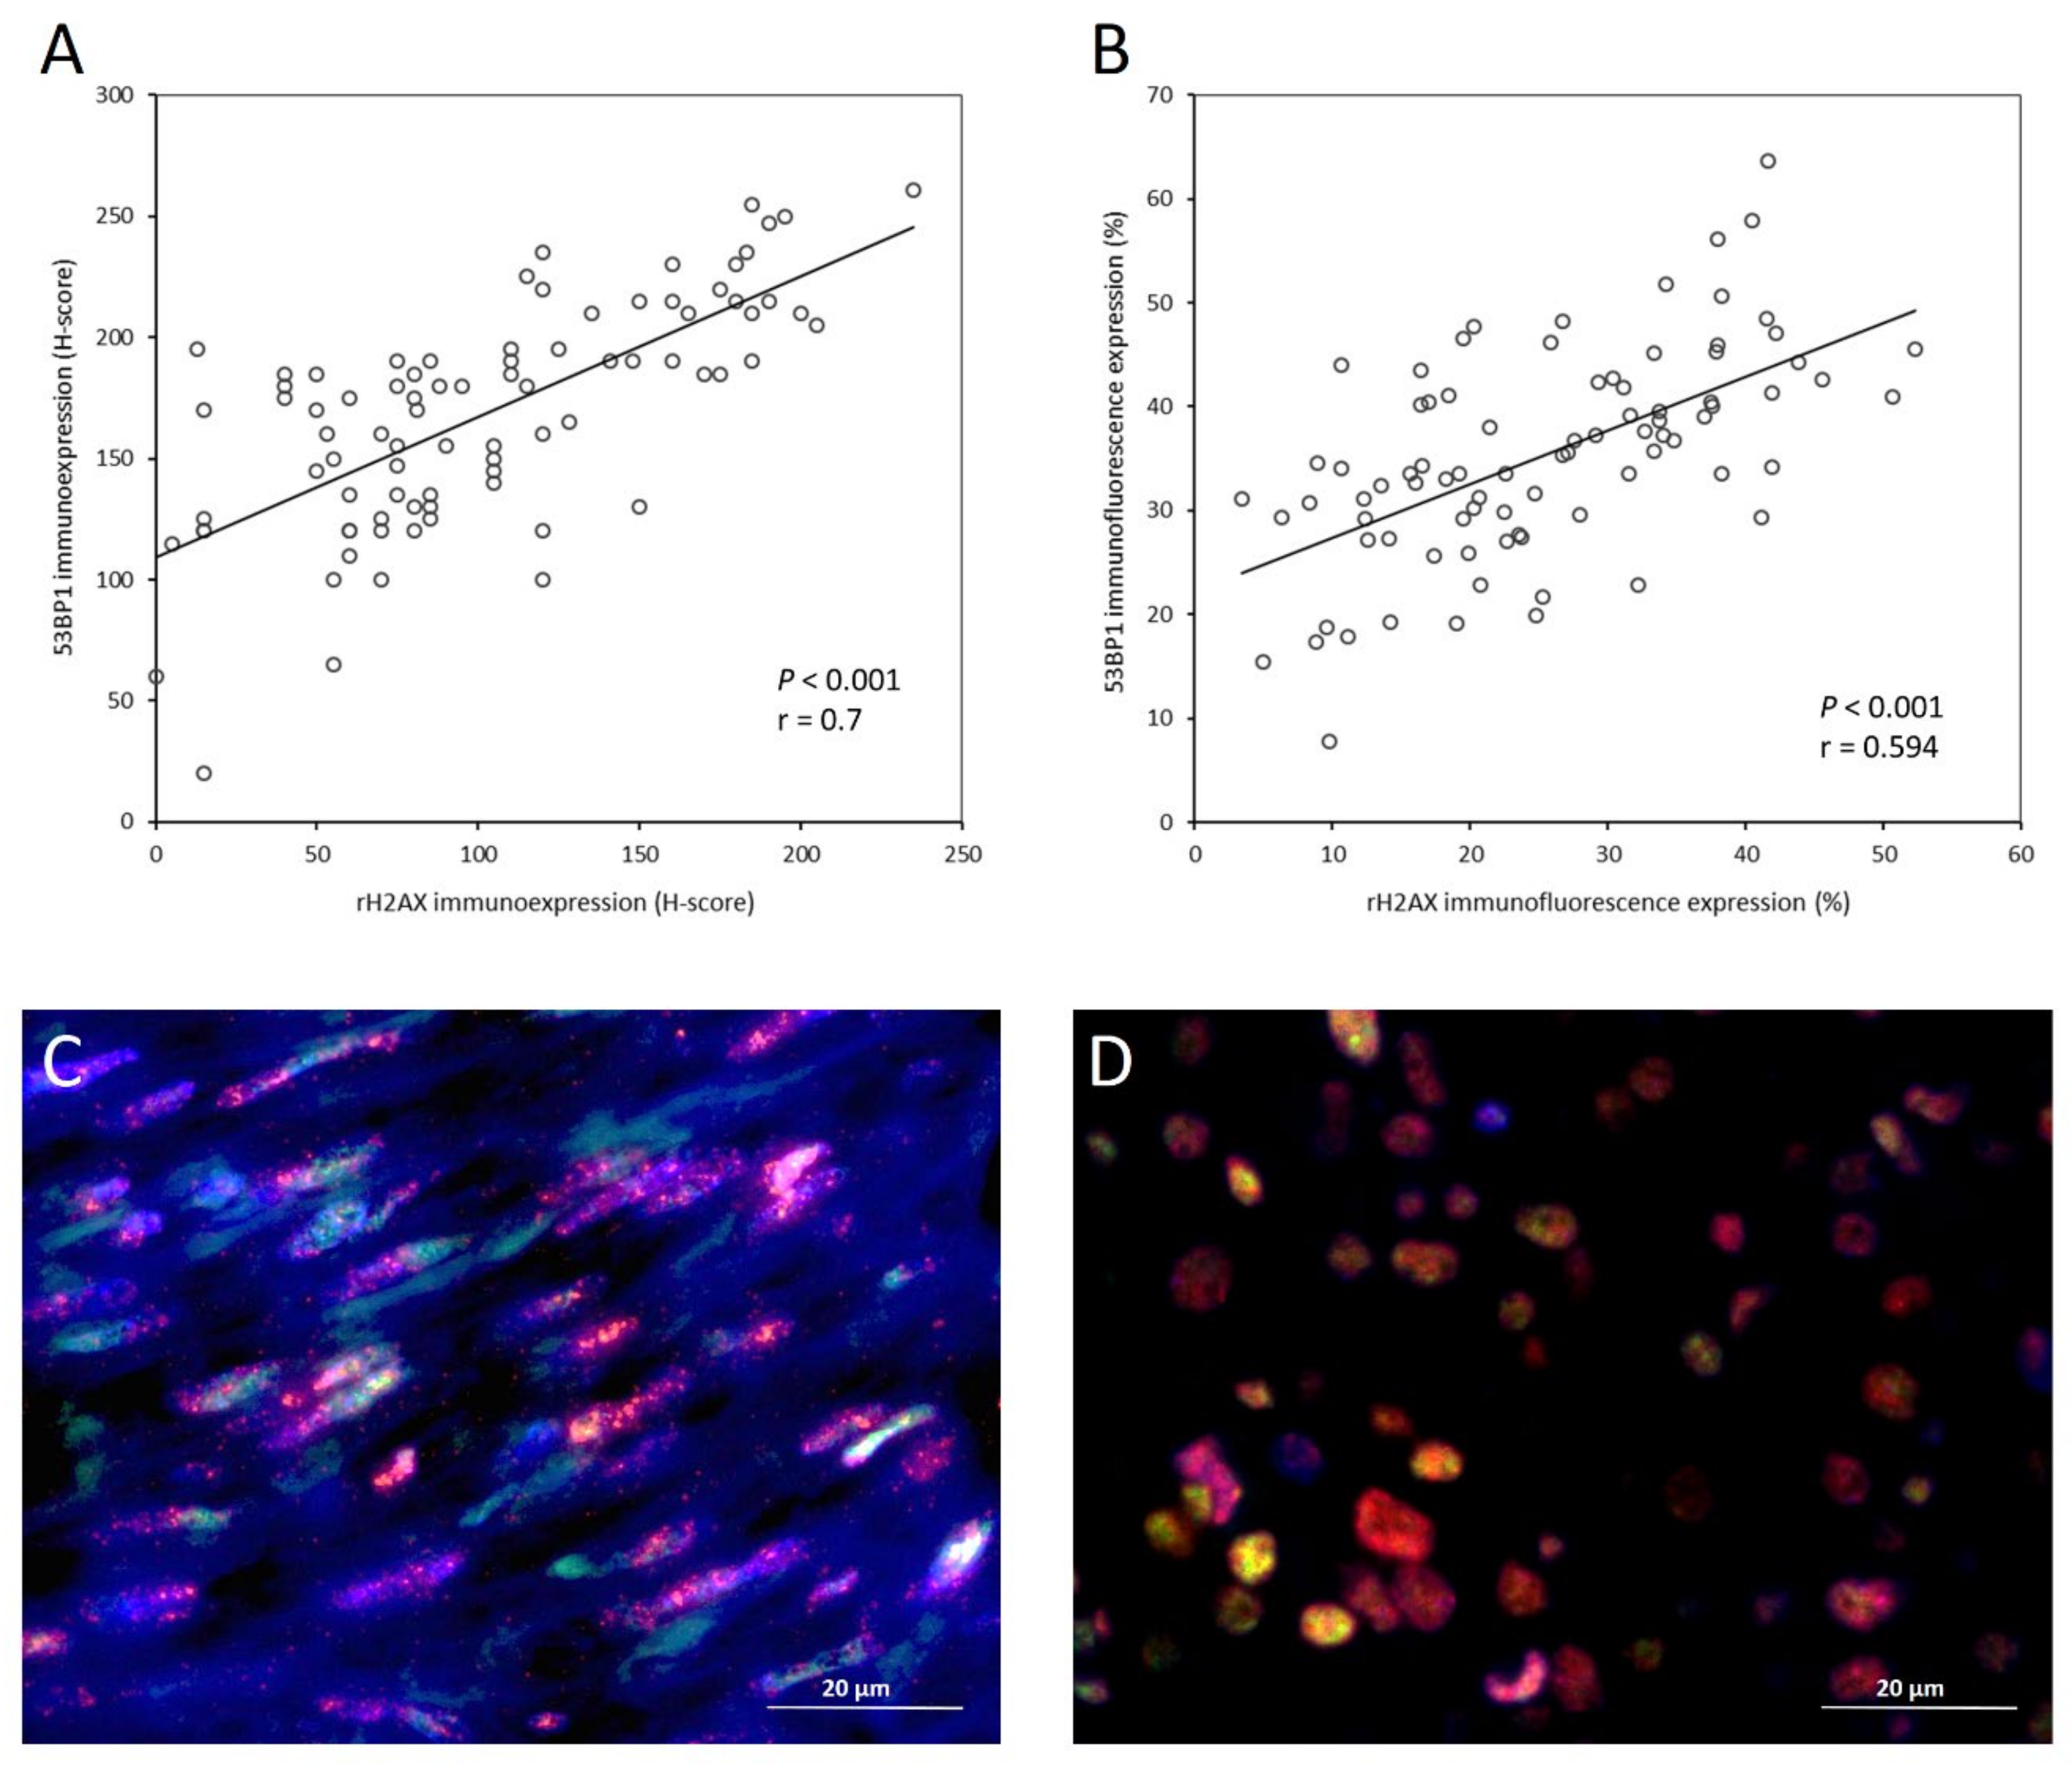
3.3. Correlation and Co-Localization of γ-H2AX and 53BP1
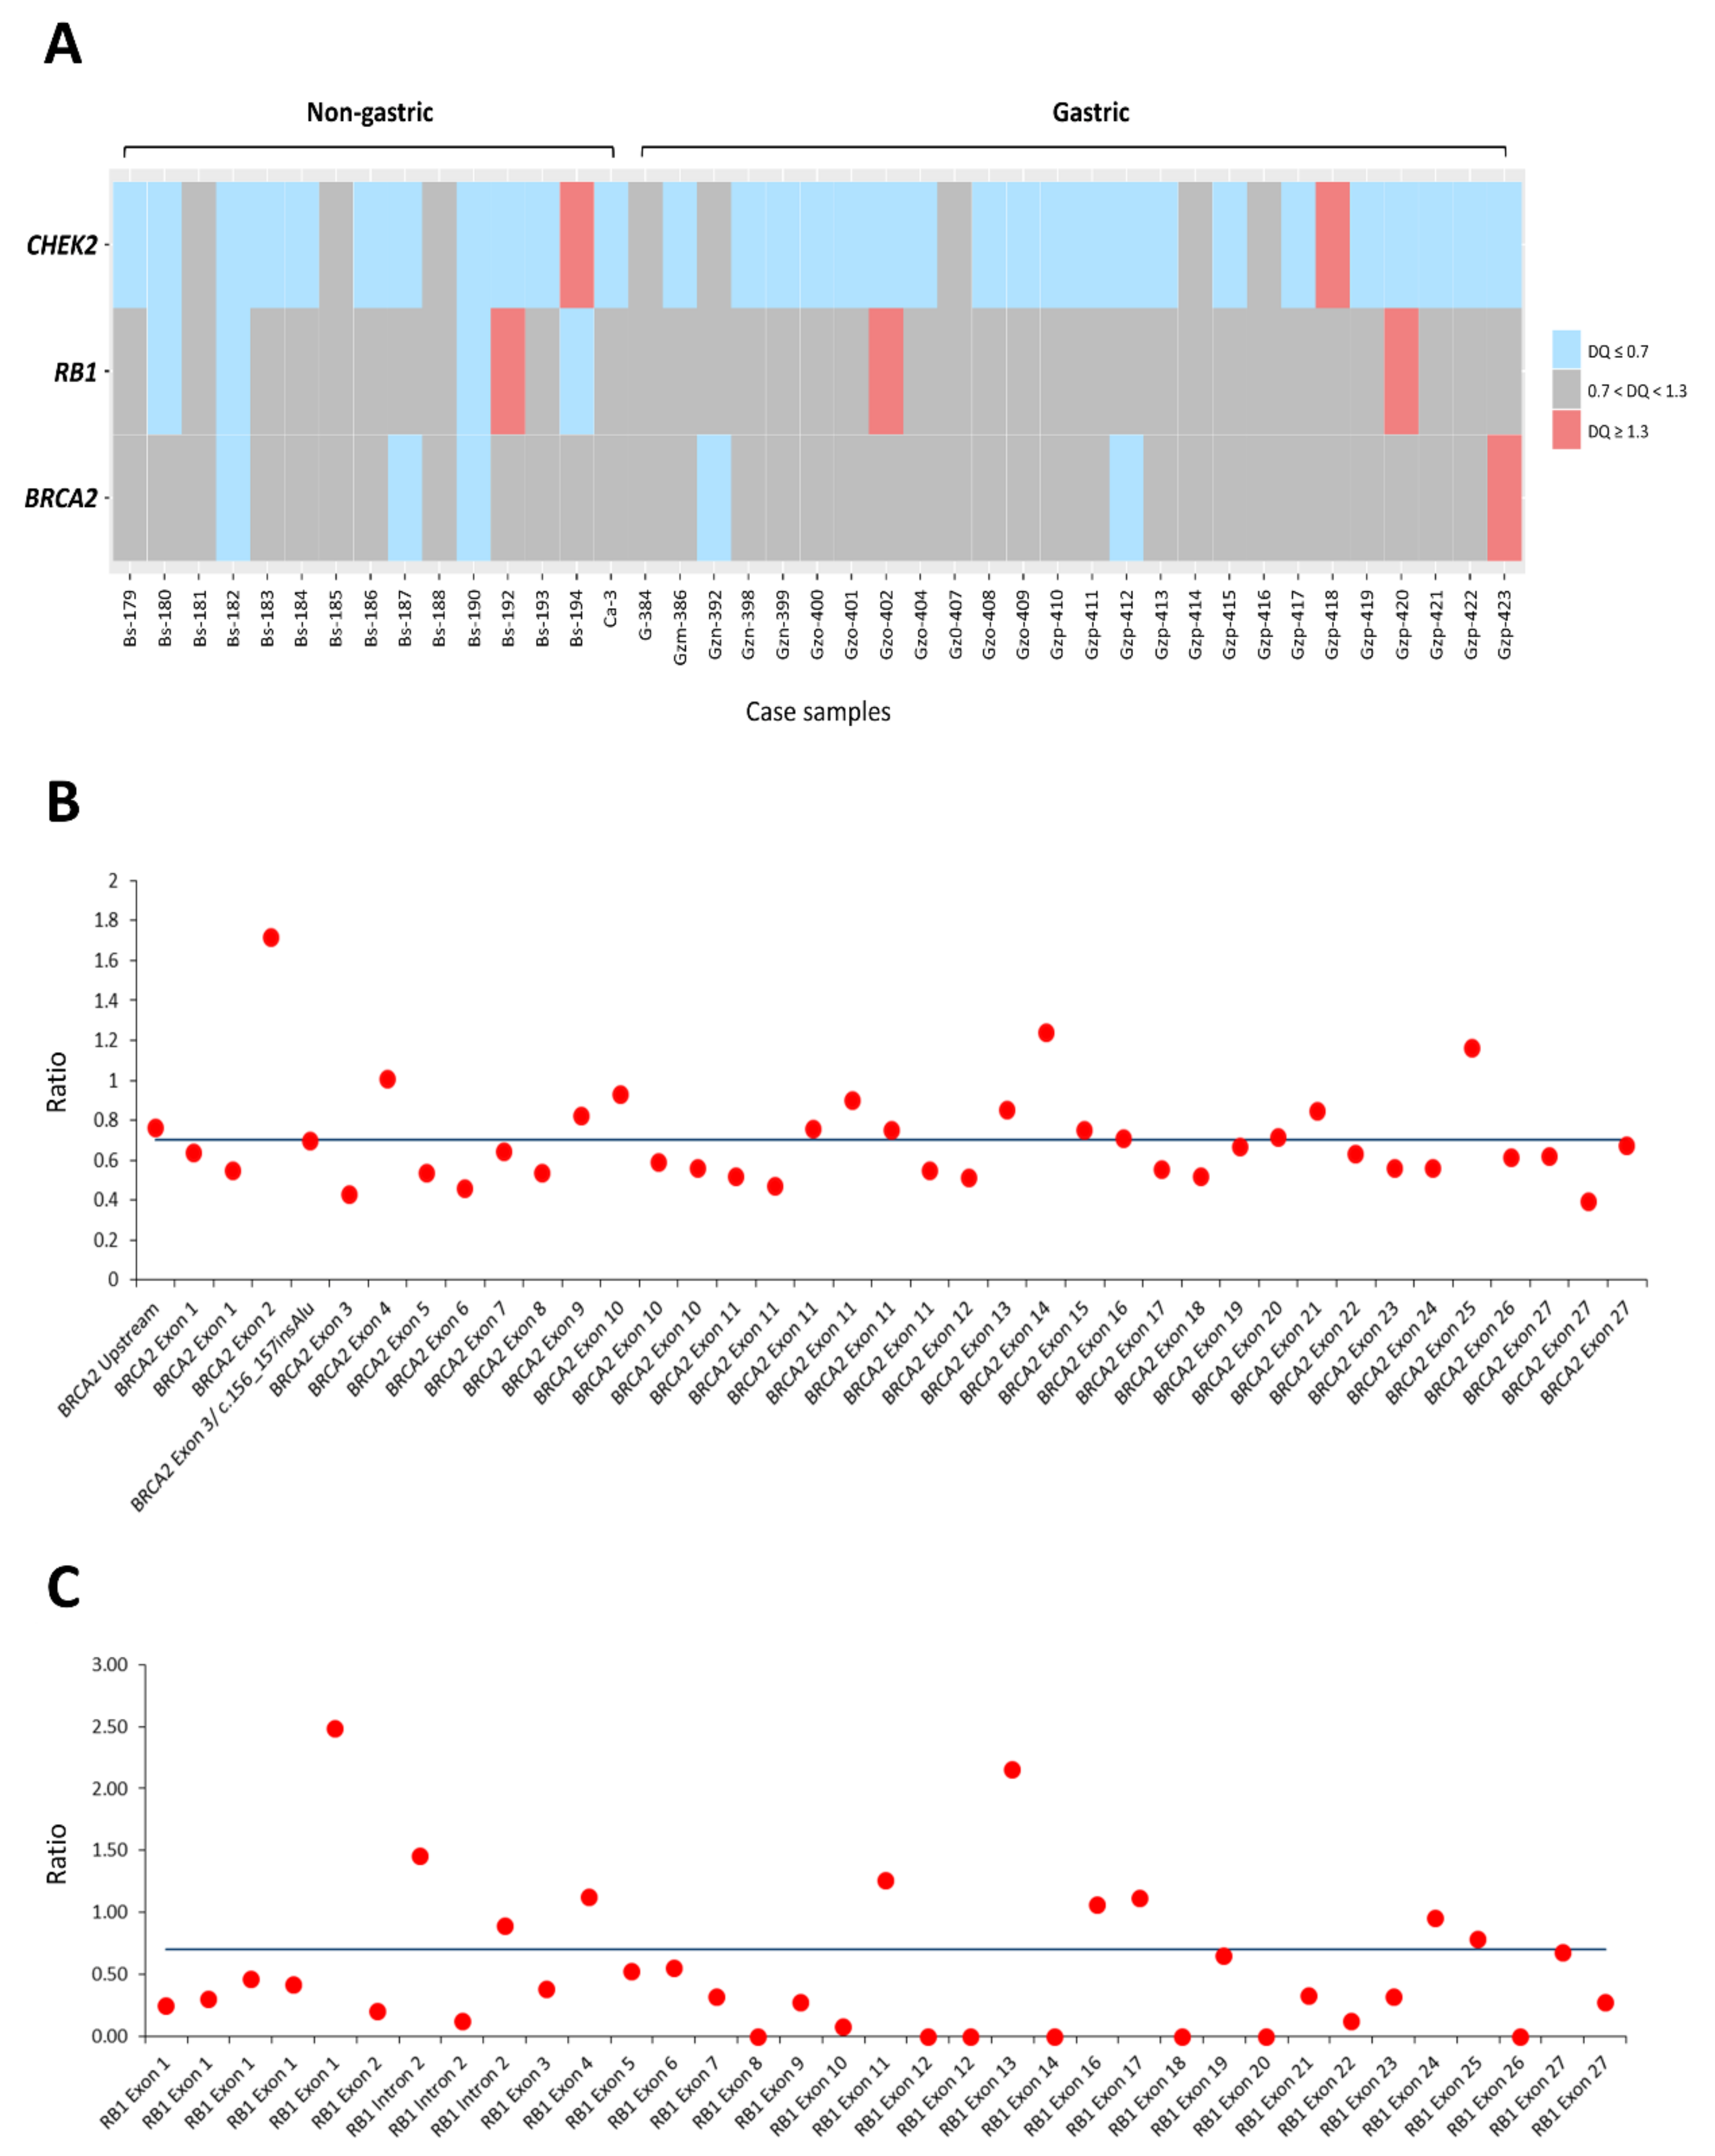
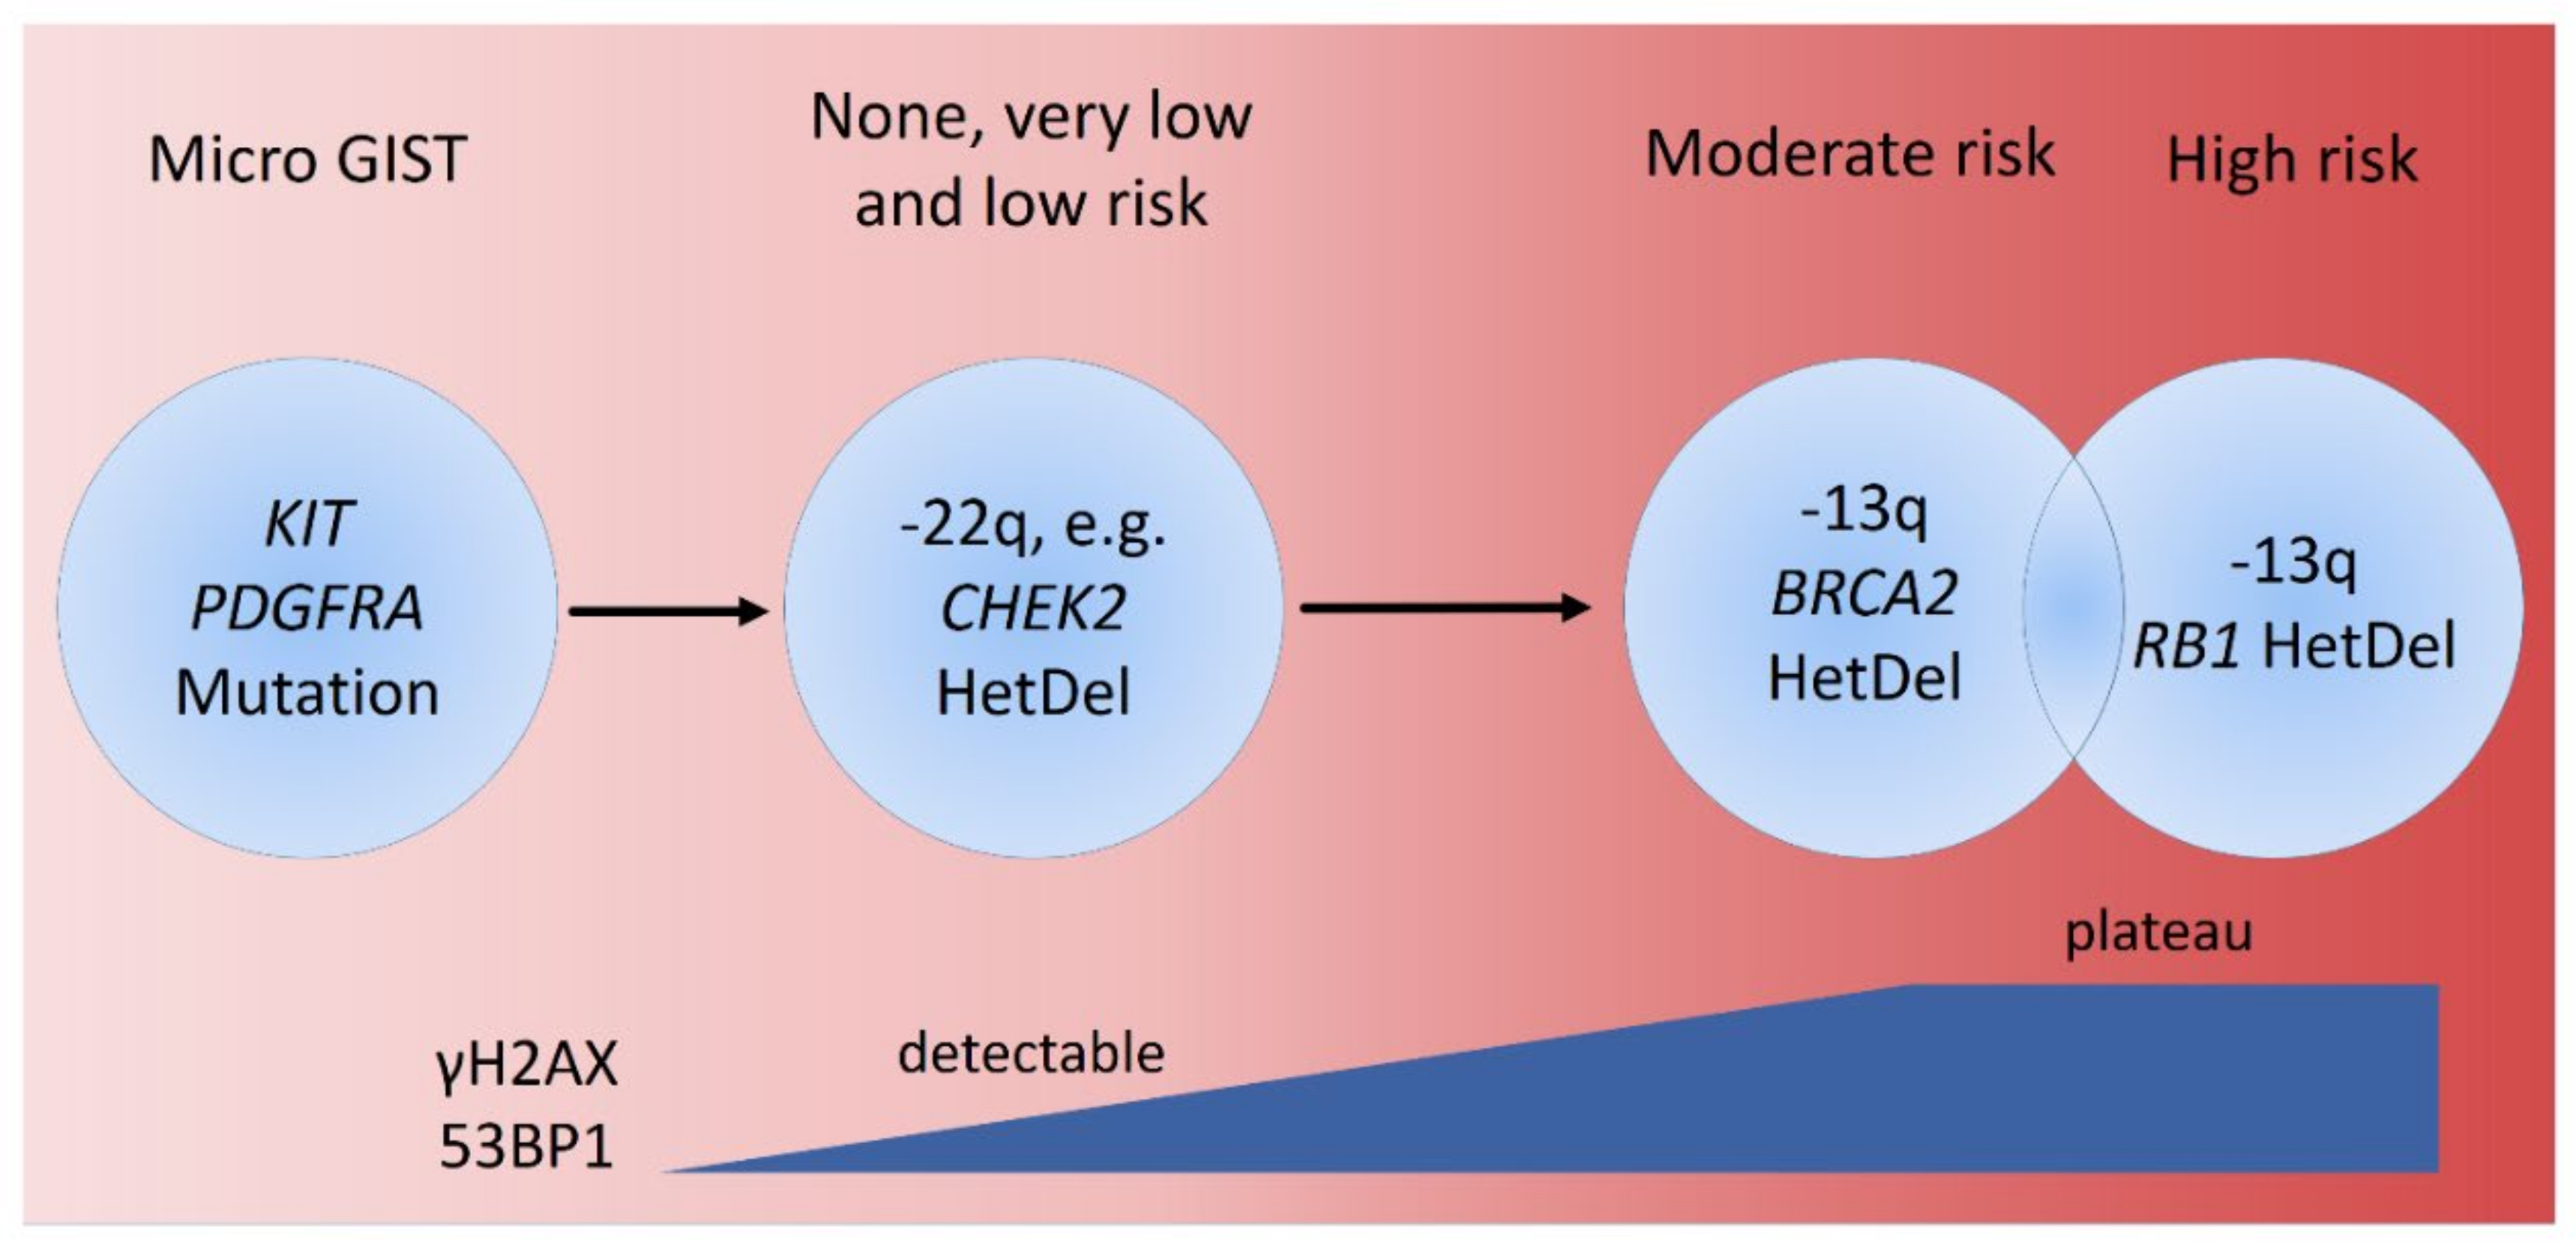
3.4. The Dosages of RB1, BRCA2, and CHEK2 Genes Determined by MLPA and Their Associations with Clinicopathologic Factors, γ-H2AX and 53BP1 in GISTs
3.5. Independent Validation of Immunohistochemical Expression, Clinical and Molecular Correlates, and Prognostic Relevance of γ-H2AX and 53BP1 in TMA-Based GISTs
4. Discussion
Supplementary Materials
Author Contributions
Funding
Institutional Review Board Statement
Informed Consent Statement
Data Availability Statement
Acknowledgments
Conflicts of Interest
References
- Demetri, G.D.; von Mehren, M.; Antonescu, C.R.; DeMatteo, R.P.; Ganjoo, K.N.; Maki, R.G.; Pisters, P.W.; Raut, C.P.; Riedel, R.F.; Schuetze, S.; et al. NCCN Task Force report: Update on the management of patients with gastrointestinal stromal tumors. J. Natl. Compr. Cancer Netw. 2010, 8 (Suppl. 2), S1–S41. [Google Scholar] [CrossRef] [Green Version]
- Fletcher, C.D.; Berman, J.J.; Corless, C.; Gorstein, F.; Lasota, J.; Longley, B.J.; Miettinen, M.; O’Leary, T.J.; Remotti, H.; Rubin, B.P.; et al. Diagnosis of gastrointestinal stromal tumors: A consensus approach. Hum. Pathol. 2002, 33, 459–465. [Google Scholar] [CrossRef] [Green Version]
- Joensuu, H.; Rutkowski, P.; Nishida, T.; Steigen, S.E.; Brabec, P.; Plank, L.; Nilsson, B.; Braconi, C.; Bordoni, A.; Magnusson, M.K.; et al. KIT and PDGFRA mutations and the risk of GI stromal tumor recurrence. J. Clin. Oncol. 2015, 33, 634–642. [Google Scholar] [CrossRef]
- Boikos, S.A.; Pappo, A.S.; Killian, J.K.; LaQuaglia, M.P.; Weldon, C.B.; George, S.; Trent, J.C.; von Mehren, M.; Wright, J.A.; Schiffman, J.D.; et al. Molecular Subtypes of KIT/PDGFRA Wild-Type Gastrointestinal Stromal Tumors: A Report From the National Institutes of Health Gastrointestinal Stromal Tumor Clinic. JAMA Oncol. 2016, 2, 922–928. [Google Scholar] [CrossRef] [Green Version]
- Miettinen, M.; Wang, Z.F.; Sarlomo-Rikala, M.; Osuch, C.; Rutkowski, P.; Lasota, J. Succinate dehydrogenase-deficient GISTs: A clinicopathologic, immunohistochemical, and molecular genetic study of 66 gastric GISTs with predilection to young age. Am. J. Surg. Pathol. 2011, 35, 1712–1721. [Google Scholar] [CrossRef] [Green Version]
- Mason, E.F.; Hornick, J.L. Conventional Risk Stratification Fails to Predict Progression of Succinate Dehydrogenase-deficient Gastrointestinal Stromal Tumors: A Clinicopathologic Study of 76 Cases. Am. J. Surg. Pathol. 2016, 40, 1616–1621. [Google Scholar] [CrossRef]
- Brenca, M.; Rossi, S.; Polano, M.; Gasparotto, D.; Zanatta, L.; Racanelli, D.; Valori, L.; Lamon, S.; Dei Tos, A.P.; Maestro, R. Transcriptome sequencing identifies ETV6-NTRK3 as a gene fusion involved in GIST. J. Pathol. 2016, 238, 543–549. [Google Scholar] [CrossRef]
- Shi, E.; Chmielecki, J.; Tang, C.M.; Wang, K.; Heinrich, M.C.; Kang, G.; Corless, C.L.; Hong, D.; Fero, K.E.; Murphy, J.D.; et al. FGFR1 and NTRK3 actionable alterations in “Wild-Type” gastrointestinal stromal tumors. J. Transl. Med. 2016, 14, 339. [Google Scholar] [CrossRef] [Green Version]
- Torrence, D.; Xie, Z.; Zhang, L.; Chi, P.; Antonescu, C.R. Gastrointestinal stromal tumors with BRAF gene fusions. A report of two cases showing low or absent KIT expression resulting in diagnostic pitfalls. Genes Chromosomes Cancer 2021, 60, 789–795. [Google Scholar] [CrossRef]
- Jeggo, P.A.; Lobrich, M. How cancer cells hijack DNA double-strand break repair pathways to gain genomic instability. Biochem. J. 2015, 471, 1–11. [Google Scholar] [CrossRef]
- Lord, C.J.; Ashworth, A. BRCAness revisited. Nat. Rev. Cancer 2016, 16, 110–120. [Google Scholar] [CrossRef] [PubMed]
- Motegi, A.; Masutani, M.; Yoshioka, K.I.; Bessho, T. Aberrations in DNA repair pathways in cancer and therapeutic significances. Semin. Cancer Biol. 2019, 58, 29–46. [Google Scholar] [CrossRef] [PubMed]
- Nesic, K.; Wakefield, M. Targeting DNA repair: The genome as a potential biomarker. J. Pathol. 2018, 244, 586–597. [Google Scholar] [CrossRef]
- Colnaghi, R.; Carpenter, G.; Volker, M.; O’Driscoll, M. The consequences of structural genomic alterations in humans: Genomic disorders, genomic instability and cancer. Semin. Cell Dev. Biol. 2011, 22, 875–885. [Google Scholar] [CrossRef] [PubMed]
- Kwei, K.A.; Kung, Y.; Salari, K.; Holcomb, I.N.; Pollack, J.R. Genomic instability in breast cancer: Pathogenesis and clinical implications. Mol. Oncol. 2010, 4, 255–266. [Google Scholar] [CrossRef] [PubMed]
- Nagelkerke, A.; van Kuijk, S.J.; Sweep, F.C.; Nagtegaal, I.D.; Hoogerbrugge, N.; Martens, J.W.; Timmermans, M.A.; van Laarhoven, H.W.; Bussink, J.; Span, P.N. Constitutive expression of γ-H2AX has prognostic relevance in triple negative breast cancer. Radiother. Oncol. 2011, 101, 39–45. [Google Scholar] [CrossRef] [Green Version]
- Otsubo, R.; Matsuda, K.; Mussazhanova, Z.; Sato, A.; Matsumoto, M.; Yano, H.; Oikawa, M.; Kondo, H.; Ito, M.; Miyauchi, A.; et al. A Novel Diagnostic Method for Thyroid Follicular Tumors Based on Immunofluorescence Analysis of p53-Binding Protein 1 Expression: Detection of Genomic Instability. Thyroid 2019, 29, 657–665. [Google Scholar] [CrossRef]
- Takabayashi, H.; Wakai, T.; Ajioka, Y.; Korita, P.V.; Yamaguchi, N. Alteration of the DNA damage response in colorectal tumor progression. Hum. Pathol. 2013, 44, 1038–1046. [Google Scholar] [CrossRef]
- Chudasama, P.; Mughal, S.S.; Sanders, M.A.; Hubschmann, D.; Chung, I.; Deeg, K.I.; Wong, S.H.; Rabe, S.; Hlevnjak, M.; Zapatka, M. Integrative genomic and transcriptomic analysis of leiomyosarcoma. Nat. Commun. 2018, 9, 144. [Google Scholar] [CrossRef] [Green Version]
- Kovac, M.; Blattmann, C.; Ribi, S.; Smida, J.; Mueller, N.S.; Engert, F.; Castro-Giner, F. Exome sequencing of osteosarcoma reveals mutation signatures reminiscent of BRCA deficiency. Nat. Commun. 2015, 6, 8940. [Google Scholar] [CrossRef]
- Chakraborty, G.; Armenia, J.; Mazzu, Y.Z.; Nandakumar, S.; Stopsack, K.H.; Atiq, M.O.; Komura, K.; Jehane, L.; Hirani, R.; Chadalavada, K.; et al. Significance of BRCA2 and RB1 Co-loss in Aggressive Prostate Cancer Progression. Clin. Cancer Res. 2020, 26, 2047–2064. [Google Scholar] [CrossRef] [PubMed]
- Yang, J.; Du, X.; Lazar, A.J.; Pollock, R.; Hunt, K.; Chen, K.; Hao, X.; Trent, J.; Zhang, W. Genetic aberrations of gastrointestinal stromal tumors. Cancer 2008, 113, 1532–1543. [Google Scholar] [CrossRef] [PubMed] [Green Version]
- Schoppmann, S.F.; Vinatzer, U.; Popitsch, N.; Mittlbock, M.; Liebmann-Reindl, S.; Jomrich, G.; Streubel, B.; Birner, P. Novel clinically relevant genes in gastrointestinal stromal tumors identified by exome sequencing. Clin. Cancer Res. 2013, 19, 5329–5339. [Google Scholar] [CrossRef] [PubMed] [Green Version]
- Romeo, S.; Debiec-Rychter, M.; Van Glabbeke, M.; Van Paassen, H.; Comite, P.; Van Eijk, R.; Oosting, J.; Verweij, J.; Terrier, P.; Schneider, U.; et al. Cell cycle/apoptosis molecule expression correlates with imatinib response in patients with advanced gastrointestinal stromal tumors. Clin. Cancer Res. 2009, 15, 4191–4198. [Google Scholar] [CrossRef] [Green Version]
- Li, C.F.; Liu, T.T.; Wang, J.C.; Yu, S.C.; Chen, Y.Y.; Fang, F.M.; Li, W.S.; Huang, H.Y. Hydroxysteroid 11-Beta Dehydrogenase 1 Overexpression with Copy-Number Gain and Missense Mutations in Primary Gastrointestinal Stromal Tumors. J. Clin. Med. 2018, 7, 408. [Google Scholar] [CrossRef] [Green Version]
- Creytens, D.; van Gorp, J.; Savola, S.; Ferdinande, L.; Mentzel, T.; Libbrecht, L. Atypical spindle cell lipoma: A clinicopathologic, immunohistochemical, and molecular study emphasizing its relationship to classical spindle cell lipoma. Virchows Arch. 2014, 465, 97–108. [Google Scholar] [CrossRef]
- Corless, C.L.; McGreevey, L.; Town, A.; Schroeder, A.; Bainbridge, T.; Harrell, P.; Fletcher, J.A.; Heinrich, M.C. KIT gene deletions at the intron 10-exon 11 boundary in GI stromal tumors. J. Mol. Diagn. 2004, 6, 366–370. [Google Scholar] [CrossRef]
- Heinrich, M.C.; Corless, C.L.; Blanke, C.D.; Demetri, G.D.; Joensuu, H.; Roberts, P.J.; Eisenberg, B.L.; von Mehren, M.; Fletcher, C.D.; Sandau, K.; et al. Molecular correlates of imatinib resistance in gastrointestinal stromal tumors. J. Clin. Oncol. 2006, 24, 4764–4774. [Google Scholar] [CrossRef]
- Heinrich, M.C.; Griffith, D.; McKinley, A.; Patterson, J.; Presnell, A.; Ramachandran, A.; Debiec-Rychter, M. Crenolanib inhibits the drug-resistant PDGFRA D842V mutation associated with imatinib-resistant gastrointestinal stromal tumors. Clin. Cancer Res. 2012, 18, 4375–4384. [Google Scholar] [CrossRef] [Green Version]
- Djuzenova, C.S.; Zimmermann, M.; Katzer, A.; Fiedler, V.; Distel, L.V.; Gasser, M.; Waaga-Gasser, A.M.; Flentje, M.; Polat, B. A prospective study on histone γ-H2AX and 53BP1 foci expression in rectal carcinoma patients: Correlation with radiation therapy-induced outcome. BMC Cancer 2015, 15, 856. [Google Scholar] [CrossRef] [Green Version]
- Jiang, M.; Jia, K.; Wang, L.; Li, W.; Chen, B.; Liu, Y.; Wang, H.; Zhao, S.; He, Y.; Zhou, C. Alterations of DNA damage response pathway: Biomarker and therapeutic strategy for cancer immunotherapy. Acta Pharm. Sin. B 2021, 11, 2983–2994. [Google Scholar] [CrossRef] [PubMed]
- Fernandez, A.; O’Leary, C.; O’Byrne, K.J.; Burgess, J.; Richard, D.J.; Suraweera, A. Epigenetic Mechanisms in DNA Double Strand Break Repair: A Clinical Review. Front. Mol. Biosci. 2021, 8, 685440. [Google Scholar] [CrossRef] [PubMed]
- Belli, M.; Tabocchini, M.A. Ionizing Radiation-Induced Epigenetic Modifications and Their Relevance to Radiation Protection. Int. J. Mol. Sci. 2020, 21, 5993. [Google Scholar] [CrossRef] [PubMed]
- Feng, Y.; Yao, S.; Pu, Z.; Cheng, H.; Fei, B.; Zou, J.; Huang, Z. Identification of New Tumor-Related Gene Mutations in Chinese Gastrointestinal Stromal Tumors. Front. Cell Dev. Biol. 2021, 9, 764275. [Google Scholar] [CrossRef] [PubMed]
- Li, P.; Li, M.; Wang, K.; Liu, Y.; Wang, Y.; Zhao, D.; Chai, J.; Ma, J.; Li, X.; Wei, J.; et al. Genetic alterations in cell cycle regulation-associated genes may promote primary progression of gastrointestinal stromal tumors. Lab. Investig. 2020, 100, 426–437. [Google Scholar] [CrossRef] [PubMed]
- Heinrich, M.C.; Patterson, J.; Beadling, C.; Wang, Y.; Debiec-Rychter, M.; Dewaele, B.; Corless, C.L.; Duensing, A.; Raut, C.P.; Rubin, B.; et al. Genomic aberrations in cell cycle genes predict progression of KIT-mutant gastrointestinal stromal tumors (GISTs). Clin. Sarcoma Res. 2019, 9, 3. [Google Scholar] [CrossRef] [PubMed]
- Du, J.; Wang, S.; Wang, R.; Wang, S.Y.; Han, Q.; Xu, H.T.; Yang, P.; Liu, Y. Identifying Secondary Mutations in Chinese Patients with Imatinib-Resistant Gastrointestinal Stromal Tumors (GISTs) by Next Generation Sequencing (NGS). Pathol. Oncol. Res. 2020, 26, 91–100. [Google Scholar] [CrossRef]
- Merten, L.; Agaimy, A.; Moskalev, E.A.; Giedl, J.; Kayser, C.; Geddert, H.; Schaefer, I.M.; Cameron, S.; Werner, M.; Strobel, P.; et al. Inactivating Mutations of RB1 and TP53 Correlate with Sarcomatous Histomorphology and Metastasis/Recurrence in Gastrointestinal Stromal Tumors. Am. J. Clin. Pathol. 2016, 146, 718–726. [Google Scholar] [CrossRef] [Green Version]
- Nizic-Kos, T.; Krajc, M.; Blatnik, A.; Stegel, V.; Skerl, P.; Novakovic, S.; Gazic, B.; Besic, N. Bilateral Disease Common Among Slovenian CHEK2-Positive Breast Cancer Patients. Ann. Surg. Oncol. 2021, 28, 2561–2570. [Google Scholar] [CrossRef]
- Takai, H.; Naka, K.; Okada, Y.; Watanabe, M.; Harada, N.; Saito, S.; Anderson, C.W.; Appella, E.; Nakanishi, M.; Suzuki, H.; et al. Chk2-deficient mice exhibit radioresistance and defective p53-mediated transcription. EMBO J. 2002, 21, 5195–5205. [Google Scholar] [CrossRef]
- Zannini, L.; Delia, D.; Buscemi, G. CHK2 kinase in the DNA damage response and beyond. J. Mol. Cell Biol. 2014, 6, 442–457. [Google Scholar] [CrossRef] [PubMed] [Green Version]
- Antoni, L.; Sodha, N.; Collins, I.; Garrett, M.D. CHK2 kinase: Cancer susceptibility and cancer therapy—Two sides of the same coin? Nat. Rev. Cancer 2007, 7, 925–936. [Google Scholar] [CrossRef] [PubMed]
- Knudson, A.G. Two genetic hits (more or less) to cancer. Nat. Rev. Cancer 2001, 1, 157–162. [Google Scholar] [CrossRef] [PubMed]
- Kato, N.; Fujimoto, H.; Yoda, A.; Oishi, I.; Matsumura, N.; Kondo, T.; Tsukada, J.; Tanaka, Y.; Imamura, M.; Minami, Y. Regulation of Chk2 gene expression in lymphoid malignancies: Involvement of epigenetic mechanisms in Hodgkin’s lymphoma cell lines. Cell Death Differ. 2004, 11 (Suppl. 2), S153–S161. [Google Scholar] [CrossRef] [PubMed] [Green Version]
- Zhang, P.; Wang, J.; Gao, W.; Yuan, B.Z.; Rogers, J.; Reed, E. CHK2 kinase expression is down-regulated due to promoter methylation in non-small cell lung cancer. Mol. Cancer 2004, 3, 14. [Google Scholar] [CrossRef] [Green Version]
- Li, Y.; Geng, P.; Jiang, W.; Wang, Y.; Yao, J.; Lin, X.; Liu, J.; Huang, L.; Su, B.; Chen, H. Enhancement of radiosensitivity by 5-Aza-CdR through activation of G2/M checkpoint response and apoptosis in osteosarcoma cells. Tumour Biol. 2014, 35, 4831–4839. [Google Scholar] [CrossRef]
- Tan, Y.; Raychaudhuri, P.; Costa, R.H. Chk2 mediates stabilization of the FoxM1 transcription factor to stimulate expression of DNA repair genes. Mol. Cell Biol. 2007, 27, 1007–1016. [Google Scholar] [CrossRef] [Green Version]
- Indovina, P.; Marcelli, E.; Casini, N.; Rizzo, V.; Giordano, A. Emerging roles of RB family: New defense mechanisms against tumor progression. J. Cell. Physiol. 2013, 228, 525–535. [Google Scholar] [CrossRef]
- Manickavinayaham, S.; Velez-Cruz, R.; Biswas, A.K.; Chen, J.; Guo, R.; Johnson, D.G. The E2F1 transcription factor and RB tumor suppressor moonlight as DNA repair factors. Cell Cycle 2020, 19, 2260–2269. [Google Scholar] [CrossRef]
- Gonzalez-Vasconcellos, I.; Anastasov, N.; Sanli-Bonazzi, B.; Klymenko, O.; Atkinson, M.J.; Rosemann, M. Rb1 haploinsufficiency promotes telomere attrition and radiation-induced genomic instability. Cancer Res. 2013, 73, 4247–4255. [Google Scholar] [CrossRef] [Green Version]


| Parameters | rH2AX H-Score | p-Value | rH2AX IF | p-Value | 53BP1 H-Score | p-Value | 53BP1 IF | p-Value | ||||
|---|---|---|---|---|---|---|---|---|---|---|---|---|
| Low | High | Low | High | Low | High | Low | High | |||||
| Sex | 0.121 | 0.825 | 0.237 | 0.121 | ||||||||
| Male | 21 | 28 | 24 | 25 | 26 | 23 | 28 | 21 | ||||
| Female | 21 | 14 | 18 | 17 | 14 | 21 | 14 | 21 | ||||
| Age (years) & | 60.5 ± 12.821 | 64.19 ± 12.451 | 0.243 | 60.5 ± 11.171 | 64.19 ± 13.952 | 0.088 | 60.7 ± 13.885 | 63.84 ± 11.471 | 0.373 | 62.48 ± 12.547 | 62.21 ± 12.998 | 0.9 |
| Location | 0.005 * | 0.637 | 0.514 | 0.3445 | ||||||||
| Gastric | 35 | 23 | 30 | 28 | 29 | 29 | 27 | 31 | ||||
| Non-gastric | 7 | 19 | 12 | 14 | 11 | 15 | 15 | 11 | ||||
| Histologic Type | 0.266 | 0.266 | 0.145 | 0.578 | ||||||||
| Spindle | 36 | 32 | 36 | 32 | 35 | 33 | 35 | 33 | ||||
| Epithelioid and mixed | 6 | 10 | 6 | 10 | 5 | 11 | 7 | 9 | ||||
| Tumor size (cm) | 3.785 ± 1.877 | 6.227 ± 4.803 | 0.01 * | 4.212 ± 2.538 | 5.8 ± 4.681 | 0.128 | 4.128 ± 2.25 | 5.843 ± 4.757 | 0.091 | 4.622 ± 3.577 | 5.390 ± 4.068 | 0.244 |
| <5 cm | 33 | 23 | 0.018 * | 31 | 25 | 0.154 | 30 | 26 | 0.203 | 30 | 26 | 0.342 |
| >5 cm | 8 | 18 | 10 | 16 | 10 | 16 | 11 | 15 | ||||
| Mitotic count (50HPFs) & | 1.74 ± 1.149 | 8.46 ± 9.998 | <0.001 * | 2.91 ± 6.818 | 7.26 ± 8.201 | <0.001 * | 3.08 ± 6.893 | 6.91 ± 8.214 | 0.016 * | 2.95 ± 6.811 | 7.22 ± 8.233 | 0.001 * |
| NIH Risk | <0.001 * | 0.001 * | 0.001 * | 0.007 * | ||||||||
| Low/very low | 34 | 14 | 32 | 16 | 30 | 18 | 31 | 17 | ||||
| Intermediate | 8 | 9 | 7 | 10 | 8 | 9 | 6 | 11 | ||||
| High | 0 | 19 | 3 | 16 | 2 | 17 | 5 | 14 | ||||
| NCCN guideline | <0.001 * | <0.001 * | <0.001 * | 0.002 * | ||||||||
| None/very low | 29 | 11 | 25 | 15 | 25 | 15 | 24 | 16 | ||||
| Low | 12 | 4 | 13 | 3 | 11 | 5 | 12 | 4 | ||||
| Moderate | 1 | 10 | 2 | 9 | 2 | 9 | 2 | 9 | ||||
| High | 0 | 17 | 2 | 15 | 2 | 15 | 4 | 13 | ||||
| Parameters | RB1 Dosage | p-Value | BRCA2 Dosage | p-Value | CHEK2 Dosage | p-Value | |||
|---|---|---|---|---|---|---|---|---|---|
| DQ > 0.7 | DQ ≤ 0.7 | DQ > 0.7 | DQ ≤ 0.7 | DQ > 0.7 | DQ ≤ 0.7 | ||||
| Sex | 0.107 | 0.564 | 0.201 | ||||||
| Male | 26 | 1 | 24 | 3 | 5 | 22 | |||
| Female | 11 | 3 | 12 | 2 | 5 | 9 | |||
| Age (years) & | 64.08 ± 11.15 | 64.25 ± 17.86 | 1 | 62.39 ± 11.22 | 76.4 ± 6.5 | 0.005 * | 58.1 ± 9.28 | 66.03 ± 11.81 | 0.033 * |
| Location | 0.013 * | 0.249 | 0.54 | ||||||
| Gastric | 26 | 0 | 24 | 2 | 6 | 20 | |||
| Non-gastric | 11 | 4 | 12 | 3 | 4 | 11 | |||
| Histologic Type | 0.288 | 0.11 | 0.546 | ||||||
| Spindle | 28 | 2 | 28 | 2 | 7 | 23 | |||
| Epithelioid and mixed | 9 | 2 | 8 | 3 | 3 | 8 | |||
| Tumor size (cm) | 0.283 | 0.308 | 0.475 | ||||||
| <5 cm | 23 | 1 | 22 | 2 | 6 | 18 | |||
| >5 cm | 13 | 3 | 13 | 3 | 3 | 13 | |||
| Mitotic count (50HPFs) & | 4.14 ± 5.75 | 15.5 ± 12.58 | 0.005 * | 5.11 ± 7.64 | 6.4 ± 5.18 | 0.449 | 7.4 ± 10.8 | 4.57 ± 5.83 | 0.89 |
| NIH Risk | 0.001 * | 0.086 | 0.405 | ||||||
| Low/very low | 17 | 0 | 15 | 2 | 3 | 14 | |||
| Intermediate | 14 | 0 | 14 | 0 | 3 | 11 | |||
| High | 6 | 4 | 7 | 3 | 4 | 6 | |||
| NCCN guideline | 0.003 * | 0.23 | 0.397 | ||||||
| None/very low | 14 | 0 | 13 | 1 | 4 | 10 | |||
| Low | 10 | 0 | 9 | 1 | 1 | 9 | |||
| Moderate | 7 | 0 | 7 | 0 | 1 | 6 | |||
| High | 6 | 4 | 7 | 3 | 4 | 6 | |||
| rH2AX H-score | 0.143 | 0.341 | 0.612 | ||||||
| Low | 16 | 0 | 15 | 1 | 4 | 12 | |||
| High | 21 | 4 | 21 | 4 | 6 | 19 | |||
| rH2AX IF | 0.143 | 0.071 | 0.325 | ||||||
| Low | 16 | 0 | 16 | 0 | 5 | 11 | |||
| High | 21 | 4 | 20 | 5 | 5 | 20 | |||
| 53BP1 H-score | 0.048 * | 0.156 | 0.607 | ||||||
| Low | 21 | 0 | 20 | 1 | 5 | 16 | |||
| High | 16 | 4 | 16 | 4 | 5 | 15 | |||
| 53BP1 IF | 0.118 | 0.258 | 0.535 | ||||||
| Low | 18 | 0 | 17 | 1 | 4 | 14 | |||
| High | 19 | 4 | 19 | 4 | 6 | 17 | |||
| Parameters | rH2AX H-Score | p-Value | 53BP1 H-Score | p-Value | ||
|---|---|---|---|---|---|---|
| Low | High | Low | High | |||
| Sex | 0.889 | 0.372 | ||||
| Male | 65 | 69 | 63 | 71 | ||
| Female | 72 | 79 | 79 | 72 | ||
| Age (years) & | 60.57 ± 12.36 | 59.12 ± 12.01 | 0.395 | 58.82 ± 13.35 | 60.8 ± 10.94 | 0.158 |
| Location | 0.097 | 0.359 | ||||
| Gastric | 97 | 91 | 90 | 98 | ||
| Non-gastric | 40 | 57 | 52 | 45 | ||
| Histologic Type | 0.012 * | <0.001 * | ||||
| Spindle | 108 | 98 | 118 | 88 | ||
| Epithelioid and mixed | 27 | 49 | 23 | 53 | ||
| Tumor size (cm) | 0.081 | 0.001 * | ||||
| ≤5 cm | 63 | 53 | 72 | 44 | ||
| >5 cm | 74 | 95 | 70 | 99 | ||
| Mitotic count (50HPFs) & | 8.72 ± 23.68 | 9.95 ± 21.95 | 0.021 * | 4.79 ± 16.08 | 13.89 ± 27.17 | <0.001 * |
| NIH Risk | 0.002 * | <0.001 * | ||||
| Low/very low | 52 | 30 | 63 | 19 | ||
| Intermediate | 50 | 59 | 51 | 58 | ||
| High | 35 | 59 | 28 | 66 | ||
| NCCN guideline # | ||||||
| None/very low | 38 | 17 | <0.001 * | 41 | 14 | <0.001 * |
| Low | 51 | 37 | 60 | 28 | ||
| Moderate | 19 | 45 | 17 | 47 | ||
| High | 28 | 49 | 23 | 54 | ||
| Genotypes | 0.449 | 0.015 * | ||||
| Other mutant and wild types | 100 | 102 | 110 | 92 | ||
| 5′ deletion of KIT exon-11 | 37 | 46 | 32 | 51 | ||
| Parameters | Univariate Analysis | Multivariate Analysis | ||||
|---|---|---|---|---|---|---|
| No. Case | No. Event | p-Value | HR | 95% CI | p-Value | |
| Sex | 0.563 | |||||
| Male | 134 | 30 | ||||
| Female | 151 | 31 | ||||
| Age (years) | 0.1 | |||||
| <70 | 214 | 41 | ||||
| ≥70 | 71 | 20 | ||||
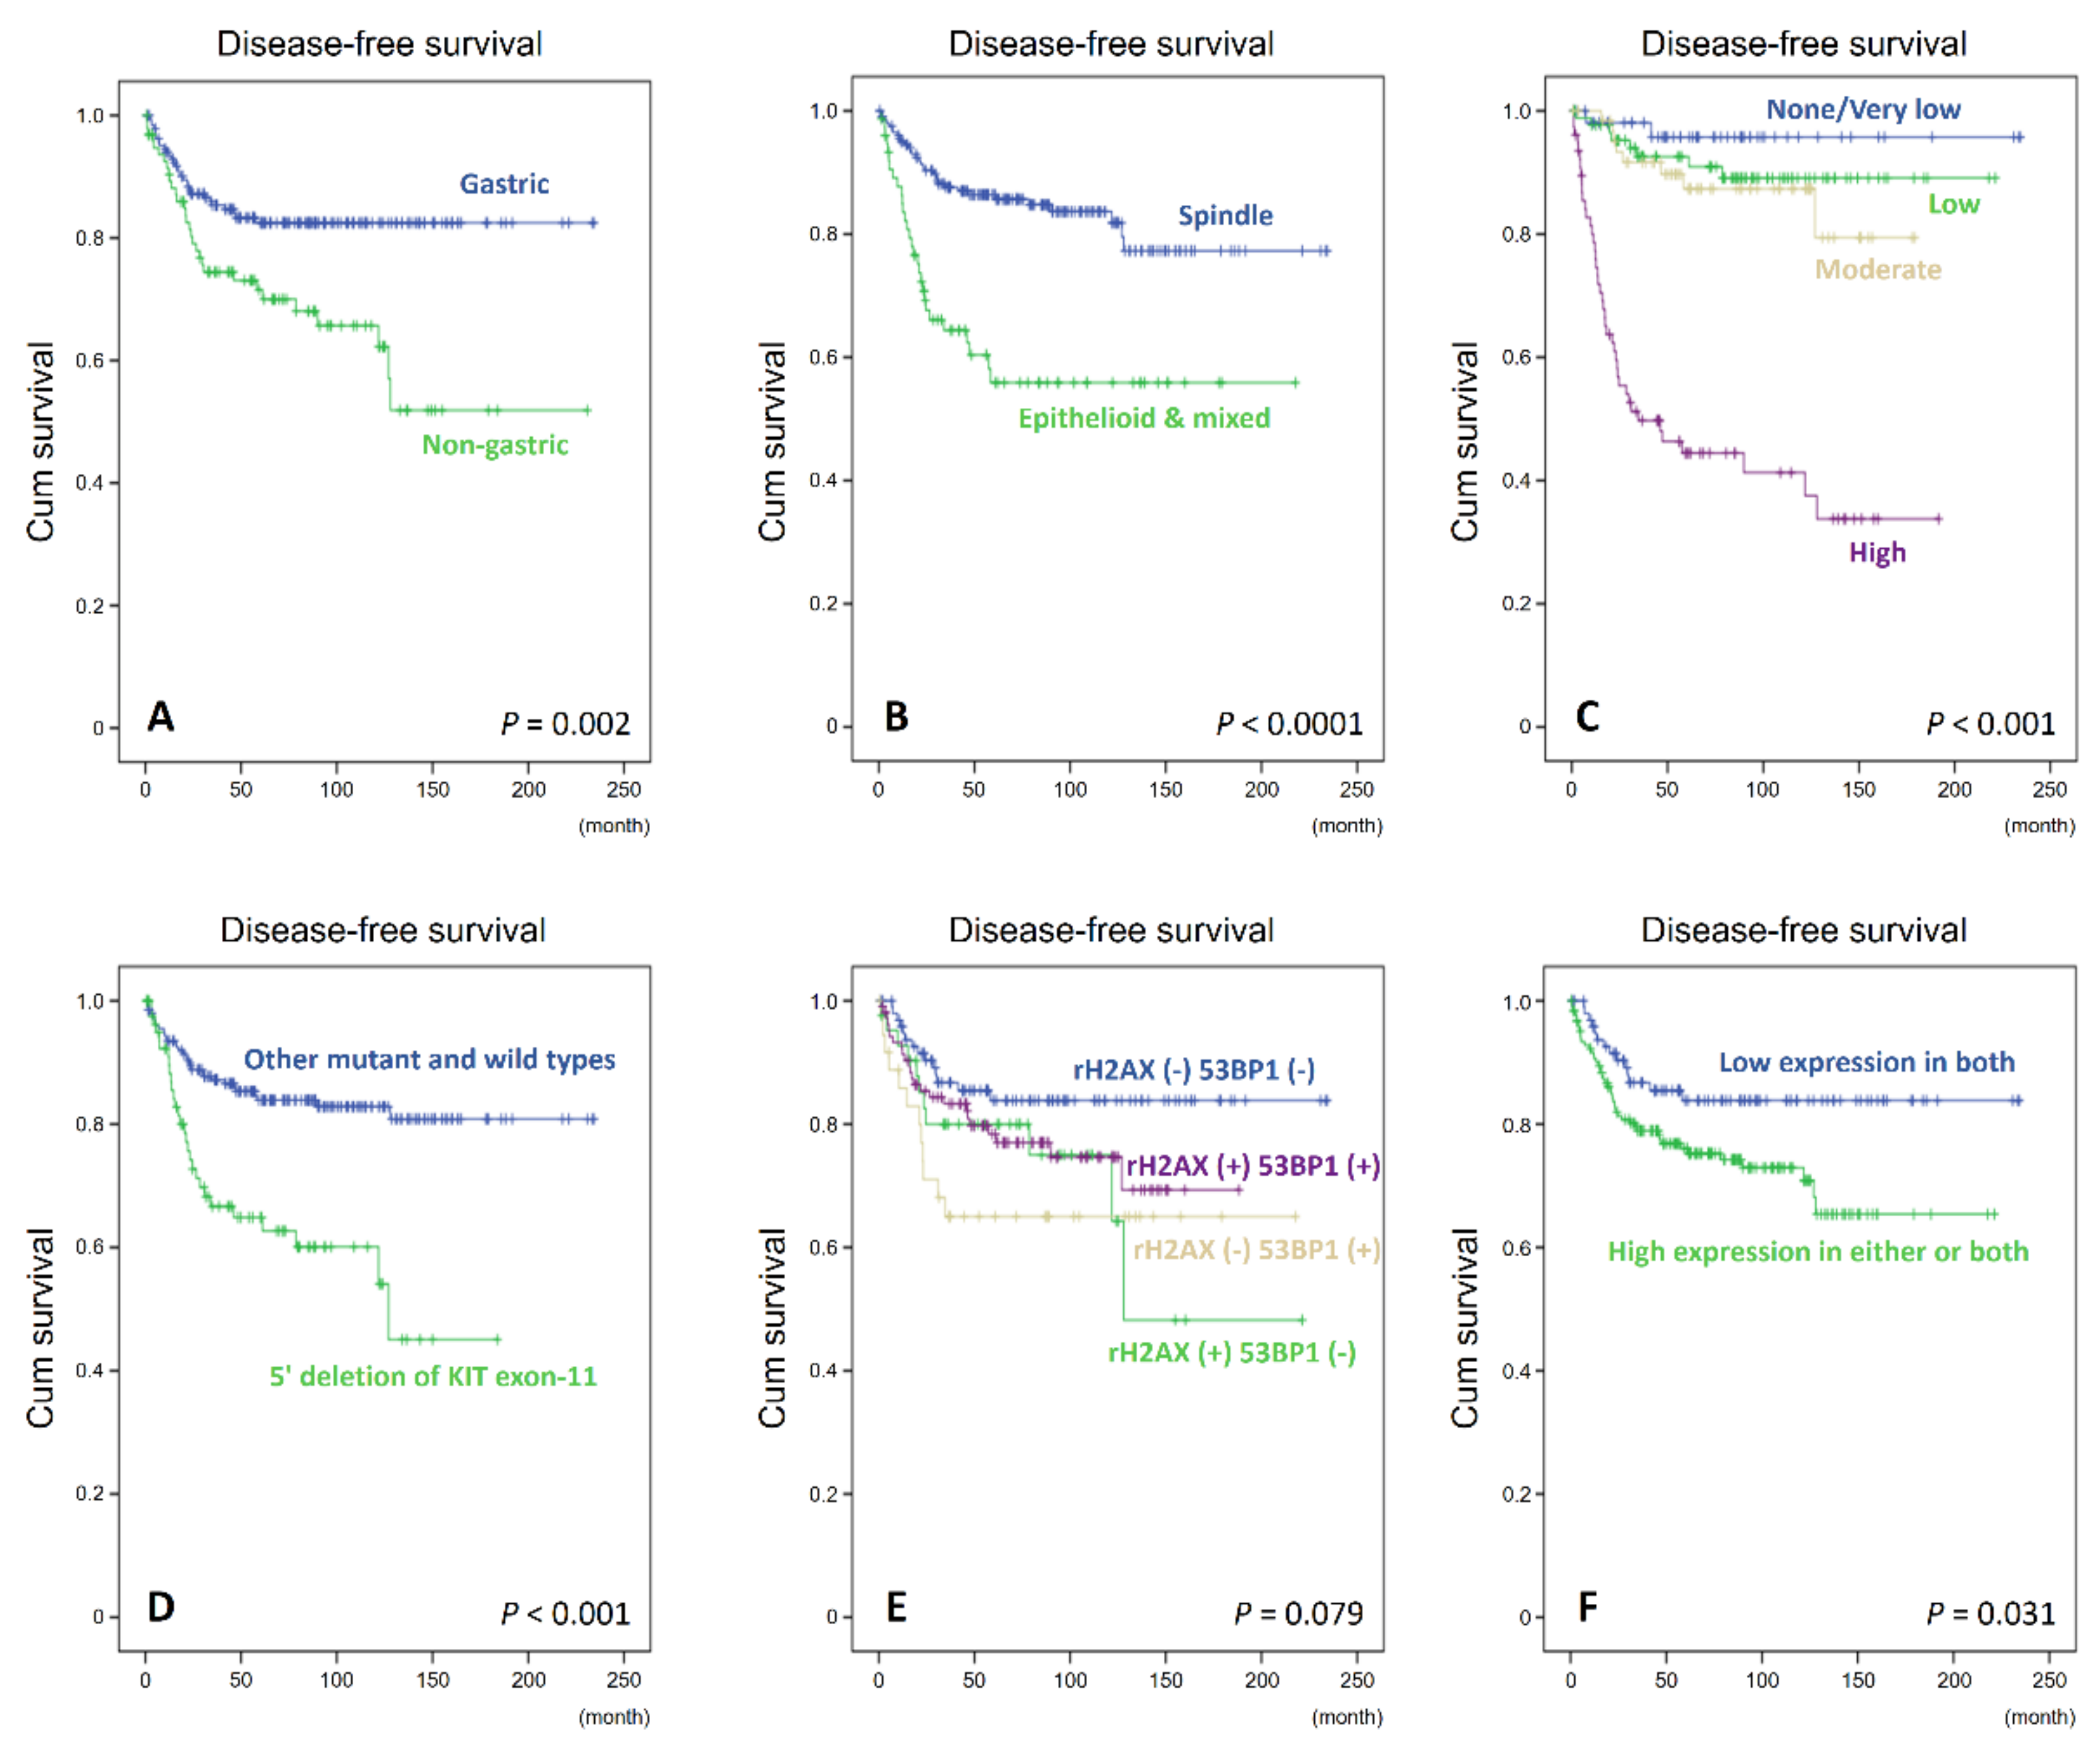
| Location | 0.002 * | 0.237 | ||||
| Gastric | 188 | 30 | 1 | - | ||
| Non-gastric | 97 | 31 | 1.365 | 0.815–2.289 | ||
| Histologic Type | <0.0001 * | 0.033 * | ||||
| Spindle | 206 | 32 | 1 | - | ||
| Epithelioid and mixed | 77 | 29 | 1.8 | 1.048–3.093 | ||
| Tumor size (cm) | <0.001 * | |||||
| ≤5 cm | 116 | 10 | ||||
| >5; ≤10 cm | 119 | 25 | ||||
| ≥10 cm | 50 | 26 | ||||
| Mitotic count (50HPFs) | <0.001 * | |||||
| 0–5 | 197 | 24 | ||||
| 6–10 | 43 | 9 | ||||
| >10 | 45 | 28 | ||||
| NCCN guideline # | <0.001 * | <0.001 * | ||||
| None/very low | 55 | 2 | 1 | - | ||
| Low | 88 | 8 | 2.05 | 0.431–9.743 | ||
| Moderate | 64 | 8 | 2.518 | 0.514–12.339 | ||
| High | 77 | 43 | 14.612 | 3.355–63.641 | ||
| Genotypes | <0.001 * | 0.005 * | ||||
| Other mutant and wild types | 202 | 32 | 1 | - | ||
| 5′ deletion of KIT exon-11 | 83 | 29 | 2.12 | 1.23–3.568 | ||
| rH2AX expression | 0.403 | |||||
| Low expression | 137 | 26 | ||||
| High expression | 148 | 35 | ||||
| 53BP1 expression | 0.125 | |||||
| Low expression | 142 | 25 | ||||
| High expression | 143 | 36 | ||||
| Combinations of rH2AX and 53BP1 | 0.031 * | 0.537 | ||||
| Low expression in both | 100 | 14 | 1 | - | ||
| High expression in either or both | 185 | 47 | 0.815 | 0.426–1.559 | ||
Publisher’s Note: MDPI stays neutral with regard to jurisdictional claims in published maps and institutional affiliations. |
© 2022 by the authors. Licensee MDPI, Basel, Switzerland. This article is an open access article distributed under the terms and conditions of the Creative Commons Attribution (CC BY) license (https://creativecommons.org/licenses/by/4.0/).
Share and Cite
Liu, T.-T.; Li, C.-F.; Tan, K.-T.; Jan, Y.-H.; Lee, P.-H.; Huang, C.-H.; Yu, S.-C.; Tsao, C.-F.; Wang, J.-C.; Huang, H.-Y. Characterization of Aberrations in DNA Damage Repair Pathways in Gastrointestinal Stromal Tumors: The Clinicopathologic Relevance of γH2AX and 53BP1 in Correlation with Heterozygous Deletions of CHEK2, BRCA2, and RB1. Cancers 2022, 14, 1787. https://doi.org/10.3390/cancers14071787
Liu T-T, Li C-F, Tan K-T, Jan Y-H, Lee P-H, Huang C-H, Yu S-C, Tsao C-F, Wang J-C, Huang H-Y. Characterization of Aberrations in DNA Damage Repair Pathways in Gastrointestinal Stromal Tumors: The Clinicopathologic Relevance of γH2AX and 53BP1 in Correlation with Heterozygous Deletions of CHEK2, BRCA2, and RB1. Cancers. 2022; 14(7):1787. https://doi.org/10.3390/cancers14071787
Chicago/Turabian StyleLiu, Ting-Ting, Chien-Feng Li, Kien-Thiam Tan, Yi-Hua Jan, Pei-Hang Lee, Chih-Hao Huang, Shih-Chen Yu, Cheng-Feng Tsao, Jui-Chu Wang, and Hsuan-Ying Huang. 2022. "Characterization of Aberrations in DNA Damage Repair Pathways in Gastrointestinal Stromal Tumors: The Clinicopathologic Relevance of γH2AX and 53BP1 in Correlation with Heterozygous Deletions of CHEK2, BRCA2, and RB1" Cancers 14, no. 7: 1787. https://doi.org/10.3390/cancers14071787