
Machine Learning Using Real-World and Translational Data to Improve Treatment Selection for NSCLC Patients Treated with Immunotherapy

 , ,
, ,  , , , ,
  and
and  add
Show full author list
add
Show full author list
Abstract
:Simple Summary
Abstract
1. Introduction
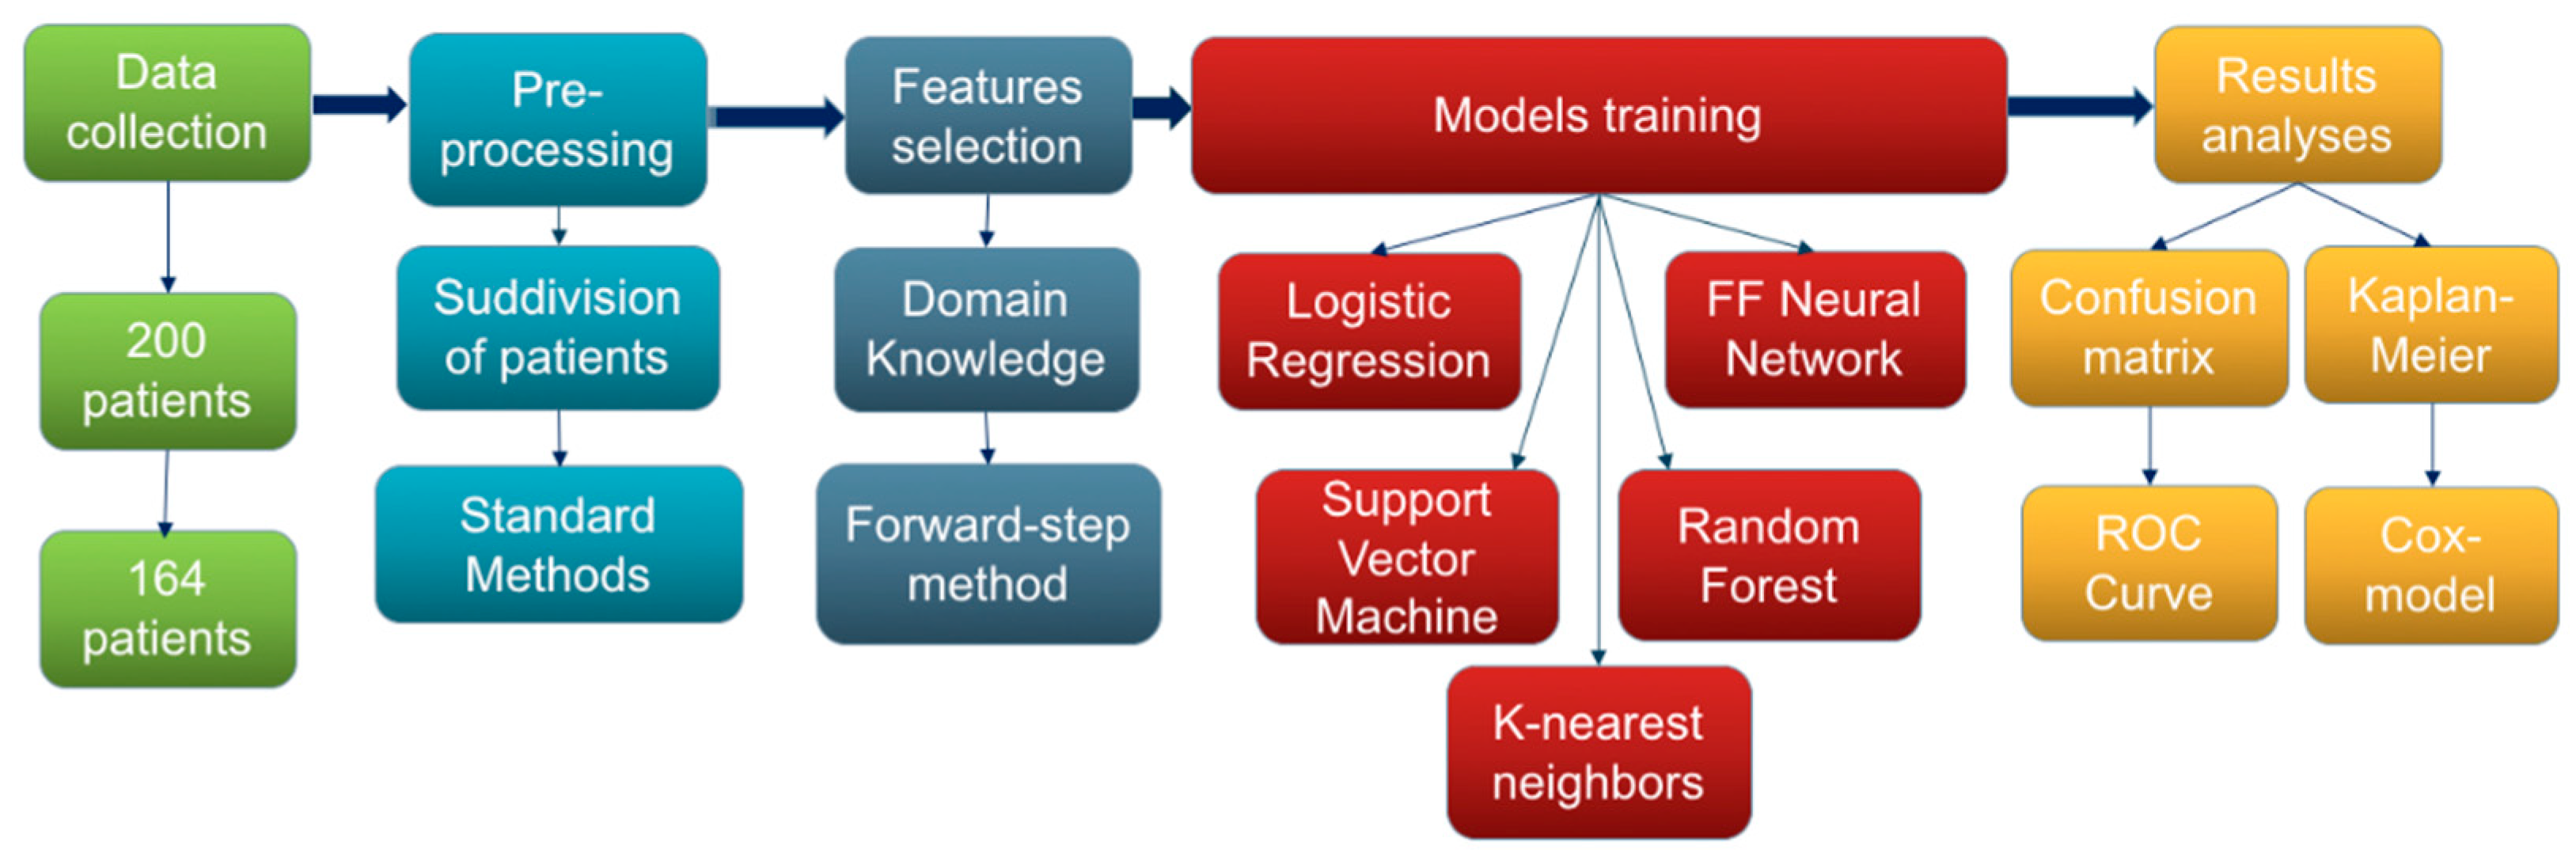
2. Materials and Methods
2.1. Study Population
2.2. Real World Data Collection: Clinical, Blood, and Tissue Data
2.3. Omic Collection: MSC Blood Test
2.4. Treatment Administration
2.5. Radiological Response Evaluation
3. Statistics and AI Methodology
3.1. Statistical Analysis
3.2. Machine Learning Methods
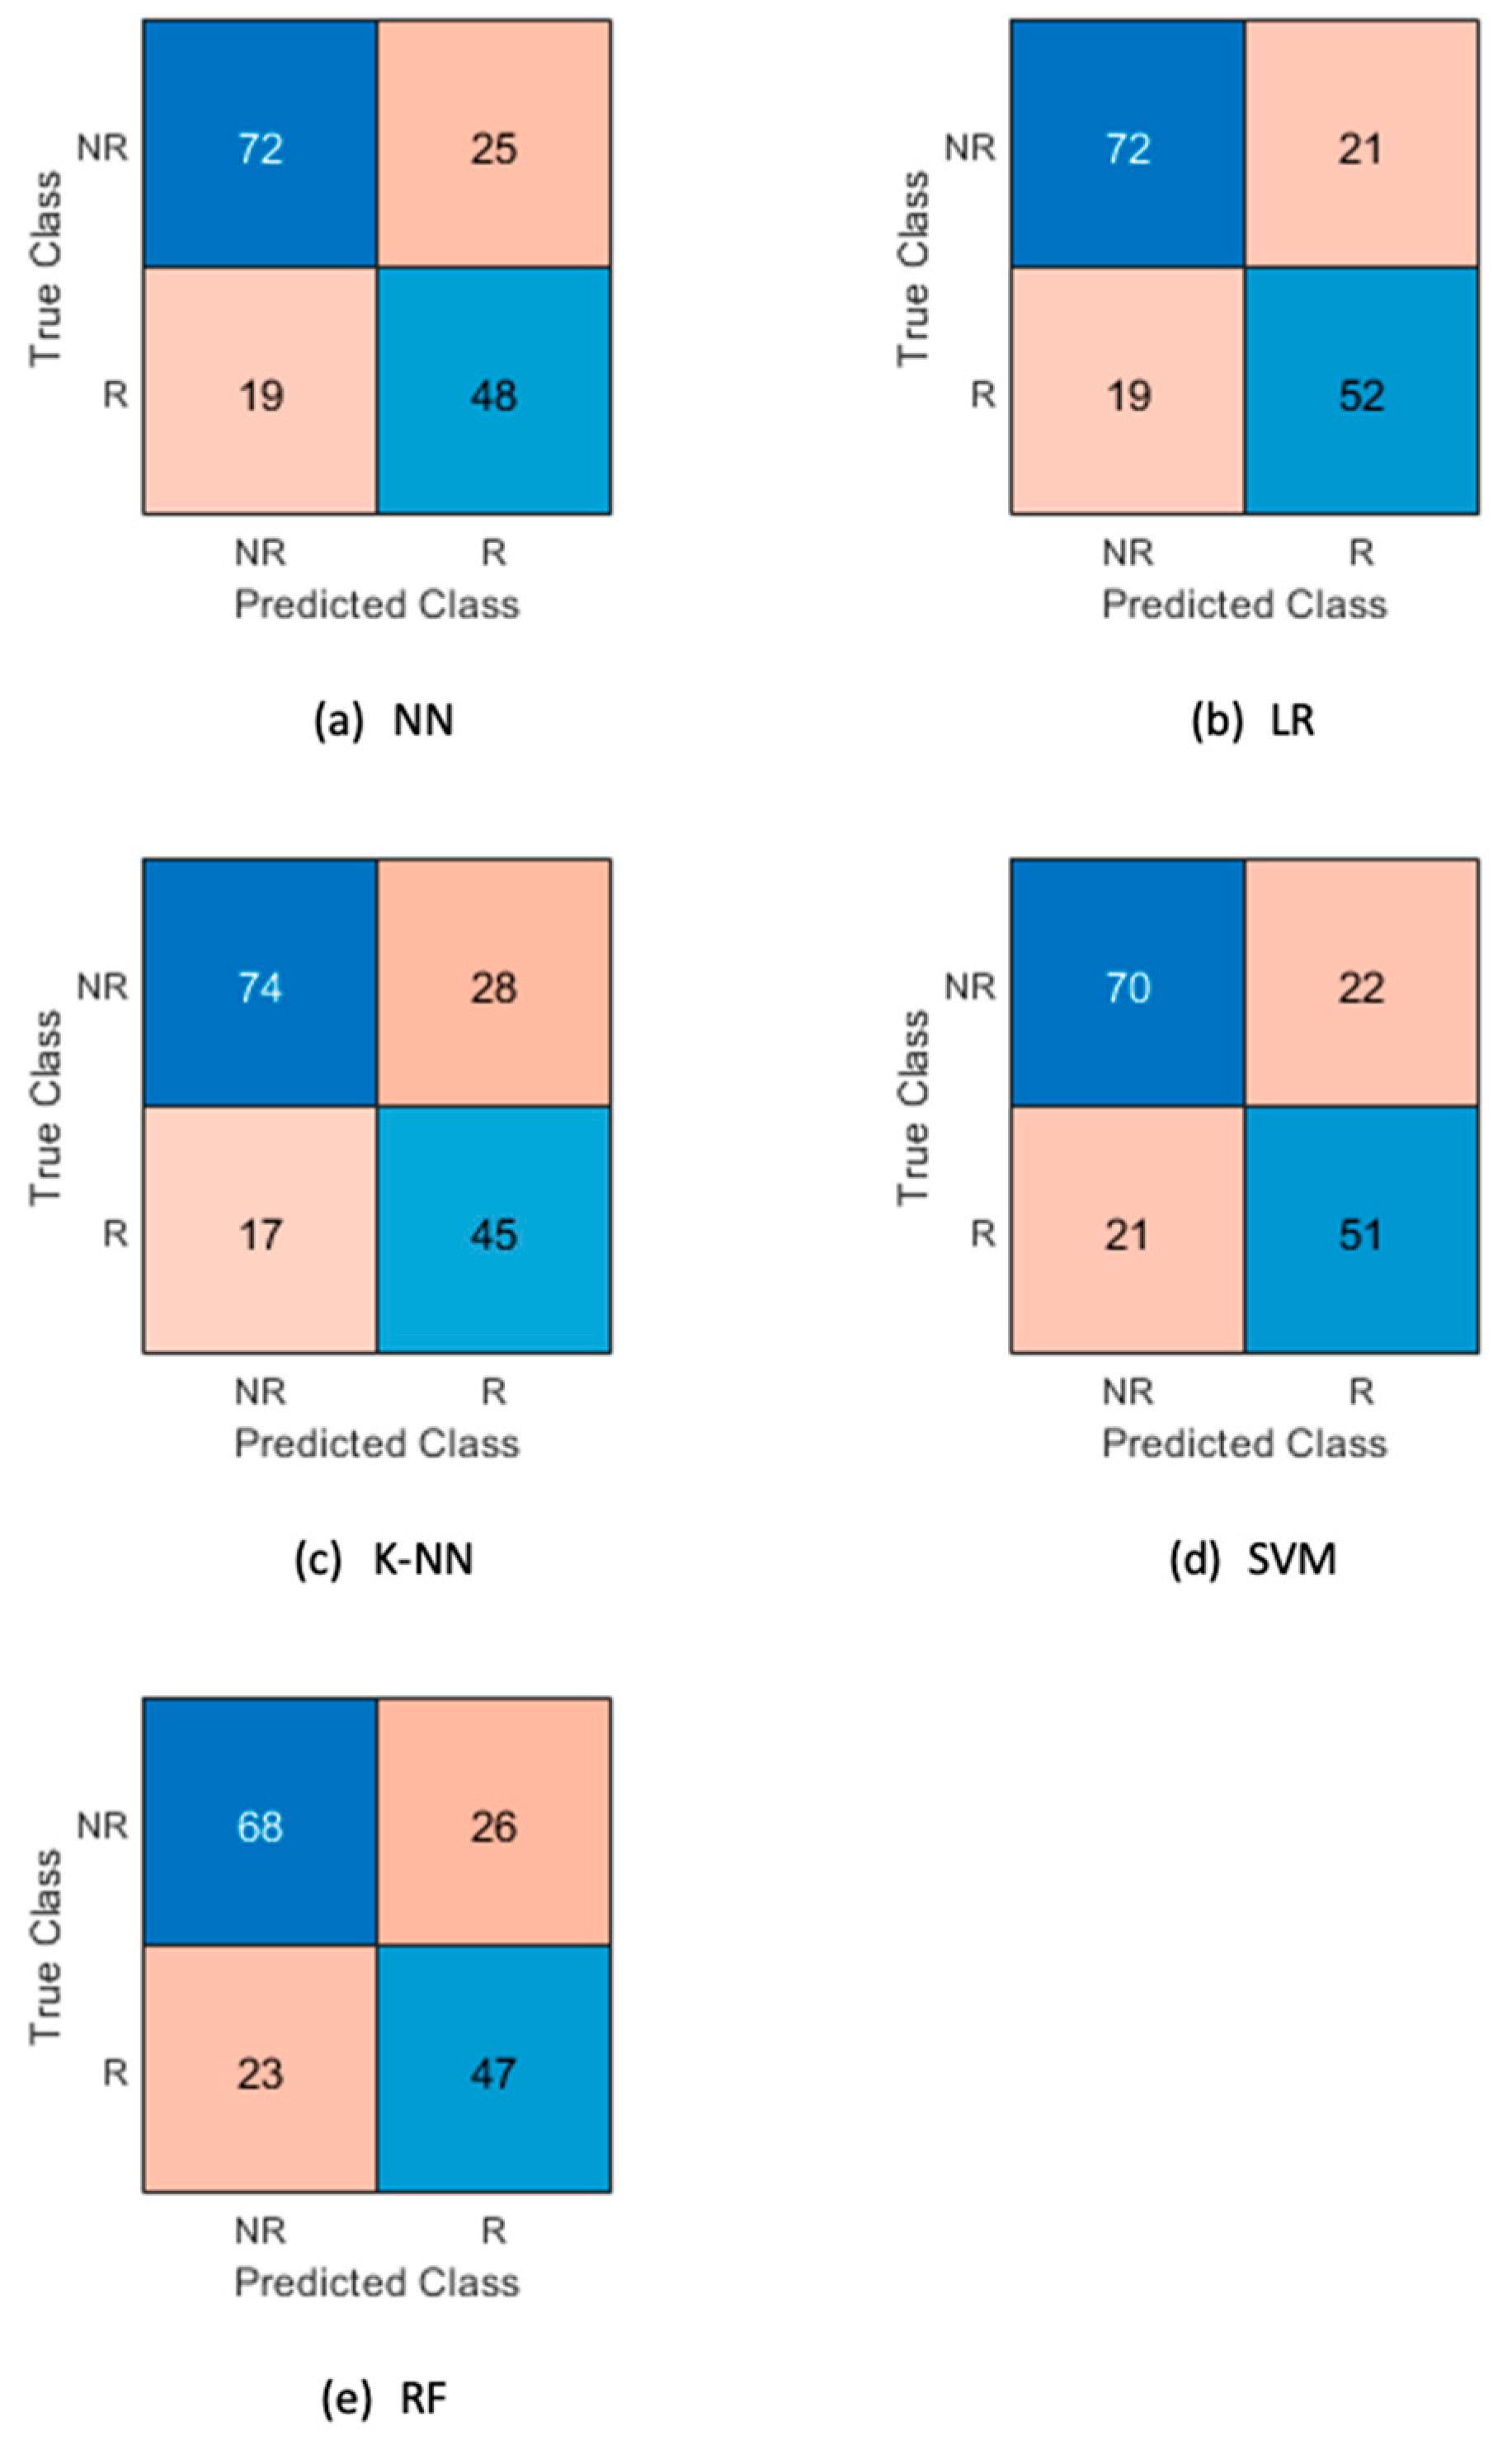
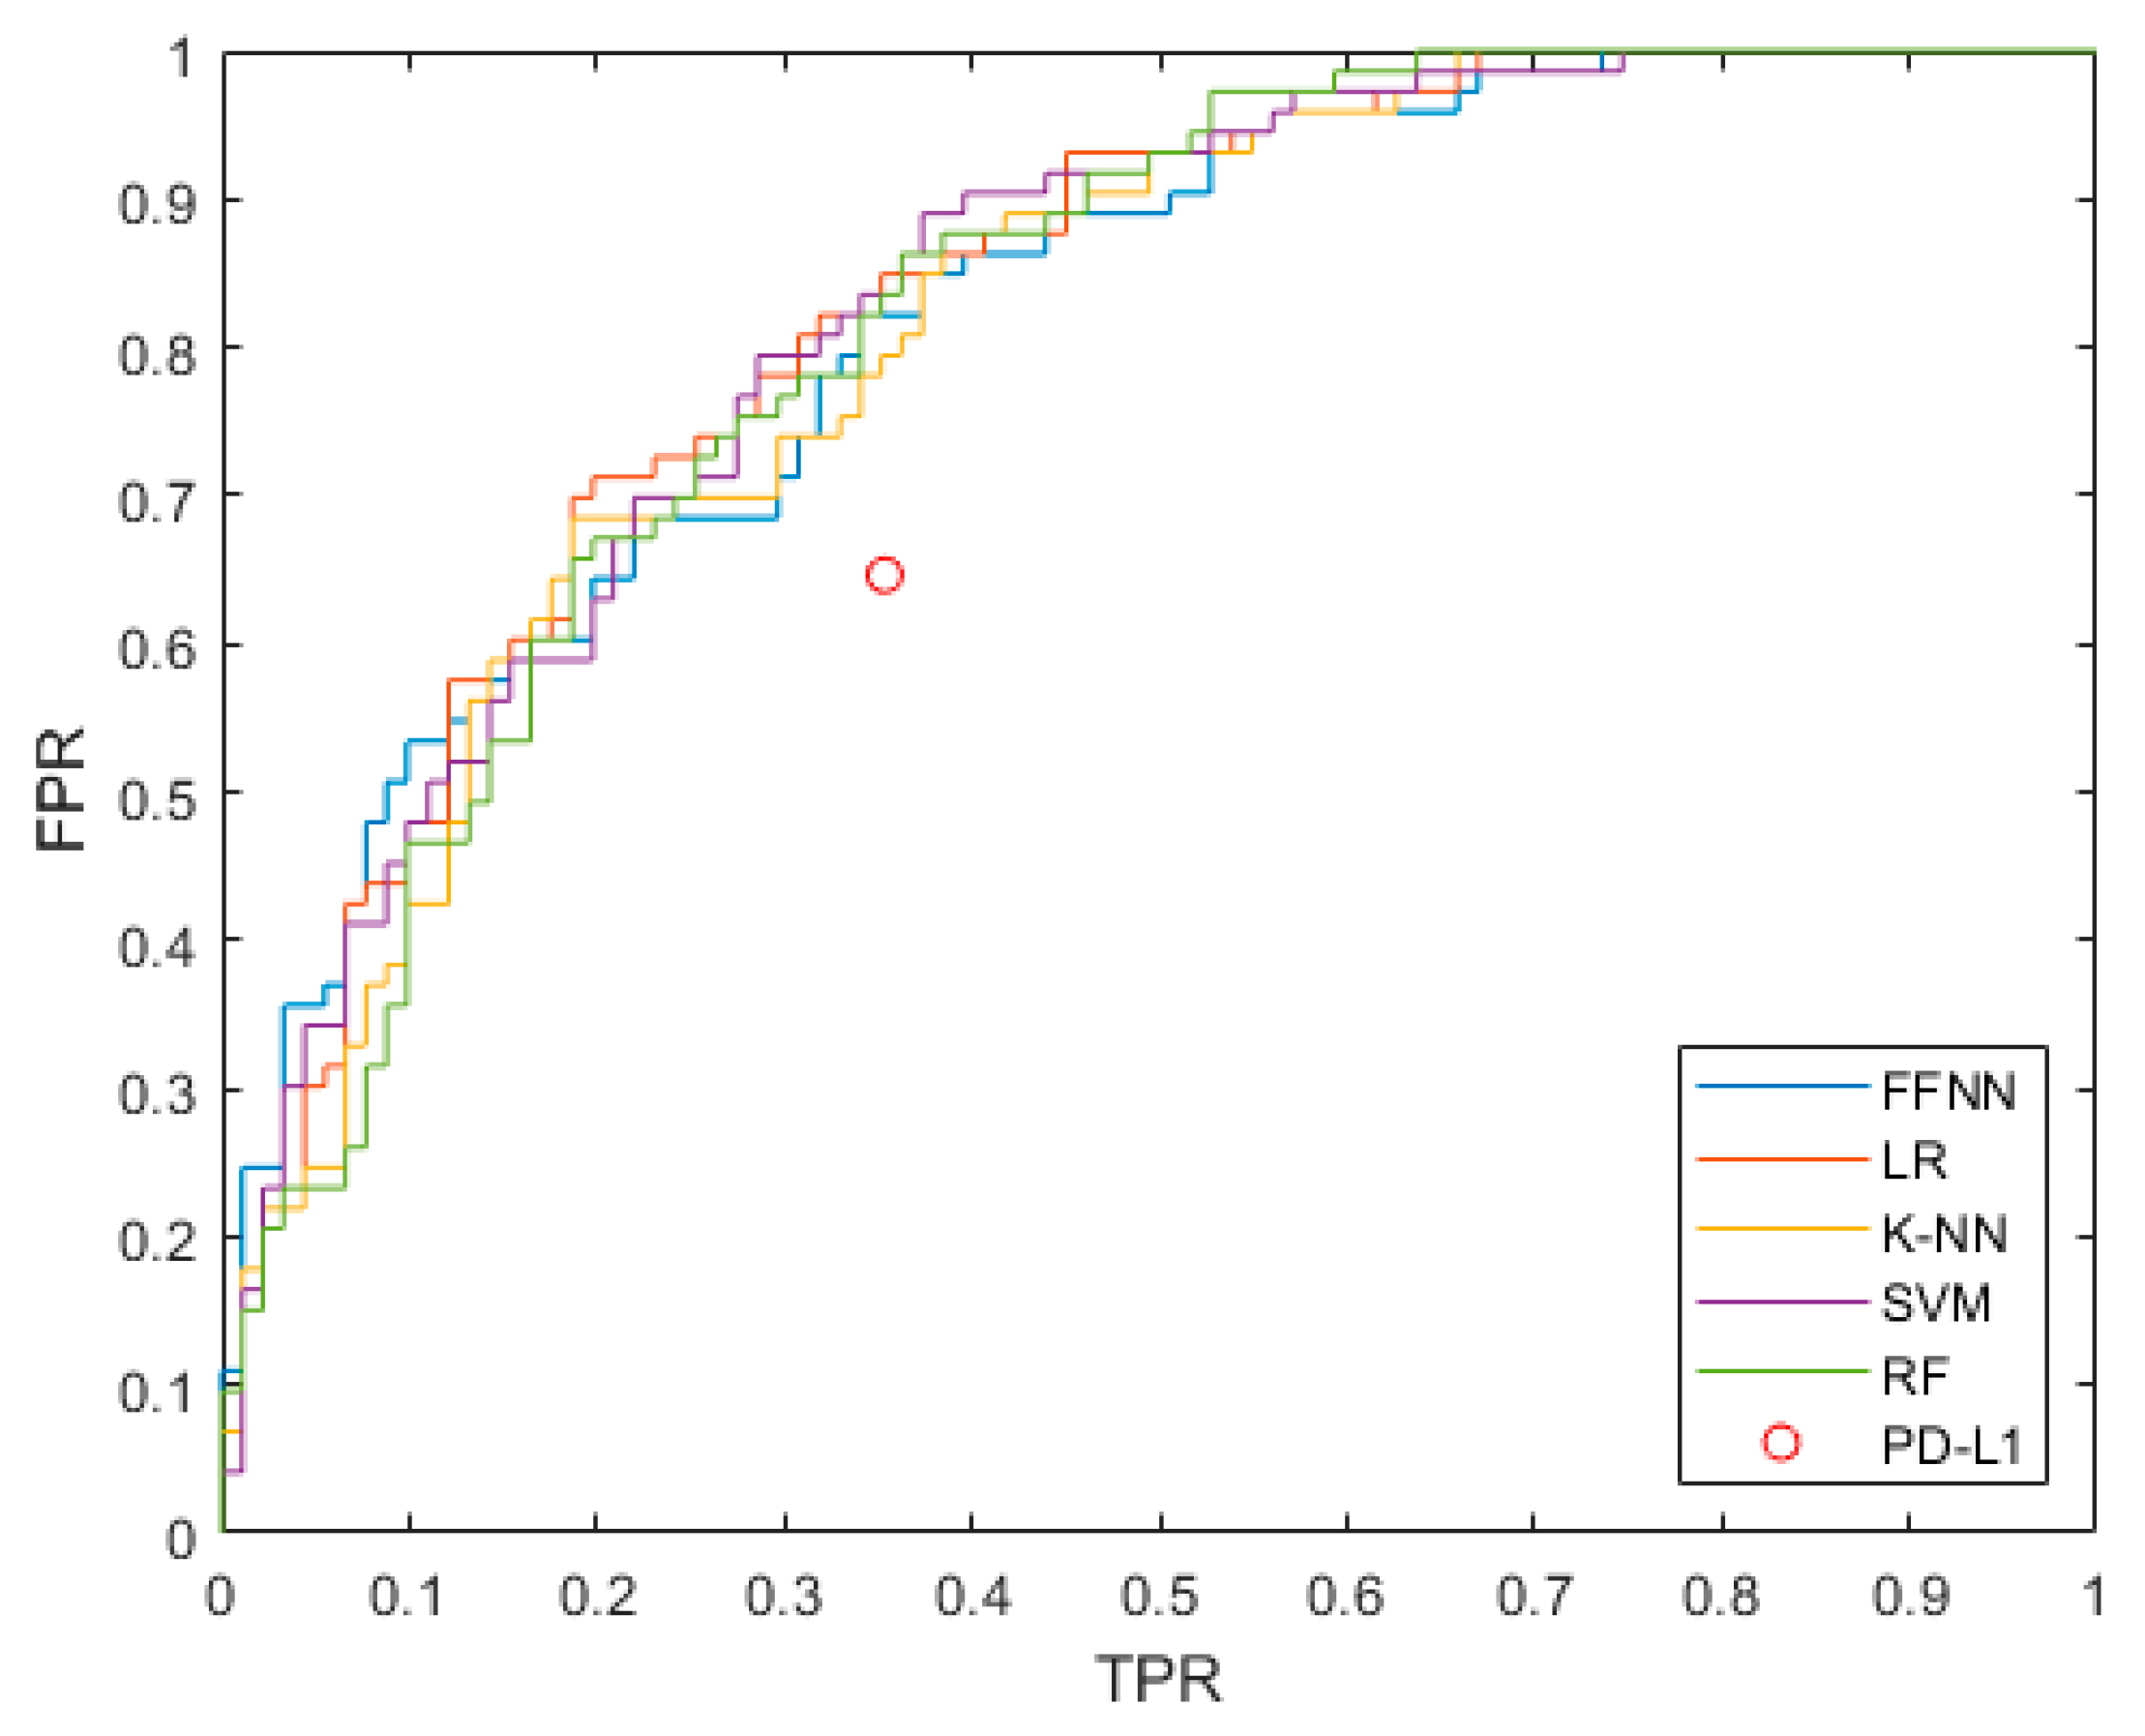
4. Results
4.1. Patients’ Characteristics
4.2. Predicting Responder and Non-Responder Patients
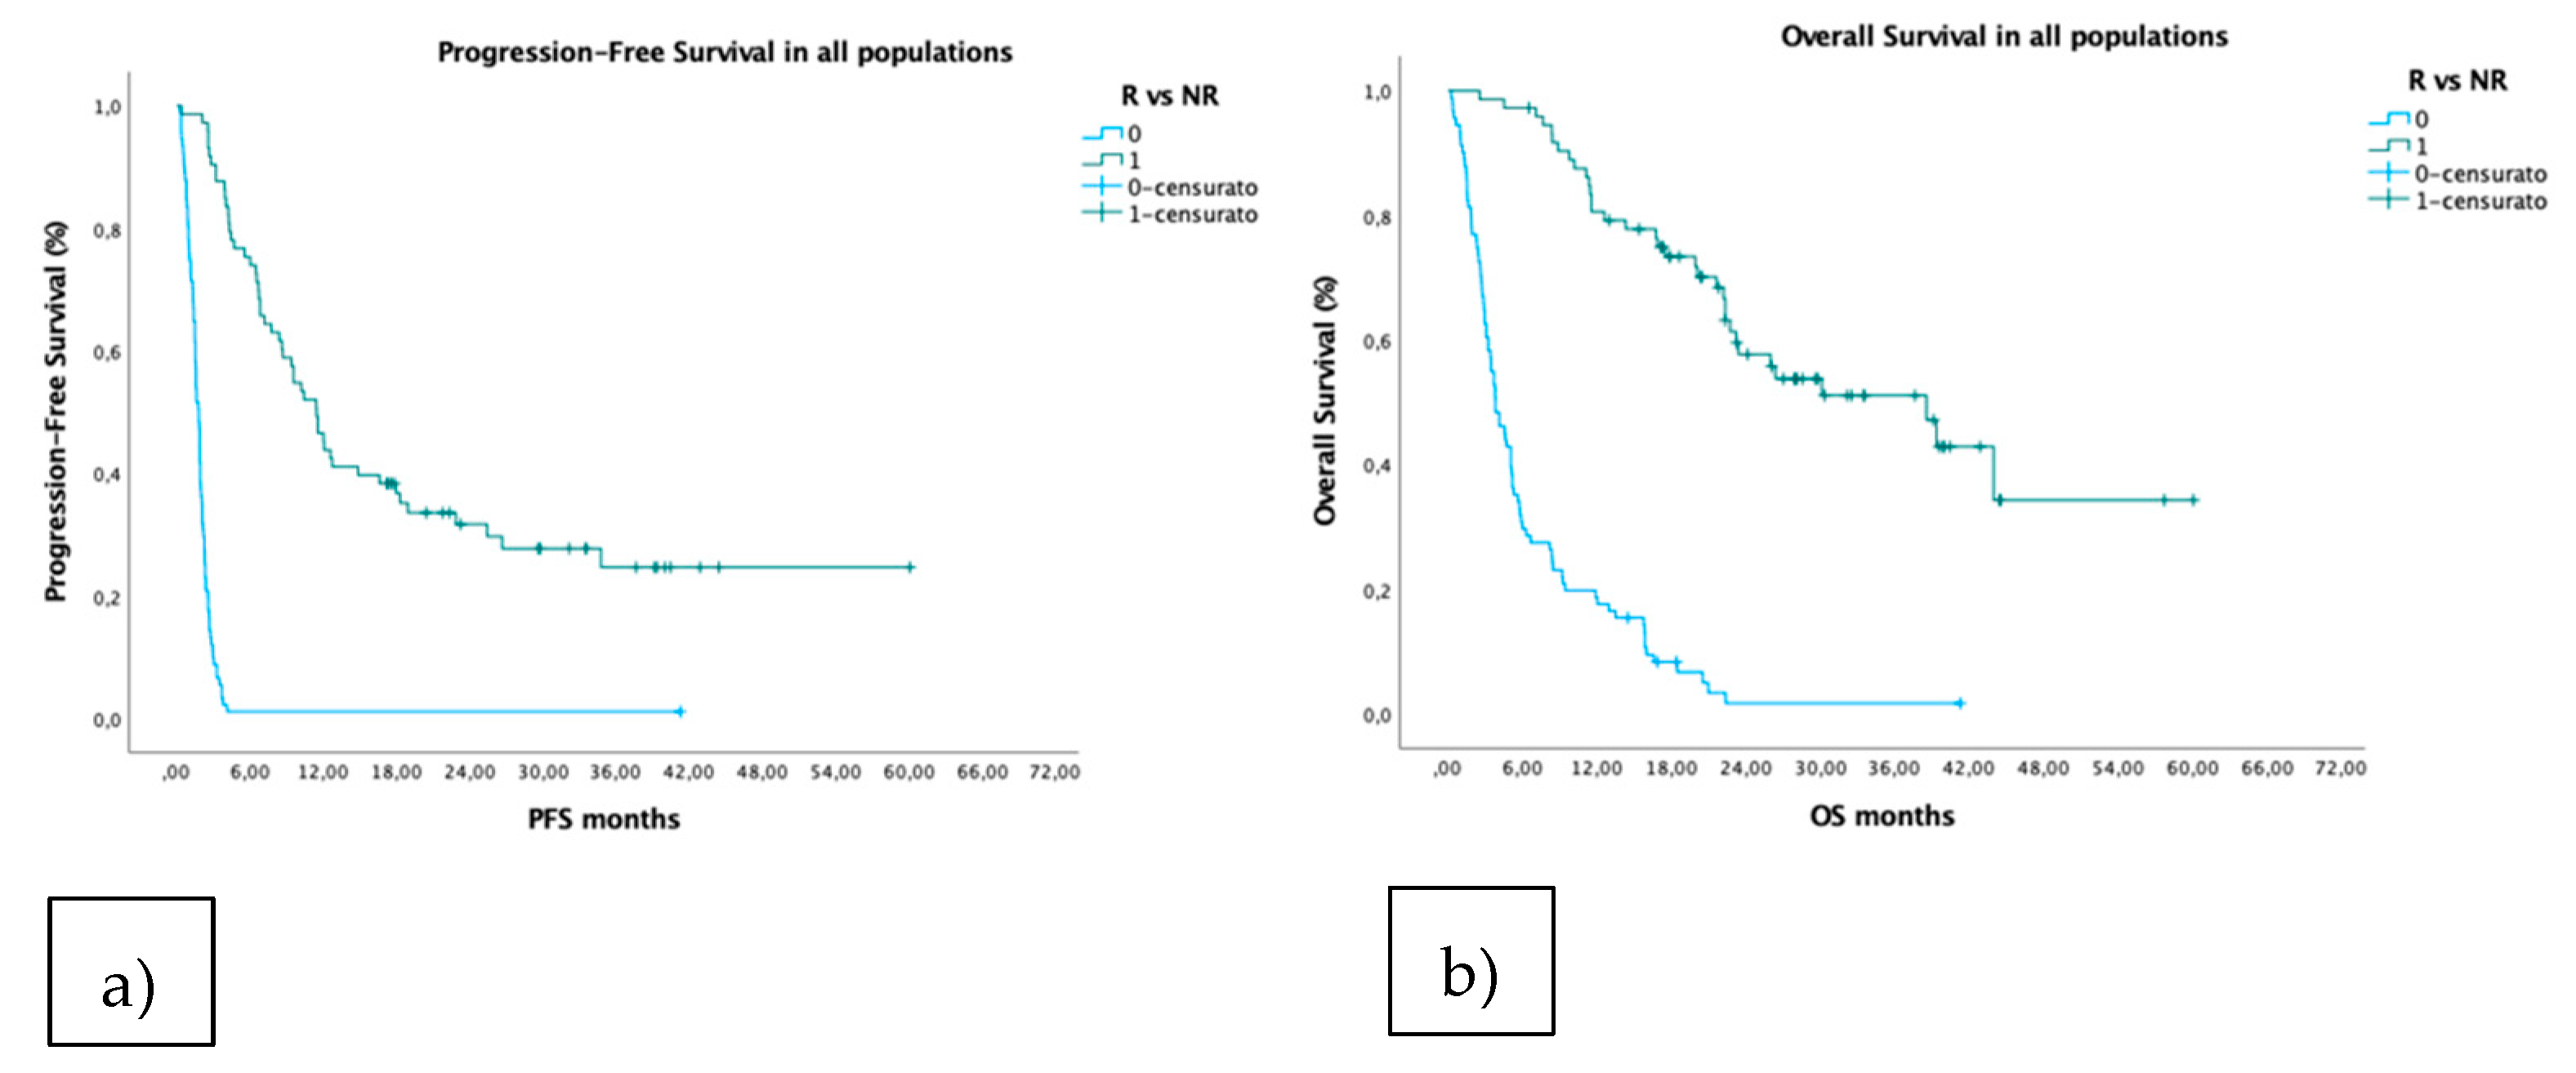
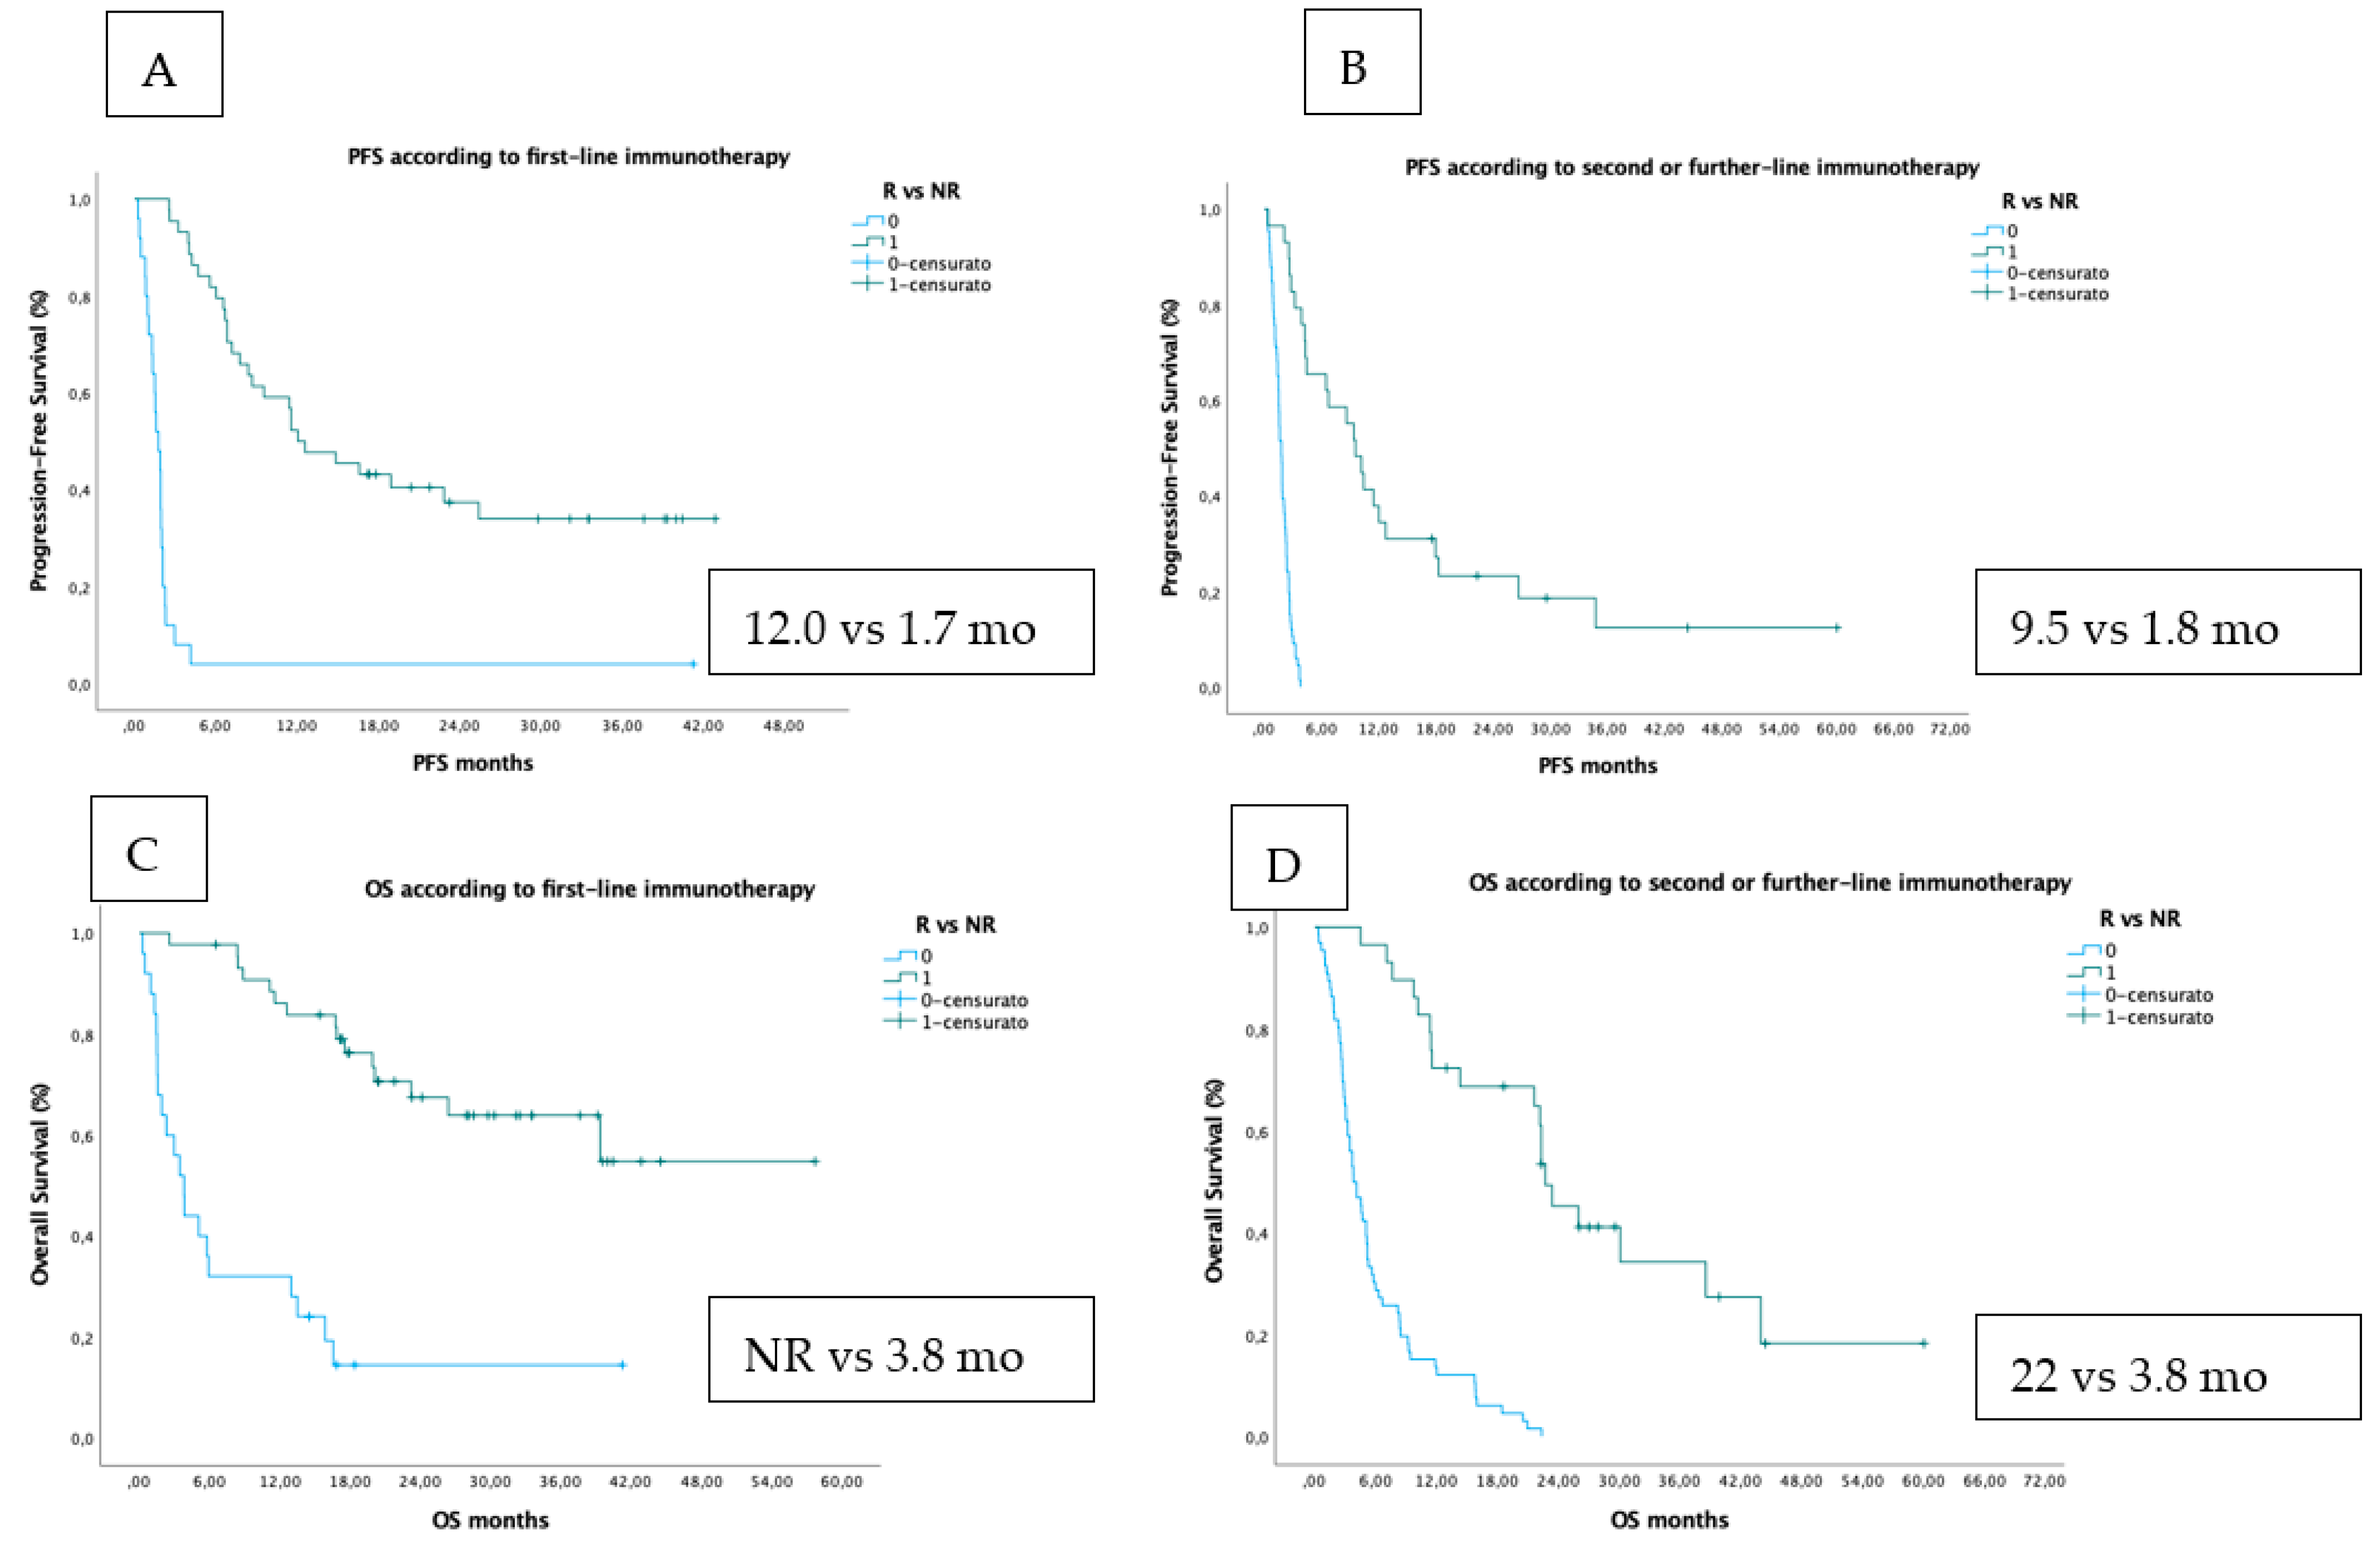
4.3. Survival Analysis According to PFS and OS
4.4. Predicting Long-Survival Patients (≥24-Months OS)
5. Discussion
6. Conclusions
Author Contributions
Funding
Institutional Review Board Statement
Informed Consent Statement
Data Availability Statement
Acknowledgments
Conflicts of Interest
Abbreviations
Appendix A


References
- Sung, H.; Ferlay, J.; Siegel, R.L.; Laversanne, M.; Soerjomataram, I.; Jemal, A.; Bray, F. Global Cancer Statistics 2020: GLOBOCAN Estimates of Incidence and Mortality Worldwide for 36 Cancers in 185 Countries. CA Cancer J. Clin. 2021, 71, 209–249. [Google Scholar] [CrossRef]
- Planchard, D.; Popat, S.; Kerr, K.; Novello, S.; Smit, E.F.; Faivre-Finn, C.; Mok, T.S.; Reck, M.; van Schil, P.E.; Hellmann, M.D.; et al. Correction to: “Metastatic non-small cell lung cancer: ESMO Clinical Practice Guidelines for diagnosis, treatment and follow-up”. Ann. Oncol. 2019, 30, 863–870. [Google Scholar] [CrossRef]
- Gettinger, S.; Horn, L.; Jackman, D.; Spigel, D.; Antonia, S.; Hellmann, M.; Powderly, J.; Heist, R.; Sequist, L.V.; Smith, D.C.; et al. Five-Year Follow-Up of Nivolumab in Previously Treated Advanced Non-Small-Cell Lung Cancer: Results From the CA209-003 Study. J. Clin. Oncol. 2018, 36, 1675–1684. [Google Scholar] [CrossRef]
- Reck, M.; Rodríguez-Abreu, D.; Robinson, A.G.; Hui, R.; Csőszi, T.; Fülöp, A.; Gottfried, M.; Peled, N.; Tafreshi, A.; Cuffe, S.; et al. Updated Analysis of KEYNOTE-024: Pembrolizumab Versus Platinum-Based Chemotherapy for Advanced Non-Small-Cell Lung Cancer With PD-L1 Tumor Proportion Score of 50% or Greater. J. Clin. Oncol. Off. J. Am. Soc. Clin. Oncol. 2019, 37, 537–546. [Google Scholar] [CrossRef]
- Gadgeel, S.; Rodríguez-Abreu, D.; Speranza, G.; Esteban, E.; Felip, E.; Dómine, M.; Hui, R.; Hochmair, M.J.; Clingan, P.; Powell, S.F.; et al. Updated Analysis From KEYNOTE-189: Pembrolizumab or Placebo Plus Pemetrexed and Platinum for Previously Untreated Metastatic Nonsquamous Non-Small-Cell Lung Cancer. J. Clin. Oncol. 2020, 38, 1505–1517. [Google Scholar] [CrossRef]
- Paz-Ares, L.; Vicente, D.; Tafreshi, A.; Robinson, A.; Soto Parra, H.; Mazières, J.; Hermes, B.; Cicin, I.; Medgyasszay, B.; Rodríguez-Cid, J.; et al. A Randomized, Placebo-Controlled Trial of Pembrolizumab Plus Chemotherapy in Patients With Metastatic Squamous NSCLC: Protocol-Specified Final Analysis of KEYNOTE-407. J. Thorac. Oncol. 2020, 15, 1657–1669. [Google Scholar] [CrossRef]
- Pai-Scherf, L.; Blumenthal, G.M.; Li, H.; Subramaniam, S.; Mishra-Kalyani, P.S.; He, K.; Zhao, H.; Zhao, H.; Yu, J.; Paciga, M.; et al. FDA Approval Summary: Pembrolizumab for Treatment of Metastatic Non-Small Cell Lung Cancer: First-Line Therapy and Beyond. Oncologist 2017, 22, 1392–1399. [Google Scholar] [CrossRef] [Green Version]
- Reck, M.; Schenker, M.; Lee, K.H.; Provencio, M.; Nishio, M.; Lesniewski-Kmak, K.; Sangha, R.; Ahmed, S.; Raimbourg, J.; Feeney, K.; et al. Nivolumab plus ipilimumab versus chemotherapy as first-line treatment in advanced non-small-cell lung cancer with high tumour mutational burden: Patient-reported outcomes results from the randomised, open-label, phase III CheckMate 227 trial. Eur J. Cancer 2019, 116, 137–147. [Google Scholar] [CrossRef]
- Petitprez, F.; Meylan, M.; de Reyniès, A.; Sautès-Fridman, C.; Fridman, W.H. The Tumor Microenvironment in the Response to Immune Checkpoint Blockade Therapies. Front. Immunol. 2020, 11, 784. [Google Scholar] [CrossRef]
- Fortunato, O.; Borzi, C.; Milione, M.; Centonze, G.; Conte, D.; Boeri, M.; Verri, C.; Moro, M.; Facchinetti, F.; Andriani, F.; et al. Circulating mir-320a promotes immunosuppressive macrophages M2 phenotype associated with lung cancer risk. Int. J. Cancer 2019, 144, 2746–2761. [Google Scholar] [CrossRef] [Green Version]
- Prelaj, A.; Tay, R.; Ferrara, R.; Chaput, N.; Besse, B.; Califano, R. Predictive biomarkers of response for immune checkpoint inhibitors in non-small-cell lung cancer. Eur. J. Cancer 2019, 106, 144–159. [Google Scholar] [CrossRef]
- Sivan, A.; Corrales, L.; Hubert, N.; Williams, J.B.; Aquino-Michaels, K.; Earley, Z.M.; Benyamin, F.W.; Lei, Y.M.; Jabri, B.; Alegre, M.L.; et al. Commensal Bifidobacterium promotes antitumor immunity and facilitates anti-PD-L1 efficacy. Science 2015, 350, 1084–1089. [Google Scholar] [CrossRef] [Green Version]
- Yoon, H.J.; Kang, J.; Park, H.; Sohn, I.; Lee, S.H.; Lee, H.Y. Deciphering the tumor microenvironment through radiomics in non-small cell lung cancer: Correlation with immune profiles. PLoS ONE 2020, 15, e0231227. [Google Scholar] [CrossRef] [Green Version]
- Prelaj, A.; Rebuzzi, S.E.; Pizzutilo, P.; Bilancia, M.; Montrone, M.; Pesola, F.; Longo, V.; Del Bene, G.; Lapadula, V.; Cassano, F. EPSILoN: A Prognostic Score Using Clinical and Blood Biomarkers in Advanced Non- Small-cell Lung Cancer Treated With Immunotherapy. Clin. Lung Cancer 2020, 21, 365–377. [Google Scholar] [CrossRef]
- Sorich, M.J.; Rowland, A.; Karapetis, C.S.; Hopkins, A.M. Evaluation of the Lung Immune Prognostic Index for Prediction of Survival and Response in Patients Treated with Atezolizumab for NSCLC: Pooled Analysis of Clinical Trials. J. Thorac. Oncol. 2019, 14, 1440–1446. [Google Scholar] [CrossRef]
- Triberti, S.; Durosini, I.; Pravettoni, G. A “Third Wheel” Effect in Health Decision Making Involving Artificial Entities: A Psychological Perspective. Front. Public Health 2020, 8, 117. [Google Scholar] [CrossRef] [PubMed]
- Boeri, M.; Verri, C.; Conte, D.; Roz, L.; Modena, P.; Facchinetti, F.; Calabrò, E.; Croce, C.M.; Pastorino, U.; Sozzi, G. MicroRNA signatures in tissues and plasma predict development and prognosisof computed tomography detected lung cancer. Proc. Natl. Acad. Sci. USA 2011, 108, 3713–3718. [Google Scholar] [CrossRef] [PubMed] [Green Version]
- Sozzi, G.; Boeri, M.; Rossi, M.; Verri, C.; Suatoni, P.; Bravi, F.; Roz, L.; Conte, D.; Grassi, M.; Sverzellati, N.; et al. Clinical utility of a plasma-based miRNA signature classifier within computed tomography lung cancer screening: A correlative MILD trial study. J. Clin. Oncol. 2014, 32, 768–773. [Google Scholar] [CrossRef]
- Boeri, M.; Milione, M.; Proto, C.; Signorelli, D.; Lo Russo, G.; Galeone, C.; Verri, C.; Mensah, M.; Centonze, G.; Martinetti, A.; et al. Circulating miRNAs and PD-L1 Tumor Expression Are Associated with Survival in Advanced NSCLC Patients Treated with Immunotherapy: A Prospective Study. Clin. Cancer Res. 2019, 25, 2166–2173. [Google Scholar] [CrossRef] [Green Version]
- Prelaj, A.; Proto, C.; Lo Russo, G.; Signorelli, D.; Ferrara, R.; Mensah, M.; Galli, G.; De Toma, A.; Viscardi, G.; Brambilla, M.; et al. Integrating clinical and biological prognostic biomarkers in patients with advanced NSCLC treated with immunotherapy: The DEMo score system. Transl Lung Cancer Res. 2020, 9, 617–628. [Google Scholar] [CrossRef]
- Mensah, M.; Borzi, C.; Verri, C.; Suatoni, P.; Conte, D.; Pastorino, U.; Orazio, F.; Sozzi, G.; Boeri, M. MicroRNA Based Liquid Biopsy: The Experience of the Plasma miRNA Signature Classifier (MSC) for Lung Cancer Screening. J. Vis. Exp. 2017, 128, 56326. [Google Scholar] [CrossRef]
- Ferrara, R.; Mezquita, L.; Texier, M.; Lahmar, J.; Audigier-Valette, C.; Tessonnier, L.; Mazieres, J.; Zalcman, G.; Brosseau, S.; Le Moulec, S.; et al. Hyperprogressive Disease in Patients With Advanced Non-Small Cell Lung Cancer Treated With PD-1/PD-L1 Inhibitors or With Single-Agent Chemotherapy. JAMA Oncol. 2018, 4, 1543–1552. [Google Scholar] [CrossRef] [PubMed]
- Lo Russo, G.; Moro, M.; Sommariva, M.; Cancila, V.; Boeri, M.; Centonze, G.; Ferro, S.; Ganzinelli, M.; Gasparini, P.; Huber, V.; et al. Antibody-Fc/FcR Interaction on Macrophages as a Mechanism for Hyperprogressive Disease in Non-small Cell Lung Cancer Subsequent to PD-1/PD-L1 Blockade. Clin. Cancer Res. 2019, 25, 989–999. [Google Scholar] [CrossRef] [Green Version]
- NSCLC Response Prediction to IO Using ML Methods. Available online: https://trovo.faculty.polimi.it/downloads.html (accessed on 10 October 2021).
- He, B.; Dong, D.; She, Y.; Zhou, C.; Fang, M.; Zhu, Y.; Zhang, H.; Huang, Z.; Jiang, T.; Tian, J.; et al. Predicting response to immunotherapy in advanced non-small-cell lung cancer using tumor mutational burden radiomic biomarker. J. Immunother. Cancer 2020, 8, 1–10. [Google Scholar] [CrossRef]
- Khorrami, M.; Prasanna, P.; Gupta, A.; Patil, P.; Velu, P.D.; Thawani, R.; Corredor, G.; Alilou, M.; Bera, K.; Fu, P.; et al. Changes in CT Radiomic Features Associated with Lymphocyte Distribution Predict Overall Survival and Response to Immunotherapy in Non-Small Cell Lung Cancer. Cancer Immunol. Res. 2020, 8, 108. [Google Scholar] [CrossRef] [PubMed]
- Yang, Y.; Yang, J.; Shen, L.; Chen, J.; Xia, L.; Ni, B.; Ge, L.; Wang, Y.; Lu, S. A multi-omics-based serial deep learning approach to predict clinical outcomes of single-agent anti-PD-1/PD-L1 immunotherapy in advanced stage non-small-cell lung cancer. Am. J. Transl. Res. 2021, 13, 743–756. [Google Scholar]
- Fang, C.; Xu, D.; Su, J.; Dry, J.R.; Linghu, B. DeePaN: Deep patient graph convolutional network integrating clinico-genomic evidence to stratify lung cancers for immunotherapy. NPJ Digital Med. 2021, 4, 14. [Google Scholar] [CrossRef]
- Tian, P.; He, B.; Mu, W.; Liu, K.; Liu, L.; Zeng, H.; Liu, Y.; Jiang, L.; Zhou, P.; Huang, Z.; et al. Assessing PD-L1 expression in non-small cell lung cancer and predicting responses to immune checkpoint inhibitors using deep learning on computed tomography images. Theranostics 2021, 11, 2098–2107. [Google Scholar] [CrossRef]
- Xue, L.; Bi, G.; Zhan, C.; Zhang, Y.; Yuan, Y.; Fan, H. Development and Validation of a 12-Gene Immune Relevant Prognostic Signature for Lung Adenocarcinoma Through Machine Learning Strategies. Front. Oncol. 2020, 10, 1–14. [Google Scholar] [CrossRef] [PubMed]
- Lai, Y.H.; Chen, W.N.; Hsu, T.C.; Lin, C.; Tsao, Y.; Wu, S. Overall survival prediction of non-small cell lung cancer by integrating microarray and clinical data with deep learning. Sci. Rep. 2020, 10, 4679. [Google Scholar] [CrossRef]
- Bartholomai, J.A.; Frieboes, H.B. Lung Cancer Survival Prediction via Machine Learning Regression Classification, and Statistical Techniques. Proc. IEEE Int. Symp. Signal Proc. Inf. Tech. 2018. [Google Scholar] [CrossRef]
- Johannet, P.; Coudray, N.; Donnelly, D.M.; Jour, G.; Illa-Bochaca, I.; Xia, Y.; Johnson, D.B.; Wheless, L.; Patrinely, J.R.; Nomikou, S.; et al. Using Machine Learning Algorithms to Predict Immunotherapy Response in Patients with Advanced Melanoma. Clin. Cancer Res. 2021, 27, 131–140. [Google Scholar] [CrossRef] [PubMed]
- Lu, Z.; Chen, H.; Jiao, X.; Zhou, W.; Han, W.; Li, S.; Liu, C.; Gong, J.; Li, J.; Zhang, X.; et al. Prediction of immune checkpoint inhibition with immune oncology-related gene expression in gastrointestinal cancer using a machine learning classifier. J. Immunother. Cancer 2020, 8, 1–5. [Google Scholar] [CrossRef] [PubMed]
- Rundo, F.; Spampinato, C.; Banna, G.L.; Conoci, S. Advanced deep learning embedded motion radiomics pipeline for predicting anti-PD-1/PD-L1 immunotherapy response in the treatment of bladder cancer: Preliminary results. Electronics 2019, 8, 1134. [Google Scholar] [CrossRef] [Green Version]


| Feature Classes | Features |
|---|---|
| Clinical features | Age, sex, smoker/non-smoker, packs per year, ECOG |
| Laboratory exams | NLR * NLR4, LDH |
| Tumor features | PD-L1, histology (adenocarcinoma, squamous, other) |
| Radiological | Metastatic sites (liver, brain, bone) |
| Treatment features | IO line (first or further line) |
| Omic features | MSC test |
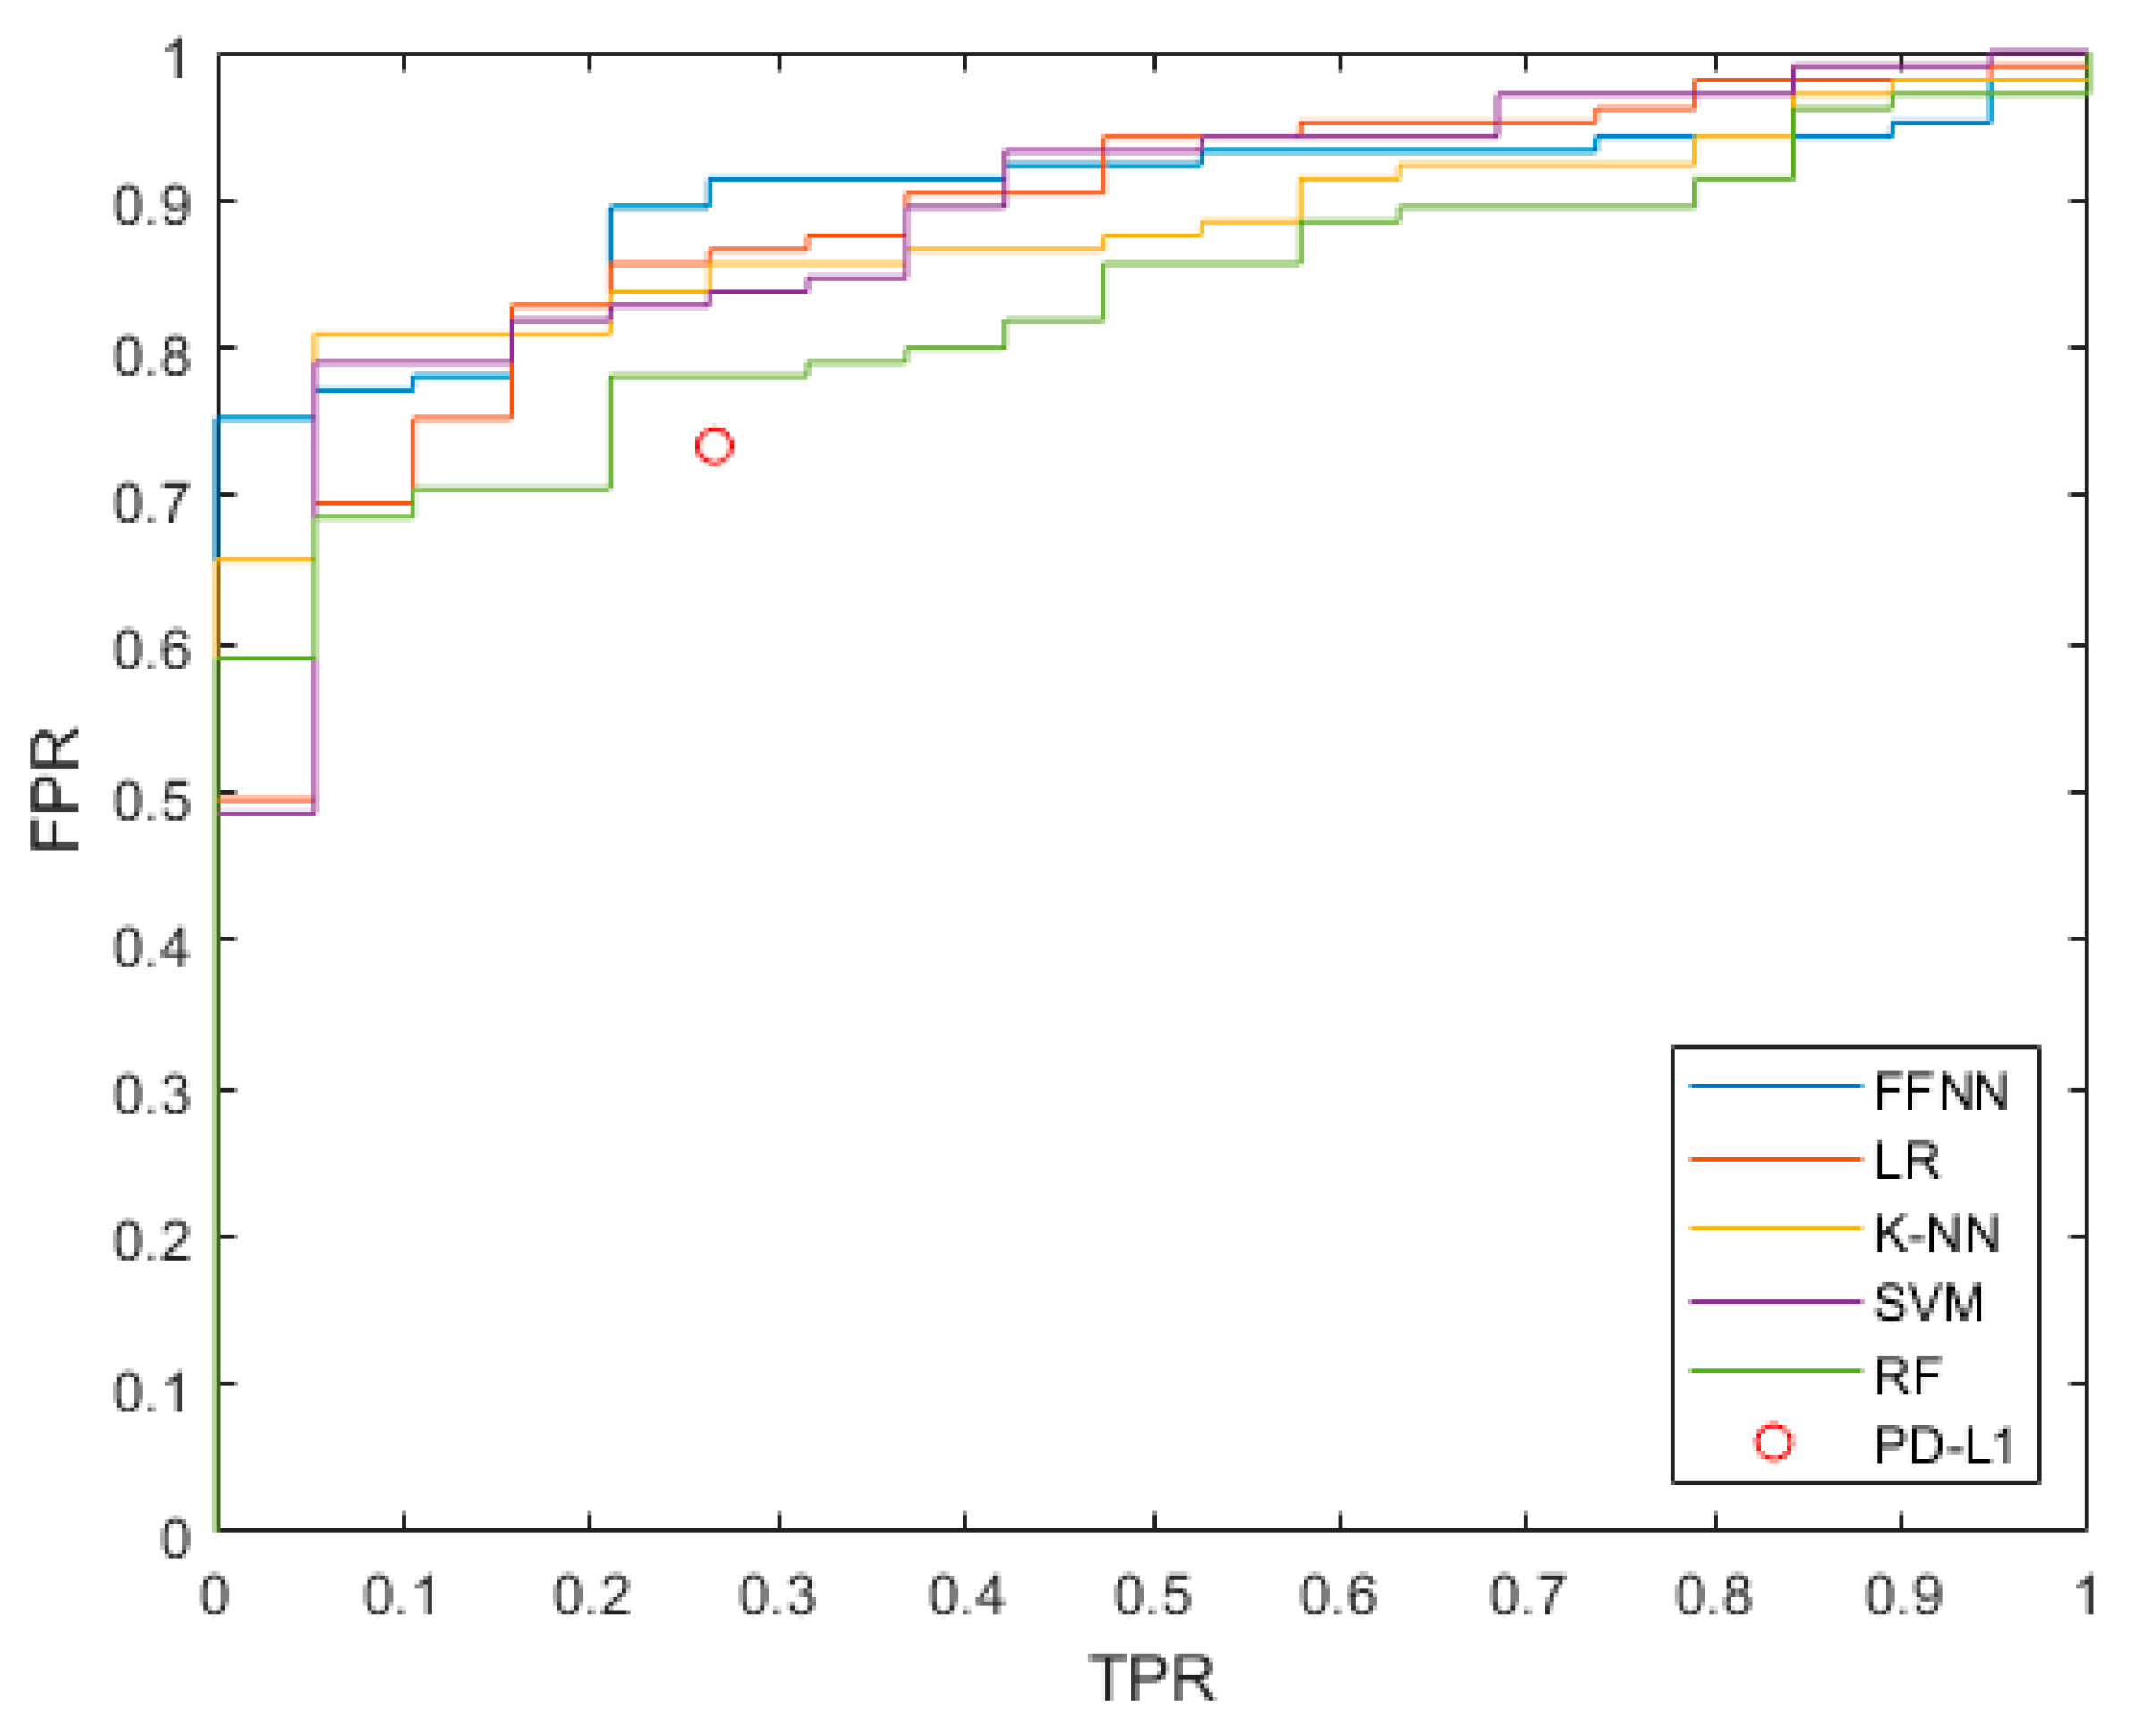
| ML Model | Selected Features | AIC | ACC | F1 | AUC |
|---|---|---|---|---|---|
| LR | ECOG, IOLine, NLR, MSC, PD-L1 | 132.5 | 0.756 | 0.722 | 0.83 (0.76–0.88) |
| FFNN | NLR, IOLine, MSC, LDH, ECOG, PackYear | 137.2 | 0.732 | 0.686 | 0.80 (0.73–0.86) |
| K-NN | NLR, IOLine, ECOG, MSC, NLR4 | 137.4 | 0.726 | 0.667 | 0.81 (0.74–0.87) |
| SVM | ECOG, IOLine, NLR, MSC, PD-L1 | 134.5 | 0.738 | 0.703 | 0.83 (0.75–0.88) |
| RF | NLR, IOLine, ECOG, Age, MSC | 135.5 | 0.701 | 0.657 | 0.82 (0.73–0.87) |
| Initial Feature Set | Selected Features | ACC | F1 | AUC |
|---|---|---|---|---|
| All | ECOG, IOLine, NLR, MSC, PD-L1 | 0.756 | 0.722 | 0.83 (0.76–0.88) |
| No PD-L1 | ECOG, IOLine, NLR, MSC | 0.726 | 0.696 | 0.82 (0.75–0.88) |
| NO MSC | ECOG, IOLine, NLR, PD-L1, Age | 0.750 | 0.709 | 0.81 (0.74–0.87 |
| NO PD-L1 and MSC | ECOG, IOLine, NLR, Age | 0.707 | 0.662 | 0.80 (0.73–0.86) |
| NO ECOG | IOLine, NLR, MSC, PD-L1 | 0.726 | 0.690 | 0.80 (0.73–0.87) |
| ML Model | Selected Features | AIC | ACC | F1 | AUC |
|---|---|---|---|---|---|
| LR | ECOG, Histology, NLR, IOLine | 58.1 | 0.855 | 0.917 | 0.89 (0.80–0.94) |
| FFNN | Histology, NLR, PD-L1, NLR4 | 61.4 | 0.839 | 0.908 | 0.87 (0.78–0.92) |
| K-NN | NLR, PD-L1, Histology | 60.6 | 0.847 | 0.916 | 0.88 (0.80–0.93) |
| SVM | Age, Histology, MSC, ECOG, PD-L1, NLR | 63.2 | 0.847 | 0.913 | 0.90 (0.83–0.94) |
| RF | NLR, PD-L1 | 63.8 | 0.847 | 0.917 | 0.83 (0.74–0.89) |
Publisher’s Note: MDPI stays neutral with regard to jurisdictional claims in published maps and institutional affiliations. |
© 2022 by the authors. Licensee MDPI, Basel, Switzerland. This article is an open access article distributed under the terms and conditions of the Creative Commons Attribution (CC BY) license (https://creativecommons.org/licenses/by/4.0/).
Share and Cite
Prelaj, A.; Boeri, M.; Robuschi, A.; Ferrara, R.; Proto, C.; Lo Russo, G.; Galli, G.; De Toma, A.; Brambilla, M.; Occhipinti, M.; et al. Machine Learning Using Real-World and Translational Data to Improve Treatment Selection for NSCLC Patients Treated with Immunotherapy. Cancers 2022, 14, 435. https://doi.org/10.3390/cancers14020435
Prelaj A, Boeri M, Robuschi A, Ferrara R, Proto C, Lo Russo G, Galli G, De Toma A, Brambilla M, Occhipinti M, et al. Machine Learning Using Real-World and Translational Data to Improve Treatment Selection for NSCLC Patients Treated with Immunotherapy. Cancers. 2022; 14(2):435. https://doi.org/10.3390/cancers14020435
Chicago/Turabian StylePrelaj, Arsela, Mattia Boeri, Alessandro Robuschi, Roberto Ferrara, Claudia Proto, Giuseppe Lo Russo, Giulia Galli, Alessandro De Toma, Marta Brambilla, Mario Occhipinti, and et al. 2022. "Machine Learning Using Real-World and Translational Data to Improve Treatment Selection for NSCLC Patients Treated with Immunotherapy" Cancers 14, no. 2: 435. https://doi.org/10.3390/cancers14020435