Article

Circulating Cell-Free DNA-Based Comprehensive Molecular Analysis of Biliary Tract Cancers Using Next-Generation Sequencing

1
Department of Pathology, Faculty of Medicine, University of Debrecen, H-4032 Debrecen, Hungary
2
Division of Radiology and Imaging Science, Department of Medical Imaging, Faculty of Medicine, University of Debrecen, H-4032 Debrecen, Hungary
3
Department of Oncology, Faculty of Medicine, University of Debrecen, H-4032 Debrecen, Hungary
*
Author to whom correspondence should be addressed.
Cancers 2022, 14(1), 233; https://doi.org/10.3390/cancers14010233
Submission received: 6 December 2021 / Revised: 21 December 2021 / Accepted: 1 January 2022 / Published: 4 January 2022

Abstract

:

Simple Summary

In the era of personalized oncology, next-generation sequencing plays an important role in identifying mutations that may predict the molecular pathomechanism and manage biliary tract cancers (BTC) therapy. The peripheral blood of cancer patients represents variable amounts of cell-free DNA (cfDNA) released from the tumor. Tumor-derived cfDNA in BTCs also allows the effective monitoring of the molecular genetic profile and the response to chemotherapy. Our study aimed to identify genetic aberrations in cell-free and matched tumor DNA in BTCs. We assume that the efficacy of the LB-based sequencing provides a novel perspective for BTCs therapy.

Abstract

Biliary tract cancer (BTC) is a rare malignancy with a long disease course and an overall poor prognosis. Despite multiple chemotherapy agents, there is no defined second-line treatment opportunity for advanced BTCs. In the era of precision oncology, NGS plays an important role in identifying mutations that may predict the molecular pathomechanism and manage the BTC therapy. The peripheral blood liquid biopsy (LB) of cancer patients represents variable amounts of cell-free DNA (cfDNA) released from tumor foci of any anatomical location. Our study aimed to identify somatic mutations and tumor variant burden (TVB) in cell-free and matched tumor DNA. We found a positive correlation between the estimated tumor volume and cfDNA yield (r = 0.9326, p < 0.0001). Comparing tissue and LB results, similar TVB was observed. SNVs were proven in 84% of the cases, while in two cases, only the LB sample was informative for molecular analysis. The most important aberrations in BTCs, such as FGFR2, IDH1, IDH2, KRAS, and TP53, could be detected in matched LB samples. Our prospective study demonstrates a minimally invasive testing approach to identify molecular genetic alterations in cholangiocarcinoma and gallbladder cancers. Clinical applications of cfDNA reflect by capturing the outstanding spatial tumor heterogeneity and guarantee novel aspects for the precision oncology treatment.

1. Introduction

Biliary tract cancers (BTCs) are rare malignancies with an extended disease course with an inadequate prognosis and restricted oncotherapeutic options [1,2]. The epithelial cells from three distinct anatomic locations are responsible for BTCs’ transformation, resulting in three BTC subtypes, which are as follows: intrahepatic cholangiocarcinoma (IHCC), extrahepatic cholangiocarcinoma (EHCC), and gallbladder carcinoma (GBC). Over the past few decades, the prevalence and mortality ratio of BTCs have been increasing [3]. According to a recent study, the five-year survival rates for IHCC and EHCC are 12 and 30%, respectively [3]. In clinical and histopathological views, the BTC subtypes have variable features, and they are often treated similarly [4,5]. Surgery is the curative approach; however, BTCs are often unresectable, gemcitabine chemotherapy and adjuvant with capecitabine remain the basic curative decision in BTCs treatment [6,7,8]. Gemcitabine was not effective in the PRODIGE 12 and BCAT trials [9,10], in this case, second-line treatment is currently defined as FOLFOX based on the ABC-06 landmark trial [11]. Nowadays, some studies highlight immunotherapy’s effectiveness in BTC management in cases with high expression of programmed death ligand-1 (PD-L1) and programmed death-1 (PD-1) [12,13,14].
Despite multiple chemotherapy agents, there is no accurate second-line treatment opportunity for advanced BTCs. The reason for the lack of therapeutic consensus is differences in underlying tumor etiology, and consequently, the three BTC subtypes have different molecular profiles [2,15,16,17]. The ideal solution is to find practical molecular genetic aberrations that may increase the oncological management of BTC cases. Next-generation sequencing (NGS) is a popular available technology with a wide spectrum of genes in an individual platform. In the era of personalized medicine, NGS plays an essential role in detecting and annotating aberrations that may predict the prognosis and management of BTC therapy. Despite this substantial approach, the raised difficulty of molecular factors promoting genetic variability in GBC requires a more accurate application of NGS to this malignancy [18].
The peripheral blood (PB) of cancer patients contains varying and fluctuating amounts of cell-free DNA (cfDNA) emitted from tumor foci of any anatomical location. The principle of the minimally invasive liquid biopsy (LB) has been successfully transferred to clinical routine follow-up of solid tumors [19]. Cell-free nucleic acids spread at extremely low levels in the PB, and consequently, detection of molecular genetic alterations demands high-throughput techniques, such as NGS. A small amount of literature data reflecting LB for BTC patients were published [20,21], although studying cfDNA has enormous clinical possibilities, such as in cases where it is difficult to carry out tissue biopsy (e.g., liver or gallbladder). PB sampling has minimal procedural risks, suitable for longitudinal follow-up of the patients, and with the help of LB, the effectiveness of the chemotherapy can be monitored.
The aims of our study were (i) to characterize histological and immunohistochemical (IHC) staining features of samples originating from the three subtypes of BTC patients, (ii) to quantify tumor-derived cfDNA, (iii) to find a correlation between estimated tumor volume (ETV) and nucleic acid concentration, (iv) to identify somatic mutations and tumor variant burden (TVB) in LB samples, (v) to compare alterations between histological and LB samples, and (vi) to elucidate genetic difference among the three subtypes of BTCs. For this purpose, histologic examination, IHC, ETV calculation, nucleic acid isolation from the two types of samples (tissue and LB), and NGS gene panel analysis targeting 67 genes (Archer VariantPlex Solid Tumor panel, Illumina MiSeq platform) were performed on all samples of 25 BTC patients.

2. Materials and Methods

2.1. Patients Samples

Altogether, 25 formaldehyde-fixed paraffin-embedded tissue (FFPE) and 25 paired PB LB BTC samples were tested. Because of the long disease course, LB was performed for the mean 24 months (range: 12–36) after initial tissue biopsy (IHCC and EHCC cases)/surgical resection (only GBC cases) to evaluate chemotherapy effectiveness. All protocols have been approved by the author’s respective Institutional Review Board for human subjects (IRB reference number: 60355-2/2016/EKU and 4648-6/2018/EÜIG).

2.2. Tumor Volume Evaluation

The tumor mass parameters have been determined by using computed tomography (CT) and/or magnetic resonance imaging (MRI) right before the initial tissue biopsy/resection. According to radiological practice, maximal tumor width (w) and length (l) were measured. Estimated tumor volume (ETV) has to be calculated using the following formula:
V (mm3) = w2 (mm2) × l (mm) ÷ 2

2.3. Histology and Immunohistochemistry

Hematoxylin and eosin (H&E) stainings were performed and carefully analyzed by pathology specialists. The samples containing at least 20% tumor cells were selected for DNA isolation. IHC of CK7 (clone OV-TL 12/30, 1:100 dilution, Dako, Agilent Technologies, Santa Clara, CA, USA), CK8/18 (clone 5D3, 1:100 dilution, Leica Biosystems, Wetzlar, Germany), CK19 (clone Ks19.1, 1:200 dilution, Biocare Medical, Pacheco, CA, USA), CK20 (clone Ks20.8, 1:200 dilution, Leica Biosystems, Wetzlar, Germany), CA19-9 (clone C241:5:1:4, 1:200 dilution, Leica Biosystems, Wetzlar, Germany), HSA (clone OCH1E5, 1:700 dilution, Dako, Agilent Technologies Company, Santa Clara, CA, USA), arginase (polyclonal, 1:20,000 dilution, Merck, Darmstadt, Germany), and glypican-3 (clone 1G12, 1:50 dilution, Biocare Medical, Pacheco, CA, USA) were performed to validate BTC diagnosis. PD-L1 IHC (clone SP142, 1:100 dilution, Abcam, Cambridge, UK) was carried out to study the possibility of immunotherapy.

2.4. DNA Isolation

QIAamp DNA FFPE Tissue Kit (Qiagen, Hilden, Germany) was applied for FFPE tissues genomic DNA (gDNA) extraction. The isolations were carried out according to the manufacturer’s instructions and the gDNA was eluted in 50 µL elution buffer.
EDTA anticoagulant blood samples were centrifuged at 3000× g for 10 min. To eliminate cell residues, 5 ± 0.1 mL plasma was spun down (16,000× g, 10 min). Cell-free DNA was extracted from PB plasma into 35 µL elution buffer using QIAamp Circulating Nucleic Acid Kit (Qiagen, Hilden, Germany).
The DNA concentrations were measured in the Qubit dsDNA HS Assay Kit using a Qubit 4.0 Fluorometer (Thermo Fisher Scientific, Waltham, MA, USA).
DNA yield was calculated with the following formula:
DNA yield (ng/mL plasma) = DNA concentration (ng/µL) × elution volume (35 µL)/plasma volume (mL).

2.5. Next-Generation Sequencing

The amplifiable DNA amounts were estimated according to the Archer PreSeq DNA Calculator Assay Protocol (Archer DX, Boulder, CO, USA). Libraries of the samples were constructed using Archer VariantPlex Solid Tumor Kit (Archer DX, Boulder, CO, USA). The final purified libraries were quantified with KAPA Universal Library Quantification Kit (Kapa Biosystems, Roche, Basel, Switzerland).
The indexed libraries were then submitted to Illumina MiSeq System (MiSeq Reagent kit v3 600 cycles, Illumina, San Diego, CA, USA). The libraries pooling, denaturation, and dilution were carried out according to the manufacturer’s instructions. The terminating loading concentration was 8 pM libraries and 1% PhiX. Captured libraries were sequenced with a paired-end run to obtain 2 × 150 bp reads with at least 250× depth of coverage.
The fastq files were analyzed with the Local Virtual Machine application of Archer DX Analysis software (version 6.2.7; Archer DX, Boulder, CO, USA) for identifying single-nucleotide variants (SNVs) as well as insertions and deletions (indels). For the alignment, the human reference genome GRCh37 (equivalent UCSC version hg19) was used. The sequence quality was evaluated and the cutoff was determined to be 3% variant allele frequency (VAF) in FFPE samples and 2% in LB samples. Massive insertion/deletion (>50 bp) and compound structural changes could not be captured by the method. The results were defined using the latest version of the Human Genome Variation Society nomenclature. Individual gene aberrations were checked in the COSMIC (Catalogue of Somatic Mutations in Cancer), ClinVar, and TCGA (The Cancer Genome Atlas) databases for clinical significance. Single nucleotide polymorphisms (SNPs) were monitored using the dbSNP database. Detected pathogen variants were cross-checked in the OncoKB database for therapeutic options.

2.6. Statistical Analysis

Statistical analyses were performed with GraphPad Prism 9. Differences between the ETV and DNA concentration of the three subtypes of BTC patients were analyzed using an unpaired t-test. When comparing the average TVB of the three BTC subtypes, a nonparametric t-test was used. Association between the tumor volume and cfDNA concentration was examined with Pearson correlation test (Spearman’s rho calculation). A value of p < 0.05 was considered to be statistically significant.

3. Results

3.1. Patients Clinicopathological Characteristics

The clinicopathological features of the 25 BTC patients are shown in Table 1. The average age was 64.7 (range: 43–80). The gender distribution was 13/12 male/female. According to the tumor localization, 15 IHCC, five EHCC, and five GBC cases were evolved. The average ETV was 265,589 mm3 with a broad range: 3179–1,230,187 mm3. In five cases, metastasis was present (case 2, 3, 7, 13, and 14), the metastatic tumor volume was added to ETV. Tissue biopsy was performed in IHCC and EHCC cases, while resection was carried out only in potential operable GBC cases, as well. The oncological treatments included gemcitabine-based chemotherapy.

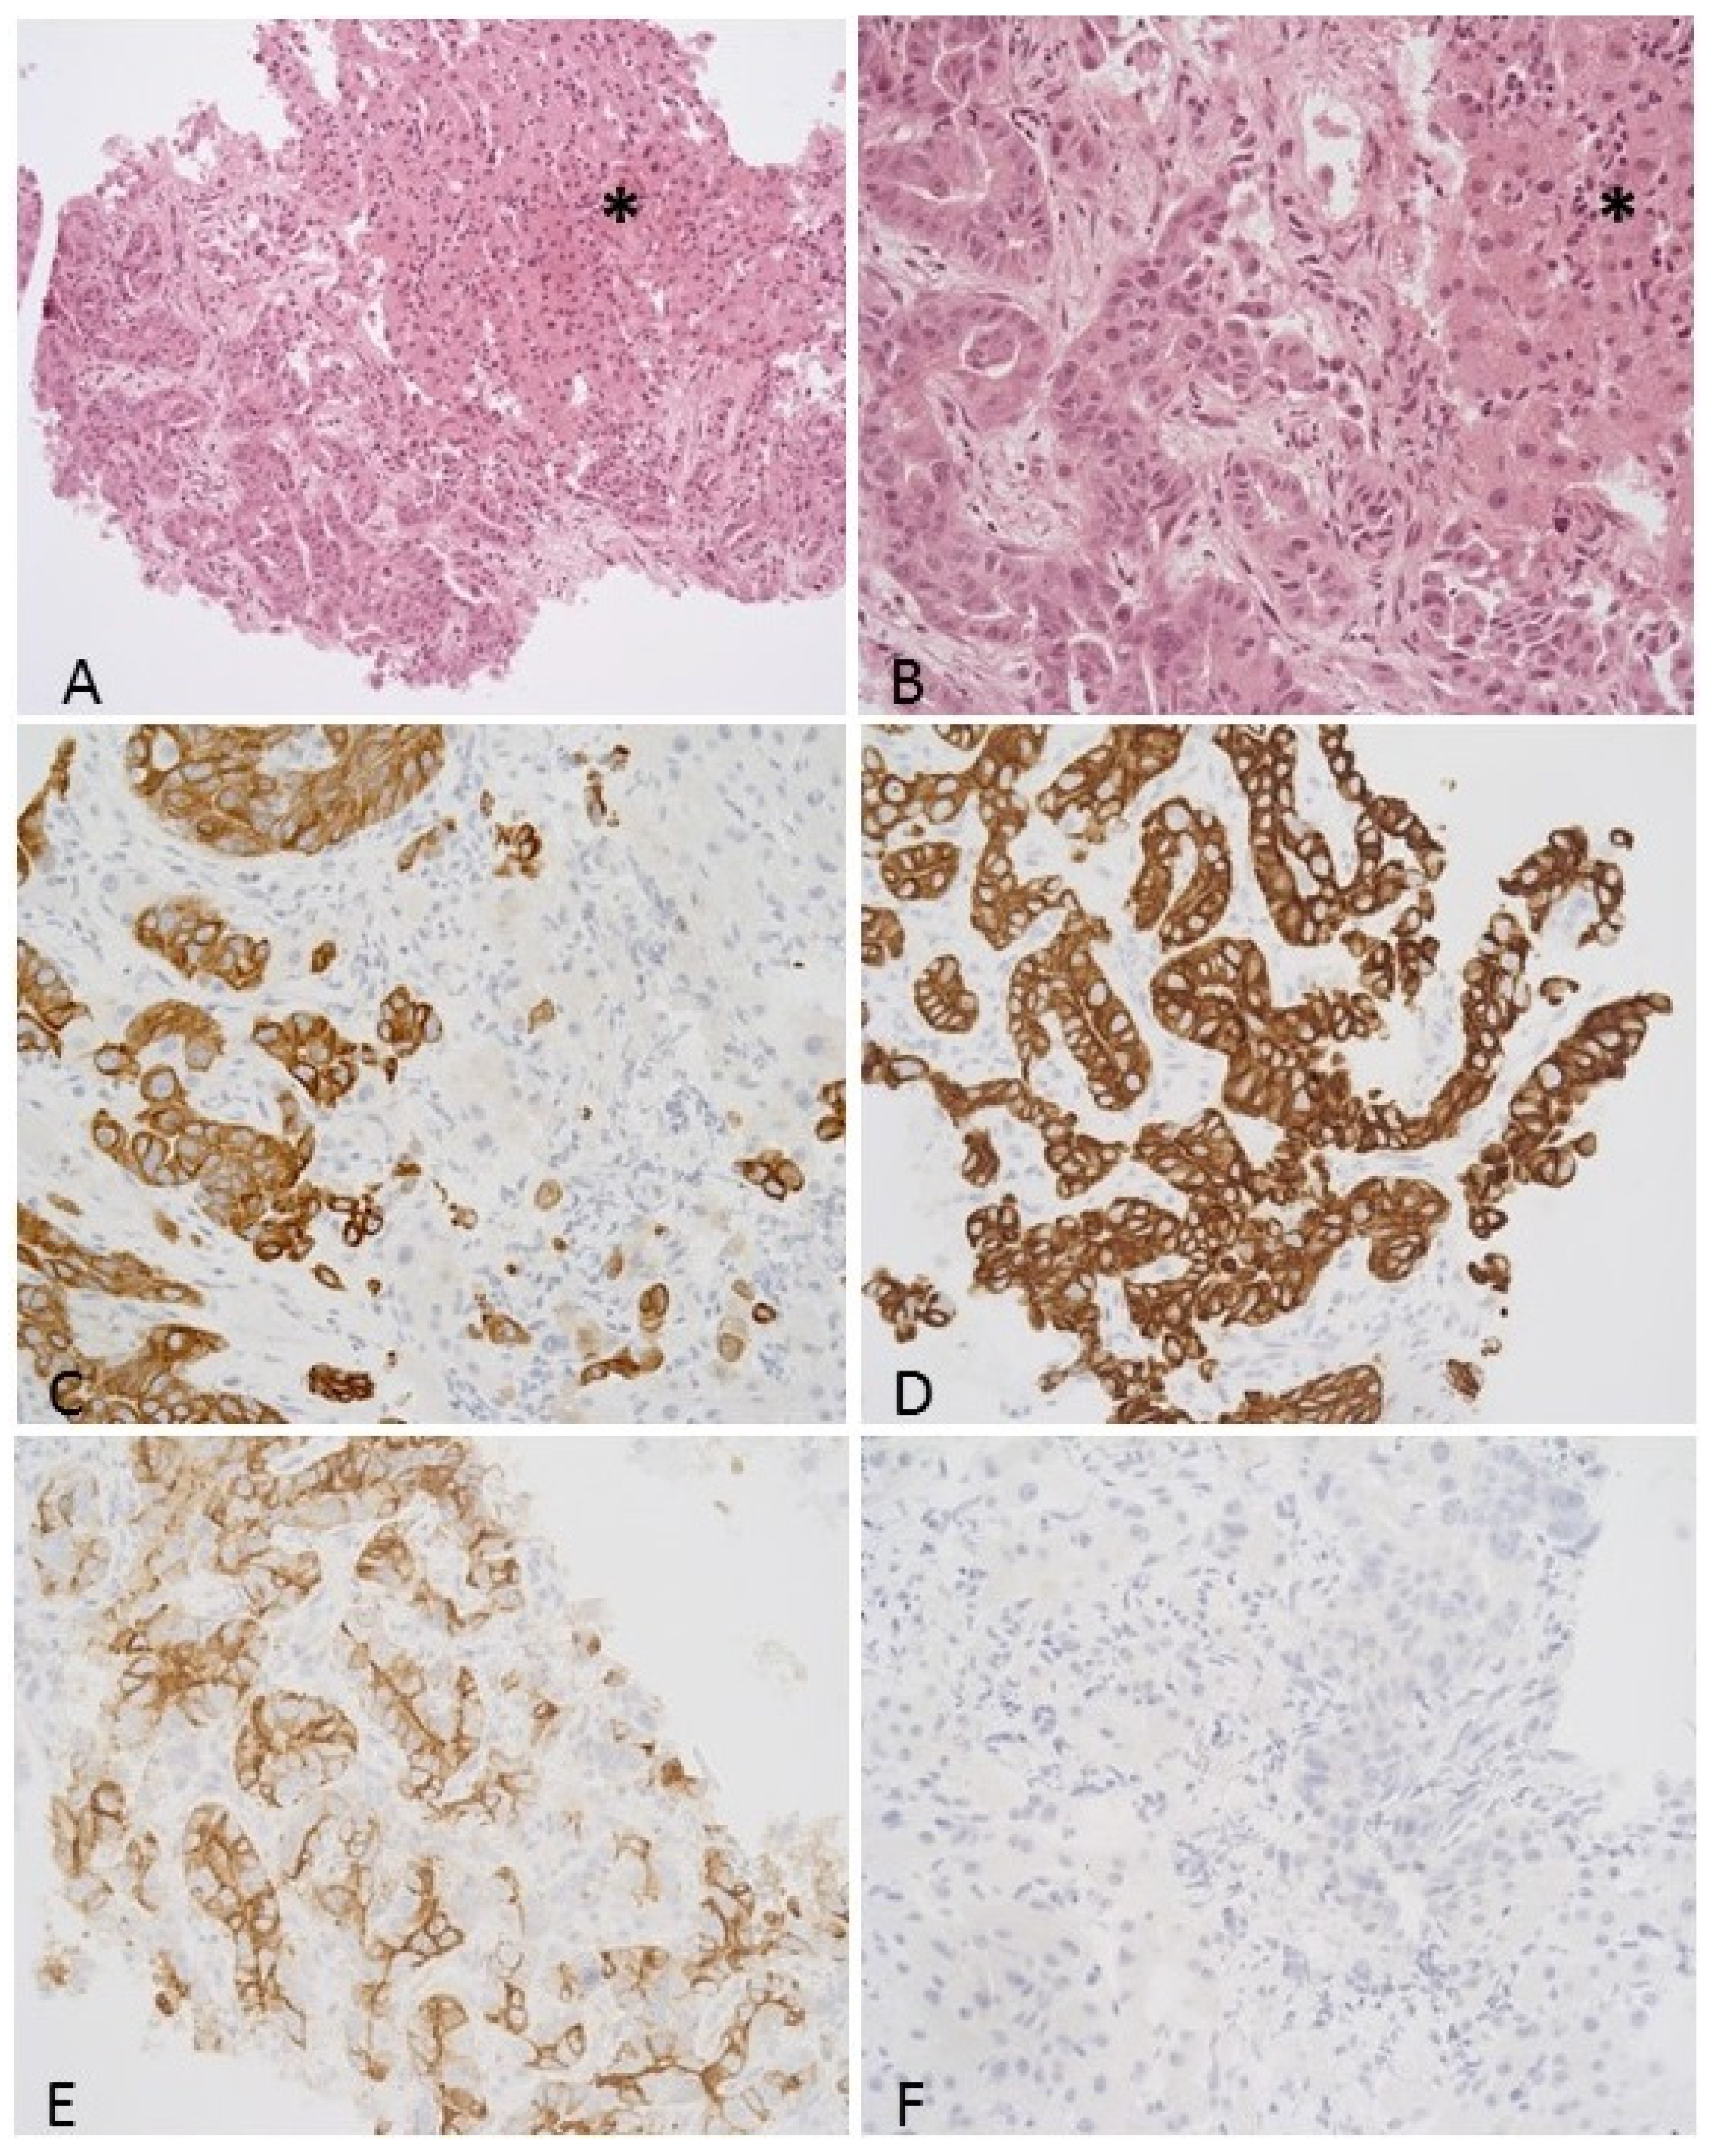
3.2. Histological Features including Immunohistochemistry

The tumor is composed of irregularly shaped, atypical glands with infiltrative growth. Viable tumor cells without necrosis were present in all samples. Tumor cells are pleomorphic with a high nuclear/cytoplasmic ratio, marked atypia, and conspicuous nucleoli. Representative histological and immunohistochemical images are presented in Figure 1. IHC staining features of the patient samples are presented in Table 2. CK7 (24/25, 96%), CK8/18 (23/25, 92%), CK19 (25/25, 100%), and CA19.9 (23/25, 92%) positivity were found. CK20 (21/25, 84%), HSA (25/25, 100%), arginase (22/25, 88%), glypican (23/25, 92%), and PD-L1 (25/25, 100%) immunostaining negativity were performed.

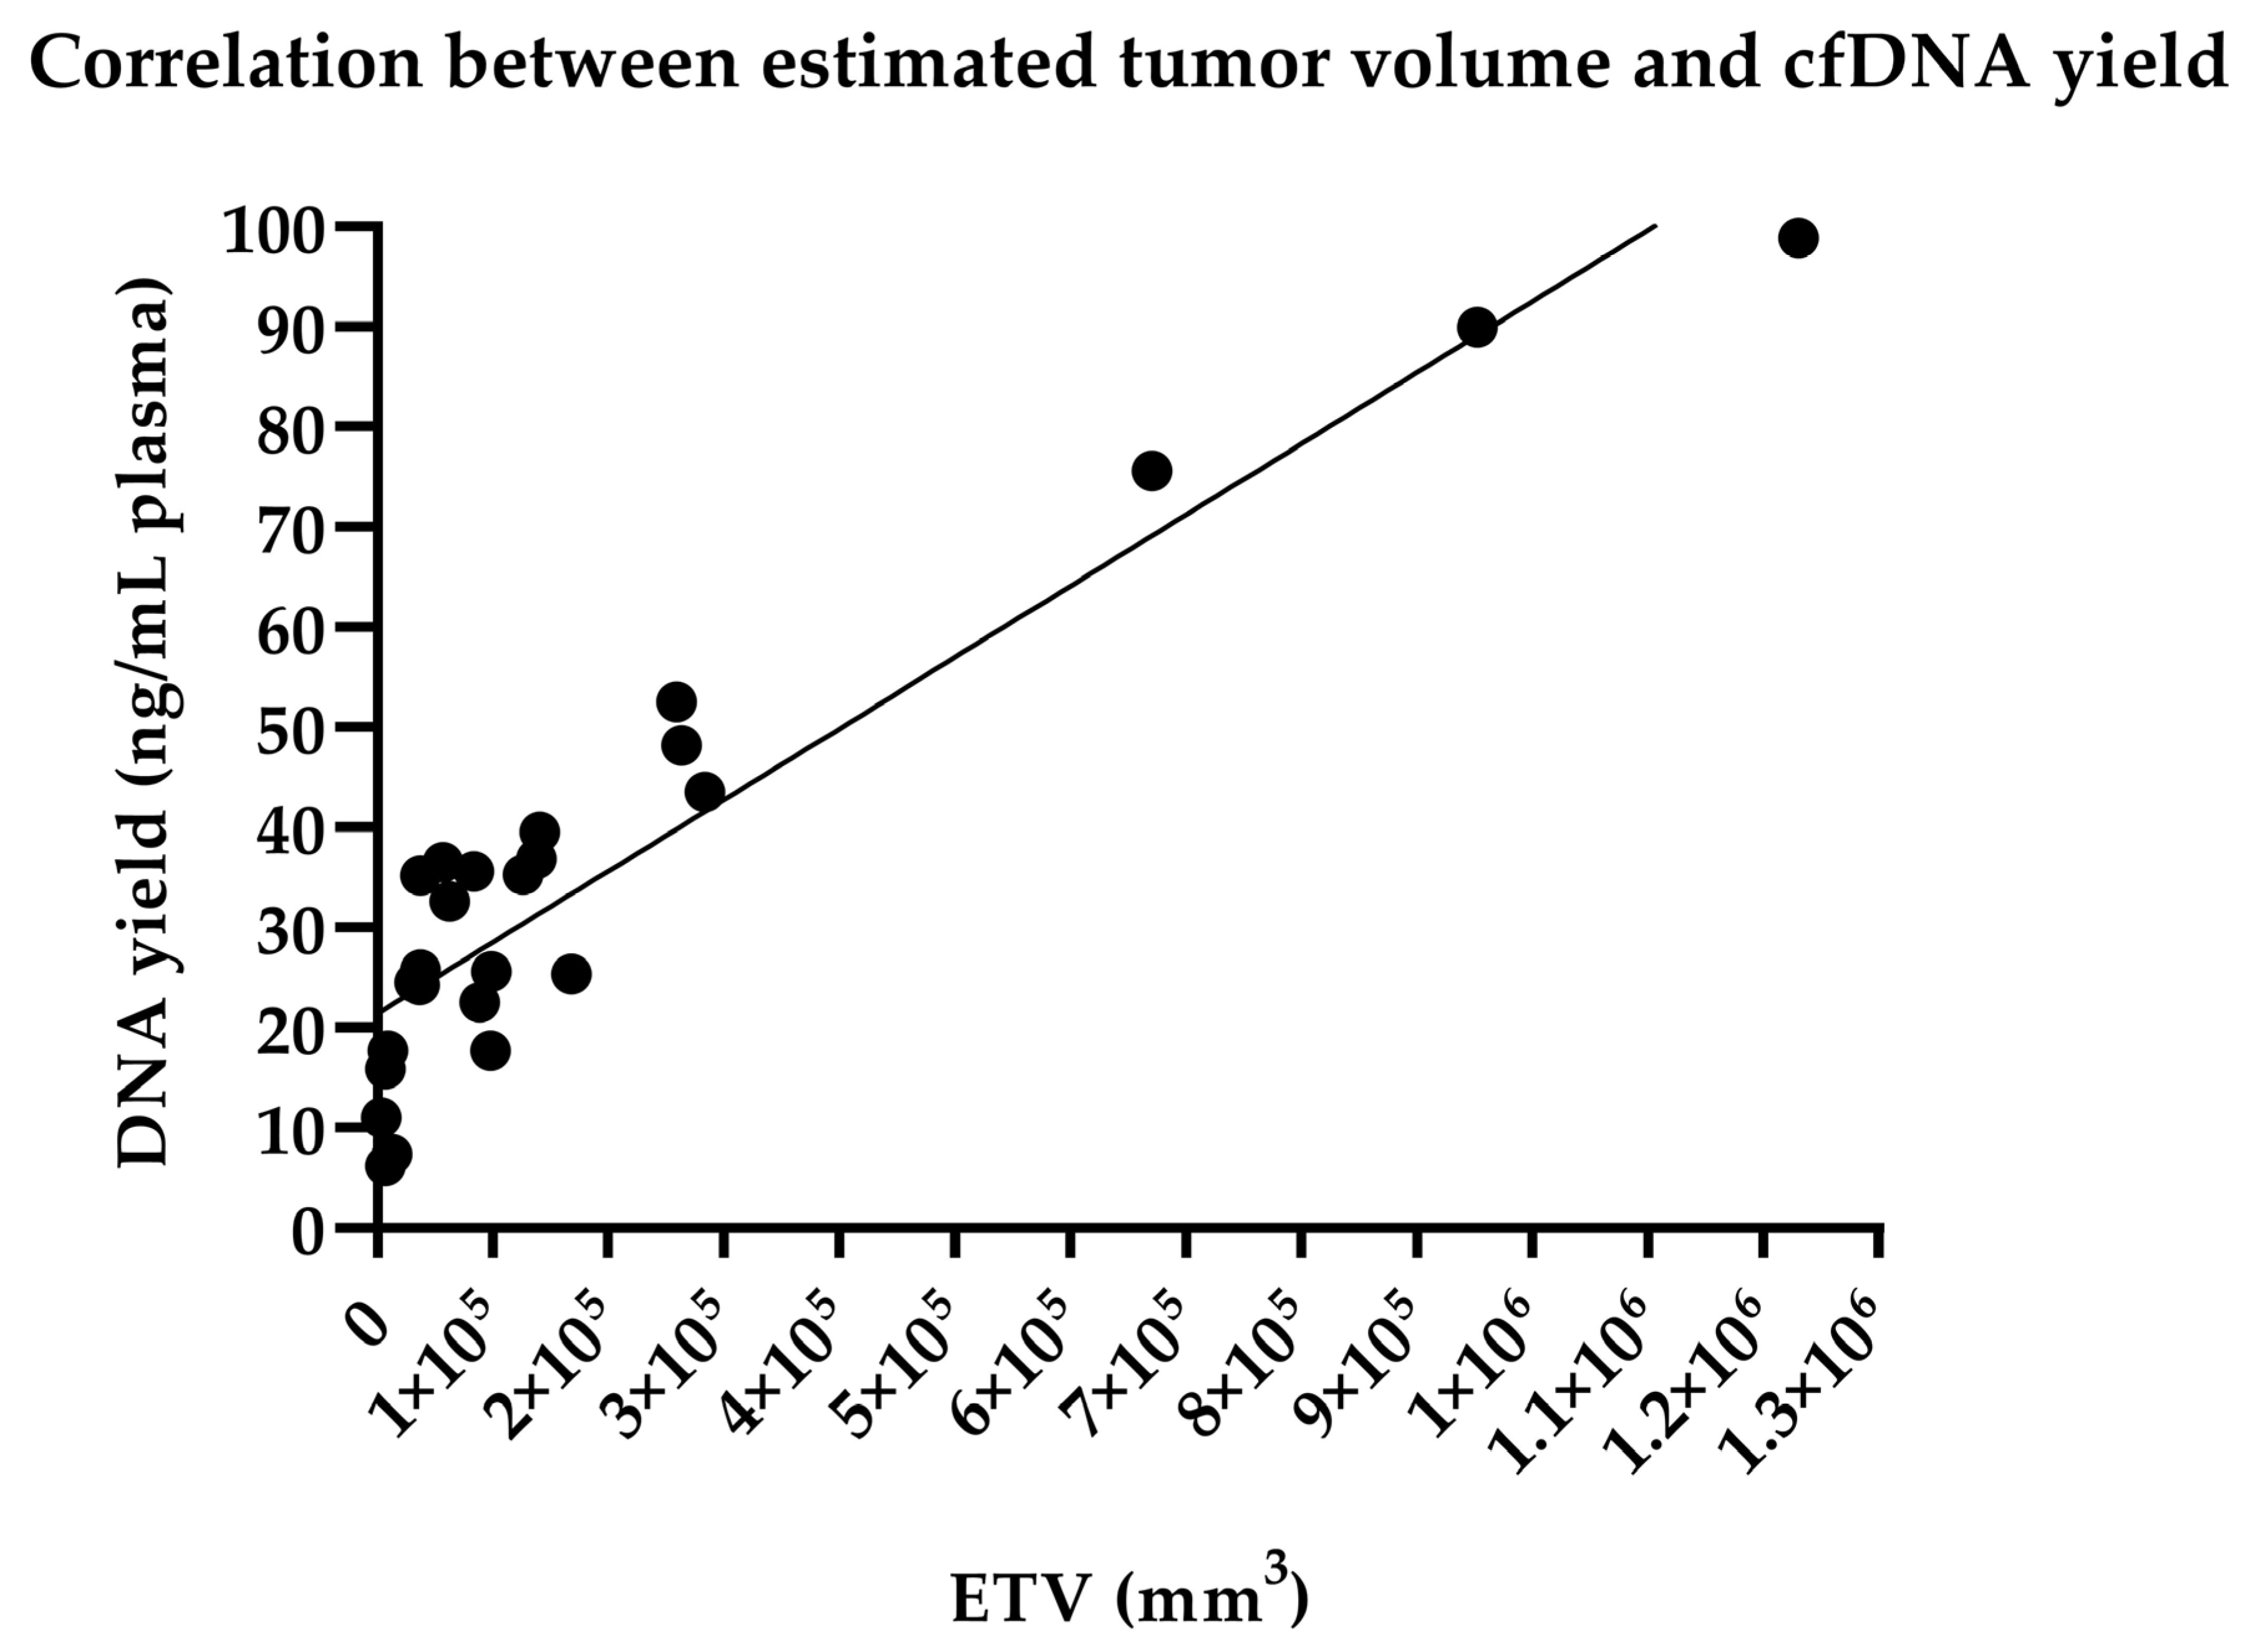
3.3. Correlation Analysis between Estimated Tumor Volume and cfDNA Yield

No statistically significant differences were found in the ETV between the IHCC and the EHCC group (p = 0.9928), between the IHCC and the GBC subtypes (p = 0.3192), and between the EHCC and the GBC category (p = 0.4376), when GBC considered a different entity, as well.
The mean cfDNA yield was 35.4 ng/mL plasma (range: 6.18–98.9). No statistically significant differences were found in the cfDNA yield between the IHCC and the EHCC (p = 0.7736), between the IHCC and the GBC (p = 0.1121), and between the EHCC and the GBC entity (p = 0.3570).
We found a positive significant correlation between the ETV and cfDNA yield using the Pearson correlation test (r = 0.9326, p < 0.0001) analyzing all BTC cases (Figure 2).

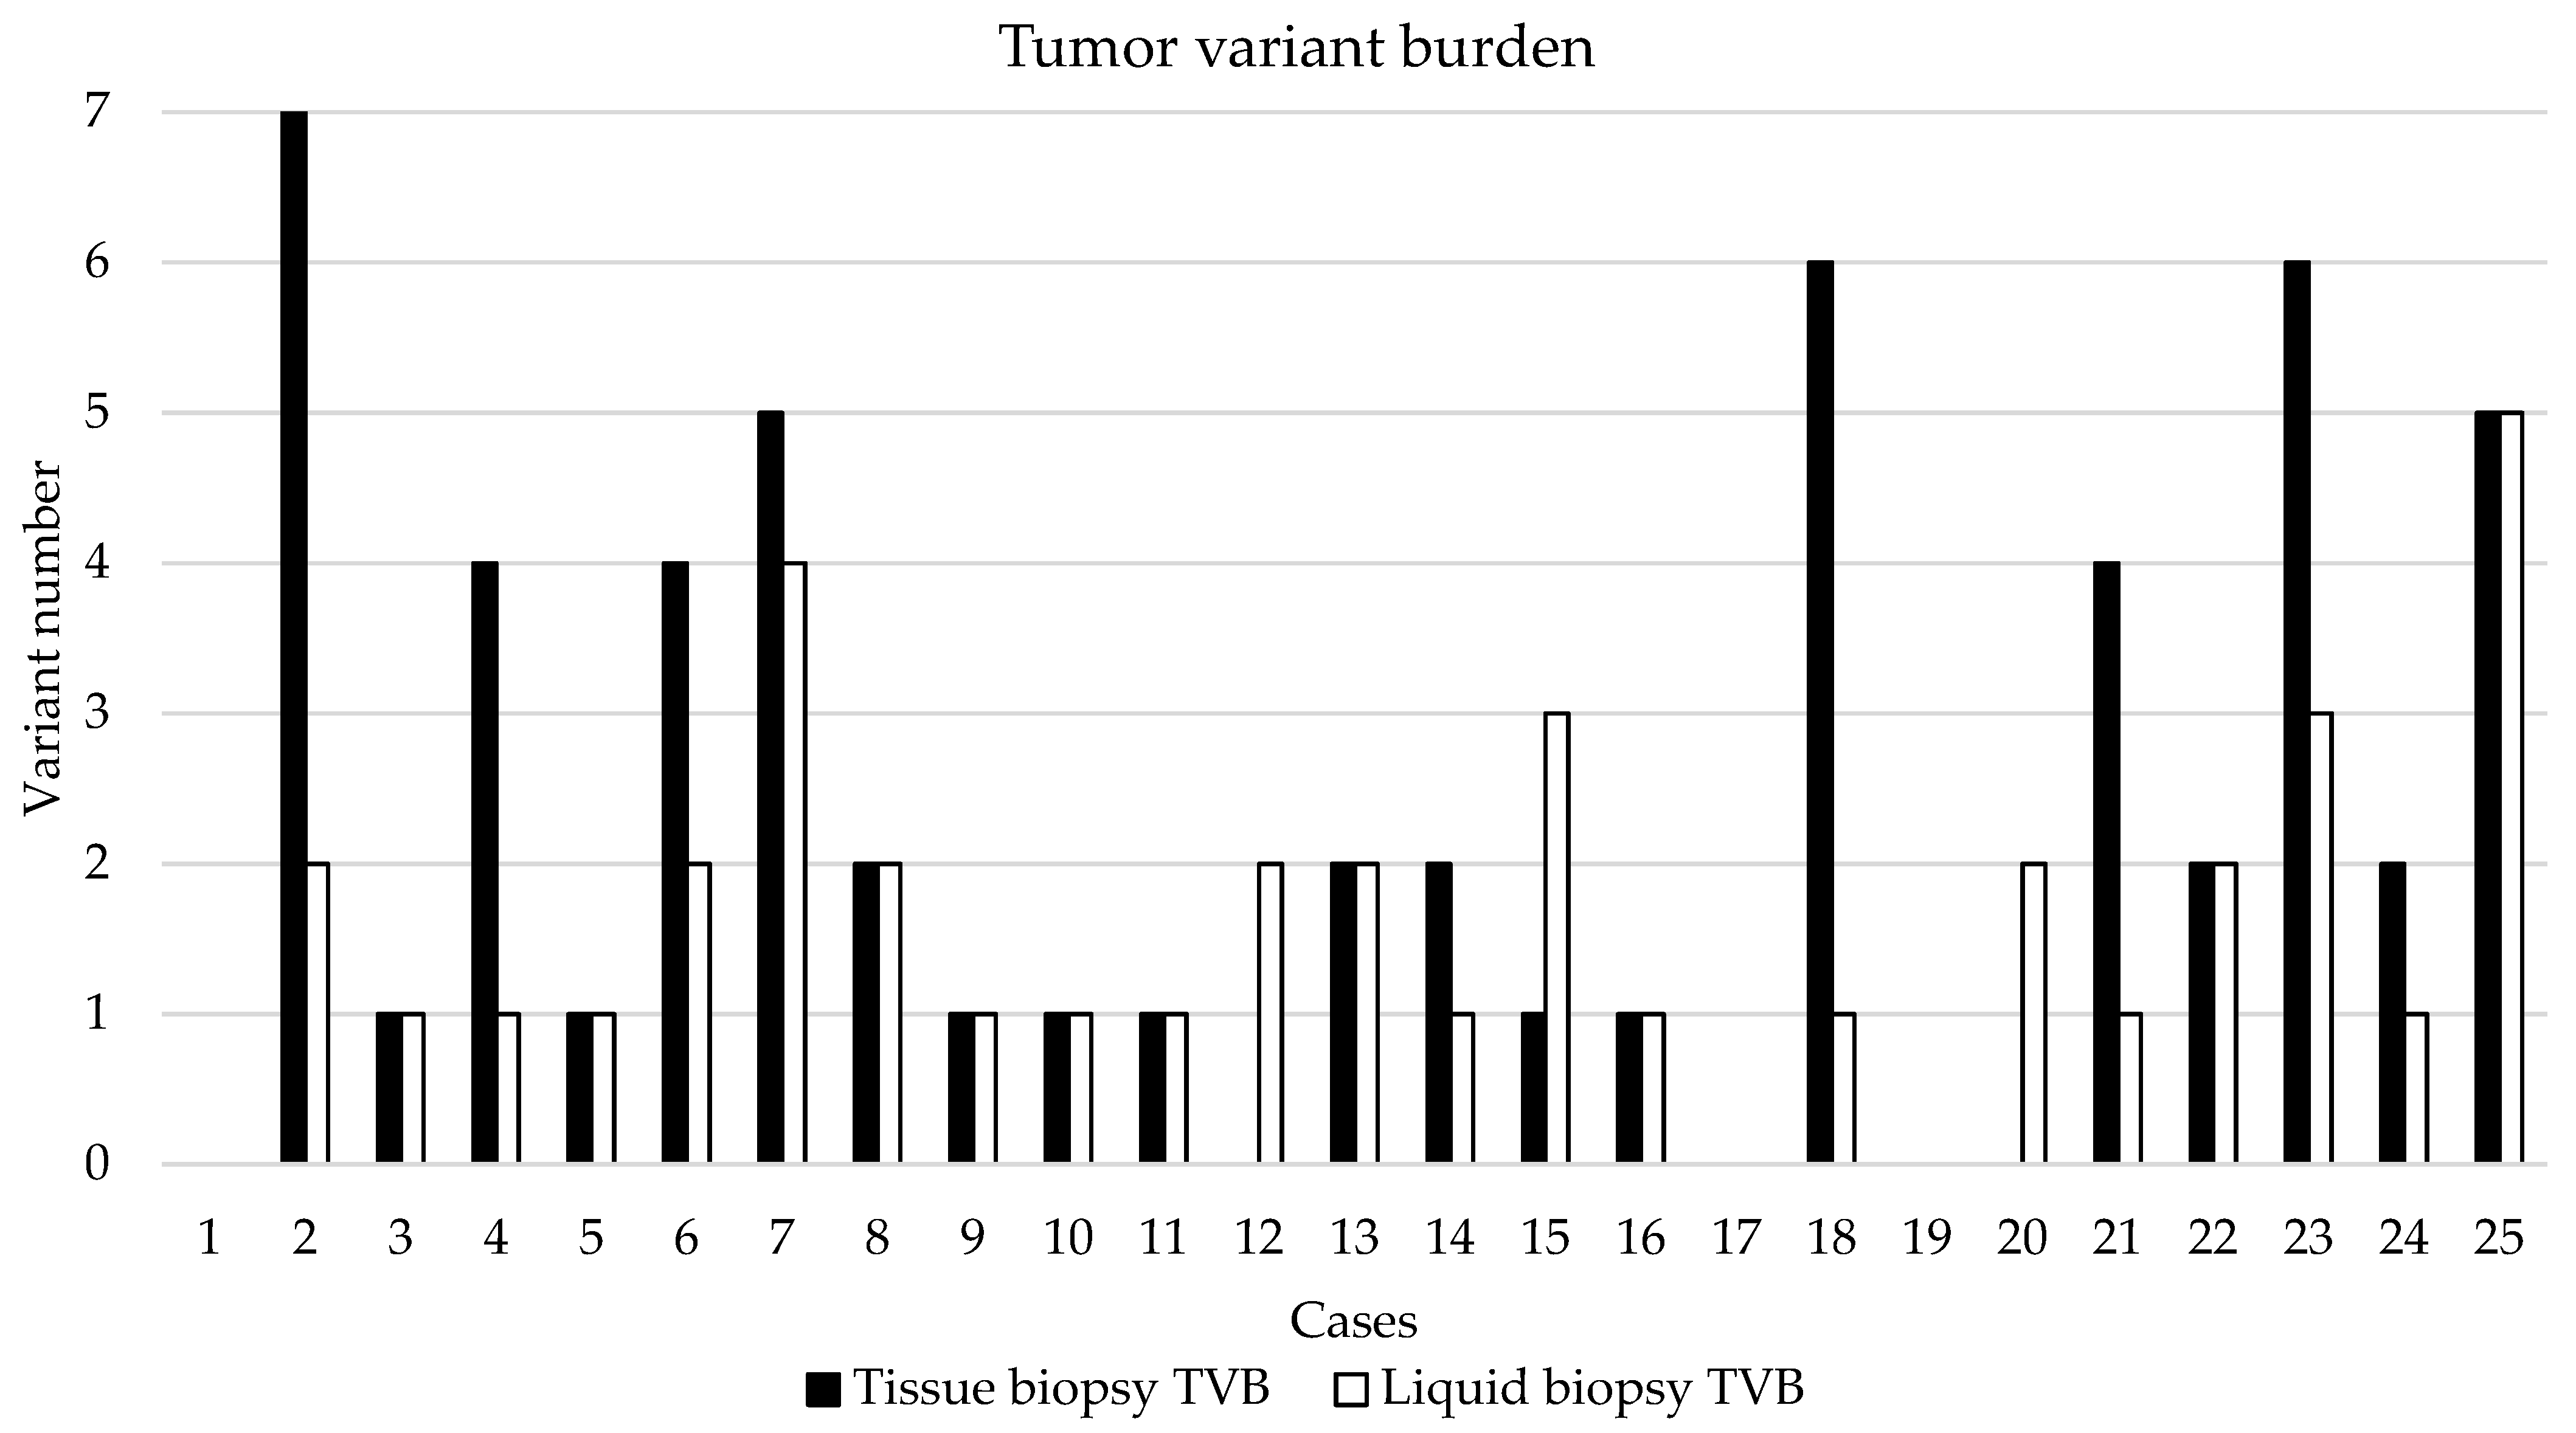
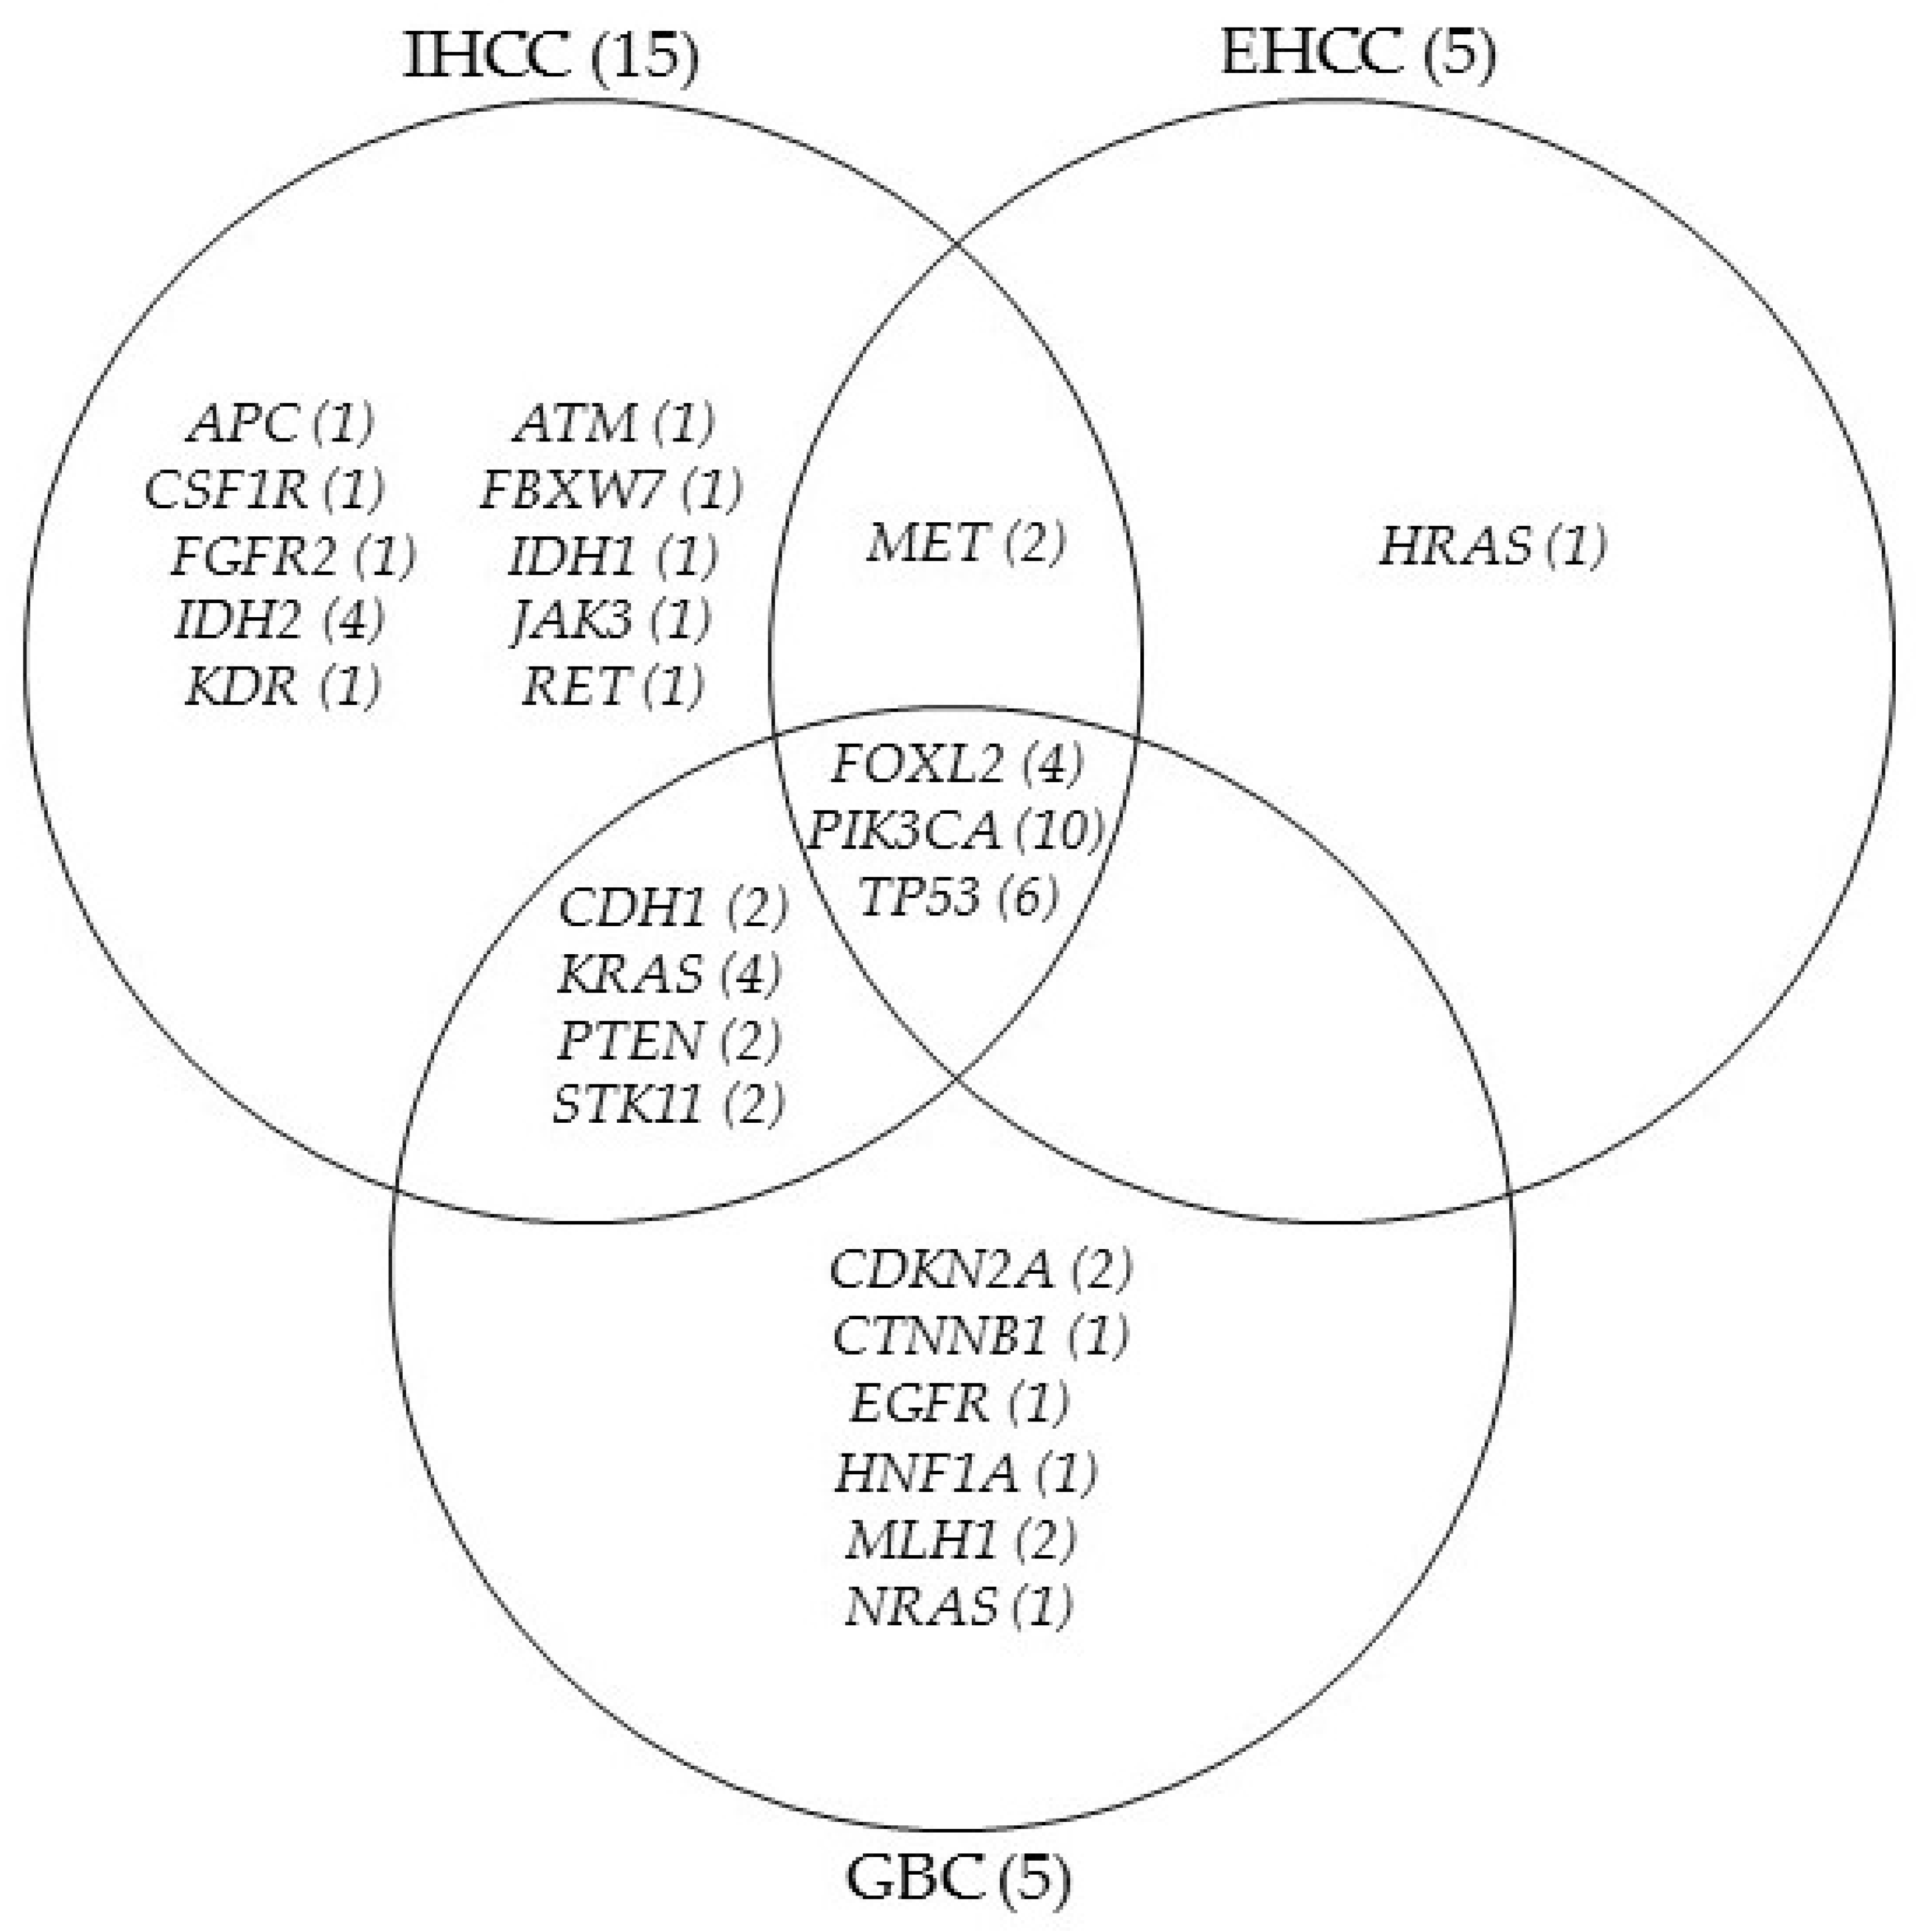
3.4. NGS-Based Mutation Profiling of Genomic and Cell-Free DNA

TVB was defined with the number of gene variants including SNPs above 2% VAF (Figure 3). TVB was calculated in tissue and liquid biopsy samples, as well. The largest TVB was in cases 2, 18, and 23, while no nucleotide change was detected in cases 1, 17, and 19. In cases 12 and 20, only the liquid biopsy was informative for the aspect of tumor burden determination. Comparing tissue and LB results, similar TVB was observed in most of the cases.
When comparing average TVB of the three BTC subtypes, no significant difference was identified (tissue vs. LB in IHCC: 2.1 vs. 1.6, p = 0.3612; tissue vs. LB in EHCC: 1.4 vs. 0.8, p = 0.6374; tissue vs. LB in GBC: 3.8 vs. 2.4, p = 0.2371). No significant difference was observed, comparing tissue biopsy-derived TVB (IHCC vs. EHCC: p = 0.5166; IHCC vs. GBC: p = 0.1154, EHCC vs. GBC: p = 0.1281) and LB-derived TVB (IHCC vs. EHCC: p = 0.122; IHCC vs. GBC: p = 0.2034, EHCC vs. GBC: p = 0.0922), as well.
SNVs were detected in 21/25 patients (84%), while in cases 1, 5, 17, and 19, nucleotide aberration was not identified by our method. In two cases, only the LB sample was informative for molecular analysis (tissue biopsy insufficient for molecular analysis, case 12 and 20). Detected SNVs and their clinical significance were presented in Table 3.
The DNA VAF of tissue biopsy and LB were greatly varying with the average of 21.8% (range: 3.0–62.6) and 13.32% (range: 2.1–67.5), respectively. Pathogenic variations were proven at a rate of 17/25 (68%) and presented in some of the most usually affected genes in BTCs, such as FGFR2, IDH1, IDH2, KRAS, and TP53, and most of them could be identified in matched LB-originated cfDNA. Pathogenic SNVs were referred to as mutations (n = 28 in the 25 patients), while benign aberrations were considered neutral (n = 15).
Twenty-five genes were affected in the BTC patients. FOXL2, PIK3CA, and TP53 SNVs have emerged in all BTC subgroups, while CDH1, KRAS, PTEN, and STK11 alteration was found in the IHCC and GBC cases, as well. MET aberration was proved in IHCC and EHCC group, but HRAS c.182A>G (p.Gln61Arg) variance was detected only in one EHCC sample. Several other molecular abnormalities were identified in IHCC and GBC. The genetically aberrant gene distribution of the three subtypes of BTCs was presented in Figure 4.

4. Discussion

BTC is a rare malignancy with a distinctly poor prognosis and limited therapeutic options, so it would be essential to understand the molecular pathogenesis and find a specific molecular target for achieving an effective treatment [1,2]. In the area of precision oncology, not only obtaining an individual possibility of chemotherapy, but also early diagnosis is important for the oncological management of BTC patients. For this purpose, our prospective study focuses on the comprehensive genetic analysis of molecular aberrations of the background in cholangiocarcinoma.
Accessing genetic alterations, therefore, is essential for the diagnosis, management, and selection of targeted therapies, although sampling tumor tissue, when possible, is often risky and difficult to carry out. Compared to the traditional tissue biopsy, LB is not invasive and can be repeated as the potential substitute method for gaining information about the real-time molecular aberration background. The use of peripheral blood LB has been introduced in the early molecular diagnosis of several malignancies, such as lung and colorectal adenocarcinomas, and melanomas, as well [19,22,23,24]. More recently, LB application to detect aberrant gene fusions has been published for the diagnosis of aggressive lymphoma genotyping [25]. Little information was found about the utility of LB to identify diagnostic and prognostic biomarkers in BTCs [26], so for this reason we aimed to quantify and analyze cfDNA management of patients affected by BTC. No published data is available for the association between tumor mass and LB nucleic acid quantity. When determining the ETV in our study, a statistically significant correlation was proved between the tumor volume and peripheral blood plasma cfDNA concentration. The larger tumor mass, calculated based on recent in vivo CT/MR scans, was associated with higher cfDNA yield, as well. In cases with metastasis (case 2, 3, 7, 13, and 14), the metastatic tumor volume was added to ETV. LB was performed the mean 24 months after tissue biopsy (IHCC and EHCC cases), in these cases, ETV was not significantly different from the initial imaging scans. In GBC cases, where surgical resection was carried out, low cfDNA concentration was measured in the PB plasma.
Tumor Mutation Burden (TMB) is a relevant type of specific biomarker, which was introduced as a general molecular diagnostic feature to predict response to immunotherapy in a broad scale of malignancies [27]. TMB is calculated as the number of variants per Mbp genomic DNA isolated from the neoplastic tissue sample. There is very limited literature available on TMB data in association with BTCs [28]. To address this issue in our study, we calculated TVB for every case, not only for the tissue, but also in LB samples. TVB was defined in this study as the number of all gene variants including SNPs above 2% VAF. High TVB was determined to produce targeted NGS libraries of 660 regions of interest across 67 genes. Comparing tumor tissue and LB results, similar TVB was observed in most of the cases. No significant difference was identified when analyzing the average tissue biopsy-derived and LB-derived TVB of the three BTC subtypes. A total of 45 alterations were found in tissue and from these, 28 emerged in the plasma (62.2%). Controversially, four SNVs were identified only in the plasma, while in two cases, only the LB sample was informative for molecular analysis (in case 12 and 20, four variants were detected in cfDNA).
Recent reports described gene aberrations related to the individual BTC subtypes that potentially contribute to different cholangiocarcinoma pathogenesis [3,16,17,18]. In our study, SNVs were identified in twenty-one patients and the results broadly reflected the differences in the three molecular categories described in the literature [16,17,18] (Figure 4). The highest number of the affected genes (n = 18) was found in the IHCC type, but eight of them were shared with either EHCC or GBC types. In the EHCC group, only five gene variants could be identified, four of them were common with the other subtypes, while one (HRAS) variant occurred exclusively in this subtype. Out of the total 13 gene alterations, six were identified in GBC, which has not emerged in the other two groups. CDH1, KRAS, PTEN, MET, and STK11 alterations were described in association with IHCC and GBC in some publications [29,30,31]. FOXL2, PIK3CA, and TP53 variants were found in all three BTC histologic subtypes. According to the literature data, these variations are most often, but not exclusively detected in the EHCC patients, while their occurrence in IHCC samples is associated with an unfavorable prognosis [16,32,33].
One of the most common gene mutations in cholangiocarcinoma is affecting the IDH1/IDH2 gene (encoding isocitrate dehydrogenase isotypes), which is characteristic of the IHCC category [1,3,16]. A similar finding was provided by our study, as it was detected only in IHCC patients with a frequency of 4/15 (case 2, 10, 11, and 13). In case 2, IDH1 and IDH2 variants emerged at the same time. FGFR2 point mutation is one other major gene alteration in IHCC [29,30,31], which was found in a single case with pathogenic clinical significance (case 9).
Variants were further categorized according to their clinical significance as determined by the COSMIC and Clinvar databases. Pathogenic mutations were detected in 17 of 25 patients (68%). The most common affected genes in BTCs, such as FGFR2, IDH1, IDH2, KRAS, and TP53 presented with pathogenic variants in our study population, and most of them could be identified in matched LB originated cfDNA, as well. KRAS, BRAF mutations, overexpression of EGFR, HER2, activation of oncogenic signaling pathways, DNA amplification, and deletions are associated with poor outcomes [34,35].
Detected pathogen variants were cross-checked in the OncoKB database for therapeutic possibilities. Optional oncotherapeutic agent was found in only four cases, one was specific for BTC patients. Ivosidenib for IDH1 p.Arg132Leu aberration (case 2) was the FDA’s approved therapeutic drug for the management of advanced cholangiocarcinoma patients [36,37]. AZD4547, BGJ398, Debio1347, and Erdafitinib for all oncogenic FGFR2 mutations, Tipifarnib for HRAS aberrations, and AZD8186, and GSK2636771 for PTEN point mutations were not specified in the FDA’s approved packaging label for BTC therapy (off-label drug).
BTCs are extraordinary rare malignancies and diagnostic sampling is frequently extremely difficult due to the special anatomical localization, partial tissue involvement, or minimal amounts of the tissue sample. Thus, our study design was also faced with such issues, which could be partially overcome when applying tumor tissue and LB-based sequencing. The major limitation of our study is the low case number originating from a single institution. The use of an NGS gene panel targeting 67 genes appeared highly effective in both sample types, although did not fully cover all affected genes described in BTCs. The presence of copy number variations (ERBB2) and fusions (FGFR2, NTRK) are important in BTC and are not covered in the assay, as well. LB was carried out only one time to control the chemotherapy effectiveness and no clinical follow-up was performed because most of the patients were treated with similar onco-chemotherapeutic agents.

5. Conclusions

Tumor-derived cfDNA in BTCs also allows the effective monitoring of the molecular genetic profile and the response to chemotherapy. The use of LB is a favorable solution because repeated invasive sampling can be avoided. We assume that the efficacy of the LB-based sequencing is increasing with the progression and cfDNA release of the tumor. In the present series, we were able to demonstrate clinically relevant SNVs from the tissue and matched LB samples of BTC patients. Our prospective study demonstrates a minimally invasive testing approach to identify molecular genetic alterations in cholangiocarcinoma and gallbladder cancers. Clinical applications of cfDNA reflect by capturing the outstanding spatial tumor heterogeneity and guarantee novel aspects for precision oncology treatment.

Author Contributions

S.L.C., data curation, formal analysis, investigation, methodology, project administration, and writing—original draft preparation; J.B., investigation, methodology, and writing—original draft preparation; G.V., data curation, formal analysis, methodology, and visualization; A.Á. and C.A., data curation, and investigation; G.M., conceptualization, formal analysis, funding acquisition, investigation, resources, supervision, and writing—review and editing; A.M., conceptualization, data curation, formal analysis, investigation, methodology, project administration, supervision, visualization, and writing—review and editing. All authors have read and agreed to the published version of the manuscript.

Funding

This research received no external funding.

Institutional Review Board Statement

The study was conducted according to the guidelines of the Declaration of Helsinki, and approved by the Hungarian Medical Research Council (protocol code 60355-2/2016/EKU and 4648-6/2018/EÜIG).

Informed Consent Statement

Informed consent was obtained from all subjects involved in the study.

Data Availability Statement

The data presented in this study are available on request from the corresponding author. The data are not publicly available to protect the rights of patients.

Conflicts of Interest

The authors declare no conflict of interest.

References

  1. Noel, M.S.; Hezel, A.F. New and Emerging Treatment Options for Biliary Tract Cancer. OncoTargets Ther. 2013, 6, 1545–1552. [Google Scholar] [CrossRef] [Green Version]
  2. Weinberg, B.A.; Xiu, J.; Lindberg, M.R.; Shields, A.F.; Hwang, J.J.; Poorman, K.; Salem, M.E.; Pishvaian, M.J.; Holcombe, R.F.; Marshall, J.L.; et al. Molecular Profiling of Biliary Cancers Reveals Distinct Molecular Alterations and Potential Therapeutic Targets. J. Gastrointest. Oncol. 2019, 10, 652–662. [Google Scholar] [CrossRef]
  3. Putra, J.; de Abreu, F.B.; Peterson, J.D.; Pipas, J.M.; Mody, K.; Amos, C.I.; Tsongalis, G.J.; Suriawinata, A.A. Molecular Profiling of Intrahepatic and Extrahepatic Cholangiocarcinoma Using next Generation Sequencing. Exp. Mol. Pathol. 2015, 99, 240–244. [Google Scholar] [CrossRef] [Green Version]
  4. Horgan, A.M.; Amir, E.; Walter, T.; Knox, J.J. Adjuvant Therapy in the Treatment of Biliary Tract Cancer: A Systematic Review and Meta-Analysis. J. Clin. Oncol. 2012, 30, 1934–1940. [Google Scholar] [CrossRef]
  5. Ma, N.; Cheng, H.; Qin, B.; Zhong, R.; Wang, B. Adjuvant Therapy in the Treatment of Gallbladder Cancer: A Meta-Analysis. BMC Cancer 2015, 15, 615. [Google Scholar] [CrossRef] [Green Version]
  6. Lamarca, A.; Hubner, R.A.; David Ryder, W.; Valle, J.W. Second-Line Chemotherapy in Advanced Biliary Cancer: A Systematic Review. Ann. Oncol. 2014, 25, 2328–2338. [Google Scholar] [CrossRef]
  7. Ben-Josef, E.; Guthrie, K.A.; El-Khoueiry, A.B.; Corless, C.L.; Zalupski, M.M.; Lowy, A.M.; Thomas, C.R.; Alberts, S.R.; Dawson, L.A.; Micetich, K.C.; et al. SWOG S0809: A Phase II Intergroup Trial of Adjuvant Capecitabine and Gemcitabine Followed by Radiotherapy and Concurrent Capecitabine in Extrahepatic Cholangiocarcinoma and Gallbladder Carcinoma. J. Clin. Oncol. 2015, 33, 2617–2622. [Google Scholar] [CrossRef] [Green Version]
  8. Primrose, J.N.; Fox, R.P.; Palmer, D.H.; Malik, H.Z.; Prasad, R.; Mirza, D.; Anthony, A.; Corrie, P.; Falk, S.; Finch-Jones, M.; et al. Capecitabine Compared with Observation in Resected Biliary Tract Cancer (BILCAP): A Randomised, Controlled, Multicentre, Phase 3 Study. Lancet Oncol. 2019, 20, 663–673. [Google Scholar] [CrossRef] [Green Version]
  9. Ebata, T.; Hirano, S.; Konishi, M.; Uesaka, K.; Tsuchiya, Y.; Ohtsuka, M.; Kaneoka, Y.; Yamamoto, M.; Ambo, Y.; Shimizu, Y.; et al. Randomized Clinical Trial of Adjuvant Gemcitabine Chemotherapy versus Observation in Resected Bile Duct Cancer. Br. J. Surg. 2018, 105, 192–202. [Google Scholar] [CrossRef]
  10. Edeline, J.; Benabdelghani, M.; Bertaut, A.; Watelet, J.; Hammel, P.; Joly, J.-P.; Boudjema, K.; Fartoux, L.; Bouhier-Leporrier, K.; Jouve, J.-L.; et al. Gemcitabine and Oxaliplatin Chemotherapy or Surveillance in Resected Biliary Tract Cancer (PRODIGE 12-ACCORD 18-UNICANCER GI): A Randomized Phase III Study. J. Clin. Oncol. 2019, 37, 658–667. [Google Scholar] [CrossRef]
  11. Lamarca, A.; Palmer, D.H.; Wasan, H.S.; Ross, P.J.; Ma, Y.T.; Arora, A.; Falk, S.; Gillmore, R.; Wadsley, J.; Patel, K.; et al. Second-Line FOLFOX Chemotherapy versus Active Symptom Control for Advanced Biliary Tract Cancer (ABC-06): A Phase 3, Open-Label, Randomised, Controlled Trial. Lancet Oncol. 2021, 22, 690–701. [Google Scholar] [CrossRef]
  12. Tamai, K.; Nakamura, M.; Mizuma, M.; Mochizuki, M.; Yokoyama, M.; Endo, H.; Yamaguchi, K.; Nakagawa, T.; Shiina, M.; Unno, M.; et al. Suppressive Expression of CD274 Increases Tumorigenesis and Cancer Stem Cell Phenotypes in Cholangiocarcinoma. Cancer Sci. 2014, 105, 667–674. [Google Scholar] [CrossRef]
  13. Fontugne, J.; Augustin, J.; Pujals, A.; Compagnon, P.; Rousseau, B.; Luciani, A.; Tournigand, C.; Cherqui, D.; Azoulay, D.; Pawlotsky, J.-M.; et al. PD-L1 Expression in Perihilar and Intrahepatic Cholangiocarcinoma. Oncotarget 2017, 8, 24644–24651. [Google Scholar] [CrossRef] [Green Version]
  14. Mody, K.; Starr, J.; Saul, M.; Poorman, K.; Weinberg, B.A.; Salem, M.E.; VanderWalde, A.; Shields, A.F. Patterns and Genomic Correlates of PD-L1 Expression in Patients with Biliary Tract Cancers. J. Gastrointest. Oncol. 2019, 10, 1099–1109. [Google Scholar] [CrossRef]
  15. Cardinale, V.; Carpino, G.; Reid, L.; Gaudio, E.; Alvaro, D. Multiple Cells of Origin in Cholangiocarcinoma Underlie Biological, Epidemiological and Clinical Heterogeneity. World J. Gastrointest. Oncol. 2012, 4, 94–102. [Google Scholar] [CrossRef]
  16. Churi, C.R.; Shroff, R.; Wang, Y.; Rashid, A.; Kang, H.C.; Weatherly, J.; Zuo, M.; Zinner, R.; Hong, D.; Meric-Bernstam, F.; et al. Mutation Profiling in Cholangiocarcinoma: Prognostic and Therapeutic Implications. PLoS ONE 2014, 9, e115383. [Google Scholar] [CrossRef] [Green Version]
  17. Nakamura, H.; Arai, Y.; Totoki, Y.; Shirota, T.; Elzawahry, A.; Kato, M.; Hama, N.; Hosoda, F.; Urushidate, T.; Ohashi, S.; et al. Genomic Spectra of Biliary Tract Cancer. Nat. Genet 2015, 47, 1003–1010. [Google Scholar] [CrossRef]
  18. Brandi, G.; Farioli, A.; Astolfi, A.; Biasco, G.; Tavolari, S. Genetic Heterogeneity in Cholangiocarcinoma: A Major Challenge for Targeted Therapies. Oncotarget 2015, 6, 14744–14753. [Google Scholar] [CrossRef] [Green Version]
  19. Méhes, G. Liquid Biopsy for Predictive Mutational Profiling of Solid Cancer: The Pathologist’s Perspective. J. Biotechnol. 2019, 297, 66–70. [Google Scholar] [CrossRef]
  20. Rizzo, A.; Ricci, A.D.; Tavolari, S.; Brandi, G. Circulating Tumor DNA in Biliary Tract Cancer: Current Evidence and Future Perspectives. Cancer Genom. Proteom. 2020, 17, 441–452. [Google Scholar] [CrossRef]
  21. Han, J.-Y.; Ahn, K.S.; Kim, T.-S.; Kim, Y.H.; Cho, K.B.; Shin, D.W.; Baek, W.-K.; Suh, S.-I.; Jang, B.-C.; Kang, K.J. Liquid Biopsy from Bile-Circulating Tumor DNA in Patients with Biliary Tract Cancer. Cancers 2021, 13, 4581. [Google Scholar] [CrossRef]
  22. Rachiglio, A.M.; Esposito Abate, R.; Sacco, A.; Pasquale, R.; Fenizia, F.; Lambiase, M.; Morabito, A.; Montanino, A.; Rocco, G.; Romano, C.; et al. Limits and Potential of Targeted Sequencing Analysis of Liquid Biopsy in Patients with Lung and Colon Carcinoma. Oncotarget 2016, 7, 66595–66605. [Google Scholar] [CrossRef] [PubMed] [Green Version]
  23. Mack, P.C.; Banks, K.C.; Espenschied, C.R.; Burich, R.A.; Zill, O.A.; Lee, C.E.; Riess, J.W.; Mortimer, S.A.; Talasaz, A.; Lanman, R.B.; et al. Spectrum of Driver Mutations and Clinical Impact of Circulating Tumor DNA Analysis in Non-Small Cell Lung Cancer: Analysis of over 8000 Cases. Cancer 2020, 126, 3219–3228. [Google Scholar] [CrossRef] [PubMed]
  24. Gaiser, M.R.; von Bubnoff, N.; Gebhardt, C.; Utikal, J.S. Liquid Biopsy to Monitor Melanoma Patients. J. Dtsch. Dermatol. Ges. 2018, 16, 405–414. [Google Scholar] [CrossRef] [PubMed]
  25. Mokánszki, A.; Bicskó, R.; Gergely, L.; Méhes, G. Cell-Free Total Nucleic Acid-Based Genotyping of Aggressive Lymphoma: Comprehensive Analysis of Gene Fusions and Nucleotide Variants by Next-Generation Sequencing. Cancers 2021, 13, 3032. [Google Scholar] [CrossRef]
  26. Rompianesi, G.; Di Martino, M.; Gordon-Weeks, A.; Montalti, R.; Troisi, R. Liquid Biopsy in Cholangiocarcinoma: Current Status and Future Perspectives. World J. Gastrointest. Oncol. 2021, 13, 332–350. [Google Scholar] [CrossRef]
  27. Samstein, R.M.; Lee, C.-H.; Shoushtari, A.N.; Hellmann, M.D.; Shen, R.; Janjigian, Y.Y.; Barron, D.A.; Zehir, A.; Jordan, E.J.; Omuro, A.; et al. Tumor Mutational Load Predicts Survival after Immunotherapy across Multiple Cancer Types. Nat. Genet. 2019, 51, 202–206. [Google Scholar] [CrossRef] [PubMed]
  28. Chen, X.; Wu, X.; Wu, H.; Gu, Y.; Shao, Y.; Shao, Q.; Zhu, F.; Li, X.; Qian, X.; Hu, J.; et al. Camrelizumab plus Gemcitabine and Oxaliplatin (GEMOX) in Patients with Advanced Biliary Tract Cancer: A Single-Arm, Open-Label, Phase II Trial. J. Immunother. Cancer 2020, 8, e001240. [Google Scholar] [CrossRef]
  29. Jusakul, A.; Cutcutache, I.; Yong, C.H.; Lim, J.Q.; Huang, M.N.; Padmanabhan, N.; Nellore, V.; Kongpetch, S.; Ng, A.W.T.; Ng, L.M.; et al. Whole-Genome and Epigenomic Landscapes of Etiologically Distinct Subtypes of Cholangiocarcinoma. Cancer Discov. 2017, 7, 1116–1135. [Google Scholar] [CrossRef] [Green Version]
  30. Mertens, J.C.; Rizvi, S.; Gores, G.J. Targeting Cholangiocarcinoma. Biochim. Biophys. Acta Mol. Basis Dis. 2018, 1864, 1454–1460. [Google Scholar] [CrossRef]
  31. Rizvi, S.; Khan, S.A.; Hallemeier, C.L.; Kelley, R.K.; Gores, G.J. Cholangiocarcinoma—Evolving Concepts and Therapeutic Strategies. Nat. Rev. Clin. Oncol. 2018, 15, 95–111. [Google Scholar] [CrossRef] [Green Version]
  32. Montal, R.; Sia, D.; Montironi, C.; Leow, W.Q.; Esteban-Fabró, R.; Pinyol, R.; Torres-Martin, M.; Bassaganyas, L.; Moeini, A.; Peix, J.; et al. Molecular Classification and Therapeutic Targets in Extrahepatic Cholangiocarcinoma. J. Hepatol. 2020, 73, 315–327. [Google Scholar] [CrossRef]
  33. Lendvai, G.; Szekerczés, T.; Illyés, I.; Dóra, R.; Kontsek, E.; Gógl, A.; Kiss, A.; Werling, K.; Kovalszky, I.; Schaff, Z.; et al. Cholangiocarcinoma: Classification, Histopathology and Molecular Carcinogenesis. Pathol. Oncol. Res. 2020, 26, 3–15. [Google Scholar] [CrossRef]
  34. Andersen, J.B.; Spee, B.; Blechacz, B.R.; Avital, I.; Komuta, M.; Barbour, A.; Conner, E.A.; Gillen, M.C.; Roskams, T.; Roberts, L.R.; et al. Genomic and Genetic Characterization of Cholangiocarcinoma Identifies Therapeutic Targets for Tyrosine Kinase Inhibitors. Gastroenterology 2012, 142, 1021–1031.e15. [Google Scholar] [CrossRef] [PubMed] [Green Version]
  35. Sia, D.; Hoshida, Y.; Villanueva, A.; Roayaie, S.; Ferrer, J.; Tabak, B.; Peix, J.; Sole, M.; Tovar, V.; Alsinet, C.; et al. Integrative Molecular Analysis of Intrahepatic Cholangiocarcinoma Reveals 2 Classes That Have Different Outcomes. Gastroenterology 2013, 144, 829–840. [Google Scholar] [CrossRef] [PubMed] [Green Version]
  36. Abou-Alfa, G.K.; Macarulla, T.; Javle, M.M.; Kelley, R.K.; Lubner, S.J.; Adeva, J.; Cleary, J.M.; Catenacci, D.V.; Borad, M.J.; Bridgewater, J.; et al. Ivosidenib in IDH1-Mutant, Chemotherapy-Refractory Cholangiocarcinoma (ClarIDHy): A Multicentre, Randomised, Double-Blind, Placebo-Controlled, Phase 3 Study. Lancet Oncol. 2020, 21, 796–807. [Google Scholar] [CrossRef]
  37. Zhu, A.X.; Macarulla, T.; Javle, M.M.; Kelley, R.K.; Lubner, S.J.; Adeva, J.; Cleary, J.M.; Catenacci, D.V.T.; Borad, M.J.; Bridgewater, J.A.; et al. Final Overall Survival Efficacy Results of Ivosidenib for Patients With Advanced Cholangiocarcinoma with IDH1 Mutation: The Phase 3 Randomized Clinical ClarIDHy Trial. JAMA Oncol. 2021, 7, 1669–1677. [Google Scholar] [CrossRef] [PubMed]
Figure 1. Representative histological and immunostaining of intrahepatic cholangiocarcinoma. (A,B): Core biopsy of a hepatic lesion which was consistent with intrahepatic cholangiocarcinoma (H&E, 200× and 400× magnification, respectively). The tumor is made up of irregular, atypical glandules with infiltrative growth. The neoplastic glandules are surrounded by desmoplastic stroma. Non-neoplastic hepatocytes can be seen on the right side (*). The neoplastic cells were positive for CK7 (C), CK19 (D), and Ca19-9 (E), while negative for CK20 (F) immunostaining (400× magnification).
Cancers 14 00233 g001
Figure 2. Association between estimated tumor volume (ETV) and tumor-derived circulating cell-free DNA yield. Pearson correlation coefficient was showed a significant correlation (r = 0.9326, p < 0.0001, 95% confidence interval: 0.8510 to 0.9702).
Cancers 14 00233 g002
Figure 3. Tumor variant burden in the 25 BTC cases. TVB was defined with the number of gene variants including SNPs above 2% VAF.
Cancers 14 00233 g003
Figure 4. Genetically aberrant gene distribution of the three subtypes of BTCs. IHCC (15): intrahepatic cholangiocarcinoma, EHCC (5): extrahepatic cholangiocarcinoma, GBC (5): gallbladder carcinoma (case number are in bracket). Gene aberration frequencies are presented in the bracket after gene symbols.
Cancers 14 00233 g004
Table 1. Clinicopathological features of the BTC patients.
CasesGenderAge (Years)ETV (mm3)MetastasisBTC SubtypeChemotherapy
1F8083,349noIHCCcisplatin plus gemcitabine, capecitabine, irinotecan
2F7588,200liverIHCCgemcitabine, bevacizumab
3M7656,784liverIHCCcapecitabine, cisplatin plus gemcitabin
4M5937,044noIHCCcisplatin plus gemcitabine
5M681,680,000noIHCCcisplatin plus gemcibatine, irinotecan, capecitabine
6M6837,462noIHCCcisplatin plus gemcitabine, capecitabine
7M60259,200peritoneumIHCCcisplatin plus gemcitabine, trametinib, everolimus
8M6862,500noIHCCcisplatin plus gemcitabine
9F631,230,187noIHCCcisplatin plus gemcitabine
10M53263,250noIHCCcisplatin plus gemcitabine, irinotecan
11M7012,800noIHCCcisplatin plus gemcitabine, irinotecan, capeticabine
12F61283,500noIHCCcisplatin plus gemcitabine, capecitabine
13M759126liverIHCCcapecitabine, gemcitabine
14F49140,625ovaryIHCCcisplatin plus gemcitabine
15F66670,372noIHCCgemcitabine
16F6436,162noEHCCcisplatin plus gemcitabine, capecitabine
17M43952,544noEHCCcisplatin plus gemcitabine, irinotecan
18M516664noEHCCcisplatin plus gemcitabine, nivolumab
19F7098,606noEHCCcisplatin plus gemcitabine
20F7132,000noEHCCcisplatin plus gemcitabine
21F586750noGBCcisplatin plus gemcitabine, irinotecan
22M70126,000noGBCcisplatin plus gemcitabine
23M683179noGBCcisplatin plus gemcitabine
24F71137,312noGBCcisplatin plus gemcitabine
25F6098,000noGBCcapecitabine, cisplatin plus gemcitabine
The number represents the case ID. Estimated tumor volume (ETV) was calculated using the following formula: V (mm3) = w2 (mm2) × l (mm) ÷ 2. BTC: biliary tract cancer, IHCC: intrahepatic cholangiocarcinoma, EHCC: extrahepatic cholangiocarcinoma, GBC: gallbladder carcinoma.
Table 2. Immunohistochemical characteristics of the patient samples.
CasesGradingCK7CK8/18CK19CK20CA19.9HSAArginaseGlypicanPD-L1
1G2++++
2G2+++++
3G3++++
4G2++++
5G2++++
6G2+++
7G2++++
8G2+++++ *
9G2+++++
10G2++++
11G2+++++
12G3+++++
13G2+++
14G3+++++ *
15G2+++
16G1++++
17G3++++
18G2+++
19G2+++
20G2++++
21G2++++
22G2+++++
23G3+++++
24G3+++++
25G2++++
CK7: cytokeratin 7, CK8/18: cytokeratin 8/cytokeratin 18, CK19: cytokeratin 19, CK20: cytokeratin 20, CA19.9: cancer antigen 19-9, HSA: hepatocyte-specific antigen, PD-L1: programmed death-ligand 1. *: focal positivity.
Table 3. Detected single-nucleotide variants.
CasesGeneNucleotide ChangeAmino Acid ChangeVAF (%) TissueVAF (%) LBClinical Significance
2KRASc.407G>Ap.Ser136Asn5021.3pathogenic
IDH1c.395G>Tp.Arg132Leu2519.6pathogenic
PTENc.925G>Ap.Ala309Thr2015.2benign
FBXW7c.239C>Tp.Thr80Ile60likely pathogenic
IDH2c.332G>Ap.Gly111Asp4.60likely benign
CDH1c.596C>Tp.Thr199Ile4.30likely benign
3PIK3CAc.1634A>Cp.Glu545Ala33pathogenic
6FOXL2c.536C>Gp.Ala179Gly57.615.2benign
APCc.7504G>Ap.Gly2502Ser49.56.7likely pathogenic
PIK3CAc.1634A>Cp.Glu545Ala3.80pathogenic
7JAK3c.2164G>Ap.Val722Ile45.56.9benign
TP53c.518T>Cp.Val173Ala13.24.9pathogenic
KRASc.35G>Tp.Gly12Val12.83.6pathogenic
8TP53c.460G>Ap.Gly154Ser42.1pathogenic
9FGFR2c.827T>Gp.Phe276Cys376.3pathogenic
10IDH2c.515G>Tp.Arg172Met24.321.5pathogenic
11IDH2c.359G>Ap.Arg120Lys27.68.4pathogenic
12KDRc.1444T>Cp.Cys482ArgLow tumor cell ratio47.2pathogenic
STK11c.1189G>Ap.Ala397Thr46.3benign
13TP53c.536A>Gp.His179Arg62.65.6pathogenic
IDH2c.359G>Ap.Arg120Lys30.24.2pathogenic
14METc.2975C>Tp.Thr992Ile045.8pathogenic
15CSF1Rc.2916C>Gp.Cys972Trp07.9benign
RETc.1946C>Tp.Ser649Leu07.8likely pathogenic
FOXL2c.536C>Gp.Ala179Gly61.64.5benign
16TP53c.796G>Tp.Gly266Ter29.25.2pathogenic
18METc.1124A>Gp.Asn375Ser59.748.21pathogenic
HRASc.182A>Gp.Gln61Arg33.30pathogenic
PIK3CAc.40C>Ap.His14Asn7.20likely benign
PIK3CAc.1634A>Cp.Glu545Ala4.60pathogenic
20FOXL2c.536C>Gp.Ala179GlyLow tumor cell ratio67.5benign
PIK3CAc.1571G>Ap.Arg524Lys7.7pathogenic
21NRASc.104C>Tp.Thr35Ile8.32.6benign
22CDKN2Ac.442G>Ap.Ala148Thr57.852benign
EGFRc.2543C>Tp.Pro848Leu4139likely benign
23CDKN2Ac.442G>Ap.Ala148Thr4952.8benign
CDH1c.2474C>Tp.Pro825Leu4650.7pathogenic
HNF1Ac.862delGp.Pro291GlnfsTer515.25.14likely pathogenic
TP53c.325T>Gp.Phe109Val4.90pathogenic
PTENc.802G>Tp.Asp268Tyr4.60pathogenic
24STK11c.842delp.Pro281ArgfsTer66.30pathogenic
25MLH1c.1321G>Ap.Ala441Thr46.249.1pathogenic
TP53c.707_711delp.Tyr236LeufsTer212.13.4likely pathogenic
PIK3CAc.1571G>Ap.Arg524Lys11.35.3pathogenic
CTNNB1c.133T>Cp.Ser45Pro11.22.4pathogenic
KRASc.34G>Tp.Gly12Cys6.60pathogenic
FOXL2c.743T>Cp.Leu248Pro03.1likely pathogenic
NGS on samples originating from tissue biopsy and matched liquid biopsy was performed.
Publisher’s Note: MDPI stays neutral with regard to jurisdictional claims in published maps and institutional affiliations.

