Receptor-Tyrosine Kinase Inhibitor Ponatinib Inhibits Meningioma Growth In Vitro and In Vivo

 , , , ,
  , , and
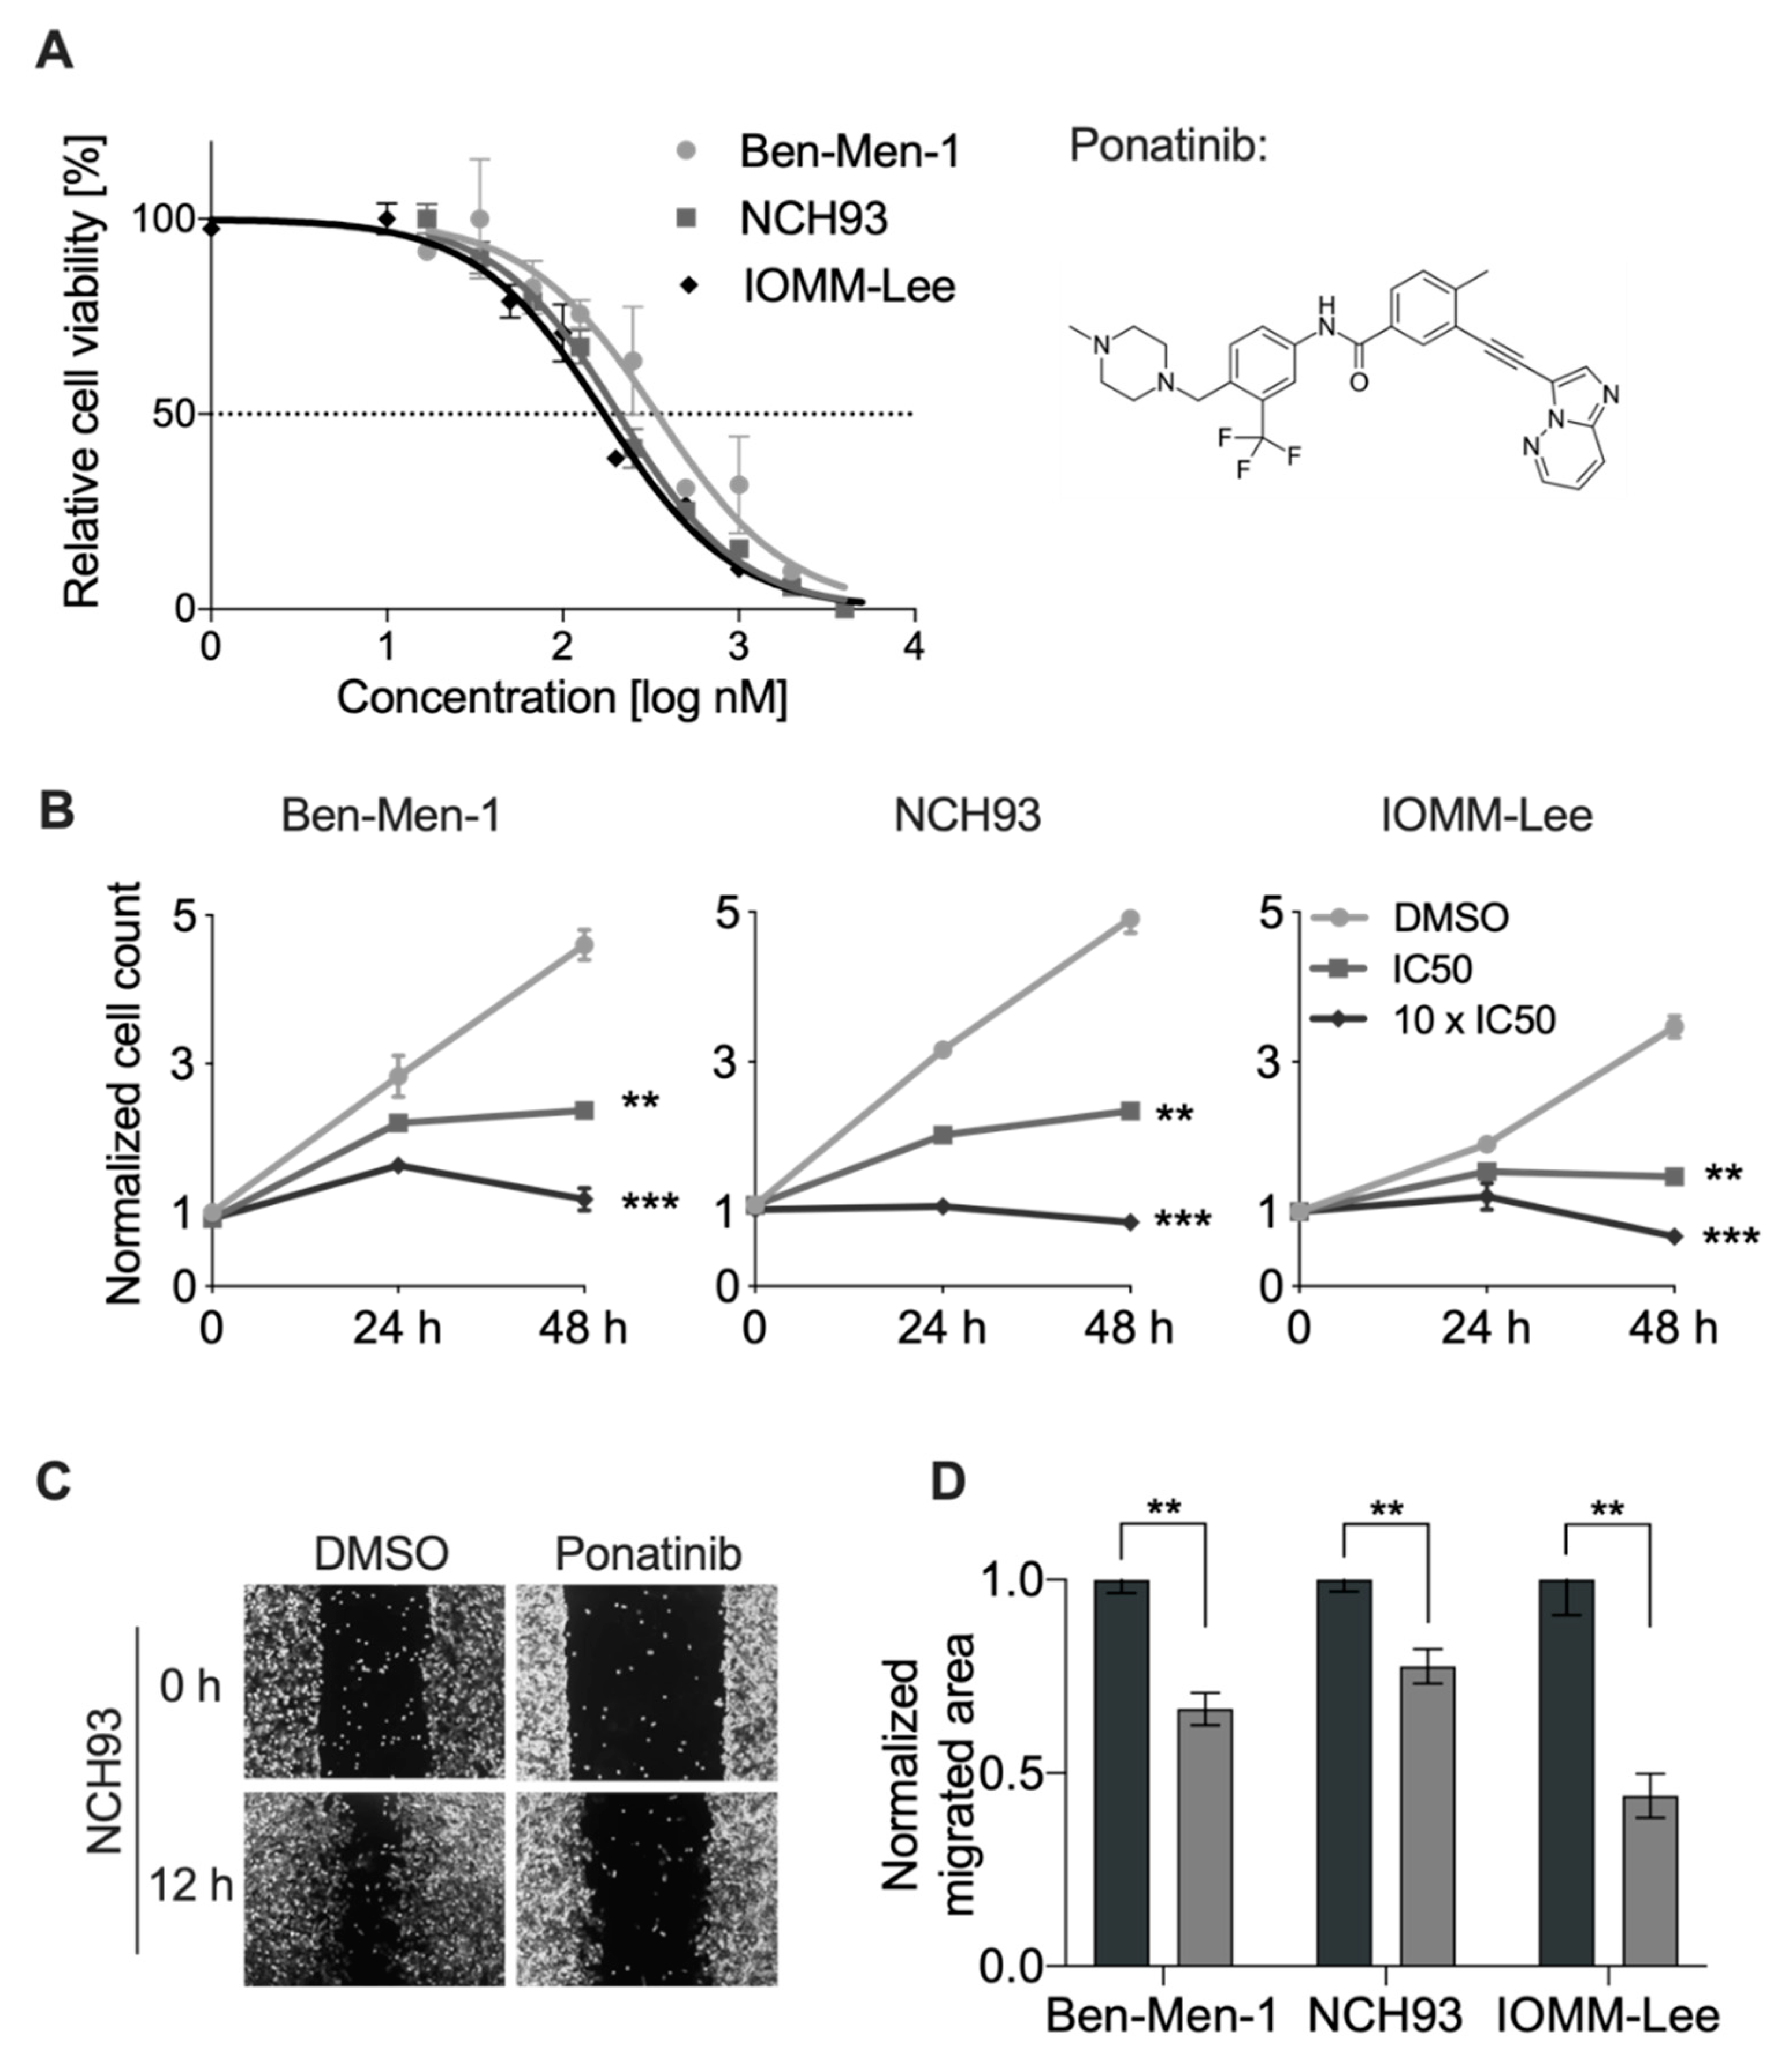
Abstract
:Simple Summary
Abstract
1. Introduction
2. Materials and Methods
2.1. Cell Culture
2.2. Crystal Violet Assay
2.3. Growth Curves
2.4. BrdU Assay
2.5. Wound Healing Assay
2.6. Cell Cycle Analysis
2.7. Apoptosis Assay
2.8. Meningioma Xenograft Experiments
2.9. Immunohistochemical Staining
2.10. Quantitative Real-Time PCR
2.11. Full-Length cDNA Nanopore Sequencing
2.12. Analysis of Mitochondrial Dysfunction
2.13. Statistical Analysis
3. Results
3.1. Ponatinib Decreased Viability and Proliferation of Meningioma Cells
3.2. Ponatinib Reduced Migration of Meningioma Cells
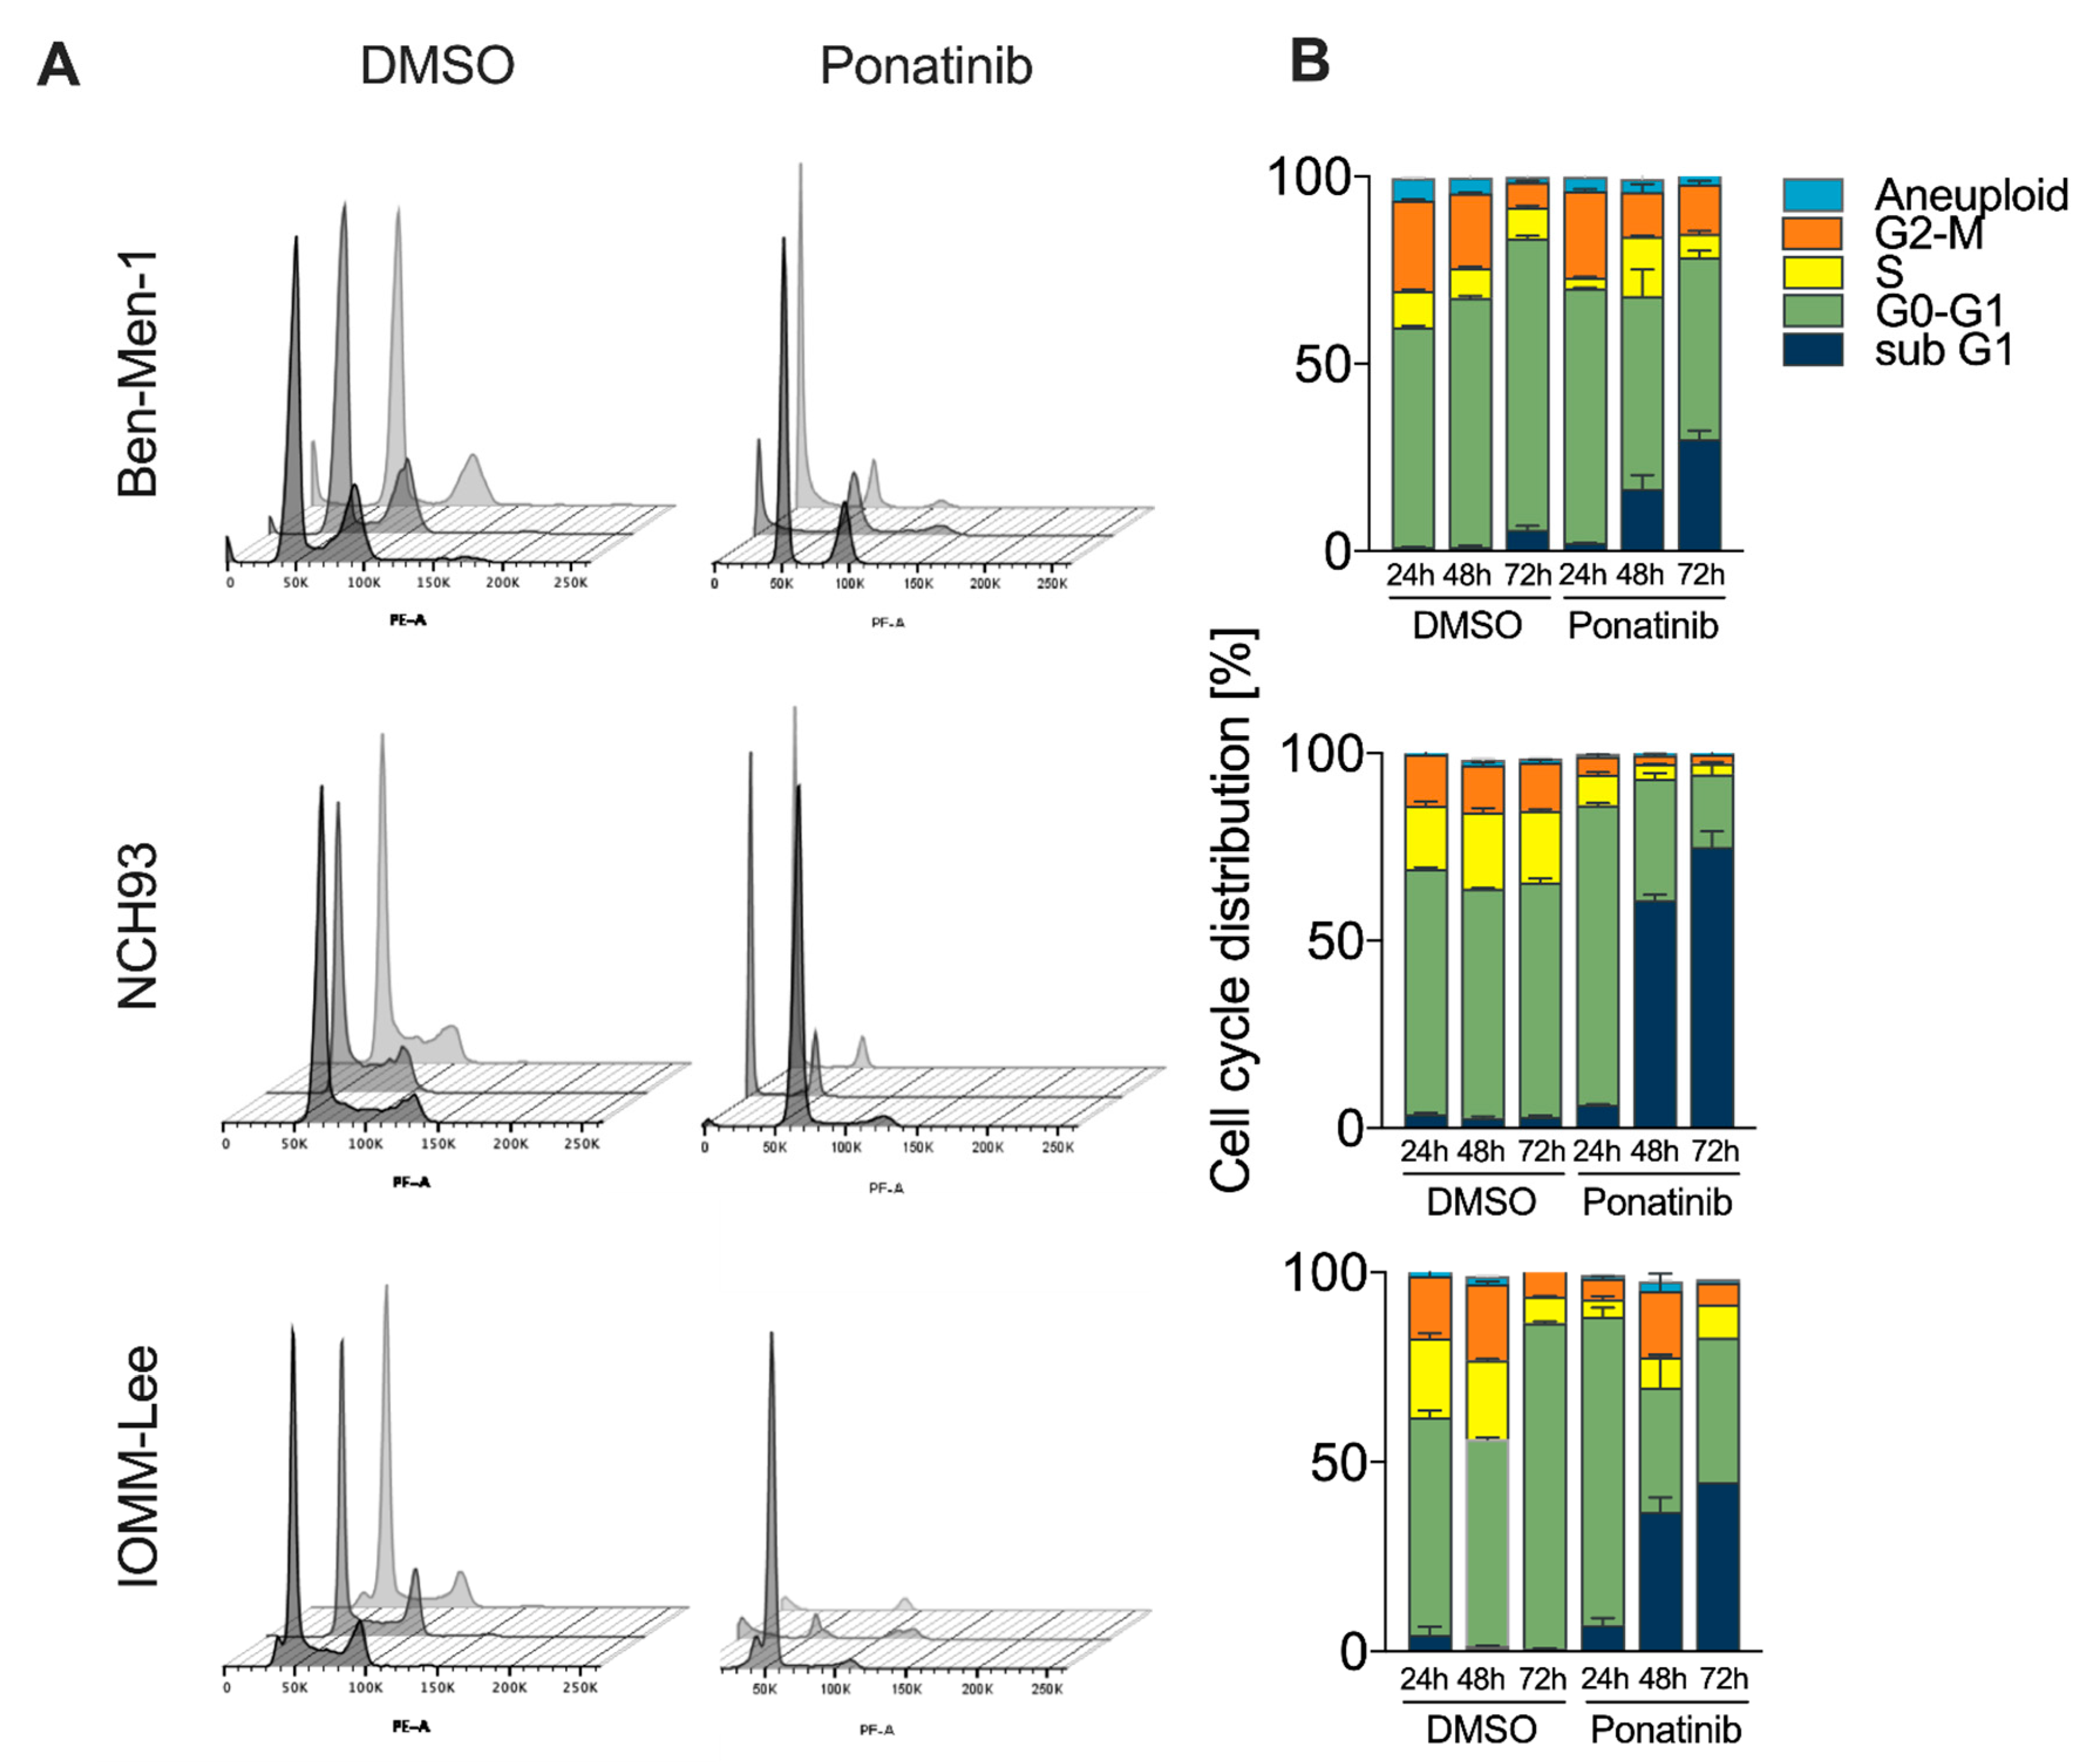
3.3. Accumulation of Cells in G0/G1 and subG1-Phase upon Treatment
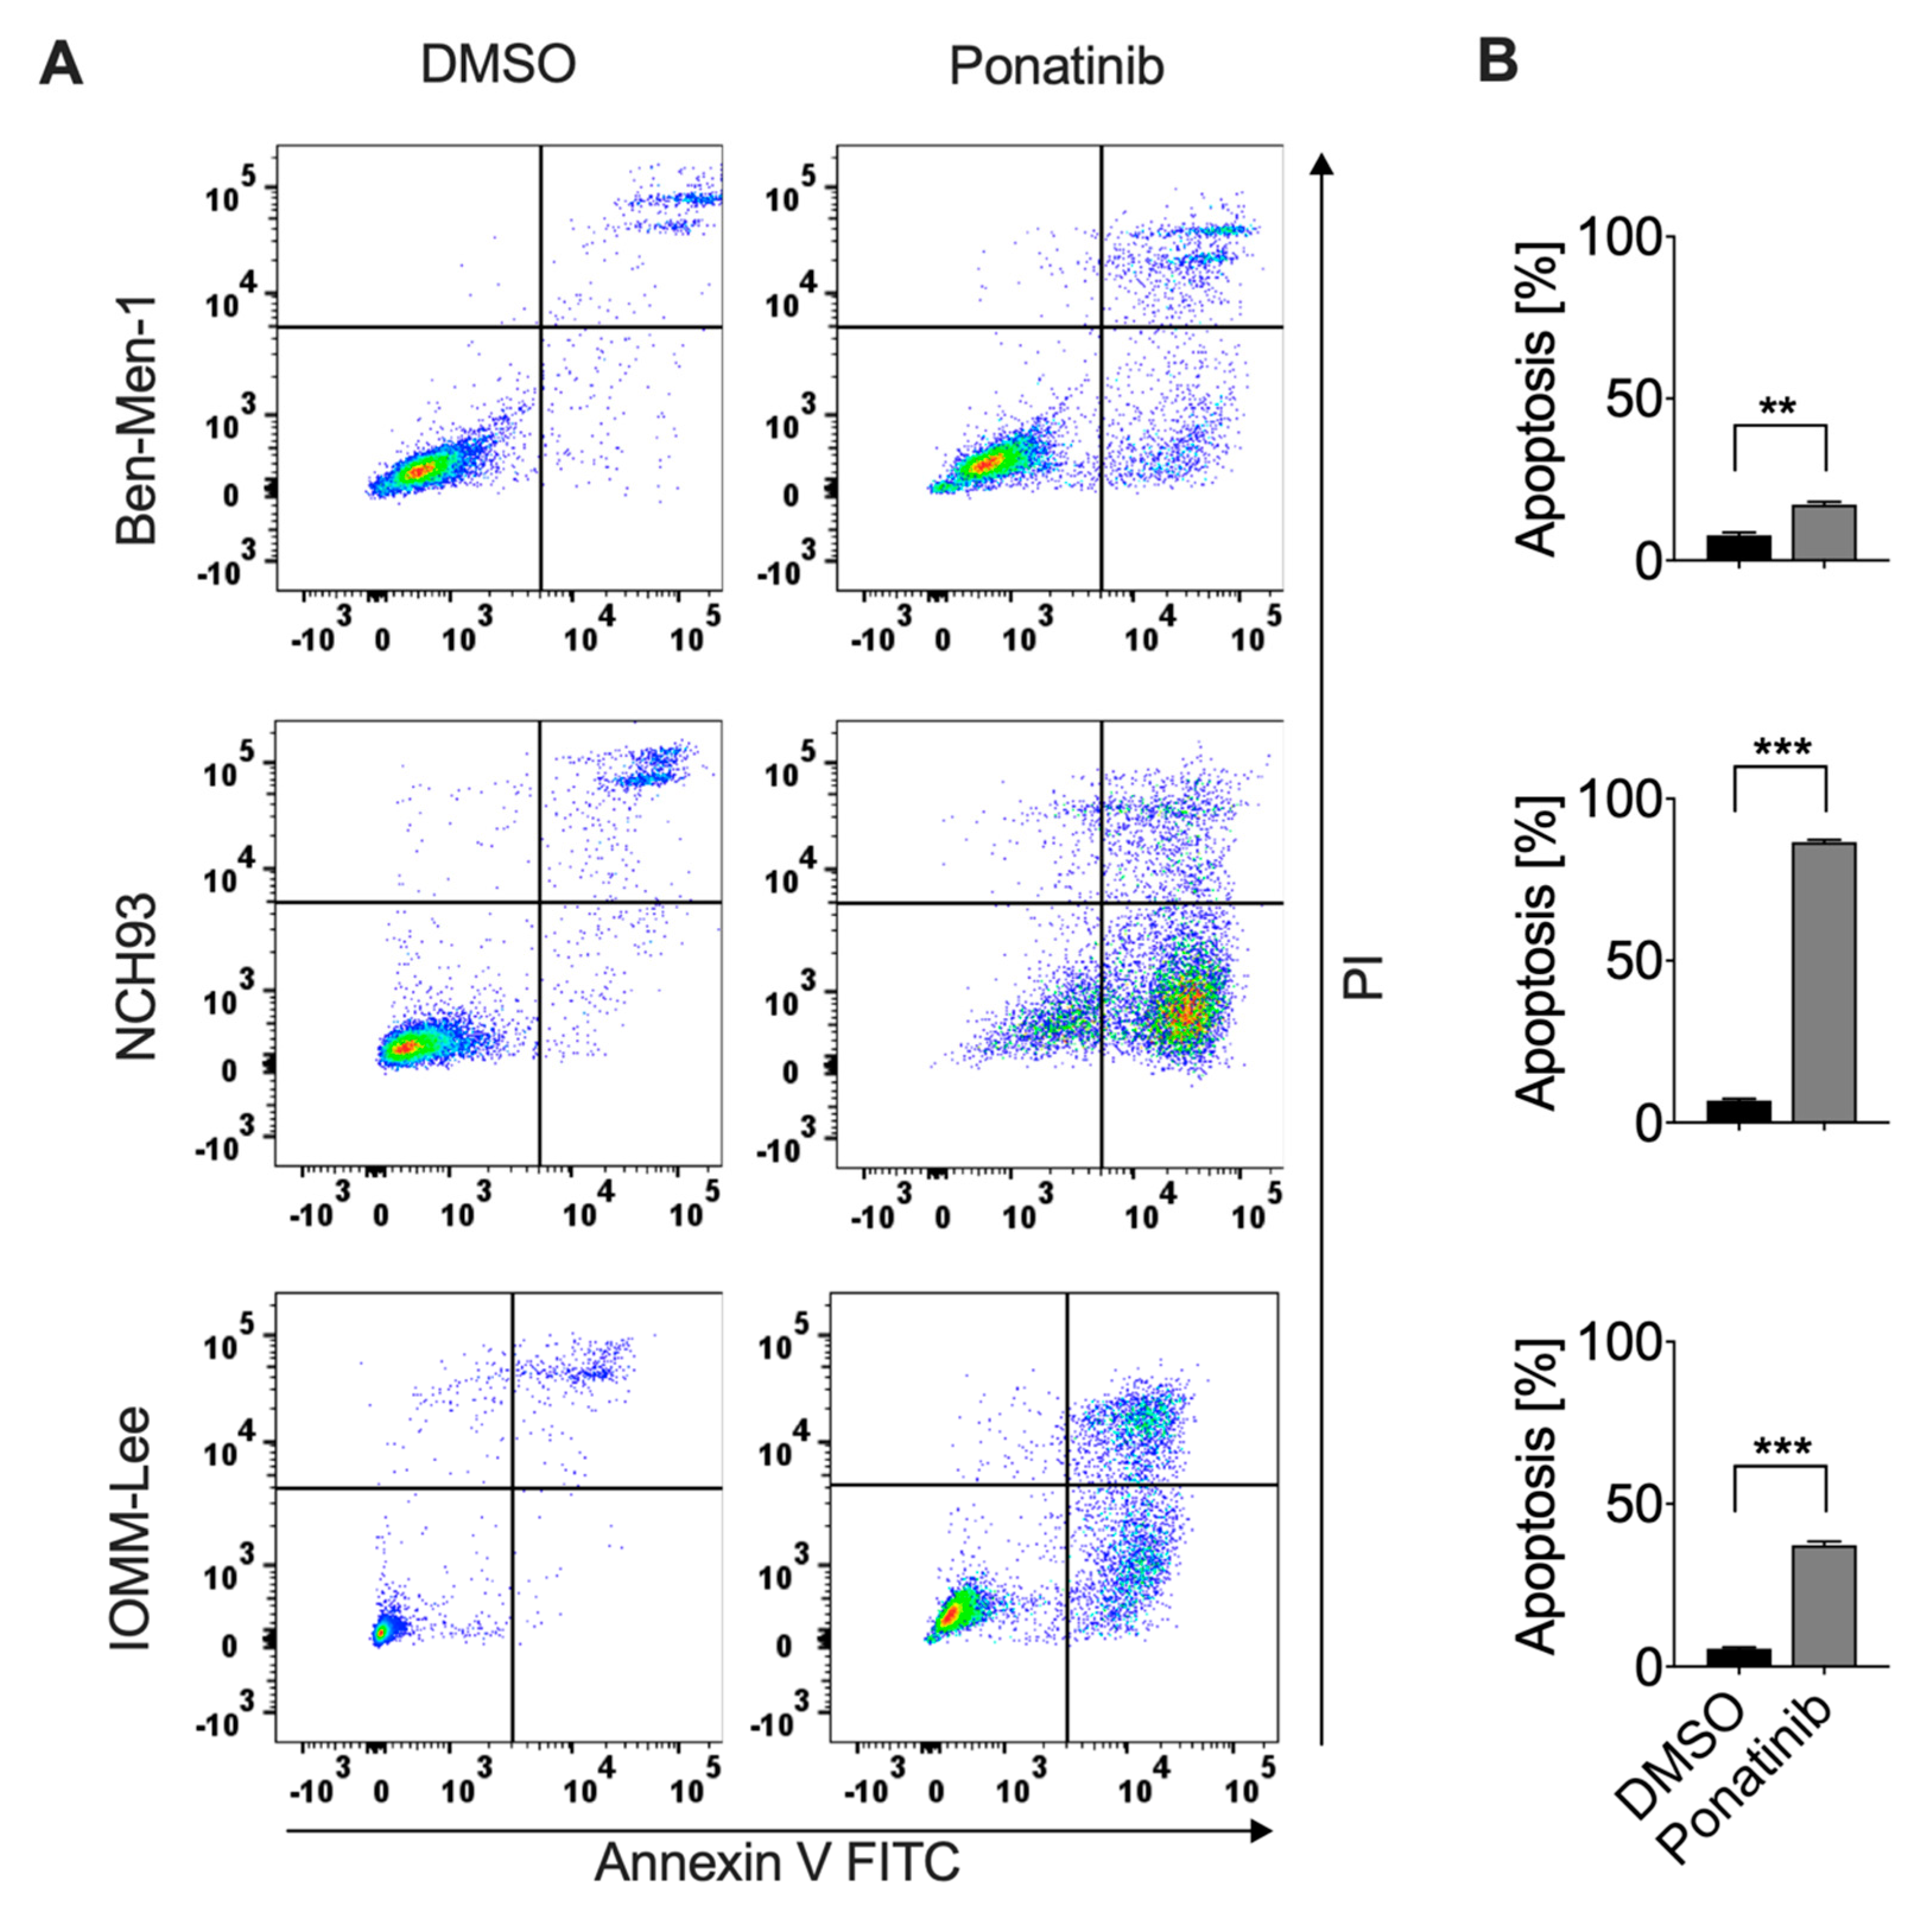
3.4. Ponatinib Effectively Induced Apoptosis of Meningioma Cells
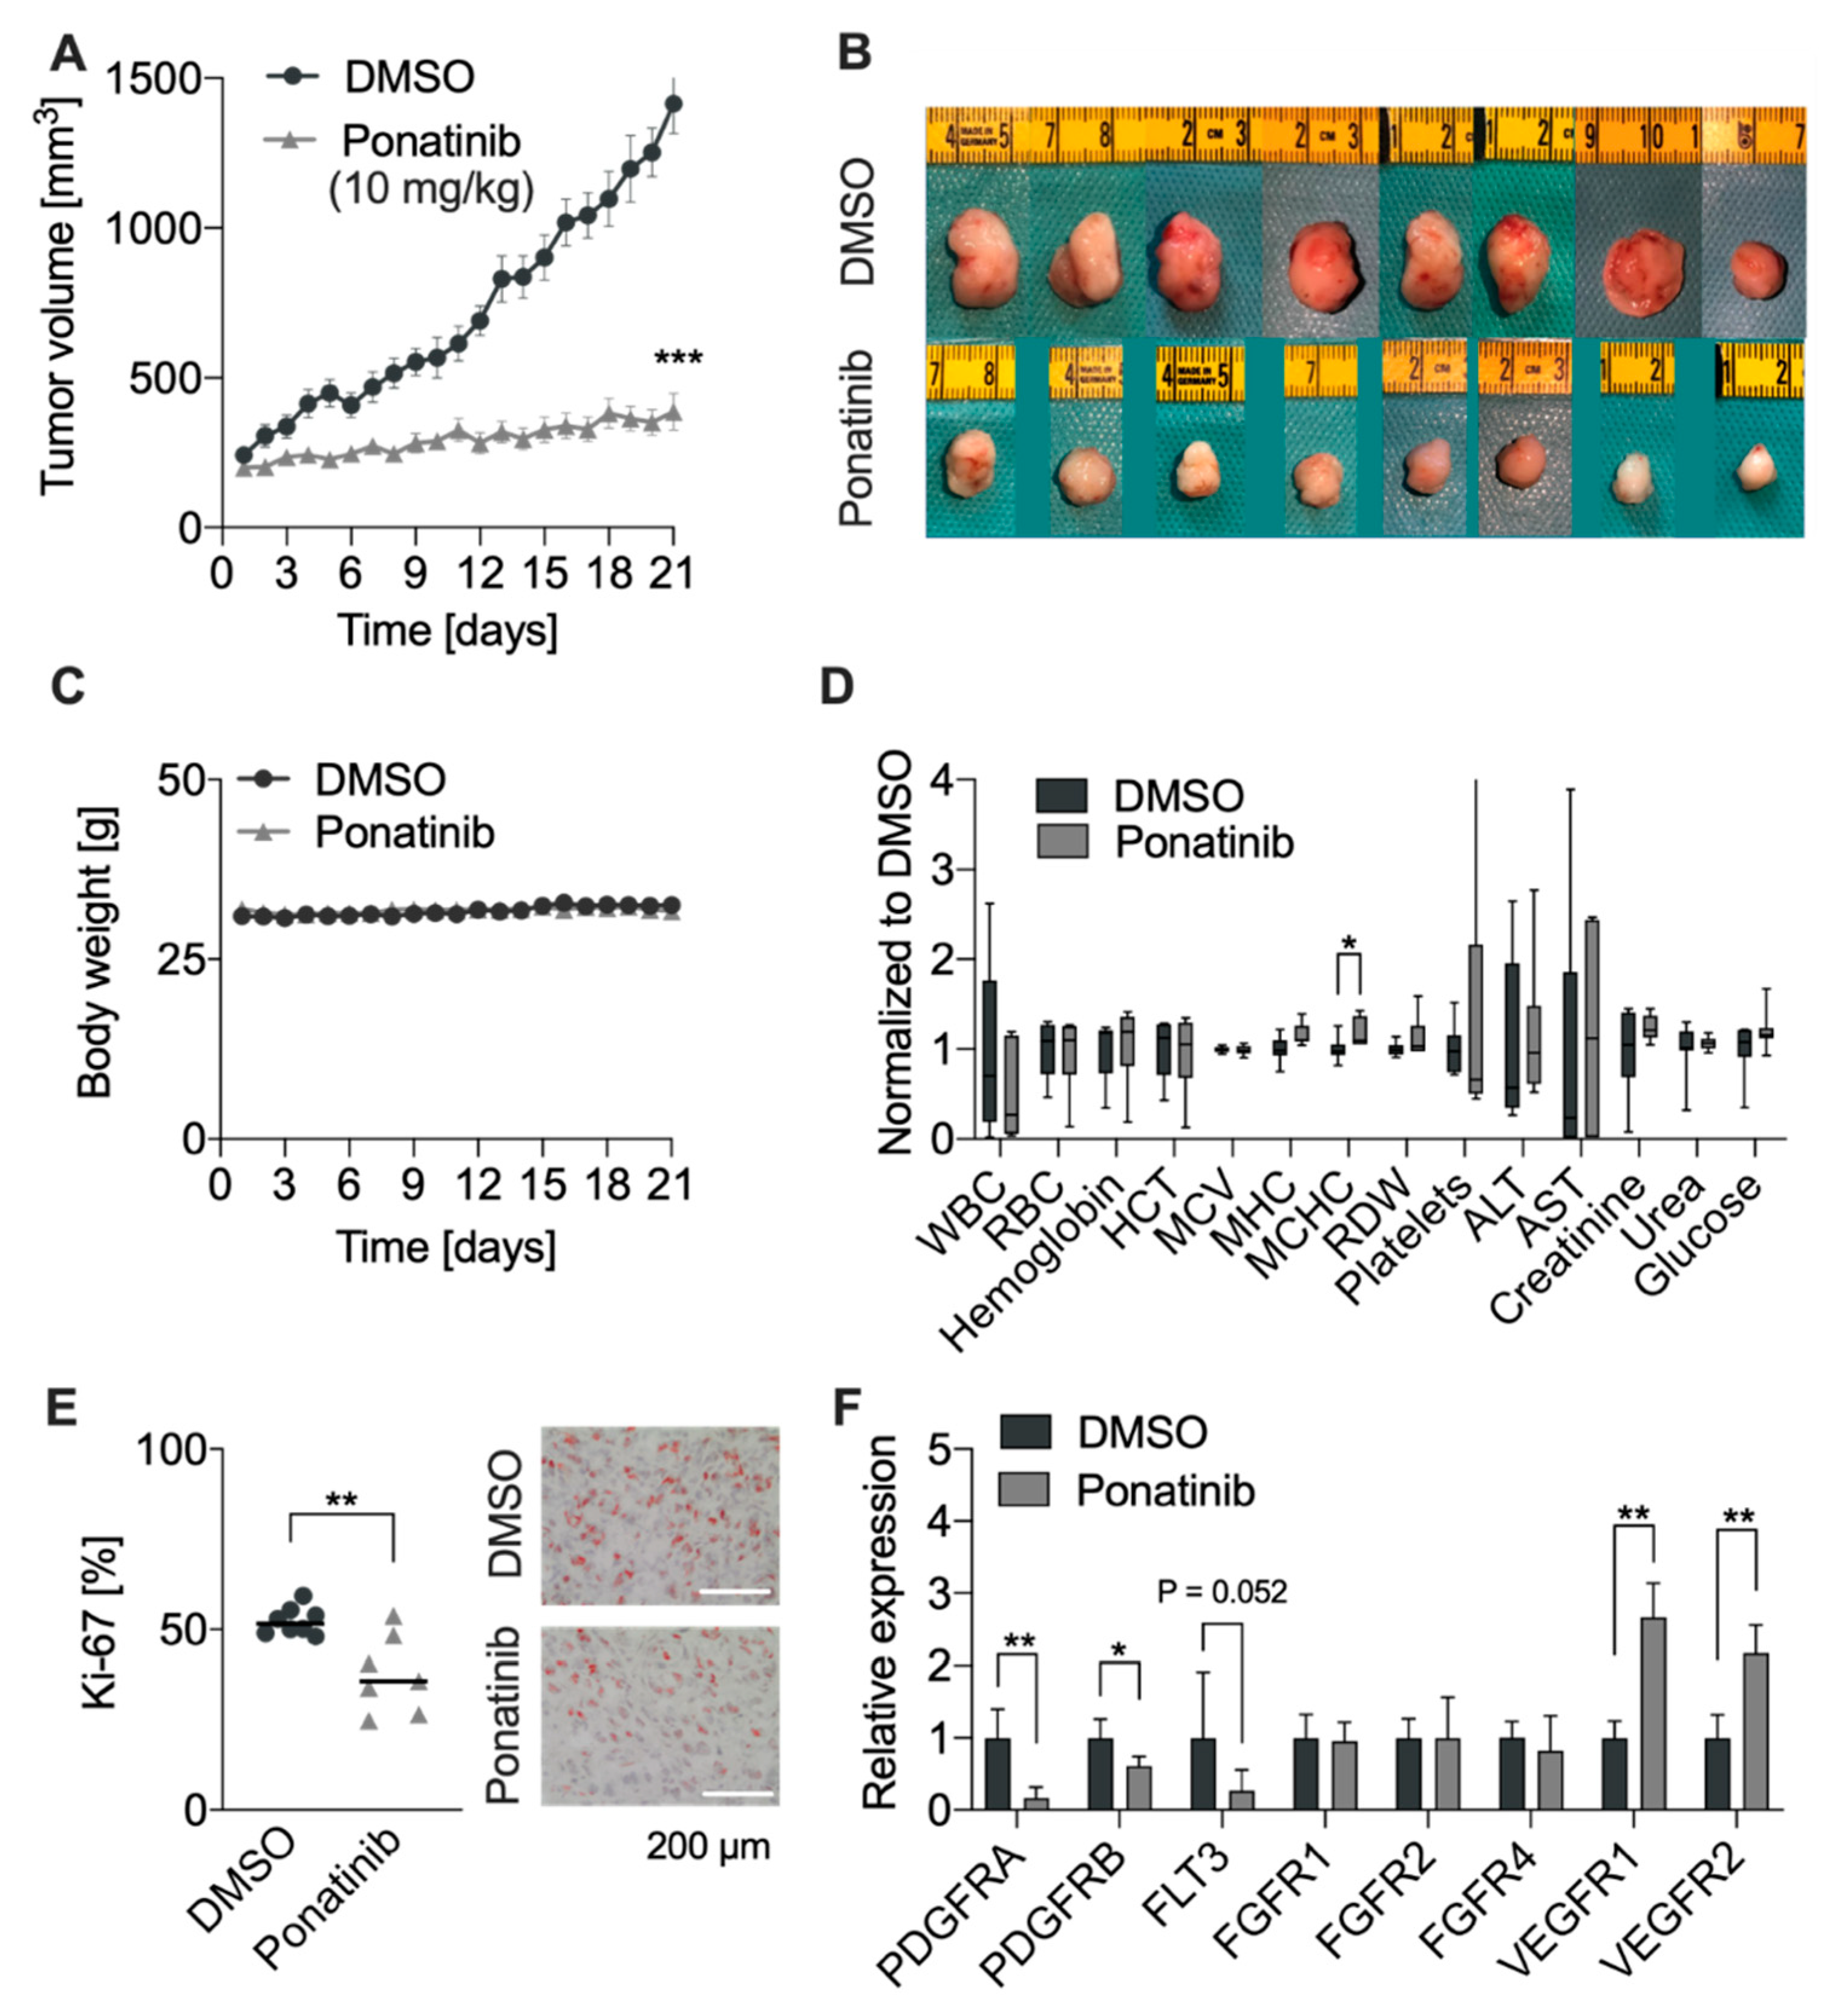
3.5. RTKi Ponatinib Blocks Tumor Growth In Vivo
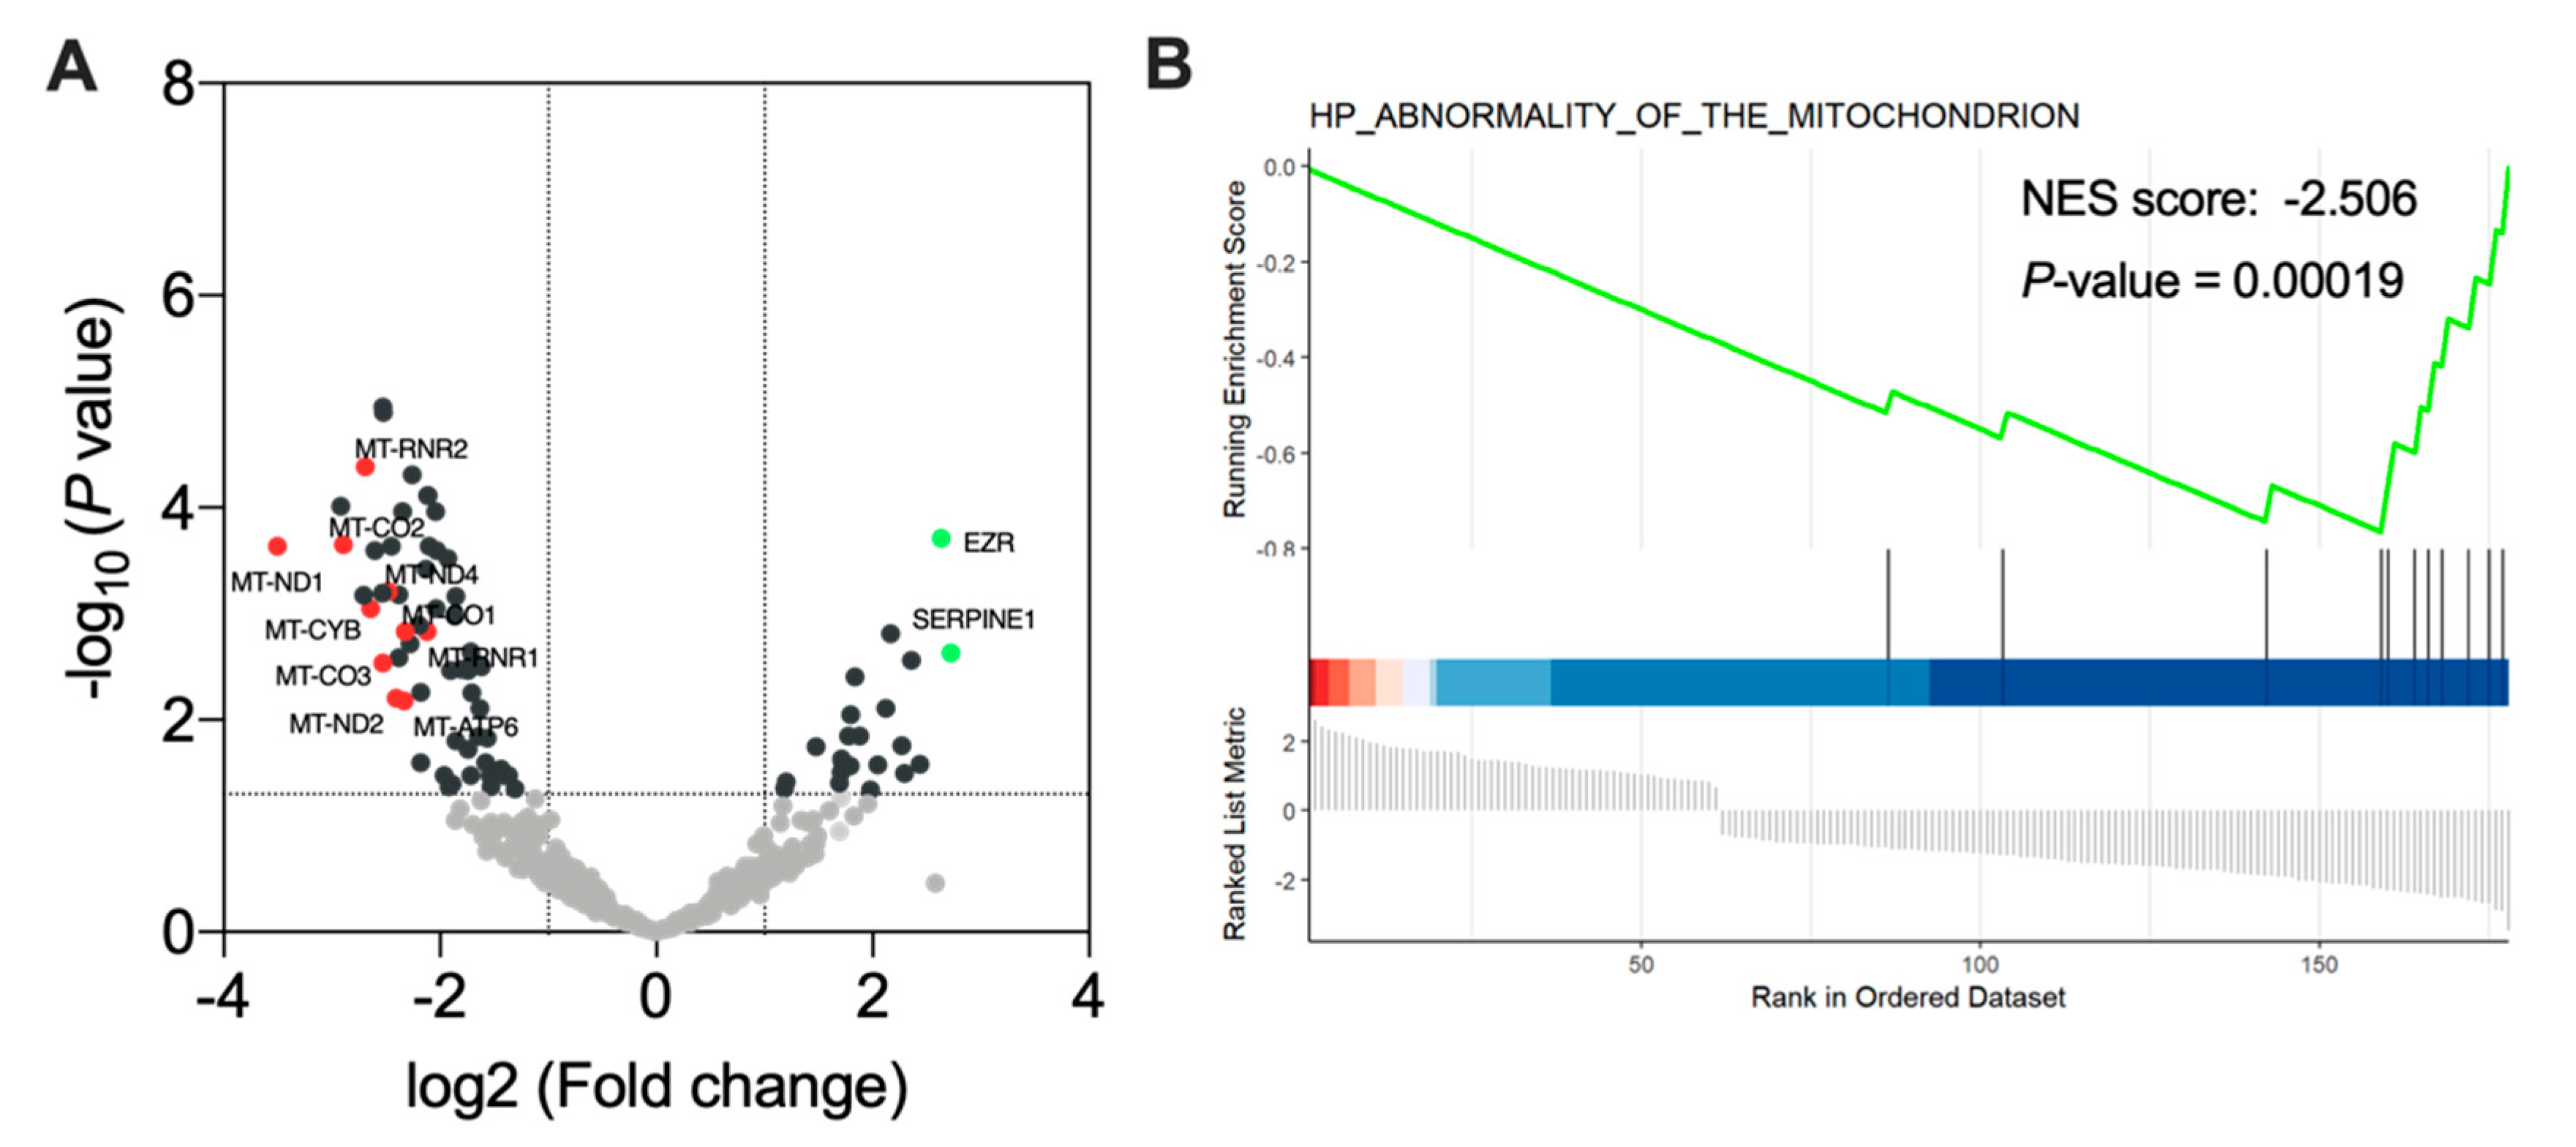
3.6. Ponatinib Treatment Induced Mitochondrial Dysfunction
4. Discussion
5. Conclusions
Supplementary Materials
Author Contributions
Funding
Institutional Review Board Statement
Informed Consent Statement
Data Availability Statement
Acknowledgments
Conflicts of Interest
References
- Ostrom, Q.T.; Patil, N.; Cioffi, G.; Waite, K.; Kruchko, C.; Barnholtz-Sloan, J.S. CBTRUS Statistical Report: Primary Brain and Other Central Nervous System Tumors Diagnosed in the United States in 2013–2017. Neuro-Oncology 2020, 22, iv1–iv96. [Google Scholar] [CrossRef]
- Holleczek, B.; Zampella, D.; Urbschat, S.; Sahm, F.; von Deimling, A.; Oertel, J.; Ketter, R. Incidence, Mortality and Outcome of Meningiomas: A Population-Based Study from Germany. Cancer Epidemiol. 2019, 62, 101562. [Google Scholar] [CrossRef] [PubMed]
- Fuentes, S.; Chinot, O.; Dufour, H.; Paz-Paredes, A.; Métellus, P.; Barrie-Attarian, M.; Grisoli, F. Hydroxyurea treatment for unresectable meningioma. Neurochirurgie 2004, 50, 461–467. [Google Scholar] [CrossRef]
- Scorsetti, M.; Alongi, F.; Clerici, E.; Navarria, P.; Simonelli, M.; Rognone, E.; Santoro, A. Temozolomide Combined with Radiotherapy in the Treatment of Recurrent Cranial Meningioma Previously Treated with Multiple Surgical Resections and Two Sessions of Radiosurgery: A Case Report and Literature Review. Tumori 2012, 98, e67–e71. [Google Scholar] [CrossRef]
- Clark, V.E.; Erson-Omay, E.Z.; Serin, A.; Yin, J.; Cotney, J.; Özduman, K.; Avşar, T.; Li, J.; Murray, P.B.; Henegariu, O.; et al. Genomic Analysis of Non-NF2 Meningiomas Reveals Mutations in TRAF7, KLF4, AKT1 and SMO. Science 2013, 339, 1077–1080. [Google Scholar] [CrossRef] [Green Version]
- Abedalthagafi, M.; Bi, W.L.; Aizer, A.A.; Merrill, P.H.; Brewster, R.; Agarwalla, P.K.; Listewnik, M.L.; Dias-Santagata, D.; Thorner, A.R.; Van Hummelen, P.; et al. Oncogenic PI3K Mutations are as Common as AKT1 and SMO Mutations in Meningioma. Neuro-Oncology 2016, 18, 649–655. [Google Scholar] [CrossRef] [PubMed] [Green Version]
- Hadfield, K.D.; Newman, W.G.; Bowers, N.L.; Wallace, A.; Bolger, C.; Colley, A.; McCann, E.; Trump, D.; Prescott, T.; Evans, D.G.R. Molecular Characterisation of SMARCB1 and NF2 in Familial and Sporadic Schwannomatosis. J. Med. Genet. 2008, 45, 332–339. [Google Scholar] [CrossRef]
- Shankar, G.M.; Abedalthagafi, M.; Vaubel, R.A.; Merrill, P.H.; Nayyar, N.; Gill, C.M.; Brewster, R.; Bi, W.L.; Agarwalla, P.K.; Thorner, A.R.; et al. Germline and Somatic BAP1 Mutations in High-Grade Rhabdoid Meningiomas. Neuro-Oncology 2017, 19, 535–545. [Google Scholar] [CrossRef] [Green Version]
- Goutagny, S.; Nault, J.C.; Mallet, M.; Henin, D.; Rossi, J.Z.; Kalamarides, M. High Incidence of Activating TERT Promoter Mutations in Meningiomas Undergoing Malignant Progression. Brain Pathol. Zurich Switz. 2014, 24, 184–189. [Google Scholar] [CrossRef]
- Mawrin, C.; Sasse, T.; Kirches, E.; Kropf, S.; Schneider, T.; Grimm, C.; Pambor, C.; Vorwerk, C.K.; Firsching, R.; Lendeckel, U.; et al. Different Activation of Mitogen-Activated Protein Kinase and Akt Signaling is Associated with Aggressive Phenotype of Human Meningiomas. Clin. Cancer Res. 2005, 11, 4074–4082. [Google Scholar] [CrossRef] [Green Version]
- El-Habr, E.A.; Levidou, G.; Trigka, E.-A.; Sakalidou, J.; Piperi, C.; Chatziandreou, I.; Spyropoulou, A.; Soldatos, R.; Tomara, G.; Petraki, K.; et al. Complex Interactions between the Components of the PI3K/AKT/MTOR Pathway, and with Components of MAPK, JAK/STAT and Notch-1 Pathways, Indicate Their Involvement in Meningioma Development. Virchows Arch. 2014, 465, 473–485. [Google Scholar] [CrossRef]
- Johnson, M.D.; Reeder, J.E.; O’Connell, M. MKP-3 Regulates PDGF-BB Effects and MAPK Activation in Meningioma Cells. J. Clin. Neurosci. 2015, 22, 752–757. [Google Scholar] [CrossRef]
- Johnson, M.; Toms, S. Mitogenic Signal Transduction Pathways in Meningiomas: Novel Targets for Meningioma Chemotherapy? J. Neuropathol. Exp. Neurol. 2005, 64, 1029–1036. [Google Scholar] [CrossRef] [PubMed] [Green Version]
- Nakada, S.; Sasagawa, Y.; Tachibana, O.; Iizuka, H.; Kurose, N.; Shioya, A.; Guo, X.; Yamada, S.; Nojima, T. The Clinicopathological Analysis of Receptor Tyrosine Kinases in Meningiomas: The Expression of VEGFR-2 in Meningioma was Associated with a Higher WHO Grade and Shorter Progression-Free Survival. Brain Tumor Pathol. 2019, 36, 7–13. [Google Scholar] [CrossRef] [PubMed]
- Figarella-Branger, D.; Vagner-Capodano, A.M.; Bouillot, P.; Graziani, N.; Gambarelli, D.; Devictor, B.; Zattara-Cannoni, H.; Bianco, N.; Grisoli, F.; Pellissier, J.F. Platelet-Derived Growth Factor (PDGF) and Receptor (PDGFR) Expression in Human Meningiomas: Correlations with Clinicopathological Features and Cytogenetic Analysis. Neuropathol. Appl. Neurobiol. 1994, 20, 439–447. [Google Scholar] [CrossRef] [PubMed]
- Caltabiano, R.; Barbagallo, G.M.V.; Castaing, M.; Cassenti, A.; Senetta, R.; Cassoni, P.; Albanese, V.; Lanzafame, S. Prognostic Value of EGFR Expression in de Novo and Progressed Atypical and Anaplastic Meningiomas: An Immunohistochemical and Fluorescence in situ Hybridization Pilot Study. J. Neurosurg. Sci. 2013, 57, 139–151. [Google Scholar]
- Sharma, P.; Katiyar, V.; Sharma, R.; Gurjar, H.K.; Krishnan, S. Letter: Role of Tyrosine Kinase Inhibitors in Recurrent Meningiomas: Controversies and Promises. Neurosurgery 2018, 82, E181–E183. [Google Scholar] [CrossRef] [Green Version]
- Wen, P.Y.; Yung, W.K.A.; Lamborn, K.R.; Norden, A.D.; Cloughesy, T.F.; Abrey, L.E.; Fine, H.A.; Chang, S.M.; Robins, H.I.; Fink, K.; et al. Phase II Study of Imatinib Mesylate for Recurrent Meningiomas (North American Brain Tumor Consortium Study 01–08). Neuro-Oncology 2009, 11, 853–860. [Google Scholar] [CrossRef] [Green Version]
- Tuchen, M.; Wilisch-Neumann, A.; Daniel, E.A.; Baldauf, L.; Pachow, D.; Scholz, J.; Angenstein, F.; Stork, O.; Kirches, E.; Mawrin, C. Receptor Tyrosine Kinase Inhibition by Regorafenib/Sorafenib Inhibits Growth and Invasion of Meningioma Cells. Eur. J. Cancer 2017, 73, 9–21. [Google Scholar] [CrossRef]
- Norden, A.D.; Raizer, J.J.; Abrey, L.E.; Lamborn, K.R.; Lassman, A.B.; Chang, S.M.; Yung, W.K.A.; Gilbert, M.R.; Fine, H.A.; Mehta, M.; et al. Phase II Trials of Erlotinib or Gefitinib in Patients with Recurrent Meningioma. J. Neurooncol. 2010, 96, 211–217. [Google Scholar] [CrossRef] [Green Version]
- Alexander, P.B.; Wang, X.-F. Resistance to Receptor Tyrosine Kinase Inhibition in Cancer: Molecular Mechanisms and Therapeutic Strategies. Front. Med. 2015, 9, 134–138. [Google Scholar] [CrossRef] [Green Version]
- Andrae, N.; Kirches, E.; Hartig, R.; Haase, D.; Keilhoff, G.; Kalinski, T.; Mawrin, C. Sunitinib Targets PDGF-Receptor and Flt3 and Reduces Survival and Migration of Human Meningioma Cells. Eur. J. Cancer 2012, 48, 1831–1841. [Google Scholar] [CrossRef] [PubMed]
- Kaley, T.J.; Wen, P.; Schiff, D.; Ligon, K.; Haidar, S.; Karimi, S.; Lassman, A.B.; Nolan, C.P.; DeAngelis, L.M.; Gavrilovic, I.; et al. Phase II Trial of Sunitinib for Recurrent and Progressive Atypical and Anaplastic Meningioma. Neuro-Oncology 2015, 17, 116–121. [Google Scholar] [CrossRef] [PubMed] [Green Version]
- Tabish, T.A.; Narayan, R.J. Mitochondria-Targeted Graphene for Advanced Cancer Therapeutics. Acta Biomater. 2021, 129, 43–56. [Google Scholar] [CrossRef] [PubMed]
- Paech, F.; Mingard, C.; Grünig, D.; Abegg, V.F.; Bouitbir, J.; Krähenbühl, S. Mechanisms of Mitochondrial Toxicity of the Kinase Inhibitors Ponatinib, Regorafenib and Sorafenib in Human Hepatic HepG2 Cells. Toxicology 2018, 395, 34–44. [Google Scholar] [CrossRef]
- Rodríguez-Hernández, M.A.; de la Cruz-Ojeda, P.; López-Grueso, M.J.; Navarro-Villarán, E.; Requejo-Aguilar, R.; Castejón-Vega, B.; Negrete, M.; Gallego, P.; Vega-Ochoa, Á.; Victor, V.M.; et al. Integrated Molecular Signaling Involving Mitochondrial Dysfunction and Alteration of Cell Metabolism Induced by Tyrosine Kinase Inhibitors in Cancer. Redox Biol. 2020, 36, 101510. [Google Scholar] [CrossRef] [PubMed]
- Rimola, J.; Díaz-González, Á.; Darnell, A.; Varela, M.; Pons, F.; Hernandez-Guerra, M.; Delgado, M.; Castroagudin, J.; Matilla, A.; Sangro, B.; et al. Complete Response under Sorafenib in Patients with Hepatocellular Carcinoma: Relationship with Dermatologic Adverse Events. Hepatology 2018, 67, 612–622. [Google Scholar] [CrossRef] [PubMed] [Green Version]
- Tan, F.H.; Putoczki, T.L.; Stylli, S.S.; Luwor, R.B. Ponatinib: A Novel Multi-Tyrosine Kinase Inhibitor against Human Malignancies. OncoTargets Ther. 2019, 12, 635–645. [Google Scholar] [CrossRef] [Green Version]
- Ren, M.; Hong, M.; Liu, G.; Wang, H.; Patel, V.; Biddinger, P.; Silva, J.; Cowell, J.; Hao, Z. Novel FGFR Inhibitor Ponatinib Suppresses the Growth of Non-Small Cell Lung Cancer Cells Overexpressing FGFR1. Oncol. Rep. 2013, 29, 2181–2190. [Google Scholar] [CrossRef] [Green Version]
- Mologni, L.; Redaelli, S.; Morandi, A.; Plaza-Menacho, I.; Gambacorti-Passerini, C. Ponatinib is a Potent Inhibitor of Wild-Type and Drug-Resistant Gatekeeper Mutant RET Kinase. Mol. Cell. Endocrinol. 2013, 377, 1–6. [Google Scholar] [CrossRef]
- Han, Y.; Gu, Z.; Wu, J.; Huang, X.; Zhou, R.; Shi, C.; Tao, W.; Wang, L.; Wang, Y.; Zhou, G.; et al. Repurposing Ponatinib as a Potent Agent against KIT Mutant Melanomas. Theranostics 2019, 9, 1952–1964. [Google Scholar] [CrossRef] [PubMed]
- Gozgit, J.M.; Wong, M.J.; Wardwell, S.; Tyner, J.W.; Loriaux, M.M.; Mohemmad, Q.K.; Narasimhan, N.I.; Shakespeare, W.C.; Wang, F.; Druker, B.J.; et al. Potent Activity of Ponatinib (AP24534) in Models of FLT3-Driven Acute Myeloid Leukemia and Other Hematologic Malignancies. Mol. Cancer Ther. 2011, 10, 1028–1035. [Google Scholar] [CrossRef] [PubMed] [Green Version]
- De Falco, V.; Buonocore, P.; Muthu, M.; Torregrossa, L.; Basolo, F.; Billaud, M.; Gozgit, J.M.; Carlomagno, F.; Santoro, M. Ponatinib (AP24534) is a Novel Potent Inhibitor of Oncogenic RET Mutants Associated with Thyroid Cancer. J. Clin. Endocrinol. Metab. 2013, 98, E811–E819. [Google Scholar] [CrossRef]
- Li, S.Q.; Cheuk, A.T.; Shern, J.F.; Song, Y.K.; Hurd, L.; Liao, H.; Wei, J.S.; Khan, J. Targeting Wild-Type and Mutationally Activated FGFR4 in Rhabdomyosarcoma with the Inhibitor Ponatinib (AP24534). PLoS ONE 2013, 8, e76551. [Google Scholar] [CrossRef] [PubMed] [Green Version]
- Garner, A.P.; Gozgit, J.M.; Anjum, R.; Vodala, S.; Schrock, A.; Zhou, T.; Serrano, C.; Eilers, G.; Zhu, M.; Ketzer, J.; et al. Ponatinib Inhibits Polyclonal Drug-Resistant KIT Oncoproteins and Shows Therapeutic Potential in Heavily Pretreated Gastrointestinal Stromal Tumor (GIST) Patients. Clin. Cancer Res. Off. J. Am. Assoc. Cancer Res. 2014, 20, 5745–5755. [Google Scholar] [CrossRef] [PubMed] [Green Version]
- Zhang, J.; Zhou, Q.; Gao, G.; Wang, Y.; Fang, Z.; Li, G.; Yu, M.; Kong, L.; Xing, Y.; Gao, X. The Effects of Ponatinib, a Multi-Targeted Tyrosine Kinase Inhibitor, against Human U87 Malignant Glioblastoma Cells. OncoTargets Ther. 2014, 7, 2013–2019. [Google Scholar] [CrossRef] [Green Version]
- Gozgit, J.M.; Squillace, R.M.; Wongchenko, M.J.; Miller, D.; Wardwell, S.; Mohemmad, Q.; Narasimhan, N.I.; Wang, F.; Clackson, T.; Rivera, V.M. Combined Targeting of FGFR2 and MTOR by Ponatinib and Ridaforolimus Results in Synergistic Antitumor Activity in FGFR2 Mutant Endometrial Cancer Models. Cancer Chemother. Pharmacol. 2013, 71, 1315–1323. [Google Scholar] [CrossRef]
- Faustino-Rocha, A.; Oliveira, P.A.; Pinho-Oliveira, J.; Teixeira-Guedes, C.; Soares-Maia, R.; da Costa, R.G.; Colaço, B.; Pires, M.J.; Colaço, J.; Ferreira, R.; et al. Estimation of Rat Mammary Tumor Volume Using Caliper and Ultrasonography Measurements. Lab Anim. 2013, 42, 217–224. [Google Scholar] [CrossRef]
- Subramanian, A.; Tamayo, P.; Mootha, V.K.; Mukherjee, S.; Ebert, B.L.; Gillette, M.A.; Paulovich, A.; Pomeroy, S.L.; Golub, T.R.; Lander, E.S.; et al. Gene Set Enrichment Analysis: A Knowledge-Based Approach for Interpreting Genome-Wide Expression Profiles. Proc. Natl. Acad. Sci. USA 2005, 102, 15545–15550. [Google Scholar] [CrossRef] [Green Version]
- Jungwirth, G.; Yu, T.; Moustafa, M.; Rapp, C.; Warta, R.; Jungk, C.; Sahm, F.; Dettling, S.; Zweckberger, K.; Lamszus, K.; et al. Identification of KIF11 as a Novel Target in Meningioma. Cancers 2019, 11, 545. [Google Scholar] [CrossRef] [Green Version]
- Jungwirth, G.; Yu, T.; Cao, J.; Eddine, M.A.; Moustafa, M.; Warta, R.; Debus, J.; Unterberg, A.; Abdollahi, A.; Herold-Mende, C. KIF11 Inhibitors Filanesib and Ispinesib Inhibit Meningioma Growth in vitro and in vivo. Cancer Lett. 2021, 506, 1–10. [Google Scholar] [CrossRef]
- Abril, J.; de Heredia, M.L.; González, L.; Clèries, R.; Nadal, M.; Condom, E.; Aguiló, F.; Gómez-Zaera, M.; Nunes, V. Altered Expression of 12S/MT-RNR1, MT-CO2/COX2, and MT-ATP6 Mitochondrial Genes in Prostate Cancer. Prostate 2008, 68, 1086–1096. [Google Scholar] [CrossRef]
- Mastrorocco, A.; Ciani, E.; Nicassio, L.; Roelen, B.A.J.; Minervini, F.; Dell’Aquila, M.E. Beauvericin Alters the Expression of Genes Coding for Key Proteins of the Mitochondrial Chain in Ovine Cumulus-Oocyte Complexes. Mycotoxin Res. 2021, 37, 1–9. [Google Scholar] [CrossRef] [PubMed]
- Whittle, S.B.; Patel, K.; Zhang, L.; Woodfield, S.E.; Du, M.; Smith, V.; Zage, P.E. The Novel Kinase Inhibitor Ponatinib is an Effective Anti-Angiogenic Agent against Neuroblastoma. Investig. New Drugs 2016, 34, 685–692. [Google Scholar] [CrossRef]
- O’Hare, T.; Shakespeare, W.C.; Zhu, X.; Eide, C.A.; Rivera, V.M.; Wang, F.; Adrian, L.T.; Zhou, T.; Huang, W.-S.; Xu, Q.; et al. AP24534, a Pan-BCR-ABL Inhibitor for Chronic Myeloid Leukemia, Potently Inhibits the T315I Mutant and Overcomes Mutation-Based Resistance. Cancer Cell 2009, 16, 401–412. [Google Scholar] [CrossRef] [PubMed] [Green Version]
- Petrilli, A.M.; Garcia, J.; Bott, M.; Plati, S.K.; Dinh, C.T.; Bracho, O.R.; Yan, D.; Zou, B.; Mittal, R.; Telischi, F.F.; et al. Ponatinib Promotes a G1 Cell-Cycle Arrest of Merlin/NF2-Deficient Human Schwann Cells. Oncotarget 2017, 8, 31666–31681. [Google Scholar] [CrossRef] [PubMed]
- Liu, C.; Mu, X.; Wang, X.; Zhang, C.; Zhang, L.; Yu, B.; Sun, G. Ponatinib Inhibits Proliferation and Induces Apoptosis of Liver Cancer Cells, but Its Efficacy is Compromised by Its Activation on PDK1/Akt/MTOR Signaling. Molecules 2019, 24, 1363. [Google Scholar] [CrossRef] [Green Version]
- Nair, A.B.; Jacob, S. A Simple Practice Guide for dose Conversion between Animals and Human. J. Basic Clin. Pharm. 2016, 7, 27–31. [Google Scholar] [CrossRef] [Green Version]
- Gozgit, J.M.; Wong, M.J.; Moran, L.; Wardwell, S.; Mohemmad, Q.K.; Narasimhan, N.I.; Shakespeare, W.C.; Wang, F.; Clackson, T.; Rivera, V.M. Ponatinib (AP24534), a Multitargeted Pan-FGFR Inhibitor with Activity in Multiple FGFR-Amplified or Mutated Cancer Models. Mol. Cancer Ther. 2012, 11, 690–699. [Google Scholar] [CrossRef] [Green Version]
- Mawrin, C. Animal Models of Meningiomas. Chin. Clin. Oncol. 2017, 6, S6. [Google Scholar] [CrossRef]
- Hirata, E.; Sahai, E. Tumor Microenvironment and Differential Responses to Therapy. Cold Spring Harb. Perspect. Med. 2017, 7, a026781. [Google Scholar] [CrossRef] [Green Version]
- Wang, J.-L.; Nistér, M.; Hermansson, M.; Westermark, B.; Pontén, J. Expression of PDGF β-Receptors in Human Meningioma Cells. Int. J. Cancer 1990, 46, 772–778. [Google Scholar] [CrossRef]
- Sherman, W.J.; Raizer, J.J. Chemotherapy: What is Its Role in Meningioma? Expert Rev. Neurother. 2012, 12, 1189–1196. [Google Scholar] [CrossRef] [Green Version]
- Weinberg, F.; Chandel, N.S. Reactive Oxygen Species-Dependent Signaling Regulates Cancer. Cell. Mol. Life Sci. 2009, 66, 3663. [Google Scholar] [CrossRef]
- Jin, Y.; Ding, K.; Li, H.; Xue, M.; Shi, X.; Wang, C.; Pan, J. Ponatinib Efficiently Kills Imatinib-Resistant Chronic Eosinophilic Leukemia Cells Harboring Gatekeeper Mutant T674I FIP1L1-PDGFRα: Roles of Mcl-1 and β-Catenin. Mol. Cancer 2014, 13, 17. [Google Scholar] [CrossRef] [Green Version]
- Chan, O.; Talati, C.; Isenalumhe, L.; Shams, S.; Nodzon, L.; Fradley, M.; Sweet, K.; Pinilla-Ibarz, J. Side-Effects Profile and Outcomes of Ponatinib in the Treatment of Chronic Myeloid Leukemia. Blood Adv. 2020, 4, 530–538. [Google Scholar] [CrossRef]


Publisher’s Note: MDPI stays neutral with regard to jurisdictional claims in published maps and institutional affiliations. |
© 2021 by the authors. Licensee MDPI, Basel, Switzerland. This article is an open access article distributed under the terms and conditions of the Creative Commons Attribution (CC BY) license (https://creativecommons.org/licenses/by/4.0/).
Share and Cite
Yu, T.; Cao, J.; Alaa Eddine, M.; Moustafa, M.; Mock, A.; Erkut, C.; Abdollahi, A.; Warta, R.; Unterberg, A.; Herold-Mende, C.; et al. Receptor-Tyrosine Kinase Inhibitor Ponatinib Inhibits Meningioma Growth In Vitro and In Vivo. Cancers 2021, 13, 5898. https://doi.org/10.3390/cancers13235898
Yu T, Cao J, Alaa Eddine M, Moustafa M, Mock A, Erkut C, Abdollahi A, Warta R, Unterberg A, Herold-Mende C, et al. Receptor-Tyrosine Kinase Inhibitor Ponatinib Inhibits Meningioma Growth In Vitro and In Vivo. Cancers. 2021; 13(23):5898. https://doi.org/10.3390/cancers13235898
Chicago/Turabian StyleYu, Tao, Junguo Cao, Montadar Alaa Eddine, Mahmoud Moustafa, Andreas Mock, Cihan Erkut, Amir Abdollahi, Rolf Warta, Andreas Unterberg, Christel Herold-Mende, and et al. 2021. "Receptor-Tyrosine Kinase Inhibitor Ponatinib Inhibits Meningioma Growth In Vitro and In Vivo" Cancers 13, no. 23: 5898. https://doi.org/10.3390/cancers13235898