
Identifying New Potential Biomarkers in Adrenocortical Tumors Based on mRNA Expression Data Using Machine Learning

 , , , , and
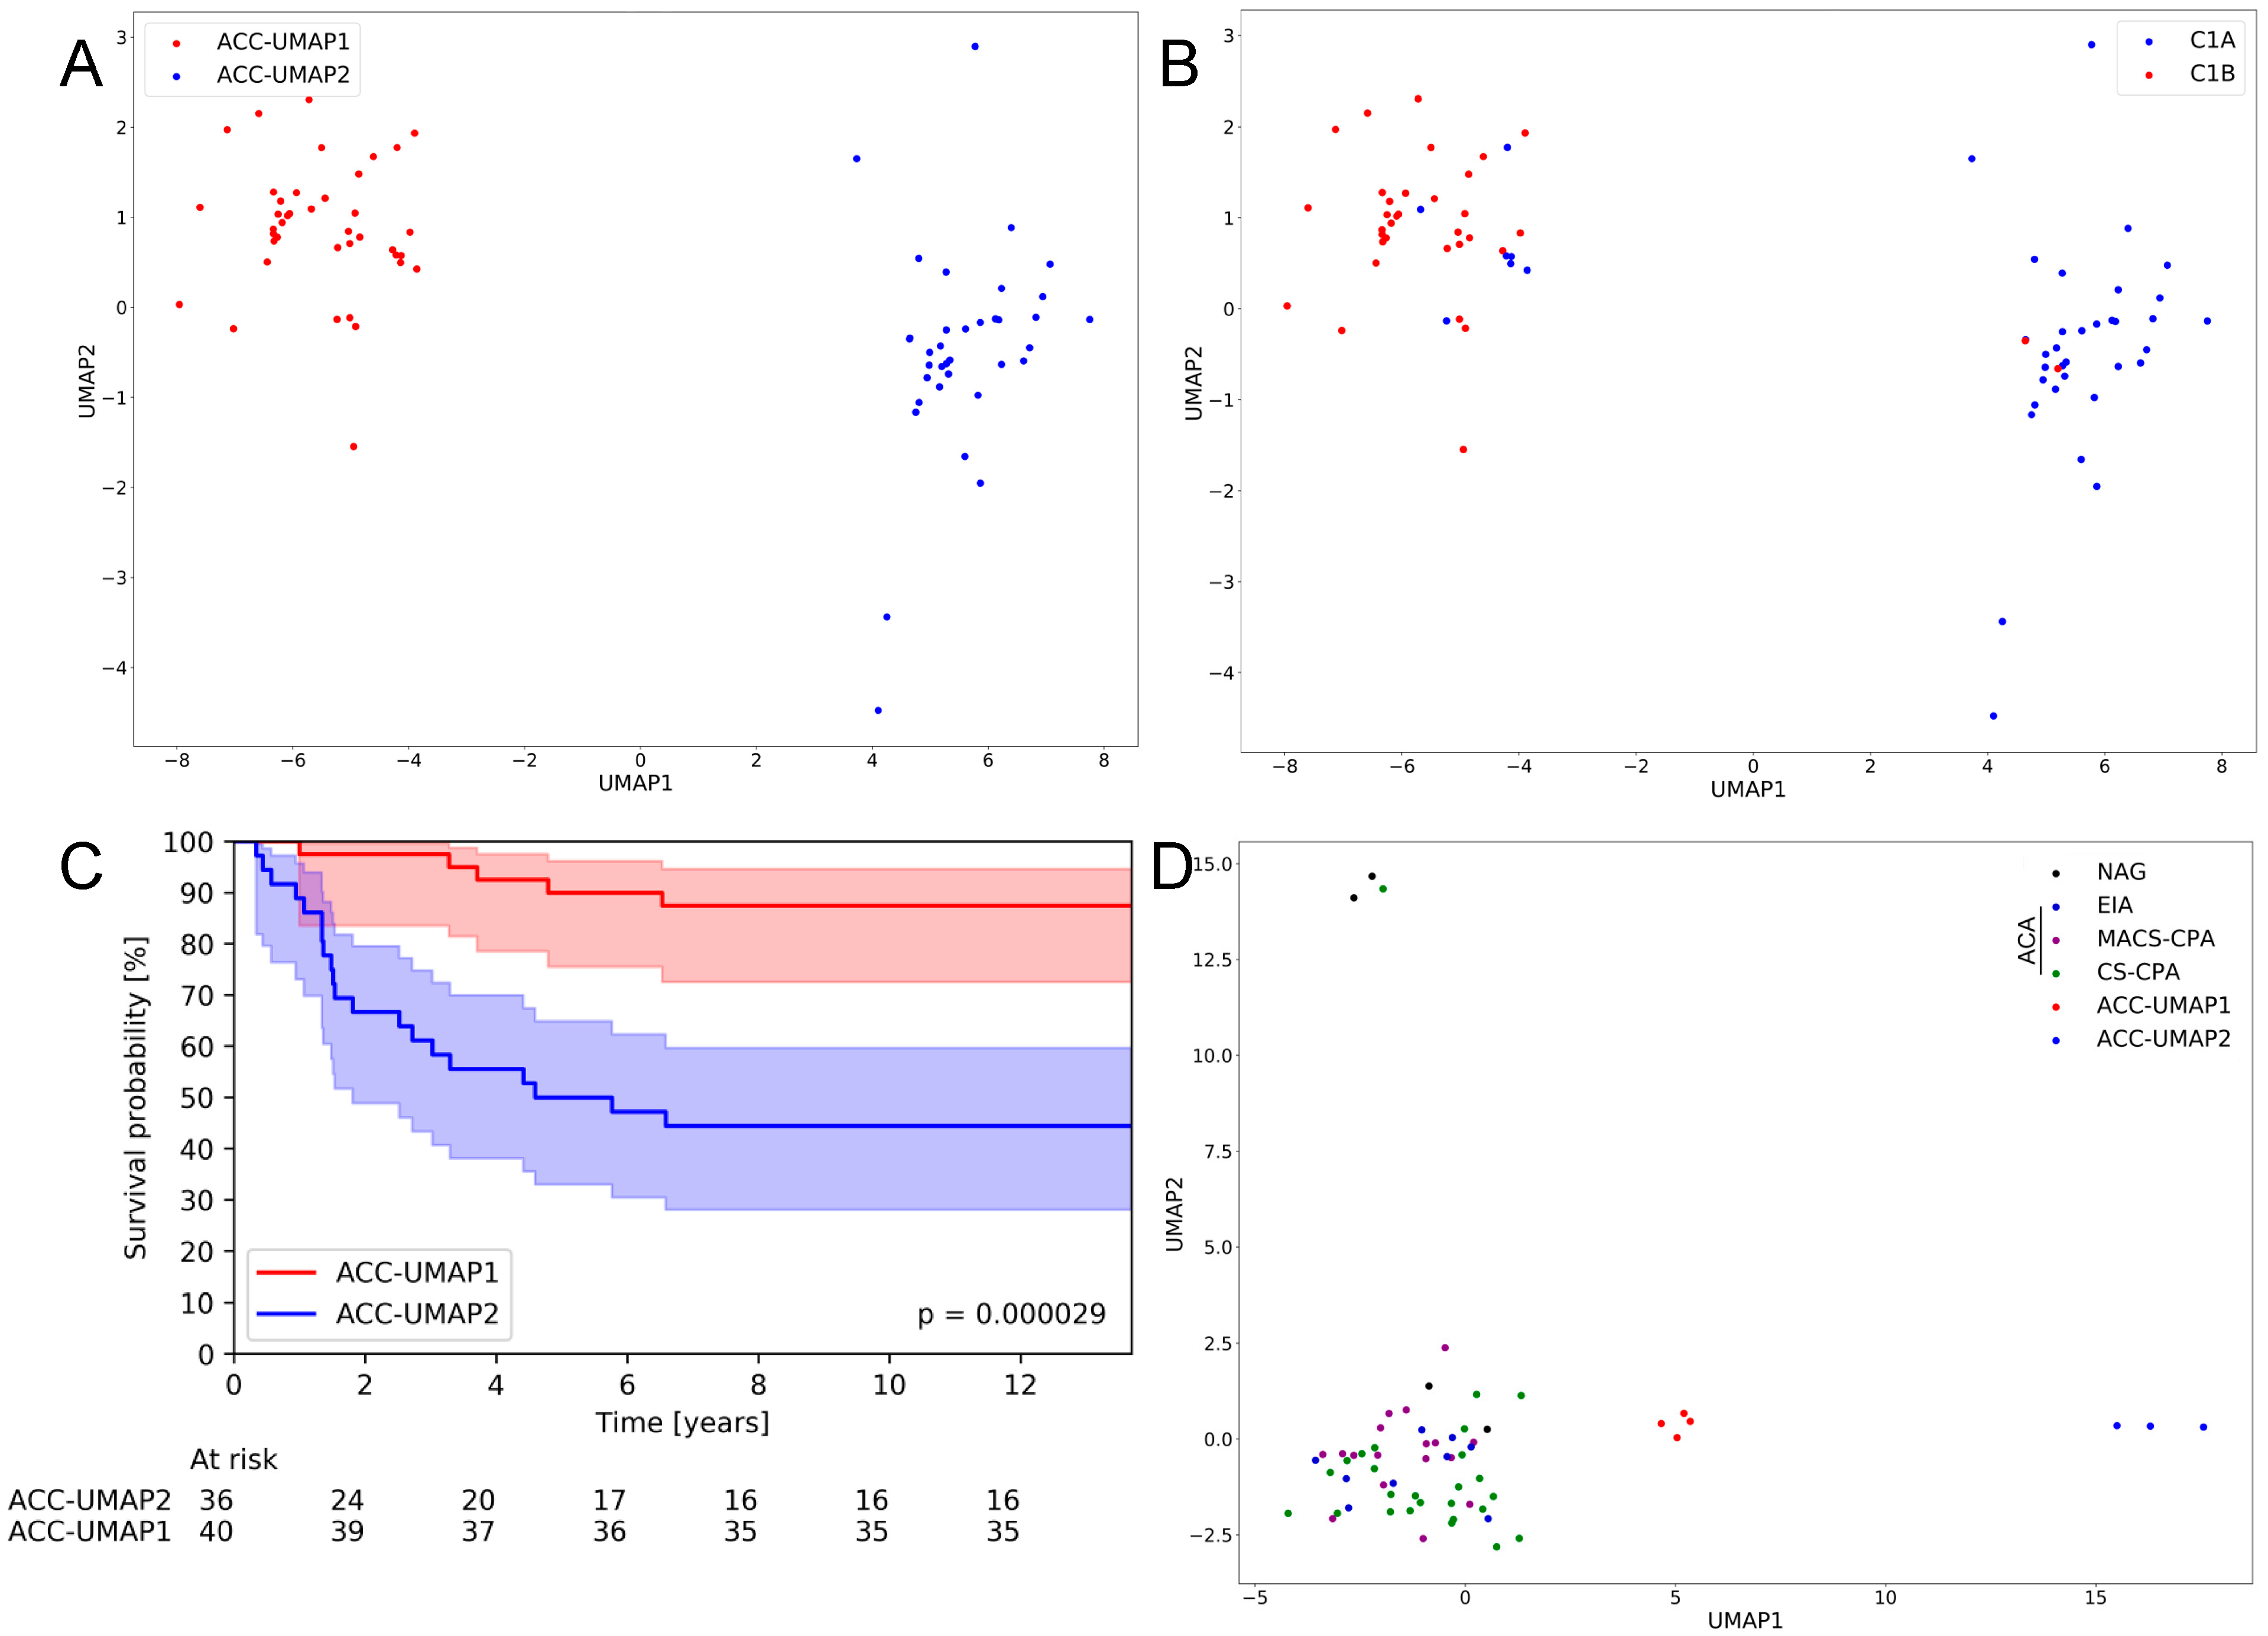
Abstract
:Simple Summary
Abstract
1. Introduction
2. Materials and Methods
2.1. Patient Cohorts
2.2. Bioinformatics Analyses
2.2.1. Uniform Manifold Approximation and Projection (UMAP) Clustering
2.2.2. Random Forest Learning
2.2.3. Mutation Analysis
2.2.4. Plots and Statistical Analysis
3. Results
3.1. An UMAP Clustering Approach Is Able to Generate Two Distinct Clusters of ACC Samples That Largely Confirm Previously Published Clusters and Correlate with Patient Survival
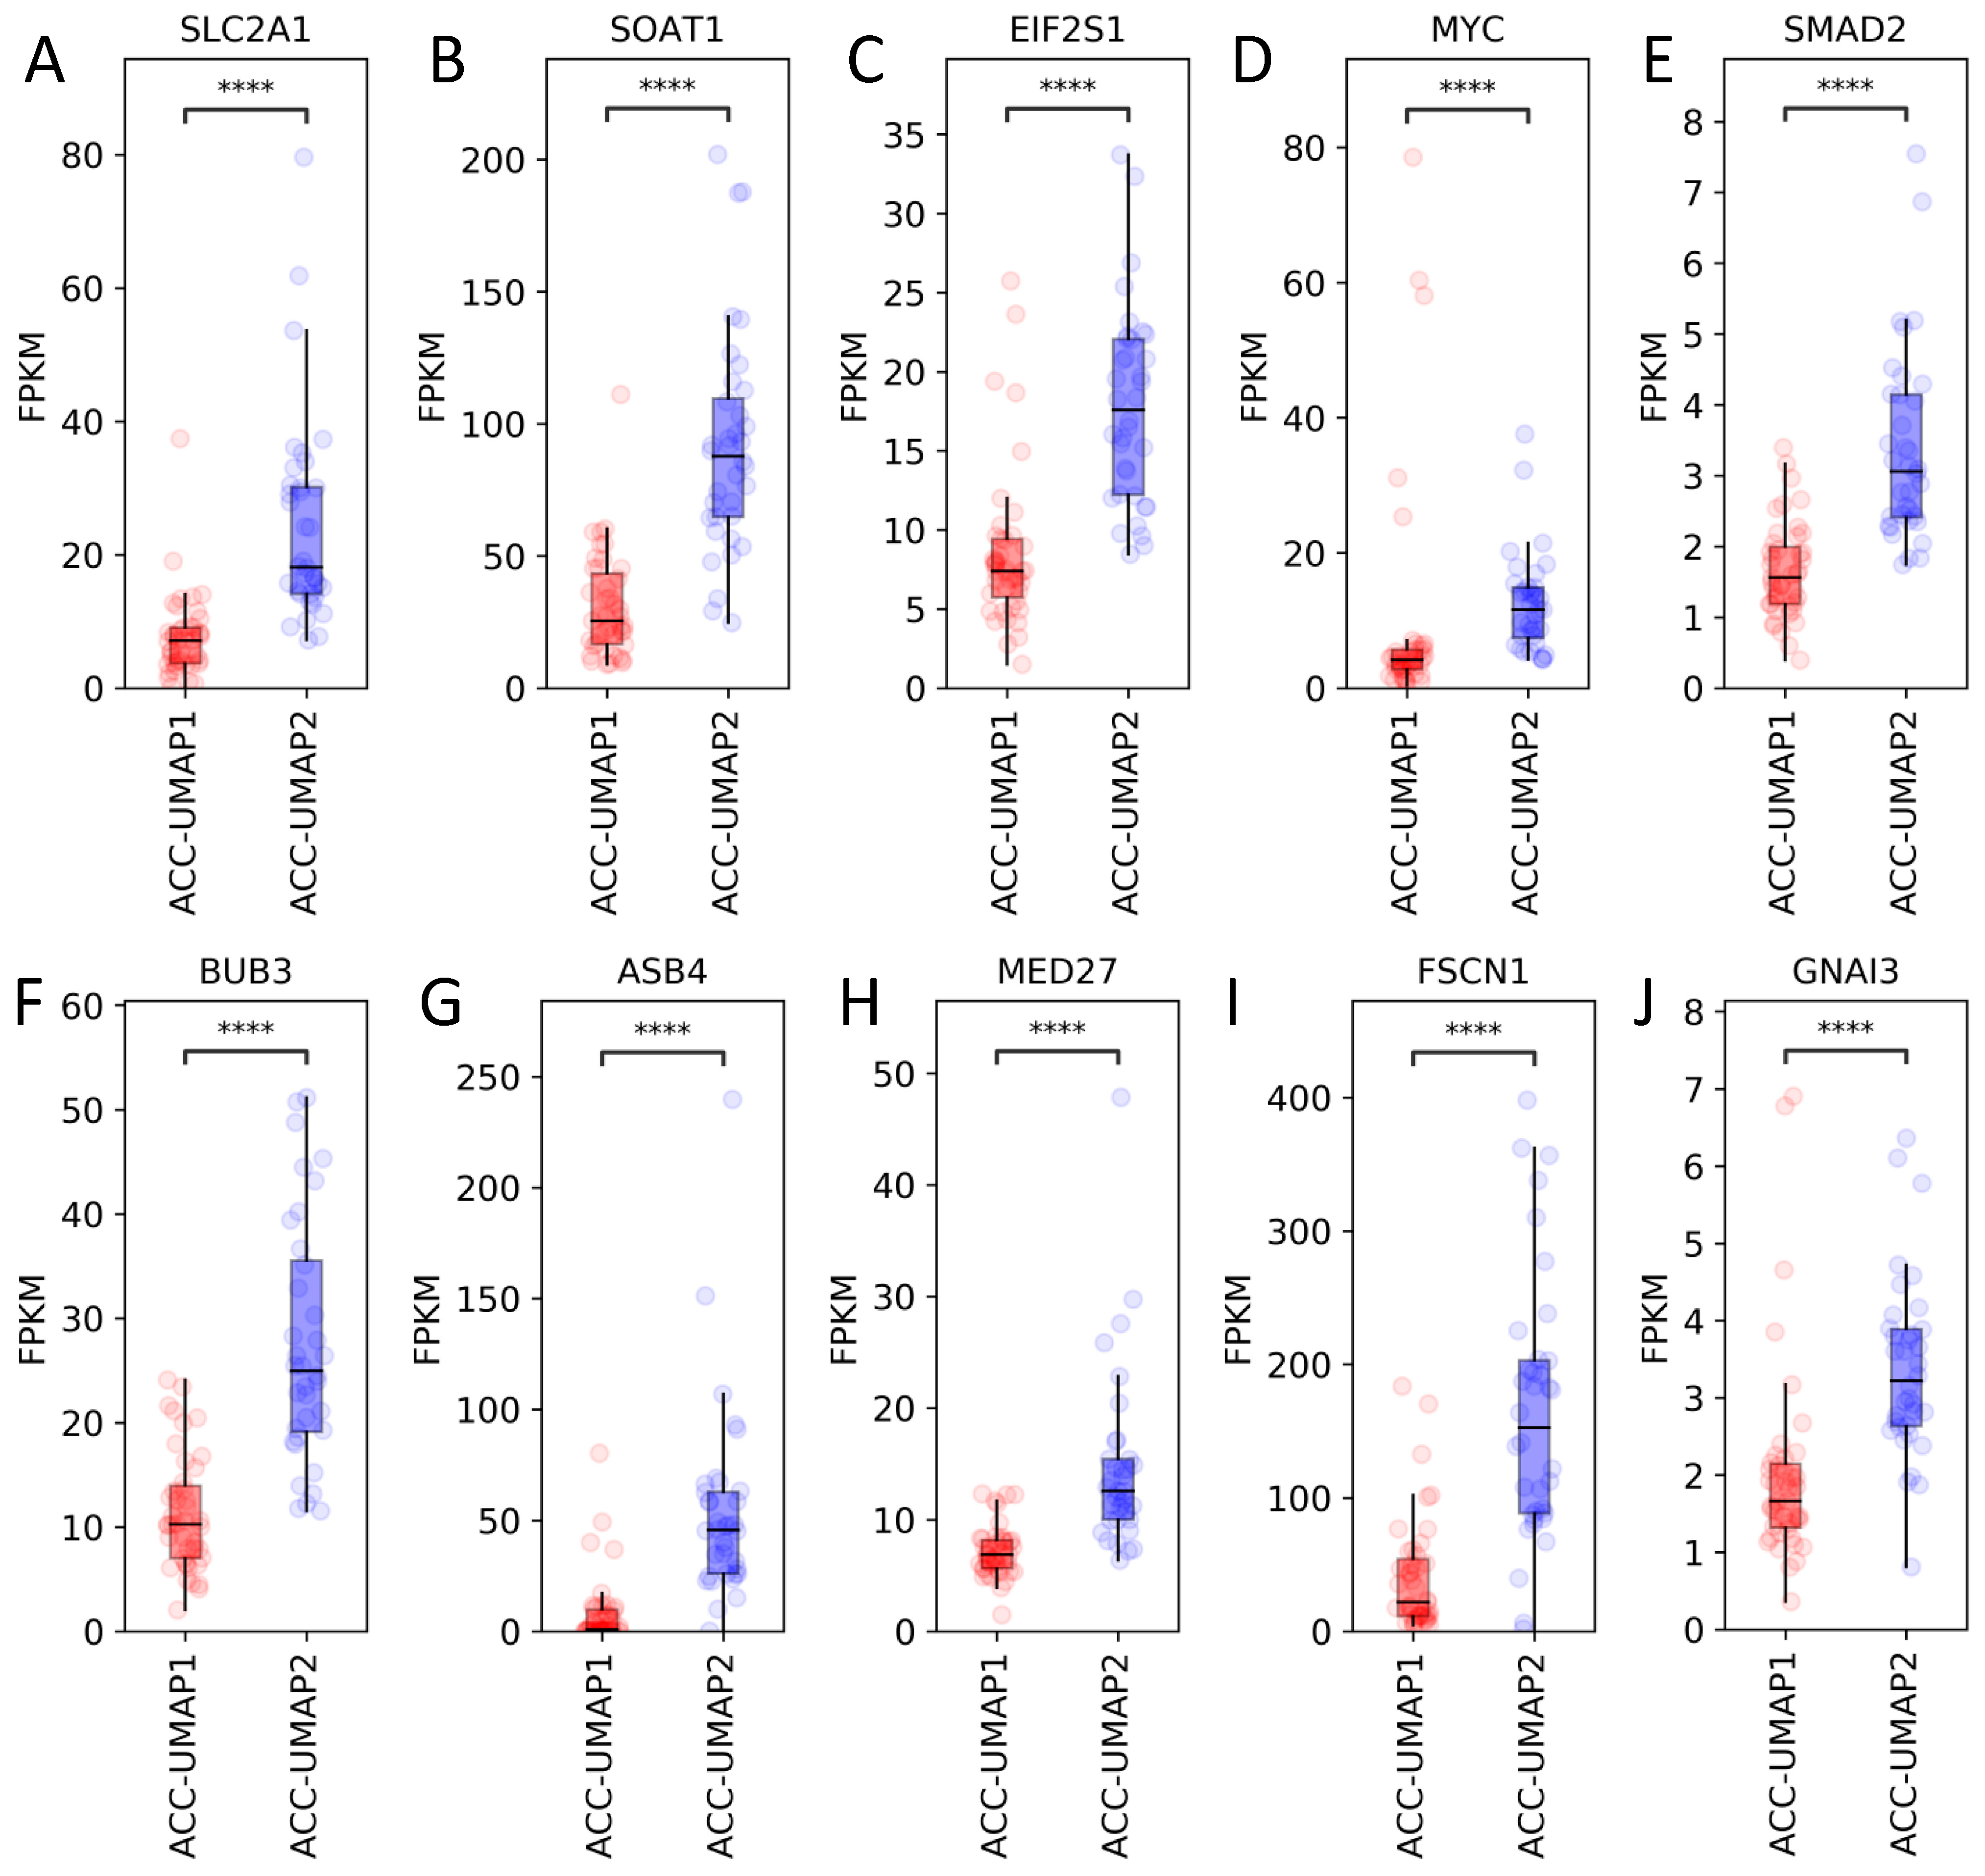
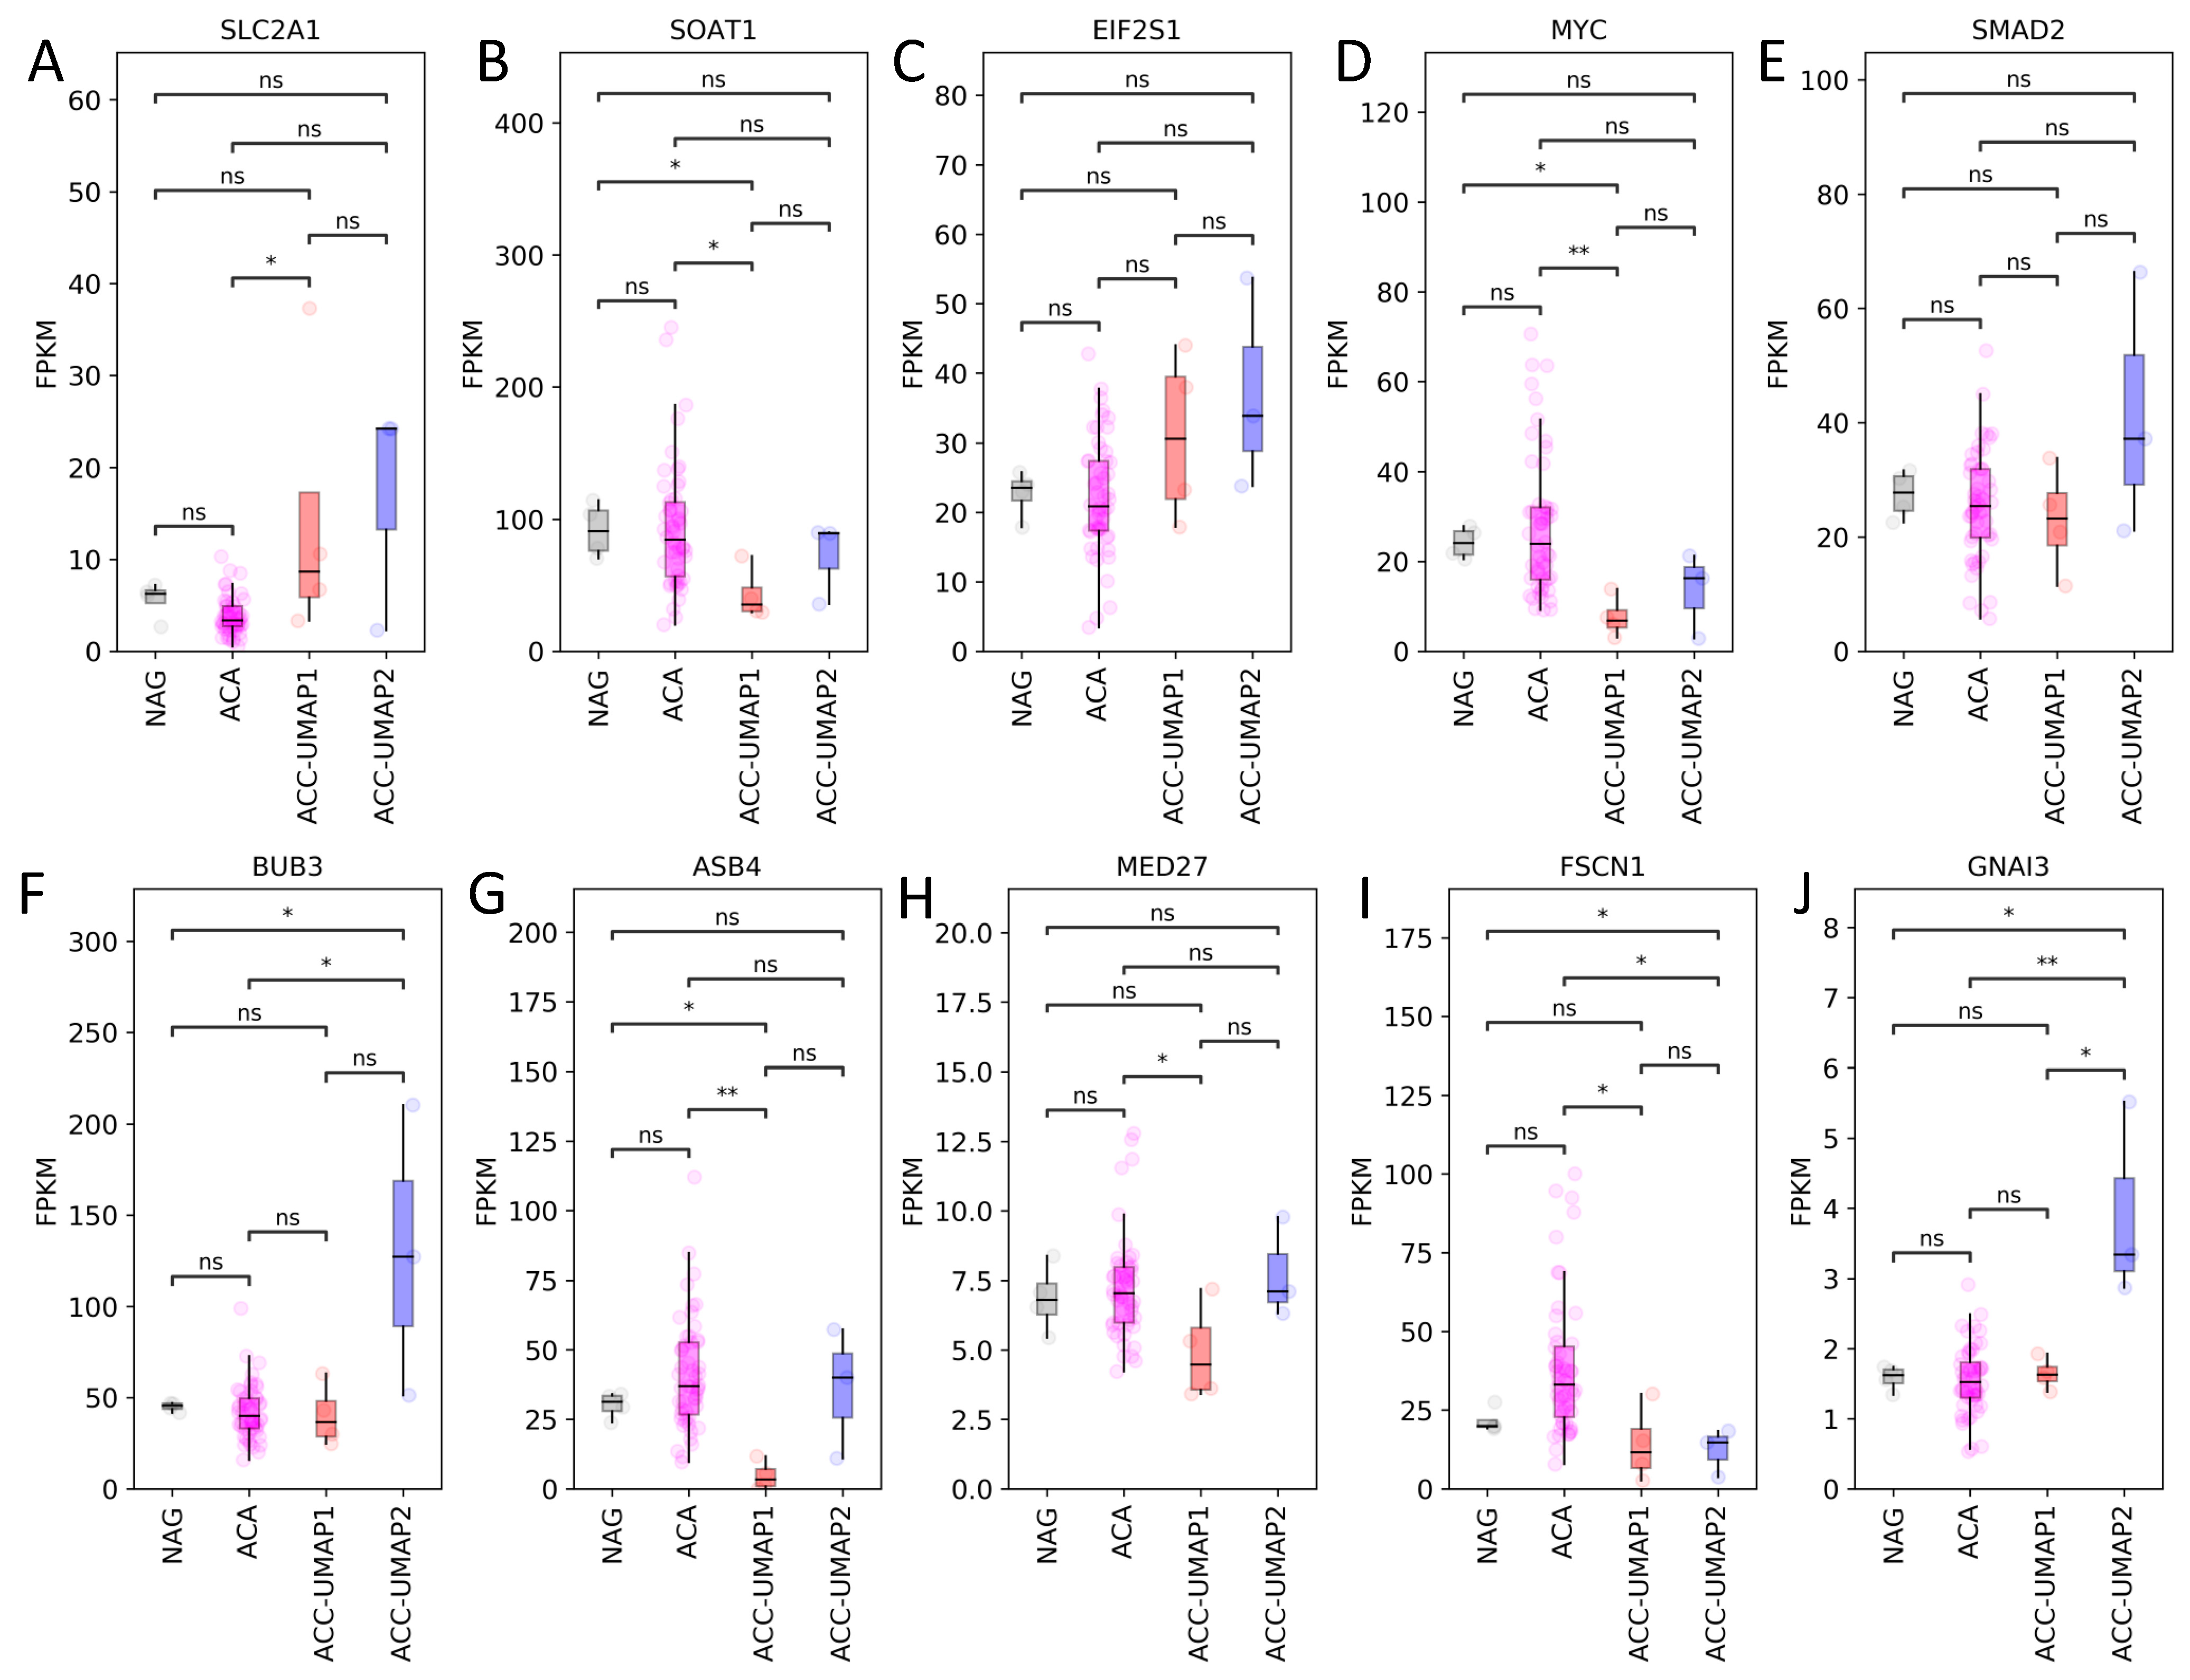
3.2. Random Forest Analysis Identifies 100 Genes That Are Differentially Expressed in Cluster ACC-UMAP2, but Most of These Genes Have Not Yet Been Associated with Adrenocortical Tumorigenesis
3.3. Mutational Analysis Reveals CTNNB1 and TP53 as the Only Known Differentially Mutated Genes
4. Discussion
5. Conclusions
Supplementary Materials
Author Contributions
Funding
Institutional Review Board Statement
Informed Consent Statement
Data Availability Statement
Acknowledgments
Conflicts of Interest
References
- Erickson, L.A.; Rivera, M.; Zhang, J. Adrenocortical Carcinoma: Review and Update. Adv. Anat. Pathol. 2014, 21, 151–159. [Google Scholar] [CrossRef]
- Stigliano, A.; Cerquetti, L.; Lard, P.; Petrangeli, E.; Toscano, V. New insights and future perspectives in the therapeutic strategy of adrenocortical carcinoma (Review). Oncol. Rep. 2017, 37, 1301–1311. [Google Scholar] [CrossRef]
- Fassnacht, M.; Dekkers, O.M.; Else, T.; Gaudin, E.; Berruti, A.; de Krijger, R.R.; Haak, H.R.; Mihail, R.; Assie, G.; Terzolo, M. European Society of Endocrinology Clinical Practice Guidelines on the management of adrenocortical carcinoma in adults, in collaboration with the European Network for the Study of Adrenal Tumors. Eur. J. Endocrinol. 2018, 179, G1–G46. [Google Scholar] [CrossRef] [PubMed]
- Fassnacht, M.; Assie, G.; Baudin, E.; Eisenhofer, G.; de la Fouchardiere, C.; Haak, H.R.; de Krijger, R.; Porpiglia, F.; Terzolo, M.; Berruti, A.; et al. Adrenocortical carcinomas and malignant phaeochromocytomas: ESMO-EURACAN Clinical Practice Guidelines for diagnosis, treatment and follow-up. Ann. Oncol. 2020, 31, 1476–1490. [Google Scholar] [CrossRef]
- Jasim, S.; Habra, M.A. Management of Adrenocortical Carcinoma. Curr. Oncol. Rep. 2019, 21, 273–287. [Google Scholar] [CrossRef]
- Varghese, J.; Habra, M.A. Update on adrenocortical carcinoma management and future directions. Curr. Opin. Endocrinol. 2017, 24, 208–214. [Google Scholar] [CrossRef] [PubMed]
- Giordano, T.J.; Kuick, R.; Else, T.; Gauger, P.G.; Vinco, M.; Bauersfeld, J.; Sanders, D.; Thomas, D.G.; Doherty, G.; Hammer, G. Molecular Classification and Prognostication of Adrenocortical Tumors by Transcriptome Profiling. Clin. Cancer Res. 2009, 15, 668–676. [Google Scholar] [CrossRef] [Green Version]
- Fassnacht, M.; Berruti, A.; Baudin, E.; Demeure, M.J.; Gilbert, J.; Haak, H.; Kroiss, M.; Quinn, D.I.; Hesseltine, E.; Ronchi, C.L.; et al. Linsitinib (OSI-906) versus placebo for patients with locally advanced or metastatic adrenocortical carcinoma: A double-blind, randomised, phase 3 study. Lancet Oncol. 2015, 16, 426–435. [Google Scholar] [CrossRef] [Green Version]
- Wortmann, S.; Quinkler, M.; Ritter, C.; Kroiss, M.; Johanssen, S.; Hahner, S.; Allolio, B.; Fassnacht, M. Bevacizumab plus capecitabine as a salvage therapy in advanced adrenocortical carcinoma. Eur. J. Endocrinol. 2010, 162, 349–356. [Google Scholar] [CrossRef] [Green Version]
- Altieri, B.; Ronchi, C.L.; Kroiss, M.; Fassnacht, M. Next-generation therapies for adrenocortical carcinoma. Best Pract. Res. Clin. Endocrinol. Metab. 2020, 34, 101434. [Google Scholar] [CrossRef] [PubMed]
- Creemers, S.G.; Hofland, L.J.; Korpershoek, E.; Franssen, G.J.H.; van Kemenade, F.J.; de Herder, W.W.; Feelders, R.A. Future directions in the diagnosis and medical treatment of adrenocortical carcinoma. Endocr.-Relat. Cancer 2016, 23, R43–R69. [Google Scholar] [CrossRef]
- Assie, G.; Letouze, E.; Fassnacht, M.; Jouinot, A.; Luscap, W.; Barreau, O.; Omeiri, H.; Rodriguez, S.; Perlemoine, K.; Rene-Corail, F.; et al. Integrated genomic characterization of adrenocortical carcinoma. Nat. Genet. 2014, 46, 607–612. [Google Scholar] [CrossRef] [PubMed]
- Assie, G.; Jouinot, A.; Fassnacht, M.; Libe, R.; Garinet, S.; Jacob, L.; Hamzaoui, N.; Neou, M.; Sakat, J.; de La Villeon, B.; et al. Value of Molecular Classification for Prognostic Assessment of Adrenocortical Carcinoma. JAMA Oncol. 2019, 5, 1440–1447. [Google Scholar] [CrossRef]
- Juhlin, C.C.; Goh, G.; Healy, J.M.; Fonseca, A.L.; Scholl, U.I.; Stenman, A.; Kunstman, J.W.; Brown, T.C.; Overton, J.D.; Mane, S.M.; et al. Whole-Exome Sequencing Characterizes the Landscape of Somatic Mutations and Copy Number Alterations in Adrenocortical Carcinoma. J. Clin. Endocr. Metab. 2015, 100, E493–E502. [Google Scholar] [CrossRef] [PubMed]
- Zheng, S.Y.; Cherniack, A.D.; Dewal, N.; Moffitt, R.A.; Danilova, L.; Murray, B.A.; Lerario, A.M.; Else, T.; Knijnenburg, T.A.; Ciriello, G.; et al. Comprehensive Pan-Genomic Characterization of Adrenocortical Carcinoma. Cancer Cell 2016, 29, 723–736. [Google Scholar] [CrossRef] [Green Version]
- Ronchi, C.L.; Sbiera, S.; Leich, E.; Henzel, K.; Rosenwald, A.; Allolio, B.; Fassnacht, M. Single Nucleotide Polymorphism Array Profiling of Adrenocortical Tumors—Evidence for an Adenoma Carcinoma Sequence? PLoS ONE 2013, 8, e73959. [Google Scholar] [CrossRef] [PubMed]
- Hao, H.X.; Xie, Y.; Zhang, Y.; Charlat, O.; Oster, E.; Avello, M.; Lei, H.; Mickanin, C.; Liu, D.; Ruffner, H.; et al. ZNRF3 promotes Wnt receptor turnover in an R-spondin-sensitive manner. Nature 2012, 485, 195–200. [Google Scholar] [CrossRef] [PubMed]
- de Reynies, A.; Assie, G.; Rickman, D.S.; Tissier, F.; Groussin, L.; Rene-Corrail, F.; Dousset, B.; Bertagna, X.; Clauser, E.; Bertherat, J. Gene Expression Profiling Reveals a New Classification of Adrenocortical Tumors and Identifies Molecular Predictors of Malignancy and Survival. J. Clin. Oncol. 2009, 27, 1108–1115. [Google Scholar] [CrossRef]
- Di Dalmazi, G.; Altieri, B.; Scholz, C.; Sbiera, S.; Luconi, M.; Waldman, J.; Kastelan, D.; Ceccato, F.; Chiodini, I.; Arnaldi, G.; et al. RNA Sequencing and Somatic Mutation Status of Adrenocortical Tumors: Novel Pathogenetic Insights. J. Clin. Endocrinol. Metab. 2020, 105, e4459–e4473. [Google Scholar] [CrossRef]
- Murakami, M.; Yoshimoto, T.; Nakabayashi, K.; Tsuchiya, K.; Minami, I.; Bouchi, R.; Izumiyama, H.; Fujii, Y.; Abe, K.; Tayama, C.; et al. Integration of transcriptome and methylome analysis of aldosterone-producing adenomas. Eur. J. Endocrinol. 2015, 173, 185–195. [Google Scholar] [CrossRef] [Green Version]
- Reback, J.; McKinney, W.; Augspurger, T.; Cloud, P.; Roeschke, M.; Hawkins, S.; Tratner, J.; She, C.; Ayd, W.; Petersen, T.; et al. pandas-dev/pandas: Pandas 1.0.3. 2020. Available online: https://doi.org/10.5281/ZENODO.3715232 (accessed on 6 September 2021).
- McKinney, W. Data structures for statistical computing in python. In Proceedings of the 9th Python in Science Conference, Austin, TX, USA, 28 June–8 July 2010; Volume 56, pp. 51–56. [Google Scholar] [CrossRef] [Green Version]
- Marquardt, A.; Solimando, A.G.; Kerscher, A.; Bittrich, M.; Kalogirou, C.; Kubler, H.; Rosenwald, A.; Bargou, R.; Kollmannsberger, P.; Schilling, B.; et al. Subgroup-Independent Mapping of Renal Cell Carcinoma-Machine Learning Reveals Prognostic Mitochondrial Gene Signature Beyond Histopathologic Boundaries. Front. Oncol. 2021, 11, 621278. [Google Scholar] [CrossRef] [PubMed]
- Cerami, E.; Gao, J.; Dogrusoz, U.; Gross, B.E.; Sumer, S.O.; Aksoy, B.A.; Jacobsen, A.; Byrne, C.J.; Heuer, M.L.; Larsson, E.; et al. The cBio cancer genomics portal: An open platform for exploring multidimensional cancer genomics data. Cancer Discov. 2012, 2, 401–404. [Google Scholar] [CrossRef] [Green Version]
- Gao, J.; Aksoy, B.A.; Dogrusoz, U.; Dresdner, G.; Gross, B.; Sumer, S.O.; Sun, Y.; Jacobsen, A.; Sinha, R.; Larsson, E.; et al. Integrative analysis of complex cancer genomics and clinical profiles using the cBioPortal. Sci. Signal. 2013, 6, l1. [Google Scholar] [CrossRef] [Green Version]
- Davidson-Pilon, C.; Kalderstam, J.; Zivich, P.; Kuhn, B.; Williamson, M.; Fiore-Gartland, A.; Moneda, L.; WIlson, D.; Parij, A.; Stark, K.; et al. CamDavidsonPilon/lifelines: v0.21.3. 2019. Available online: https://doi.org/10.5281/zenodo.3240536 (accessed on 6 September 2021).
- Szklarczyk, D.; Gable, A.L.; Lyon, D.; Junge, A.; Wyder, S.; Huerta-Cepas, J.; Simonovic, M.; Doncheva, N.T.; Morris, J.H.; Bork, P.; et al. STRING v11: Protein-protein association networks with increased coverage, supporting functional discovery in genome-wide experimental datasets. Nucleic. Acids. Res. 2019, 47, D607–D613. [Google Scholar] [CrossRef] [Green Version]
- Fenske, W.; Volker, H.U.; Adam, P.; Hahner, S.; Johanssen, S.; Wortmann, S.; Schmidt, M.; Morcos, M.; Muller-Hermelink, H.K.; Allolio, B.; et al. Glucose transporter GLUT1 expression is an stage-independent predictor of clinical outcome in adrenocortical carcinoma. Endocr. Relat. Cancer 2009, 16, 919–928. [Google Scholar] [CrossRef] [Green Version]
- Weigand, I.; Altieri, B.; Lacombe, A.M.F.; Basile, V.; Kircher, S.; Landwehr, L.S.; Schreiner, J.; Zerbini, M.C.N.; Ronchi, C.L.; Megerle, F.; et al. Expression of SOAT1 in Adrenocortical Carcinoma and Response to Mitotane Monotherapy: An ENSAT Multicenter Study. J. Clin. Endocrinol. Metab. 2020, 105, 2642–2653. [Google Scholar] [CrossRef] [PubMed]
- Sbiera, S.; Leich, E.; Liebisch, G.; Sbiera, I.; Schirbel, A.; Wiemer, L.; Matysik, S.; Eckhardt, C.; Gardill, F.; Gehl, A.; et al. Mitotane Inhibits Sterol-O-Acyl Transferase 1 Triggering Lipid-Mediated Endoplasmic Reticulum Stress and Apoptosis in Adrenocortical Carcinoma Cells. Endocrinology 2015, 156, 3895–3908. [Google Scholar] [CrossRef] [PubMed] [Green Version]
- Pennanen, M.; Hagstrom, J.; Heiskanen, I.; Sane, T.; Mustonen, H.; Arola, J.; Haglund, C. C-myc expression in adrenocortical tumours. J. Clin. Pathol. 2018, 71, 129–134. [Google Scholar] [CrossRef]
- Parviainen, H.; Schrade, A.; Kiiveri, S.; Prunskaite-Hyyrylainen, R.; Haglund, C.; Vainio, S.; Wilson, D.B.; Arola, J.; Heikinheimo, M. Expression of Wnt and TGF-beta pathway components and key adrenal transcription factors in adrenocortical tumors: Association to carcinoma aggressiveness. Pathol. Res. Pract. 2013, 209, 503–509. [Google Scholar] [CrossRef] [PubMed] [Green Version]
- Subramanian, C.; Cohen, M.S. Over expression of DNA damage and cell cycle dependent proteins are associated with poor survival in patients with adrenocortical carcinoma. Surgery 2019, 165, 202–210. [Google Scholar] [CrossRef] [PubMed]
- He, H.; Dai, J.; Yang, X.; Wang, X.; Sun, F.; Zhu, Y. Silencing of MED27 inhibits adrenal cortical carcinogenesis by targeting the Wnt/beta-catenin signaling pathway and the epithelial-mesenchymal transition process. Biol. Chem. 2018, 399, 593–602. [Google Scholar] [CrossRef] [PubMed]
- Poli, G.; Ruggiero, C.; Cantini, G.; Canu, L.; Baroni, G.; Armignacco, R.; Jouinot, A.; Santi, R.; Ercolino, T.; Ragazzon, B.; et al. Fascin-1 Is a Novel Prognostic Biomarker Associated With Tumor Invasiveness in Adrenocortical Carcinoma. J. Clin. Endocrinol. Metab. 2019, 104, 1712–1724. [Google Scholar] [CrossRef]
- Bastin, G.; Dissanayake, K.; Langburt, D.; Tam, A.L.C.; Lee, S.H.; Lachhar, K.; Heximer, S.P. RGS4 controls Galphai3-mediated regulation of Bcl-2 phosphorylation on TGN38-containing intracellular membranes. J. Cell Sci. 2020, 133, jcs241034. [Google Scholar] [CrossRef] [PubMed]
- Szabo, P.M.; Racz, K.; Igaz, P. Underexpression of C-myc in adrenocortical cancer: A major pathogenic event? Horm. Metab. Res. 2011, 43, 297–299. [Google Scholar] [CrossRef]
- van Wijnen, A.J.; Bagheri, L.; Badreldin, A.A.; Larson, A.N.; Dudakovic, A.; Thaler, R.; Paradise, C.R.; Wu, Z. Biological functions of chromobox (CBX) proteins in stem cell self-renewal, lineage-commitment, cancer and development. Bone 2021, 143, 115659. [Google Scholar] [CrossRef] [PubMed]


Publisher’s Note: MDPI stays neutral with regard to jurisdictional claims in published maps and institutional affiliations. |
© 2021 by the authors. Licensee MDPI, Basel, Switzerland. This article is an open access article distributed under the terms and conditions of the Creative Commons Attribution (CC BY) license (https://creativecommons.org/licenses/by/4.0/).
Share and Cite
Marquardt, A.; Landwehr, L.-S.; Ronchi, C.L.; di Dalmazi, G.; Riester, A.; Kollmannsberger, P.; Altieri, B.; Fassnacht, M.; Sbiera, S. Identifying New Potential Biomarkers in Adrenocortical Tumors Based on mRNA Expression Data Using Machine Learning. Cancers 2021, 13, 4671. https://doi.org/10.3390/cancers13184671
Marquardt A, Landwehr L-S, Ronchi CL, di Dalmazi G, Riester A, Kollmannsberger P, Altieri B, Fassnacht M, Sbiera S. Identifying New Potential Biomarkers in Adrenocortical Tumors Based on mRNA Expression Data Using Machine Learning. Cancers. 2021; 13(18):4671. https://doi.org/10.3390/cancers13184671
Chicago/Turabian StyleMarquardt, André, Laura-Sophie Landwehr, Cristina L. Ronchi, Guido di Dalmazi, Anna Riester, Philip Kollmannsberger, Barbara Altieri, Martin Fassnacht, and Silviu Sbiera. 2021. "Identifying New Potential Biomarkers in Adrenocortical Tumors Based on mRNA Expression Data Using Machine Learning" Cancers 13, no. 18: 4671. https://doi.org/10.3390/cancers13184671