
Correlation of Body Mass Index with Oncologic Outcomes in Colorectal Cancer Patients: A Large Population-Based Study

 , , ,
, , ,  , ,
, ,  ,
,
Abstract
:Simple Summary
Abstract
1. Introduction
2. Materials and Methods
2.1. Study Design and Data Sources
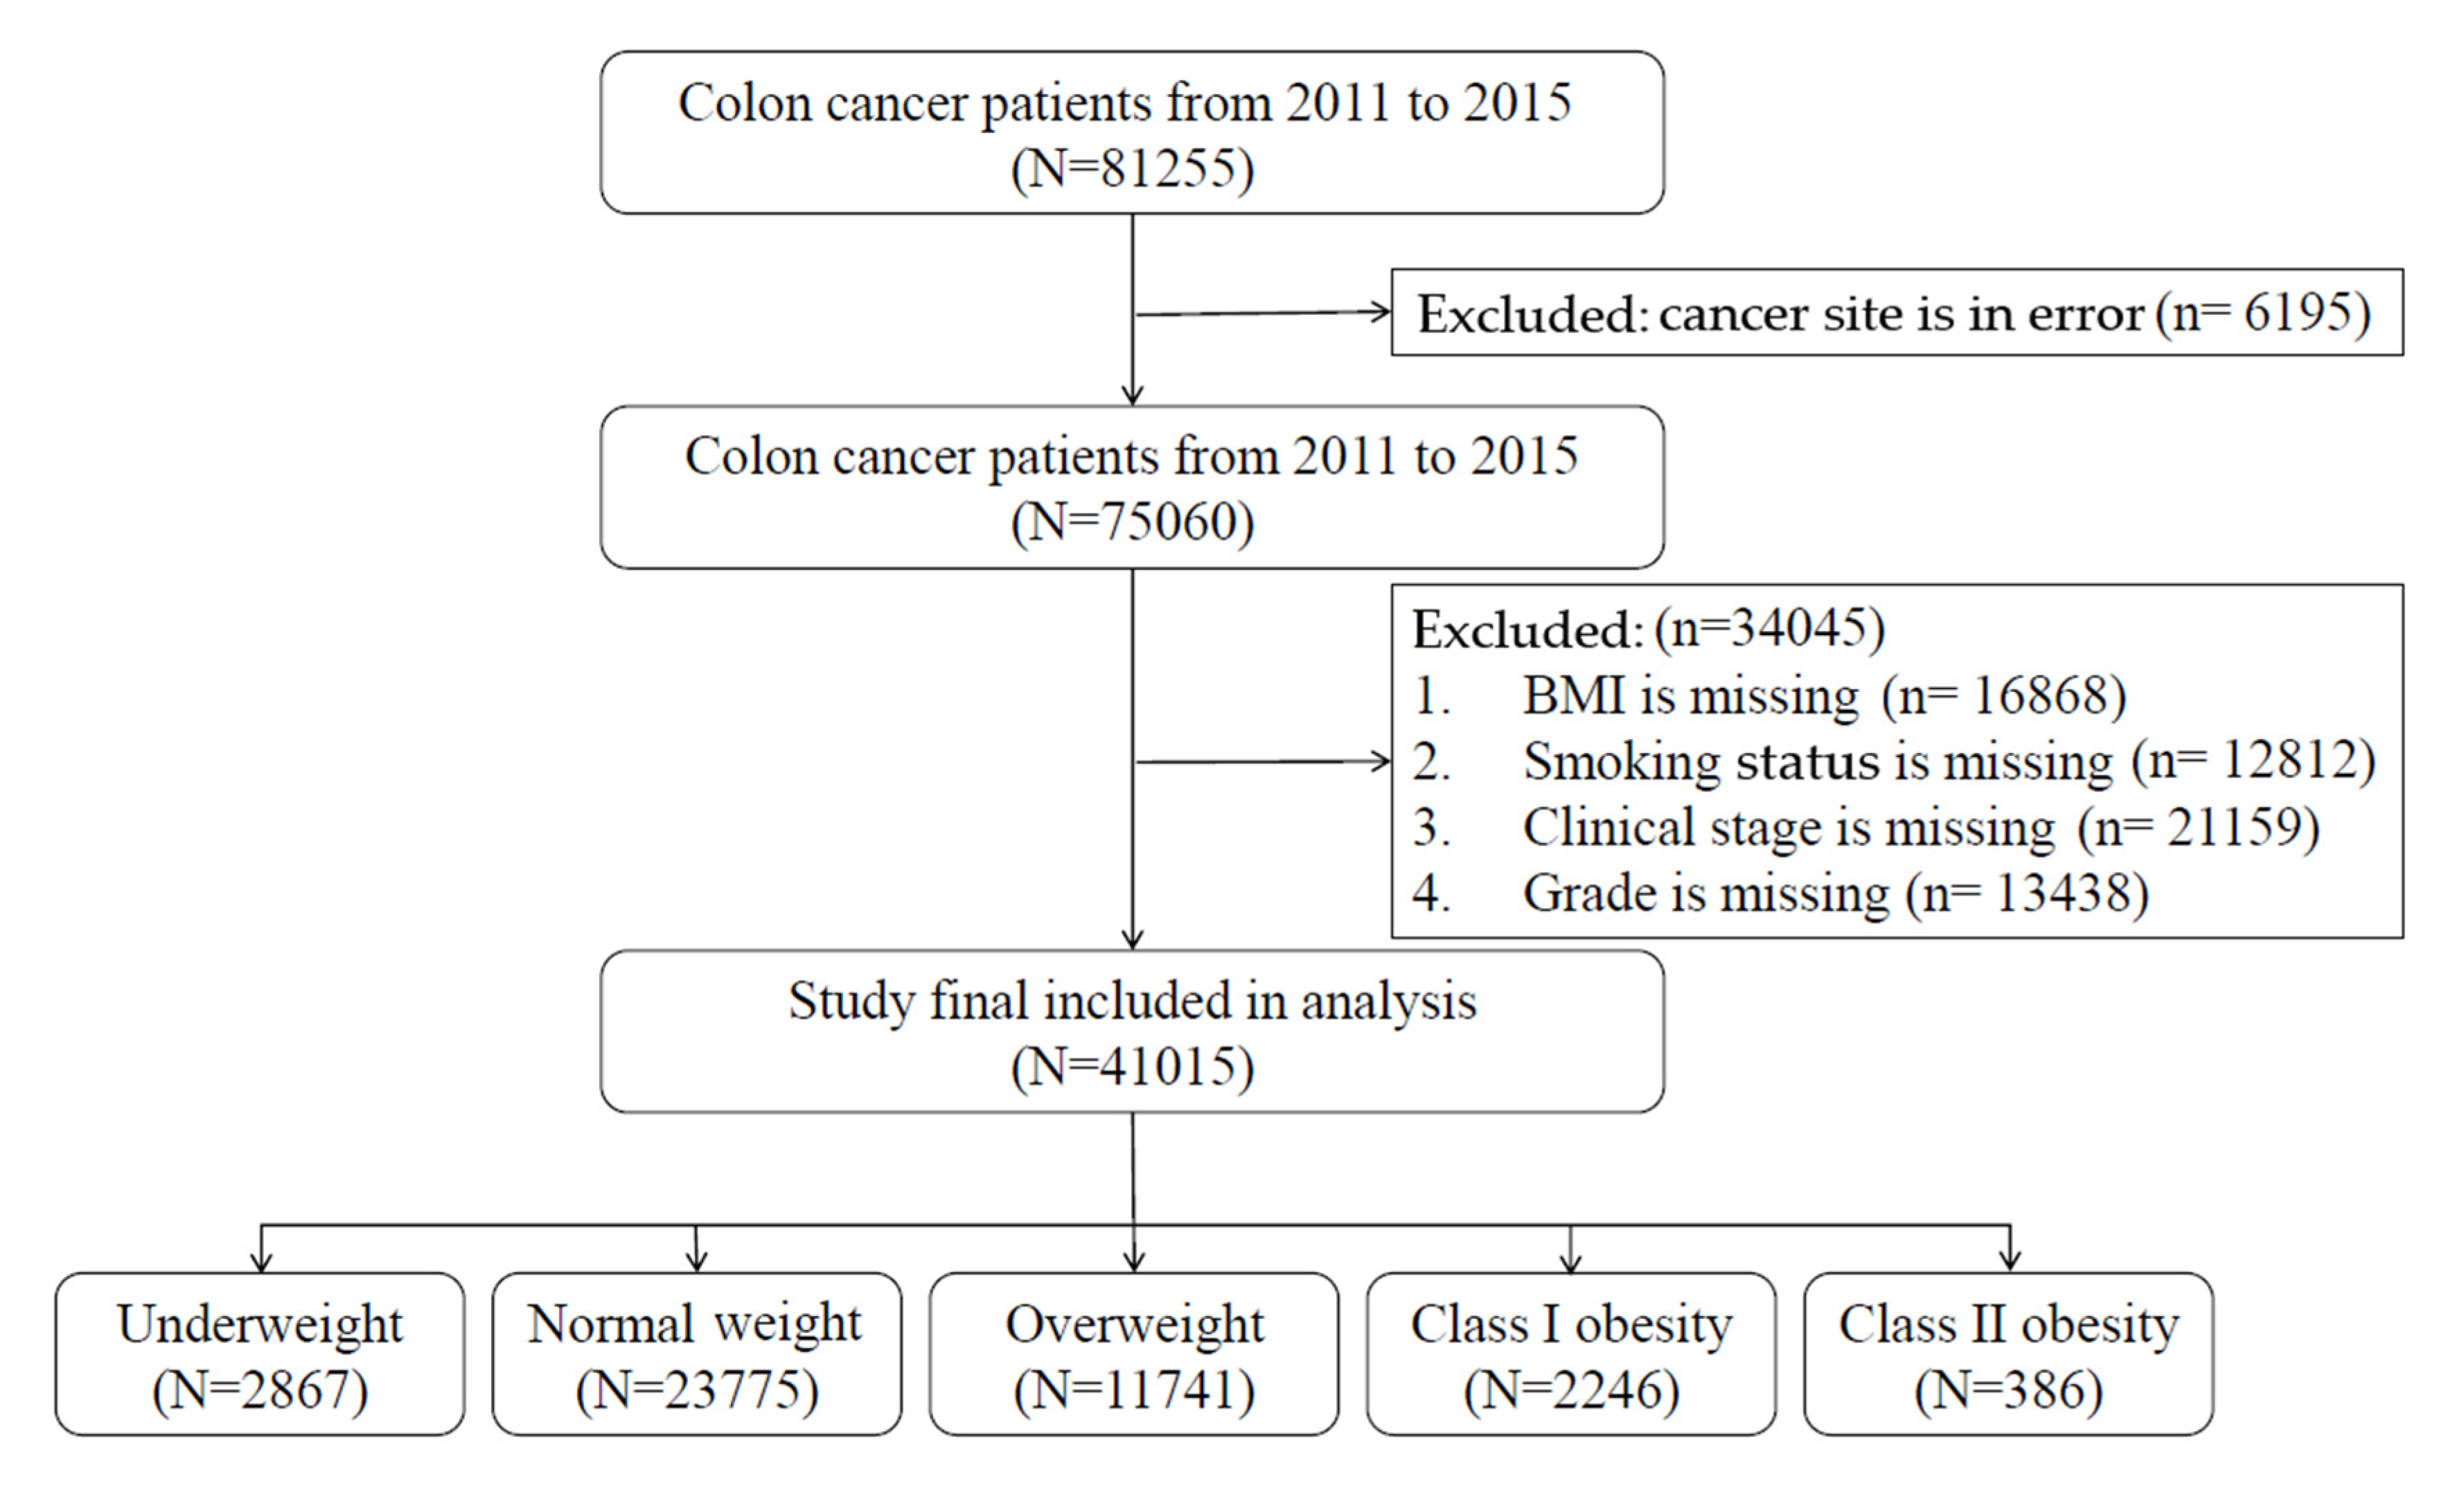
2.2. Study Patients
2.3. Measurements
2.4. Statistical Analysis
3. Results
3.1. Patient Characteristics
3.2. Hazard Ratios of BMI at Diagnosis and Mortality Rates
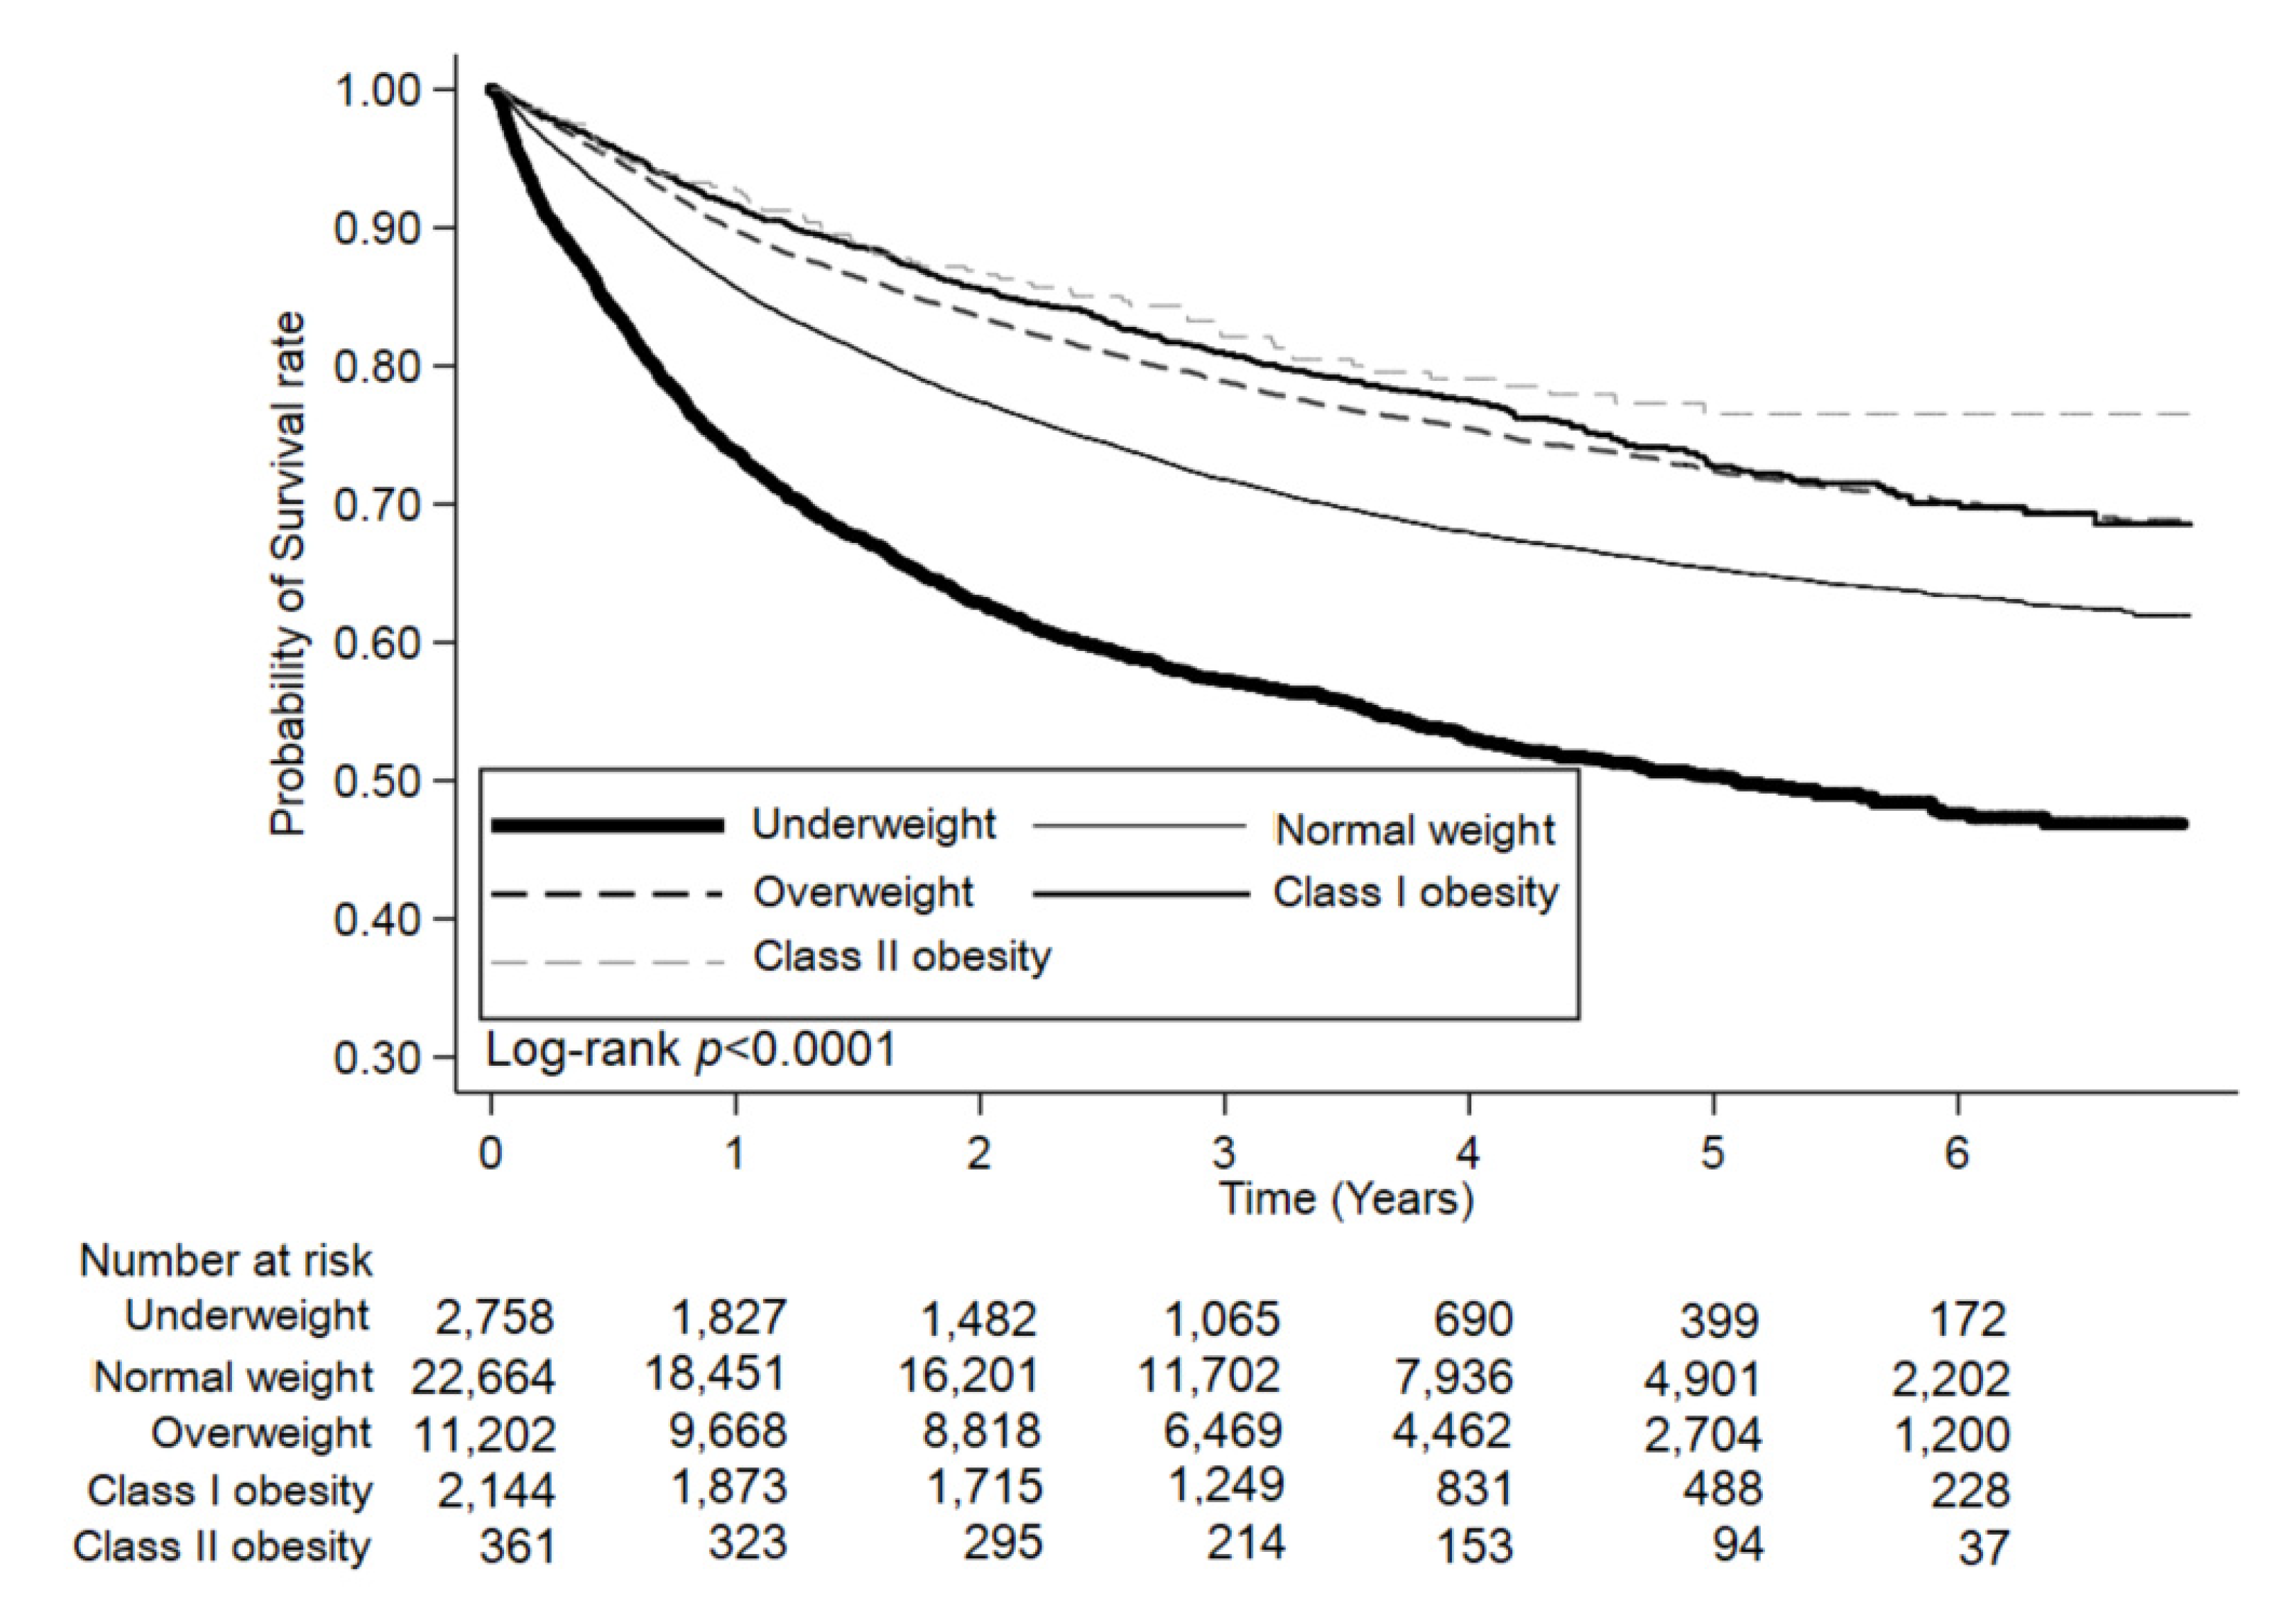
3.3. Stratified Analyses of Overall Survival Rates
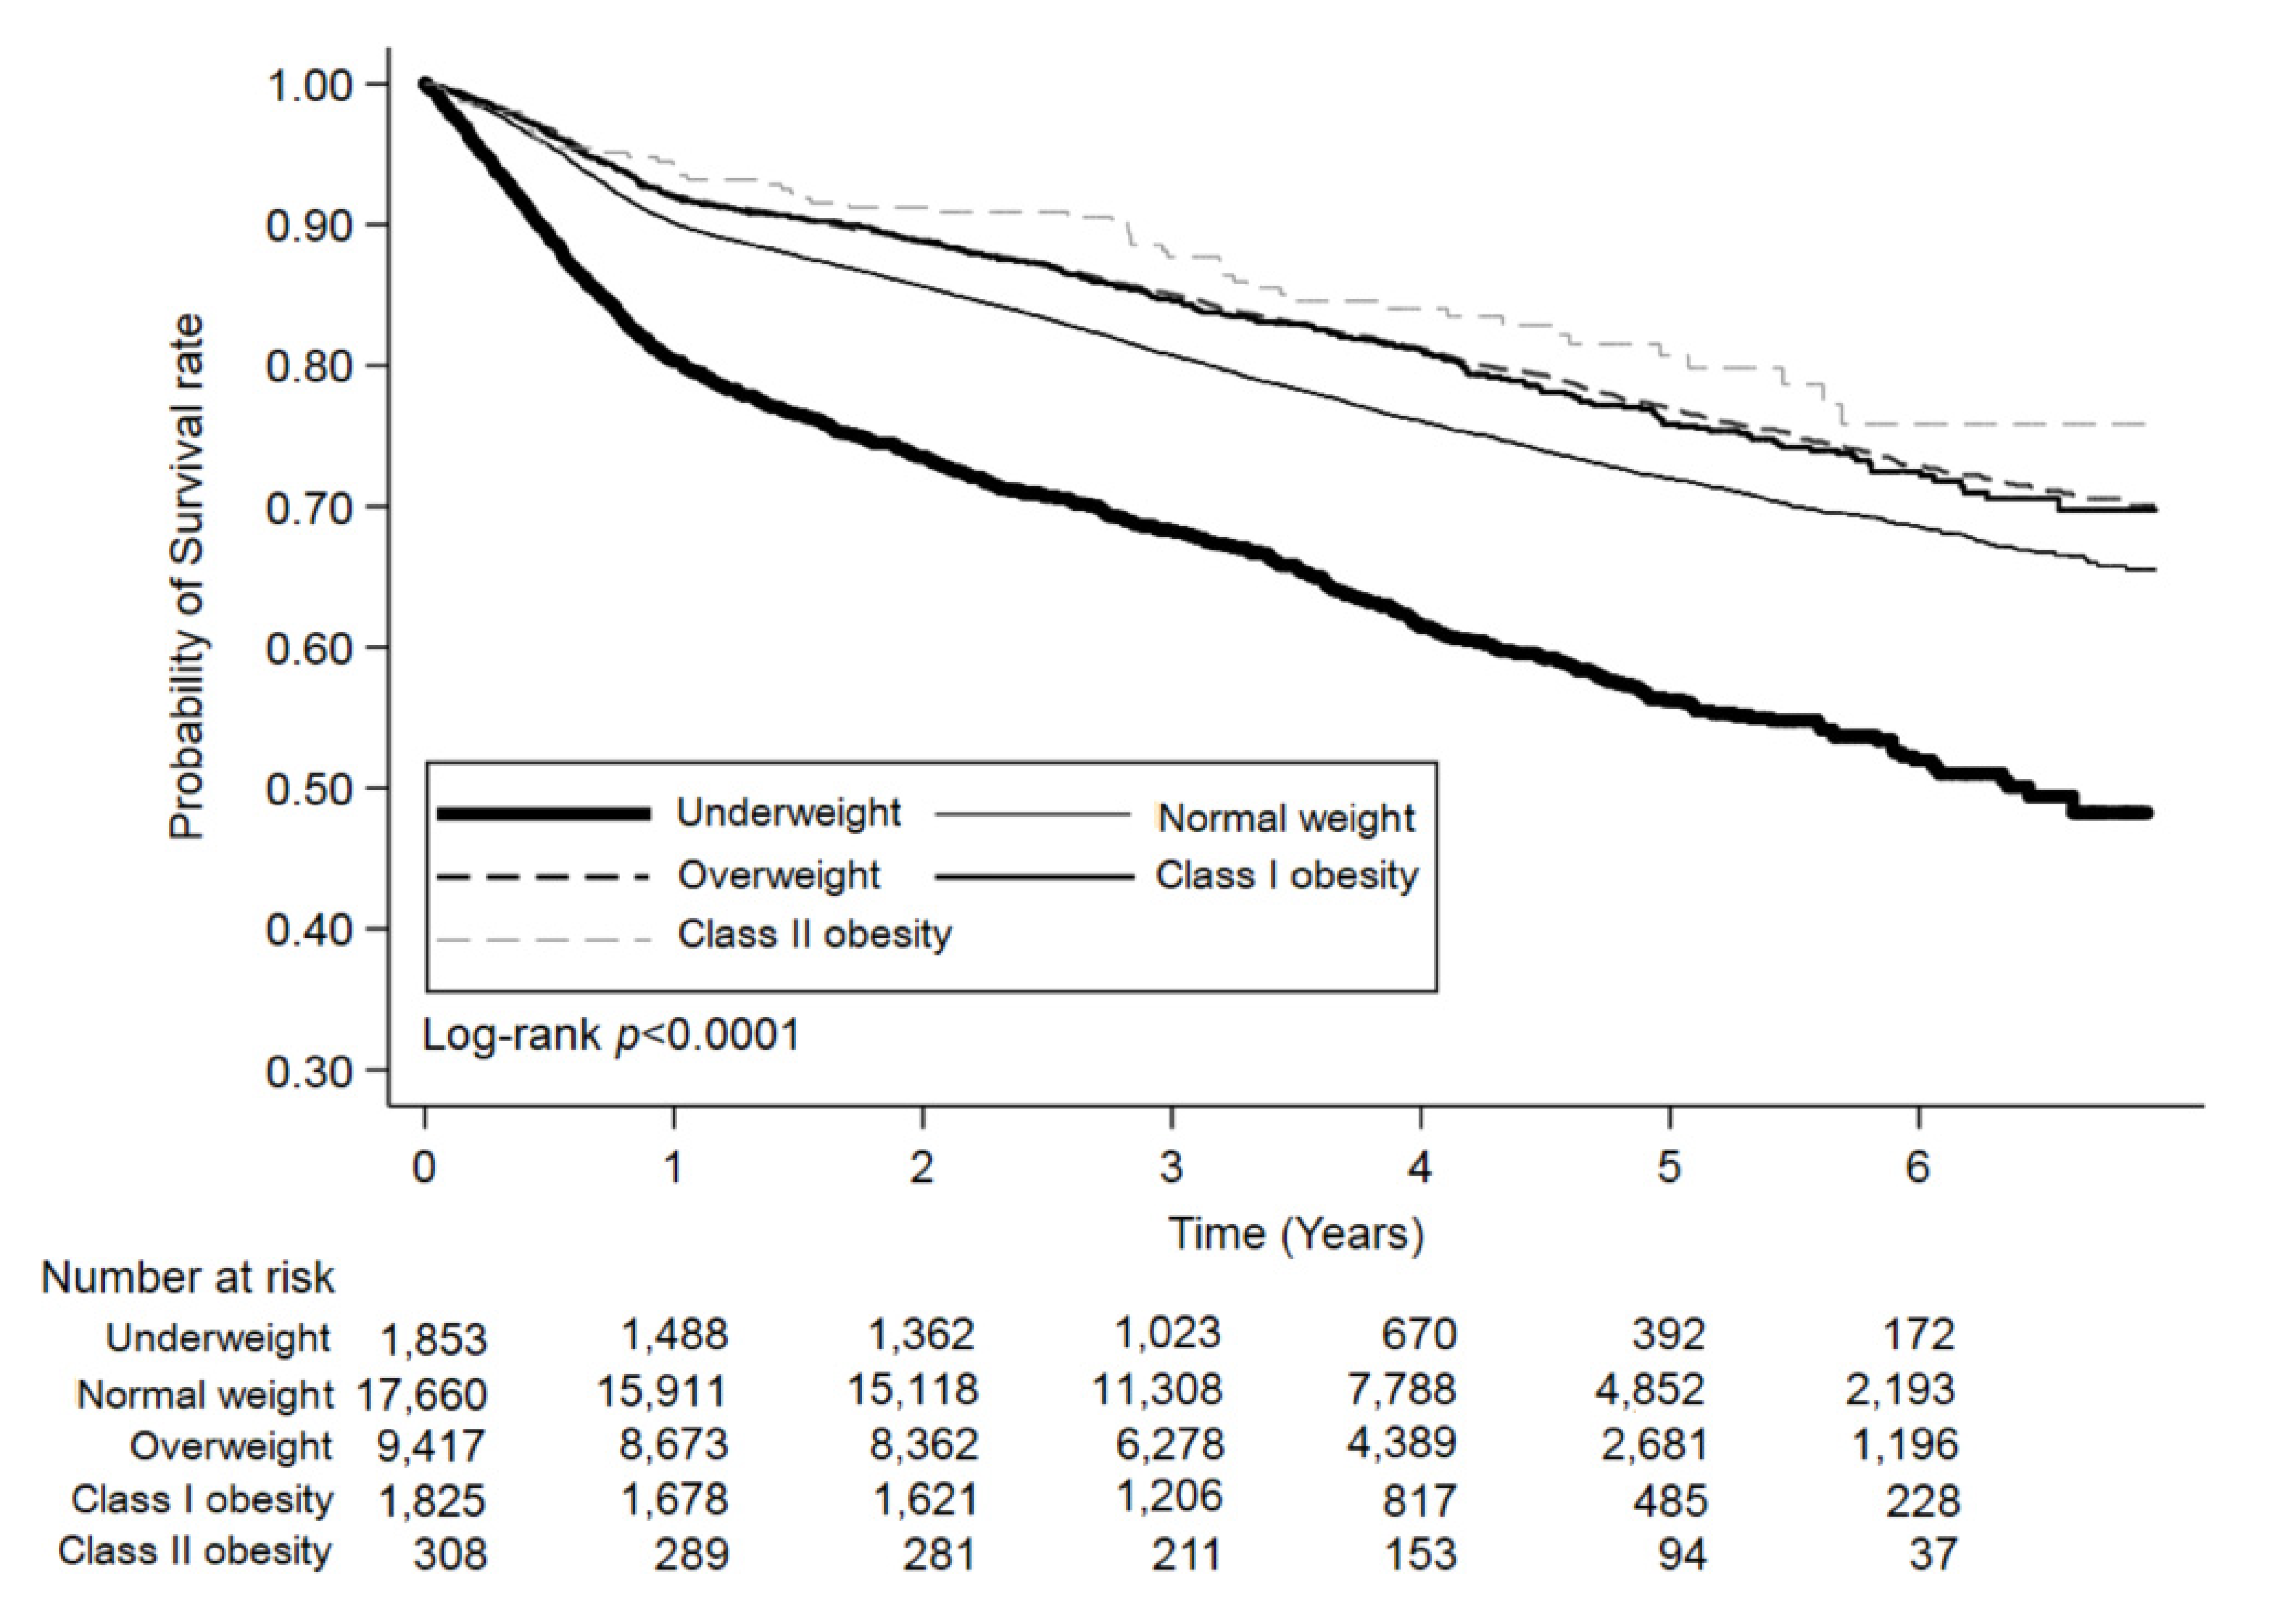
3.4. Stratified Analyses of Disease-Free Survival Rates
3.5. Stratified Analyses of Colorectal-Cancer-Specific Survival Rates
4. Discussion
5. Conclusions
Author Contributions
Funding
Institutional Review Board Statement
Informed Consent Statement
Data Availability Statement
Acknowledgments
Conflicts of Interest
References
- Ferlay, J.; Soerjomataram, I.; Dikshit, R.; Eser, S.; Mathers, C.; Rebelo, M.; Parkin, D.M.; Forman, D.; Bray, F. Cancer incidence and mortality worldwide: Sources, methods and major patterns in GLOBOCAN 2012. Int. J. Cancer 2015, 136, E359–E386. [Google Scholar] [CrossRef] [PubMed]
- Whitlock, K.; Gill, R.S.; Birch, D.W.; Karmali, S. The Association between Obesity and Colorectal Cancer. Gastroenterol. Res. Pr. 2012, 2012, 1–6. [Google Scholar] [CrossRef]
- Sung, J.J.; Lau, J.Y.; Goh, K.; Leung, W.K. Increasing incidence of colorectal cancer in Asia: Implications for screening. Lancet Oncol. 2005, 6, 871–876. [Google Scholar] [CrossRef]
- Martinez-Useros, J.; Garcia-Foncillas, J. Obesity and colorectal cancer: Molecular features of adipose tissue. J. Transl. Med. 2016, 14, 1–12. [Google Scholar] [CrossRef] [Green Version]
- Aparicio, T.; Ducreux, M.; Faroux, R.; Barbier, E.; Manfredi, S.; Lecomte, T.; Etienne, P.-L.; Bedenne, L.; Bennouna, J.; Phelip, J.-M.; et al. Overweight is associated to a better prognosis in metastatic colorectal cancer: A pooled analysis of FFCD trials. Eur. J. Cancer 2018, 98, 1–9. [Google Scholar] [CrossRef] [Green Version]
- Vrieling, A.; Kampman, E. The role of body mass index, physical activity, and diet in colorectal cancer recurrence and survival: A review of the literature. Am. J. Clin. Nutr. 2010, 92, 471–490. [Google Scholar] [CrossRef]
- Harriss, D.J.; Atkinson, G.; George, K.; Cable, N.T.; Reilly, T.; Haboubi, N.; Zwahlen, M.; Egger, M.; Renehan, A. The C-CLEAR group Lifestyle factors and colorectal cancer risk (1): Systematic review and meta-analysis of associations with body mass index. Color. Dis. 2009, 11, 547–563. [Google Scholar] [CrossRef] [PubMed]
- Ma, Y.; Yang, Y.; Wang, F.; Zhang, P.; Shi, C.; Zou, Y.; Qin, H. Obesity and Risk of Colorectal Cancer: A Systematic Review of Prospective Studies. PLoS ONE 2013, 8, e53916. [Google Scholar] [CrossRef] [PubMed] [Green Version]
- Baade, P.D.; Meng, X.; Youl, P.H.; Aitken, J.; Dunn, J.; Chambers, S.K. The Impact of Body Mass Index and Physical Activity on Mortality among Patients with Colorectal Cancer in Queensland, Australia. Cancer Epidemiol. Biomark. Prev. 2011, 20, 1410–1420. [Google Scholar] [CrossRef] [Green Version]
- Kuiper, J.G.; Phipps, A.I.; Neuhouser, M.L.; Chlebowski, R.T.; Thomson, C.A.; Irwin, M.L.; Lane, R.S.; Wactawski-Wende, J.; Hou, L.; Jackson, R.D.; et al. Recreational physical activity, body mass index, and survival in women with colorectal cancer. Cancer Causes Control 2012, 23, 1939–1948. [Google Scholar] [CrossRef] [PubMed] [Green Version]
- Meyerhardt, J.A.; Tepper, J.E.; Niedzwiecki, D.; Hollis, D.R.; McCollum, A.D.; Brady, D.; O’Connell, M.J.; Mayer, R.J.; Cum-mings, B.; Willett, C.; et al. Impact of body mass index on outcomes and treatment-related toxicity in patients with stage II and III rectal cancer: Findings from Intergroup Trial 0114. J. Clin. Oncol. 2004, 22, 648–657. [Google Scholar] [CrossRef]
- Meyerhardt, J.A.; Catalano, P.J.; Haller, D.G.; Mayer, R.J.; Benson, A.B., 3rd; Macdonald, J.S.; Fuchs, C.S. Influence of body mass index on outcomes and treatment-related toxicity in patients with colon carcinoma. Cancer 2003, 98, 484–495. [Google Scholar] [CrossRef] [PubMed]
- Meyerhardt, J.A.; Niedzwiecki, D.; Hollis, D.; Saltz, L.; Mayer, R.J.; Nelson, H.; Whittom, R.; Hantel, A.; Thomas, J.; Fuchs, C.S. Impact of Body Mass Index and Weight Change After Treatment on Cancer Recurrence and Survival in Patients with Stage III Colon Cancer: Findings From Cancer and Leukemia Group B 89803. J. Clin. Oncol. 2008, 26, 4109–4115. [Google Scholar] [CrossRef] [Green Version]
- Lee, J.; Meyerhardt, J.A.; Giovannucci, E.; Jeon, J.Y. Association between Body Mass Index and Prognosis of Colorectal Cancer: A Meta-Analysis of Prospective Cohort Studies. PLoS ONE 2015, 10, e0120706. [Google Scholar] [CrossRef] [PubMed] [Green Version]
- Ma, R.C.; Chan, J. Type 2 diabetes in East Asians: Similarities and differences with populations in Europe and the United States. Ann. N. Y. Acad. Sci. 2013, 1281, 64–91. [Google Scholar] [CrossRef] [PubMed] [Green Version]
- Min, Y.W.; Kim, S.A.; Lee, J.H.; Kim, J.Y.; Chang, D.K.; Rhee, P.L.; Kim, J.J.; Rhee, J.C.; Kim, Y.H. Overweight is associated with a favorable survival in patients with colorectal cancer: A prospective cohort study in an Asian population. Ann. Surg. Oncol. 2012, 19, 3460–3464. [Google Scholar] [CrossRef] [PubMed]
- Yamamoto, N.; Fujii, S.; Sato, T.; Oshima, T.; Rino, Y.; Kunisaki, C.; Masuda, M.; Imada, T. Impact of body mass index and visceral adiposity on outcomes in colorectal cancer. Asia-Pac. J. Clin. Oncol. 2012, 8, 337–345. [Google Scholar] [CrossRef]
- Liu, D.; Li, Q.; Yang, Z.; Hu, X.; Qian, W.; Du, Y.; Liu, B. Association of body mass index and smoking on outcome of Chinese patients with colorectal cancer. World J. Surg. Oncol. 2013, 11, 271. [Google Scholar] [CrossRef] [Green Version]
- Moon, H.-G.; Ju, Y.-T.; Jeong, C.-Y.; Jung, E.-J.; Lee, Y.-J.; Hong, S.-C.; Ha, W.-S.; Park, S.-T.; Choi, S.-K. Visceral Obesity May Affect Oncologic Outcome in Patients with Colorectal Cancer. Ann. Surg. Oncol. 2008, 15, 1918–1922. [Google Scholar] [CrossRef] [PubMed]
- Wang, N.; Khankari, N.K.; Cai, H.; Li, H.-L.; Yang, G.; Gao, Y.-T.; Xiang, Y.-B.; Shu, X.-O.; Zheng, W. Prediagnosis body mass index and waist-hip circumference ratio in association with colorectal cancer survival. Int. J. Cancer 2016, 140, 292–301. [Google Scholar] [CrossRef] [Green Version]
- Ho, C.-H.; Cheng, K.-C.; Chao, C.-M.; Lai, C.-C.; Chiang, S.-R.; Chen, C.-M.; Liao, K.-M.; Wang, J.-J.; Lee, P.-H.; Hung, C.-M.; et al. Does radiotherapy increase the risk of colorectal cancer among prostate cancer patients? A large population-based study. J. Cancer 2020, 11, 6204–6212. [Google Scholar] [CrossRef]
- Daniel, C.R.; Shu, X.; Ye, Y.; Gu, J.; Raju, G.S.; Kopetz, S.; Wu, X. Severe obesity prior to diagnosis limits survival in colorectal cancer patients evaluated at a large cancer centre. Br. J. Cancer 2015, 114, 103–109. [Google Scholar] [CrossRef] [PubMed]
- Finucane, M.M.; Stevens, G.A.; Cowan, M.J.; Danaei, G.; Lin, J.K.; Paciorek, C.J.; Singh, G.M.; Gutierrez, H.R.; Lu, Y.; Bahalim, A.N.; et al. National, regional, and global trends in body-mass index since 1980: Systematic analysis of health examination surveys and epidemiological studies with 960 country-years and 9.1 million participants. Lancet 2011, 377, 557–567. [Google Scholar] [CrossRef] [Green Version]
- Larsson, S.C.; Wolk, A. Obesity and colon and rectal cancer risk: A meta-analysis of prospective studies. Am. J. Clin. Nutr. 2007, 86, 556–565. [Google Scholar] [CrossRef] [PubMed] [Green Version]
- Hines, R.B.; Shanmugam, C.; Waterbor, J.W.; McGwin, G.; Funkhouser, E.; Coffey, C.S.; Posey, J.; Manne, U. Effect of Comorbidity and Body Mass Index on Colon Cancer Survival of African American and Caucasian Patients. Cancer 2009, 115, 5798–5806. [Google Scholar] [CrossRef] [PubMed] [Green Version]
- Sinicrope, F.A.; Foster, N.R.; Sargent, D.; O’Connell, M.J.; Rankin, C. Obesity Is an Independent Prognostic Variable in Colon Cancer Survivors. Clin. Cancer Res. 2010, 16, 1884–1893. [Google Scholar] [CrossRef] [Green Version]
- Renehan, A.G.; Roberts, D.; Dive, C. Obesity and cancer: Pathophysiological and biological mechanisms. Arch. Physiol. Biochem. 2008, 114, 71–83. [Google Scholar] [CrossRef] [PubMed]
- Larsson, S.C.; Orsini, N.; Wolk, A. Diabetes Mellitus and Risk of Colorectal Cancer: A Meta-Analysis. J. Natl. Cancer Inst. 2005, 97, 1679–1687. [Google Scholar] [CrossRef]
- Merkow, R.P.; Bilimoria, K.Y.; McCarter, M.D.; Bentrem, D.J. Effect of Body Mass Index on Short-Term Outcomes after Colectomy for Cancer. J. Am. Coll. Surg. 2009, 208, 53–61. [Google Scholar] [CrossRef]
- Coussens, L.M.; Werb, Z. Inflammation and cancer. Nature 2002, 420, 860–867. [Google Scholar] [CrossRef]
- Ashrafian, H.; Ahmed, K.; Rowland, S.P.; Patel, V.M.; Gooderham, N.J.; Holmes, E.; Darzi, A.; Athanasiou, T. Metabolic surgery and cancer: Protective effects of bariatric procedures. Cancer 2011, 117, 1788–1799. [Google Scholar] [CrossRef]
- Trevisan, M.; Liu, J.; Muti, P.; Misciagna, G.; Menotti, A.; Fucci, F.; Trevisan, M.; Liu, J.; Muti, P.; Misciagna, G.; et al. Markers of insulin resistance and colorectal cancer mortality. Cancer Epidemiol. Biomark. Prev. 2001, 10, 937–941. [Google Scholar]
- Guo, Y.S.; Narayan, S.; Yallampalli, C.; Singh, P. Characterization of insulin like growth factor I receptors in human colon cancer. Gastroenterology 1992, 102, 1101–1108. [Google Scholar] [CrossRef]
- Ogino, S.; Nosho, K.; Meyerhardt, J.A.; Kirkner, G.J.; Chan, A.T.; Kawasaki, T.; Giovannucci, E.L.; Loda, M.; Fuchs, C.S. Cohort Study of Fatty Acid Synthase Expression and Patient Survival in Colon Cancer. J. Clin. Oncol. 2008, 26, 5713–5720. [Google Scholar] [CrossRef] [PubMed]
- Menendez, J.; Lupu, R. Fatty acid synthase and the lipogenic phenotype in cancer pathogenesis. Nat. Rev. Cancer 2007, 7, 763–777. [Google Scholar] [CrossRef]
- Kroenke, C.H.; Neugebauer, R.; Meyerhardt, J.; Prado, C.M.; Weltzien, E.; Kwan, M.L.; Xiao, J.; Caan, B. Analysis of Body Mass Index and Mortality in Patients with Colorectal Cancer Using Causal Diagrams. JAMA Oncol. 2016, 2, 1137–1145. [Google Scholar] [CrossRef] [Green Version]
- Flegal, K.M.; Graubard, B.I.; Williamson, D.F.; Gail, M.H. Cause-Specific Excess Deaths Associated with Underweight, Overweight, and Obesity. JAMA 2007, 298, 2028–2037. [Google Scholar] [CrossRef] [PubMed] [Green Version]
- Orpana, H.M.; Berthelot, J.M.; Kaplan, M.S.; Feeny, D.H.; McFarland, B.; Ross, N.A. BMI and mortality: Results from a national longitudinal study of Canadian adults. Obesity 2010, 18, 214–218. [Google Scholar] [CrossRef] [PubMed]
- Campbell, P.T.; Newton, C.C.; Dehal, A.N.; Jacobs, E.J.; Patel, A.V.; Gapstur, S.M. Impact of Body Mass Index on Survival After Colorectal Cancer Diagnosis: The Cancer Prevention Study-II Nutrition Cohort. J. Clin. Oncol. 2012, 30, 42–52. [Google Scholar] [CrossRef] [PubMed]
- Vasunilashorn, S.; Kim, J.K.; Crimmins, E.M. International differences in the links between obesity and physiological dysregulation: The United States, England, and Taiwan. J. Obes. 2013, 2013, 618056. [Google Scholar] [CrossRef] [PubMed]
- Dignam, J.J.; Polite, B.N.; Yothers, G.; Raich, P.; Colangelo, L.; O’Connell, M.J.; Wolmark, N. Body Mass Index and Outcomes in Patients Who Receive Adjuvant Chemotherapy for Colon Cancer. J. Natl. Cancer Inst. 2006, 98, 1647–1654. [Google Scholar] [CrossRef]
- Sairenchi, T.; Iso, H.; Irie, F.; Fukasawa, N.; Ota, H.; Muto, T. Underweight as a Predictor of Diabetes in Older Adults: A large cohort study. Diabetes Care 2007, 31, 583–584. [Google Scholar] [CrossRef] [Green Version]
- Kenchaiah, S.; Pocock, S.J.; Wang, D.; Finn, P.V.; Zornoff, L.A.M.; Skali, H.; Pfeffer, M.A.; Yusuf, S.; Swedberg, K.; Michelson, E.L.; et al. Body mass index and prognosis in patients with chronic heart failure: Insights from the Candesartan in Heart failure: Assessment of Reduction in Mortality and morbidity (CHARM) program. Circulation 2007, 116, 627–636. [Google Scholar] [CrossRef] [Green Version]
- Cao, C.; Wang, R.; Wang, J.; Bunjhoo, H.; Xu, Y.; Xiong, W. Body Mass Index and Mortality in Chronic Obstructive Pulmonary Disease: A Meta-Analysis. PLoS ONE 2012, 7, e43892. [Google Scholar] [CrossRef] [PubMed]
- Van Vledder, M.G.; Levolger, S.; Ayez, N.; Verhoef, C.; Tran, T.C.K.; Ijzermans, J.N.M. Body composition and outcome in patients undergoing resection of colorectal liver metastases. BJS 2012, 99, 550–557. [Google Scholar] [CrossRef]
- Fearon, K.; Strasser, F.; Anker, S.D.; Bosaeus, I.; Bruera, E.; Fainsinger, R.L.; Jatoi, A.; Loprinzi, C.; MacDonald, N.; Mantovani, G.; et al. Definition and classification of cancer cachexia: An international consensus. Lancet Oncol. 2011, 12, 489–495. [Google Scholar] [CrossRef]
- Polednak, A.P. Estimating the number of U.S. incident cancers attributable to obesity and the impact on temporal trends in incidence rates for obesity-related cancers. Cancer Detect. Prev. 2008, 32, 190–199. [Google Scholar] [CrossRef] [PubMed]
- Slattery, M.L.; Potter, J.; Curtin, K.; Edwards, S.; Ma, K.N.; Anderson, K.; Schaffer, D.; Samowitz, W.S. Estrogens reduce and withdrawal of estrogens increase risk of microsatellite instability-positive colon cancer. Cancer Res. 2001, 61, 126–130. [Google Scholar]
- Power, M.L.; Schulkin, J. Sex differences in fat storage, fat metabolism, and the health risks from obesity: Possible evolutionary origins. Br. J. Nutr. 2008, 99, 931–940. [Google Scholar] [CrossRef]
- Giovannucci, E. Metabolic syndrome, hyperinsulinemia, and colon cancer: A review. Am. J. Clin. Nutr. 2007, 86, 836S–842S. [Google Scholar] [CrossRef] [Green Version]
- Wolpin, B.M.; Meyerhardt, J.A.; Chan, A.T.; Ng, K.; Chan, J.A.; Wu, K.; Pollak, M.N.; Giovannucci, E.L.; Fuchs, C.S. Insulin, the insulin-like growth factor axis, and mortality in patients with nonmetastatic colorectal cancer. J. Clin. Oncol. 2009, 27, 176–185. [Google Scholar] [CrossRef] [PubMed]
- McTiernan, A.; Wu, L.; Chen, C.; Chlebowski, R.; Mossavar-Rahmani, Y.; Modugno, F.; Perri, M.G.; Stanczyk, F.Z.; Van Horn, L.; Wang, C. Relation of BMI and Physical Activity to Sex Hormones in Postmenopausal Women*. Obesity 2006, 14, 1662–1677. [Google Scholar] [CrossRef] [PubMed] [Green Version]
- Terry, P.D.; Miller, A.B.; Rohan, T.E. Obesity and colorectal cancer risk in women. Gut 2002, 51, 191–194. [Google Scholar] [CrossRef] [PubMed] [Green Version]
- Henderson, K.D.; Duan, L.; Sullivan-Halley, J.; Ma, H.; Clarke, C.A.; Neuhausen, S.L.; Templeman, C.; Bernstein, L. Meno-pausal hormone therapy use and risk of invasive colon cancer: The California Teachers Study. Am. J. Epidemiol. 2010, 171, 415–425. [Google Scholar] [CrossRef] [Green Version]
- Sinicrope, F.A.; Foster, N.R.; Yothers, G.; Benson, A.; Seitz, J.F.; Labianca, R.; Goldberg, R.M.; Degramont, A.; O’Connell, M.J.; Sargent, D.J.; et al. Body mass index at diagnosis and survival among colon cancer patients enrolled in clinical trials of adjuvant chemotherapy. Cancer 2013, 119, 1528–1536. [Google Scholar] [CrossRef] [Green Version]
- Russo, A.G.; Franceschi, S.; La Vecchia, C.; Maso, L.D.; Montella, M.; Conti, E.; Giacosa, A.; Falcini, F.; Negri, E. Body size and colorectal-cancer risk. Int. J. Cancer 1998, 78, 161–165. [Google Scholar] [CrossRef]
- Slattery, M.L.; Berry, T.D.; Potter, J.; Caan, B. Diet diversity, diet composition, and risk of colon cancer (United States). Cancer Causes Control. 1997, 8, 872–882. [Google Scholar] [CrossRef]
- Franco, M.; Bilal, U.; Orduñez, P.; Benet, M.; Morejón, A.; Caballero, B.; Kennelly, J.F.; Cooper, R.S. Population-wide weight loss and regain in relation to diabetes burden and cardiovascular mortality in Cuba 1980–2010: Repeated cross sectional surveys and ecological comparison of secular trends. BMJ 2013, 346, f1515. [Google Scholar] [CrossRef] [Green Version]
- Volkova, E.; Willis, J.; Wells, J.E.; Robinson, B.; Dachs, G.U.; Currie, M.J. Association of angiopoietin-2, C-reactive protein and markers of obesity and insulin resistance with survival outcome in colorectal cancer. Br. J. Cancer 2010, 104, 51–59. [Google Scholar] [CrossRef] [Green Version]
- Jeon, J.Y.; Jeong, D.H.; Park, M.G.; Lee, J.-W.; Chu, S.H.; Park, J.-H.; Lee, M.K.; Sato, K.; Ligibel, J.A.; Meyerhardt, J.A.; et al. Impact of Diabetes on Oncologic Outcome of Colorectal Cancer Patients: Colon vs. Rectal Cancer. PLoS ONE 2013, 8, e55196. [Google Scholar] [CrossRef] [Green Version]
- Feinstein, A.R. The pre-therapeutic classification of co-morbidity in chronic disease. J. Chronic Dis. 1970, 23, 455–468. [Google Scholar] [CrossRef]
- De Groot, V.; Beckerman, H.; Lankhorst, G.J.; Bouter, L. How to measure comorbidity: A critical review of available methods. J. Clin. Epidemiol. 2003, 56, 221–229. [Google Scholar] [CrossRef] [Green Version]
- Polite, B.N.; Dignam, J.J.; Olopade, O.I. Colorectal Cancer Model of Health Disparities: Understanding Mortality Differences in Minority Populations. J. Clin. Oncol. 2006, 24, 2179–2187. [Google Scholar] [CrossRef] [PubMed]
- Extermann, M. Measuring comorbidity in older cancer patients. Eur. J. Cancer 2000, 36, 453–471. [Google Scholar] [CrossRef]


| Characteristic | Total (n = 41,015) | <18.50 (n = 2867) | 18.50–24.99 (n = 23,775) | 25.00–29.99 (n = 11,741) | 30.00–34.99 (n = 2246) | ≥35.00 (n = 386) | p-Value |
|---|---|---|---|---|---|---|---|
| Gender, n (%) | |||||||
| Male | 23,230 (56.64) | 1412 (49.25) | 13,261 (55.78) | 7200 (61.32) | 1191 (53.03) | 166 (43.01) | <0.0001 |
| Female | 17,785 (43.36) | 1455 (50.75) | 10,514 (44.22) | 4541 (38.68) | 1055 (46.97) | 220 (56.99) | |
| Age Group, n (%) | |||||||
| <40 | 1349 (3.29) | 154 (5.37) | 758 (3.19) | 309 (2.63) | 98 (4.36) | 30 (7.77) | <0.0001 |
| 40–49 | 3468 (8.46) | 209 (7.29) | 2081 (8.75) | 893 (7.61) | 236 (10.51) | 49 (12.69) | |
| 50–59 | 8737 (21.30) | 472 (16.46) | 4909 (20.65) | 2727 (23.23) | 522 (23.24) | 107 (27.72) | |
| 60–69 | 10,474 (25.54) | 498 (17.37) | 5816 (24.46) | 3395 (28.92) | 658 (29.30) | 107 (27.72) | |
| ≥70 | 16987 (41.42) | 1534 (53.51) | 10,211 (42.95) | 4417 (37.62) | 732 (32.59) | 93 (24.09) | |
| Clinic Stage, n (%) | |||||||
| 0 | 762 (1.82) | 40 (1.40) | 413 (1.74) | 239 (1.89) | 54 (2.40) | 16 (4.15) | <0.0001 |
| 1 | 9220 (22.00) | 448 (15.63) | 4929 (20.73) | 3069 (24.28) | 669 (29.79) | 105 (27.20) | |
| 2 | 8667 (20.68) | 655 (22.85) | 4561 (19.18) | 2957 (23.39) | 406 (18.08) | 88 (22.80) | |
| 3 | 15,203 (36.27) | 1004 (35.02) | 8829 (37.14) | 4468 (35.35) | 786 (35.00) | 116 (30.05) | |
| 4 | 8063 (19.24) | 720 (25.11) | 5043 (21.21) | 1908 (15.09) | 331 (14.74) | 61 (15.80) | |
| Site, n (%) | |||||||
| Malignant neoplasm of colon | 26,153 (63.76) | 1847 (64.42) | 15,293 (64.32) | 7301 (62.18) | 1448 (64.47) | 264 (68.39) | 0.0073 |
| Rectosigmoid junction | 3441 (8.39) | 234 (8.16) | 1975 (8.31) | 1015 (8.64) | 188 (8.37) | 29 (7.51) | |
| Rectum | 11,421 (27.85) | 786 (27.42) | 6507 (27.37) | 3425 (29.17) | 610 (27.16) | 93 (24.09) | |
| Treatment, n (%) | |||||||
| Operation | 37,240 (90.80) | 2401 (83.75) | 21,486 (90.37) | 10,886 (92.72) | 2111 (93.99) | 356 (92.23) | <0.0001 |
| Radiotherapy | 4782 (11.66) | 323 (11.27) | 2827 (11.89) | 1366 (11.63) | 221 (9.84) | 45 (11.66) | 0.0638 |
| Chemotherapy | 24,760 (60.37) | 1572 (54.83) | 14,618 (61.48) | 7063 (60.16) | 1292 (57.52) | 215 (55.70) | <0.0001 |
| Smoking, n (%) | |||||||
| Never | 29,872 (72.83) | 2070 (72.20) | 17,428 (73.30) | 8396 (71.51) | 1675 (74.58) | 303 (78.50) | <0.0001 |
| Quit | 4415 (10.76) | 280 (9.77) | 2447 (10.29) | 1410 (12.01) | 249 (11.09) | 29 (7.51) | |
| Current | 6728 (16.40) | 517 (18.03) | 3900 (16.40) | 1935 (16.48) | 322 (14.34) | 54 (13.99) | |
| Death, n (%) | 15,021 (36.62) | 1617 (56.40) | 9097 (38.26) | 3550 (30.24) | 655 (29.16) | 102 (26.42) | <0.0001 |
| Time to mortality, Median (Q1-Q3) | 1.49 (0.64–2.62) | 0.97 (0.37–2.01) | 1.48 (0.64–2.58) | 1.71 (0.79–2.88) | 1.82 (0.88–2.96) | 1.69 (0.79–2.92) | <0.0001 |
| Death in colon cancer, n (%) | 11,347 (27.67) | 1186 (41.37) | 6911 (29.07) | 2696 (22.96) | 483 (21.50) | 71 (18.39) | <0.0001 |
| Time to specific-mortality, Median (Q1-Q3) | 1.41 (0.61–2.43) | 0.93 (0.33–1.88) | 1.38 (0.60–2.38) | 1.62 (0.77–2.65) | 1.77 (0.88–2.86) | 1.53 (0.76–2.83) | <0.0001 |
| Recurrence, n (%) | 2068 (5.04) | 153 (5.34) | 1218 (5.12) | 576 (4.91) | 106 (4.72) | 15 (3.89) | 0.0016 |
| Time to recurrence, Median (Q1-Q3) | 0.64 (0.44–0.84) | 0.56 (0.41–0.78) | 0.64 (0.44–0.83) | 0.65 (0.45–0.85) | 0.63 (0.46–0.85) | 0.69 (0.41–1.00) | 0.0402 |
| Comorbidity, n (%) | |||||||
| Myocardial infarction | 482 (1.18) | 41 (1.43) | 238 (1.00) | 164 (1.40) | 35 (1.56) | 4 (1.01) | 0.0035 |
| Congestive heart failure | 1977 (4.82) | 152 (5.30) | 1044 (4.39) | 588 (5.01) | 167 (7.44) | 26 (6.74) | <0.0001 |
| Peripheral vascular disease | 752 (1.83) | 51 (1.78) | 433 (1.82) | 219 (1.87) | 41 (1.83) | 8 (2.07) | 0.9924 |
| Cardiovascular disease | 3396 (8.28) | 289 (10.08) | 1975 (8.31) | 930 (7.92) | 184 (8.19) | 18 (4.66) | 0.0003 |
| Dementia | 921 (2.25) | 161 (5.62) | 569 (2.39) | 170 (1.45) | 20 (0.89) | 1 (0.26) | <0.0001 |
| COPD | 3339 (8.14) | 307 (10.71) | 1816 (7.64) | 951 (8.10) | 213 (9.48) | 52 (13.47) | <0.0001 |
| Rheumatic disease | 432 (1.05) | 33 (1.15) | 261 (1.10) | 121 (1.03) | 13 (0.58) | 4 (1.04) | 0.2289 |
| peptic ulcer disease | 5966 (14.55) | 514 (17.93) | 3462 (14.56) | 1625 (13.84) | 297 (13.22) | 68 (17.62) | <0.0001 |
| Mild liver disease | 3151 (7.68) | 196 (6.84) | 1702 (7.16) | 1006 (8.57) | 212 (9.44) | 35 (9.07) | <0.0001 |
| Diabetes without chronic complication | 8805 (21.47) | 362 (12.63) | 4630 (19.47) | 2992 (25.48) | 682 (30.37) | 139 (36.01) | <0.0001 |
| Diabetes with chronic complication | 2180 (5.32) | 77 (2.69) | 1123 (4.72) | 762 (6.49) | 184 (8.19) | 34 (8.81) | <0.0001 |
| Hemiplegia or paraplegia | 287 (0.70) | 27 (0.94) | 175 (0.74) | 70 (0.60) | 12 (0.53) | 3 (0.78) | 0.2313 |
| Renal disease | 2188 (5.33) | 144 (5.02) | 1244 (5.23) | 635 (5.41) | 146 (6.50) | 19 (4.92) | 0.1187 |
| Moderate or severe liver disease | 157 (0.38) | 8 (0.28) | 89 (0.37) | 48 (0.41) | 11 (0.49) | 1 (0.26) | 0.7557 |
| Grade, n (%) | |||||||
| 1. Well differentiated | 3266 (7.96) | 191 (6.66) | 1859 (7.96) | 974 (8.30) | 202 (8.99) | 40 (10.36) | <0.0001 |
| 2. Moderately differentiated | 33,134 (80.79) | 2312 (80.64) | 19,139 (80.38) | 9571 (81.52) | 1811 (80.63) | 301 (77.98) | |
| 3. Poorly differentiated | 3734 (9.10) | 285 (9.94) | 2268 (9.53) | 969 (8.25) | 176 (7.84) | 36 (9.33) | |
| 4. Undifferentiated | 393 (0.96) | 33 (1.15) | 234 (0.98) | 103 (0.88) | 20 (0.89) | 3 (0.78) | |
| 5. Others | 488 (1.19) | 46 (1.60) | 275 (1.15) | 124 (1.06) | 37 (1.65) | 6 (1.55) | |
| Characteristic | Patient (n = 41015) | Event (n = 15021) | Age-, Gender-Adjusted HR | p-Value | Age-, Gender-,Stage- Adjusted HR | p-Value | Multivariable-Adjusted HR † | p-Value |
|---|---|---|---|---|---|---|---|---|
| Overall Survival | ||||||||
| BMI WHO Categories, n (%) | ||||||||
| <18.50 | 2867 | 1617 (56.40) | 1.76 (1.67–1.85) | <0.0001 | 1.68 (1.59–1.77) | <0.0001 | 1.61 (1.53–1.70) | <0.0001 |
| 18.50–24.99 | 23,775 | 9097 (38.26) | Ref. | Ref. | Ref. | |||
| 25.00–29.99 | 11,741 | 3550 (30.24) | 0.75 (0.72–0.78) | <0.0001 | 0.82 (0.79–0.86) | <0.0001 | 0.82 (0.79–0.85) | <0.0001 |
| 30.00–34.99 | 2246 | 655 (29.16) | 0.76 (0.71–0.83) | <0.0001 | 0.87 (0.80–0.94) | <0.0001 | 0.83 (0.77–0.90) | <0.0001 |
| ≥35.00 | 386 | 102 (26.42) | 0.73 (0.60–0.89) | 0.0018 | 0.83 (0.68–1.01) | <0.0001 | 0.74 (0.61–0.90) | 0.0027 |
| CRC-Specific Survival | ||||||||
| BMI WHO Categories, n (%) | ||||||||
| <18.50 | 2867 | 1186 (41.37) | 1.69 (1.59–1.79) | <0.0001 | 1.59 (1.50–1.69) | <0.0001 | 1.52 (1.43–1.62) | <0.0001 |
| 18.50–24.99 | 23,775 | 6911 (29.07) | Ref. | Ref. | Ref. | |||
| 25.00–29.99 | 11,741 | 2696 (22.96) | 0.75 (0.72–0.79) | <0.0001 | 0.85 (0.81–0.88) | <0.0001 | 0.85 (0.81–0.89) | <0.0001 |
| 30.00–34.99 | 2246 | 483 (21.50) | 0.73 (0.66–0.80) | <0.0001 | 0.86 (0.79–0.95) | 0.0015 | 0.85 (0.78–0.94) | 0.0009 |
| ≥35.00 | 386 | 71 (18.39) | 0.64 (0.50–0.80) | 0.0001 | 0.74 (0.59–0.94) | 0.0119 | 0.69 (0.54–0.87) | 0.0017 |
| Disease Free Survival # | ||||||||
| BMI WHO categories, n (%) | ||||||||
| <18.50 | 1853 | 737 (39.77) | 1.73 (1.60–1.87) | <0.0001 | 1.71 (1.58–1.85) | <0.0001 | 1.75 (1.62–1.89) | <0.0001 |
| 18.50–24.99 | 17,660 | 4454 (25.22) | Ref. | Ref. | Ref. | |||
| 25.00–29.99 | 9417 | 1932 (20.52) | 0.81 (0.77–0.85) | <0.0001 | 0.83 (0.78–0.87) | <0.0001 | 0.81 (0.77–0.86) | <0.0001 |
| 30.00–34.99 | 1825 | 381 (20.88) | 0.89 (0.80–0.99) | 0.0329 | 0.94 (0.84–1.04) | 0.2212 | 0.87 (0.79–0.97) | 0.0122 |
| ≥35.00 | 308 | 53 (17.21) | 0.79 (0.60–1.03) | 0.0797 | 0.83 (0.64–1.09) | 0.1852 | 0.75 (0.57–0.98) | 0.0351 |
| Characteristic | BMI WHO Categories | ||||
|---|---|---|---|---|---|
| <18.50 | 18.50–24.99 | 25.00–29.99 | 30.00–34.99 | ≥35.00 | |
| Age Group | |||||
| <40, No | 154 | 758 | 309 | 98 | 30 |
| Event, No | 51 | 251 | 85 | 34 | 9 |
| HR (95% CI) | 0.96 (0.70–1.31) | Ref. | 0.96 (0.74–1.24) | 1.14 (0.79–1.65) | 0.69 (0.35–1.37) |
| 40–49, No | 209 | 2081 | 893 | 236 | 49 |
| Event, No | 86 | 595 | 238 | 48 | 9 |
| HR (95% CI) | 1.23 (0.98–1.54) | Ref. | 1.03 (0.88–1.20) | 0.81 (0.60–1.09) | 0.77 (0.40–1.50) |
| 50–59, No | 472 | 4909 | 2727 | 522 | 107 |
| Event, No | 194 | 1407 | 638 | 127 | 25 |
| HR (95% CI) | 1.49 (1.28–1.73) ** | Ref. | 0.84 (0.76–0.92) * | 1.01 (0.84–1.22) | 0.76 (0.51–1.14) |
| 60–69, No | 498 | 5816 | 3395 | 658 | 107 |
| Event, No | 237 | 1728 | 821 | 149 | 20 |
| HR (95% CI) | 1.85 (1.61–2.13) ** | Ref. | 0.90 (0.83–0.98) * | 0.88 (0.75–1.05) | 0.85 (0.55–1.32) |
| ≥70, No | 1534 | 10,211 | 4417 | 732 | 93 |
| Event, No | 1049 | 5116 | 1768 | 297 | 39 |
| HR (95% CI) | 1.62 (1.51–1.73) ** | Ref. | 0.77 (0.73–0.81) ** | 0.77 (0.69–0.87) ** | 0.75 (0.54–1.02) |
| Gender | |||||
| Male, No | 1412 | 13,261 | 7200 | 1191 | 166 |
| Event, No | 888 | 5436 | 2210 | 361 | 46 |
| HR (95% CI) | 1.72 (1.60–1.85) ** | Ref. | 0.79 (0.75–0.83) ** | 0.84 (0.76–0.94) * | 0.79 (0.59–1.06) |
| Female, No | 1455 | 10,514 | 4541 | 1055 | 220 |
| Event, No | 729 | 3661 | 1340 | 294 | 56 |
| HR (95% CI) | 1.48 (1.36–1.60) ** | Ref. | 0.85 (0.80–0.91) ** | 0.81 (0.72–0.92) * | 0.69 (0.53–0.90) * |
| Clinic Stage | |||||
| Stage 0, No | 40 | 413 | 239 | 54 | 16 |
| Event, No | 18 | 57 | 15 | 3 | 1 |
| HR (95% CI) | 3.72 (1.95–7.11) ** | Ref. | 0.45 (0.25–0.82) * | 0.32 (0.09–1.09) | 0.43 (0.05–3.53) |
| Stage 1, No | 448 | 4929 | 3069 | 669 | 105 |
| Event, No | 171 | 937 | 412 | 102 | 13 |
| HR (95% CI) | 2.23 (1.88–2.64) ** | Ref. | 0.69 (0.61–0.78) ** | 0.85 (0.69–1.04) | 0.72 (0.41–1.24) |
| Stage 2, No | 655 | 4561 | 2957 | 406 | 88 |
| Event, No | 321 | 1340 | 483 | 87 | 18 |
| HR (95% CI) | 1.94 (1.71–2.19) ** | Ref. | 0.74 (0.67–0.82) ** | 0.72 (0.58–0.89) * | 0.75 (0.47–1.21) |
| Stage 3, No | 1004 | 8829 | 4468 | 786 | 116 |
| Event, No | 487 | 2699 | 1144 | 206 | 29 |
| HR (95% CI) | 1.85 (1.68–2.04) ** | Ref. | 0.82 (0.77–0.88) ** | 0.88 (0.76–1.01) | 0.90 (0.62–1.30) |
| Stage 4, No | 720 | 5043 | 1908 | 331 | 61 |
| Event, No | 620 | 4064 | 1496 | 257 | 41 |
| HR (95% CI) | 1.23 (1.13–1.34) ** | Ref. | 0.90 (0.85–0.96) * | 0.90 (0.79–1.02) | 0.68 (0.50–0.93) * |
| Site | |||||
| Malignant neoplasm of colon, No | 1847 | 15,293 | 7301 | 1448 | 264 |
| Event, No | 1018 | 5853 | 2215 | 428 | 72 |
| HR (95% CI) | 1.56 (1.46–1.67) ** | Ref. | 0.82 (0.78–0.86) ** | 0.84 (0.76–0.93) * | 0.84 (0.67–1.06) |
| Rectosigmoid junction, No | 234 | 1975 | 1015 | 188 | 29 |
| Event, No | 137 | 757 | 294 | 53 | 5 |
| HR (95% CI) | 1.66 (1.38–2.01) ** | Ref. | 0.81 (0.71–0.93) * | 0.79 (0.60–1.05) | 0.32 (0.13–0.78) * |
| Rectum, No | 786 | 6507 | 3425 | 610 | 93 |
| Event, No | 462 | 2487 | 1041 | 174 | 25 |
| HR (95% CI) | 1.78 (1.61–1.97) ** | Ref. | 0.82 (0.76–0.88) ** | 0.83 (0.71–0.97) * | 0.70 (0.47–1.03) |
| Characteristic | WHO Categories | ||||
|---|---|---|---|---|---|
| <18.50 | 18.50–24.99 | 25.00–29.99 | 30.00–34.99 | ≥35.00 | |
| Age Group | |||||
| <40, No | 104 | 528 | 233 | 73 | 24 |
| Event, No | 18 | 84 | 38 | 16 | 4 |
| HR (95% CI) | 1.06 (0.63–1.79) | Ref. | 1.05 (0.71–1.57) | 1.41 (0.81–2.44) | 0.86 (0.30–2.42) |
| 40–49, No | 142 | 1561 | 696 | 193 | 37 |
| Event, No | 33 | 232 | 105 | 28 | 2 |
| HR (95% CI) | 1.30 (0.89–1.90) | Ref. | 1.07 (0.84–1.36) | 0.95 (0.64–1.42) | 0.35 (0.09–1.42) |
| 50–59, No | 337 | 3760 | 2221 | 436 | 86 |
| Event, No | 83 | 629 | 325 | 75 | 14 |
| HR (95% CI) | 1.50 (1.19–1.90) * | Ref. | 0.88 (0.77–1.00) * | 1.05 (0.82–1.34) | 1.05 (0.61–1.80) |
| 60–69, No | 330 | 4498 | 2842 | 554 | 89 |
| Event, No | 95 | 796 | 446 | 88 | 11 |
| HR (95% CI) | 1.92 (1.55–2.38) ** | Ref. | 0.88 (0.79–0.99) * | 0.92 (0.74–1.15) | 0.76 (0.42–1.37) |
| ≥70, No | 940 | 7313 | 3425 | 569 | 72 |
| Event, No | 508 | 2713 | 1018 | 174 | 22 |
| HR (95% CI) | 1.79 (1.62–1.97) ** | Ref. | 0.75 (0.70–0.81) ** | 0.79 (0.67–0.92) * | 0.73 (0.48–1.11) |
| Gender | |||||
| Male, No | 878 | 9721 | 5728 | 970 | 139 |
| Event, No | 423 | 2725 | 1165 | 209 | 29 |
| HR (95% CI) | 1.88 (1.70–2.09) ** | Ref. | 0.75 (0.70–0.80) ** | 0.84 (0.73–0.97) * | 0.82 (0.57–1.19) |
| Female, No | 975 | 7939 | 3689 | 855 | 169 |
| Event, No | 314 | 1729 | 767 | 172 | 24 |
| HR (95% CI) | 1.59 (1.41–1.80) ** | Ref. | 0.92 (0.85–1.00) * | 0.93 (0.79–1.08) | 0.71 (0.47–1.06) |
| Clinic Stage | |||||
| Stage 0, No | 34 | 385 | 223 | 49 | 15 |
| Event, No | 12 | 49 | 14 | 2 | 1 |
| HR (95% CI) | 3.24 (1.52–6.90) * | Ref. | 0.41 (0.22–0.77) * | 0.20 (0.04–0.93) * | 0.27 (0.03–2.35) |
| Stage 1, No | 388 | 4619 | 2906 | 641 | 96 |
| Event, No | 128 | 818 | 365 | 100 | 9 |
| HR (95% CI) | 2.06 (1.70–2.49) ** | Ref. | 0.69 (0.61–0.78) ** | 0.92 (0.74–1.13) | 0.56 (0.29–1.07) |
| Stage 2, No | 540 | 4065 | 1880 | 371 | 80 |
| Event, No | 232 | 1082 | 417 | 76 | 18 |
| HR (95% CI) | 1.85 (1.61–2.14) ** | Ref. | 0.78 (0.70–0.88) ** | 0.75 (0.59–0.94) * | 0.95 (0.60–1.52) |
| Stage 3, No | 798 | 7780 | 4055 | 703 | 101 |
| Event, No | 319 | 2130 | 988 | 177 | 20 |
| HR (95% CI) | 1.64 (1.46–1.85) ** | Ref. | 0.88 (0.81–0.95) * | 0.94 (0.81–1.10) | 0.77 (0.50–1.20) |
| Stage 4, No | 93 | 811 | 353 | 61 | 16 |
| Event, No | 46 | 375 | 148 | 26 | 5 |
| HR (95% CI) | 1.23 (0.90–1.68) | Ref. | 0.89 (0.73–1.08) | 0.85 (0.57–1.27) | 0.68 (0.28–1.69) |
| Site | |||||
| Malignant neoplasm of colon, No | 1248 | 11397 | 5850 | 1169 | 212 |
| Event, No | 492 | 2856 | 1156 | 233 | 39 |
| HR (95% CI) | 1.69 (1.54–1.87) ** | Ref. | 0.78 (0.73–0.84) ** | 0.83 (0.73–0.96) * | 0.89 (0.65–1.23) |
| Rectosigmoid junction, No | 151 | 1480 | 851 | 147 | 26 |
| Event, No | 67 | 372 | 192 | 28 | 3 |
| HR (95% CI) | 1.99 (1.53–2.60) ** | Ref. | 0.91 (0.76–1.09) | 0.81 (0.55–1.19) | 0.21 (0.06–0.67) * |
| Rectum, No | 454 | 4783 | 2716 | 509 | 70 |
| Event, No | 178 | 1226 | 584 | 120 | 11 |
| HR (95% CI) | 1.83 (1.56–2.15) ** | Ref. | 0.84 (0.76–0.93) * | 1.00 (0.83–1.20) | 0.65 (0.36–1.18) |
| Characteristic | WHO Categories | ||||
|---|---|---|---|---|---|
| <18.50 | 18.50–24.99 | 25.00–29.99 | 30.00–34.99 | ≥35.00 | |
| Age Group | |||||
| <40, No | 154 | 758 | 309 | 98 | 30 |
| Event, No | 49 | 236 | 79 | 31 | 9 |
| HR (95% CI) | 1.00 (0.73–1.38) | Ref. | 0.94 (0.72–1.23) | 1.11 (0.75–1.64) | 0.76 (0.38–1.50) |
| 40–49, No | 209 | 2081 | 893 | 236 | 49 |
| Event, No | 78 | 543 | 218 | 41 | 6 |
| HR (95% CI) | 1.24 (0.97–1.57) | Ref. | 1.06 (0.90–1.24) | 0.82 (0.59–1.13) | 0.57 (0.25–1.27) |
| 50–59, No | 472 | 4909 | 2727 | 522 | 107 |
| Event, No | 158 | 1214 | 547 | 101 | 19 |
| HR (95% CI) | 1.38 (1.17–1.64) * | Ref. | 0.87 (0.78–0.96) * | 1.04 (0.85–1.28) | 0.68 (0.43–1.08) |
| 60–69, No | 498 | 5816 | 3395 | 658 | 107 |
| Event, No | 183 | 1370 | 644 | 117 | 12 |
| HR (95% CI) | 1.76 (1.51–2.06) ** | Ref. | 0.94 (0.86–1.04) | 0.96 (0.79–1.16) | 0.73 (0.41–1.29) |
| ≥70, No | 1534 | 10,211 | 4417 | 732 | 93 |
| Event, No | 718 | 3548 | 1208 | 193 | 25 |
| HR (95% CI) | 1.54 (1.42–1.67) ** | Ref. | 0.79 (0.74–0.84) ** | 0.76 (0.66–0.88) * | 0.74 (0.50–1.10) |
| Gender | |||||
| Male, No | 1412 | 13261 | 7200 | 1191 | 166 |
| Event, No | 616 | 3973 | 1678 | 252 | 28 |
| HR (95% CI) | 1.62 (1.49–1.77) ** | Ref. | 0.84 (0.80–0.89) ** | 0.85 (0.75–0.97) * | 0.69 (0.47–1.00) * |
| Female, No | 1455 | 10,514 | 4541 | 1055 | 220 |
| Event, No | 570 | 2938 | 1018 | 231 | 43 |
| HR (95% CI) | 1.43 (1.30–1.56) ** | Ref. | 0.85 (0.79–0.92) ** | 0.84 (0.74–0.96) * | 0.67 (0.49–0.90) * |
| Clinic Stage | |||||
| Stage 0, No | 40 | 413 | 239 | 54 | 16 |
| Event, No | 4 | 11 | 2 | 1 | 1 |
| HR (95% CI) | 9.29 (1.42–60.60) * | Ref. | 0.29 (0.06–1.51) | 0.21 (0.02–3.00) | 4.24 (0.34–52.80) |
| Stage 1, No | 448 | 4929 | 3069 | 669 | 105 |
| Event, No | 77 | 421 | 187 | 43 | 4 |
| HR (95% CI) | 2.15 (1.67–2.76) ** | Ref. | 0.71 (0.60–0.85) * | 0.84 (0.61–1.15) | 0.49 (0.18–1.30) |
| Stage 2, No | 655 | 4561 | 2957 | 406 | 88 |
| Event, No | 198 | 822 | 303 | 51 | 6 |
| HR (95% CI) | 1.95 (1.67–2.28) ** | Ref. | 0.77 (0.68–0.88) * | 0.71 (0.54–0.95) * | 0.40 (0.18–0.90) * |
| Stage 3, No | 1004 | 8829 | 4468 | 786 | 116 |
| Event, No | 347 | 1970 | 833 | 155 | 20 |
| HR (95% CI) | 1.83 (1.63–2.05) ** | Ref. | 0.83 (0.76–0.90) ** | 0.91 (0.77–1.07) | 0.84 (0.54–1.31) |
| Stage 4, No | 720 | 5043 | 1908 | 331 | 61 |
| Event, No | 560 | 3687 | 1371 | 233 | 40 |
| HR (95% CI) | 1.23 (1.13–1.35) ** | Ref. | 0.92 (0.86–0.98) * | 0.90 (0.79–1.03) | 0.73 (0.53–1.00) * |
| Site | |||||
| Malignant neoplasm of colon, No | 1847 | 15,293 | 7301 | 1448 | 264 |
| Event, No | 737 | 4449 | 1670 | 308 | 52 |
| HR (95% CI) | 1.45 (1.34–1.57) ** | Ref. | 0.85 (0.80–0.90) ** | 0.85 (0.75–0.95) * | 0.79 (0.60–1.04) |
| Rectosigmoid junction, No | 234 | 1975 | 1015 | 188 | 29 |
| Event, No | 103 | 587 | 219 | 41 | 2 |
| HR (95% CI) | 1.57 (1.26–1.96) ** | Ref. | 0.79 (0.68–0.93) * | 0.82 (0.59–1.12) | 0.19 (0.05–0.77) * |
| Rectum, No | 786 | 6507 | 3425 | 610 | 93 |
| Event, No | 346 | 1875 | 807 | 134 | 17 |
| HR (95% CI) | 1.73 (1.54–1.95) ** | Ref. | 0.86 (0.79–0.93) * | 0.89 (0.75–1.06) | 0.65 (0.40–1.06) |
Publisher’s Note: MDPI stays neutral with regard to jurisdictional claims in published maps and institutional affiliations. |
© 2021 by the authors. Licensee MDPI, Basel, Switzerland. This article is an open access article distributed under the terms and conditions of the Creative Commons Attribution (CC BY) license (https://creativecommons.org/licenses/by/4.0/).
Share and Cite
Chiu, C.-C.; Ho, C.-H.; Hung, C.-M.; Chao, C.-M.; Lai, C.-C.; Chen, C.-M.; Liao, K.-M.; Wang, J.-J.; Wu, Y.-C.; Shi, H.-Y.; et al. Correlation of Body Mass Index with Oncologic Outcomes in Colorectal Cancer Patients: A Large Population-Based Study. Cancers 2021, 13, 3592. https://doi.org/10.3390/cancers13143592
Chiu C-C, Ho C-H, Hung C-M, Chao C-M, Lai C-C, Chen C-M, Liao K-M, Wang J-J, Wu Y-C, Shi H-Y, et al. Correlation of Body Mass Index with Oncologic Outcomes in Colorectal Cancer Patients: A Large Population-Based Study. Cancers. 2021; 13(14):3592. https://doi.org/10.3390/cancers13143592
Chicago/Turabian StyleChiu, Chong-Chi, Chung-Han Ho, Chao-Ming Hung, Chien-Ming Chao, Chih-Cheng Lai, Chin-Ming Chen, Kuang-Ming Liao, Jhi-Joung Wang, Yu-Cih Wu, Hon-Yi Shi, and et al. 2021. "Correlation of Body Mass Index with Oncologic Outcomes in Colorectal Cancer Patients: A Large Population-Based Study" Cancers 13, no. 14: 3592. https://doi.org/10.3390/cancers13143592