
Low Levels of Urinary PSA Better Identify Prostate Cancer Patients

 , , ,
, , ,
Abstract
:Simple Summary
Abstract
1. Introduction
2. Materials and Methods
2.1. Study Population and Study Design
2.2. Sample Collection and Processing
2.3. Urine Analysis
2.4. Immunohistochemistry
2.5. Ethics Statement
2.6. Study Endpoints and Statistical Analyses
3. Results
3.1. Patient Characteristics
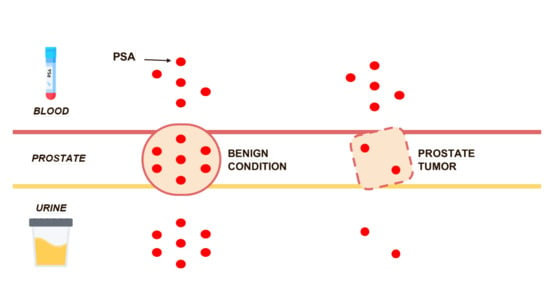
3.2. Correlation Between Urinary PSA and PSA Expression in Prostate Tissue
3.3. Differences in Urinary PSA between Healthy Individuals and Patients with Advanced Prostate Cancer
3.4. Quantification of Urinary PSA in Subjects Candidate for Prostate Biopsy
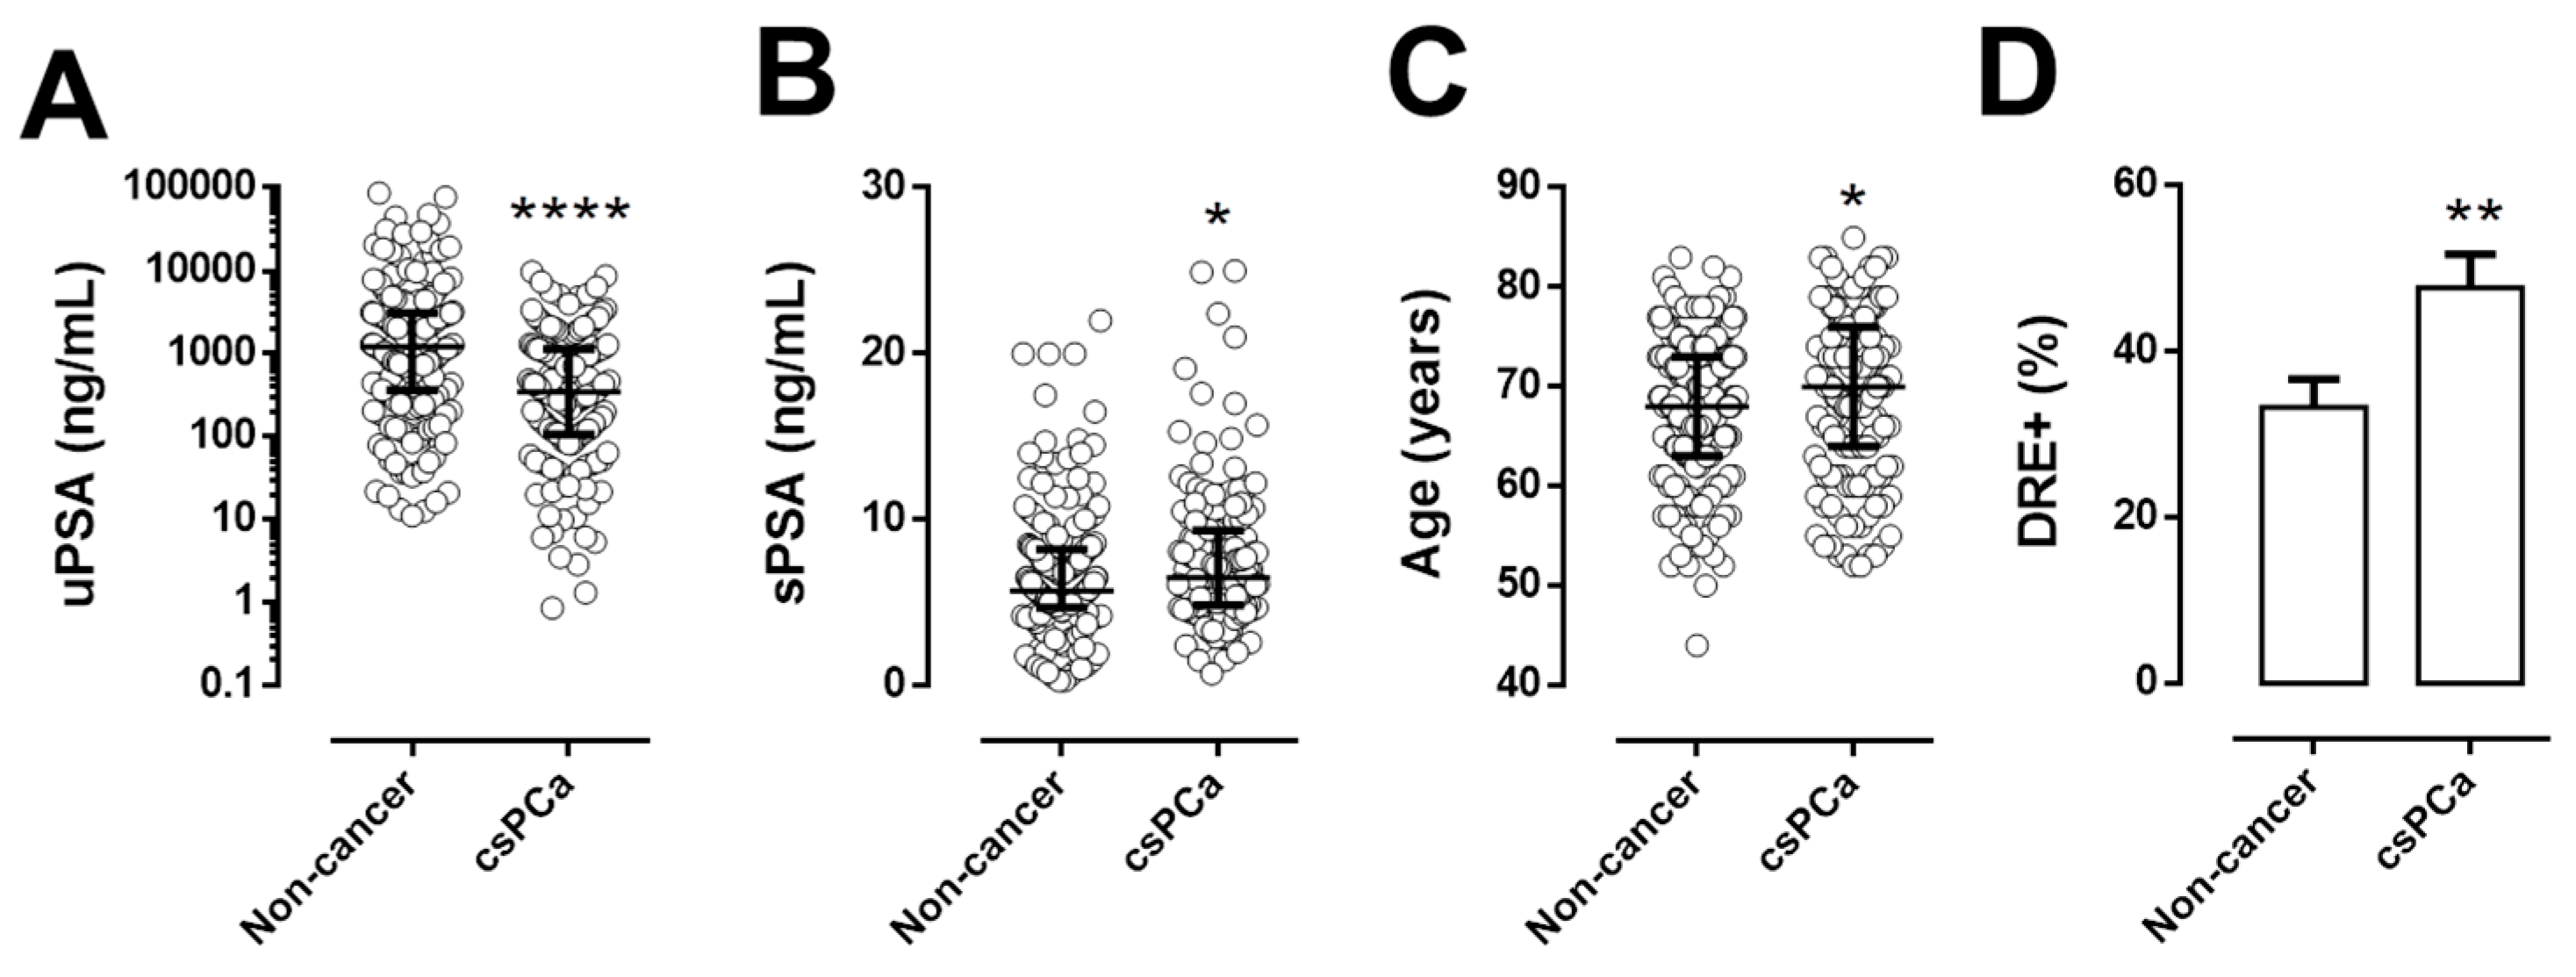
3.5. Evaluation of Urinary PSA, Serum PSA, Age and DRE in Subjects Candidate for Prostate Biopsy
3.6. Diagnostic Accuracy of Urinary PSA Levels in Patients with Clinically Significant Prostate Cancer
3.7. Development and Validation of a Diagnostic Model in Subjects Candidate for Prostate Biopsy
3.8. Clinical Utility of Urinary PSA
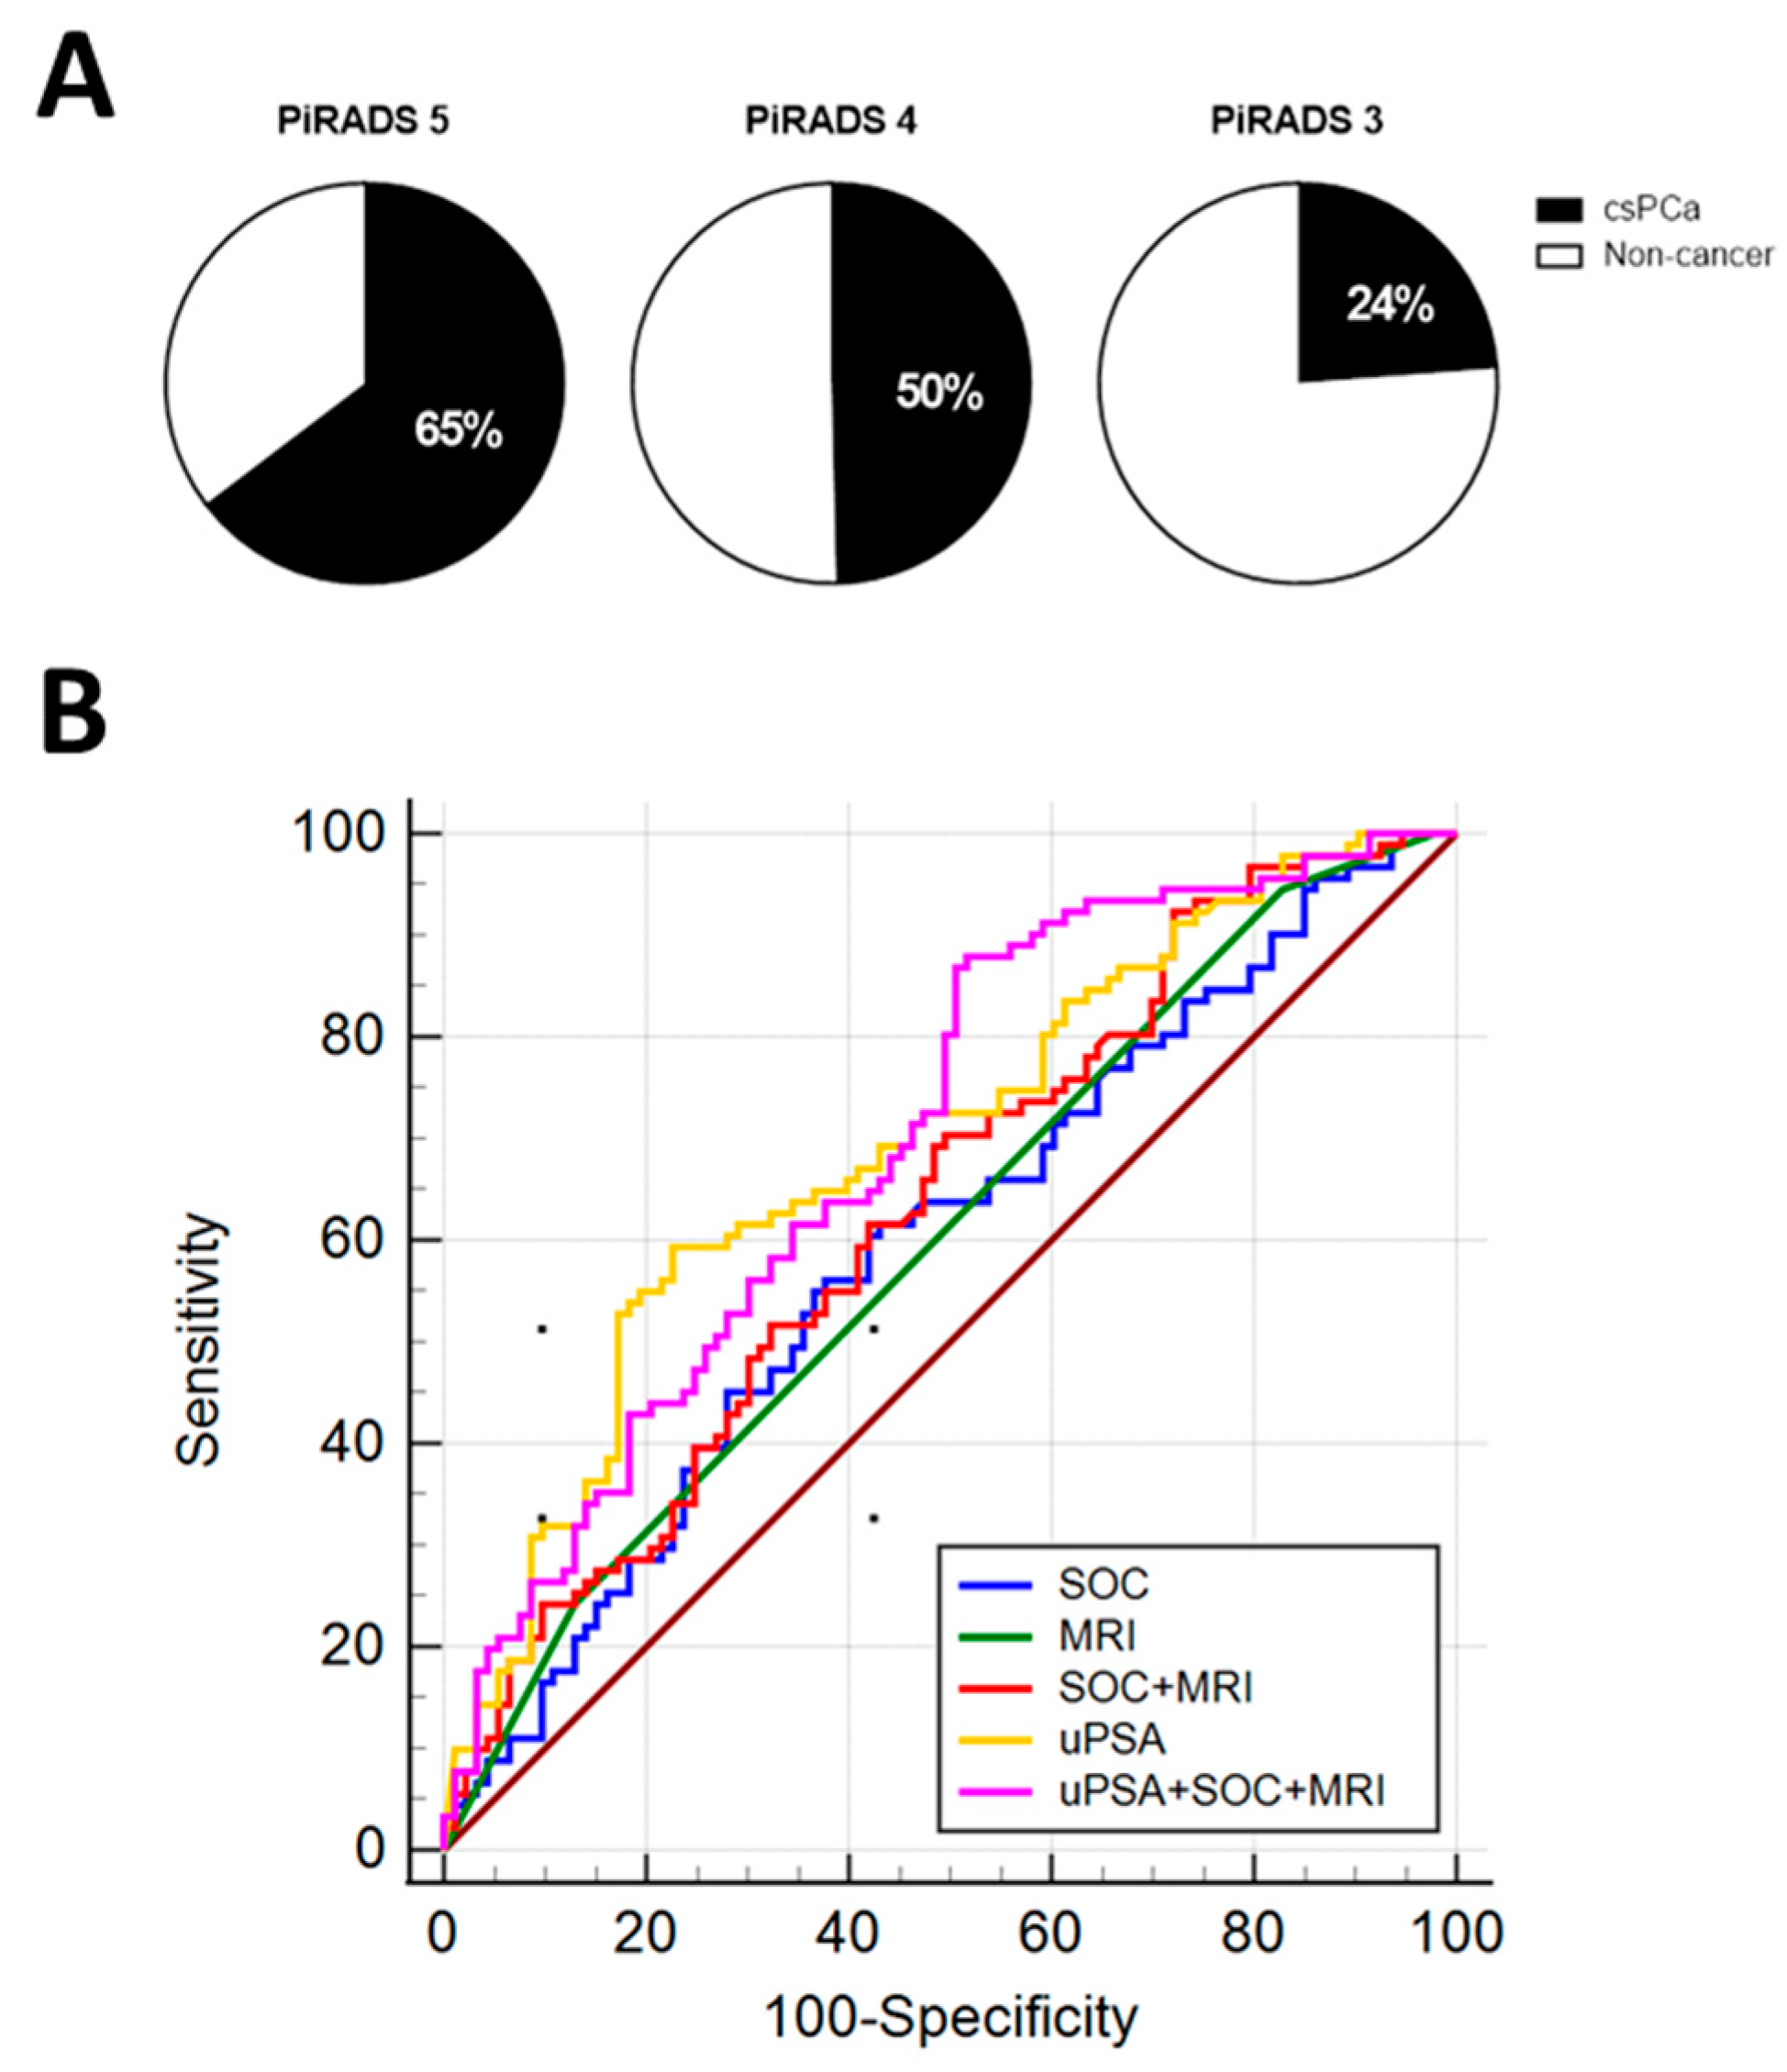
3.9. Combination of uPSA with Multiparametric Magnetic Resonance Results
3.10. Diagnostic Accuracy of Urinary PSA Levels in Men Undergoing Repeat Prostate Biopsy
4. Discussion
5. Conclusions
Author Contributions
Funding
Institutional Review Board Statement
Informed Consent Statement
Data Availability Statement
Conflicts of Interest
References
- Globocan 2020, Cancer Incidence and Mortality Worldwide: IARC CancerBase. Available online: http://globocan.iarc.fr (accessed on 10 July 2021).
- Siegel, R.L.; Miller, K.D.; Jemal, A. Cancer Statistics, 2017. CA Cancer J. Clin. 2017, 67, 7–30. [Google Scholar] [CrossRef] [Green Version]
- Jemal, A.; Fedewa, S.A.; Ma, J.; Siegel, R.; Lin, C.C.; Brawley, O.; Ward, E.M. Prostate Cancer Incidence and PSA Testing Patterns in Relation to USPSTF Screening Recommendations. JAMA 2015, 314, 2054–2061. [Google Scholar] [CrossRef] [Green Version]
- Sammon, J.D.; Abdollah, F.; Choueiri, T.K.; Kantoff, P.W.; Nguyen, P.L.; Menon, M.; Trinh, Q.D. Prostate-Specific Antigen Screening after 2012 US Preventive Services Task Force Recommendations. JAMA 2015, 314, 2077–2079. [Google Scholar] [CrossRef] [Green Version]
- Welch, H.G.; Black, W.C. Overdiagnosis in cancer. J. Natl. Cancer Inst. 2010, 102, 605–613. [Google Scholar] [CrossRef] [Green Version]
- Becerra, M.F.; Atluri, V.S.; Bhattu, A.S.; Punnen, S. Serum and urine biomarkers for detecting clinically significant prostate cancer. Urol. Oncol. 2020. [Google Scholar] [CrossRef] [PubMed]
- Walsh, T.J.; Schembri, M.; Turek, P.J.; Chan, J.M.; Carroll, P.R.; Smith, J.F.; Eisenberg, M.L.; Van Den Eeden, S.K.; Croughan, M.S. Increased risk of high-grade prostate cancer among infertile men. Cancer 2010, 116, 2140–2147. [Google Scholar] [CrossRef] [PubMed] [Green Version]
- Marconi, M.; Pilatz, A.; Wagenlehner, F.; Diemer, T.; Weidner, W. Impact of infection on the secretory capacity of the male accessory glands. Int. Braz. J. Urol. 2009, 35, 299–308, Discussion 308–309. [Google Scholar] [CrossRef] [PubMed] [Green Version]
- Weir, E.G.; Partin, A.W.; Epstein, J.I. Correlation of serum prostate specific antigen and quantitative immunohistochemistry. J. Urol. 2000, 163, 1739–1742. [Google Scholar] [CrossRef]
- Augustin, H.; Hammerer, P.G.; Graefen, M.; Palisaar, J.; Daghofer, F.; Huland, H.; Erbersdobler, A. Characterisation of biomolecular profiles in primary high-grade prostate cancer treated by radical prostatectomy. J. Cancer Res. Clin. Oncol. 2003, 129, 662–668. [Google Scholar] [CrossRef]
- Erbersdobler, A.; Isbarn, H.; Steiner, I.; Schlomm, T.; Chun, F.; Mirlacher, M.; Sauter, G. Predictive value of prostate-specific antigen expression in prostate cancer: A tissue microarray study. Urology 2009, 74, 1169–1173. [Google Scholar] [CrossRef]
- Irani, J.; Millet, C.; Levillain, P.; Doré, B.; Begon, F.; Aubert, J. Serum-to-urinary prostate-specific antigen ratio: A potential means of distinguishing benign prostatic hyperplasia from prostate cancer. Eur. Urol. 1996, 29, 407–412. [Google Scholar] [CrossRef] [PubMed]
- Bolduc, S.; Lacombe, L.; Naud, A.; Grégoire, M.; Fradet, Y.; Tremblay, R.R. Urinary PSA: A potential useful marker when serum PSA is between 2.5 ng/mL and 10 ng/mL. Can. Urol. Assoc. J. 2007, 1, 377–381. [Google Scholar] [CrossRef] [PubMed]
- Egevad, L.; Delahunt, B.; Srigley, J.R.; Samaratunga, H. International Society of Urological Pathology (ISUP) grading of prostate cancer—An ISUP consensus on contemporary grading. APMIS 2016, 124, 433–435. [Google Scholar] [CrossRef]
- Di Nardo, F.; Occhipinti, S.; Gontero, P.; Cavalera, S.; Chiarello, M.; Baggiani, C.; Anfossi, L. Detection of urinary prostate specific antigen by a lateral flow biosensor predicting repeat prostate biopsy outcome. Sens. Actu. B Chem. 2020, 325, 128812. [Google Scholar] [CrossRef]
- Linn, S.; Grunau, P.D. New patient-oriented summary measure of net total gain in certainty for dichotomous diagnostic tests. Epidemiol. Perspect. Innov. 2006, 3, 11. [Google Scholar] [CrossRef] [Green Version]
- Fenton, J.J.; Weyrich, M.S.; Durbin, S.; Liu, Y.; Bang, H.; Melnikow, J. Prostate-Specific Antigen-Based Screening for Prostate Cancer: Evidence Report and Systematic Review for the US Preventive Services Task Force. JAMA 2018, 319, 1914–1931. [Google Scholar] [CrossRef] [PubMed]
- Schröder, F.H.; Hugosson, J.; Roobol, M.J.; Tammela, T.L.; Ciatto, S.; Nelen, V.; Kwiatkowski, M.; Lujan, M.; Lilja, H.; Zappa, M.; et al. Screening and prostate-cancer mortality in a randomized European study. N. Engl. J. Med. 2009, 360, 1320–1328. [Google Scholar] [CrossRef] [PubMed] [Green Version]
- Hugosson, J.; Roobol, M.J.; Månsson, M.; Tammela, T.L.J.; Zappa, M.; Nelen, V.; Kwiatkowski, M.; Lujan, M.; Carlsson, S.V.; Talala, K.M.; et al. A 16-yr Follow-up of the European Randomized study of Screening for Prostate Cancer. Eur Urol. 2019, 76, 43–51. [Google Scholar] [CrossRef] [PubMed] [Green Version]
- Andriole, G.L.; Crawford, E.D.; Grubb RL 3rd Buys, S.S.; Chia, D.; Church, T.R.; Fouad, M.N.; Gelmann, E.P.; Kvale, P.A.; Reding, D.J.; Weissfeld, J.L.; et al. Mortality results from a randomized prostate-cancer screening trial. N. Engl. J. Med. 2009, 360, 1310–1319, Erratum in 2009, 360, 1797. [Google Scholar] [CrossRef] [Green Version]
- Moyer, V.A.; U.S. Preventive Services Task Force. Screening for prostate cancer: U.S. Preventive Services Task Force recommendation statement. Ann. Intern. Med. 2012, 157, 120–134. [Google Scholar] [CrossRef] [Green Version]
- Grenabo Bergdahl, A.; Holmberg, E.; Moss, S.; Hugosson, J. Incidence of prostate cancer after termination of screening in a population-based randomised screening trial. Eur. Urol. 2013, 64, 703–709, Erratum: Eur. Urol. 2015, 68, e46. [Google Scholar] [CrossRef] [PubMed]
- Godtman, R.A.; Carlsson, S.; Holmberg, E.; Stranne, J.; Hugosson, J. The Effect of Start and Stop Age at Screening on the Risk of Being Diagnosed with Prostate Cancer. J. Urol. 2016, 195, 1390–1396. [Google Scholar] [CrossRef] [PubMed]
- Catalona, W.J.; Partin, A.W.; Sanda, M.G.; Wei, J.T.; Klee, G.G.; Bangma, C.H.; Slawin, K.M.; Marks, L.S.; Loeb, S.; Broyles, D.L.; et al. A multicenter study of [-2]pro-prostate specific antigen combined with prostate specific antigen and free prostate specific antigen for prostate cancer detection in the 2.0 to 10.0 ng/ml prostate specific antigen range. J. Urol. 2011, 185, 1650–1655, Erratum in 2011, 186, 354. [Google Scholar] [CrossRef] [PubMed] [Green Version]
- Parekh, D.J.; Punnen, S.; Sjoberg, D.D.; Asroff, S.W.; Bailen, J.L.; Cochran, J.S.; Concepcion, R.; David, R.D.; Deck, K.B.; Dumbadze, I.; et al. A multi-institutional prospective trial in the USA confirms that the 4Kscore accurately identifies men with high-grade prostate cancer. Eur. Urol. 2015, 68, 464–470. [Google Scholar] [CrossRef]
- Müller, H.; Brenner, H. Urine markers as possible tools for prostate cancer screening: Review of performance characteristics and practicality. Clin. Chem. 2006, 52, 562–573. [Google Scholar] [CrossRef] [Green Version]
- Cui, Y.; Cao, W.; Li, Q.; Shen, H.; Liu, C.; Deng, J.; Xu, J.; Shao, Q. Evaluation of prostate cancer antigen 3 for detecting prostate cancer: A systematic review and meta-analysis. Sci. Rep. 2016, 6, 25776. [Google Scholar] [CrossRef] [Green Version]
- Tutrone, R.; Donovan, M.J.; Torkler, P.; Tadigotla, V.; McLain, T.; Noerholm, M.; Skog, J.; McKiernan, J. Clinical utility of the exosome based ExoDx Prostate(IntelliScore) EPI test in men presenting for initial Biopsy with a PSA 2-10 ng/mL. Prostate Cancer Prostatic Dis. 2020, 23, 607–614. [Google Scholar] [CrossRef]
- Van Neste, L.; Hendriks, R.J.; Dijkstra, S.; Trooskens, G.; Cornel, E.B.; Jannink, S.A.; de Jong, H.; Hessels, D.; Smit, F.P.; Melchers, W.J.; et al. Detection of High-grade Prostate Cancer Using a Urinary Molecular Biomarker-Based Risk Score. Eur. Urol. 2016, 70, 740–748. [Google Scholar] [CrossRef]
- Cornu, J.N.; Cancel-Tassin, G.; Egrot, C.; Gaffory, C.; Haab, F.; Cussenot, O. Urine TMPRSS2:ERG fusion transcript integrated with PCA3 score, genotyping, and biological features are correlated to the results of prostatic biopsies in men at risk of prostate cancer. Prostate 2013, 73, 242–249. [Google Scholar] [CrossRef]
- Hammarsten, P.; Josefsson, A.; Thysell, E.; Lundholm, M.; Hägglöf, C.; Iglesias-Gato, D.; Flores-Morales, A.; Stattin, P.; Egevad, L.; Granfors, T.; et al. Immunoreactivity for prostate specific antigen and Ki67 differentiates subgroups of prostate cancer related to outcome. Mod. Pathol. 2019, 32, 1310–1319. [Google Scholar] [CrossRef]
- Bonk, S.; Kluth, M.; Hube-Magg, C.; Polonski, A.; Soekeland, G.; Makropidi-Fraune, G.; Möller-Koop, C.; Witt, M.; Luebke, A.M.; Hinsch, A.; et al. Prognostic and diagnostic role of PSA immunohistochemistry: A tissue microarray study on 21,000 normal and cancerous tissues. Oncotarget 2019, 10, 5439–5453. [Google Scholar] [CrossRef] [PubMed] [Green Version]
- Ahmed, H.U.; El-Shater Bosaily, A.; Brown, L.C.; Gabe, R.; Kaplan, R.; Parmar, M.K.; Collaco-Moraes, Y.; Ward, K.; Hindley, R.G.; Freeman, A.; et al. Diagnostic accuracy of multi-parametric MRI and TRUS biopsy in prostate cancer (PROMIS): A paired validating confirmatory study. Lancet 2017, 389, 815–822. [Google Scholar] [CrossRef] [Green Version]
- Stewart, G.D.; Van Neste, L.; Delvenne, P.; Delrée, P.; Delga, A.; McNeill, S.A.; O’Donnell, M.; Clark, J.; Van Criekinge, W.; Bigley, J.; et al. Clinical utility of an epigenetic assay to detect occult prostate cancer in histopathologically negative biopsies: Results of the MATLOC study. J. Urol. 2013, 189, 1110–1116. [Google Scholar] [CrossRef] [PubMed]
- Borkowetz, A.; Platzek, I.; Toma, M.; Laniado, M.; Baretton, G.; Froehner, M.; Koch, R.; Wirth, M.; Zastrow, S. Comparison of systematic transrectal biopsy to transperineal magnetic resonance imaging/ultrasound-fusion biopsy for the diagnosis of prostate cancer. BJU Int. 2015, 116, 873–879. [Google Scholar] [CrossRef] [PubMed] [Green Version]


| Characteristics | Cohort A | Cohort B | p |
|---|---|---|---|
| Patients, n | 376 | 198 | - |
| Evaluable samples, n (%) 1 | 348 (92.6) | 179 (90.4) | - |
| Age, years, mean (median; IQR) | 68 (68; 63–74) | 68 (69; 63–74) | ns 2 |
| PSA, ng/mL, mean (median; IQR) | 7 (6; 4.8–8.4) | 8.1 (6.8; 4.8–10) | 0.04 |
| DRE adnormal, n (%) | 138 (39.7) | 67 (37.4) | ns 2 |
| PCa diagnosis, n (%) | 173 (49.7) | 100 (55.9) | ns 2 |
| Low risk, n (%) | 20 (11.6) | 15 (15.2) | - |
| Intermediate favorable risk, n (%) | 53 (30.6) | 32 (32.3) | - |
| Intermediate unfavorable risk, n (%) | 47 (27.2) | 30 (30.3) | - |
| High risk, n (%) | 53 (30.6) | 23 (23.2) | - |
| Clinical significant PCa, n (%) | 153 (44) | 85 (47.5) | ns 2 |
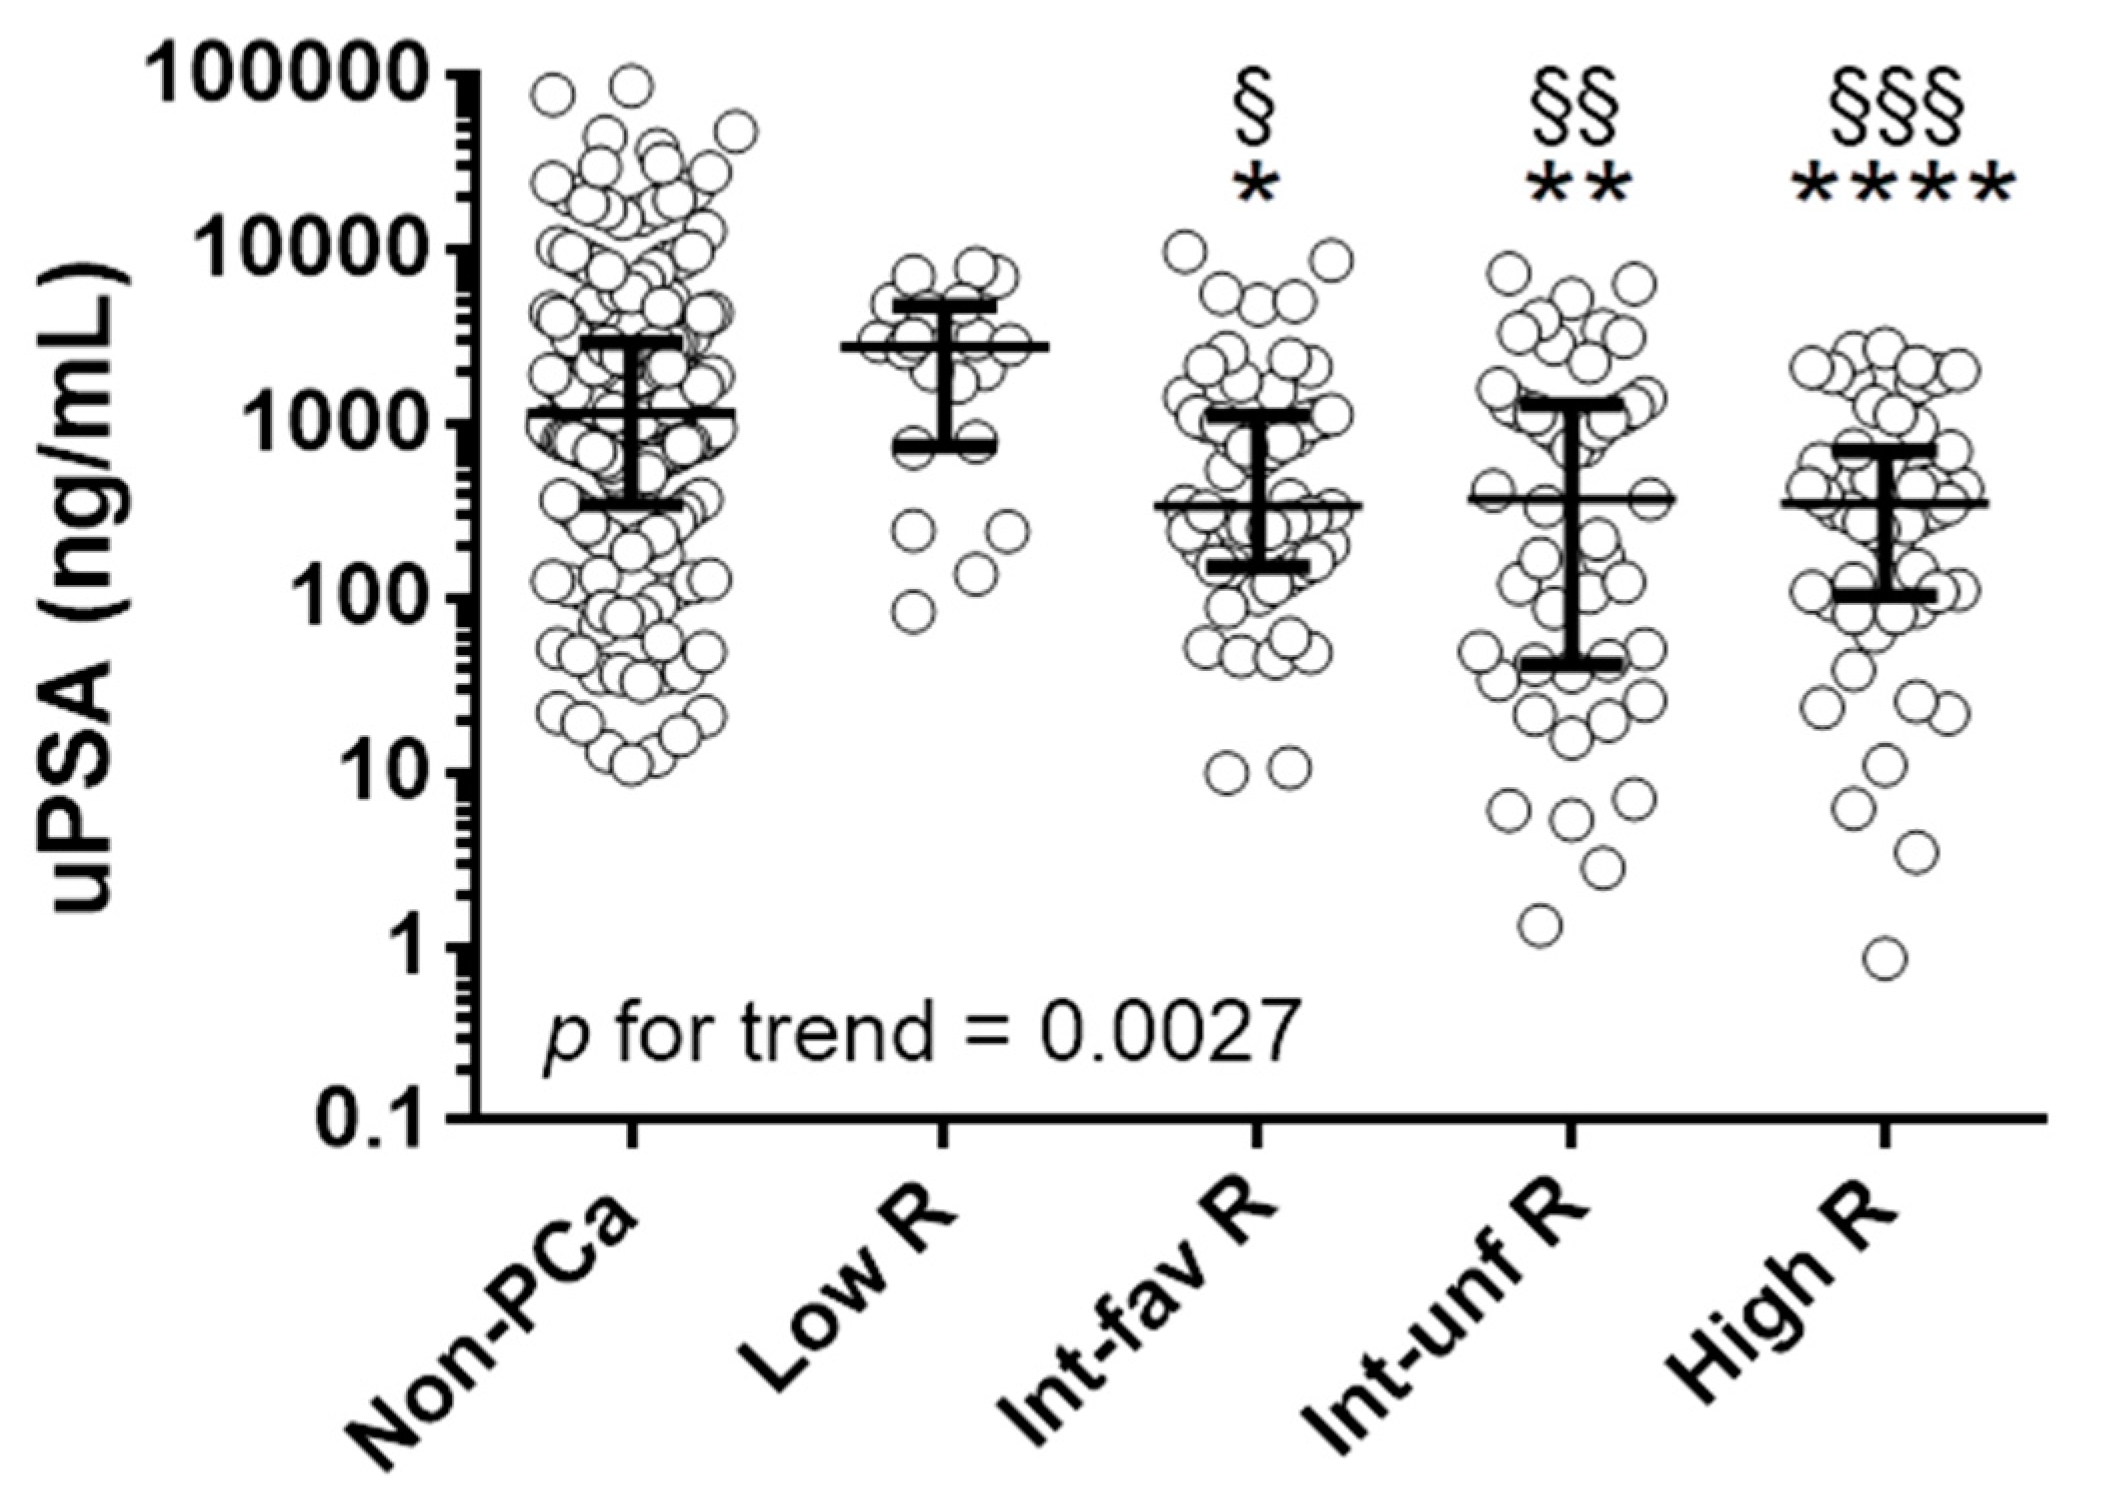
| Diagnosis | Mean (ng/mL) | Median (p25–p75) | p | p |
|---|---|---|---|---|
| no PCa | 4809 | 1158 (345–2918) | ref | - |
| Low Risk | 2932 | 2774 (742–4755) | ns 3 | ref |
| Int-fav Risk 1 | 1207 | 338 (150–1112) | 0.0111 | 0.0119 |
| Int-sfav Risk 2 | 1164 | 371 (41–1297) | 0.0018 | 0.0035 |
| High risk | 623 | 347 (103–704) | 0.0001 | 0.0003 |
| p for trend = 0.0027 | ||||
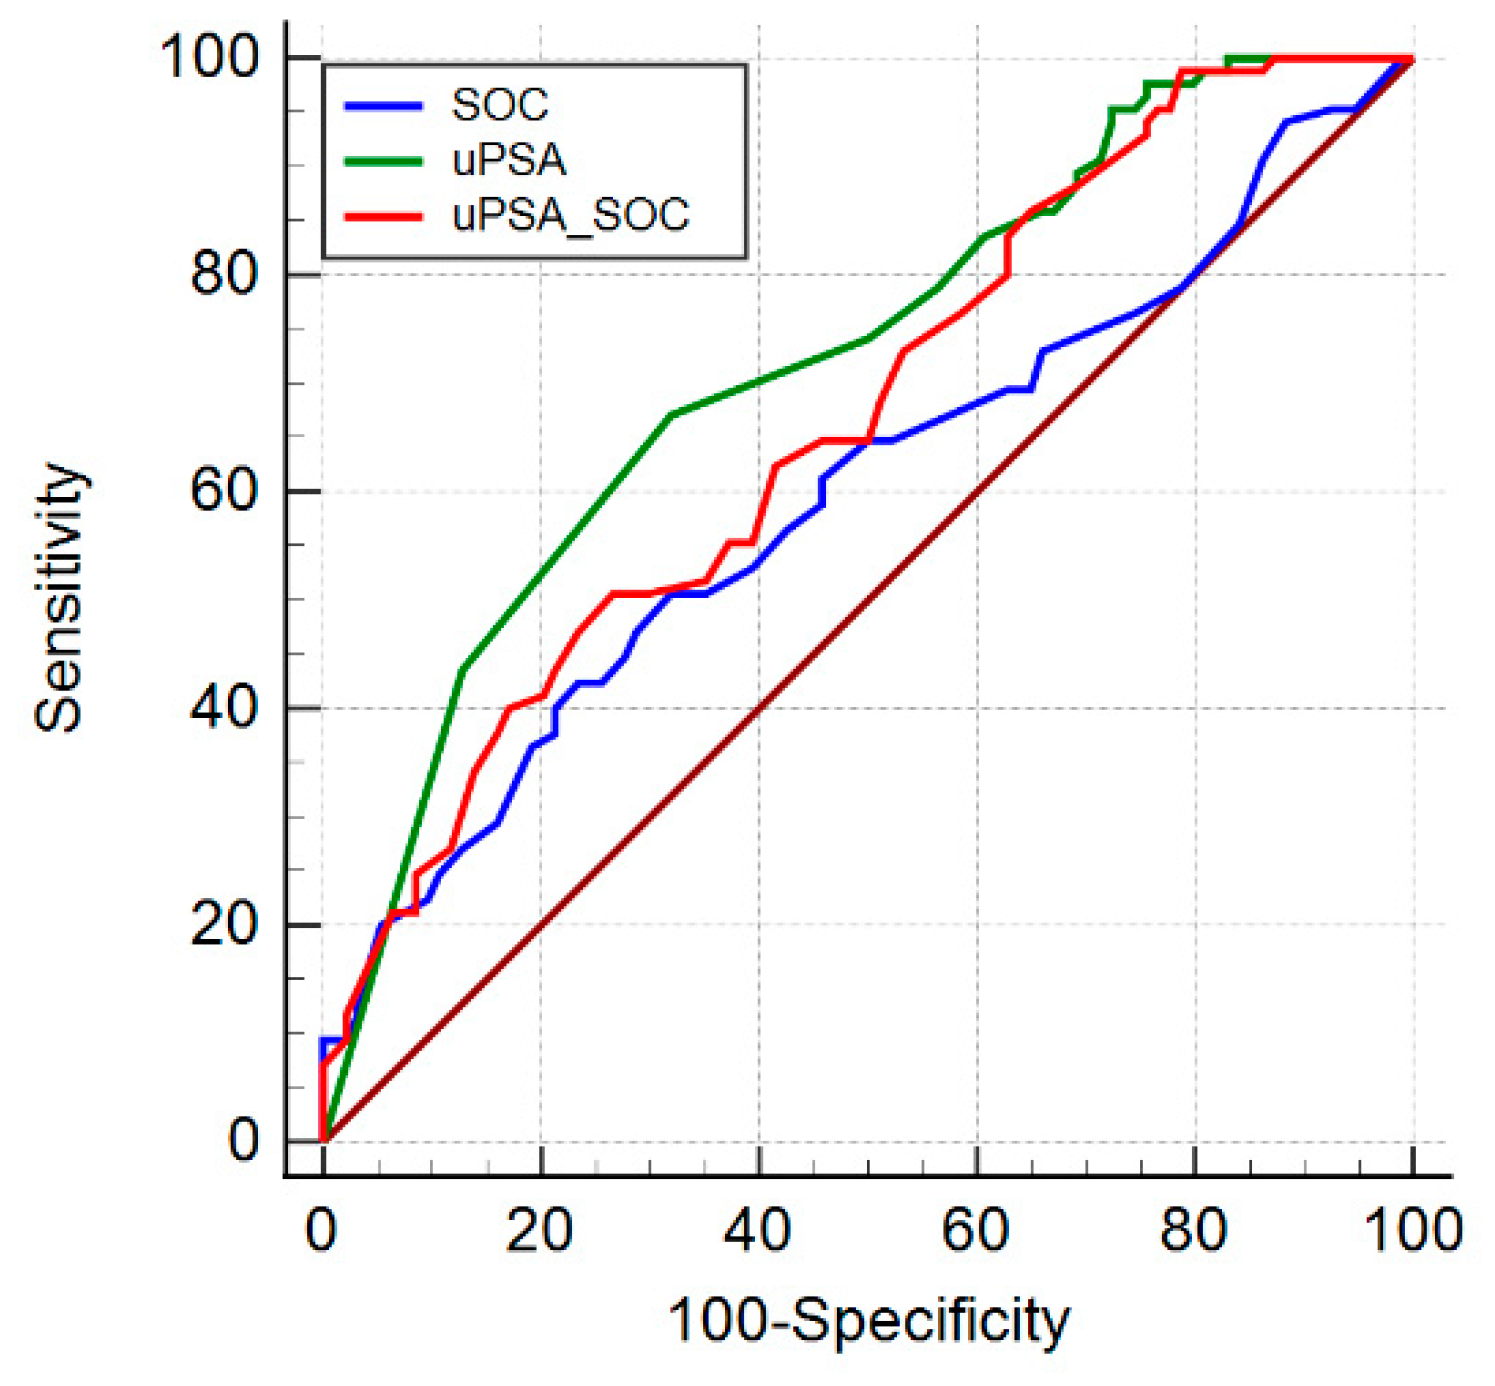
| Model | AUC 1 | SE 2 | 95% CI 3 | p | Optimism | Specif 4 | Specif 5 |
|---|---|---|---|---|---|---|---|
| SOC | 0.612 | 0.0309 | 0.559–0.664 | ref | 0.001 | 7.5 | 11.3 |
| uPSA | 0.691 | 0.0281 | 0.639–0.739 | 0.0456 | 0.001 | 19 | 32.8 |
| uPSA + SOC | 0.721 | 0.0271 | 0.671–0.767 | 0.0001 | 0.001 | 23.4 | 31.8 |
| Model | 95% Sensitivity | 90% Sensitivity | ||||
|---|---|---|---|---|---|---|
| PPV 1 | NPV 2 | NNP 3 | PPV | NPV | NNP | |
| SOC 4 | 44.7 | 65.7 | 9.7 | 44.4 | 58.9 | 30.3 |
| uPSA | 47.9 | 82.8 | 3.2 | 51.3 | 80.7 | 3.1 |
| uPSA + SOC | 49.4 | 85.7 | 2.8 | 50.9 | 80.2 | 3.2 |
| Serum PSA Group | Non Cancer (n) | csPCa (n) | AUC |
|---|---|---|---|
| 0–4 ng/mL | 32 | 19 | 0.602 |
| 4.1–10 ng/mL | 135 | 103 | 0.683 |
| 10.1–25 ng/mL | 28 | 31 | 0.792 |
| Model | AUC | SE | 95% CI | p | Specif 1 | Specif 2 |
|---|---|---|---|---|---|---|
| SOC | 0.598 | 0.0436 | 0.427–0.576 | ref | 8.5 | 14 |
| uPSA | 0.720 | 0.0373 | 0.648–0.784 | 0.025 | 27.7 | 29.8 |
| uPSA + SOC | 0.666 | 0.0400 | 0.592–0.735 | 0.002 | 23.4 | 28.5 |
| Model | 95% Sensitivity | 90% Sensitivity | ||||
|---|---|---|---|---|---|---|
| PPV | NPV | NNP | PPV | NPV | NNP | |
| SOC | 48.4 | 65.3 | 7.3 | 48.6 | 60.7 | 10.8 |
| uPSA | 54.3 | 86.0 | 2.5 | 53.7 | 76.7 | 3.3 |
| uPSA + SOC | 52.9 | 83.8 | 2.7 | 53.2 | 75.9 | 3.4 |
| Cut-Off (probab) | All n (%) | No PCa n (%) | Low Risk n (%) | csPCa n (%) | Missed High Risk n (%) | Saved Biopsies n (%) |
|---|---|---|---|---|---|---|
| 0 | 179 (100) | 79 (100) | 15 (100) | 85 (100) | 0 (0) | 0 (0) |
| 0.25 | 163 (91) | 63 (80) | 15 (100) | 85 (100) | 0 (0) | 16 (17) |
| 0.40 | 152 (85) | 56 (71) | 13 (87) | 83 (98) | 0 (0) | 25 (27) |
| 0.50 | 133 (74) | 49 (62) | 11 (73) | 73 (86) | 3 (13) | 34 (36) |
| 0.55 | 85 (45) | 21 (27) | 7 (47) | 57 (67) | 7 (30) | 66 (70) |
| Model | AUC | SE | 95% CI | p | p | p |
|---|---|---|---|---|---|---|
| SOC | 0.594 | 0.0419 | 0.519–0.665 | ref | - | - |
| MRI | 0.598 | 0.0330 | 0.524–0.670 | ns 1 | ref | - |
| SOC+MRI | 0.629 | 0.0409 | 0.555–0.699 | ns 1 | ns 1 | ref |
| uPSA | 0.695 | 0.0387 | 0.623–0.760 | 0.07 | 0.05 | ns 1 |
| uPSA + SOC + MRI | 0.698 | 0.0384 | 0.626–0.764 | 0.0055 | 0.0023 | 0.0085 |
| Cut-Off (Probab) | All n (%) | No PCa n (%) | Low Risk n (%) | csPCa n (%) | Missed High Risk n (%) | Saved Biopsies n (%) |
|---|---|---|---|---|---|---|
| 0 | 56 (100) | 27 (100) | 8 (100) | 21 (100) | 0 (0) | 0 (0) |
| 0.25 | 48 (86) | 22 (81) | 6 (75) | 20 (95) | 0 (0) | 7 (20) |
| 0.40 | 40 (71) | 15 (56) | 5 (63) | 20 (95) | 0 (0) | 15 (43) |
| 0.50 | 27 (48) | 8 (30) | 2 (25) | 17 (81) | 0 (0) | 25 (71) |
| 0.55 | 0 (0) | 0 (0) | 0 (0) | 0 (0) | 4 (100) | 35 (100) |
Publisher’s Note: MDPI stays neutral with regard to jurisdictional claims in published maps and institutional affiliations. |
© 2021 by the authors. Licensee MDPI, Basel, Switzerland. This article is an open access article distributed under the terms and conditions of the Creative Commons Attribution (CC BY) license (https://creativecommons.org/licenses/by/4.0/).
Share and Cite
Occhipinti, S.; Mengozzi, G.; Oderda, M.; Zitella, A.; Molinaro, L.; Novelli, F.; Giovarelli, M.; Gontero, P. Low Levels of Urinary PSA Better Identify Prostate Cancer Patients. Cancers 2021, 13, 3570. https://doi.org/10.3390/cancers13143570
Occhipinti S, Mengozzi G, Oderda M, Zitella A, Molinaro L, Novelli F, Giovarelli M, Gontero P. Low Levels of Urinary PSA Better Identify Prostate Cancer Patients. Cancers. 2021; 13(14):3570. https://doi.org/10.3390/cancers13143570
Chicago/Turabian StyleOcchipinti, Sergio, Giulio Mengozzi, Marco Oderda, Andrea Zitella, Luca Molinaro, Francesco Novelli, Mirella Giovarelli, and Paolo Gontero. 2021. "Low Levels of Urinary PSA Better Identify Prostate Cancer Patients" Cancers 13, no. 14: 3570. https://doi.org/10.3390/cancers13143570