
Hydroxychloroquine (HCQ) Modulates Autophagy and Oxidative DNA Damage Stress in Hepatocellular Carcinoma to Overcome Sorafenib Resistance via TLR9/SOD1/hsa-miR-30a-5p/Beclin-1 Axis

 ,
,  , ,
, ,  and
and 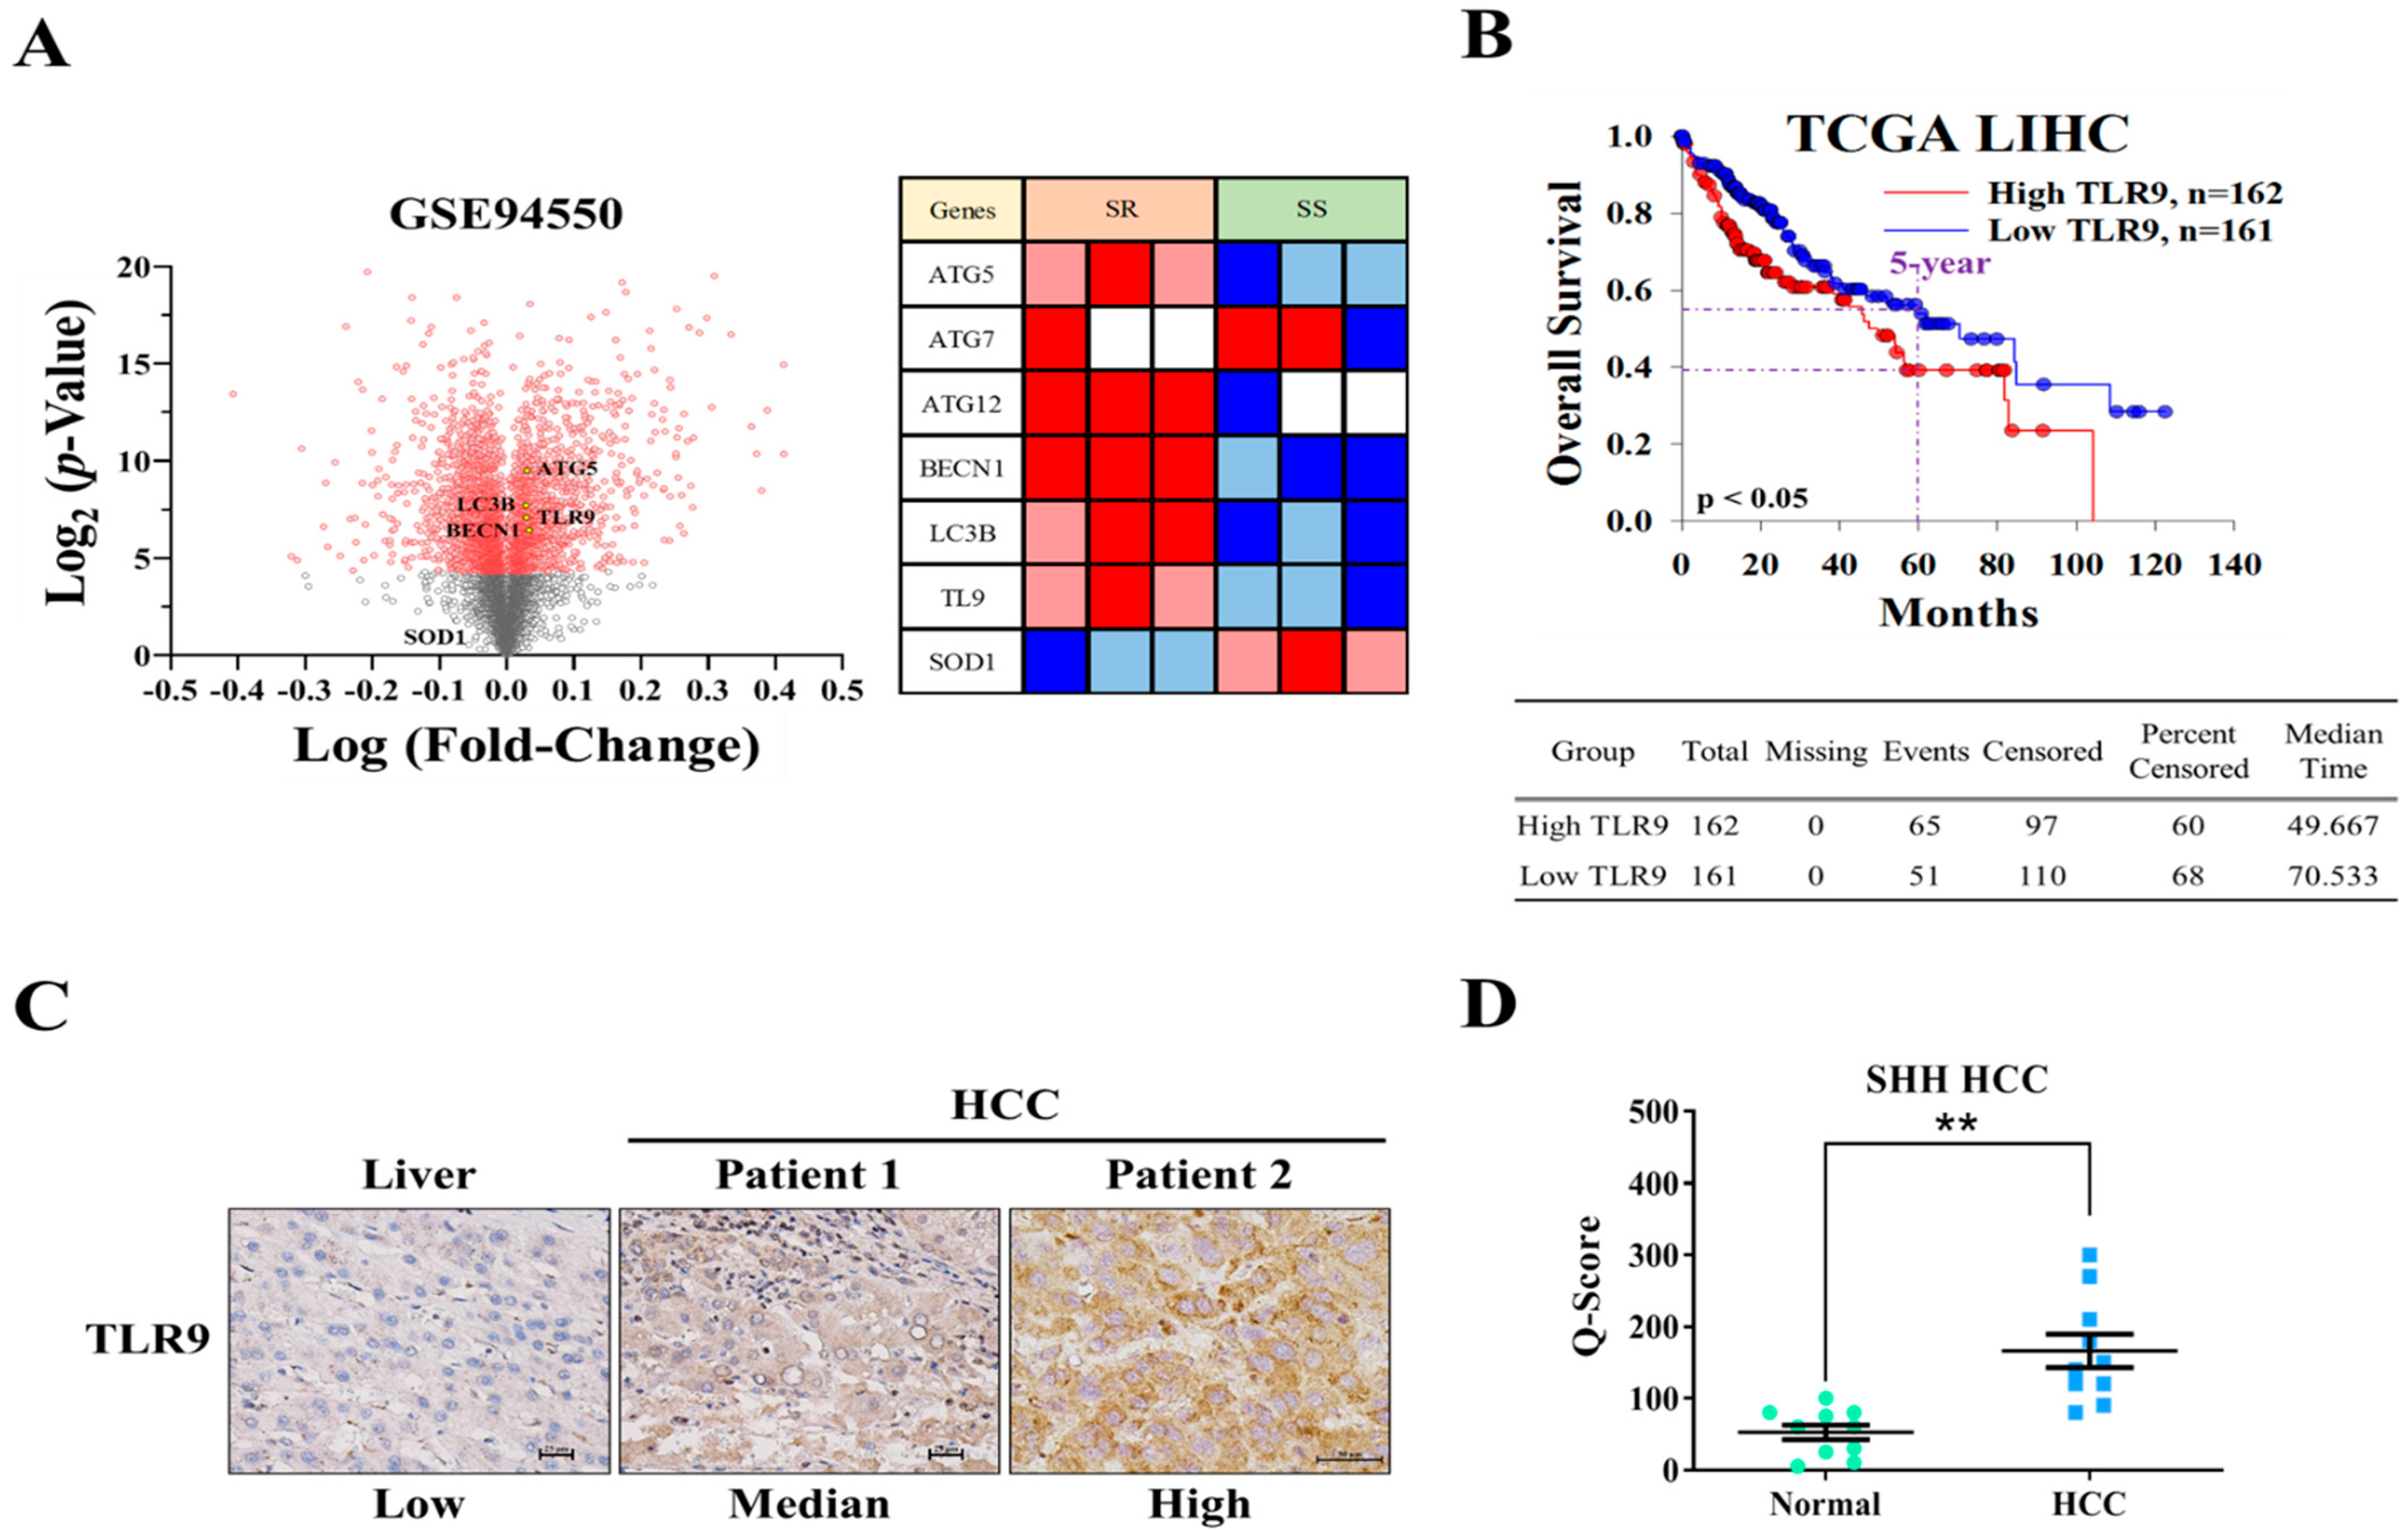
Abstract
:Simple Summary
Abstract
1. Introduction
2. Materials and Methods
2.1. Cell Lines and Media
2.2. Microarray Preprocessing and Analysis
2.3. Differential Expression Analysis
2.4. Immunohistochemistry (IHC) Analyses
2.5. Cell Viability Test and Calculation of the Combination Index
2.6. Apoptosis and Cell Cycle Analysis
2.7. Western Blotting and qRT-PCR
2.8. Colony Formation Assay
2.9. Wound Healing Migration Assay
2.10. Invasion Assay
2.11. Sphere Formation Assay
2.12. Animal Studies
2.13. Statistical Analysis
3. Results
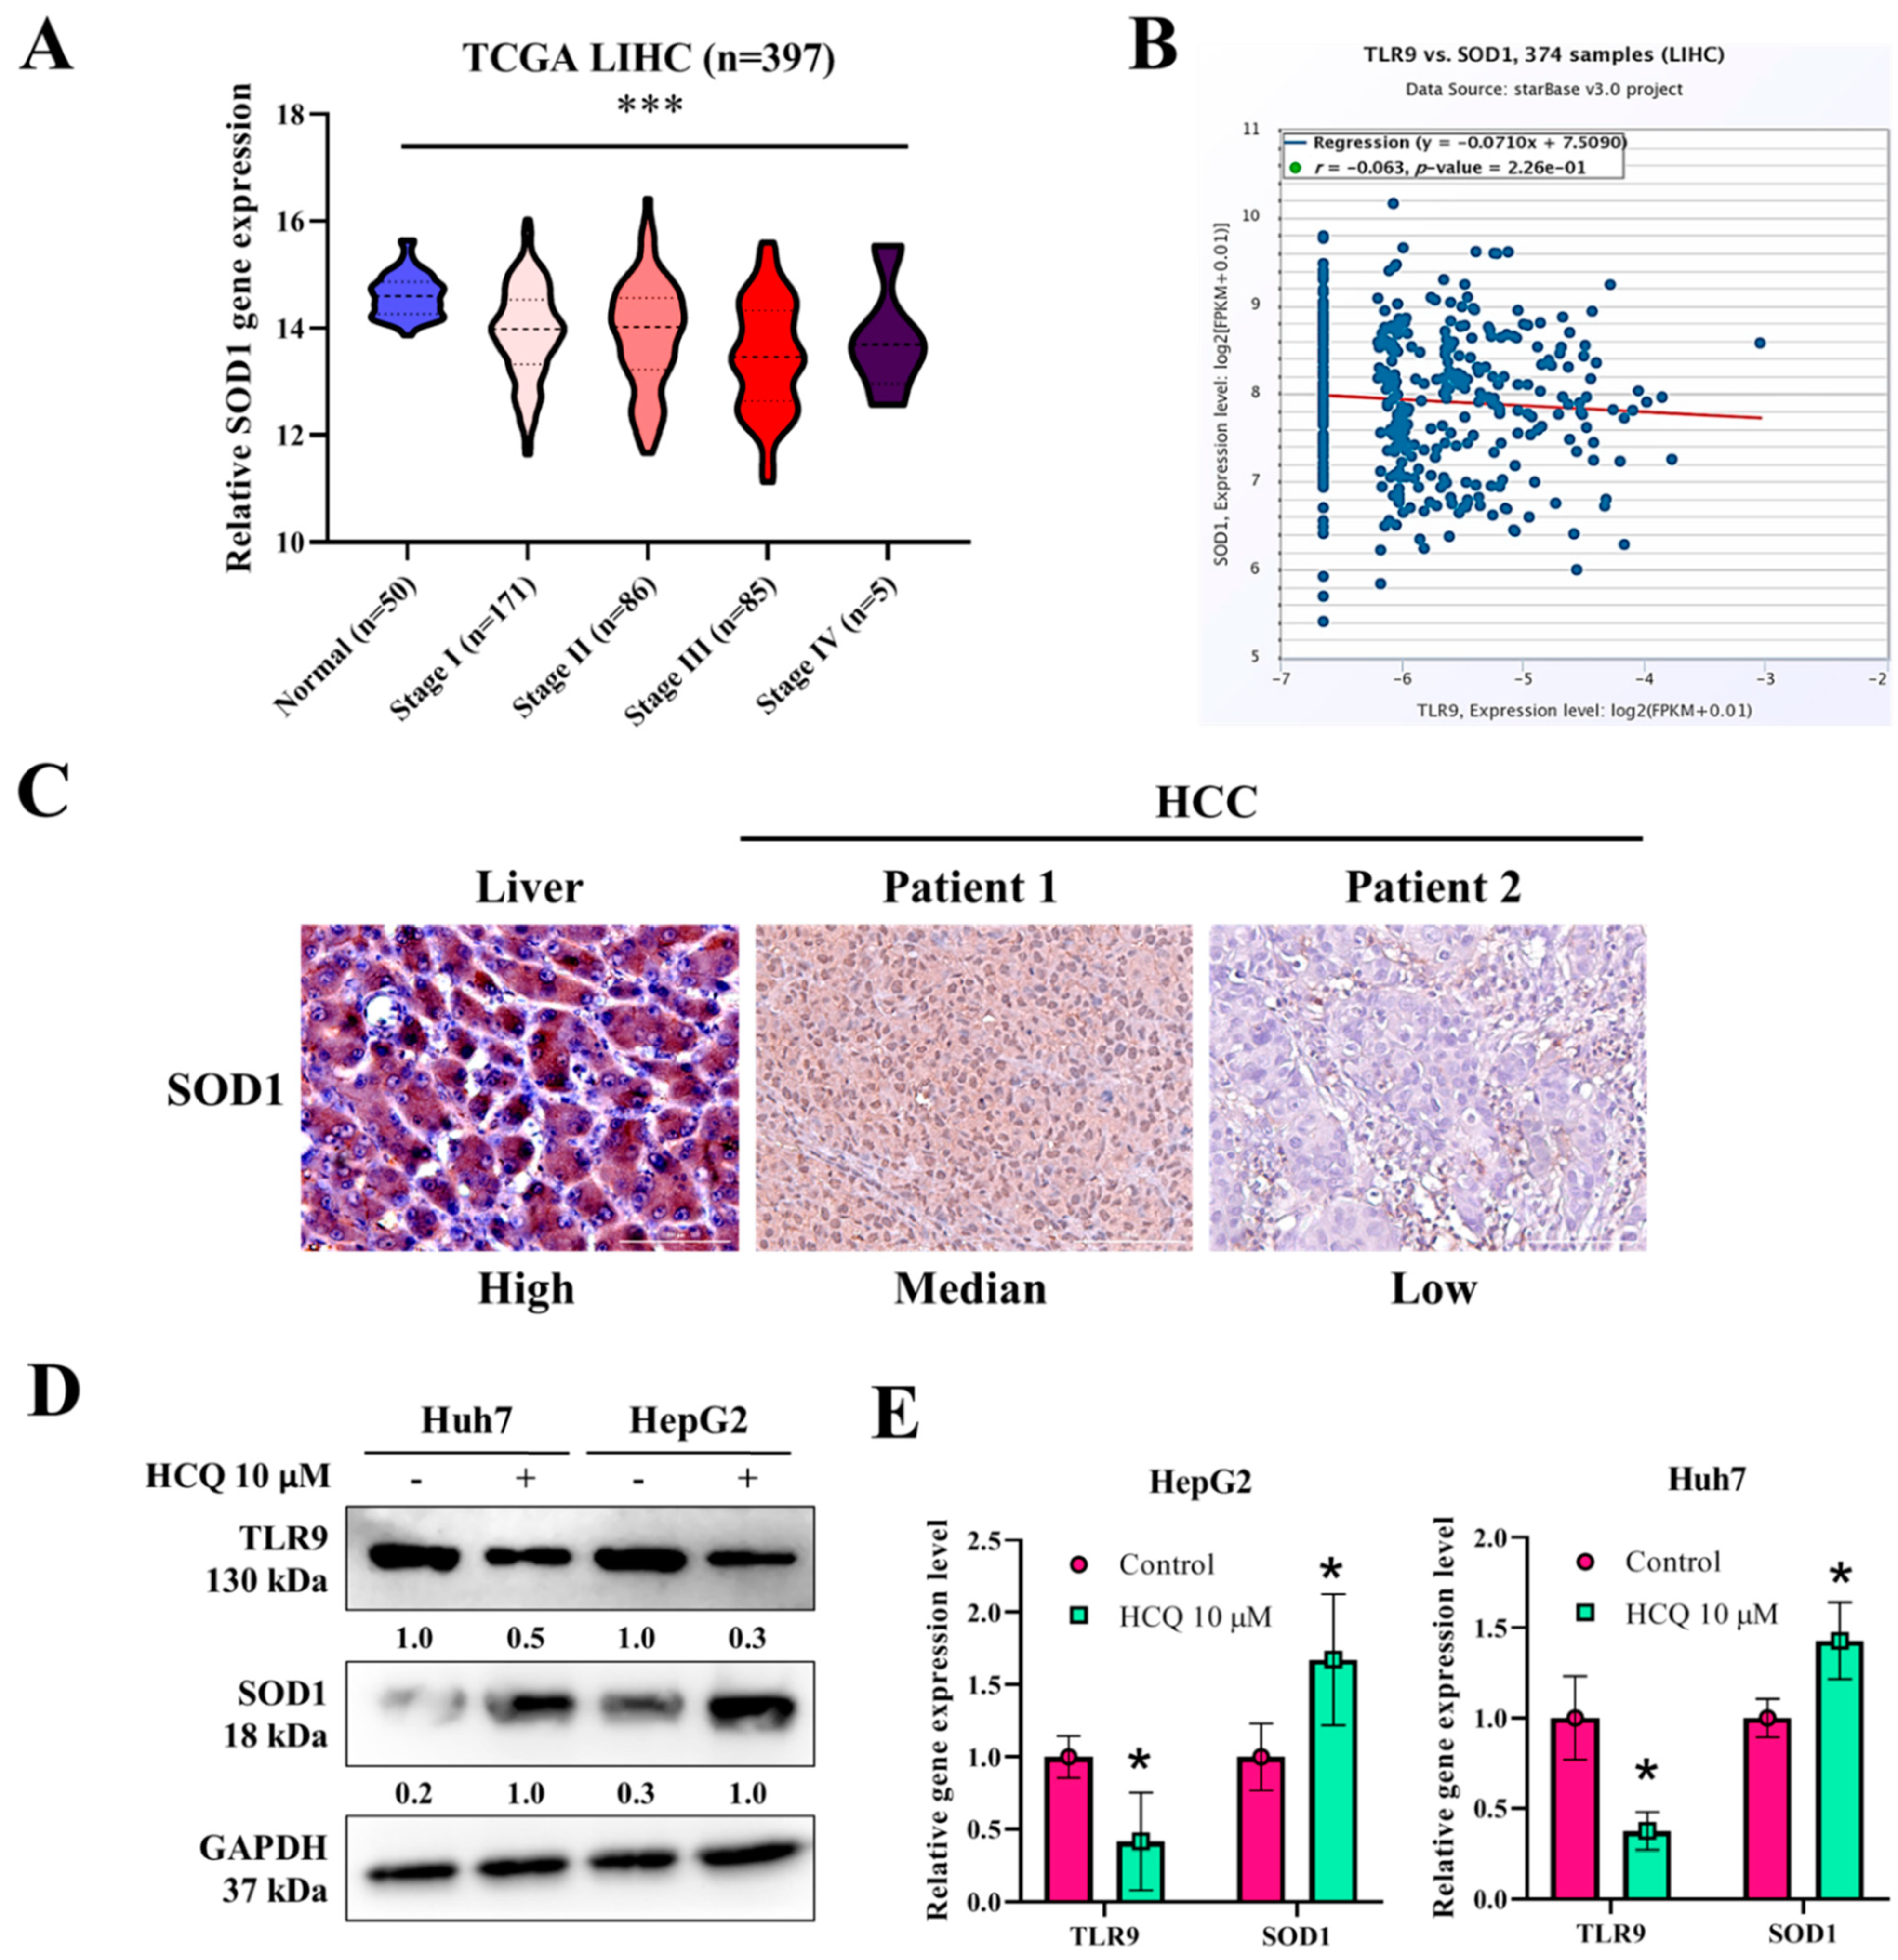
3.1. TLR9 Overexpressed in HCC Sorafenib-Resistant HCC Tissue and Cells
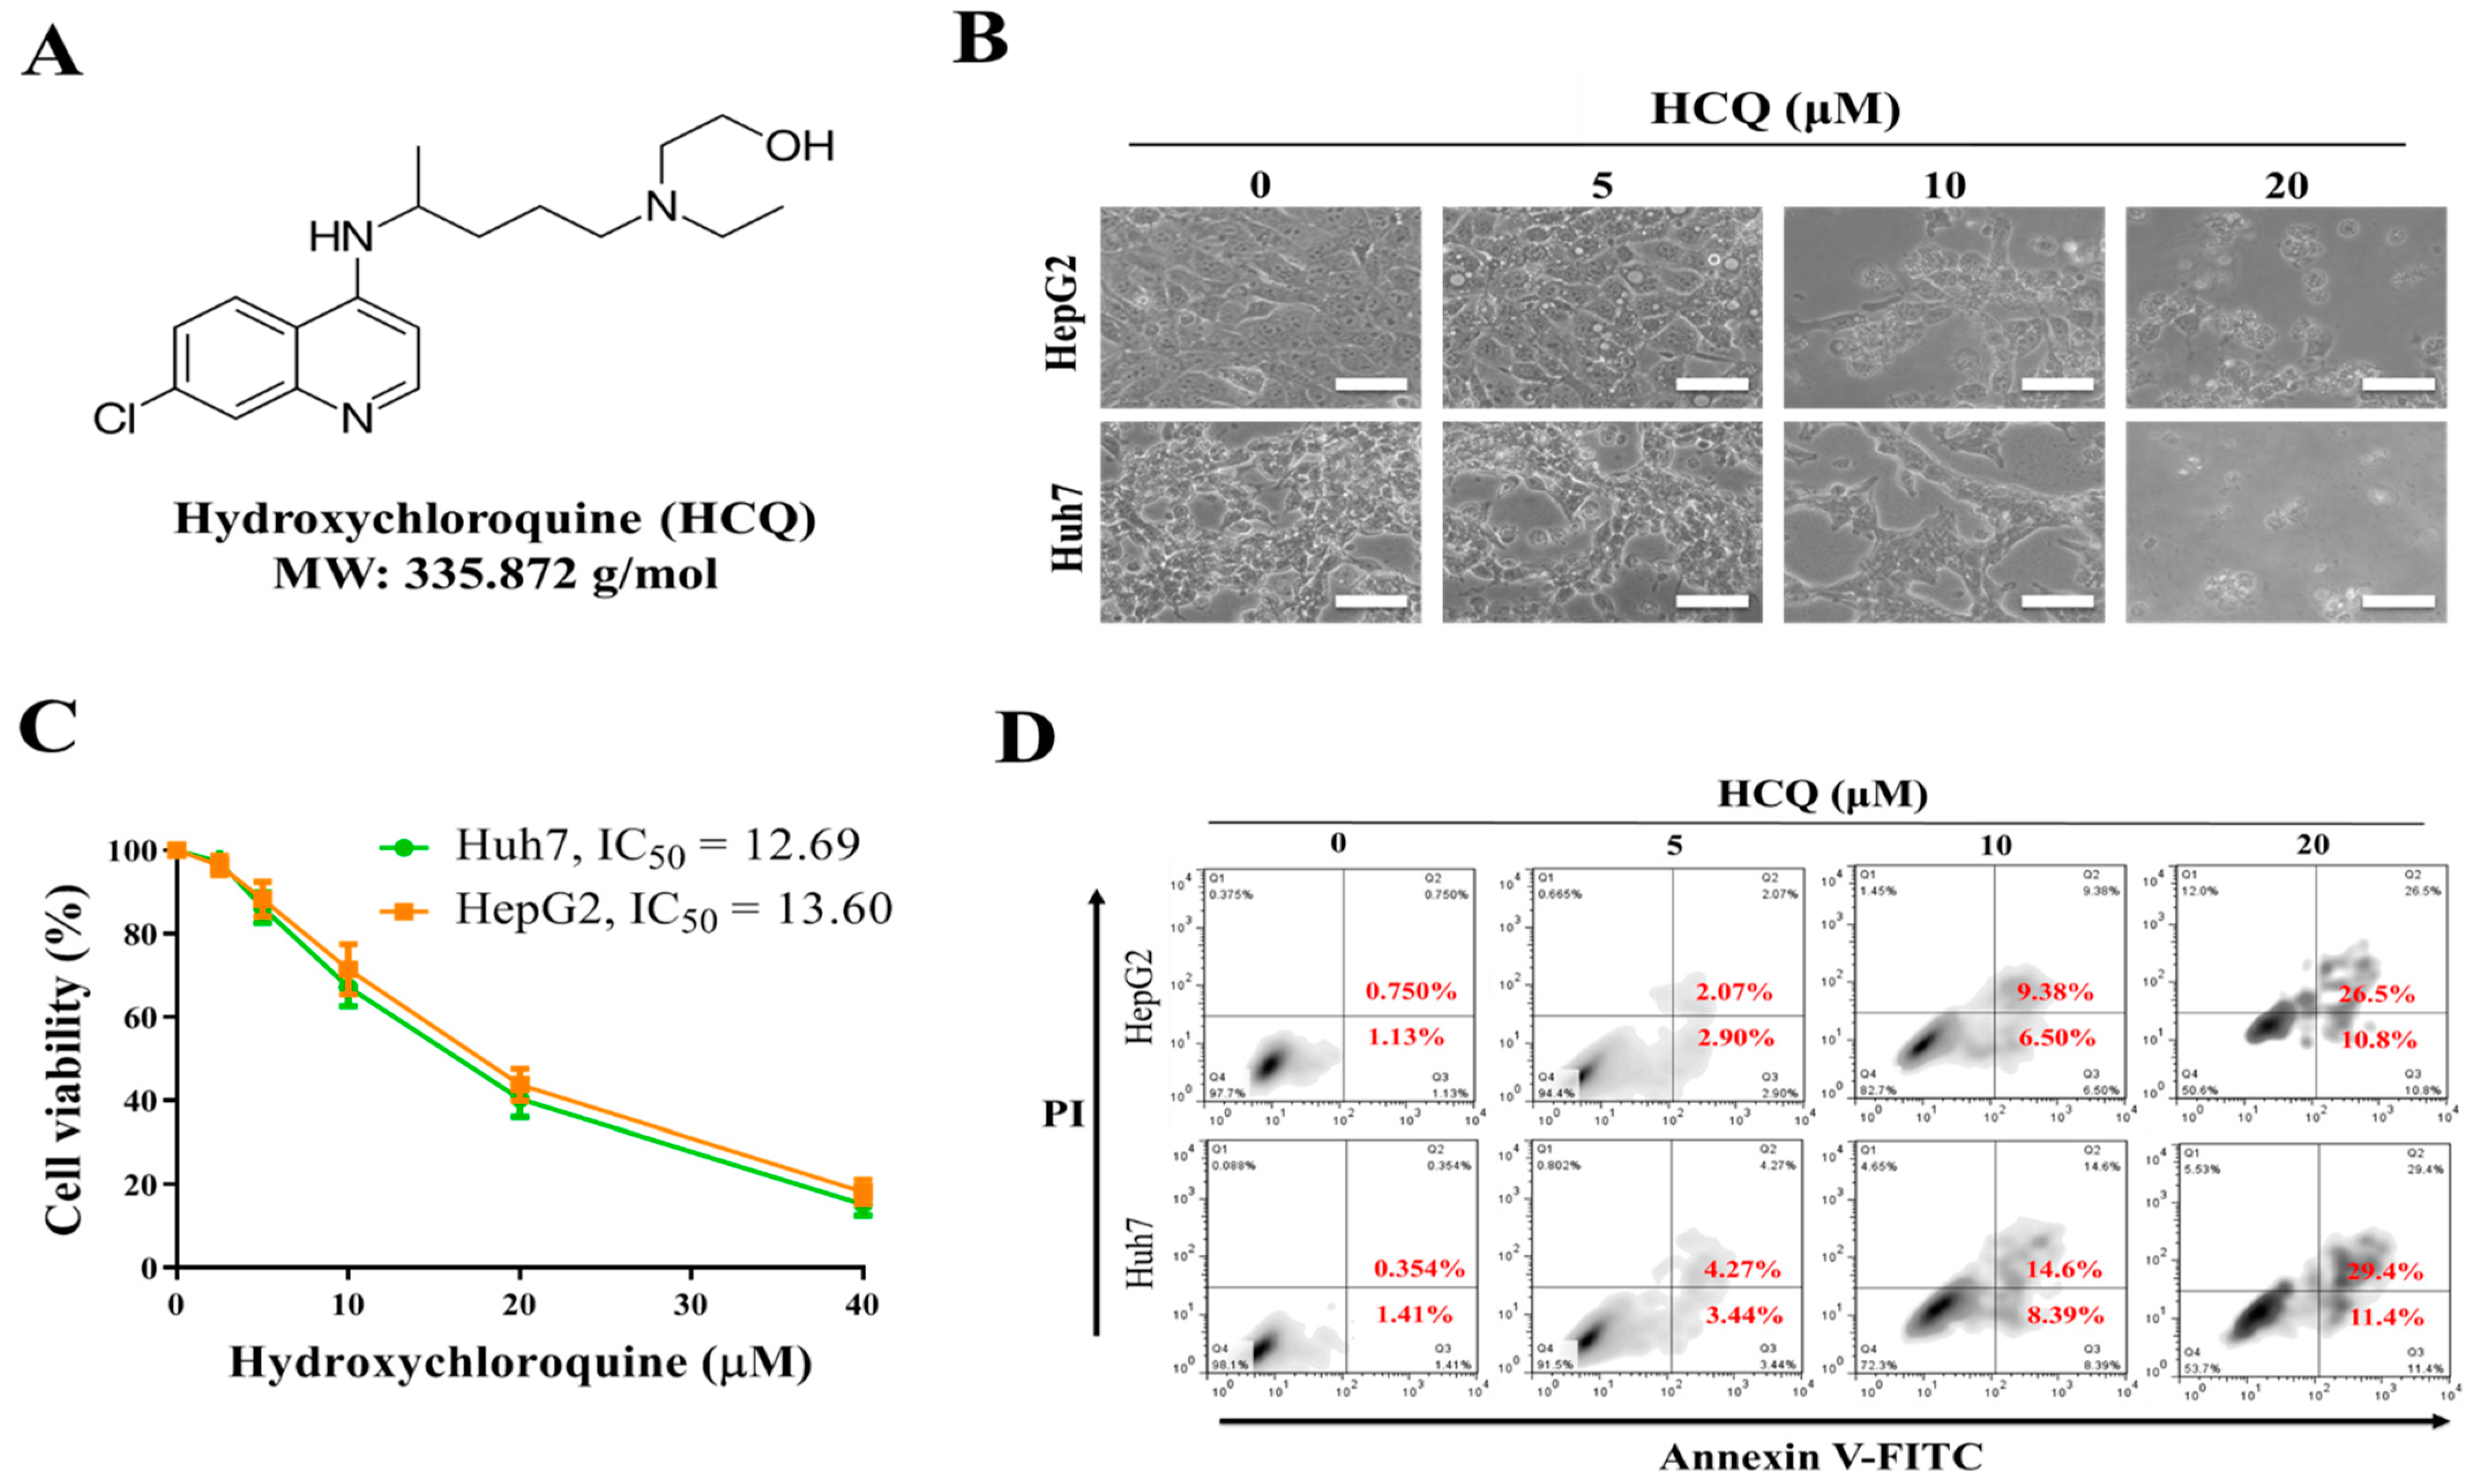
3.2. Hydroxychloroquine (HCQ) Suppressed the Cell Proliferation and Viability of HCC Cell Lines
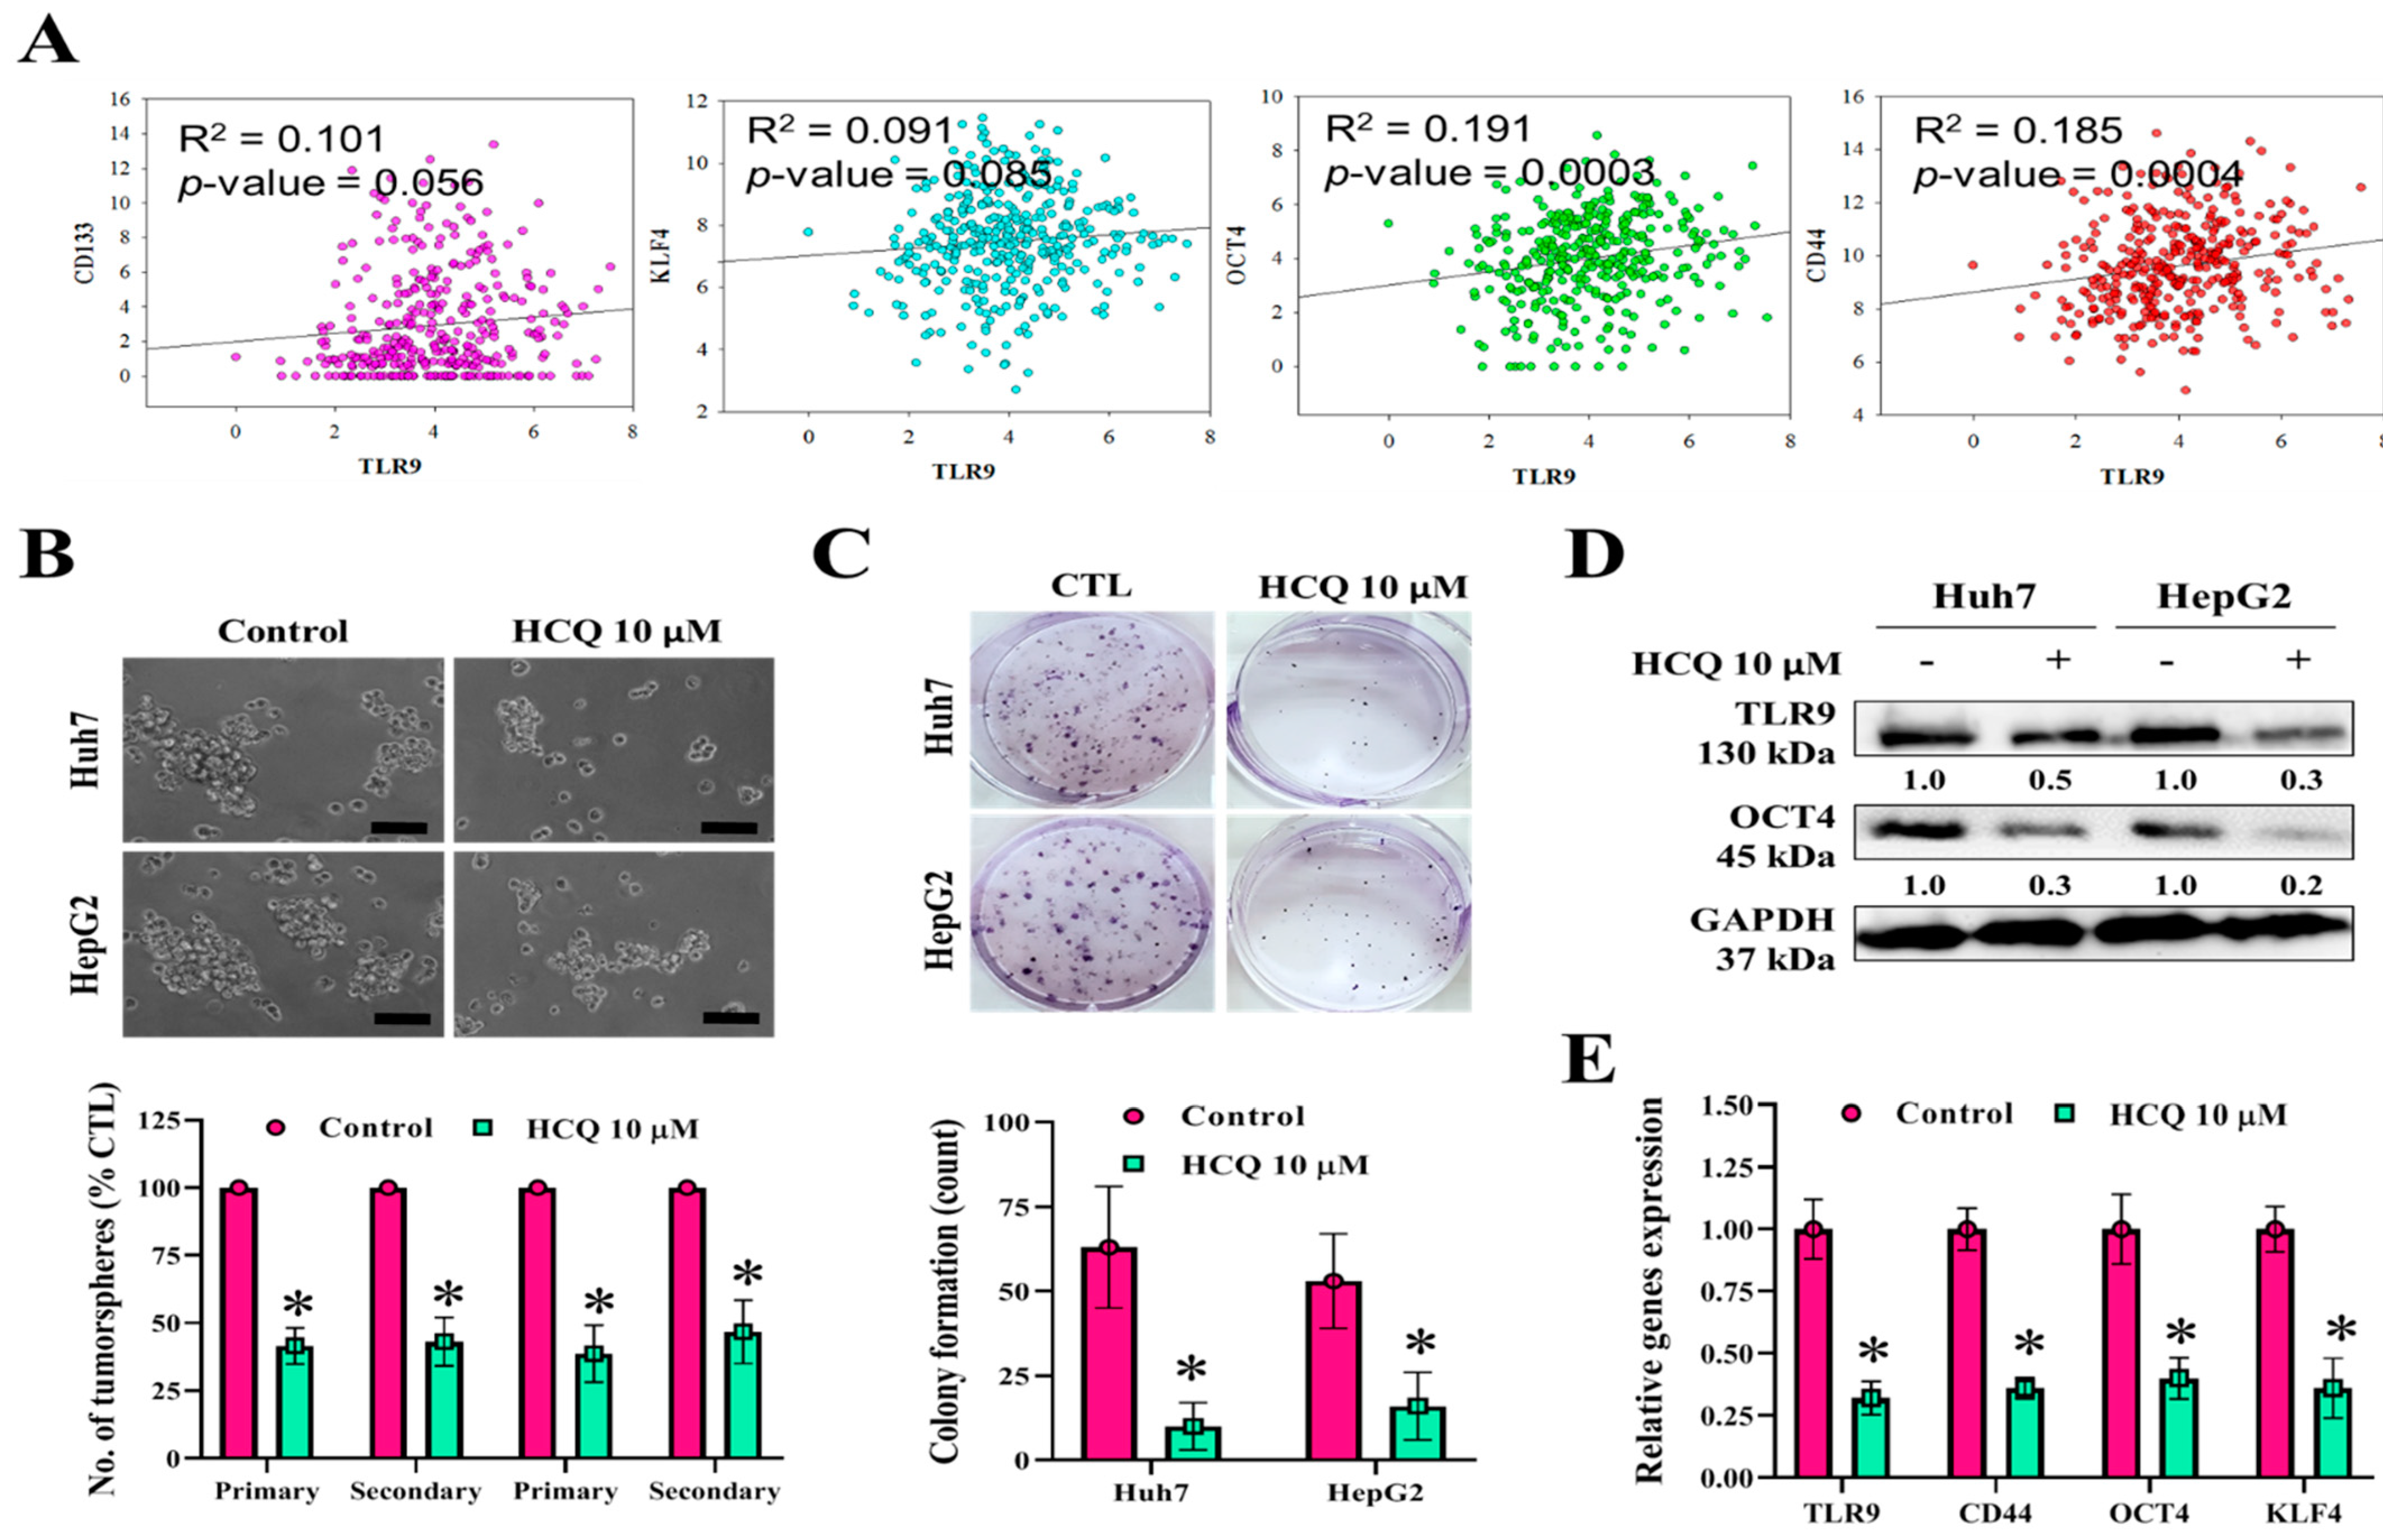
3.3. HCQ Treatment Inhibited Tumor Spheroid Growth and Stem/Self-Renewal Properties of HCC Cell Lines
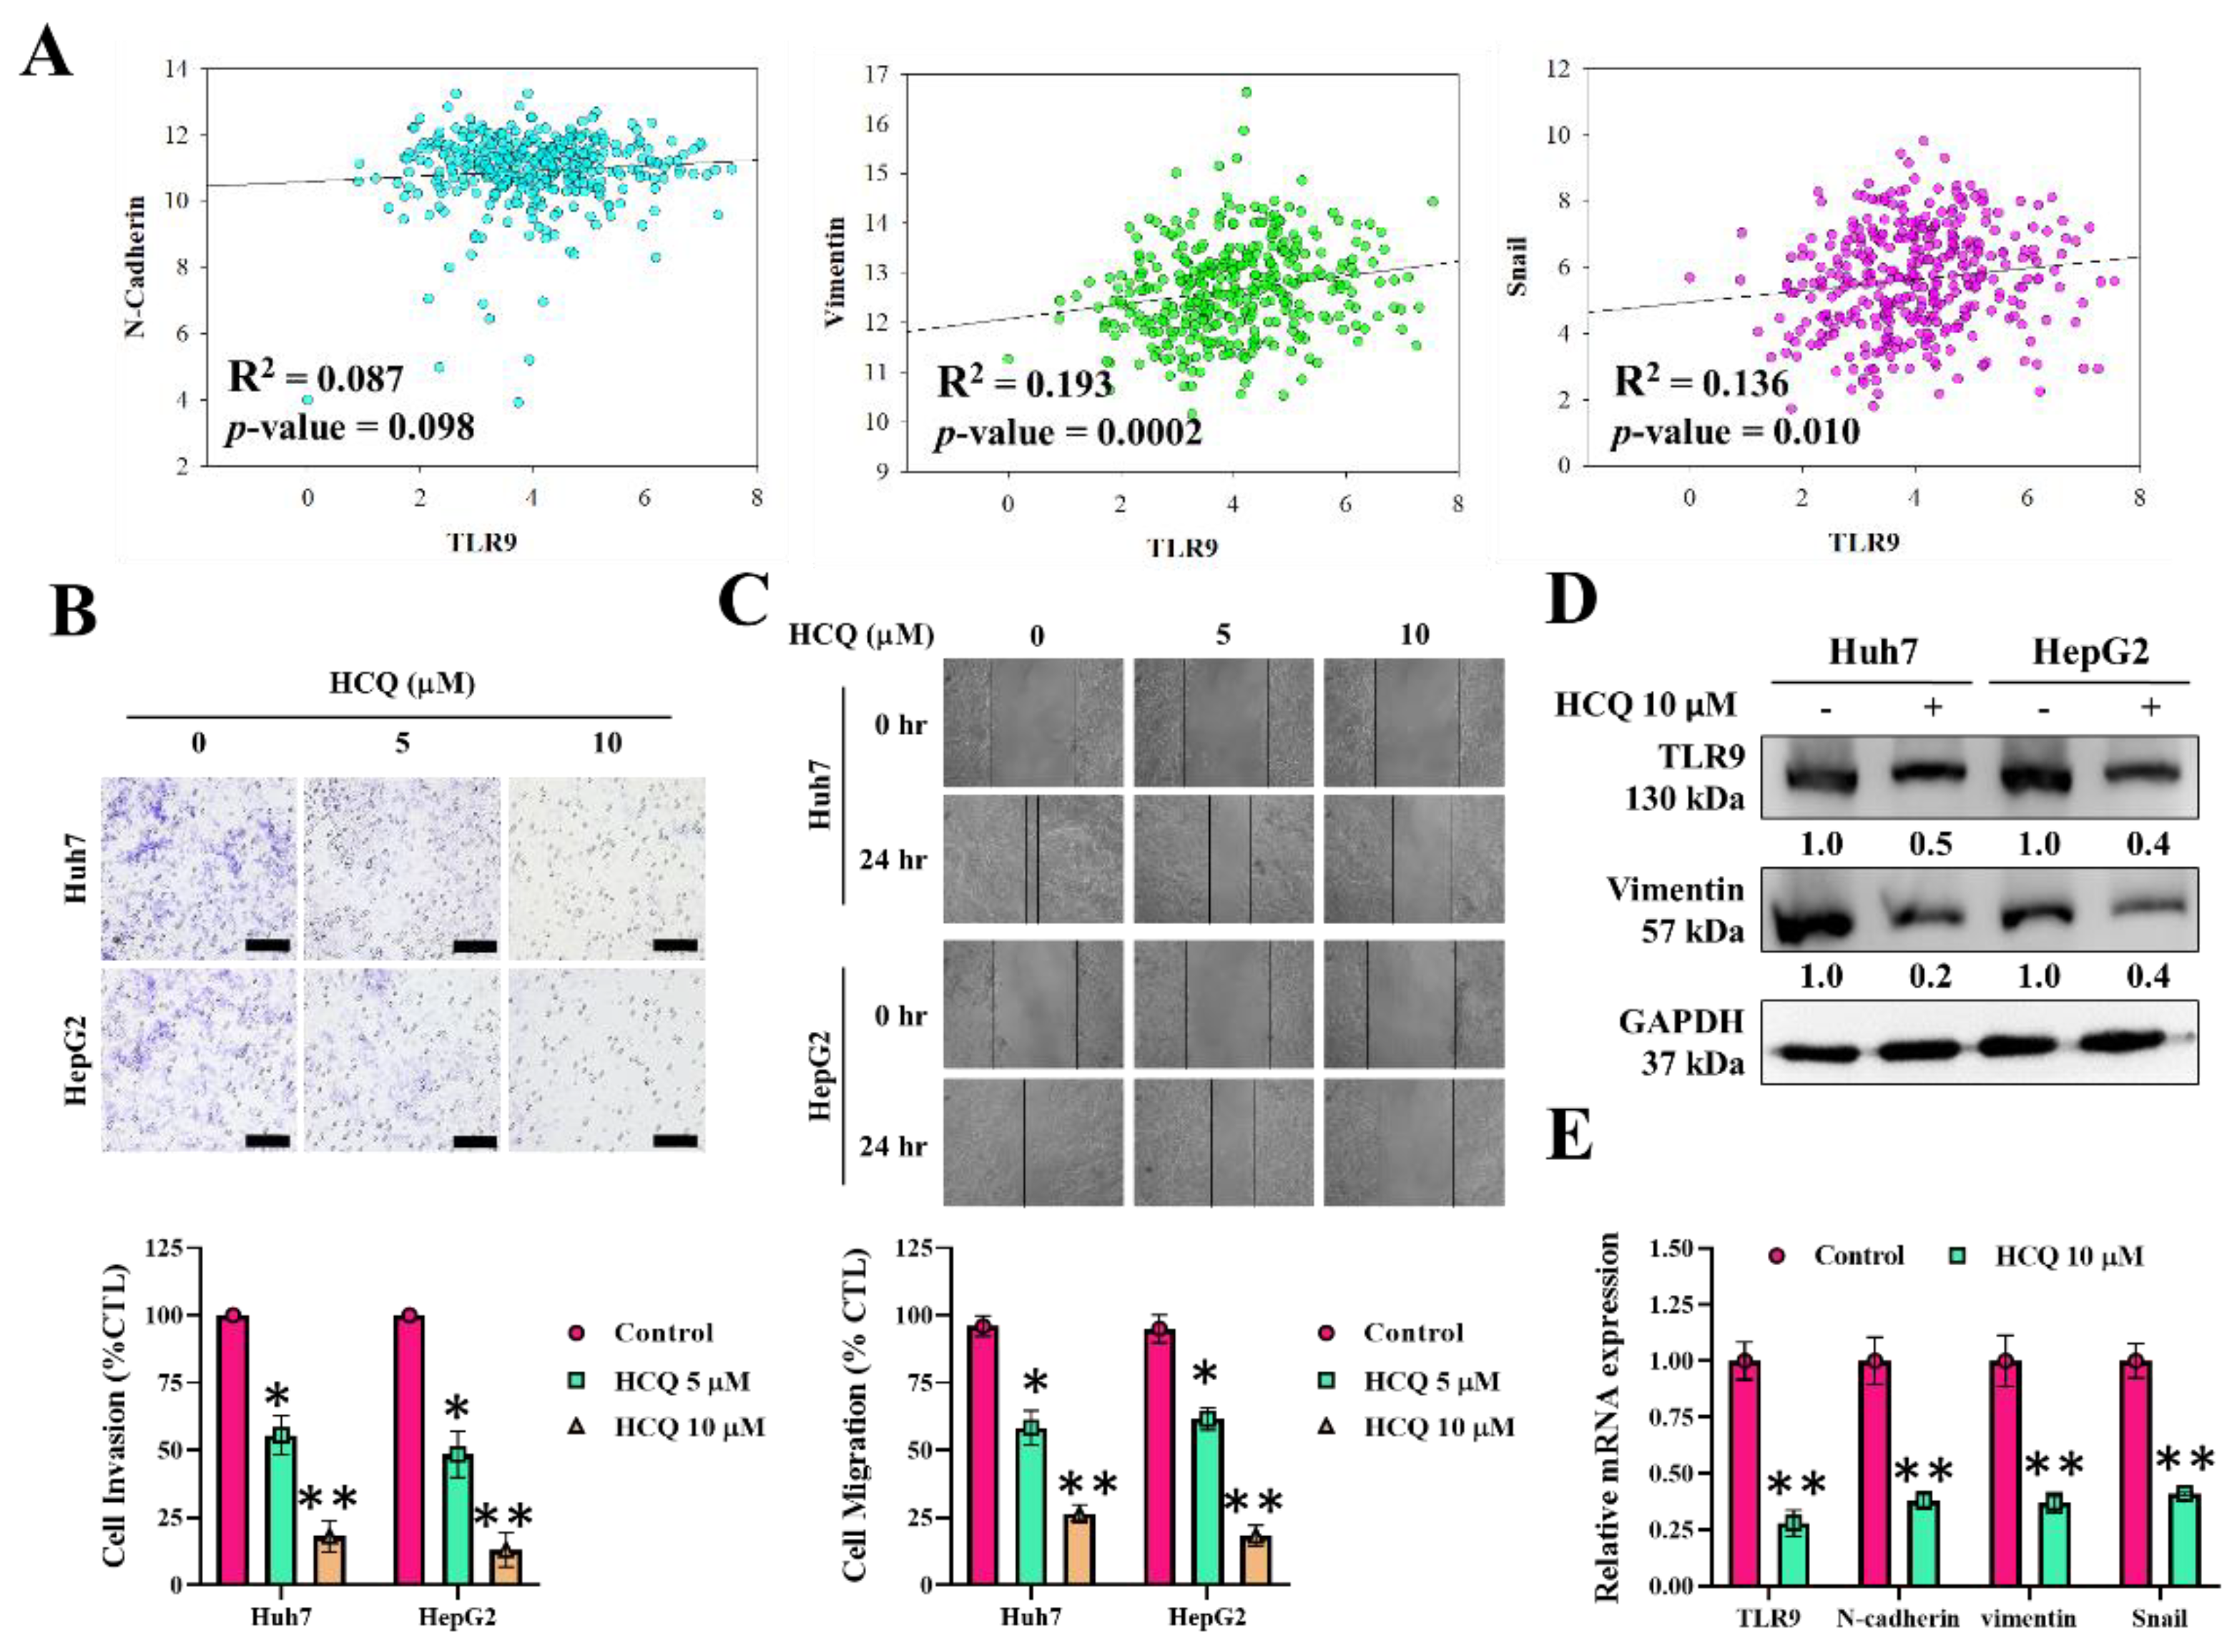
3.4. HCQ Inhibited Oncogenic Potential by Reducing Migration and Invasion of HCC Cells
3.5. HCQ Modulated the Expression of Oxidative Stress Marker (SOD1) in HCC Cells
3.6. HCQ Displayed a Synergistic Effect with the Sorafenib on HCC Sorafenib-Resistant Cells
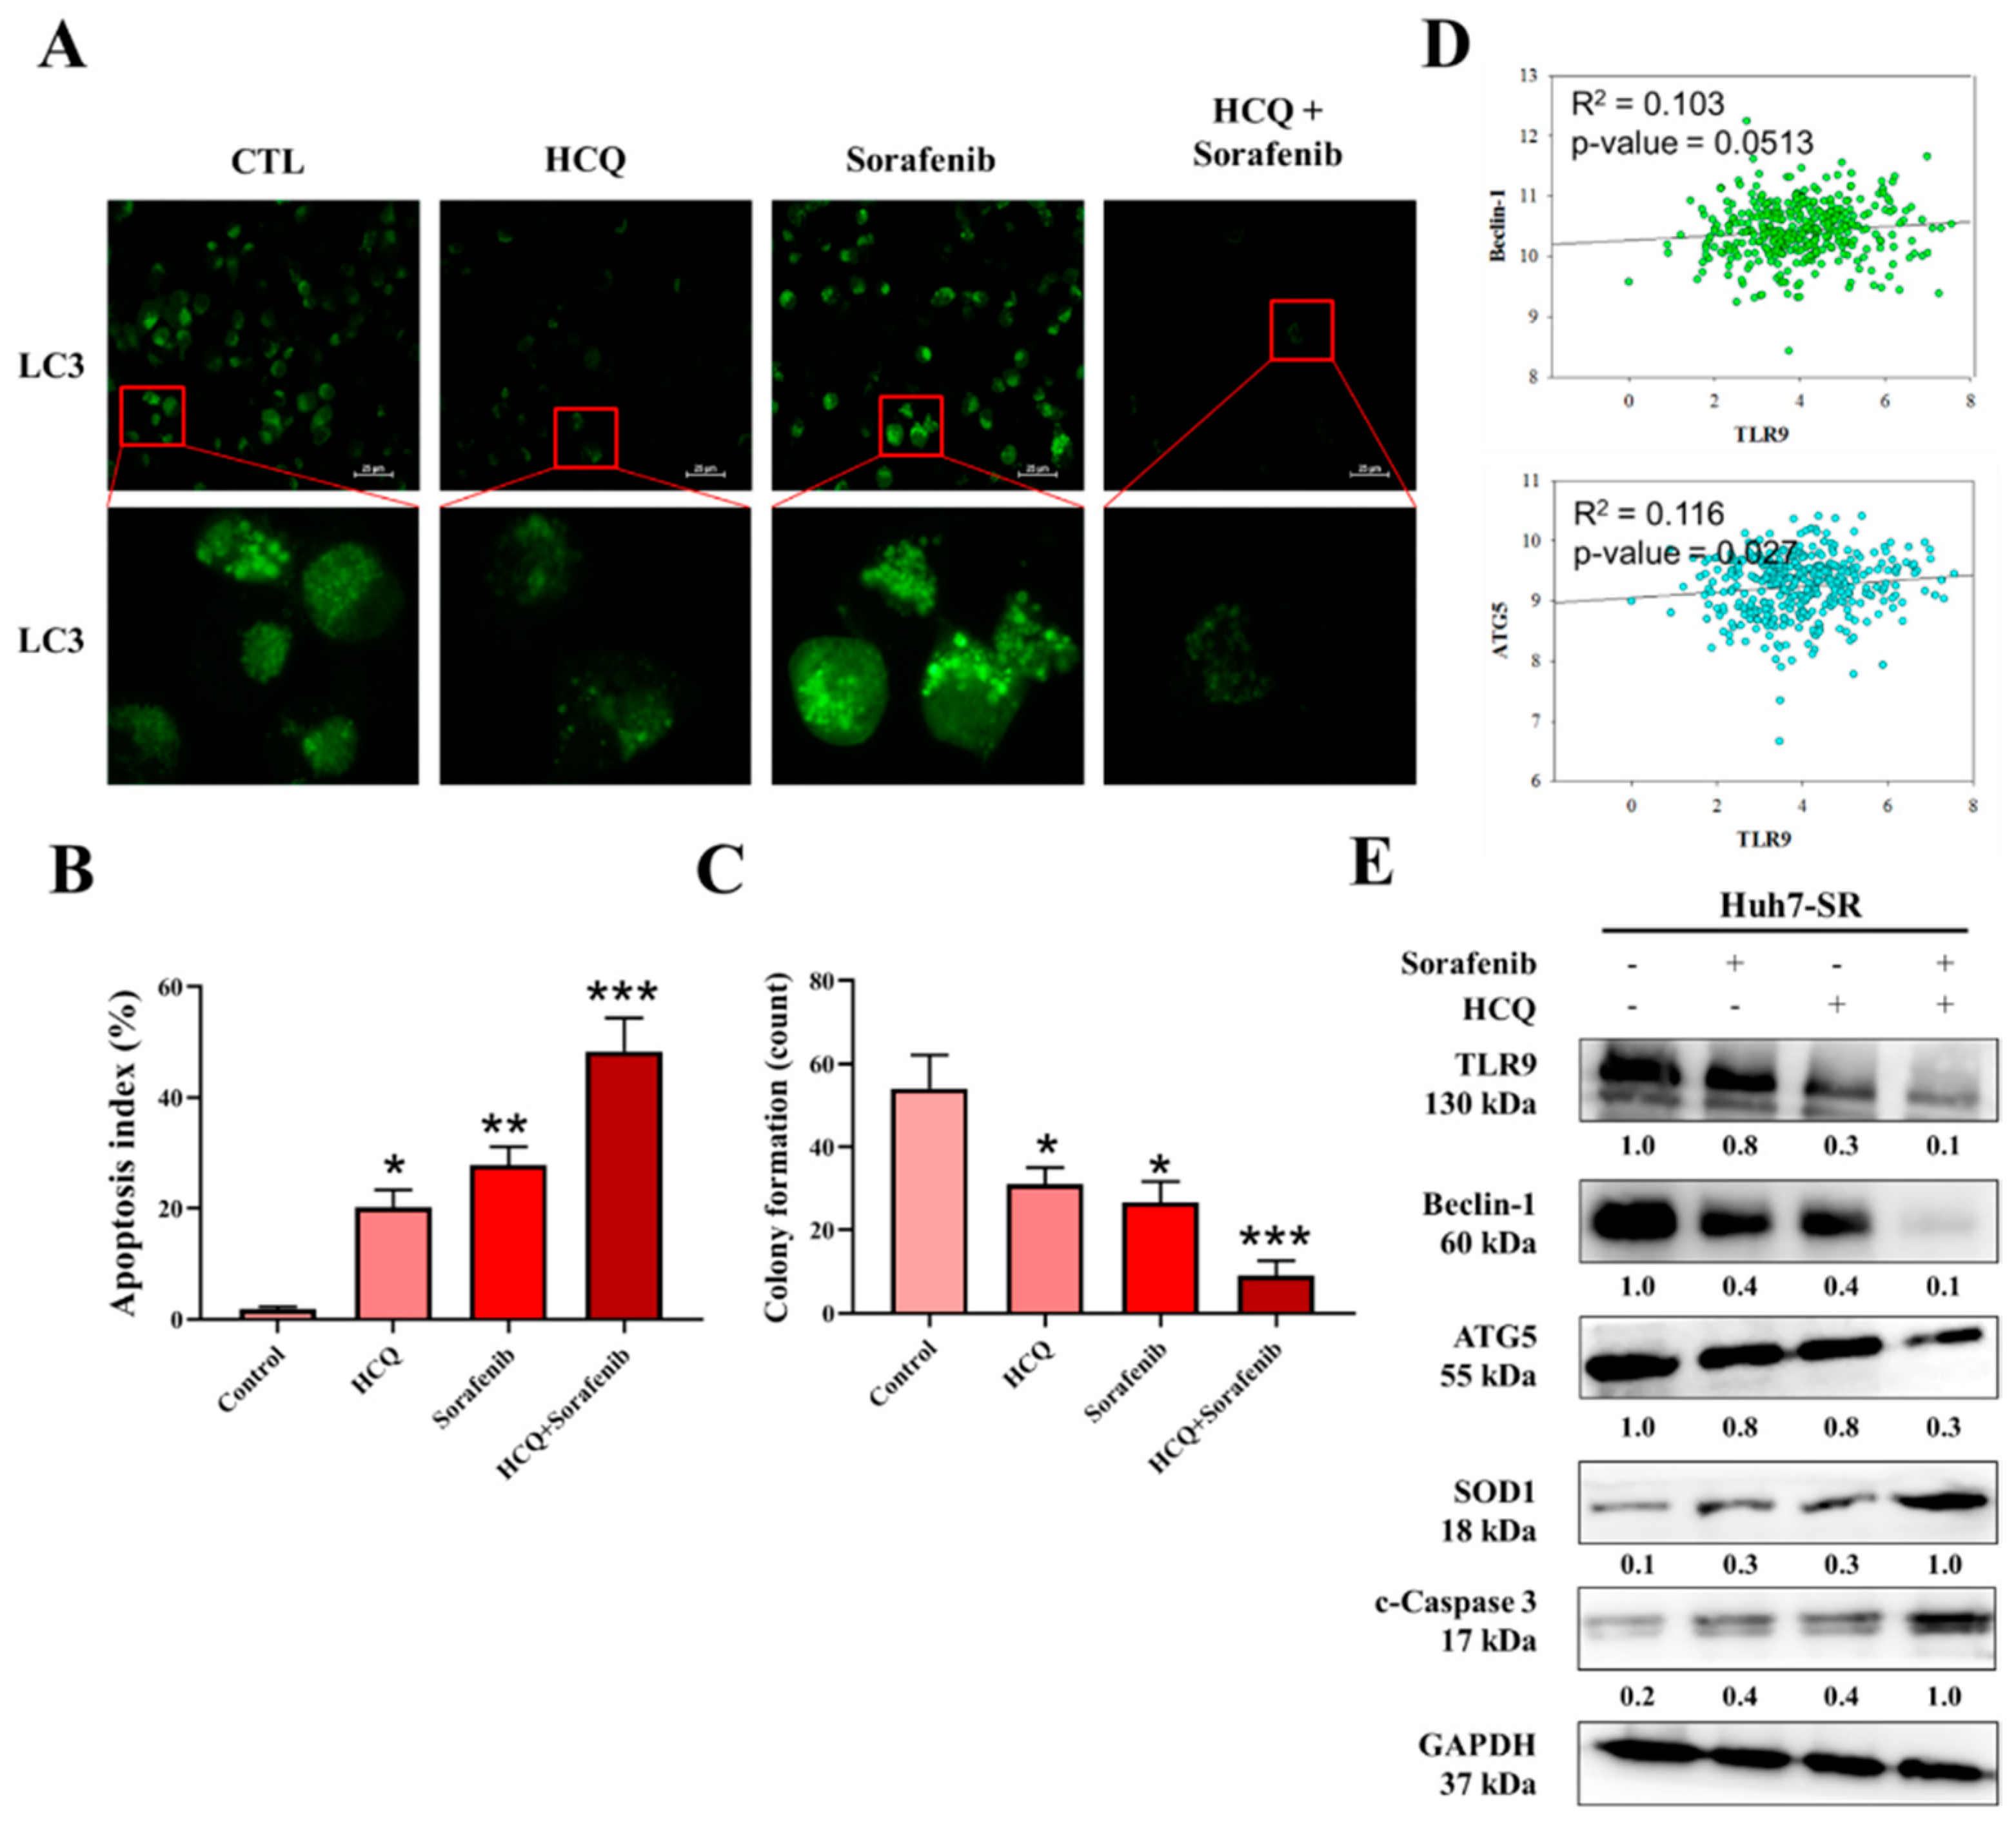
3.7. HCQ Treatment Modulated the Autophagy and Apoptosis of HCC Sorafenib-Resistant Cells In Vitro
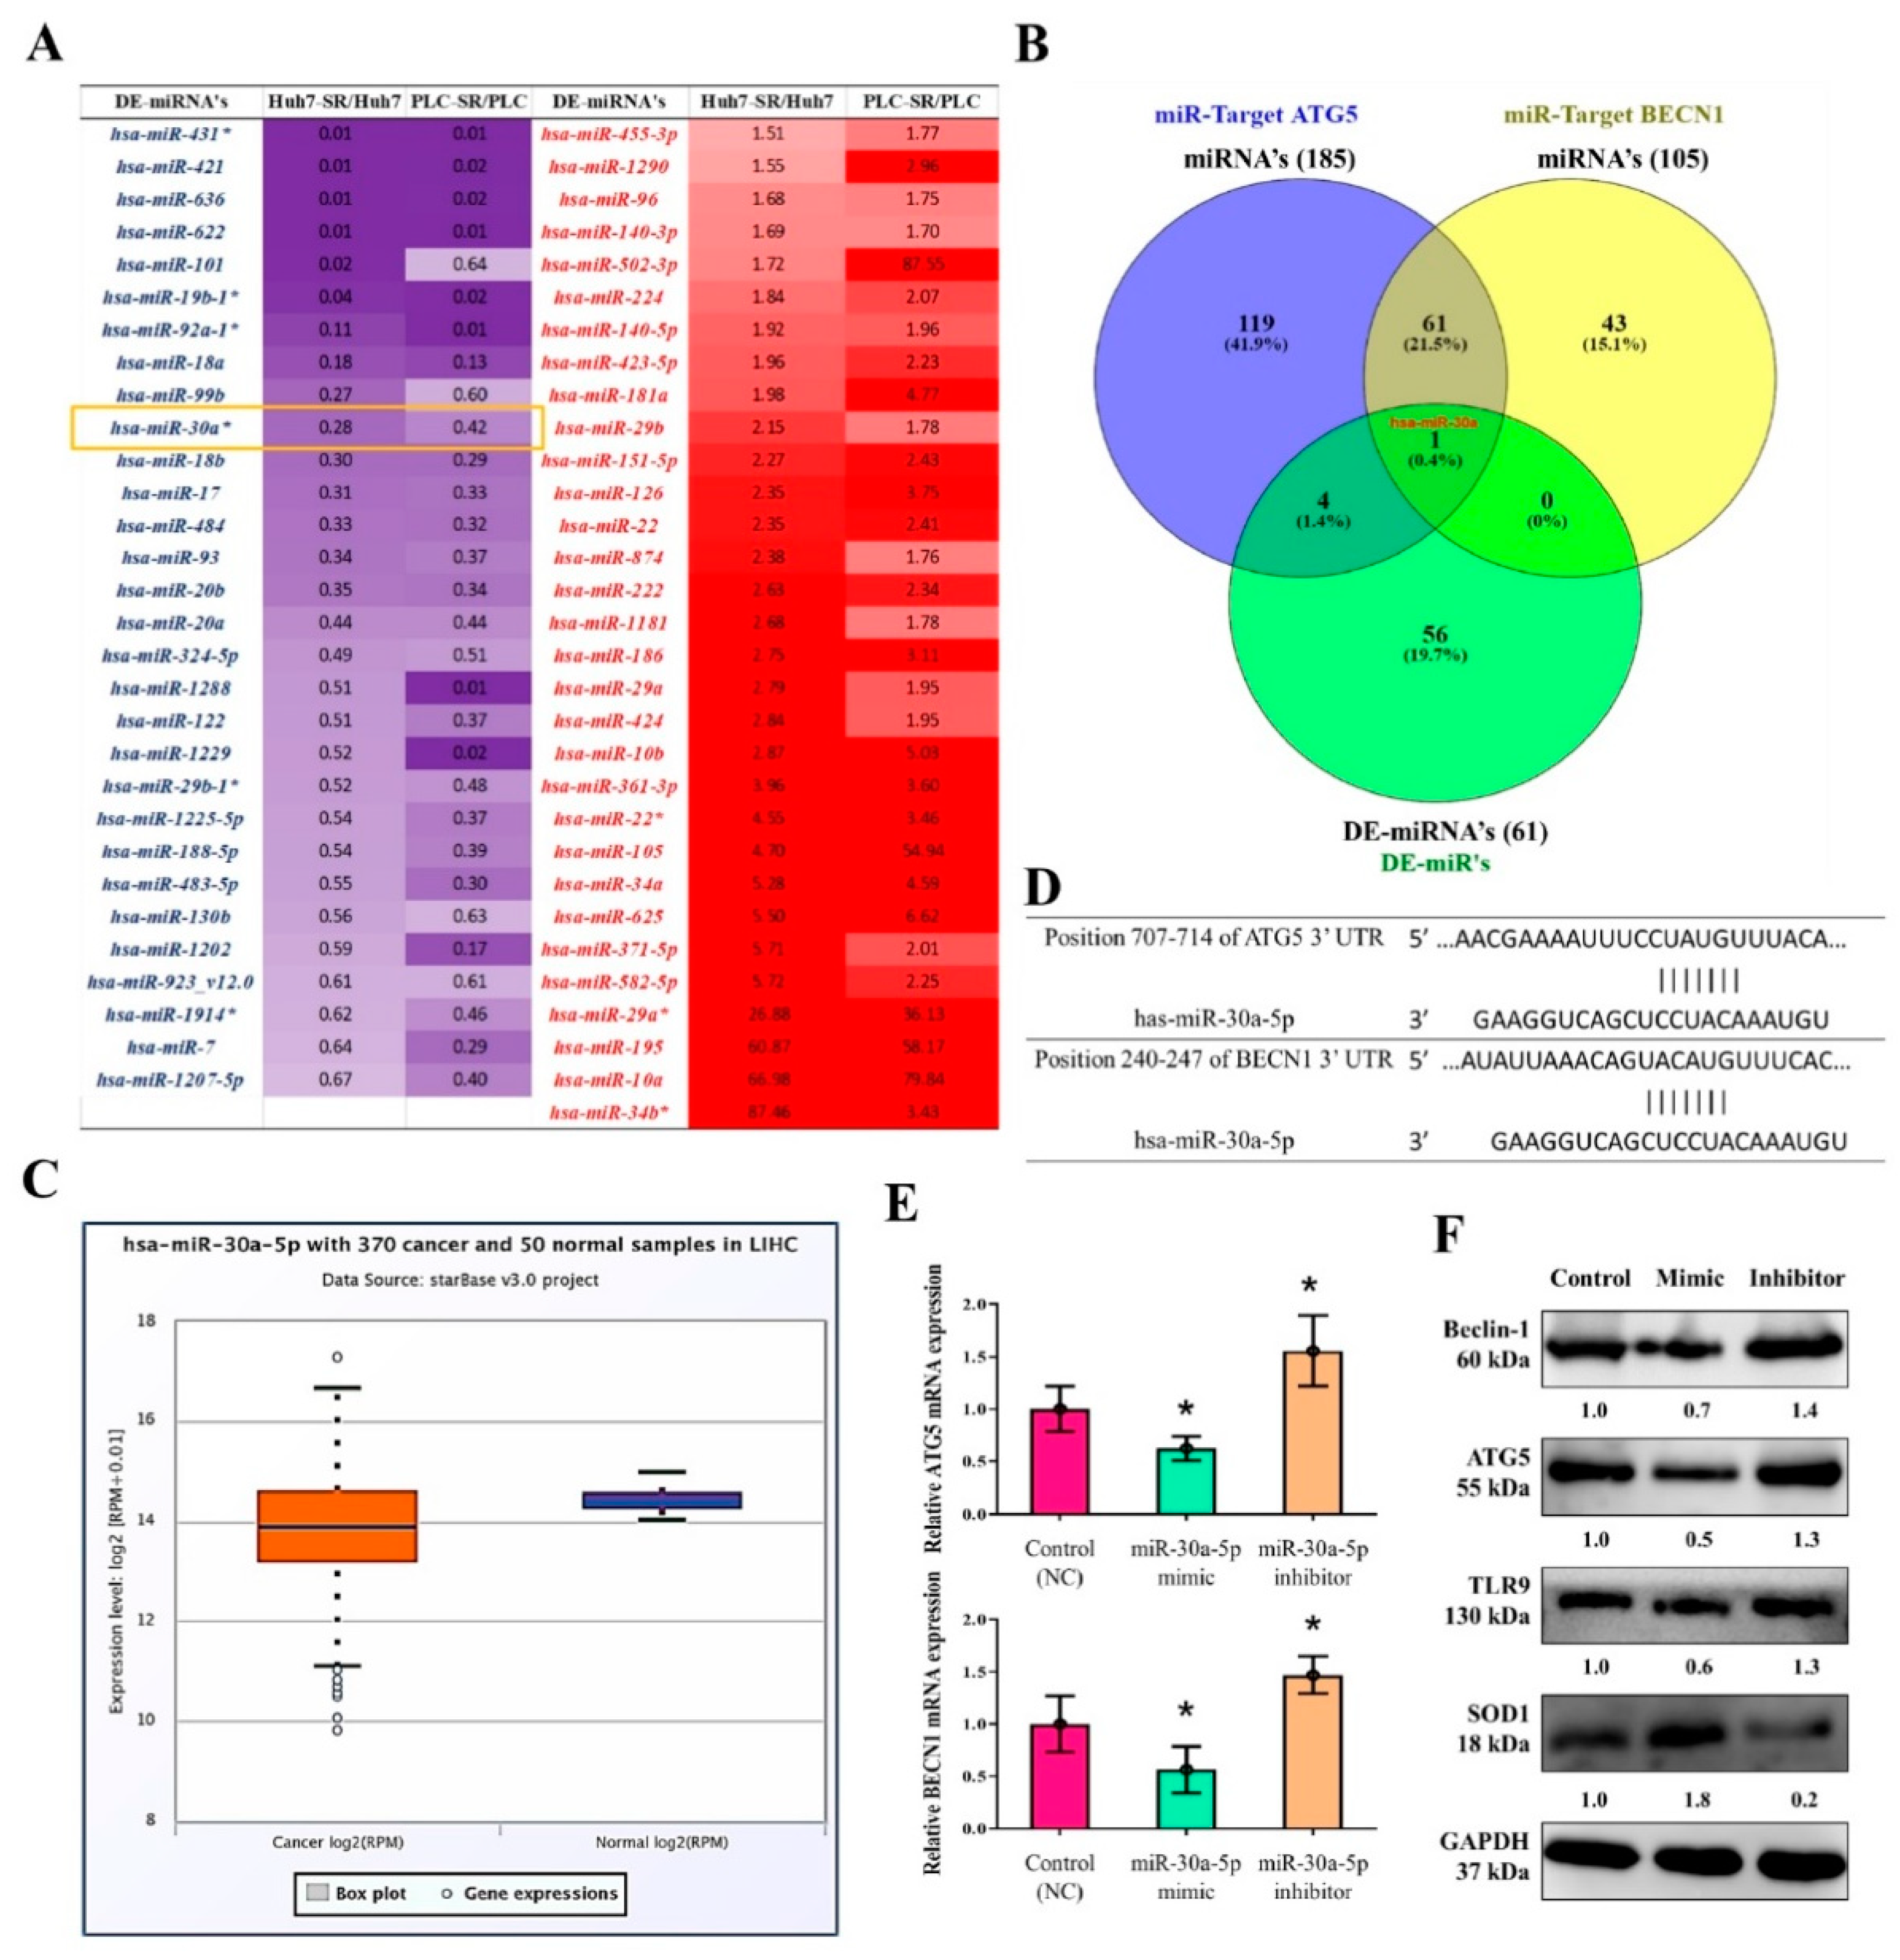
3.8. MiR-30a-5p Regulated the Expression of Autophagy Cell Markers in Sorafenib-Resistant HCC Cells
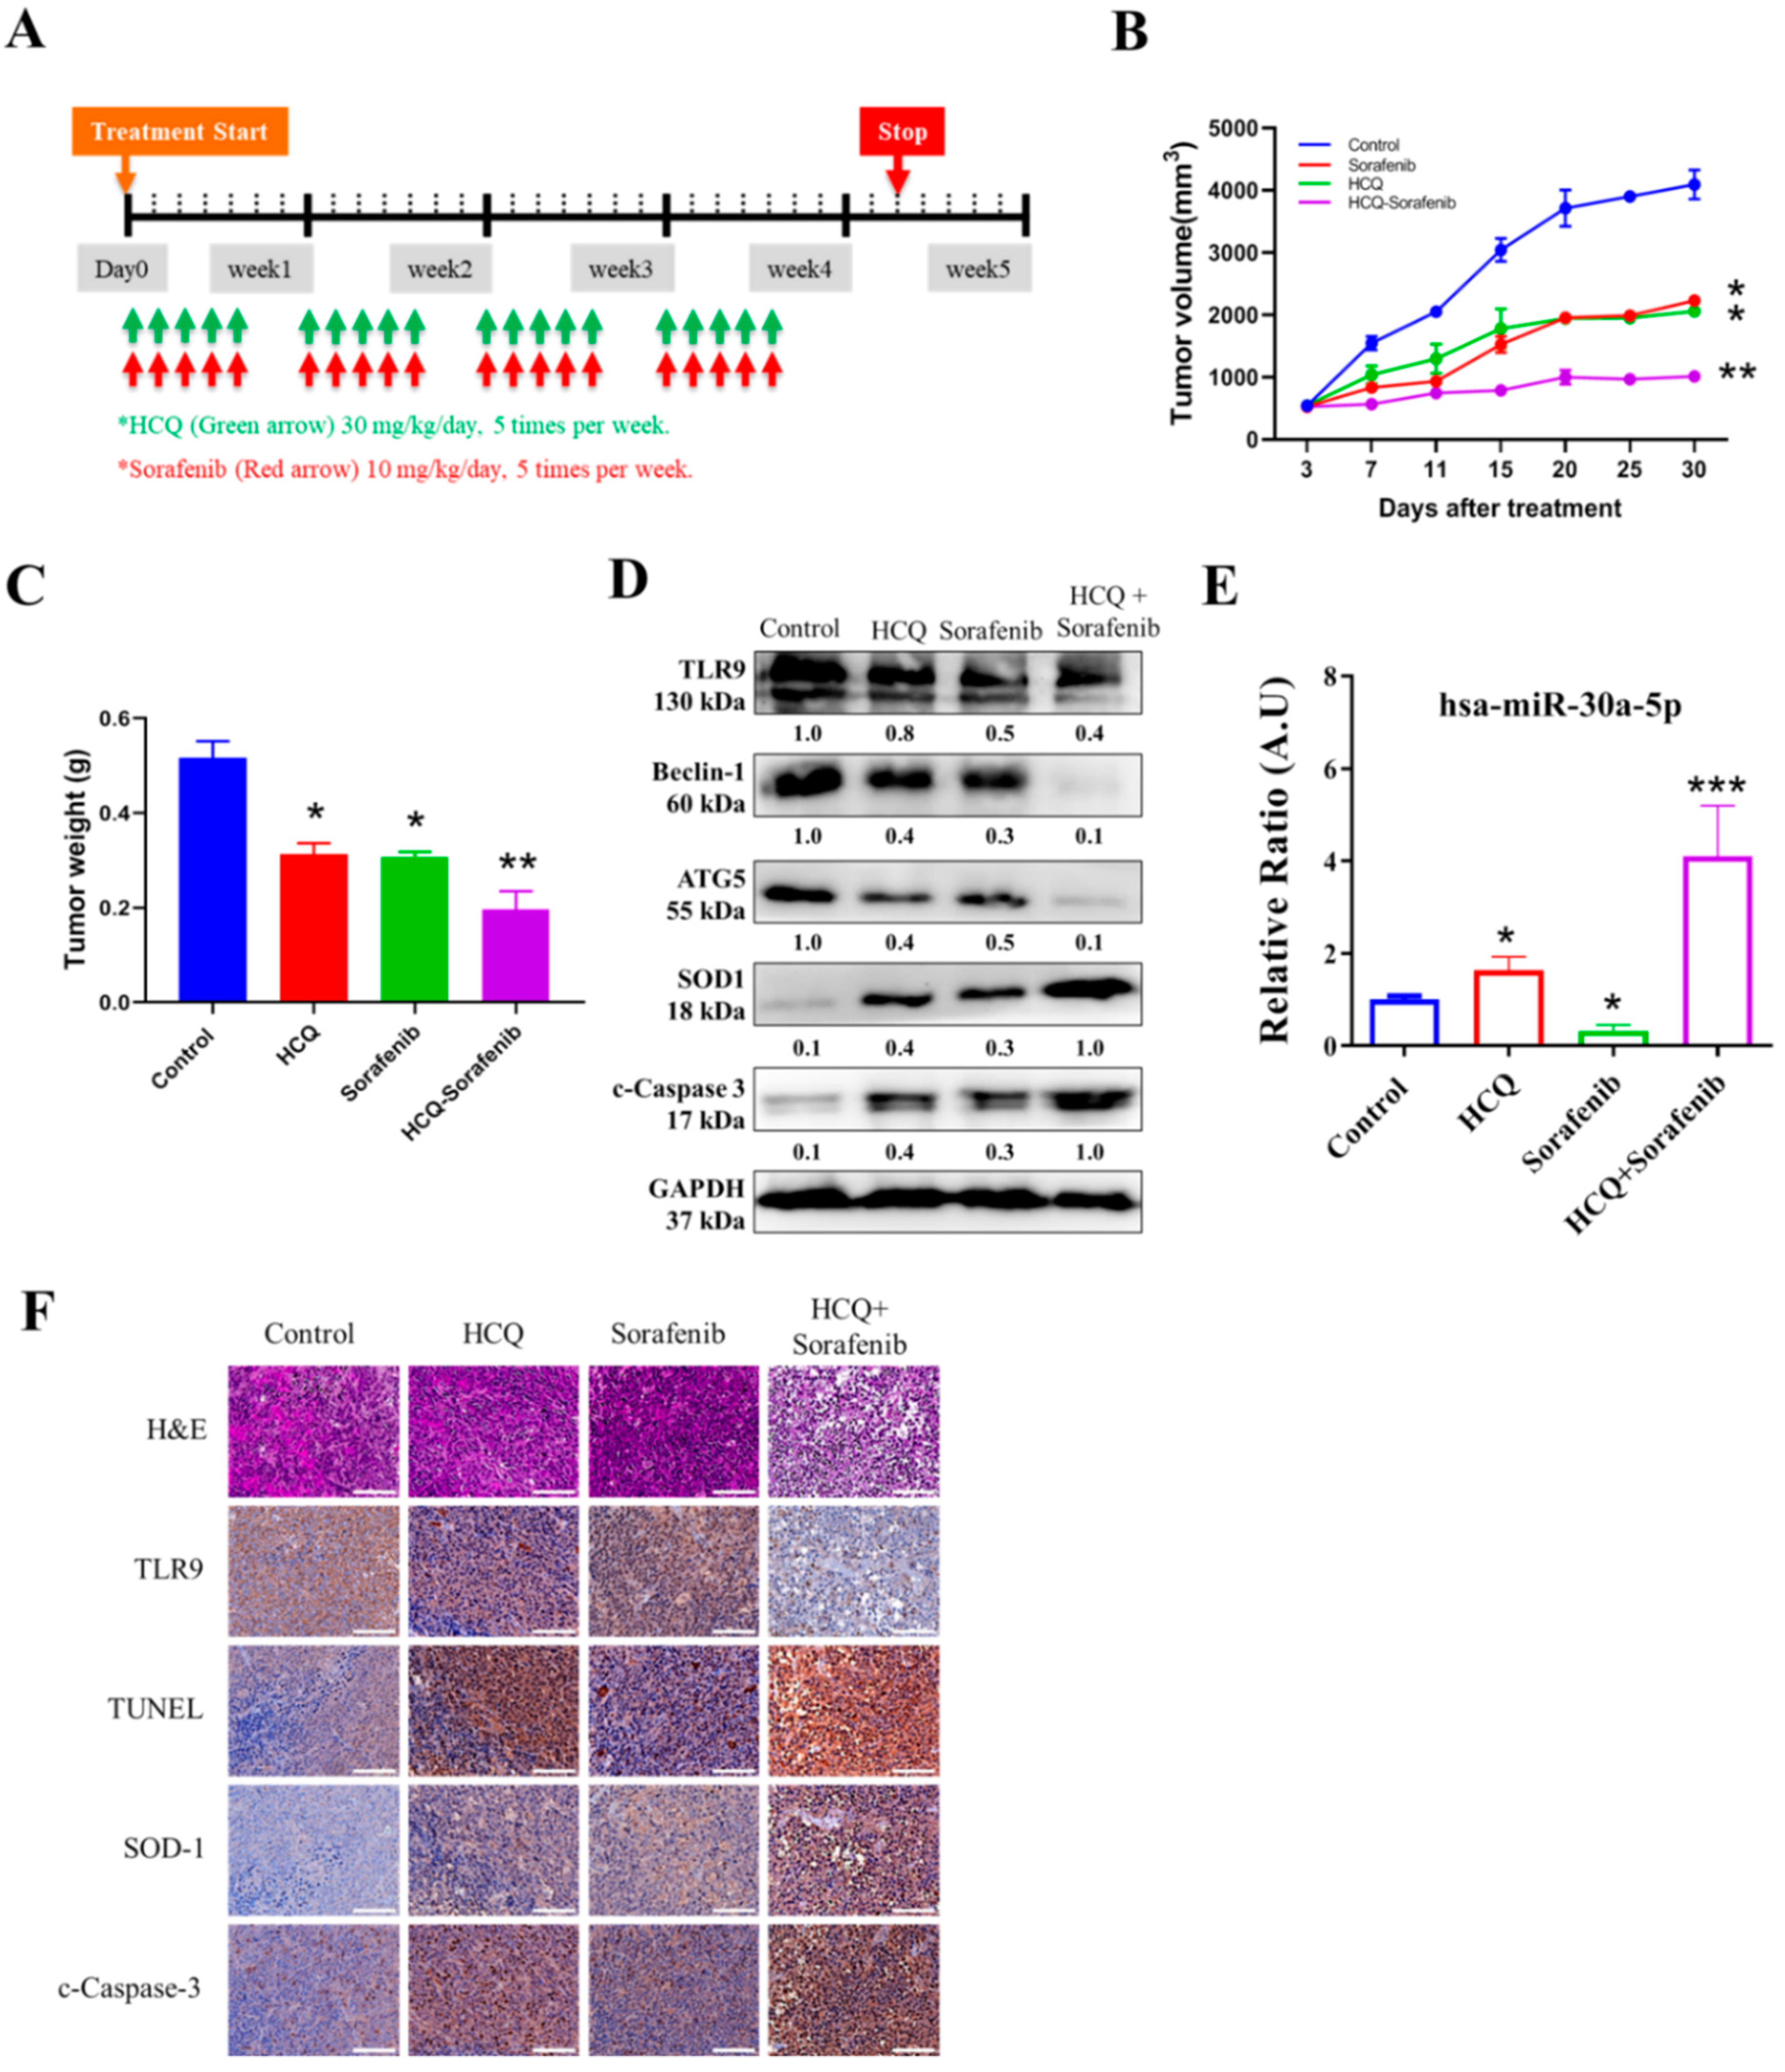
3.9. In Vivo Effect of HCQ Treatment Sensitized Sorafenib Efficacy on Sorafenib-Resistant HCC Cells
4. Discussion
5. Conclusions
Supplementary Materials
Author Contributions
Funding
Institutional Review Board Statement
Informed Consent Statement
Data Availability Statement
Acknowledgments
Conflicts of Interest
References
- Siegel, R.L.; Miller, K.D.; Jemal, A. Cancer statistics, 2016. CA Cancer J. Clin. 2016, 66, 7–30. [Google Scholar] [CrossRef]
- Hartke, J.; Johnson, M.; Ghabril, M. Seminars in Diagnostic Pathology; Elsevier: Amsterdam, The Netherlands, 2017; Volume 34, pp. 153–159. [Google Scholar]
- Bray, F.; Ferlay, J.; Soerjomataram, I.; Siegel, R.L.; Torre, L.A.; Jemal, A. Global cancer statistics 2018: GLOBOCAN estimates of incidence and mortality worldwide for 36 cancers in 185 countries. CA Cancer J. Clin. 2018, 68, 394–424. [Google Scholar] [CrossRef]
- Golabi, P.; Fazel, S.; Otgonsuren, M.; Sayiner, M.; Locklear, C.T.; Younossi, Z.M. Mortality assessment of patients with hepatocellular carcinoma according to underlying disease and treatment modalities. Medicine 2017, 96, e5904. [Google Scholar] [CrossRef] [PubMed]
- Azumi, J.; Tsubota, T.; Sakabe, T.; Shiota, G. miR-181a induces sorafenib resistance of hepatocellular carcinoma cells through downregulation of RASSF 1 expression. Cancer Sci. 2016, 107, 1256–1262. [Google Scholar] [CrossRef] [PubMed]
- Spinzi, G.; Paggi, S. Sorafenib in Advanced Hepatocellular Carcinoma. N. Engl. J. Med. 2008, 359, 2497–2499. [Google Scholar] [CrossRef] [PubMed]
- Xu, Y.; Huang, J.; Ma, L.; Shan, J.; Shen, J.; Yang, Z.; Liu, L.; Luo, Y.; Yao, C.; Qian, C. MicroRNA-122 confers sorafenib resistance to hepatocellular carcinoma cells by targeting IGF-1R to regulate RAS/RAF/ERK signaling pathways. Cancer Lett. 2016, 371, 171–181. [Google Scholar] [CrossRef]
- Xu, L.; He, M.; Dai, Z.; Yu, J.; Wang, J.; Li, X.; Jiang, B.; Ke, Z.; Su, T.; Peng, Z.; et al. Genomic and transcriptional heterogeneity of multifocal hepatocellular carcinoma. Ann. Oncol. 2019, 30, 990–997. [Google Scholar] [CrossRef]
- Fu, Y.; Chung, F.-L. Oxidative stress and hepatocarcinogenesis. Hepatoma Res. 2018, 4, 39. [Google Scholar] [CrossRef]
- Marra, M.; Sordelli, I.M.; Lombardi, A.; Lamberti, M.; Tarantino, L.; Giudice, A.; Stiuso, P.; Abbruzzese, A.; Sperlongano, R.; Accardo, M.; et al. Molecular targets and oxidative stress biomarkers in hepatocellular carcinoma: An overview. J. Transl. Med. 2011, 9, 171. [Google Scholar] [CrossRef]
- Storz, P. Reactive oxygen species in tumor progression. Front. Biosci. 2005, 10, 1881–1896. [Google Scholar] [CrossRef]
- Wang, R.; Yin, C.; Li, X.; Yang, X.-Z.; Yang, Y.; Zhang, M.-Y.; Wang, H.-Y.; Zheng, X.S. Reduced SOD2 expression is associated with mortality of hepatocellular carcinoma patients in a mutant p53-dependent manner. Aging 2016, 8, 1184–1200. [Google Scholar] [CrossRef]
- Jackson, S.P.; Bartek, J. The DNA-damage response in human biology and disease. Nat. Cell Biol. 2009, 461, 1071–1078. [Google Scholar] [CrossRef]
- Che, M.; Wang, R.; Li, X.; Wang, H.-Y.; Zheng, X.S. Expanding roles of superoxide dismutases in cell regulation and cancer. Drug Discov. Today 2016, 21, 143–149. [Google Scholar] [CrossRef] [PubMed]
- Sturtz, L.A.; Diekert, K.; Jensen, L.T.; Lill, R.; Culotta, V.C. A fraction of yeast Cu, Zn-superoxide dismutase and its metallochaperone, CCS, localize to the intermembrane space of mitochondria. A physiological role for SOD1 in guarding against mitochondrial oxidative damage. J. Biol. Chem. 2001, 276, 38084–38089. [Google Scholar] [CrossRef]
- Miao, L.; Clair, D.K.S. Regulation of superoxide dismutase genes: Implications in disease. Free. Radic. Biol. Med. 2009, 47, 344–356. [Google Scholar] [CrossRef] [PubMed]
- Brasil, A.d.A.; Carvalho, M.D.C.d.; Gerhardt, E.; Queiroz, D.D.; Pereira, M.D.; Outeiro, T.F.; Eleutherio, E.C.A. Characterization of the activity, aggregation, and toxicity of heterodimers of WT and ALS-associated mutant Sod1. Proc. Natl. Acad. Sci. USA 2019, 116, 25991–26000. [Google Scholar] [CrossRef] [PubMed]
- Somwar, R.; Erdjument-Bromage, H.; Larsson, E.; Shum, D.; Lockwood, W.W.; Yang, G.; Sander, C.; Ouerfelli, O.; Tempst, P.J.; Djaballah, D.H.; et al. Superoxide dismutase 1 (SOD1) is a target for a small molecule identified in a screen for inhibitors of the growth of lung adenocarcinoma cell lines. Proc. Natl. Acad. Sci. USA 2011, 108, 16375–16380. [Google Scholar] [CrossRef] [PubMed]
- Glasauer, A.; Sena, L.A.; Diebold, L.P.; Mazar, A.P.; Chandel, N.S. Targeting SOD1 reduces experimental non–small-cell lung cancer. J. Clin. Investig. 2014, 124, 117–128. [Google Scholar] [CrossRef]
- Yang, X.; Lu, D.; Zhuo, J.; Lin, Z.; Yang, M.; Xu, X. The Gut-liver Axis in Immune Remodeling: New insight into Liver Diseases. Int. J. Biol. Sci. 2020, 16, 2357–2366. [Google Scholar] [CrossRef]
- Mohamed, F.E.; Al-Jehani, R.M.; Minogue, S.S.; Andreola, F.; Winstanley, A.; Damink, S.W.O.; Habtesion, A.; Malagó, M.; Davies, N.; Luong, T.V.; et al. Effect of toll-like receptor 7 and 9 targeted therapy to prevent the development of hepatocellular carcinoma. Liver Int. 2014, 35, 1063–1076. [Google Scholar] [CrossRef]
- Ryu, J.Y.; Kim, H.U.; Lee, S.Y. Human genes with a greater number of transcript variants tend to show biological features of housekeeping and essential genes. Mol. BioSyst. 2015, 11, 2798–2807. [Google Scholar] [CrossRef]
- Davidson-Moncada, J.; Papavasiliou, F.N.; Tam, W. MiRNAs of the immune system: Roles in inflammation and cancer. Ann. N. Y. Acad. Sci. 2010, 1183, 183. [Google Scholar] [CrossRef]
- Shenouda, S.K.; Alahari, S.K. MicroRNA function in cancer: Oncogene or a tumor suppressor? Cancer Metastasis Rev. 2009, 28, 369–378. [Google Scholar] [CrossRef]
- Vidigal, J.A.; Ventura, A. The biological functions of miRNAs: Lessons from in vivo studies. Trends Cell Biol. 2015, 25, 137–147. [Google Scholar] [CrossRef]
- Liu, K.; Liu, S.; Zhang, W.; Ji, B.; Wang, Y.; Liu, Y. miR-222 regulates sorafenib resistance and enhance tumorigenicity in hepatocellular carcinoma. Int. J. Oncol. 2014, 45, 1537–1546. [Google Scholar] [CrossRef]
- Song, L.; Li, Y.; Li, W.; Wu, S.; Li, Z. miR-495 Enhances the Sensitivity of Non-Small Cell Lung Cancer Cells to Platinum by Modulation of Copper-Transporting P-type Adenosine Triphosphatase A (ATP7A). J. Cell. Biochem. 2014, 115, 1234–1242. [Google Scholar] [CrossRef] [PubMed]
- Tai, W.-T.; Shiau, C.-W.; Chen, H.-L.; Liu, C.-Y.; Lin, C.-S.; Cheng, A.-L.; Chen, P.-J.; Chen, K.-F. Mcl-1-dependent activation of Beclin 1 mediates autophagic cell death induced by sorafenib and SC-59 in hepatocellular carcinoma cells. Cell Death Dis. 2013, 4, e485. [Google Scholar] [CrossRef] [PubMed]
- Janku, F.; McConkey, D.J.; Hong, D.S.; Kurzrock, R. Autophagy as a target for anticancer therapy. Nat. Rev. Clin. Oncol. 2011, 8, 528–539. [Google Scholar] [CrossRef] [PubMed]
- Mizushima, N. Autophagy: Process and function. Genes Dev. 2007, 21, 2861–2873. [Google Scholar] [CrossRef] [PubMed]
- David, R. Metabolism: Keeping fit with autophagy. Nat. Rev. Mol. Cell Biol. 2012, 13, 136. [Google Scholar] [CrossRef]
- Rosenfeldt, M.T.; Ryan, K.M. The role of autophagy in tumour development and cancer therapy. Expert Rev. Mol. Med. 2009, 11, e36. [Google Scholar] [CrossRef]
- Yun, C.W.; Lee, S.H. The Roles of Autophagy in Cancer. Int. J. Mol. Sci. 2018, 19, 3466. [Google Scholar] [CrossRef]
- Han, J.; Li, X.; Luo, X.; He, J.; Huang, X.; Zhou, Q.; Han, Y.; Jie, H.; Zhuang, J.; Li, Y.; et al. The mechanisms of hydroxychloroquine in rheumatoid arthritis treatment: Inhibition of dendritic cell functions via Toll like receptor 9 signaling. Biomed Pharmacother. 2020, 132, 110–114. [Google Scholar] [CrossRef]
- Zhang, Z.; Zhou, L.; Xie, N.; Nice, E.C.; Zhang, T.; Cui, Y.; Huang, C. Overcoming cancer therapeutic bottleneck by drug repurposing. Signal Transduct. Target. Ther. 2020, 5, 1–25. [Google Scholar] [CrossRef] [PubMed]
- Poklepovic, A.; Gewirtz, D.A. Outcome of early clinical trials of the combination of hydroxychloroquine with chemotherapy in cancer. Autophagy 2014, 10, 1478–1480. [Google Scholar] [CrossRef] [PubMed]
- Mauthe, M.; Orhon, I.; Rocchi, C.; Zhou, X.; Luhr, M.; Hijlkema, K.-J.; Coppes, R.P.; Engedal, N.; Mari, M.; Reggiori, F. Chloroquine inhibits autophagic flux by decreasing autophagosome-lysosome fusion. Autophagy 2018, 14, 1435–1455. [Google Scholar] [CrossRef] [PubMed]
- Dean, M.; Fojo, T.; Bates, S.E. Tumour stem cells and drug resistance. Nat. Rev. Cancer 2005, 5, 275–284. [Google Scholar] [CrossRef]
- Park, C.Y.; Tseng, D.; Weissman, I.L. Cancer Stem Cell–Directed Therapies: Recent Data from the Laboratory and Clinic. Mol. Ther. 2009, 17, 219–230. [Google Scholar] [CrossRef]
- Zhao, W.; Wang, L.; Han, H.; Jin, K.; Lin, N.; Guo, T.; Chen, Y.; Cheng, H.; Lu, F.; Fang, W.; et al. 1B50-1, a mAb Raised against Recurrent Tumor Cells, Targets Liver Tumor-Initiating Cells by Binding to the Calcium Channel α2δ1 Subunit. Cancer Cell 2013, 23, 541–556. [Google Scholar] [CrossRef]
- Fernández-Cortés, M.; Delgado-Bellido, D.; Oliver, F.J. Vasculogenic mimicry: Become an endothelial cell “but not so much”. Front. Oncol. 2019, 9, 803. [Google Scholar] [CrossRef]
- Chou, T.-C.; Tan, Q.-H.; Sirotnak, F.M. Quantitation of the synergistic interaction of edatrexate and cisplatin in vitro. Cancer Chemother. Pharmacol. 1993, 31, 259–264. [Google Scholar] [CrossRef] [PubMed]
- Chou, T.-C. Drug Combination Studies and Their Synergy Quantification Using the Chou-Talalay Method. Cancer Res. 2010, 70, 440–446. [Google Scholar] [CrossRef] [PubMed]
- Franken, N.A.P.; Rodermond, H.M.; Stap, J.; Haveman, J.; Van Bree, C. Clonogenic assay of cells in vitro. Nat. Protoc. 2006, 1, 2315–2319. [Google Scholar] [CrossRef]
- Braggio, D.; Koller, D.; Jin, F.; Siva, N.; Zewdu, A.; Lopez, G.; Batte, K.; Casadei, L.; Welliver, M.; Strohecker, A.M.; et al. Autophagy inhibition overcomes sorafenib resistance in S45F-mutated desmoid tumors. Cancer 2019, 125, 2693–2703. [Google Scholar] [CrossRef]
- Chen, S.-F.; Chang, Y.-C.; Nieh, S.; Liu, C.-L.; Yang, C.-Y.; Lin, Y.-S. Nonadhesive Culture System as a Model of Rapid Sphere Formation with Cancer Stem Cell Properties. PLoS ONE 2012, 7, e31864. [Google Scholar] [CrossRef] [PubMed]
- Jung, M.-J.; Rho, J.-K.; Kim, Y.-M.; Jung, J.E.; Jin, Y.B.; Ko, Y.-G.; Lee, J.C.; Lee, S.-J.; Park, M.-J. Upregulation of CXCR4 is functionally crucial for maintenance of stemness in drug-resistant non-small cell lung cancer cells. Oncogene 2013, 32, 209–221. [Google Scholar] [CrossRef]
- Suetsugu, A.; Nagaki, M.; Aoki, H.; Motohashi, T.; Kunisada, T.; Moriwaki, H. Characterization of CD133+ hepatocellular carcinoma cells as cancer stem/progenitor cells. Biochem. Biophys. Res. Commun. 2006, 351, 820–824. [Google Scholar] [CrossRef]
- Abou-Alfa, G.K.; Schwartz, L.; Ricci, S.; Amadori, D.; Santoro, A.; Figer, A.; De Greve, J.; Douillard, J.-Y.; Lathia, C.; Schwartz, B.; et al. Phase II Study of Sorafenib in Patients With Advanced Hepatocellular Carcinoma. J. Clin. Oncol. 2006, 24, 4293–4300. [Google Scholar] [CrossRef] [PubMed]
- van Malenstein, H.; Dekervel, J.; Verslype, C.; van Cutsem, E.; Windmolders, P.; Nevens, F.; van Pelt, J. Long-term exposure to sorafenib of liver cancer cells induces resistance with epithelial-to-mesenchymal transition, increased invasion and risk of rebound growth. Cancer Lett. 2013, 329, 74–83. [Google Scholar] [CrossRef]
- Wei, L.; Wang, X.; Lv, L.; Liu, J.; Xing, H.; Song, Y.; Xie, M.; Lei, T.; Zhang, N.; Yang, M. The emerging role of microRNAs and long noncoding RNAs in drug resistance of hepatocellular carcinoma. Mol. Cancer 2019, 18, 1–11. [Google Scholar] [CrossRef]
- Xiao, J.; Lv, Y.; Jin, F.; Liu, Y.; Ma, Y.; Xiong, Y.; Liu, L.; Zhang, S.; Sun, Y.; Tipoe, G.L.; et al. LncRNA HANR Promotes Tumorigenesis and Increase of Chemoresistance in Hepatocellular Carcinoma. Cell. Physiol. Biochem. 2017, 43, 1926–1938. [Google Scholar] [CrossRef]
- Li, J.H.; Liu, S.; Zhou, H.; Qu, L.H.; Yang, J.H. starBase v2.0: Decoding miRNA-ceRNA, miRNA-ncRNA and protein-RNA interaction networks from large-scale CLIP-Seq data. Nucleic Acids Res. 2014, 42, D92–D97. [Google Scholar] [CrossRef]
- Wang, Z.; Li, H.; Li, F.; Su, X.; Zhang, J. Bioinformatics-Based Identification of a circRNA-miRNA-mRNA Axis in Esophageal Squamous Cell Carcinomas. J. Oncol. 2020, 29, 8813800. [Google Scholar]
- Agarwal, V.; Bell, G.W.; Nam, J.-W.; Bartel, D.P. Predicting effective microRNA target sites in mammalian mRNAs. eLife 2015, 4, e05005. [Google Scholar] [CrossRef]
- Zhu, R.X.; Seto, W.-K.; Lai, C.-L.; Yuen, M.-F. Epidemiology of Hepatocellular Carcinoma in the Asia-Pacific Region. Gut Liver 2016, 10, 332–339. [Google Scholar] [CrossRef] [PubMed]
- Mencin, A.; Kluwe, J.; Schwabe, R.F. Toll-like receptors as targets in chronic liver diseases. Gut 2009, 58, 704–720. [Google Scholar] [CrossRef]
- Housman, G.; Byler, S.; Heerboth, S.; Lapinska, K.; Longacre, M.; Snyder, N.; Sarkar, S. Drug resistance in cancer: An overview. Cancers 2014, 6, 1769–1792. [Google Scholar] [CrossRef]
- Chen, W.; Li, Z.; Liu, H.; Jiang, S.; Wang, G.; Sun, L.; Li, J.; Wang, X.; Yu, S.; Huang, J.; et al. MicroRNA-30a targets BECLIN-1 to inactivate autophagy and sensitizes gastrointestinal stromal tumor cells to imatinib. Cell Death Dis. 2020, 11, 1–13. [Google Scholar] [CrossRef] [PubMed]
- Urban-Wojciuk, Z.; Khan, M.M.; Oyler, B.L.; Fåhraeus, R.; Marek-Trzonkowska, N.; Nita-Lazar, A.; Hupp, T.R.; Goodlett, D.R. The Role of TLRs in Anti-cancer Immunity and Tumor Rejection. Front. Immunol. 2019, 10, 2388. [Google Scholar] [CrossRef]


Publisher’s Note: MDPI stays neutral with regard to jurisdictional claims in published maps and institutional affiliations. |
© 2021 by the authors. Licensee MDPI, Basel, Switzerland. This article is an open access article distributed under the terms and conditions of the Creative Commons Attribution (CC BY) license (https://creativecommons.org/licenses/by/4.0/).
Share and Cite
Chen, M.-Y.; Yadav, V.K.; Chu, Y.C.; Ong, J.R.; Huang, T.-Y.; Lee, K.-F.; Lee, K.-H.; Yeh, C.-T.; Lee, W.-H. Hydroxychloroquine (HCQ) Modulates Autophagy and Oxidative DNA Damage Stress in Hepatocellular Carcinoma to Overcome Sorafenib Resistance via TLR9/SOD1/hsa-miR-30a-5p/Beclin-1 Axis. Cancers 2021, 13, 3227. https://doi.org/10.3390/cancers13133227
Chen M-Y, Yadav VK, Chu YC, Ong JR, Huang T-Y, Lee K-F, Lee K-H, Yeh C-T, Lee W-H. Hydroxychloroquine (HCQ) Modulates Autophagy and Oxidative DNA Damage Stress in Hepatocellular Carcinoma to Overcome Sorafenib Resistance via TLR9/SOD1/hsa-miR-30a-5p/Beclin-1 Axis. Cancers. 2021; 13(13):3227. https://doi.org/10.3390/cancers13133227
Chicago/Turabian StyleChen, Ming-Yao, Vijesh Kumar Yadav, Yi Cheng Chu, Jiann Ruey Ong, Ting-Yi Huang, Kwai-Fong Lee, Kuen-Haur Lee, Chi-Tai Yeh, and Wei-Hwa Lee. 2021. "Hydroxychloroquine (HCQ) Modulates Autophagy and Oxidative DNA Damage Stress in Hepatocellular Carcinoma to Overcome Sorafenib Resistance via TLR9/SOD1/hsa-miR-30a-5p/Beclin-1 Axis" Cancers 13, no. 13: 3227. https://doi.org/10.3390/cancers13133227