Article

Simultaneous Expression of Long Non-Coding RNA FAL1 and Extracellular Matrix Protein 1 Defines Tumour Behaviour in Young Patients with Papillary Thyroid Cancer

1
Department of Internal Medicine, Yonsei University College of Medicine, 50-1 Yonsei-ro, Seodaemun-gu, Seoul 03722, Korea
2
Department of Surgery, Eulji University School of Medicine, 95 Dunsanseo-ro, Seo-gu, Daejeon 35233, Korea
3
Yonsei Cancer Center, Open NBI Convergence Technology Research Laboratory, Severance Hospital, Department of Surgery, Yonsei University College of Medicine, 50-1 Yonsei-ro, Seodaemun-gu, Seoul 03722, Korea
*
Authors to whom correspondence should be addressed.
These authors contributed equally to this work.
Cancers 2021, 13(13), 3223; https://doi.org/10.3390/cancers13133223
Submission received: 25 May 2021 / Revised: 21 June 2021 / Accepted: 23 June 2021 / Published: 28 June 2021
(This article belongs to the Special Issue Biomarkers of Thyroid Cancer)

Abstract

:

Simple Summary

FAL1 upregulation has been reported in many types of human cancers. The up-regulatory mechanism was identified in ovarian cancer but was not investigated in other type of cancers. Using The Cancer Genome Atlas (TCGA) database, we identified simultaneous upregulation of FAL1 adjacent to chromosome 1q21.3. Among 53 putative transcription factors for FAL1 and neighbouring genes, we selected c-JUN and JUND as the best candidates. This simultaneous upregulation defines molecular biological features representing RAS-driven PTC-enriched immune-related gene sets. These findings suggest that the simultaneous upregulation might be a potential diagnostic and therapeutic target for RAS-driven PTC.

Abstract

We investigated the regulatory mechanism of FAL1 and unravelled the molecular biological features of FAL1 upregulation in papillary thyroid cancer (PTC). Correlation analyses of FAL1 and neighbouring genes adjacent to chromosome 1q21.3 were performed. Focal amplification was performed using data from copy number alterations in The Cancer Genome Atlas (TCGA) database. To identify putative transcriptional factors, PROMO and the Encyclopaedia of DNA Elements (ENCODE) were used. To validate c-JUN and JUND as master transcription factors for FAL1 and ECM1, gene set enrichment analysis was performed according to FAL1 and ECM1 expression. Statistical analyses of the molecular biological features of FAL1- and ECM1-upregulated PTCs were conducted. FAL1 expression significantly correlated with that of neighbouring genes. Focal amplification of chromosome 1q21.3 was observed in ovarian cancer but not in thyroid carcinoma. However, PROMO suggested 53 transcription factors as putative common transcriptional factors for FAL1 and ECM1 simultaneously. Among them, we selected c-JUN and JUND as the best candidates based on ENCODE results. The expression of target genes of JUND simultaneously increased in FAL1- and ECM1-upregulated PTCs, especially in young patients. The molecular biological features represented RAS-driven PTC and simultaneously enriched immune-related gene sets. FAL1 and ECM1 expression frequently increased simultaneously and could be operated by JUND. The simultaneous upregulation might be a potential diagnostic and therapeutic target for RAS-driven PTC.

1. Introduction

Papillary thyroid cancer (PTC) is the most common endocrine malignancy, and its incidence has been increasing worldwide [1,2]. The main reason for this increase has been attributed to the widespread application of highly sensitive ultrasound to health screenings [3]. In this context, a new approach called active surveillance is being widely studied in the clinical setting [4]. However, basic experiments and clinical studies on thyroid cancer occurring in young patients and refractory thyroid cancer relatively commonly observed in the elderly are also being conducted [5,6,7,8]. These efforts have led to the development of various tyrosine kinase inhibitors, including targeted therapy for BRAFV600E, for the clinical setting. However, owing to limited therapeutic efficacy, there remains a need for new therapeutic agents. Unfortunately, no new emerging therapeutic targets have been suggested [9].
Non-coding RNA (ncRNA), a molecule that is not translated into protein, is present abundantly and performs important biological functions [10,11,12]. Among various ncRNAs such as small nucleolar RNAs (snoRNAs), microRNAs (miRNAs), small interfering RNA (siRNA), small nuclear RNA (snRNA), extracellular RNA (exRNA), piwi-interacting RNA (piRNAs), and long ncRNAs (lncRNAs) [13,14], previous studies have shown that lncRNAs act as tumour susceptible genes in PTC. For example, low expression of PTC susceptibility candidate 2 (PTSC2) was observed in PTC tumours, which, in turn, affected the expression of genes related to cell cycle and cancer [15]. The polymorphism rs944289 on PTC susceptibility candidate 3 (PTSC3) was reported to predispose to PTC [16]. BRAF-activated lncRNA (BANCR) is upregulated in PTC, thereby promoting cell proliferation through autophagy regulation [17].
Recently, our group reported that the oncogenic activity of focally amplified lncRNA on chromosome 1 (FAL1, ENSG00000228126) is attributed to the expression of genes related to the cell cycle, including transcription factor E2F transcription factor 1 (E2F1), E2F transcription factor 2 (E2F2), and cyclin D1 in thyroid cancers [18]. In this study, we investigated the mechanism underlying FAL1 upregulation in PTC and found that extracellular matrix protein 1 (ECM1) expression was simultaneously upregulated with FAL1 expression. In addition, we explored the biological and clinical functions of FAL1 and ECM1 and demonstrated the significance of simultaneous expression of FAL1 and ECM1.

2. Materials and Methods

2.1. Analysis of lncRNA and mRNA Expression Using Public Databases

lncRNA expression values were collected using The Atlas of Noncoding RNAs in Cancer (TANRIC) derived from The Cancer Genome Atlas (TCGA) RNA-seq database [19]. TANRIC provided the quantified expression level of lncRNA as read per kilobase million (RPKM) based on the Binary Alignment/Map format File (BAM file, *.bam). Using these datasets, the expression level of the lncRNA FAL1 was confirmed in 20 types of human cancer: colon adenocarcinoma (COAD; 157 cases), rectum adenocarcinoma (READ; 71 cases), uterine corpus endometrioid carcinoma (UCEC; 316 cases), kidney chromophobe (KICH; 66 cases), ovary serous cystadenocarcinoma (OV; 412 cases), liver hepatocellular carcinoma (LIHC; 200 cases), prostate adenocarcinoma (PRAD; 374 cases), kidney renal clear cell carcinoma (KIRC; 448 cases), stomach adenocarcinoma (STAD; 285 cases), bladder urothelial carcinoma (BLCA; 252 cases), lung squamous cell carcinoma (LUSC; 220 cases), kidney renal papillary cell carcinoma (KIRP; 198 cases), cervical squamous cell carcinoma and endocervical adenocarcinoma (CESC; 196 cases), lung adenocarcinoma (LUAD; 488 cases), skin cutaneous melanoma (SKCM; 226 cases), breast invasive carcinoma (BRCA; 837 cases), head and neck squamous cell carcinoma (HNSC; 426 cases), glioblastoma multiforme (GBM; 154 cases), thyroid carcinoma (THCA; 497 cases), and brain low grade glioma (LGG; 486 case). To compare the expression values of ECM1 and ADAMTSL4 between normal tissues and PTC, mRNA and lncRNA expression values for the normal tissue cohort were collected from the TCGA THCA RNA-seq database and TANRIC, respectively. We also selected GSE127083 from the GEO (Gene Expression Omnibus) database as in vitro validation set in addition to TCGA data.

2.2. Analysis of Copy Number Alteration

To determine copy number alterations in TCGA ovarian cancer (OVCA) and TCGA THCA, Genomic Identification of Significant Targets in Cancer (GISTIC) data from the Broad Firehose infrastructure were used [20]. GISTIC statistically calculated the copy number alteration occurring in many patient specimens. The data were sorted based on the genomic build hg19. The threshold used for DNA copy number amplification was 0.1, the confidence level was 0.99, and the q-value cut-off was 0.25.

2.3. Prediction and Validation of Putative Transcription Factors

The binding site and transcription factors of FAL1 and ECM1 were predicted using PROMO and the Encyclopaedia of DNA Elements (ENCODE), respectively. PROMO, which used a transcription factor source from the TRANSFAC® database, predicted potential transcription factor-binding sites (TFBS). The upstream 1 kb sequence of FAL1 and ECM1 was input, and the dissimilarity rate was analysed using the default value (15%; 85% similarity). Information related to gene regulation based on ENCODE data was verified using the Ensembl Genome Browser. The regulatory elements of each gene were identified using chromatin immunoprecipitation followed by sequencing (ChIP-Seq) data from ENCODE, and each motif score was selected by applying a p-value threshold of 0.01. Gene set enrichment analysis (GSEA) was performed using software, version 4.1.0, combined with Gene Ontology [21]. The normalised enrichment score (NES) calculated by GSEA described the correlation between the gene set and the expression dataset. Permutations were performed 1000 times according to the basic weighted enrichment statistic, and genes were ranked according to the level of differential expression between the two groups. We selected a set of important genes based on a p-value of ≤0.05 and a false discovery rate (FDR) q-value of <0.25.

2.4. Statistical Analysis

Statistical analysis was performed using Prism (GraphPad Software, San Diego, CA, USA) or SPSS, version 25.0, for Windows (IBM Corp., Armonk, NY, USA). Data are presented as mean ± SD. Statistical comparisons of continuous variables were performed using Student’s t-test or analysis of variance, and group comparisons were performed using χ2 test or linear association. Gene expression associations were investigated using the Pearson correlation coefficients.

3. Results

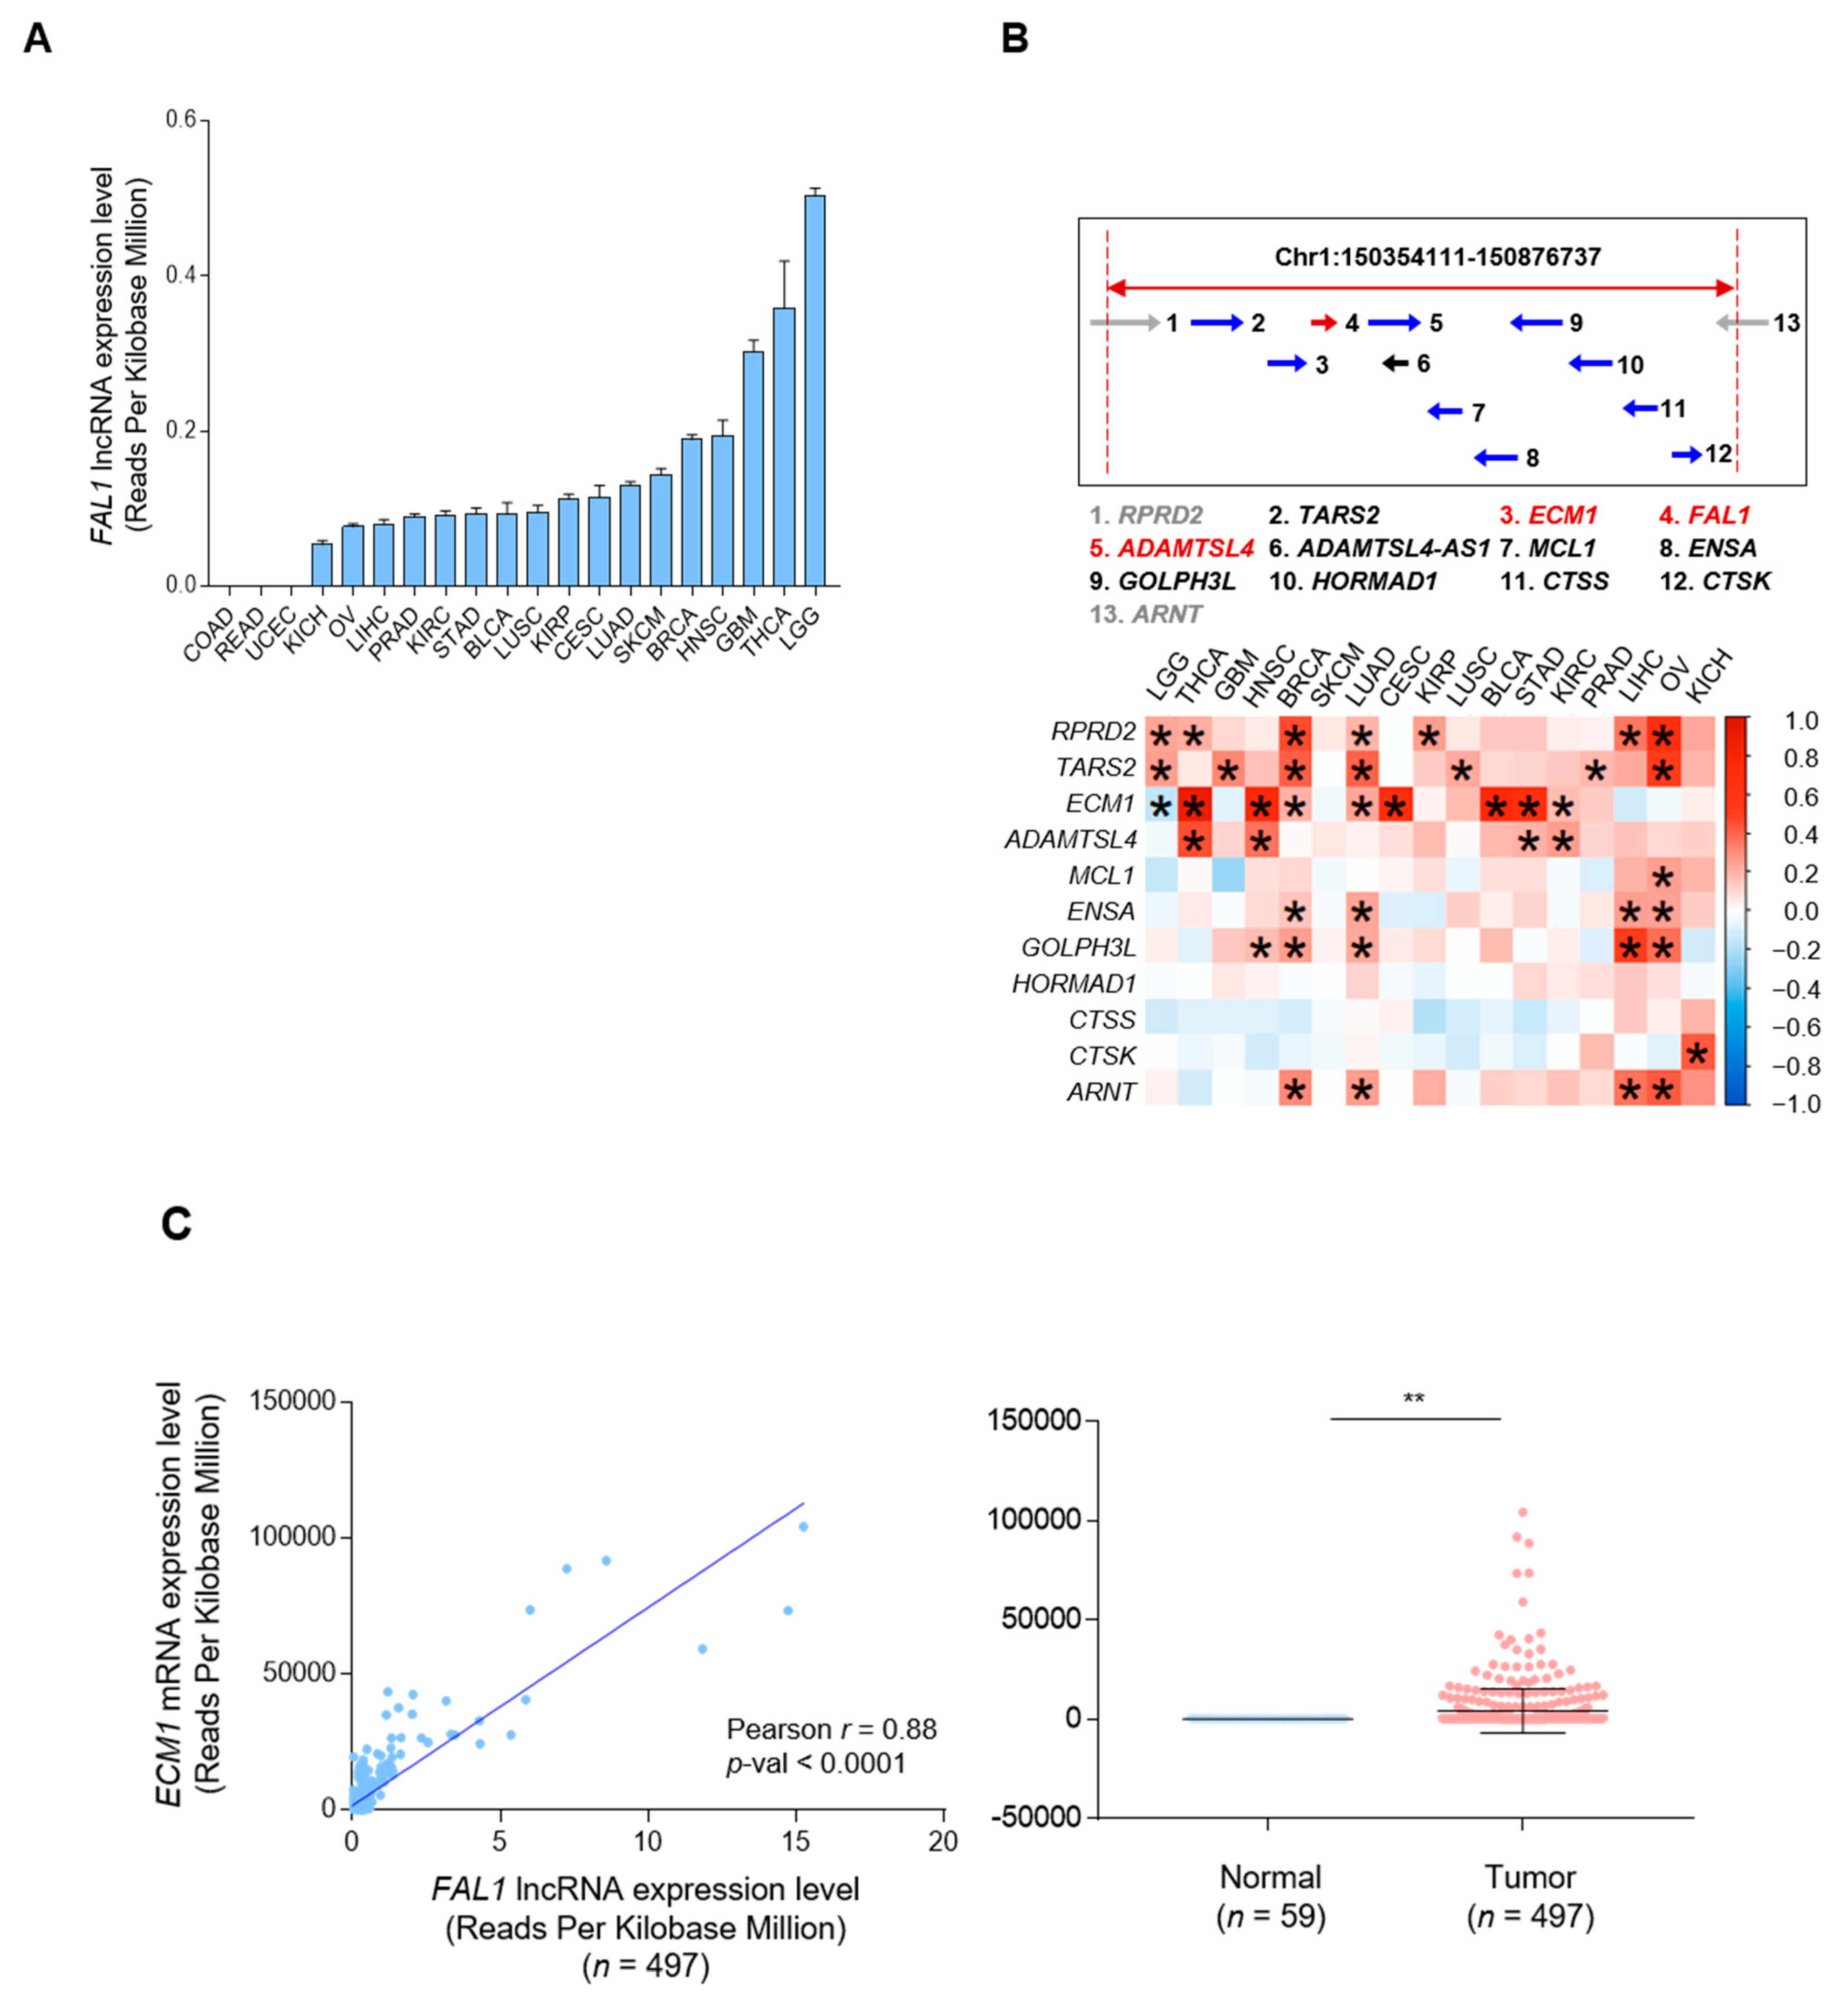
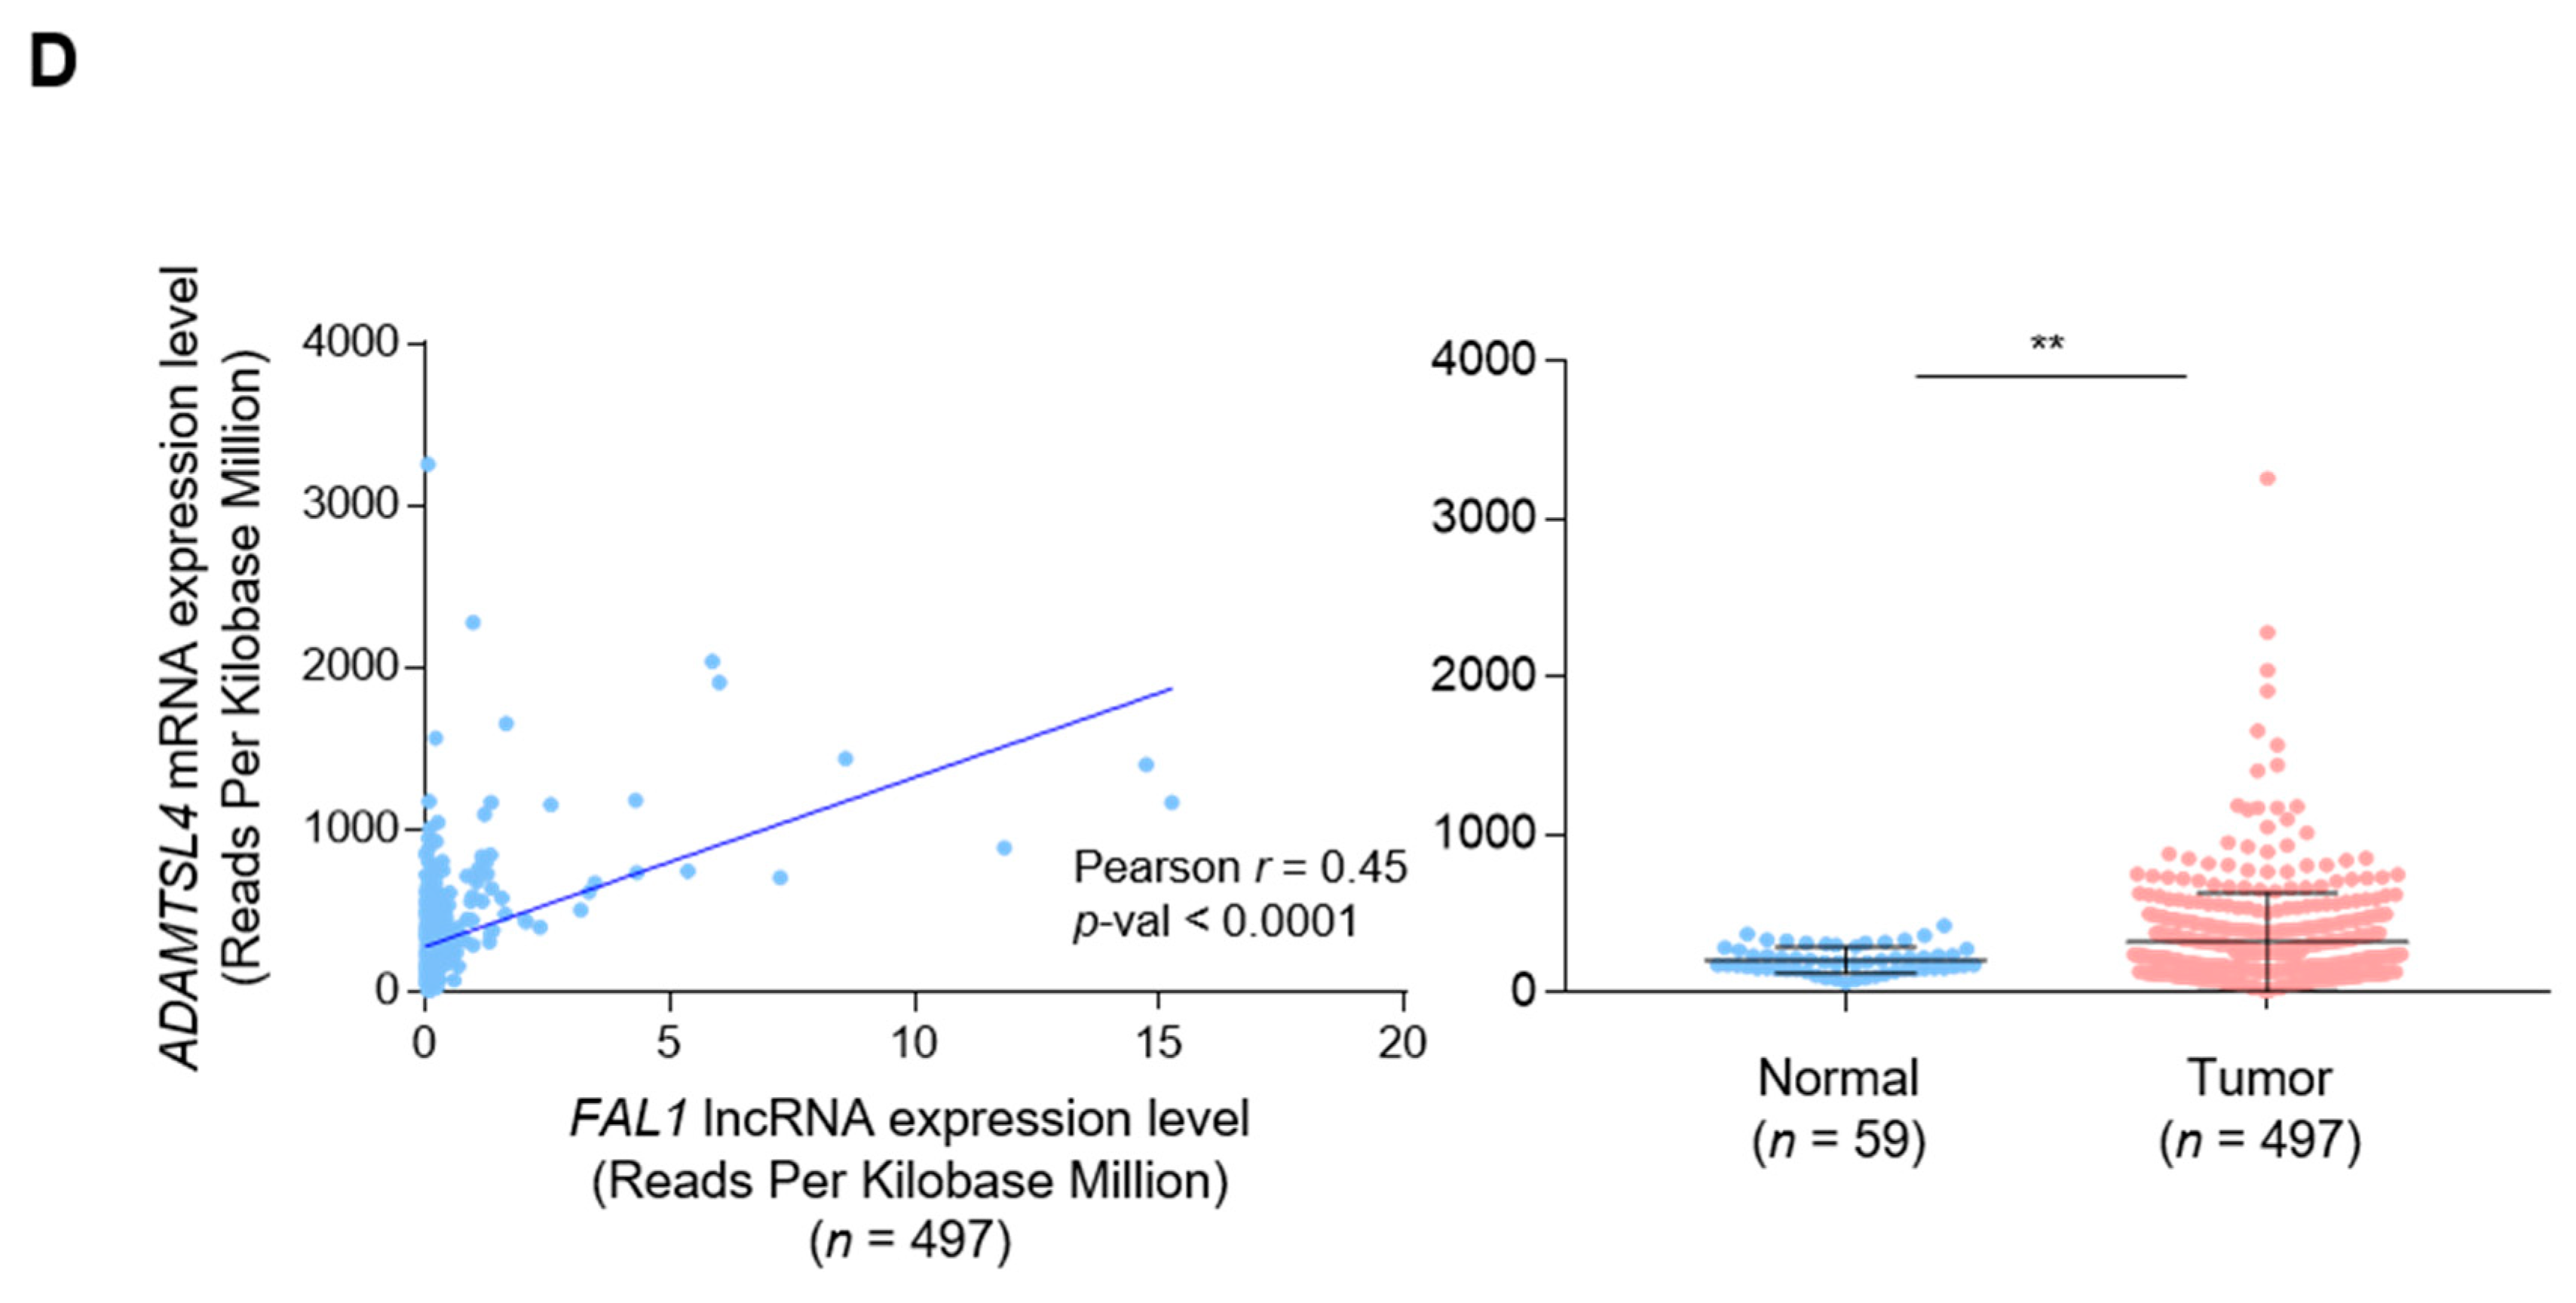
3.1. Positive Correlation between FAL1 and ECM1 Expression in Human Cancers

Upregulation of FAL1 expression was first reported in ovarian cancer. Focal amplification of chromosome 1q21.3 is the mechanism underlying the upregulated expression of FAL1 [22]. To validate this upregulatory mechanism in PTC, we first investigated the expression status of FAL1 using pan-cancer data from TCGA. Among 20 types of human cancers, COAD, READ, and UCEC did not show any expression of FAL1. However, brain LGG, THCA, and GBM presented higher expression values than the other types of human cancers (Figure 1A). Interestingly, the expression of FAL1 in OVCA was not higher than that in other types of human cancers. Because the upregulated expression of genes by focal amplification is inevitably accompanied by increased expression of genes present at the same location on the chromosome, we identified the genes located around FAL1 (Figure 1B). ECM1 and ADAMTS (disintegrin and metalloproteinase with thrombospondin motifs)-like 4 (ADAMTSL4) were located before and after FAL1 on Chr1:150354111-150876737. An analysis of the correlation between the expression of FAL1 and that of the neighbouring genes was performed, and the results showed that the expression of threonyl-tRNA synthetase 2, mitochondrial (TARS2), ECM1, ADAMTSL4, etc., in most tumours wherein FAL1 expression was observed was positively correlated with FAL1 expression (Figure 1B). Whereas the correlation of FAL1 with RPRD2 and TARS2 did not show strong positive correlation coefficients in TCGA THCA (Figure S1), as shown in Figure 1C,D, the expression of ECM1 and ADAMTSL4 showed a positive correlation with FAL1 expression and was associated with upregulated expression of FAL1 in PTC compared to that in the normal thyroid tissues. Taken together, we postulated that FAL1 expression was coupled with the upregulated expression of neighbouring genes such as ECM1 and ADAMTSL4.

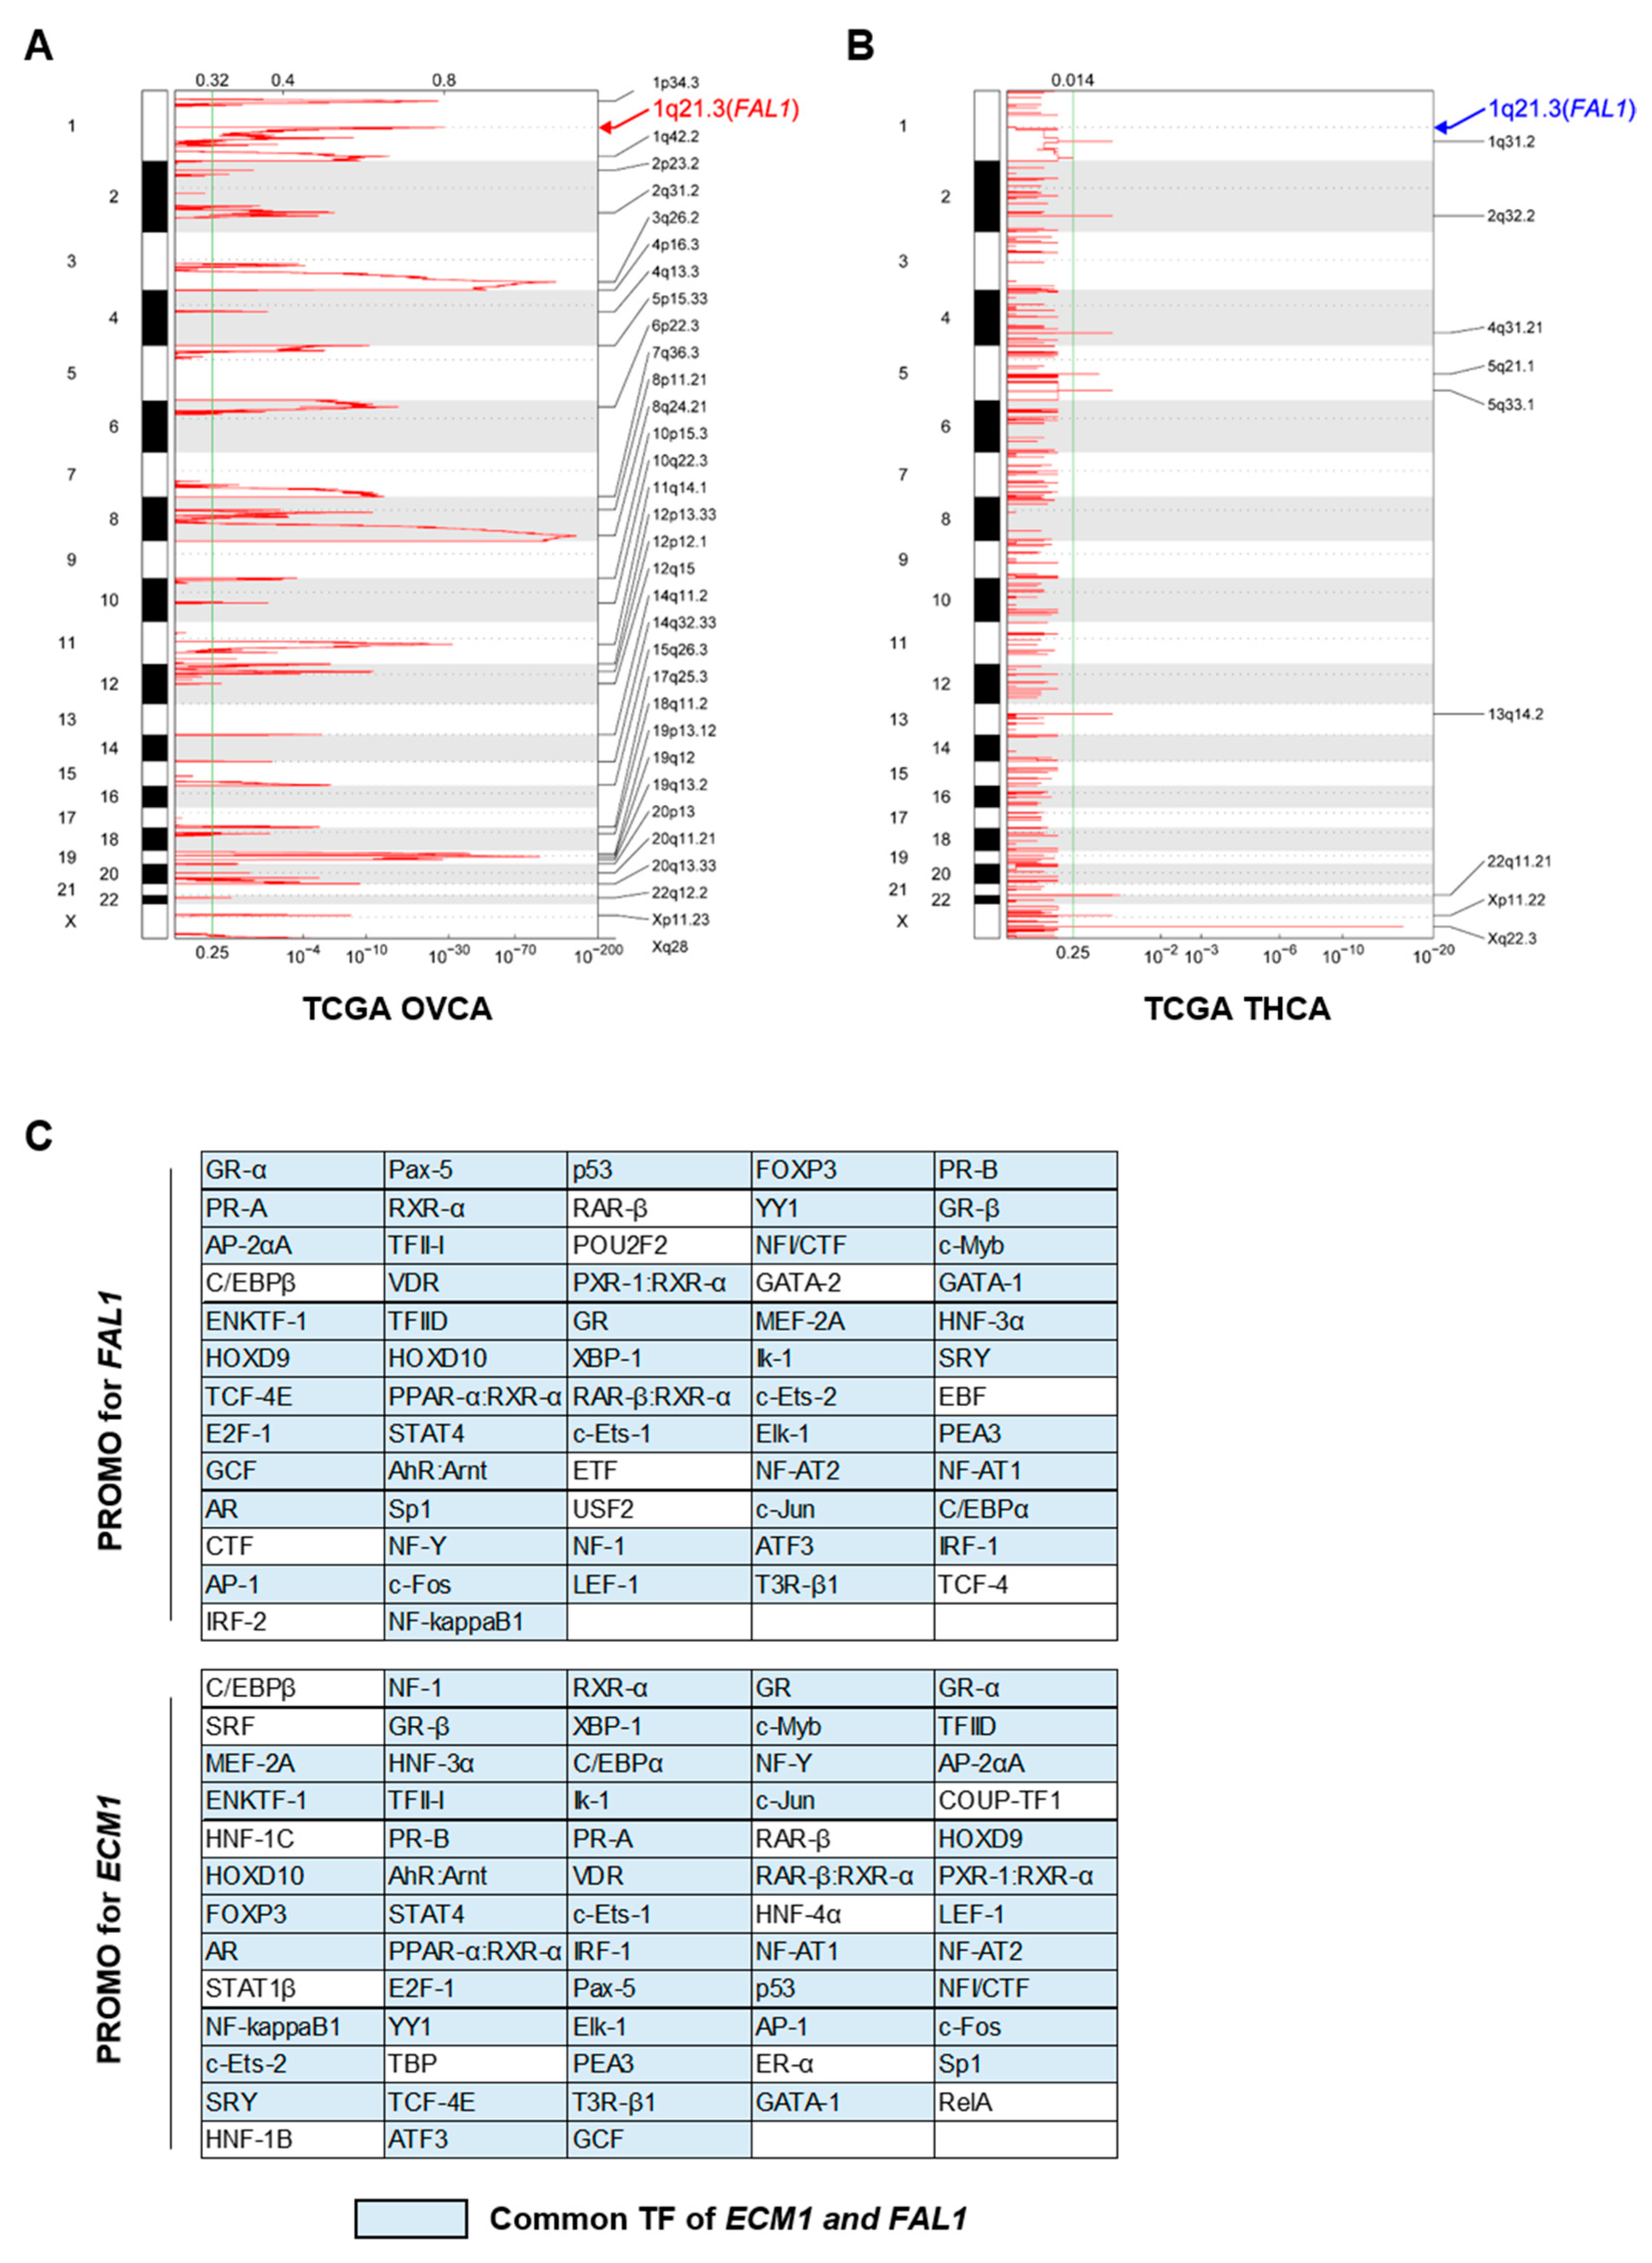
3.2. Focal Amplification of the FAL1 Gene in Ovarian Cancer but Not In PTC

Our analysis for the expression of FAL1 and neighbouring genes suggested simultaneous upregulated expression of those genes, and we investigated the amplification status of genes based on data of copy number alterations (CNAs) from TCGA OVCA and TCGA THCA. As previously reported, focal amplification of 1q21.3 was clearly observed in OVCA (Figure 2A), but no amplification signal at the same position was observed in THCA (Figure 2B), suggesting that simultaneous upregulated expression of FAL1 and the neighbouring genes was generated by different mechanisms from focal amplification in PTC. Supporting our idea, the comparison of 1q arm-level amplification in TCGA THCA according to the FAL1 expression status did not show any significant difference (Table S1). Recent efforts to understand the regulatory mechanism of lncRNA expression have emphasised the importance of transcription factors in the expression of other coding genes. In line with this idea, we decided to evaluate the effective transcription factors for the promoter areas of FAL1 and ECM1. To achieve our goal, we identified putative TFBS in DNA sequences defined in TRANSFAC, using PROMO [23,24]. This virtual laboratory suggested 62 transcription factors for FAL1 and 63 transcription factors for ECM1 (Figure 2C). As expected, most putative transcription factors overlapped in both FAL1 and ECM1 (n = 53). Taken together, the simultaneous expression of FAL1 and ECM1 might be generated by common transcription factors rather than by gene amplification.

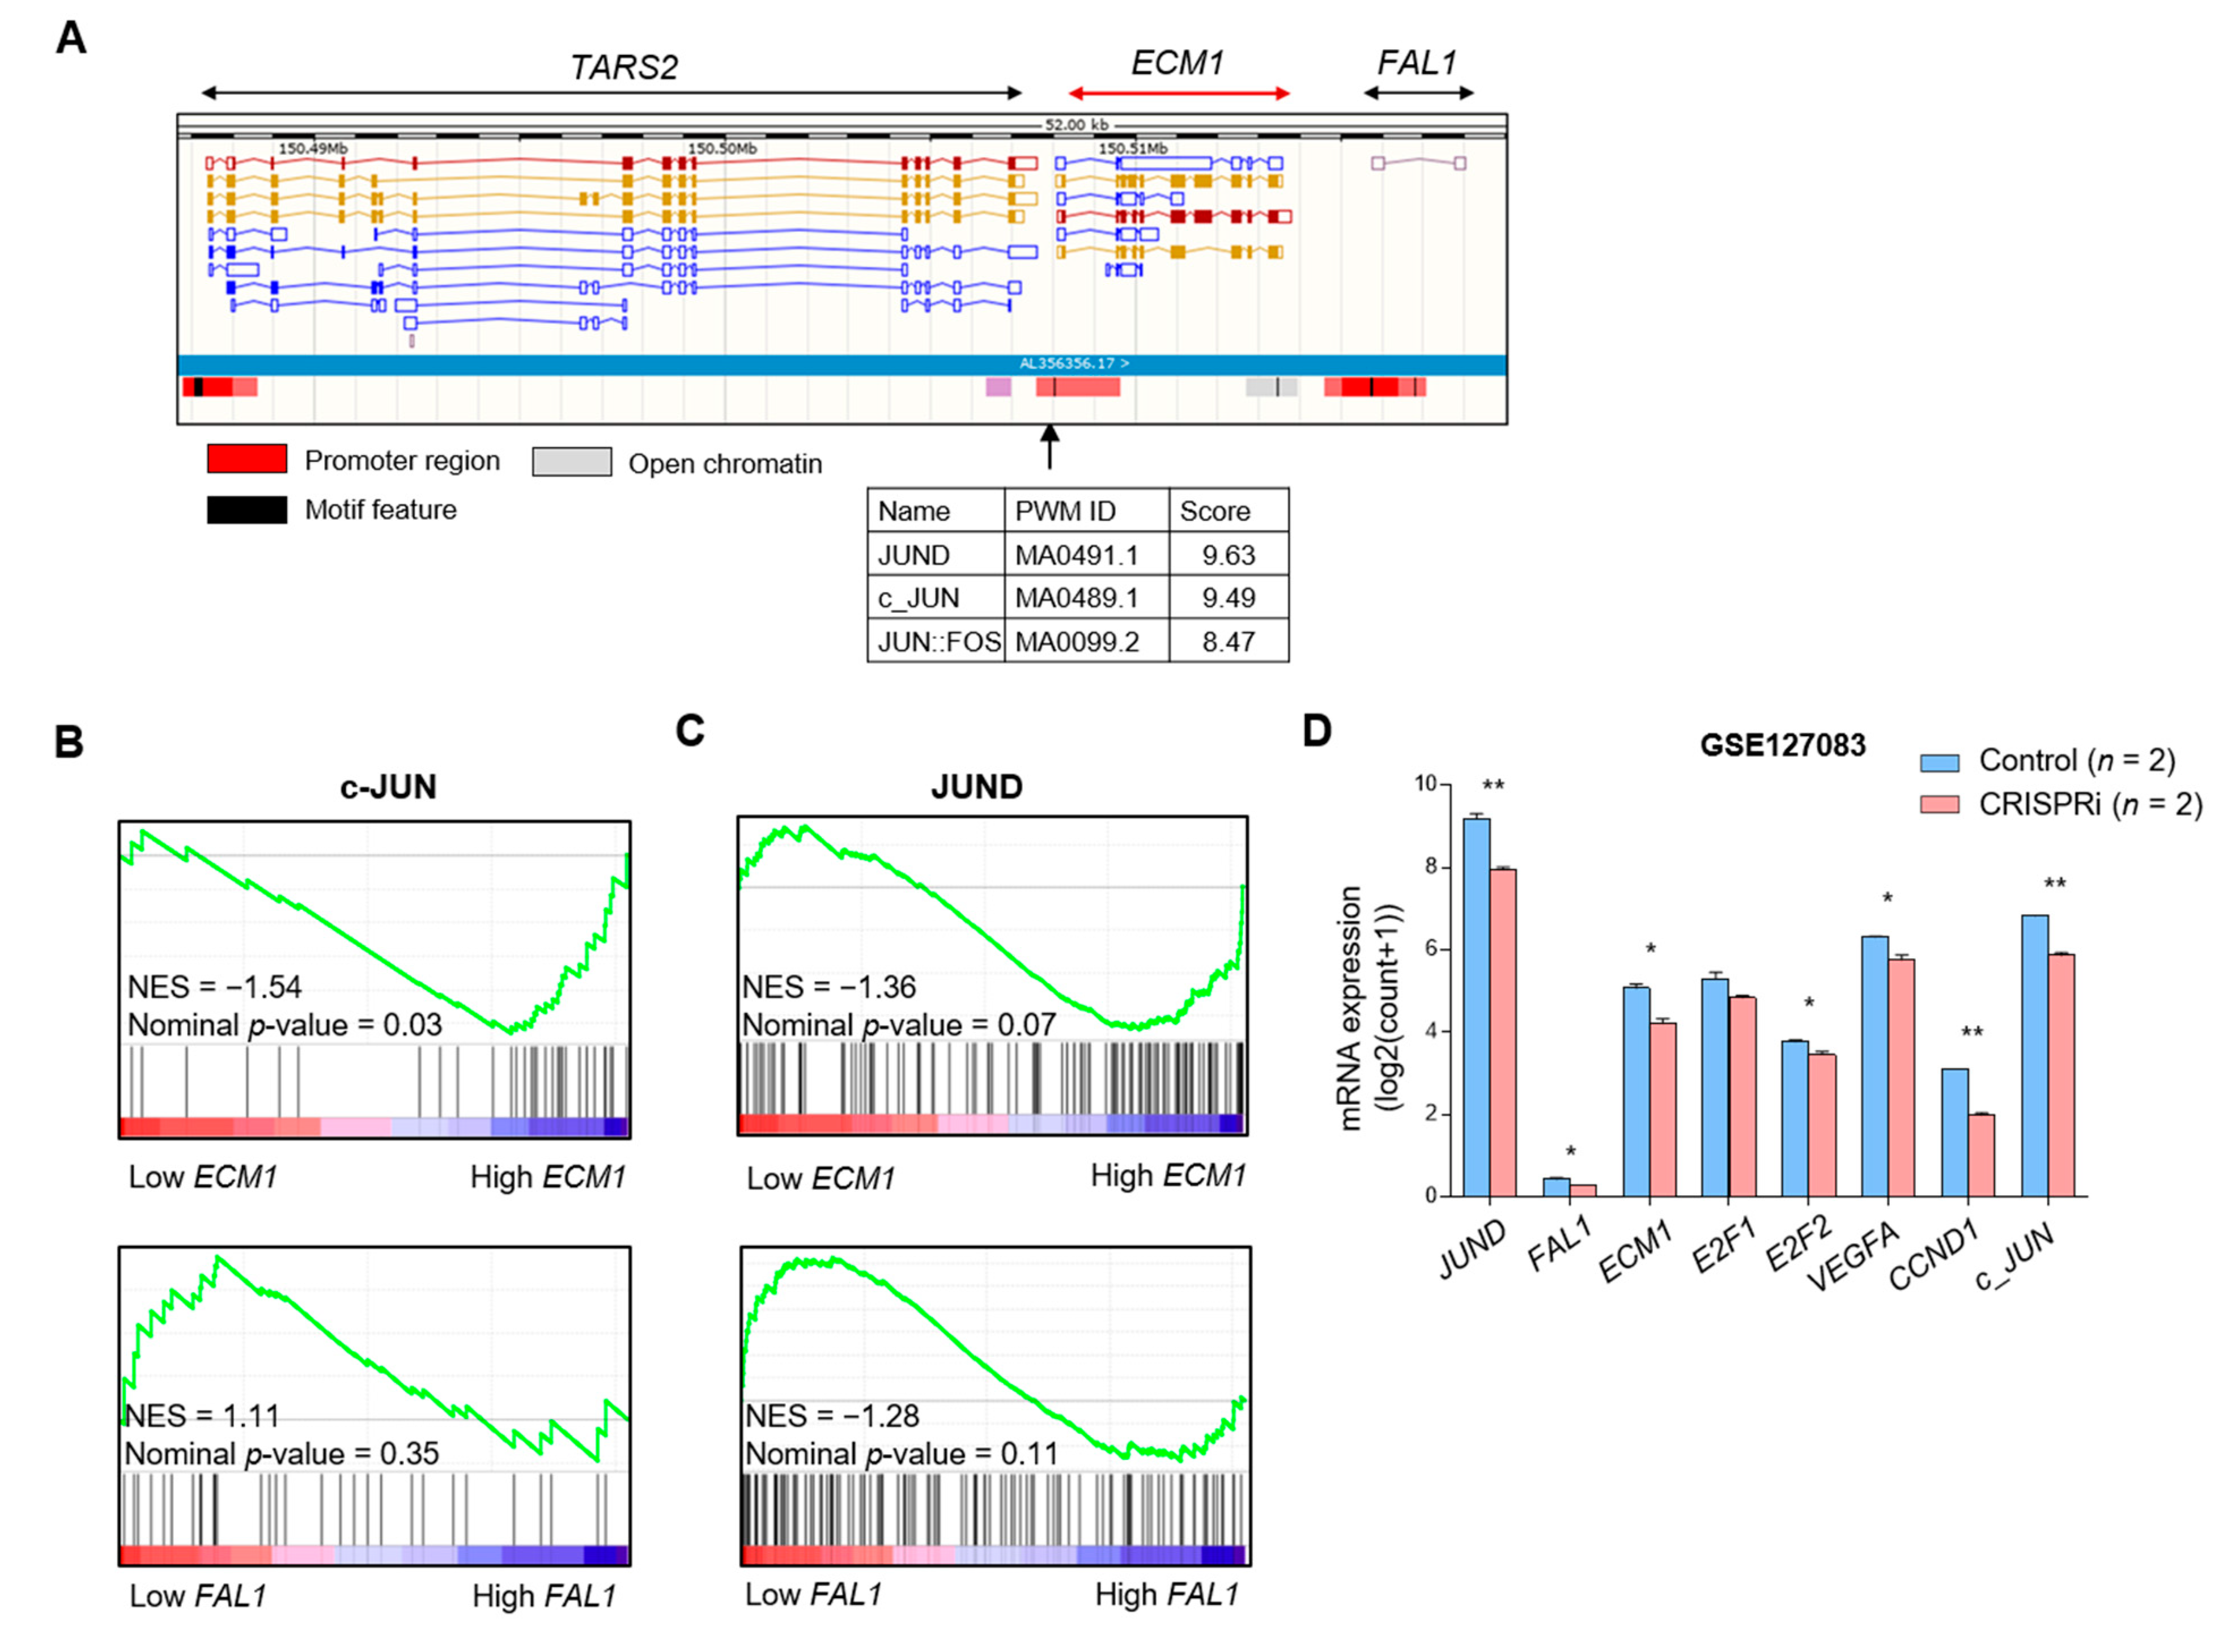
3.3. JUND as a Candidate for Common Transcription Factor for FAL1 and ECM1

To select the most reliable transcription factor from TFBS, we examined the location of TFBS on the chromosome in detail using the Encyclopaedia of DNA Elements (ENCODE), which identifies functional elements in the human genomes [25]. In the case of RPRD2 and TARS, PROMO suggested 66 transcription factors for RPRD2 and 70 transcription factors for TARS2. However, unfortunately, ENCODE did not have TFBS for RPRD2 (Figure S2). Interestingly, we observed that the TFBS of c-JUN and JUND was present in the promoter of the ECM1 gene, and the TFBS for FOS, a binding partner, was also present (Figure 3A). Based on this finding, we hypothesised that the expression of JUN target genes might be increased in FAL1- and ECM1-upregulated PTC, if the expression of FAL1 and ECM1 was increased by JUN transactivation. To validate our hypothesis, we performed GSEA by dividing the TCGA THCA into two groups according to the FAL1 and ECM1 expression status. The target genes of c-JUN were co-ordinately enriched in the high ECM1 group but not in the high FAL1 group (Figure 3B). However, the target genes for JUND were co-ordinately enriched in the high ECM1 group and showed a tendency of upregulated expression in the high FAL1 group (Figure 3C) even though JUND expression was not correlated with FAL1 and ECM1 expression (Figure S3). In addition, we confirmed that the expression of the FAL1, ECM1, and FAL1 target genes was also decreased by CRISPRi JUND in leukemia cells (Figure 3D). Although we did not verify these results from a virtual laboratory through a wet lab-based approach, we thought that these data fully supported our idea that simultaneous expression of FAL1 and ECM1 was generated, not by focal amplification but by common transcription factors such as JUND.
FAL1 was first investigated in ovarian high-grade serous carcinoma (HGSC), showing a different correlation pattern compared to TCGA THCA (Figure 1B). We thought this difference might indicate a different regulatory mechanism of FAL1 upregulation according to cancer types. As described, in HGSC, focal amplification increased FAL1 upregulation. In the case of GBM, the regulatory mechanism was not investigated. To understand the different regulatory mechansim in HGSC and GBM, we performed GSEA using c-JUN and JUND target genes in HGSC and GBM. High ECM1 expression was related to coordinately enrichment of c-JUN and JUND target genes but high FAL1 expression was not (Figure S4). This data indicated that JUND was not involved in simutaneous up regulation of ECM1 and FAL1 in HGSC and GBM.

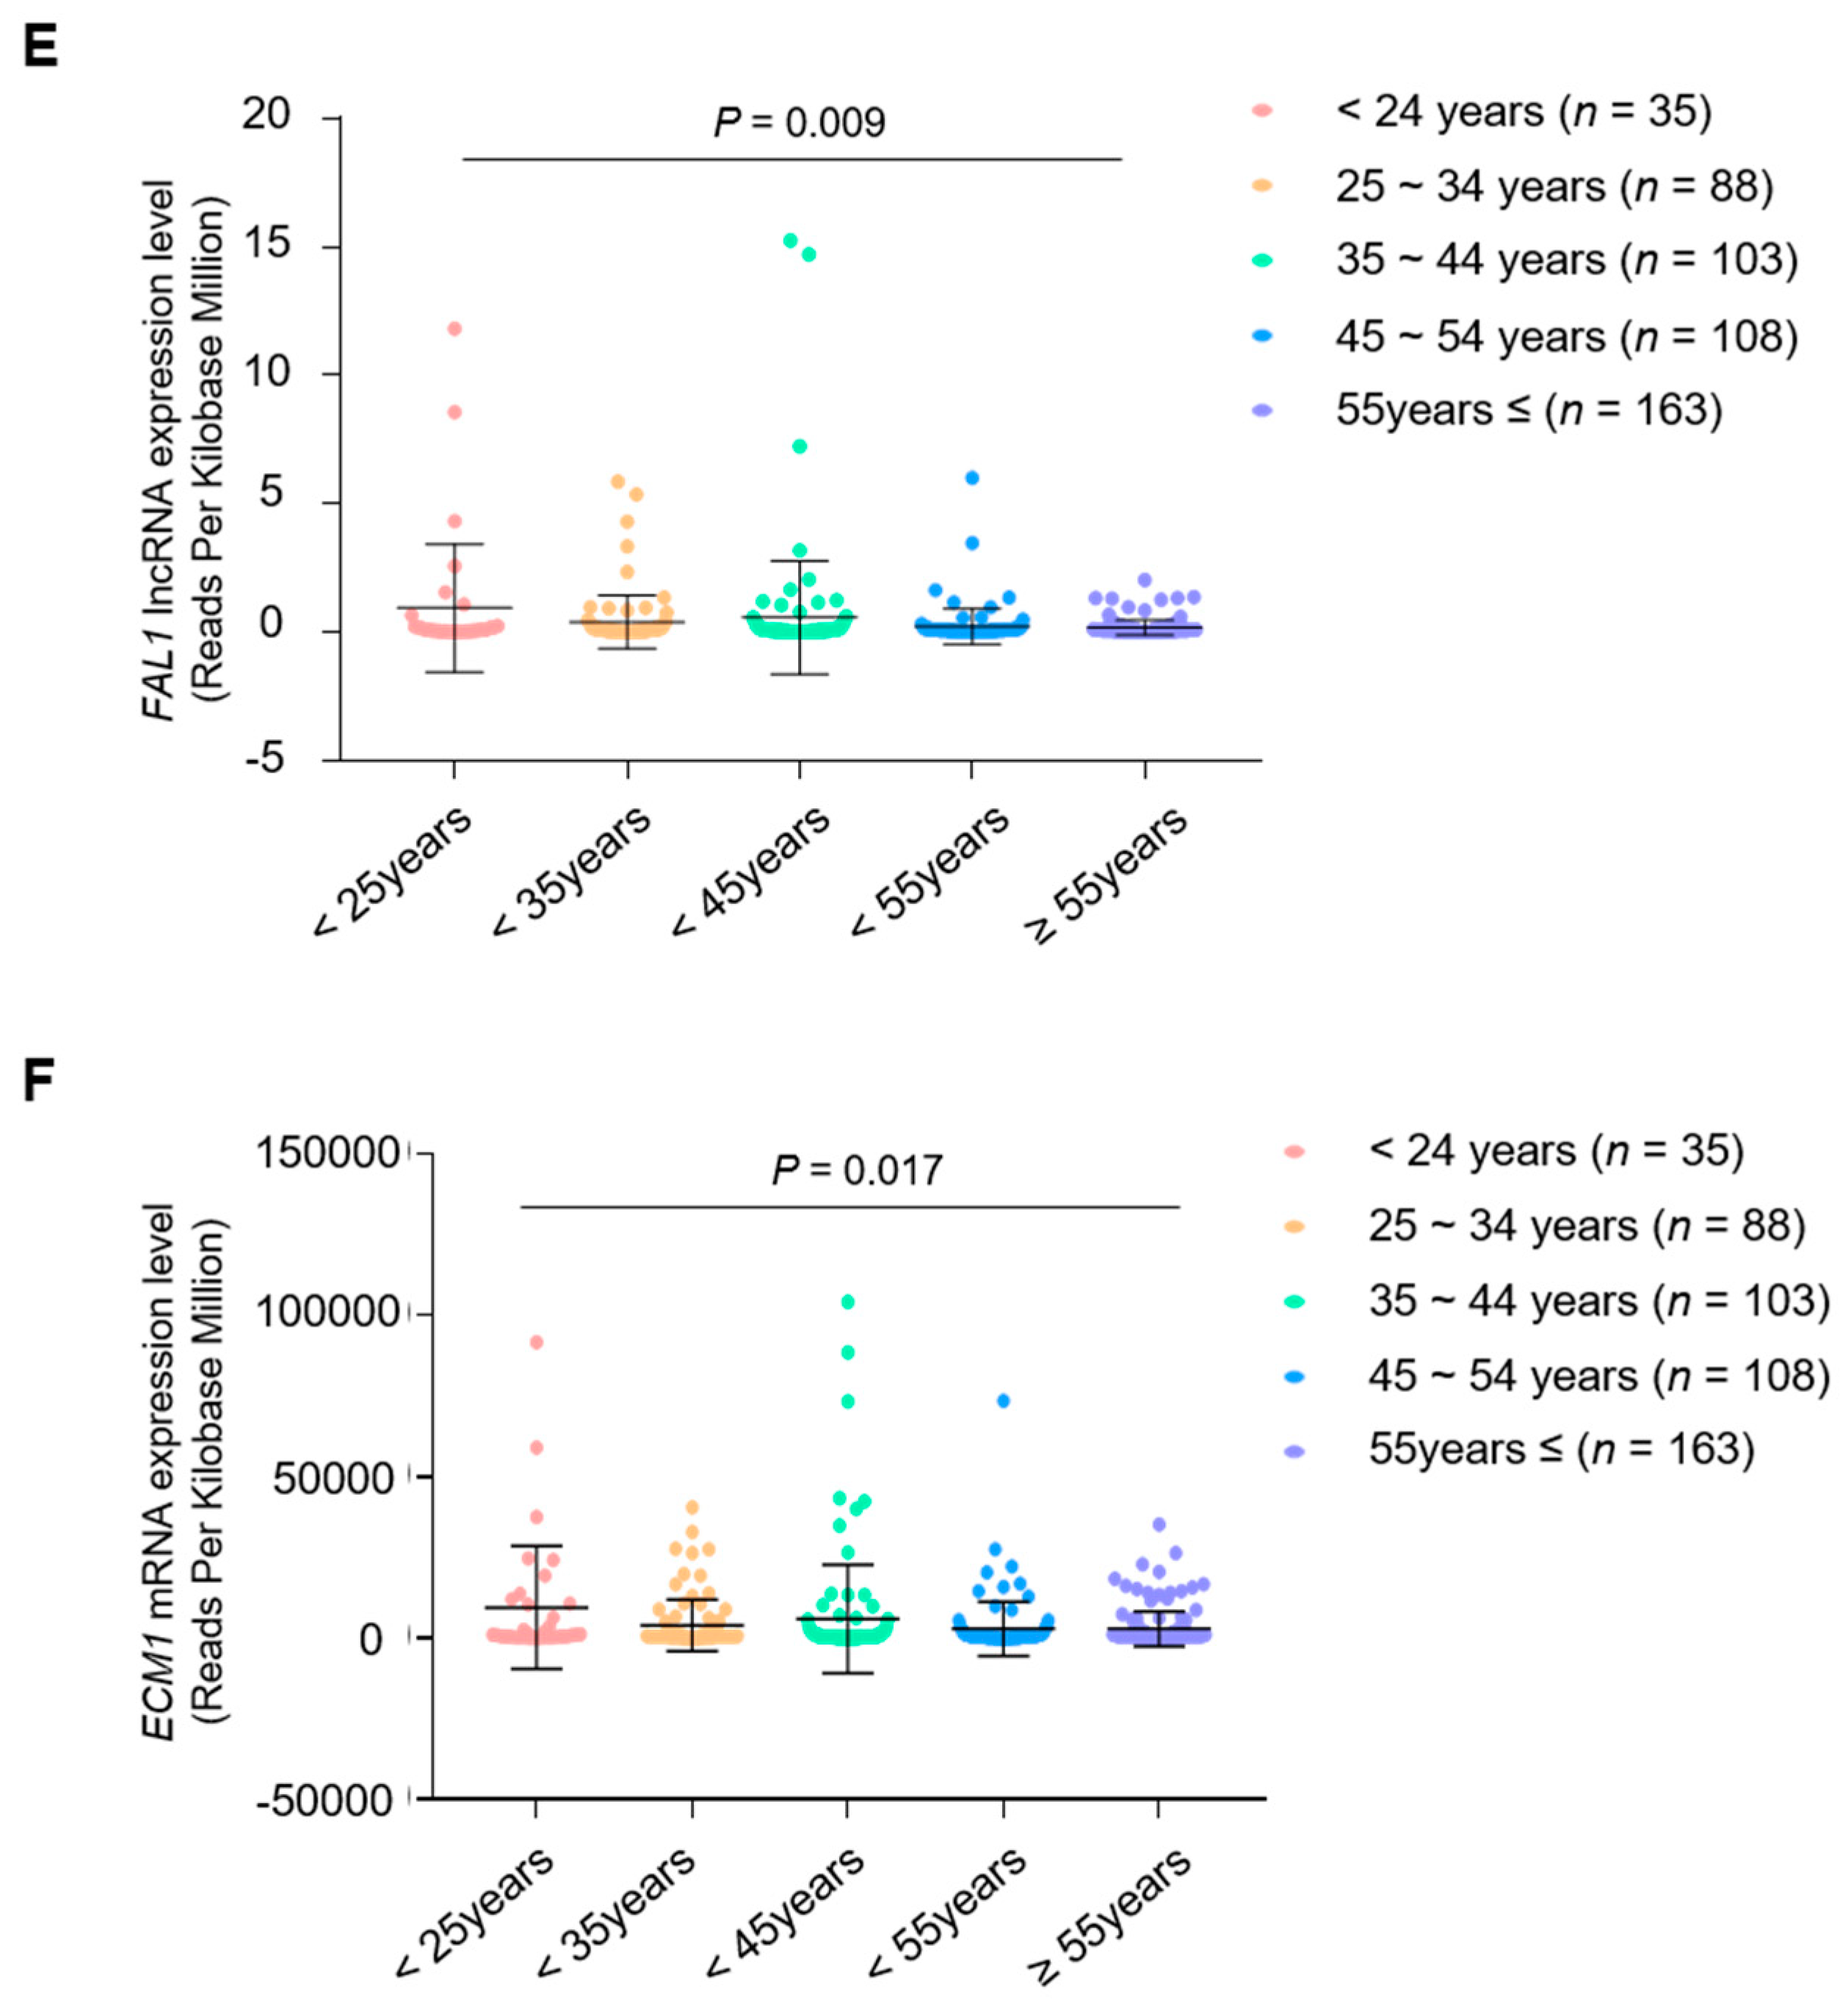
3.4. Clinical Relevance of the Simultaneous Expression of FAL1 and ECM1

To determine the clinical implication of the simultaneous expression of FAL1 and ECM1, we analysed the clinicopathological features of high FAL1 and ECM1 expression groups. Among the results, the most interesting finding was that FAL1 and ECM1 expression was upregulated in young patients aged <45 years (Figure 3D,E). In line with this finding, we performed GSEA to understand the differences in gene expression patterns according to age (young vs. old age) and found that KRAS- and immune-related gene sets were co-ordinately enriched in the young age group (<45 years old), whereas metabolism- and epithelial–mesenchymal transition-related gene sets were co-ordinately enriched in the old age group (≥55 years old) (Figure 4A,B). According to high FAL1 or ECM1 expression, KRAS- and immune-related gene sets were co-ordinately enriched (Figure 4C,D). Taken together, FAL1 and ECM1 upregulated expression was frequently observed in the young patient group, and this upregulation might contribute to defining tumour behaviour in the young patient group. To validate our hypothesis that simultaneous expression of FAL1 and ECM1 might be related to RAS-driven PTC, we compared the molecular biological features of PTC according to FAL1 and ECM1 expression (Table 1 and Table 2). FAL1-upregulated PTC presented fewer mRNA clusters but more miRNA clusters. RAS mutations were frequently detected in FAL1-upregulated PTC, whereas the frequency of BRAF mutations was relatively low. According to the frequent RAS mutation in FAL1-upregulated PTC, the RAS/RAF, ERK, and differentiation scores were compatible with RAS-driven PTC. However, serine 473 phosphorylation of PKB/AKT increased in FAL1-upregulated PTC. In the analysis of ECM1-upregulated PTC, frequent RAS mutations and a relatively low frequency of BRAF mutations were also observed as FAL1-upregulated PTC. However, the frequency of TERT promoter mutation increased, and the ERK score also increased compared to that in ECM1-downregulated PTC. In summary, all these molecular biological features might be related to the aggressive behaviour of RAS-driven tumours.

4. Discussion

The incidence of PTC has been increasing since the last two decades in Korea even though there is controversy regarding the overtreatment of papillary thyroid microcarcinoma [3,26]. Recent clinical evidence has suggested the optimal indication of active surveillance for this indolent carcinoma [27]. Refractory thyroid cancer is defined as a tumour with poor response to current treatments such as surgery and radioactive iodine therapy, and it could be managed with newly developed targeted therapy using sorafenib and vemurafenib. However, these novel therapeutics mainly target BRAFV600E-driven PTC. In fact, currently available drugs for RAS-driven PTCs are limited.
LncRNA has been investigated as a novel diagnostic and therapeutic target in many types of human cancers [12]. In the case of PTCs, lncRNAs were first reported as cancer susceptible genes such as PTCSC1, PTCSC2, and PTCSC3; following this, many interesting papers reported various kinds of tumour-suppressive or oncogenic lncRNAs in human PTC, such as Cancer Susceptibility 2 (CASC2), Promoter Of CDKN1A Antisense DNA Damage Activated RNA (PANDAR), Maternally Expressed 3 (MEG3), Non-Protein-Coding RNA, Associated With MAP Kinase Pathway And Growth Arrest (NAMA), HOX Antisense Intergenic RNA (HOTAIR), Nuclear Enriched Abundant Transcript 1 (NEAT1), Metastasis Associated Lung Adenocarcinoma Transcript 1 (MALAT1), Antisense Noncoding RNA in the INK4 Locus (ANRIL), Plasmacytoma Variant Translocation 1 (PVT1), and BANCR [28,29,30,31,32]. Our group also reported LOC100507661 and FAL1 as potential oncogenic lncRNAs in PTC [18,33]. In fact, FAL1 was first investigated in ovarian high-grade serous carcinoma (HGSC). This interesting study suggested that the mechanism underlying the upregulated expression of FAL1 was focal amplification of the chromosome-harbouring FAL1 gene, as indicated by the name itself. FAL1 expression was closely related to the upregulation of E2F1, suggesting the oncogenic function of the FAL1-promoting cell cycle [22]. First, we aimed to confirm the regulatory mechanism of FAL1 in PTC by focal amplification. However, copy number alteration data from TCGA THCA did not show any amplification signals on chromosome 1q21.3, even though FAL1 and the neighbouring genes were highly expressed in PTC with a highly positive correlation with each other. Based on this finding, we prepared a virtual laboratory for the identification of TFBS in FAL1 and ECM1 promoter sequences. Results from PROMO showed many putative transcription factors for both FAL1 and ECM1. After the analysis using ENCODE, we selected c-JUN and JUND as the best candidates for simultaneous expression of FAL1 and ECM1, supported by GSEA according to the FAL1 and ECM1 expression status. In fact, ENCODE was generated by CHIP-seq from 48 cell lines, indicating our analysis using ENCODE are based on bench work experiments. All these analyses suggested that FAL1 upregulation in PTC might be directed by transcription factors such as JUND but not by focal amplification of the FAL1-located chromosome.
In terms of clinical and biological relevance, upregulated expression of FAL1 and ECM1 was seen in the young age group and RAS-like PTC. In fact, the old-aged group showed more aggressive clinical features. In addition, our biological understanding is that BRAF-like PTC is more aggressive, and currently developed novel therapeutics have focused on BRAF-like refractory PTC [5,17]. However, in clinical settings, we have not encountered young patients with highly aggressive clinical features and RAS-like PTC harbouring TERT promoter mutation. Interestingly, our GSEA according to FAL1 and ECM1 expression status showed that the upregulated expression of these genes was functionally related to RAS signalling and immune-related genes. In the past, we considered epithelial-to-mesenchymal transition (EMT) as a representative mechanism of carcinogenesis [4,6,34,35,36]. However, in recent years, the importance of factors determining the tumour microenvironment has not been revealed, and it is understood that the relationship between tumour cells and the surrounding cells, especially immunological interaction, is an important factor in determining the prognosis of a tumour. In line with the current advances in tumour immunology, our data may suggest that RAS-like PTC with FAL1 and ECM1 upregulation proceeds from carcinogenesis to aggressive PTC by an immunological mechanism compared to classical BRAF-like PTC.
Our data did not show any statistically significant difference in clinical features, except age. We believe that this is due to the characteristics of the TCGA THCA cohort, which makes it difficult to reflect the clinically significant role of FAL1 and ECM1 in a limited sample number of aggressive RAS-like PTC because the prognosis of BRAF-like PTC, which is more frequently observed, is generally poor. However, the coordinated enrichment of RAS signalling and immune-related genes was consistently observed in PTC harbouring upregulated expression of FAL1 and ECM1 and PTC in young patients; we believe that this finding will be an important reference and will serve as the basis for future studies.

5. Conclusions

In conclusion, our data suggest that FAL1 upregulation might be induced by selective transcription factors such as JUND and could be a useful diagnostic and therapeutic marker in aggressive RAS-like PTC, especially in young patients. Further studies that include a large sample size should be conducted to confirm our data.

Supplementary Materials

The following are available online at https://www.mdpi.com/article/10.3390/cancers13133223/s1, Figure S1. Correlation analysis of FAL1 expression with RPRD2 and TARS2 expression in THCA. (A) Correlation of FAL1 expression with RPRD2 expression (n = 497). Figure S2. Confirmation of transcription factor binding site of RPRD2 and TARS2 promoters. (A) Results of PROMO analysis that predicted TFBS from the DNA sequence of RPRD2 gene. Figure S3. Correlation analysis of JUND expression with FAL1, ECM1 expression in THCA. (A) Correlation of JUND expression with FAL1 expression (n = 497). Table S1: Comparison of 1q arm-level amplification in TCGA THCA according to FAL1 expression status.

Author Contributions

Y.-S.J. and J.L. designed the project and supervised the research; S.J., S.-G.L., H.K., G.L. and S.P. performed the analyses; S.J. and S.-G.L. performed the computational analysis; S.P. and I.-K.K. contributed to the discussion about the research; S.J., S.-G.L., Y.-S.J. and J.L. wrote the manuscript. All authors have read and agreed to the published version of the manuscript.

Funding

S.G.L was supported by grants from the National Research Foundation of Korea (NRF) funded by the Korean government (MEST) (NRF-2020R1F1A1048986). J.L. was supported by a grant from the National Research Foundation of Korea (NRF) funded by the Korean government (MEST) (NRF-2020R1A2C1006047) and by the Korean Foundation for Cancer Research (2020). Y.S.J. was supported by grants from the National Research Foundation of Korea (NRF) funded by the Korean government (MEST) (NRF-2018R1A2B6004179, NRF-2021R1H1A2012035). The funders had no role in the design of the study; in the collection, analyses, or interpretation of data; in the writing of the manuscript, or in the decision to publish the results.

Institutional Review Board Statement

The study was conducted according to the guidelines of the Declaration of Helsinki and approved by the Institutional Review Board of the Severance Medical Centre (IRB No. 4-2013-0546, 30 September 2013).

Informed Consent Statement

Patient consent was waived due to the nature of this study using public data.

Data Availability Statement

A description of the publicly archived datasets analyzed in this study is detailed in the Section 2.

Acknowledgments

The authors would like to thank Ji Young Kim (Severance Hospital, Yonsei Cancer Center), Hwanju Lee (Severance Hospital, Yonsei Cancer Center), Hee Chang Yu (Severance Hospital, Yonsei Cancer Center), and Hoyoung Kim (Severance Hospital, Yonsei Cancer Center) for their technical support.

Conflicts of Interest

The authors declare no conflict of interest.

References

  1. Davies, L.; Welch, H.G. Increasing incidence of thyroid cancer in the United States, 1973–2002. Jama 2006, 295, 2164–2167. [Google Scholar] [CrossRef] [Green Version]
  2. Jung, C.K.; Little, M.P.; Lubin, J.H.; Brenner, A.V.; Wells, S.A., Jr.; Sigurdson, A.J.; Nikiforov, Y.E. The increase in thyroid cancer incidence during the last four decades is accompanied by a high frequency of BRAF mutations and a sharp increase in RAS mutations. J. Clin. Endocrinol. Metab. 2014, 99, E276–E285. [Google Scholar] [CrossRef] [PubMed] [Green Version]
  3. Ho, J.; Kim, E.; Han, M.; Jung, I.; Lee, J.; Jo, Y.S. Impact of Dyslipidemia on the Risk of Second Cancer in Thyroid Cancer Patients: A Korean National Cohort Study. Ann. Surg. Oncol. 2021. [Google Scholar] [CrossRef]
  4. Lee, W.K.; Lee, J.; Kim, H.; Lee, S.G.; Choi, S.H.; Jeong, S.; Kwon, H.J.; Jung, S.G.; Jo, Y.S. Peripheral location and infiltrative margin predict invasive features of papillary thyroid microcarcinoma. Eur. J. Endocrinol. 2019, 181, 139–149. [Google Scholar] [CrossRef] [PubMed]
  5. Lee, J.; Jeong, S.; Park, J.H.; Lee, C.R.; Ku, C.R.; Kang, S.W.; Jeong, J.J.; Nam, K.H.; Shin, D.Y.; Lee, E.J.; et al. Aberrant expression of COT is related to recurrence of papillary thyroid cancer. Medicine 2015, 94, e548. [Google Scholar] [CrossRef] [PubMed]
  6. Lee, J.; Seol, M.Y.; Jeong, S.; Lee, C.R.; Ku, C.R.; Kang, S.W.; Jeong, J.J.; Shin, D.Y.; Nam, K.H.; Lee, E.J.; et al. A metabolic phenotype based on mitochondrial ribosomal protein expression as a predictor of lymph node metastasis in papillary thyroid carcinoma. Medicine 2015, 94, e380. [Google Scholar] [CrossRef]
  7. Zhang, L.; Wei, W.J.; Ji, Q.H.; Zhu, Y.X.; Wang, Z.Y.; Wang, Y.; Huang, C.P.; Shen, Q.; Li, D.S.; Wu, Y. Risk factors for neck nodal metastasis in papillary thyroid microcarcinoma: A study of 1066 patients. J. Clin. Endocrinol. Metab. 2012, 97, 1250–1257. [Google Scholar] [CrossRef] [Green Version]
  8. Lee, J.; Kim, C.H.; Min, I.K.; Jeong, S.; Kim, H.; Choi, M.J.; Kwon, H.J.; Jung, S.G.; Jo, Y.S. Detailed characterization of metastatic lymph nodes improves the prediction accuracy of currently used risk stratification systems in N1 stage papillary thyroid cancer. Eur. J. Endocrinol. 2020, 183, 83–93. [Google Scholar] [CrossRef]
  9. Vasko, V.; Espinosa, A.V.; Scouten, W.; He, H.; Auer, H.; Liyanarachchi, S.; Larin, A.; Savchenko, V.; Francis, G.L.; de la Chapelle, A.; et al. Gene expression and functional evidence of epithelial-to-mesenchymal transition in papillary thyroid carcinoma invasion. Proc. Natl. Acad. Sci. USA 2007, 104, 2803–2808. [Google Scholar] [CrossRef] [Green Version]
  10. Higgs, P.G.; Lehman, N. The RNA World: Molecular cooperation at the origins of life. Nat. Rev. Genet. 2015, 16, 7–17. [Google Scholar] [CrossRef]
  11. Morris, K.V.; Mattick, J.S. The rise of regulatory RNA. Nat. Rev. Genet. 2014, 15, 423–437. [Google Scholar] [CrossRef] [Green Version]
  12. Esteller, M. Non-coding RNAs in human disease. Nat. Reviews. Genet. 2011, 12, 861–874. [Google Scholar] [CrossRef] [PubMed]
  13. Guttman, M.; Amit, I.; Garber, M.; French, C.; Lin, M.F.; Feldser, D.; Huarte, M.; Zuk, O.; Carey, B.W.; Cassady, J.P.; et al. Chromatin signature reveals over a thousand highly conserved large non-coding RNAs in mammals. Nature 2009, 458, 223–227. [Google Scholar] [CrossRef] [PubMed]
  14. Fatica, A.; Bozzoni, I. Long non-coding RNAs: New players in cell differentiation and development. Nat. Rev. Genet. 2014, 15, 7–21. [Google Scholar] [CrossRef] [PubMed]
  15. He, H.; Li, W.; Liyanarachchi, S.; Jendrzejewski, J.; Srinivas, M.; Davuluri, R.V.; Nagy, R.; de la Chapelle, A. Genetic predisposition to papillary thyroid carcinoma: Involvement of FOXE1, TSHR, and a novel lincRNA gene, PTCSC2. J. Clin. Endocrinol. Metab. 2015, 100, E164–E172. [Google Scholar] [CrossRef] [PubMed] [Green Version]
  16. Jendrzejewski, J.; He, H.; Radomska, H.S.; Li, W.; Tomsic, J.; Liyanarachchi, S.; Davuluri, R.V.; Nagy, R.; de la Chapelle, A. The polymorphism rs944289 predisposes to papillary thyroid carcinoma through a large intergenic noncoding RNA gene of tumor suppressor type. Proc. Natl. Acad. Sci. USA 2012, 109, 8646–8651. [Google Scholar] [CrossRef] [Green Version]
  17. Wang, Y.; Guo, Q.; Zhao, Y.; Chen, J.; Wang, S.; Hu, J.; Sun, Y. BRAF-activated long non-coding RNA contributes to cell proliferation and activates autophagy in papillary thyroid carcinoma. Oncol. Lett. 2014, 8, 1947–1952. [Google Scholar] [CrossRef] [Green Version]
  18. Jeong, S.; Lee, J.; Kim, D.; Seol, M.Y.; Lee, W.K.; Jeong, J.J.; Nam, K.H.; Jung, S.G.; Shin, D.Y.; Lee, E.J.; et al. Relationship of Focally Amplified Long Noncoding on Chromosome 1 (FAL1) lncRNA with E2F Transcription Factors in Thyroid Cancer. Medicine 2016, 95, e2592. [Google Scholar] [CrossRef]
  19. Li, J.; Han, L.; Roebuck, P.; Diao, L.; Liu, L.; Yuan, Y.; Weinstein, J.N.; Liang, H. TANRIC: An Interactive Open Platform to Explore the Function of lncRNAs in Cancer. Cancer Res. 2015, 75, 3728–3737. [Google Scholar] [CrossRef] [Green Version]
  20. Mermel, C.H.; Schumacher, S.E.; Hill, B.; Meyerson, M.L.; Beroukhim, R.; Getz, G. GISTIC2.0 facilitates sensitive and confident localization of the targets of focal somatic copy-number alteration in human cancers. Genome Biol. 2011, 12, R41. [Google Scholar] [CrossRef] [Green Version]
  21. Subramanian, A.; Tamayo, P.; Mootha, V.K.; Mukherjee, S.; Ebert, B.L.; Gillette, M.A.; Paulovich, A.; Pomeroy, S.L.; Golub, T.R.; Lander, E.S.; et al. Gene set enrichment analysis: A knowledge-based approach for interpreting genome-wide expression profiles. Proc. Natl. Acad. Sci. USA 2005, 102, 15545–15550. [Google Scholar] [CrossRef] [PubMed] [Green Version]
  22. Hu, X.; Feng, Y.; Zhang, D.; Zhao, S.D.; Hu, Z.; Greshock, J.; Zhang, Y.; Yang, L.; Zhong, X.; Wang, L.P.; et al. A functional genomic approach identifies FAL1 as an oncogenic long noncoding RNA that associates with BMI1 and represses p21 expression in cancer. Cancer Cell 2014, 26, 344–357. [Google Scholar] [CrossRef] [Green Version]
  23. Messeguer, X.; Escudero, R.; Farre, D.; Nunez, O.; Martinez, J.; Alba, M.M. PROMO: Detection of known transcription regulatory elements using species-tailored searches. Bioinformatics 2002, 18, 333–334. [Google Scholar] [CrossRef] [PubMed]
  24. Farre, D.; Roset, R.; Huerta, M.; Adsuara, J.E.; Rosello, L.; Alba, M.M.; Messeguer, X. Identification of patterns in biological sequences at the ALGGEN server: PROMO and MALGEN. Nucleic Acids Res. 2003, 31, 3651–3653. [Google Scholar] [CrossRef] [Green Version]
  25. Guigo, R.; Flicek, P.; Abril, J.F.; Reymond, A.; Lagarde, J.; Denoeud, F.; Antonarakis, S.; Ashburner, M.; Bajic, V.B.; Birney, E.; et al. EGASP: The human ENCODE Genome Annotation Assessment Project. Genome Biol. 2006, 7 (Suppl. 1), 1–31. [Google Scholar] [CrossRef] [PubMed] [Green Version]
  26. Jeong, S.; Kim, I.K.; Kim, H.; Choi, M.J.; Lee, J.; Jo, Y.S. Liver X Receptor beta Related to Tumor Progression and Ribosome Gene Expression in Papillary Thyroid Cancer. Endocrinol. Metab. 2020, 35, 656–668. [Google Scholar] [CrossRef] [PubMed]
  27. Choi, J.B.; Lee, W.K.; Lee, S.G.; Ryu, H.; Lee, C.R.; Kang, S.W.; Jeong, J.J.; Nam, K.H.; Lee, E.J.; Chung, W.Y.; et al. Long-term oncologic outcomes of papillary thyroid microcarcinoma according to the presence of clinically apparent lymph node metastasis: A large retrospective analysis of 5,348 patients. Cancer Manag. Res. 2018, 10, 2883–2891. [Google Scholar] [CrossRef] [Green Version]
  28. Sui, F.; Ji, M.; Hou, P. Long non-coding RNAs in thyroid cancer: Biological functions and clinical significance. Mol. Cell Endocrinol. 2018, 469, 11–22. [Google Scholar] [CrossRef]
  29. Mahmoudian-Sani, M.R.; Jalali, A.; Jamshidi, M.; Moridi, H.; Alghasi, A.; Shojaeian, A.; Mobini, G.R. Long Non-Coding RNAs in Thyroid Cancer: Implications for Pathogenesis, Diagnosis, and Therapy. Oncol. Res. Treat. 2019, 42, 136–142. [Google Scholar] [CrossRef]
  30. Ghafouri-Fard, S.; Mohammad-Rahimi, H.; Taheri, M. The role of long non-coding RNAs in the pathogenesis of thyroid cancer. Exp. Mol. Pathol. 2020, 112, 104332. [Google Scholar] [CrossRef]
  31. Peng, X.; Zhang, K.; Ma, L.; Xu, J.; Chang, W. The Role of Long Non-Coding RNAs in Thyroid Cancer. Front. Oncol. 2020, 10, 941. [Google Scholar] [CrossRef] [PubMed]
  32. Samimi, H.; Sajjadi-Jazi, S.M.; Seifirad, S.; Atlasi, R.; Mahmoodzadeh, H.; Faghihi, M.A.; Haghpanah, V. Molecular mechanisms of long non-coding RNAs in anaplastic thyroid cancer: A systematic review. Cancer Cell Int. 2020, 20, 352. [Google Scholar] [CrossRef]
  33. Kim, D.; Lee, W.K.; Jeong, S.; Seol, M.Y.; Kim, H.; Kim, K.S.; Lee, E.J.; Lee, J.; Jo, Y.S. Upregulation of long noncoding RNA LOC100507661 promotes tumor aggressiveness in thyroid cancer. Mol. Cell Endocrinol. 2016, 431, 36–45. [Google Scholar] [CrossRef]
  34. Lee, J.; Jeong, S.; Lee, C.R.; Ku, C.R.; Kang, S.W.; Jeong, J.J.; Nam, K.H.; Shin, D.Y.; Chung, W.Y.; Lee, E.J.; et al. GLI1 Transcription Factor Affects Tumor Aggressiveness in Patients With Papillary Thyroid Cancers. Medicine 2015, 94, e998. [Google Scholar] [CrossRef] [PubMed]
  35. Lee, J.; Seol, M.Y.; Jeong, S.; Kwon, H.J.; Lee, C.R.; Ku, C.R.; Kang, S.W.; Jeong, J.J.; Shin, D.Y.; Nam, K.H.; et al. KSR1 is coordinately regulated with Notch signaling and oxidative phosphorylation in thyroid cancer. J. Mol. Endocrinol. 2015, 54, 115–124. [Google Scholar] [CrossRef] [Green Version]
  36. Lee, W.K.; Lee, S.G.; Yim, S.H.; Kim, D.; Kim, H.; Jeong, S.; Jung, S.G.; Jo, Y.S.; Lee, J. Whole Exome Sequencing Identifies a Novel Hedgehog-Interacting Protein G516R Mutation in Locally Advanced Papillary Thyroid Cancer. Int. J. Mol. Sci. 2018, 19, 2867. [Google Scholar] [CrossRef] [Green Version]
Figure 1. (A) Positive correlation of FAL1 expression with the expression of neighbouring genes adjacently located on chromosome 1q21.3. A. FAL1 expression status of 20 types of human cancers. (B) Location of FAL1 and neighbouring genes on chromosome 1q21.3 and correlation status of FAL1 with neighbouring genes in terms of expression in 17 human cancers. (C) Positive correlation of FAL1 expression and ECM1 expression, and upregulated expression of ECM1 in tumour samples compared to that in normal tissues in THCA. (D) Positive correlation of FAL1 expression with ADAMTSL4 expression and upregulated expression of ADAMTSL4 in tumour samples compared to that in normal tissues in THCA. Abbreviations: FAL1, focally amplified lncRNA on chromosome 1; RPRD2, regulation of nuclear pre-MRNA domain-containing 2; TARS2, threonyl-tRNA synthetase 2, mitochondrial; ECM1, extracellular matrix protein 1; ADAMTSL4-AS1, ADAMTSL4 antisense RNA 1; MCL1, myeloid cell leukaemia 1; ENSA, endosulfine alpha; GOLPH3L, Golgi phosphoprotein 3-like; HORMAD1, HORMA domain-containing 1; CTSS, cathepsin S; CTSK, cathepsin K; ARNT, aryl hydrocarbon receptor nuclear translocator. The arrows indicate the direction of transcription. Average values were compared using an unpaired t-test. In the scatter plots, data are expressed as the mean ± SD. Correlation coefficient: Pearson’s r. * p < 0.05, ** p < 0.01. All p-values are two-sided.
Cancers 13 03223 g001aCancers 13 03223 g001b
Figure 2. Analysis of focal amplification using data of copy number alterations from TCGA OVCA and TCGA THCA. (A) Results of analysis of the focal amplification in the whole chromosome from TCGA OVCA. (B) Results of analysis of the focal amplification in the whole chromosome from TCGA THCA. (C)Results from PROMO analysis to identify putative TFBS in DNA sequences of the FAL1 and ECM1 genes. Abbreviations: TF, transcription factor; TFBS, transcription factor-binding sites; TCGA, The Cancer Genome Atlas; THCA, thyroid carcinoma; OVCA, ovarian cancer. The arrows indicate chromosome 1q21.3, which was reported as a focal amplification lesion for FAL1 upregulation in OVCA.
Cancers 13 03223 g002
Figure 3. Results of the analysis using the Encyclopaedia of DNA Elements (ENCODE) and FAL1 and ECM1 expression according to patients’ age. (A) The TFBS of JUND, c-JUN, and JUN-FOS in the promoter area of ECM1 and FAL1. (B) Expression of the transcriptional target genes of c-JUN according to ECM1 and FAL1 expression status in TCGA THCA. (C) Expression of the transcriptional target genes of JUND according to ECM1 and FAL1 expression status in TCGA THCA. (D) Selected target gene expressions were identified in GSE127083 RNA-seq dataset for K562 cells treated with JUND-targeted CRISPRi. (E) FAL1 expression status according to patients’ age (F) ECM1 expression status according to patients’ age. Abbreviations: JUND, junD proto-oncogene; AP-1, transcription factor subunit; JUN, jun proto-oncogene; FOS, fos proto-oncogene; TFBS, transcription factor-binding sites; TCGA, The Cancer Genome Atlas; THCA, thyroid carcinoma; E2F1, transcription factor E2F transcription factor 1; E2F2, transcription factor E2F transcription factor 2; VEGFA, vascular endothelial growth factor A; CCND1 Cyclin D1. Average values were compared using ANOVA, Student’s t-test. In the scatter plots, data are expressed as mean ± SD. All p-values are two-sided. * p < 0.01, ** p < 0.001.
Cancers 13 03223 g003aCancers 13 03223 g003b
Figure 4. Results of GSEA according to patients’ age, FAL1 upregulation and ECM1 upregulation. (A)Representative gene sets co-ordinately enriched in the young patient group. (B) Representative gene sets co-ordinately enriched in the old-aged group. (C) Representative gene sets co-ordinately enriched in the FAL1-upregulated group. (D) Representative gene sets co-ordinately enriched in the ECM1-upregulated group. Red colour refers to gene sets overlapping in the young-aged group and the FAL1- and ECM1-upregulated group. Abbreviations: GSEA, gene set enrichment analysis; NES, normalised enrichment score.
Cancers 13 03223 g004
Table 1. Molecular features of TCGA THCA according to FAL1 expression status.
Molecular FeatureFAL1p Value
Low Expression
n = 124 (%)
High Expression
n = 124 (%)
mRNA cluster number
112 (9.8)59 (48.8)<0.0001
213 (10.7)22 (18.2)
332 (26.2)5 (4.1)
439 (32.0)8 (6.6)
526 (21.3)27 (22.3)
miRNA cluster number
12 (1.6)2 (1.6)<0.0001
248 (39.0)19 (15.4)
326 (21.1)7 (5.7)
416 (13.0)58 (47.2)
516 (13.0)19 (15.4)
615 (12.2)18 (14.6)
RAS mutation
Absent122 (98.4)89 (72.4)<0.0001
Present2 (1.6)34 (27.6)
BRAF mutation
Absent31 (25.0)97 (78.9)<0.0001
Present93 (75.0)26 (21.1)
TERT promoter mutation
Absent88 (87.1)81 (89.0)0.688
Present13 (12.9)10 (11.0)
RAS/RAF score−0.67 ± 0.490.21 ± 0.67<0.0001 *
ERK score11.37 ± 16.272.14 ± 20.260.001 *
Differentiation score−0.49 ± 0.990.54 ± 1.08<0.0001 *
Akt pT308−0.02 ± 0.640.06 ± 0.470.275 *
Akt pS473−0.02 ± 0.470.09 ± 0.340.047 *
TCGA, The Cancer Genome Atlas; THCA, thyroid carcinoma.  p values calculated by Student’s t test; * p values calculated by chi-square test or linear-by-linear association.
Table 2. Molecular features of TCGA THCA according to ECM1 expression status.
Molecular FeatureECM1p Value
Low Expression
n = 124 (%)
High Expression
n = 124 (%)
mRNA cluster number
158 (47.9)51 (43.2)0.190
27 (5.8)21 (17.8)
336 (29.8)5 (4.2)
45 (4.1)14 (11.9)
515 (12.4)27 (22.9)
miRNA cluster number
13 (2.5)3 (2.4)0.796
216 (13.1)22 (17.9)
324 (19.7)11 (8.9)
446 (37.7)51 (41.5)
519 (15.6)21 (17.1)
614 (11.5)15 (12.2)
RAS mutation
Absent117 (95.1)90 (73.2)<0.0001
Present6 (4.9)33 (26.8)
BRAF mutation
Absent71 (57.7)92 (74.8)0.005
Present52 (42.3)31 (25.2)
TERT promoter mutation
Absent91 (95.8)78 (84.8)0.011
Present4 (4.2)14 (15.2)
RAS/RAF score0.01 ± 0.810.07 ± 0.680.533 *
ERK score−5.25 ± 23.264.92 ± 19.350.001 *
Differentiation score0.32 ± 1.370.39 ± 1.000.674 *
Akt pT3080.09 ± 0.540.06 ± 0.350.691 *
Akt pS4730.14 ± 0.660.01 ± 0.460.122 *
TCGA, The Cancer Genome Atlas; THCA, thyroid carcinoma.  p values calculated by Student’s t test; * p values calculated by chi-square test or linear-by-linear association.
Publisher’s Note: MDPI stays neutral with regard to jurisdictional claims in published maps and institutional affiliations.

