
Tumor Long Interspersed Nucleotide Element-1 (LINE-1) Hypomethylation in Relation to Age of Colorectal Cancer Diagnosis and Prognosis

 , , , , add
Show full author list
, , , , add
Show full author list
Abstract
:Simple Summary
Abstract
1. Introduction
2. Materials and Methods
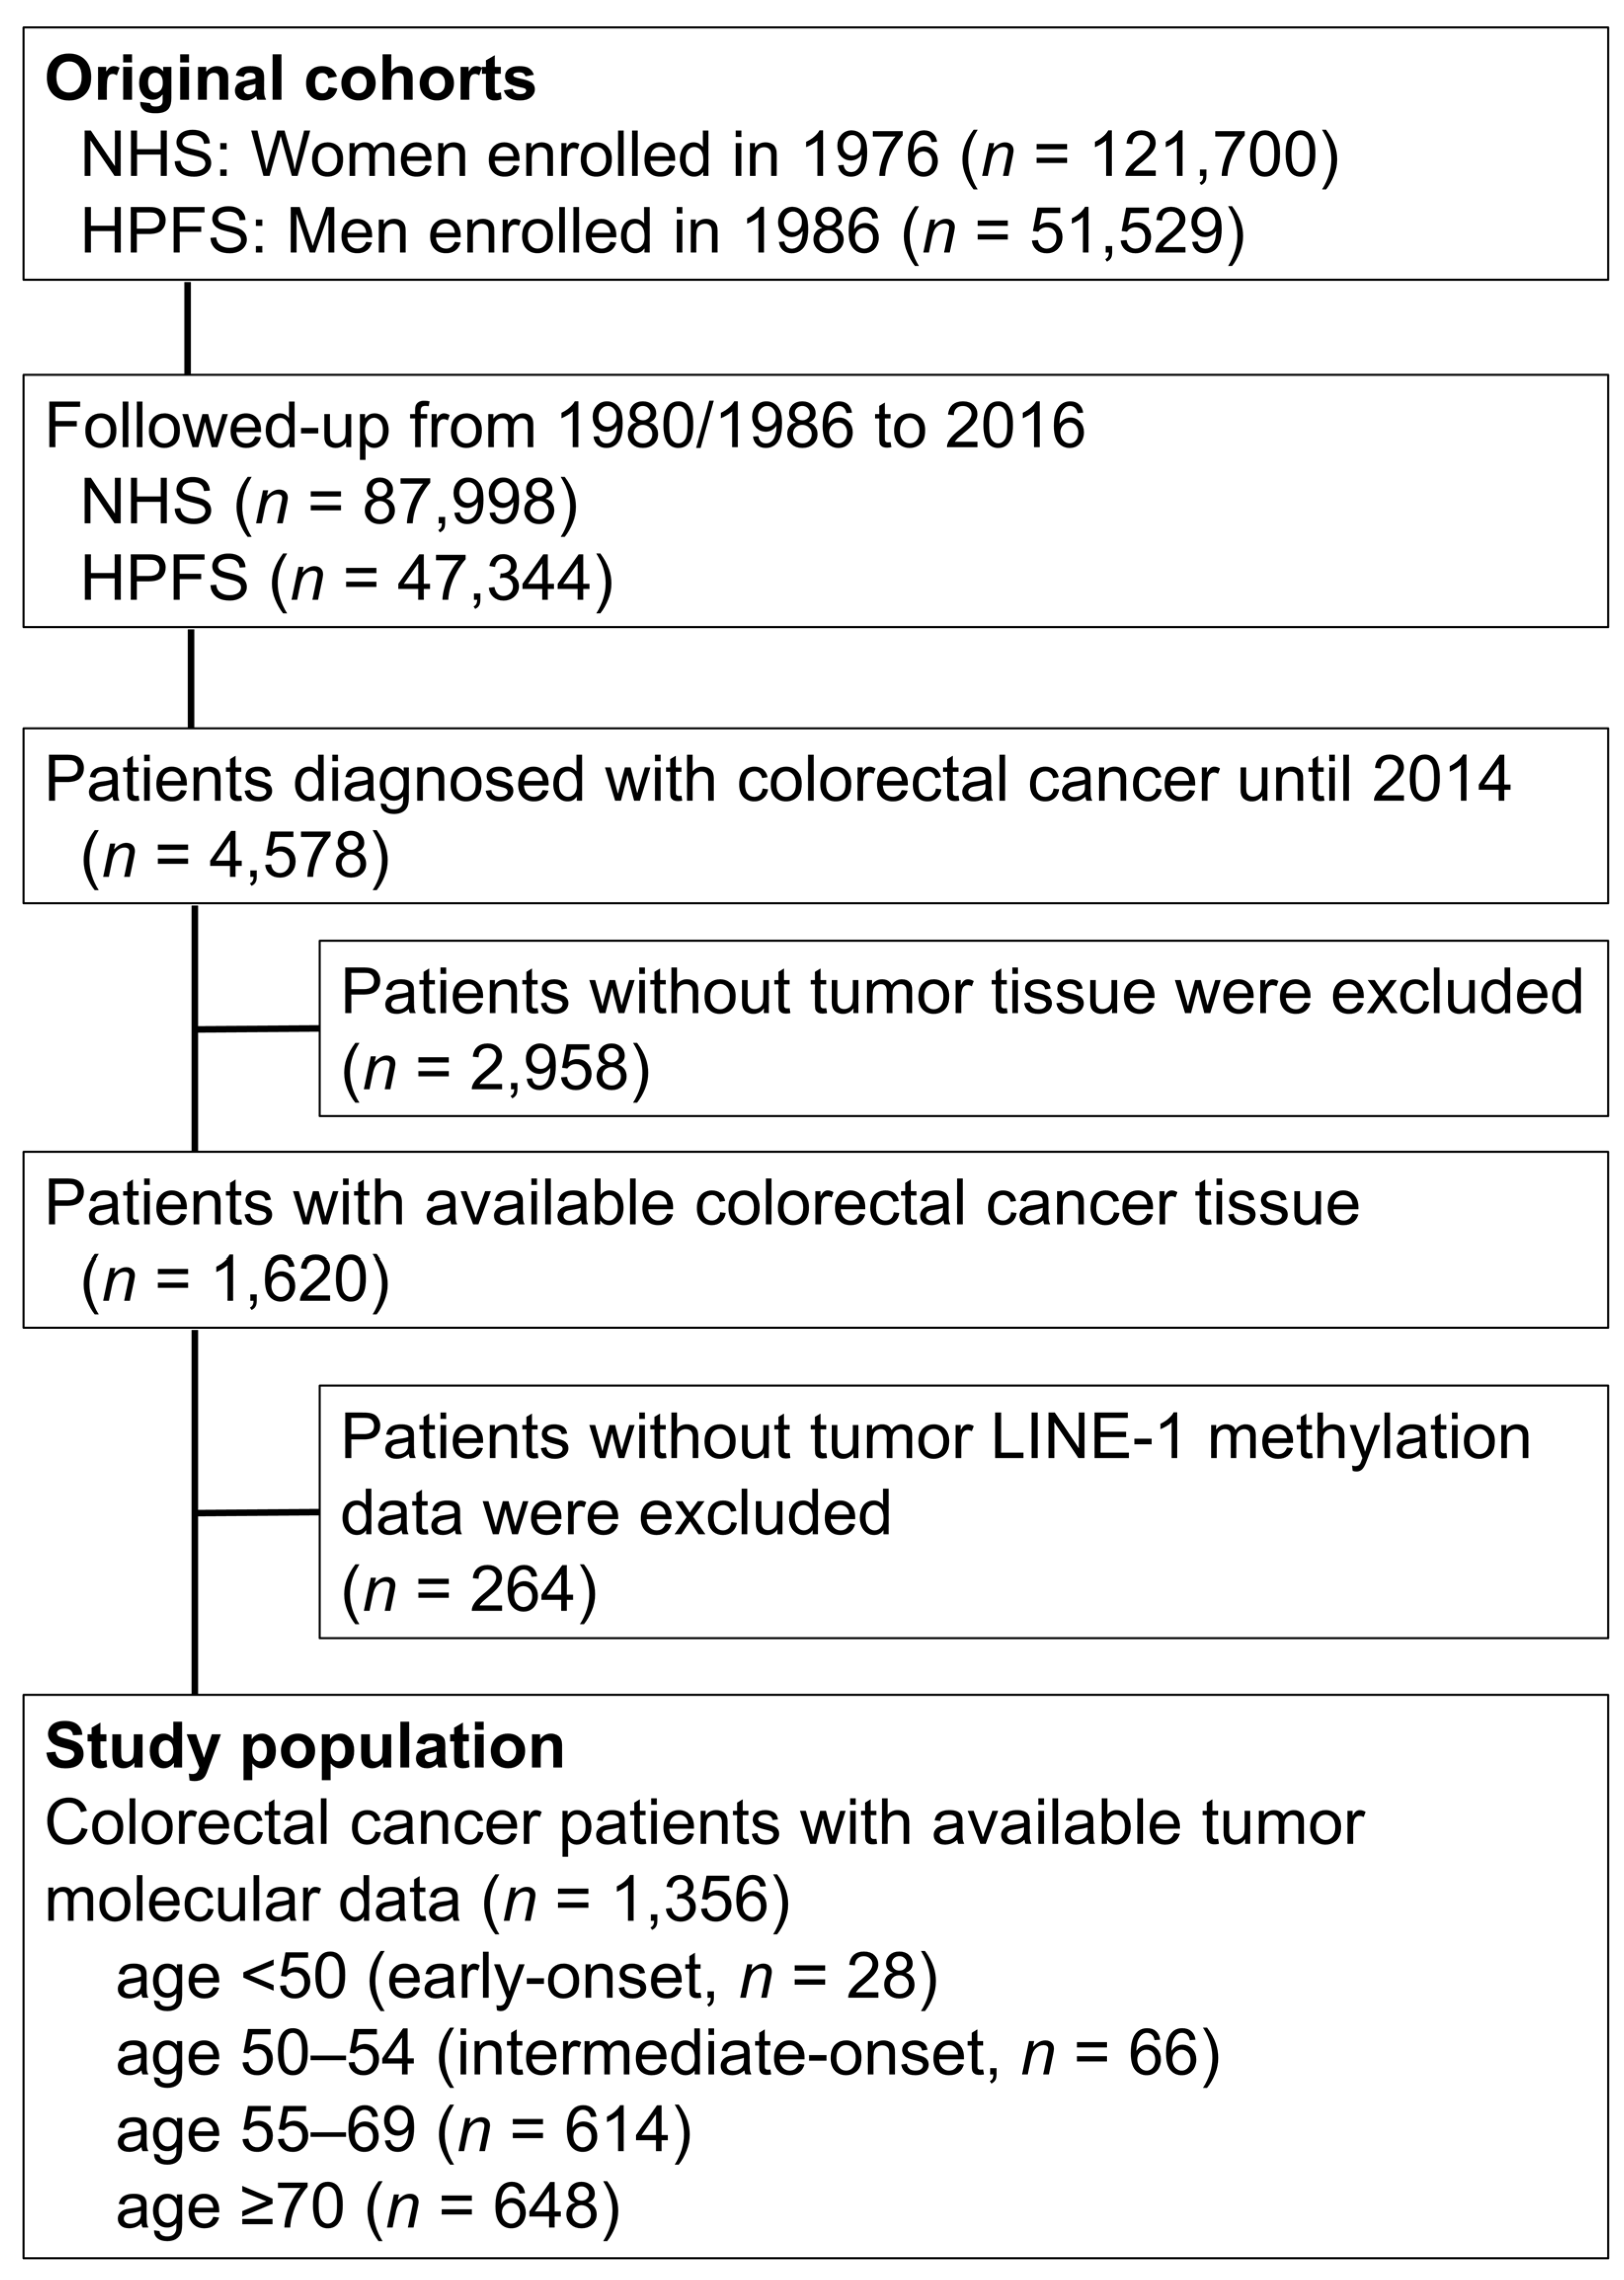
2.1. Study Population
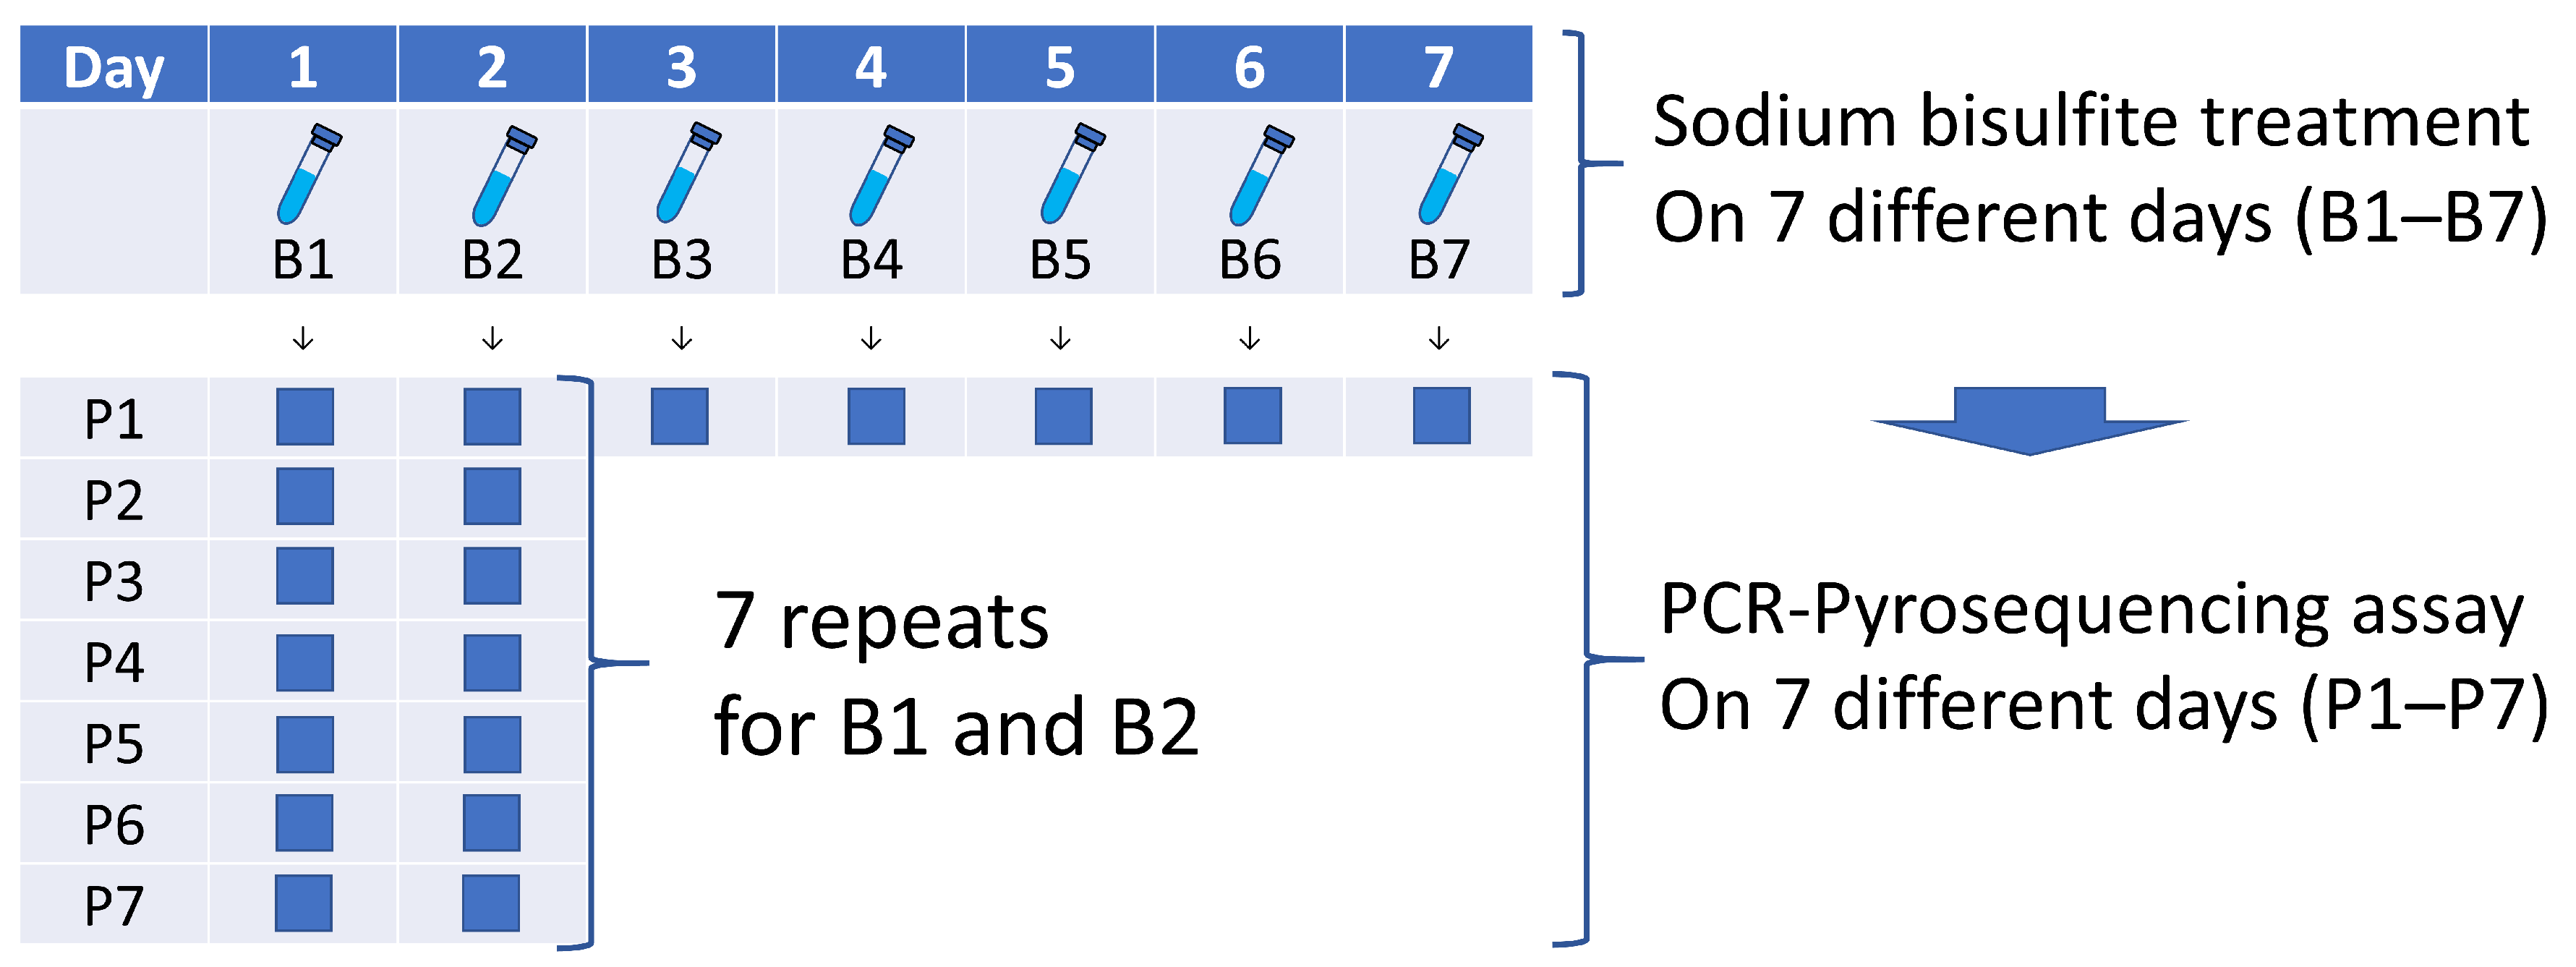
2.2. Assessment of LINE-1 Methylation Level
2.3. Assessments of Other Tumor Characteristics
2.4. Statistical Analyses
2.5. Use of Standardized Official Symbols
3. Results
4. Discussion
5. Conclusions
Supplementary Materials
Author Contributions
Funding
Institutional Review Board Statement
Informed Consent Statement
Data Availability Statement
Acknowledgments
Conflicts of Interest
Abbreviations
| AJCC | American Joint Committee on Cancer |
| CI | confidence interval |
| CIMP | CpG island methylator phenotype |
| FFPE | formalin-fixed paraffin-embedded |
| HR | hazard ratio |
| LCM | laser capture microdissection |
| LINE-1 | long interspersed nucleotide element-1 |
| MSI | microsatellite instability |
| PCR | polymerase chain reaction |
| SD | standard deviation |
| TNM | tumor, node, and metastases |
References
- Siegel, R.L.; Torre, L.A.; Soerjomataram, I.; Hayes, R.B.; Bray, F.; Weber, T.K.; Jemal, A. Global patterns and trends in colorectal cancer incidence in young adults. Gut 2019, 68, 2179–2185. [Google Scholar] [CrossRef] [PubMed] [Green Version]
- Saad El Din, K.; Loree, J.M.; Sayre, E.C.; Gill, S.; Brown, C.J.; Dau, H.; De Vera, M.A. Trends in the epidemiology of young-onset colorectal cancer: A worldwide systematic review. BMC Cancer 2020, 20, 288. [Google Scholar] [CrossRef] [PubMed] [Green Version]
- Chung, R.Y.; Tsoi, K.K.F.; Kyaw, M.H.; Lui, A.R.; Lai, F.T.T.; Sung, J.J. A population-based age-period-cohort study of colorectal cancer incidence comparing Asia against the West. Cancer Epidemiol. 2019, 59, 29–36. [Google Scholar] [CrossRef] [PubMed]
- Sung, H.; Siegel, R.L.; Rosenberg, P.S.; Jemal, A. Emerging cancer trends among young adults in the USA: Analysis of a population-based cancer registry. Lancet Public Health 2019, 4, e137–e147. [Google Scholar] [CrossRef] [Green Version]
- Hofseth, L.J.; Hebert, J.R.; Chanda, A.; Chen, H.; Love, B.L.; Pena, M.M.; Murphy, E.A.; Sajish, M.; Sheth, A.; Buckhaults, P.J.; et al. Early-onset colorectal cancer: Initial clues and current views. Nat. Rev. Gastroenterol. Hepatol. 2020, 17, 352–364. [Google Scholar] [CrossRef]
- Stoffel, E.M.; Murphy, C.C. Epidemiology and Mechanisms of the Increasing Incidence of Colon and Rectal Cancers in Young Adults. Gastroenterology 2020, 158, 341–353. [Google Scholar] [CrossRef] [PubMed]
- Akimoto, N.; Ugai, T.; Zhong, R.; Hamada, T.; Fujiyoshi, K.; Giannakis, M.; Wu, K.; Cao, Y.; Ng, K.; Ogino, S. Rising incidence of early-onset colorectal cancer—A call to action. Nat. Rev. Clin. Oncol. 2021, 18, 230–243. [Google Scholar] [CrossRef]
- Lieu, C.H.; Golemis, E.A.; Serebriiskii, I.G.; Newberg, J.; Hemmerich, A.; Connelly, C.; Messersmith, W.A.; Eng, C.; Eckhardt, S.G.; Frampton, G.; et al. Comprehensive Genomic Landscapes in Early and Later Onset Colorectal Cancer. Clin. Cancer Res. 2019, 25, 5852–5858. [Google Scholar] [CrossRef] [Green Version]
- Willauer, A.N.; Liu, Y.; Pereira, A.A.L.; Lam, M.; Morris, J.S.; Raghav, K.P.S.; Morris, V.K.; Menter, D.; Broaddus, R.; Meric-Bernstam, F.; et al. Clinical and molecular characterization of early-onset colorectal cancer. Cancer 2019, 125, 2002–2010. [Google Scholar] [CrossRef]
- Nimptsch, K.; Wu, K. Is Timing Important? The Role of Diet and Lifestyle during Early Life on Colorectal Neoplasia. Curr. Colorectal. Cancer Rep. 2018, 14, 1–11. [Google Scholar] [CrossRef] [PubMed]
- Liu, P.H.; Wu, K.; Ng, K.; Zauber, A.G.; Nguyen, L.H.; Song, M.; He, X.; Fuchs, C.S.; Ogino, S.; Willett, W.C.; et al. Association of Obesity With Risk of Early-Onset Colorectal Cancer Among Women. JAMA Oncol. 2019, 5, 37–44. [Google Scholar] [CrossRef] [PubMed] [Green Version]
- Szyf, M. The early life environment and the epigenome. Biochim. Biophys. Acta 2009, 1790, 878–885. [Google Scholar] [CrossRef] [PubMed]
- Ogino, S.; Lochhead, P.; Chan, A.T.; Nishihara, R.; Cho, E.; Wolpin, B.M.; Meyerhardt, J.A.; Meissner, A.; Schernhammer, E.S.; Fuchs, C.S.; et al. Molecular pathological epidemiology of epigenetics: Emerging integrative science to analyze environment, host, and disease. Mod. Pathol. 2013, 26, 465–484. [Google Scholar] [CrossRef] [PubMed]
- Feinberg, A.P. The Key Role of Epigenetics in Human Disease Prevention and Mitigation. N. Engl. J. Med. 2018, 378, 1323–1334. [Google Scholar] [CrossRef] [PubMed]
- Baba, Y.; Yagi, T.; Sawayama, H.; Hiyoshi, Y.; Ishimoto, T.; Iwatsuki, M.; Miyamoto, Y.; Yoshida, N.; Baba, H. Long Interspersed Element-1 Methylation Level as a Prognostic Biomarker in Gastrointestinal Cancers. Digestion 2018, 97, 26–30. [Google Scholar] [CrossRef] [PubMed]
- Antelo, M.; Balaguer, F.; Shia, J.; Shen, Y.; Hur, K.; Moreira, L.; Cuatrecasas, M.; Bujanda, L.; Giraldez, M.D.; Takahashi, M.; et al. A high degree of LINE-1 hypomethylation is a unique feature of early-onset colorectal cancer. PLoS ONE 2012, 7, e45357. [Google Scholar] [CrossRef] [PubMed]
- Baba, Y.; Huttenhower, C.; Nosho, K.; Tanaka, N.; Shima, K.; Hazra, A.; Schernhammer, E.S.; Hunter, D.J.; Giovannucci, E.L.; Fuchs, C.S.; et al. Epigenomic diversity of colorectal cancer indicated by LINE-1 methylation in a database of 869 tumors. Mol. Cancer 2010, 9, 125. [Google Scholar] [CrossRef] [PubMed] [Green Version]
- Ogino, S.; Kawasaki, T.; Nosho, K.; Ohnishi, M.; Suemoto, Y.; Kirkner, G.J.; Fuchs, C.S. LINE-1 hypomethylation is inversely associated with microsatellite instability and CpG island methylator phenotype in colorectal cancer. Int. J. Cancer 2008, 122, 2767–2773. [Google Scholar] [CrossRef] [Green Version]
- Inamura, K.; Yamauchi, M.; Nishihara, R.; Lochhead, P.; Qian, Z.R.; Kuchiba, A.; Kim, S.A.; Mima, K.; Sukawa, Y.; Jung, S.; et al. Tumor LINE-1 methylation level and microsatellite instability in relation to colorectal cancer prognosis. J. Natl. Cancer Inst. 2014, 106, dju195. [Google Scholar] [CrossRef] [Green Version]
- Mima, K.; Nowak, J.A.; Qian, Z.R.; Cao, Y.; Song, M.; Masugi, Y.; Shi, Y.; da Silva, A.; Gu, M.; Li, W.; et al. Tumor LINE-1 methylation level and colorectal cancer location in relation to patient survival. Oncotarget 2016, 7, 55098–55109. [Google Scholar] [CrossRef] [Green Version]
- Nishihara, R.; Wu, K.; Lochhead, P.; Morikawa, T.; Liao, X.; Qian, Z.R.; Inamura, K.; Kim, S.A.; Kuchiba, A.; Yamauchi, M.; et al. Long-term colorectal-cancer incidence and mortality after lower endoscopy. N. Engl. J. Med. 2013, 369, 1095–1105. [Google Scholar] [CrossRef] [PubMed] [Green Version]
- Haruki, K.; Kosumi, K.; Li, P.; Arima, K.; Väyrynen, J.P.; Lau, M.C.; Twombly, T.S.; Hamada, T.; Glickman, J.N.; Fujiyoshi, K.; et al. An integrated analysis of lymphocytic reaction, tumour molecular characteristics and patient survival in colorectal cancer. Br. J. Cancer 2020, 122, 1367–1377. [Google Scholar] [CrossRef] [PubMed]
- Yamauchi, M.; Morikawa, T.; Kuchiba, A.; Imamura, Y.; Qian, Z.R.; Nishihara, R.; Liao, X.; Waldron, L.; Hoshida, Y.; Huttenhower, C.; et al. Assessment of colorectal cancer molecular features along bowel subsites challenges the conception of distinct dichotomy of proximal versus distal colorectum. Gut 2012, 61, 847–854. [Google Scholar] [CrossRef] [PubMed]
- Irahara, N.; Nosho, K.; Baba, Y.; Shima, K.; Lindeman, N.I.; Hazra, A.; Schernhammer, E.S.; Hunter, D.J.; Fuchs, C.S.; Ogino, S. Precision of pyrosequencing assay to measure LINE-1 methylation in colon cancer, normal colonic mucosa, and peripheral blood cells. J. Mol. Diagn 2010, 12, 177–183. [Google Scholar] [CrossRef] [PubMed]
- Burden, A.F.; Manley, N.C.; Clark, A.D.; Gartler, S.M.; Laird, C.D.; Hansen, R.S. Hemimethylation and non-CpG methylation levels in a promoter region of human LINE-1 (L1) repeated elements. J. Biol. Chem. 2005, 280, 14413–14419. [Google Scholar] [CrossRef] [Green Version]
- Ogino, S.; Nosho, K.; Kirkner, G.J.; Kawasaki, T.; Meyerhardt, J.A.; Loda, M.; Giovannucci, E.L.; Fuchs, C.S. CpG island methylator phenotype, microsatellite instability, BRAF mutation and clinical outcome in colon cancer. Gut 2009, 58, 90–96. [Google Scholar] [CrossRef] [Green Version]
- Fujiyoshi, K.; Bruford, E.A.; Mroz, P.; Sims, C.L.; O’Leary, T.J.; Lo, A.W.I.; Chen, N.; Patel, N.R.; Patel, K.P.; Seliger, B.; et al. Opinion: Standardizing gene product nomenclature-a call to action. Proc. Natl. Acad. Sci. USA 2021, 118, e2025207118. [Google Scholar] [CrossRef] [PubMed]
- Liao, X.; Lochhead, P.; Nishihara, R.; Morikawa, T.; Kuchiba, A.; Yamauchi, M.; Imamura, Y.; Qian, Z.R.; Baba, Y.; Shima, K.; et al. Aspirin use, tumor PIK3CA mutation, and colorectal-cancer survival. N. Engl. J. Med. 2012, 367, 1596–1606. [Google Scholar] [CrossRef] [PubMed] [Green Version]
- Benjamin, D.J.; Berger, J.O.; Johannesson, M.; Nosek, B.A.; Wagenmakers, E.J.; Berk, R.; Bollen, K.A.; Brembs, B.; Brown, L.; Camerer, C.; et al. Redefine statistical significance. Nat. Hum. Behav. 2018, 2, 6–10. [Google Scholar] [CrossRef]
- Gupta, S.; Harper, A.; Ruan, Y.; Barr, R.; Frazier, A.L.; Ferlay, J.; Steliarova-Foucher, E.; Fidler-Benaoudia, M.M. International trends in the incidence of cancer among adolescents and young adults. J. Natl. Cancer Inst. 2020, 112, 1105–1117. [Google Scholar] [CrossRef] [PubMed]
- Siegel, R.L.; Fedewa, S.A.; Anderson, W.F.; Miller, K.D.; Ma, J.; Rosenberg, P.S.; Jemal, A. Colorectal Cancer Incidence Patterns in the United States, 1974-2013. J. Natl. Cancer. Inst. 2017, 109, djw322. [Google Scholar] [CrossRef] [Green Version]
- Kneuertz, P.J.; Chang, G.J.; Hu, C.Y.; Rodriguez-Bigas, M.A.; Eng, C.; Vilar, E.; Skibber, J.M.; Feig, B.W.; Cormier, J.N.; You, Y.N. Overtreatment of young adults with colon cancer: More intense treatments with unmatched survival gains. JAMA Surg. 2015, 150, 402–409. [Google Scholar] [CrossRef] [PubMed]
- Yeo, H.; Betel, D.; Abelson, J.S.; Zheng, X.E.; Yantiss, R.; Shah, M.A. Early-onset Colorectal Cancer is Distinct From Traditional Colorectal Cancer. Clin. Colorectal. Cancer 2017, 16, 293–299.e296. [Google Scholar] [CrossRef] [PubMed]
- Soliman, B.G.; Karagkounis, G.; Church, J.M.; Plesec, T.; Kalady, M.F. Mucinous Histology Signifies Poor Oncologic Outcome in Young Patients With Colorectal Cancer. Dis. Colon Rectum 2018, 61, 547–553. [Google Scholar] [CrossRef]
- Mauri, G.; Sartore-Bianchi, A.; Russo, A.G.; Marsoni, S.; Bardelli, A.; Siena, S. Early-onset colorectal cancer in young individuals. Mol. Oncol. 2019, 13, 109–131. [Google Scholar] [CrossRef] [Green Version]
- Chen, F.W.; Sundaram, V.; Chew, T.A.; Ladabaum, U. Advanced-Stage Colorectal Cancer in Persons Younger Than 50 Years Not Associated With Longer Duration of Symptoms or Time to Diagnosis. Clin. Gastroenterol. Hepatol. 2017, 15, 728–737.e723. [Google Scholar] [CrossRef] [Green Version]
- Stoffel, E.M.; Koeppe, E.; Everett, J.; Ulintz, P.; Kiel, M.; Osborne, J.; Williams, L.; Hanson, K.; Gruber, S.B.; Rozek, L.S. Germline Genetic Features of Young Individuals With Colorectal Cancer. Gastroenterology 2018, 154, 897–905.e891. [Google Scholar] [CrossRef] [PubMed]
- Mork, M.E.; You, Y.N.; Ying, J.; Bannon, S.A.; Lynch, P.M.; Rodriguez-Bigas, M.A.; Vilar, E. High Prevalence of Hereditary Cancer Syndromes in Adolescents and Young Adults With Colorectal Cancer. J. Clin. Oncol. 2015, 33, 3544–3549. [Google Scholar] [CrossRef] [PubMed] [Green Version]
- Archambault, A.N.; Su, Y.R.; Jeon, J.; Thomas, M.; Lin, Y.; Conti, D.V.; Win, A.K.; Sakoda, L.C.; Lansdorp-Vogelaar, I.; Peterse, E.F.P.; et al. Cumulative Burden of Colorectal Cancer-Associated Genetic Variants Is More Strongly Associated With Early-Onset vs Late-Onset Cancer. Gastroenterology 2020, 158, 1274–1286.e1212. [Google Scholar] [CrossRef] [PubMed]
- Gausman, V.; Dornblaser, D.; Anand, S.; Hayes, R.B.; O’Connell, K.; Du, M.; Liang, P.S. Risk Factors Associated With Early-Onset Colorectal Cancer. Clin. Gastroenterol. Hepatol. 2020, 18, 2752–2759. [Google Scholar] [CrossRef]
- Rosato, V.; Bosetti, C.; Levi, F.; Polesel, J.; Zucchetto, A.; Negri, E.; La Vecchia, C. Risk factors for young-onset colorectal cancer. Cancer Causes Control 2013, 24, 335–341. [Google Scholar] [CrossRef]
- Nilsson, E.E.; Skinner, M.K. Environmentally Induced Epigenetic Transgenerational Inheritance of Reproductive Disease1. Biol. Reprod. 2015, 93, 1–8. [Google Scholar] [CrossRef]
- Rodriguez-Martin, B.; Alvarez, E.G.; Baez-Ortega, A.; Zamora, J.; Supek, F.; Demeulemeester, J.; Santamarina, M.; Ju, Y.S.; Temes, J.; Garcia-Souto, D.; et al. Pan-cancer analysis of whole genomes identifies driver rearrangements promoted by LINE-1 retrotransposition. Nat. Genet. 2020, 52, 306–319. [Google Scholar] [CrossRef] [Green Version]
- Iskow, R.C.; McCabe, M.T.; Mills, R.E.; Torene, S.; Pittard, W.S.; Neuwald, A.F.; Van Meir, E.G.; Vertino, P.M.; Devine, S.E. Natural mutagenesis of human genomes by endogenous retrotransposons. Cell 2010, 141, 1253–1261. [Google Scholar] [CrossRef] [PubMed] [Green Version]
- Kitkumthorn, N.; Mutirangura, A. Long interspersed nuclear element-1 hypomethylation in cancer: Biology and clinical applications. Clin. Epigenetics 2011, 2, 315–330. [Google Scholar] [CrossRef] [PubMed] [Green Version]
- Sunami, E.; de Maat, M.; Vu, A.; Turner, R.R.; Hoon, D.S. LINE-1 hypomethylation during primary colon cancer progression. PLoS ONE 2011, 6, e18884. [Google Scholar] [CrossRef] [PubMed]
- Ye, D.; Jiang, D.; Li, Y.; Jin, M.; Chen, K. The role of LINE-1 methylation in predicting survival among colorectal cancer patients: A meta-analysis. Int. J. Clin. Oncol. 2017, 22, 749–757. [Google Scholar] [CrossRef]
- Ogino, S.; Nosho, K.; Kirkner, G.J.; Kawasaki, T.; Chan, A.T.; Schernhammer, E.S.; Giovannucci, E.L.; Fuchs, C.S. A cohort study of tumoral LINE-1 hypomethylation and prognosis in colon cancer. J. Natl. Cancer Inst. 2008, 100, 1734–1738. [Google Scholar] [CrossRef] [PubMed] [Green Version]
- Lou, Y.T.; Chen, C.W.; Fan, Y.C.; Chang, W.C.; Lu, C.Y.; Wu, I.C.; Hsu, W.H.; Huang, C.W.; Wang, J.Y. LINE-1 Methylation Status Correlates Significantly to Post-Therapeutic Recurrence in Stage III Colon Cancer Patients Receiving FOLFOX-4 Adjuvant Chemotherapy. PLoS ONE 2014, 10, e0123973. [Google Scholar] [CrossRef] [PubMed]
- Swets, M.; Zaalberg, A.; Boot, A.; van Wezel, T.; Frouws, M.A.; Bastiaannet, E.; Gelderblom, H.; van de Velde, C.J.; Kuppen, P.J. Tumor LINE-1 Methylation Level in Association with Survival of Patients with Stage II Colon Cancer. Int. J. Mol. Sci. 2016, 18, 36. [Google Scholar] [CrossRef] [PubMed] [Green Version]
- Hur, K.; Cejas, P.; Feliu, J.; Moreno-Rubio, J.; Burgos, E.; Boland, C.R.; Goel, A. Hypomethylation of long interspersed nuclear element-1 (LINE-1) leads to activation of proto-oncogenes in human colorectal cancer metastasis. Gut 2014, 63, 635–646. [Google Scholar] [CrossRef] [PubMed] [Green Version]
- Ehrlich, M. DNA hypermethylation in disease: Mechanisms and clinical relevance. Epigenetics 2019, 14, 1141–1163. [Google Scholar] [CrossRef] [PubMed] [Green Version]
- Issa, J.P. CpG island methylator phenotype in cancer. Nat. Rev. Cancer 2004, 4, 988–993. [Google Scholar] [CrossRef] [PubMed]
- Ogino, S.; Goel, A. Molecular classification and correlates in colorectal cancer. J. Mol. Diagn. 2008, 10, 13–27. [Google Scholar] [CrossRef] [PubMed] [Green Version]
- Wolf, A.M.D.; Fontham, E.T.H.; Church, T.R.; Flowers, C.R.; Guerra, C.E.; LaMonte, S.J.; Etzioni, R.; McKenna, M.T.; Oeffinger, K.C.; Shih, Y.T.; et al. Colorectal cancer screening for average-risk adults: 2018 guideline update from the American Cancer Society. CA Cancer J. Clin. 2018, 68, 250–281. [Google Scholar] [CrossRef]
- Shaukat, A.; Kahi, C.J.; Burke, C.A.; Rabeneck, L.; Sauer, B.G.; Rex, D.K. ACG Clinical Guidelines: Colorectal Cancer Screening 2021. Am. J. Gastroenterol. 2021, 116, 458–479. [Google Scholar] [CrossRef]
- Ogino, S.; Nowak, J.A.; Hamada, T.; Phipps, A.I.; Peters, U.; Milner, D.A., Jr.; Giovannucci, E.L.; Nishihara, R.; Giannakis, M.; Garrett, W.S.; et al. Integrative analysis of exogenous, endogenous, tumour and immune factors for precision medicine. Gut 2018, 67, 1168–1180. [Google Scholar] [CrossRef]
- Ogino, S.; Chan, A.T.; Fuchs, C.S.; Giovannucci, E. Molecular pathological epidemiology of colorectal neoplasia: An emerging transdisciplinary and interdisciplinary field. Gut 2011, 60, 397–411. [Google Scholar] [CrossRef] [PubMed]
- Ogino, S.; Nowak, J.A.; Hamada, T.; Milner, D.A., Jr.; Nishihara, R. Insights into Pathogenic Interactions Among Environment, Host, and Tumor at the Crossroads of Molecular Pathology and Epidemiology. Annu. Rev. Pathol. 2019, 14, 83–103. [Google Scholar] [CrossRef] [PubMed]
- Hughes, L.A.E.; Simons, C.; van den Brandt, P.A.; van Engeland, M.; Weijenberg, M.P. Lifestyle, Diet, and Colorectal Cancer Risk According to (Epi)genetic Instability: Current Evidence and Future Directions of Molecular Pathological Epidemiology. Curr. Colorectal. Cancer Rep. 2017, 13, 455–469. [Google Scholar] [CrossRef] [Green Version]
- Carr, P.R.; Alwers, E.; Bienert, S.; Weberpals, J.; Kloor, M.; Brenner, H.; Hoffmeister, M. Lifestyle factors and risk of sporadic colorectal cancer by microsatellite instability status: A systematic review and meta-analyses. Ann. Oncol. 2018, 29, 825–834. [Google Scholar] [CrossRef] [PubMed]
- Wang, S.T.; Cui, W.Q.; Pan, D.; Jiang, M.; Chang, B.; Sang, L.X. Tea polyphenols and their chemopreventive and therapeutic effects on colorectal cancer. World J. Gastroenterol. 2020, 26, 562–597. [Google Scholar] [CrossRef] [PubMed]
- Wang, R.; Chen, M.; Ye, X.; Poon, K. Role and potential clinical utility of ARID1A in gastrointestinal malignancy. Mutat. Res. Rev. Mutat. Res. 2021, 787, 108360. [Google Scholar] [CrossRef]
- Yang, A.S.; Estécio, M.R.; Doshi, K.; Kondo, Y.; Tajara, E.H.; Issa, J.P. A simple method for estimating global DNA methylation using bisulfite PCR of repetitive DNA elements. Nucleic Acids Res. 2004, 32, e38. [Google Scholar] [CrossRef]


| Characteristics a | Total No. (n = 1356) | Age at Diagnosis | p Value b | |||
|---|---|---|---|---|---|---|
| <50 | 50–54 | 55–69 | ≥70 | |||
| (n = 28) | (n = 66) | (n = 614) | (n = 648) | |||
| Sex | <0.0001 | |||||
| Female (NHS) | 742 (55%) | 21 (75%) | 46 (70%) | 378 (62%) | 297 (46%) | |
| Male (HPFS) | 614 (45%) | 7 (25%) | 20 (30%) | 236 (38%) | 351 (54%) | |
| Body mass index | 0.42 | |||||
| <30 kg/m2 | 1099 (81%) | 23 (82%) | 54 (82%) | 491 (80%) | 531 (82%) | |
| ≥30 kg/m2 | 251 (19%) | 5 (18%) | 12 (18%) | 121 (20%) | 113 (18%) | |
| Pack-years of smoking | 0.020 | |||||
| 0 | 531 (41%) | 14 (50%) | 40 (63%) | 233 (39%) | 244 (40%) | |
| 1–39 | 547 (42%) | 13 (46%) | 24 (37%) | 257 (43%) | 253 (41%) | |
| ≥40 | 219 (17%) | 1 (3.6%) | 0 | 103 (17%) | 115 (19%) | |
| Family history of colorectal cancer | 0.75 | |||||
| Absent | 1077 (80%) | 22 (79%) | 51 (80%) | 492 (81%) | 512 (80%) | |
| Present | 270 (20%) | 6 (21%) | 13 (20%) | 119 (19%) | 132 (20%) | |
| Tumor location | <0.0001 | |||||
| Proximal colon | 641 (48%) | 6 (21%) | 26 (39%) | 258 (42%) | 351 (54%) | |
| Distal colon | 410 (30%) | 14 (50%) | 26 (39%) | 204 (33%) | 166 (26%) | |
| Rectum | 298 (22%) | 8 (29%) | 14 (22%) | 150 (25%) | 126 (20%) | |
| pT stage | 0.76 | |||||
| pT1 | 143 (12%) | 3 (11%) | 4 (6.4%) | 76 (13%) | 60 (10%) | |
| pT2 | 259 (21%) | 8 (30%) | 13 (21%) | 105 (19%) | 133 (23%) | |
| pT3 | 773 (62%) | 13 (48%) | 41 (65%) | 357 (63%) | 362 (62%) | |
| pT4 | 67 (5.4%) | 3 (11%) | 5 (8.0%) | 28 (5.0%) | 31 (5.3%) | |
| pN stage | 0.048 | |||||
| pN0 (0) | 758 (63%) | 16 (62%) | 25 (45%) | 346 (63%) | 371 (65%) | |
| pN1 (1–3) | 277 (23%) | 4 (15%) | 18 (33%) | 127 (23%) | 128 (23%) | |
| pN2 (≥4) | 166 (14%) | 6 (23%) | 12 (22%) | 77 (14%) | 71 (12%) | |
| AJCC disease stage | 0.026 | |||||
| I | 315 (26%) | 9 (32%) | 9 (15%) | 141 (25%) | 156 (27%) | |
| II | 394 (32%) | 7 (25%) | 13 (22%) | 180 (32%) | 194 (34%) | |
| III | 351 (28%) | 9 (32%) | 26 (43%) | 162 (29%) | 154 (26%) | |
| IV | 172 (14%) | 3 (11%) | 12 (20%) | 83 (14%) | 74 (13%) | |
| Tumor differentiation | 0.59 | |||||
| Well to moderate | 1212 (90%) | 26 (93%) | 59 (89%) | 551 (90%) | 576 (89%) | |
| Poor | 136 (10%) | 2 (7.0%) | 7 (11%) | 59 (9.7%) | 68 (11%) | |
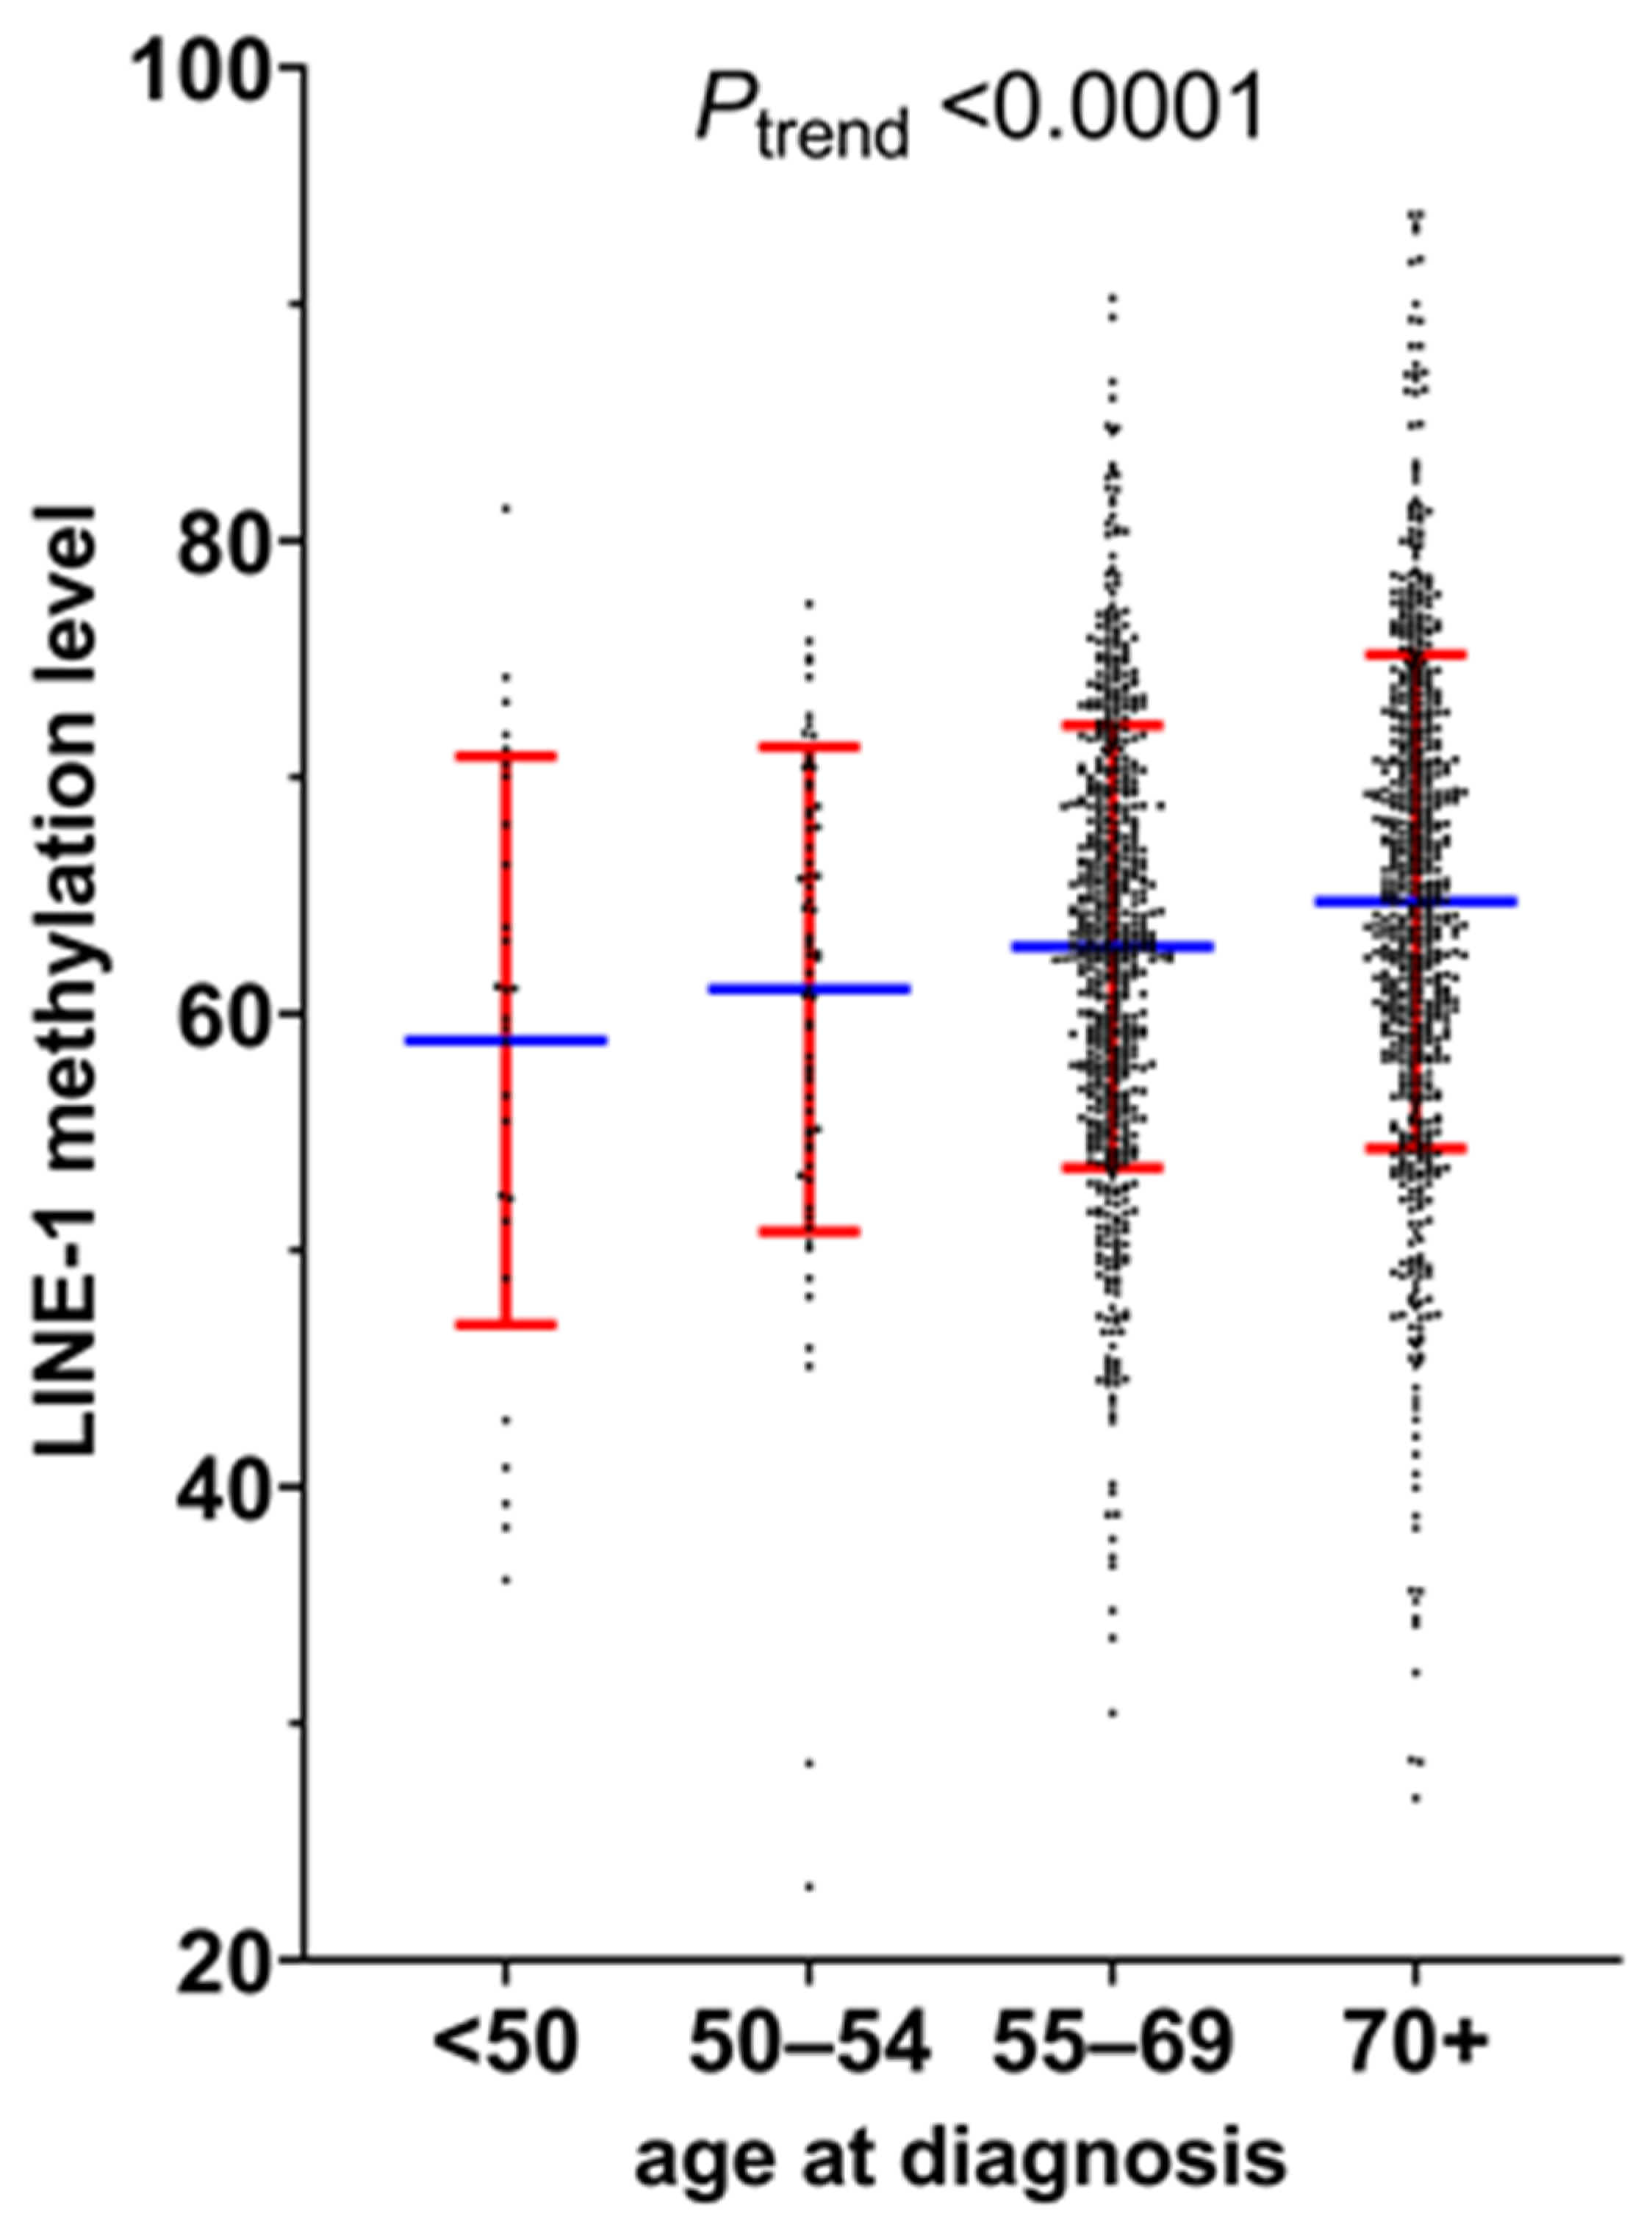
| LINE-1 methylation level | <0.0001 | |||||
| (0 to 100 (percent) scale), mean ± SD | 63.6 ± 10.1 | 58.9 ± 12.0 | 61.0 ± 10.2 | 62.8 ± 9.4 | 64.7 ± 10.4 | |
| LINE-1 methylation level | 0.0005 | |||||
| ≤45 | 47 (3.5%) | 5 (18%) | 2 (3.0%) | 21 (3.4%) | 19 (2.9%) | |
| 45–55 | 206 (15%) | 4 (14%) | 15 (23%) | 98 (16%) | 89 (14%) | |
| 55–65 | 499 (37%) | 10 (36%) | 23 (35%) | 245 (40%) | 221 (34%) | |
| >65 | 604 (45%) | 9 (32%) | 26 (39%) | 250 (41%) | 319 (49%) | |
| MSI status | <0.0001 | |||||
| Non-MSI-high | 1101 (84%) | 26 (100%) | 56 (89%) | 520 (87%) | 499 (79%) | |
| MSI-high | 217 (16%) | 0 (0%) | 7 (11%) | 80 (13%) | 130 (21%) | |
| CIMP status | <0.0001 | |||||
| Negative | 553 (43%) | 17 (61%) | 37 (58%) | 270 (46%) | 229 (38%) | |
| Low | 507 (39%) | 10 (36%) | 23 (36%) | 240 (40%) | 234 (39%) | |
| High | 230 (18%) | 1 (3.6%) | 4 (6.3%) | 83 (14%) | 142 (23%) | |
| KRAS mutation | 0.22 | |||||
| Wild-type | 737 (58%) | 16 (62%) | 41 (66%) | 346 (59%) | 334 (57%) | |
| Mutant | 532 (42%) | 10 (38%) | 21 (34%) | 245 (41%) | 256 (43%) | |
| BRAF mutation | 0.024 | |||||
| Wild-type | 1124 (85%) | 24 (92%) | 56 (89%) | 522 (86%) | 522 (83%) | |
| Mutant | 202 (15%) | 2 (7.7%) | 7 (11%) | 83 (14%) | 110 (17%) | |
| PIK3CA mutation | 0.63 | |||||
| Wild-type | 1039 (84%) | 22 (85%) | 49 (86%) | 463 (84%) | 505 (83%) | |
| Mutant | 199 (16%) | 4 (15%) | 8 (14%) | 87 (16%) | 100 (17%) | |
| Variables in the Final Model | β Coefficient a (Change in Mean LINE-1 Methylation Levels by a Given Variable) | |||
|---|---|---|---|---|
| Univariable (Unadjusted) (95% CI) | p Value | Multivariable-Adjusted b (95% CI) | p Value | |
| Age at diagnosis | <0.0001 c | 0.0003 c | ||
| <50 | −5.87 (−9.65 to −2.09) | −4.54 (−8.24 to −0.85) | ||
| 50–54 | −3.70 (−6.23 to −1.17) | −2.82 (−5.29 to −0.34) | ||
| 55–69 | −1.90 (−3.00 to −0.80) | −1.38 (−2.47 to −0.30) | ||
| ≥70 | Referent | Referent | ||
| Family history of colorectal cancer | 0.13 | 0.029 | ||
| Absent | Referent | Referent | ||
| Present | −1.03 (−2.37 to 0.31) | −1.45 (−2.75 to −0.15) | ||
| MSI status | <0.0001 | 0.002 | ||
| Non-MSI-high | Referent | Referent | ||
| MSI-high | 5.73 (4.30 to 7.16) | 2.99 (1.14 to 4.84) | ||
| CIMP status | <0.0001 | <0.0001 | ||
| Negative/low | Referent | Referent | ||
| High | 6.00 (4.61 to 7.39) | 3.86 (2.05 to 5.67) | ||
| LINE-1 Methylation Level | Years | |||||
|---|---|---|---|---|---|---|
| 0 | 2 | 4 | 6 | 8 | 10 | |
| ≤45 | 46 | 33 | 28 | 22 | 20 | 17 |
| 45–55 | 206 | 164 | 141 | 132 | 122 | 108 |
| 55–65 | 498 | 407 | 358 | 314 | 279 | 242 |
| >65 | 602 | 519 | 468 | 420 | 365 | 296 |
| Colorectal Cancer-Specific Survival | Overall Survival | ||||||
|---|---|---|---|---|---|---|---|
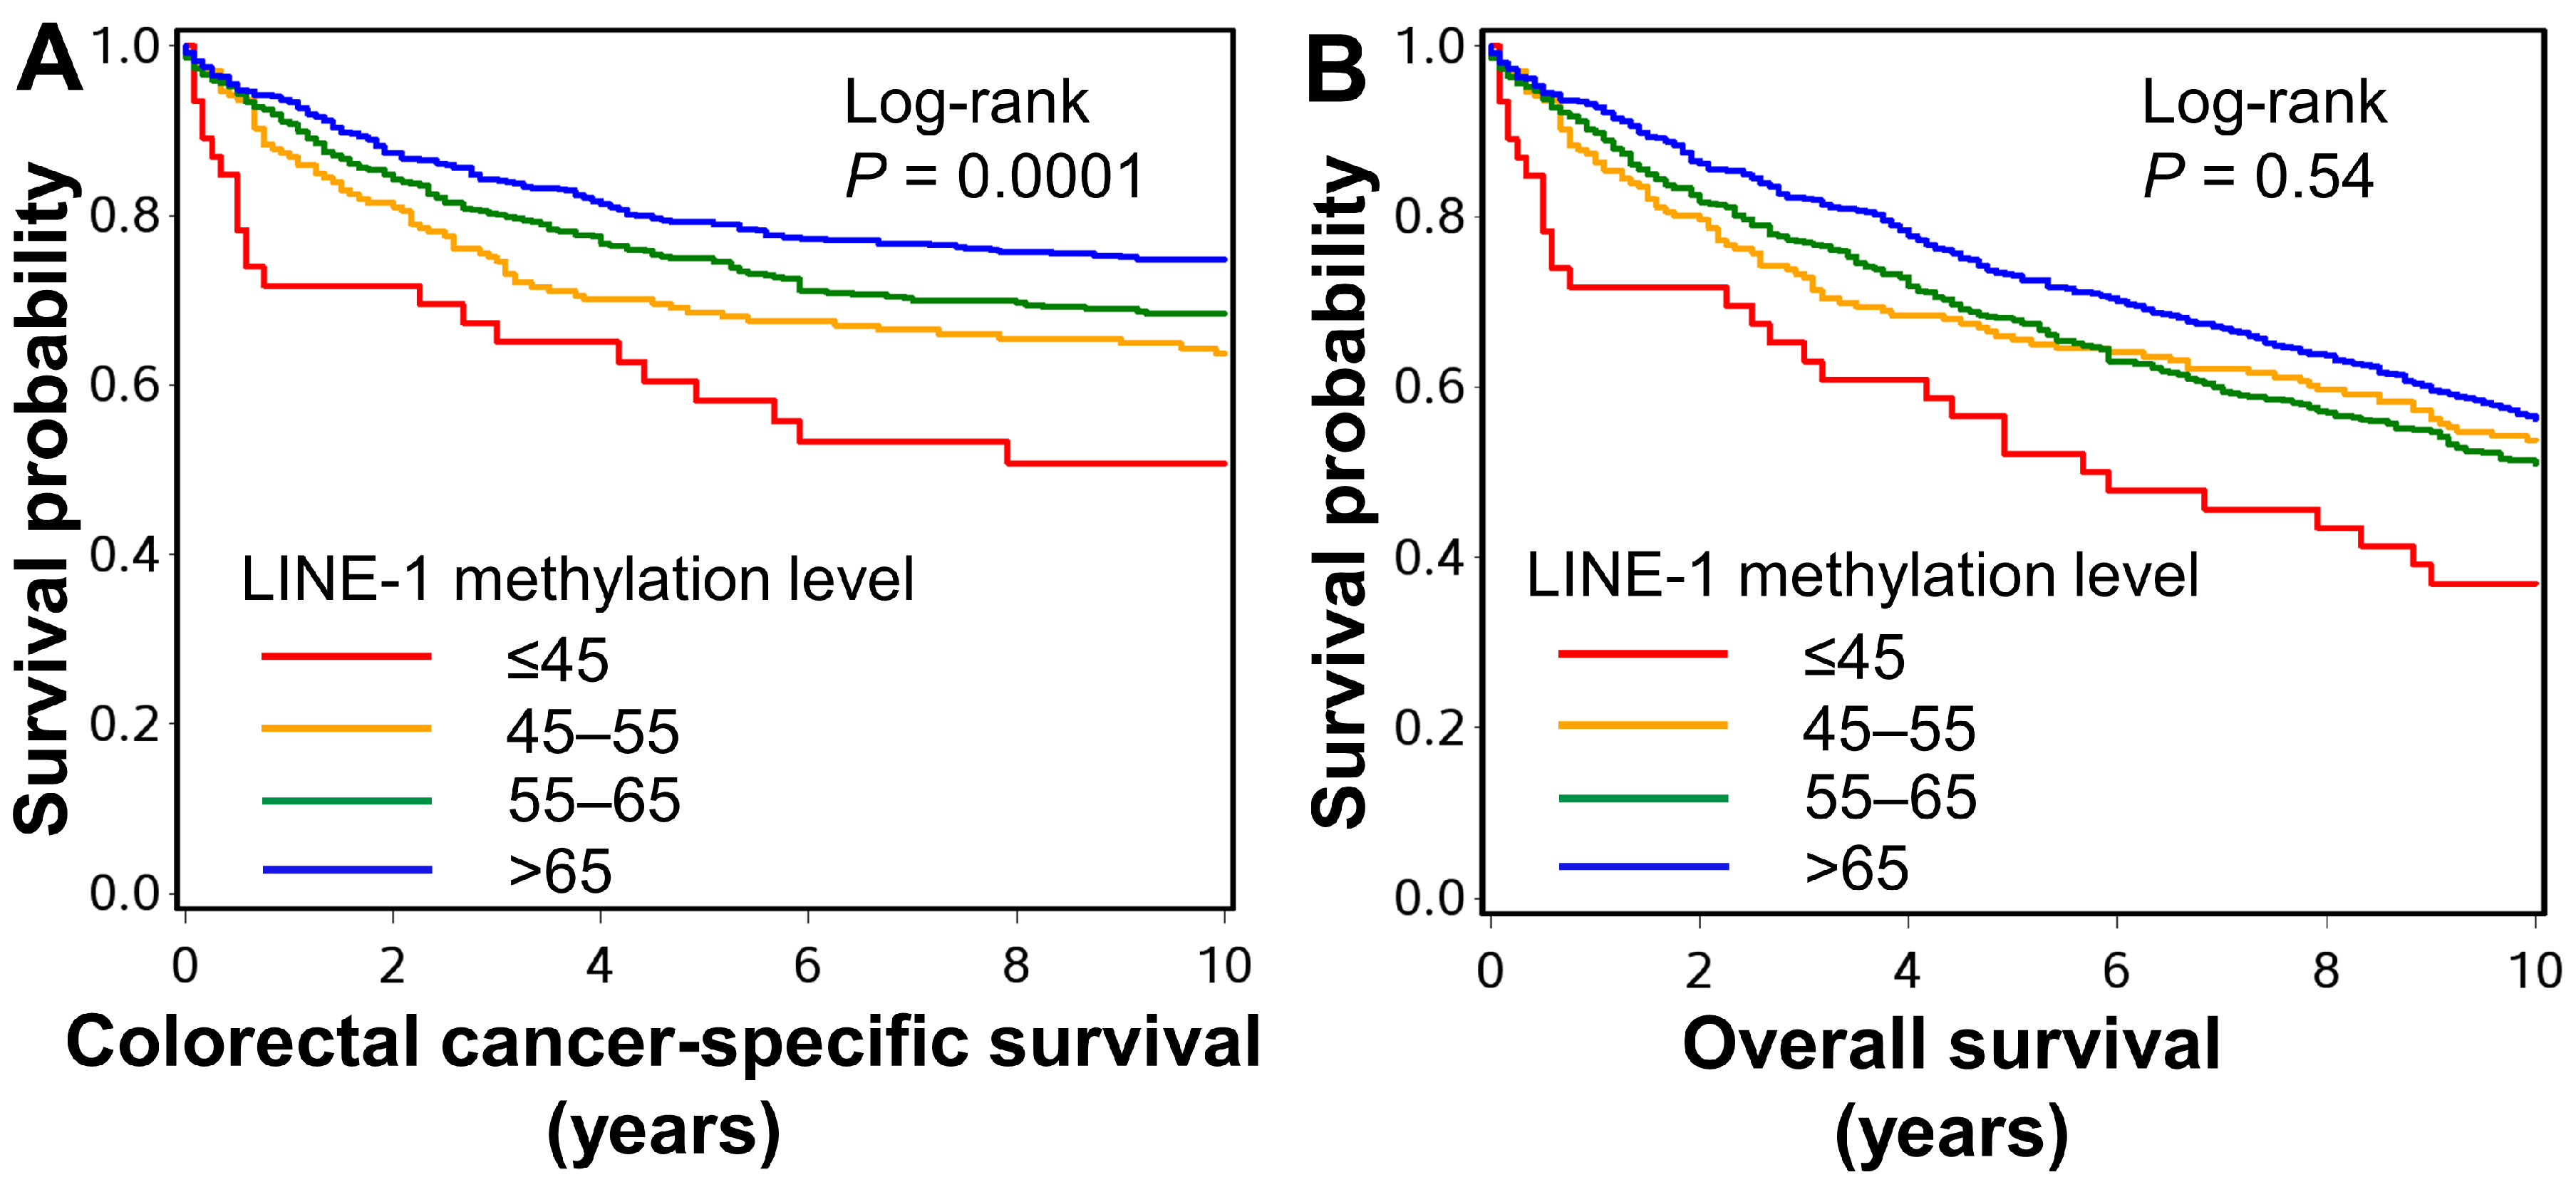
| LINE-1 Methylation Level | No. of Cases | No. of Events | Univariable HR (95% CI) | Multivariable HR (95% CI) a | No. of Events | Univariable HR (95% CI) | Multivariable HR (95% CI) a |
| ≤45 | 46 | 22 | 2.26 (1.41 to 3.62) | 2.33 (1.49 to 3.64) | 34 | 1.09 (0.70 to 1.69) | 1.63 (1.07 to 2.49) |
| 45–55 | 206 | 80 | 1.60 (1.22 to 1.16) | 1.39 (1.05 to 1.85) | 150 | 1.01 (0.84 to 1.23) | 1.10 (0.90 to 1.33) |
| 55–65 | 498 | 157 | 1.28 (1.03 to 1.60) | 1.29 (1.02 to 1.63) | 365 | 1.11 (0.96 to 1.27) | 1.21 (1.05 to 1.40) |
| >65 | 602 | 154 | Referent | Referent | 396 | Referent | Referent |
| Ptrendb | 0.0002 | 0.0005 | 0.92 | 0.020 | |||
Publisher’s Note: MDPI stays neutral with regard to jurisdictional claims in published maps and institutional affiliations. |
© 2021 by the authors. Licensee MDPI, Basel, Switzerland. This article is an open access article distributed under the terms and conditions of the Creative Commons Attribution (CC BY) license (https://creativecommons.org/licenses/by/4.0/).
Share and Cite
Akimoto, N.; Zhao, M.; Ugai, T.; Zhong, R.; Lau, M.C.; Fujiyoshi, K.; Kishikawa, J.; Haruki, K.; Arima, K.; Twombly, T.S.; et al. Tumor Long Interspersed Nucleotide Element-1 (LINE-1) Hypomethylation in Relation to Age of Colorectal Cancer Diagnosis and Prognosis. Cancers 2021, 13, 2016. https://doi.org/10.3390/cancers13092016
Akimoto N, Zhao M, Ugai T, Zhong R, Lau MC, Fujiyoshi K, Kishikawa J, Haruki K, Arima K, Twombly TS, et al. Tumor Long Interspersed Nucleotide Element-1 (LINE-1) Hypomethylation in Relation to Age of Colorectal Cancer Diagnosis and Prognosis. Cancers. 2021; 13(9):2016. https://doi.org/10.3390/cancers13092016
Chicago/Turabian StyleAkimoto, Naohiko, Melissa Zhao, Tomotaka Ugai, Rong Zhong, Mai Chan Lau, Kenji Fujiyoshi, Junko Kishikawa, Koichiro Haruki, Kota Arima, Tyler S. Twombly, and et al. 2021. "Tumor Long Interspersed Nucleotide Element-1 (LINE-1) Hypomethylation in Relation to Age of Colorectal Cancer Diagnosis and Prognosis" Cancers 13, no. 9: 2016. https://doi.org/10.3390/cancers13092016