
Distinct mRNAs in Cancer Extracellular Vesicles Activate Angiogenesis and Alter Transcriptome of Vascular Endothelial Cells

 , , and
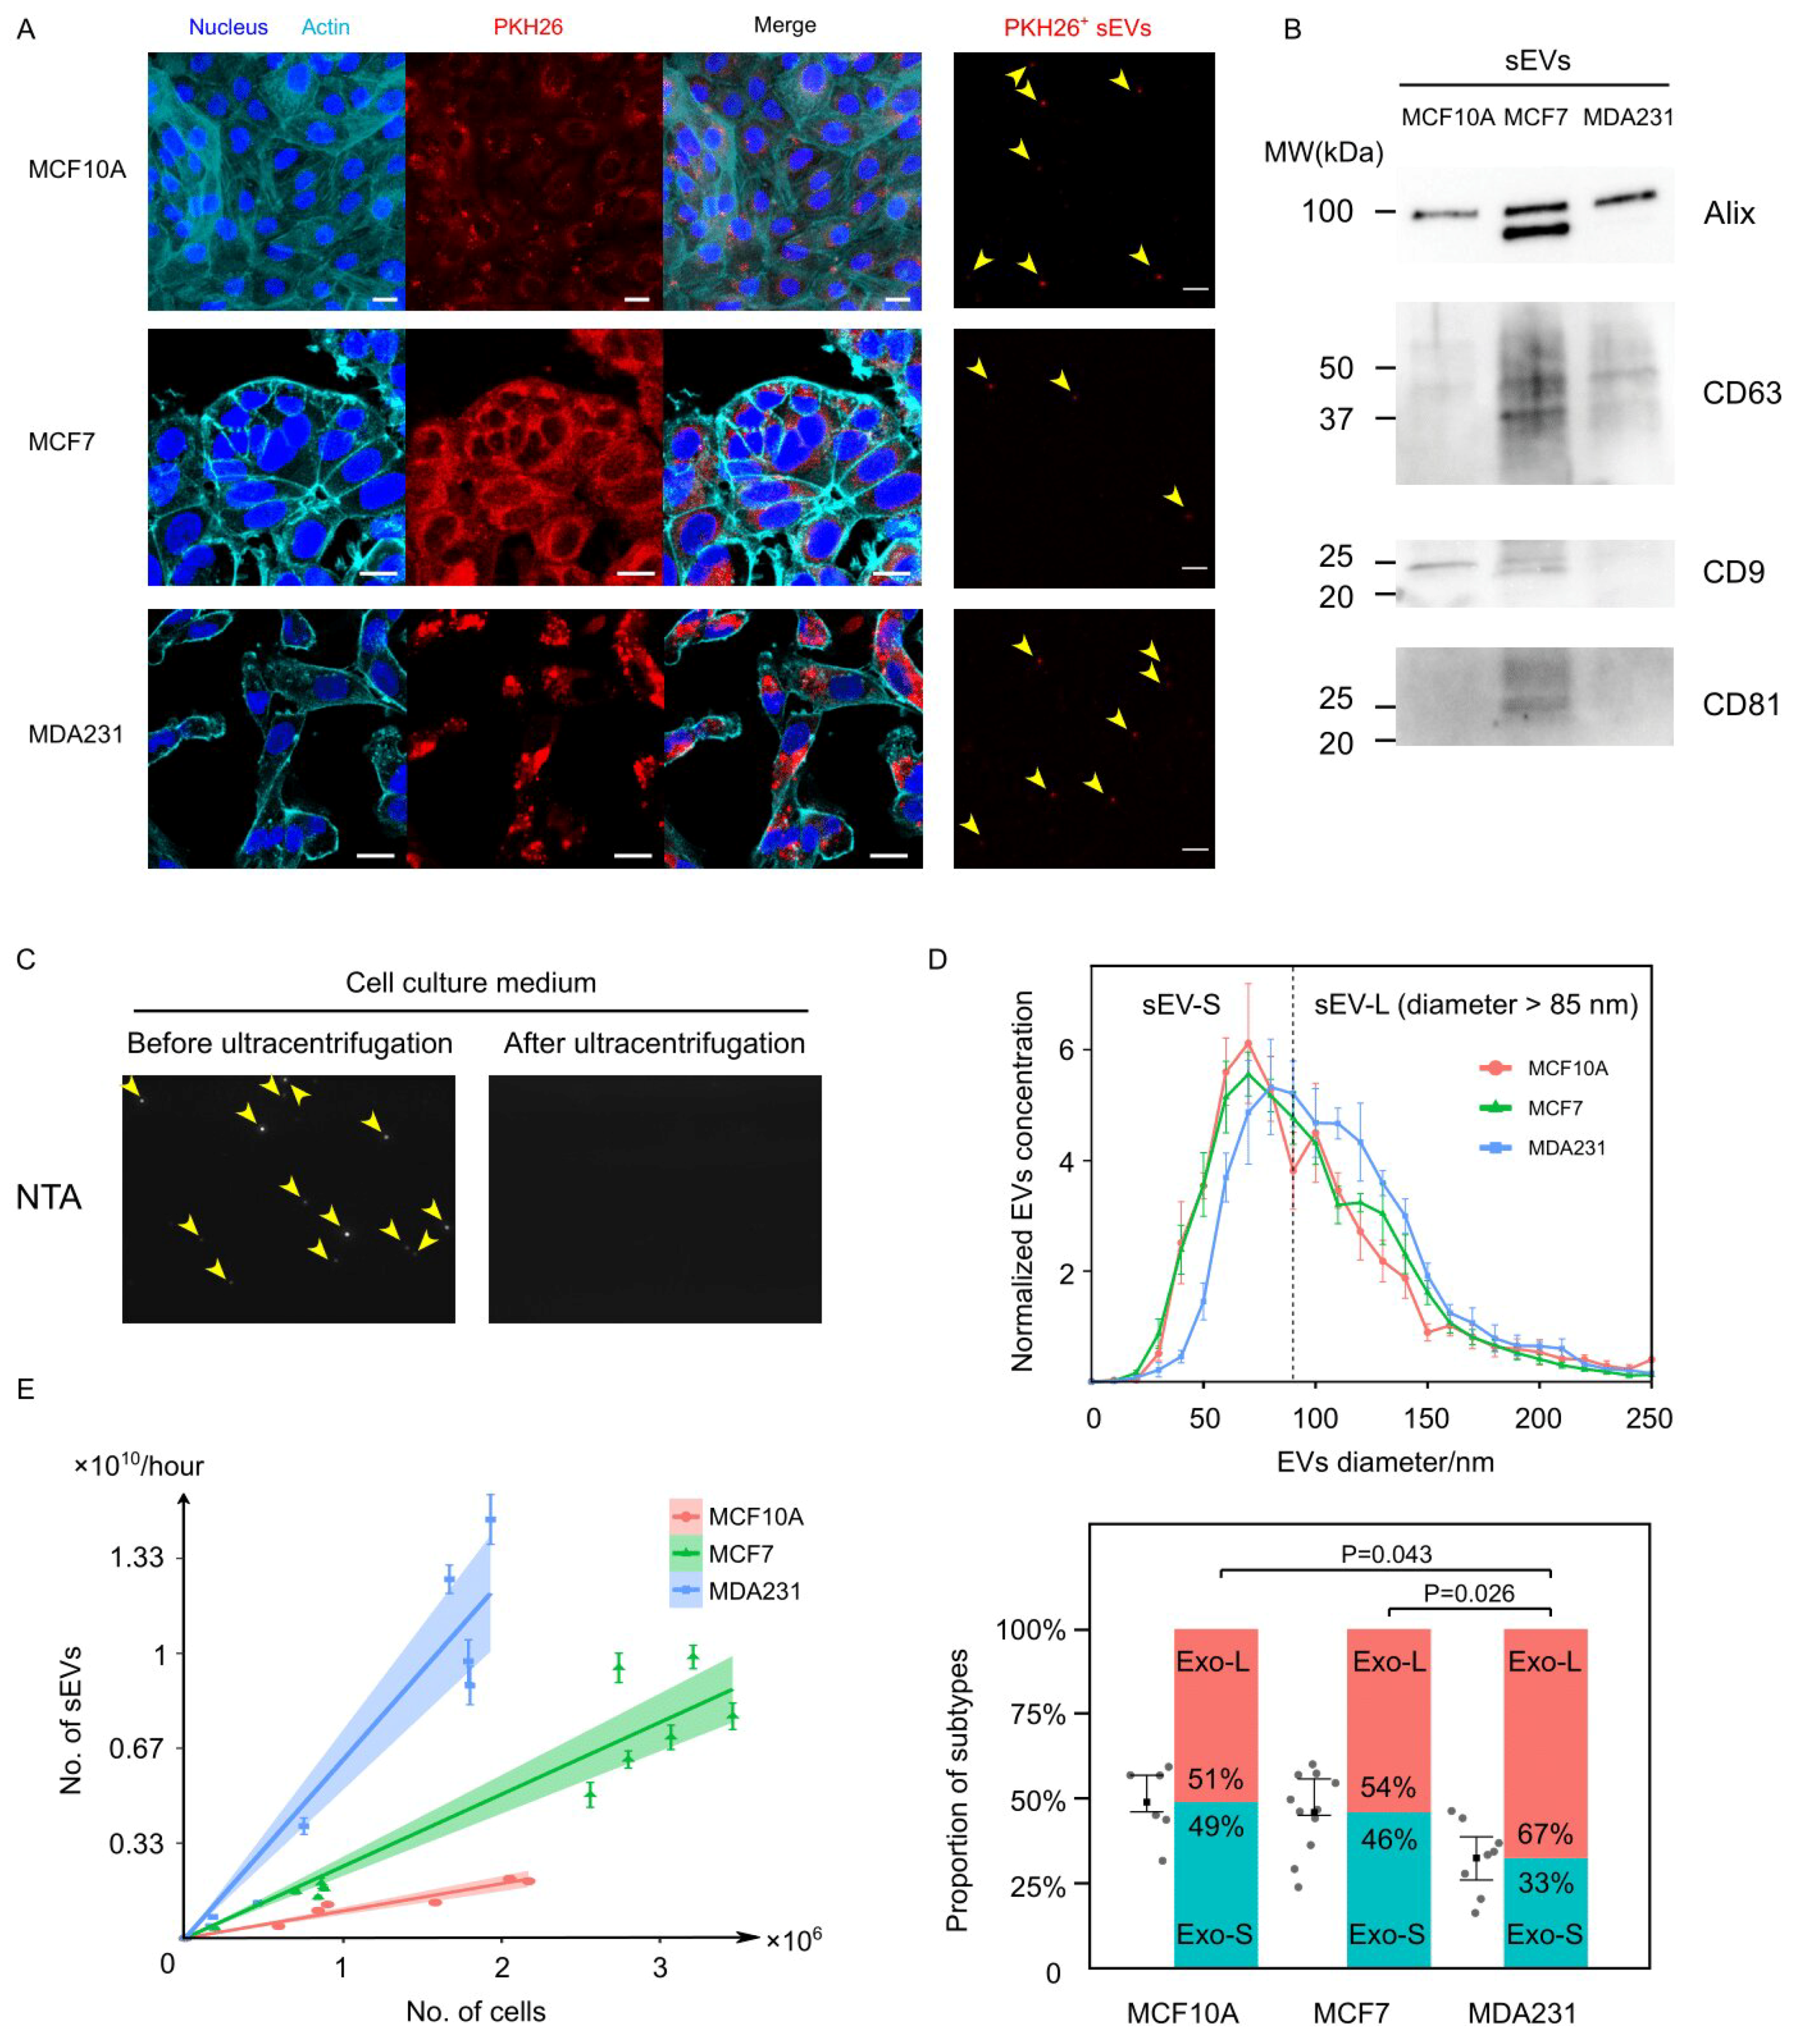
Abstract
:Simple Summary
Abstract
1. Introduction
2. Materials and Methods
2.1. Cell Culture
2.2. EV Incubation and Isolation
2.3. Quantitative Analysis of EVs by Nanoparticle Tracking Analysis
2.4. PKH26 Staining of Cells and EVs
2.5. Western Blot
2.6. RT-qPCR and DNA Gel Electrophoresis
2.7. Fluorescent Imaging of Cells and EVs
2.8. Co-Culture and Fluorescent Trafficking of EVs and mRNAs
2.9. Tube Formation Assay
2.10. EdU Proliferation Assay
2.11. RNA-Seq and Data Analysis
2.12. Statistical Analysis
3. Results
3.1. Cancer Cells Secreted EVs at Prominently Higher Rates Than Normal Cells
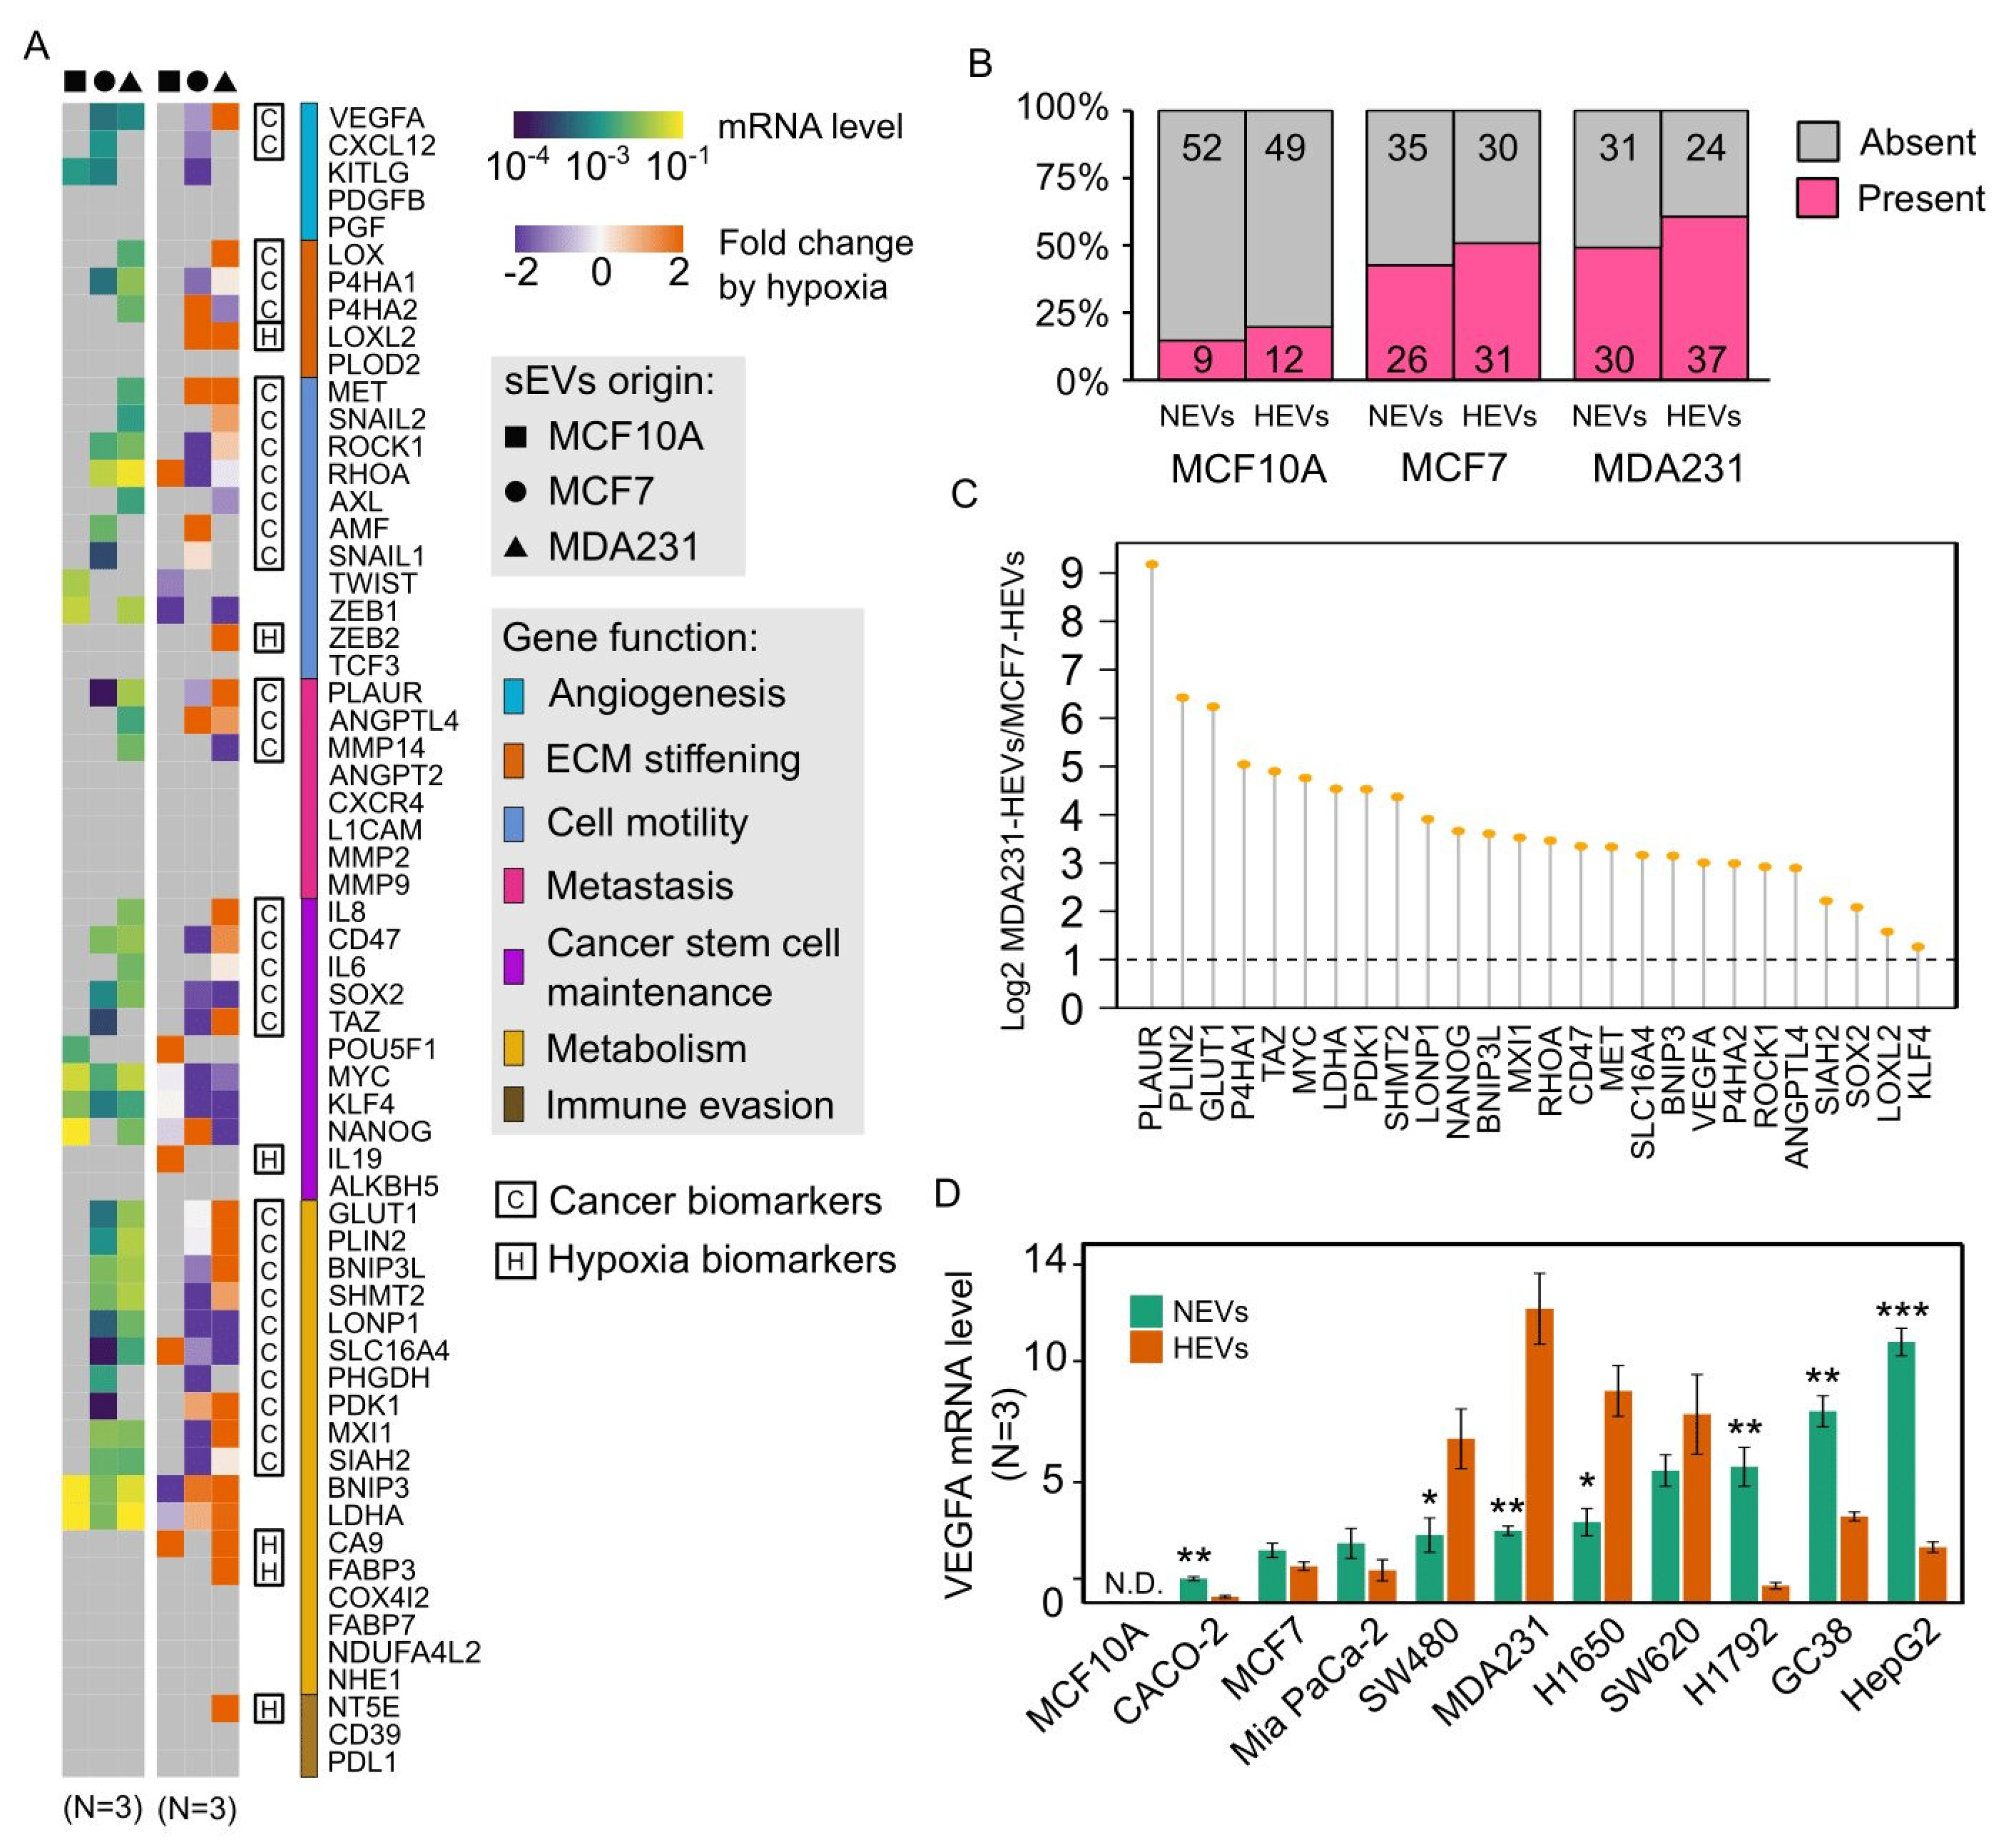
3.2. EV-mRNA Profile Showed Low Correlation with That of Cells
3.3. Cancer EVs Harbored Diverse Hypoxia-Targeted mRNAs
3.4. Hypoxia Regulated Cancer EV-mRNAs in a Cell Line-Dependent Manner
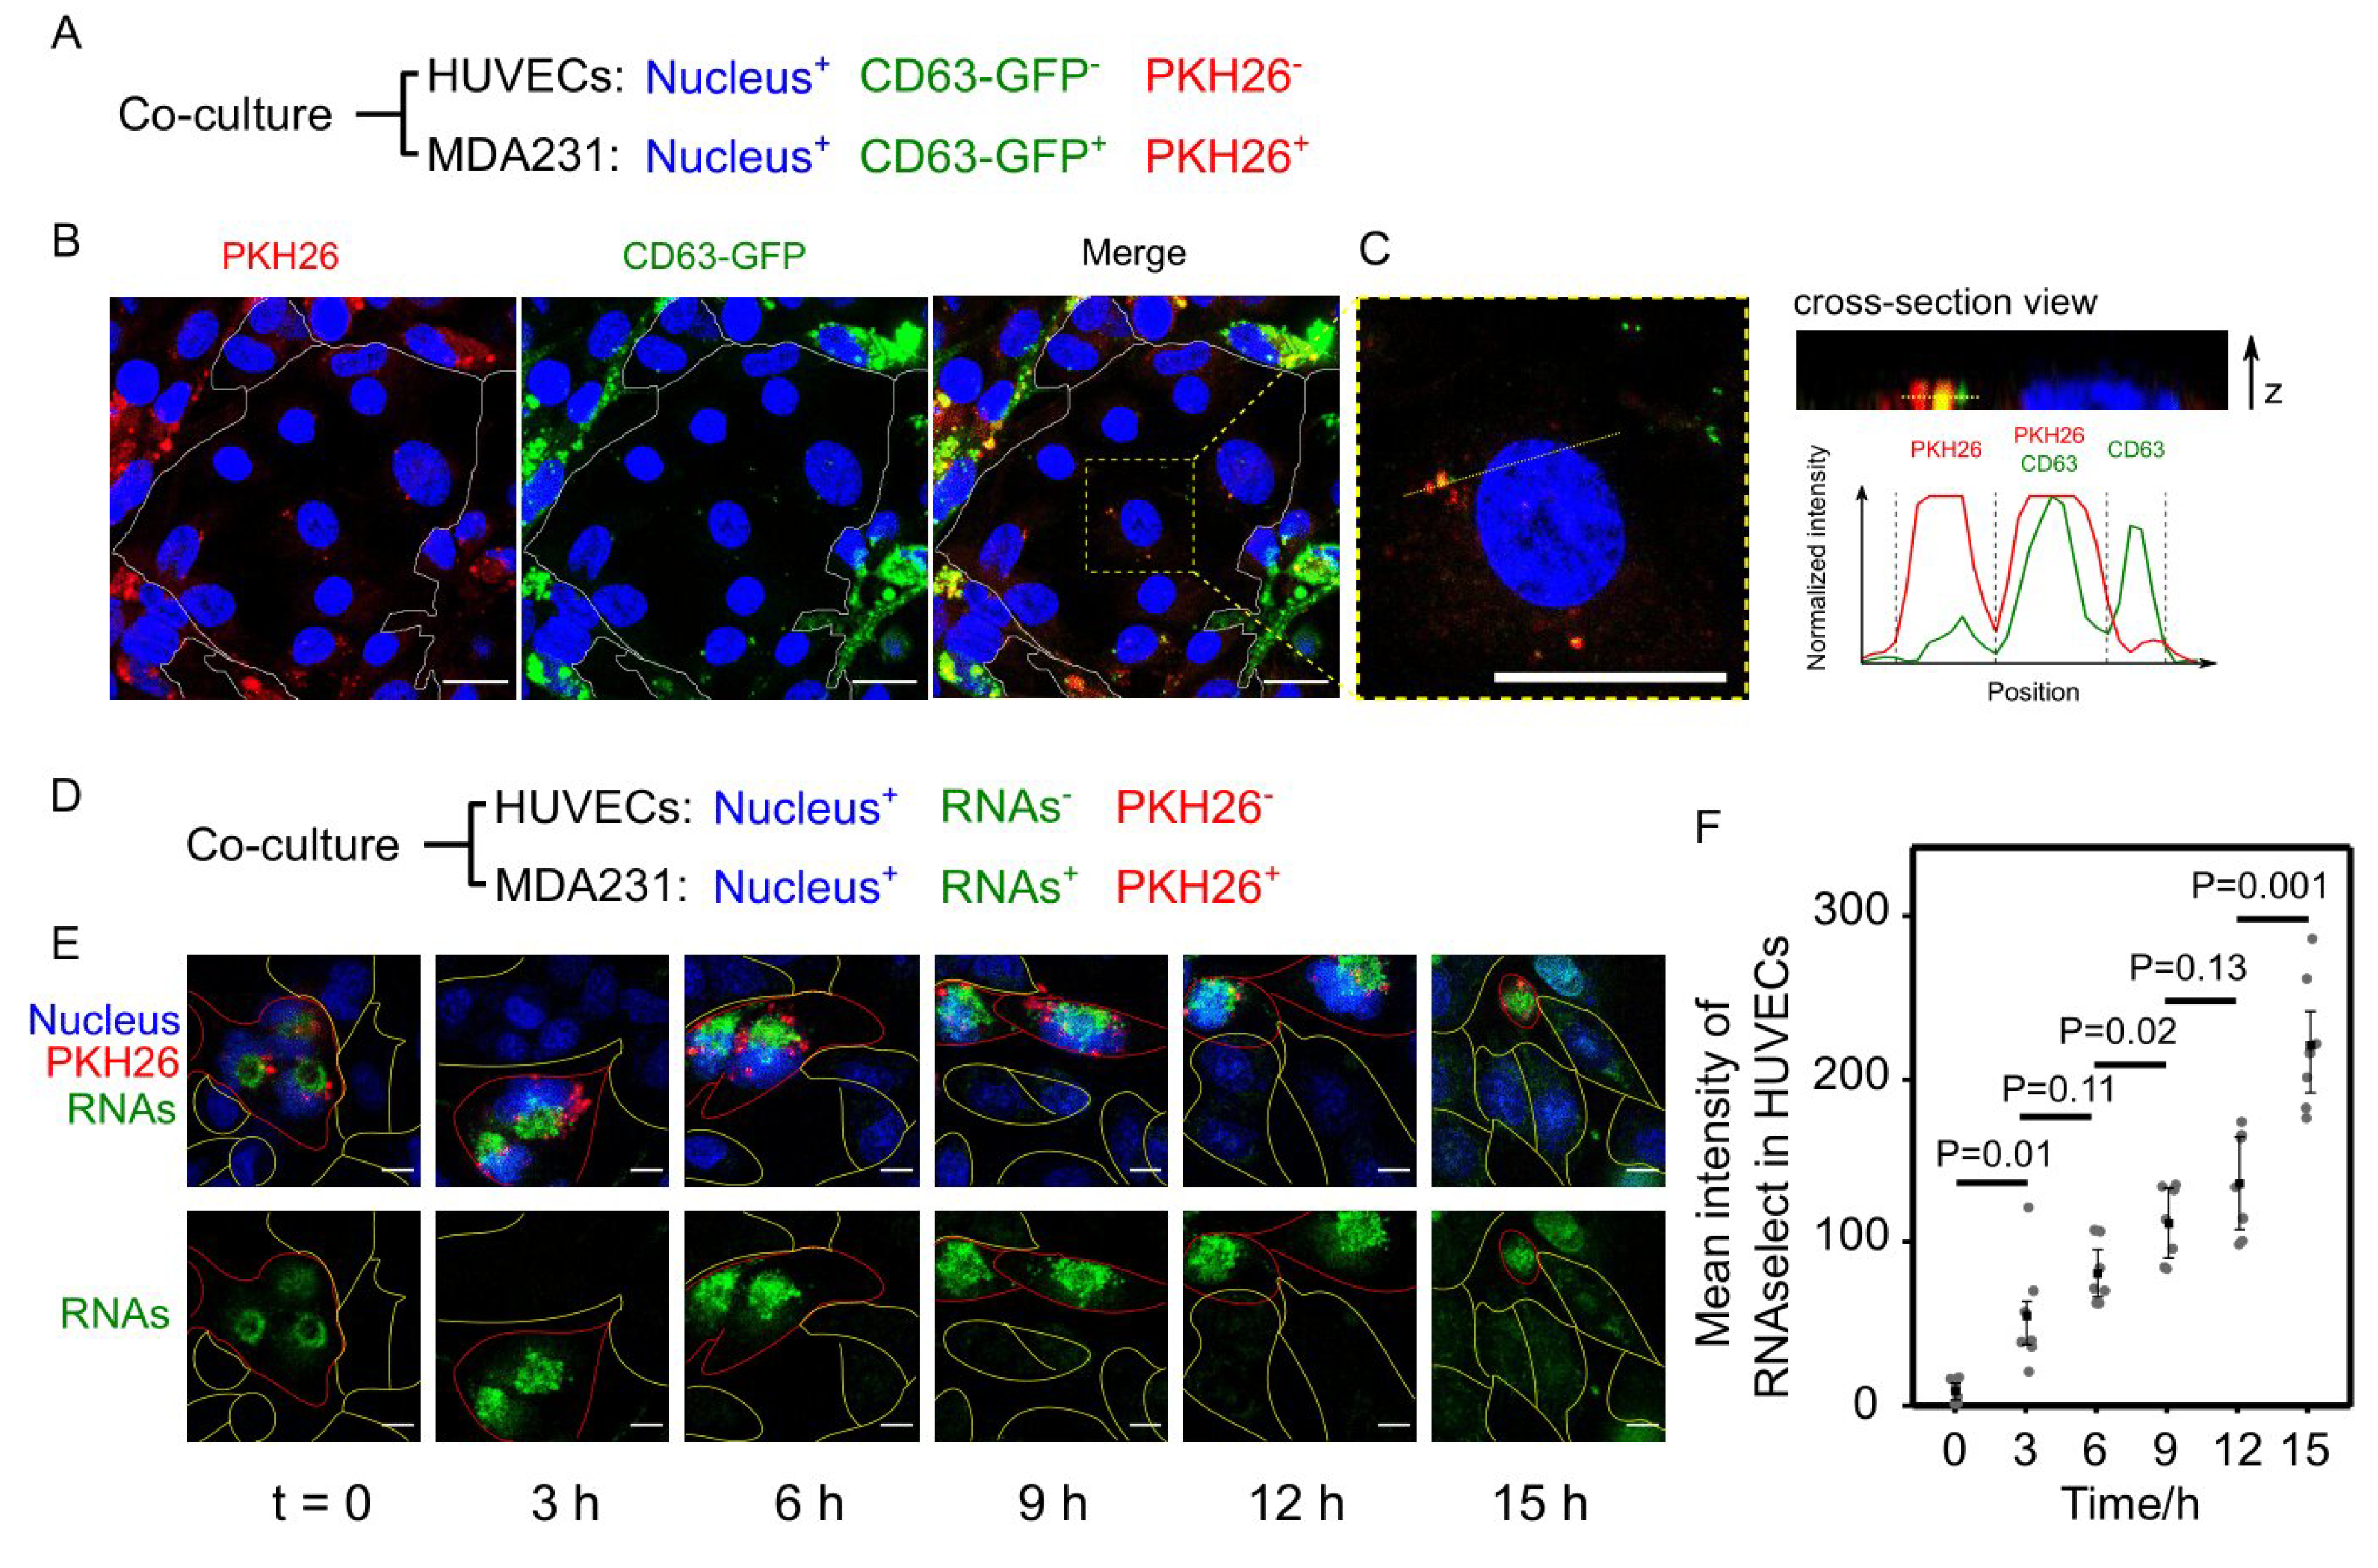
3.5. Cancer EVs Transferred RNAs to HUVECs
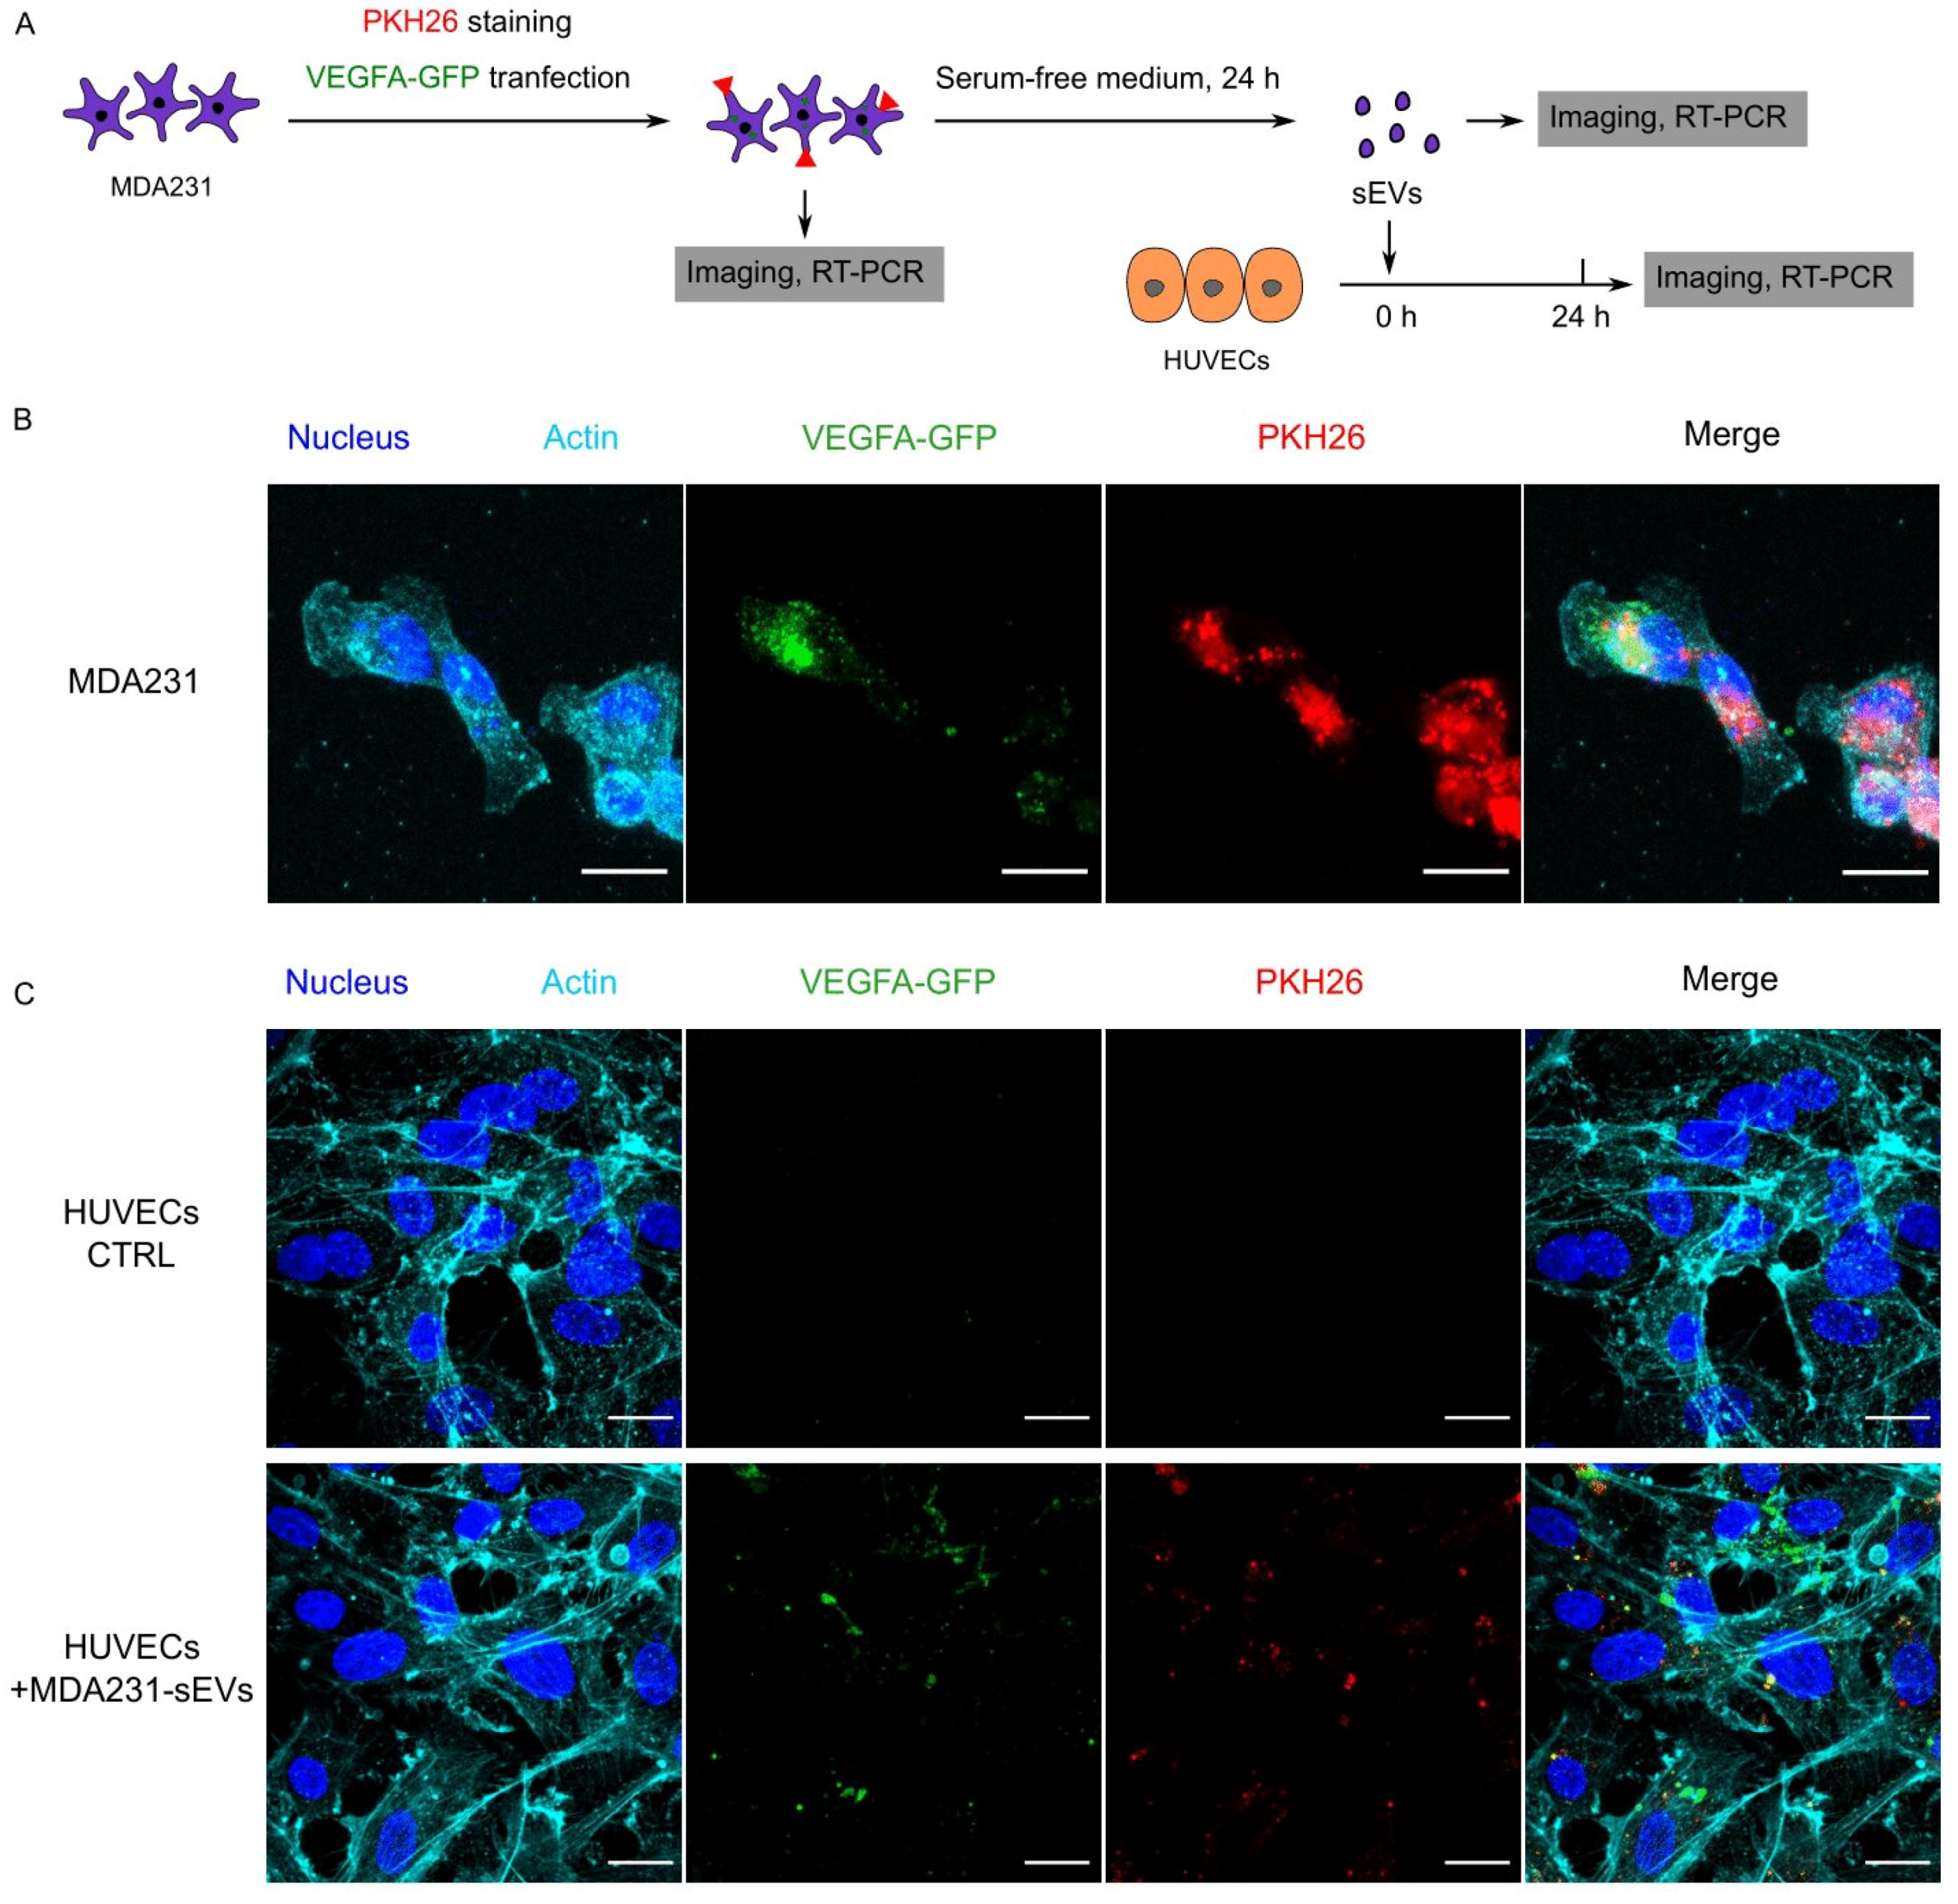
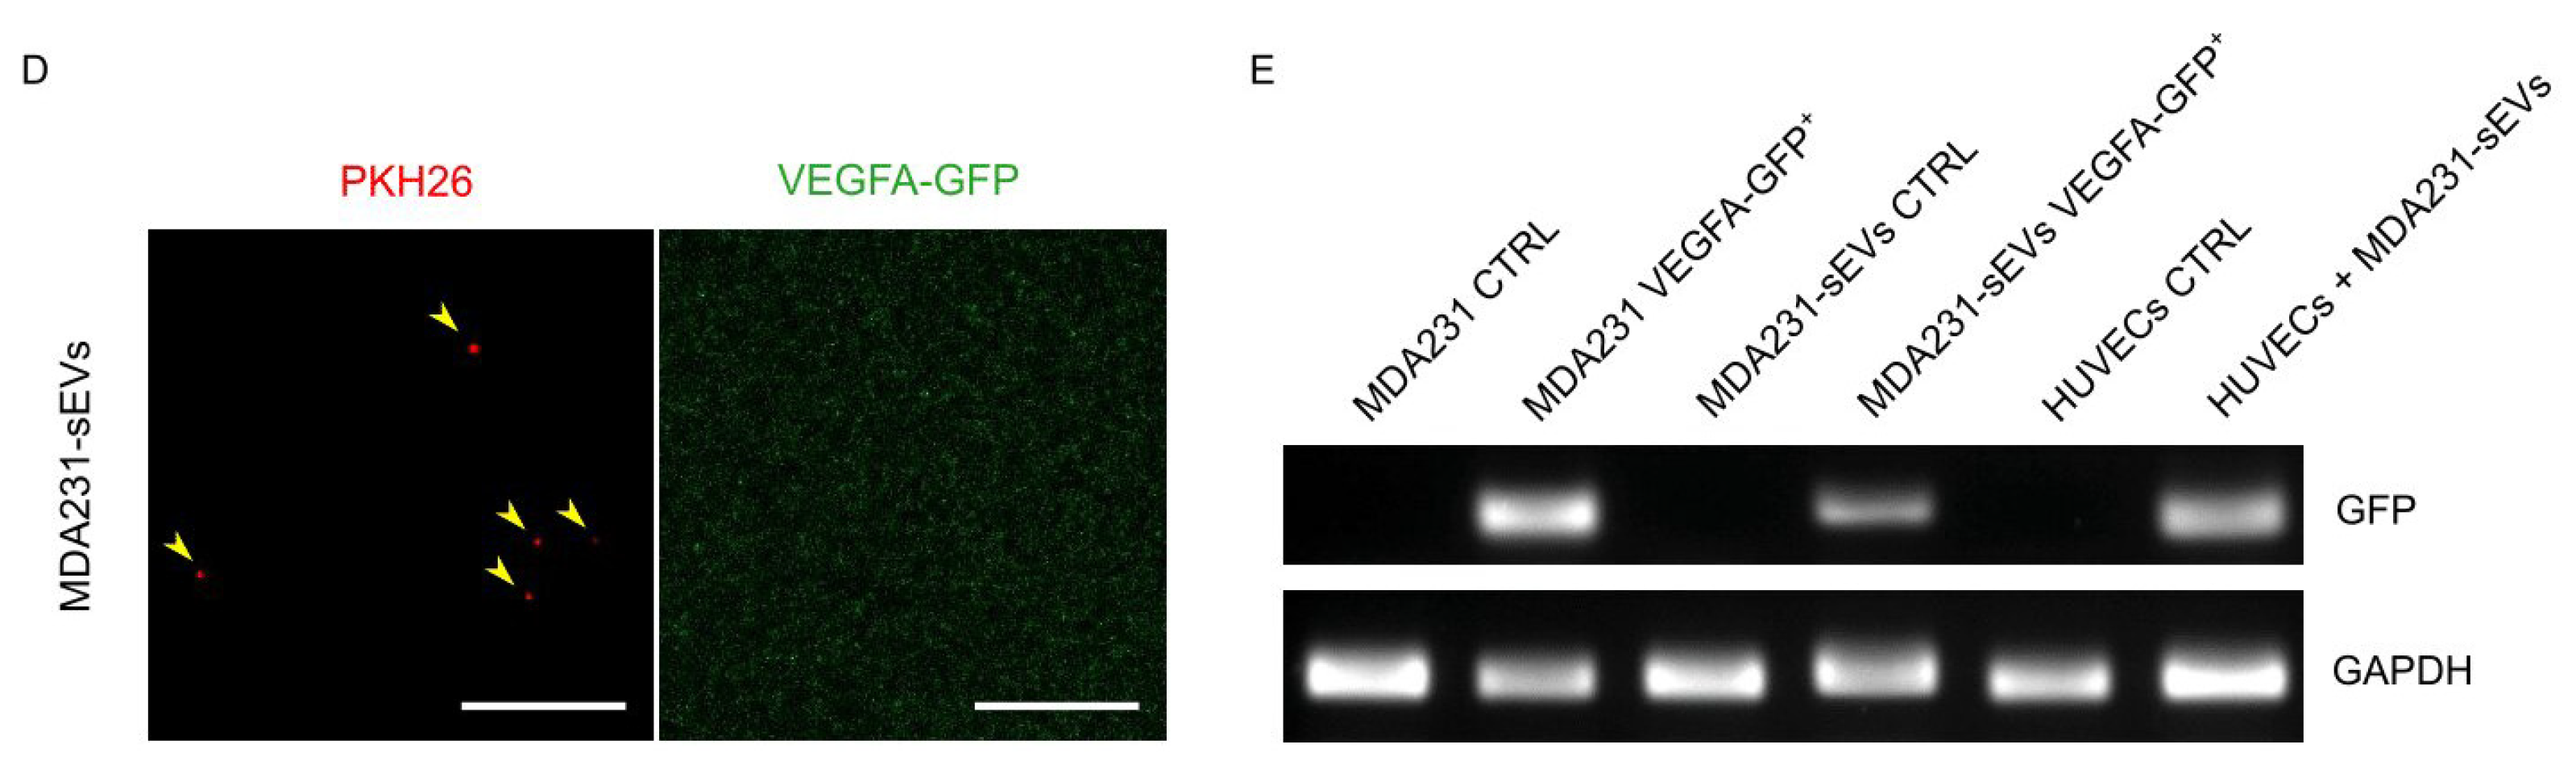
3.6. Recipient HUVECs Translated Cancer EV-VEGFA mRNA
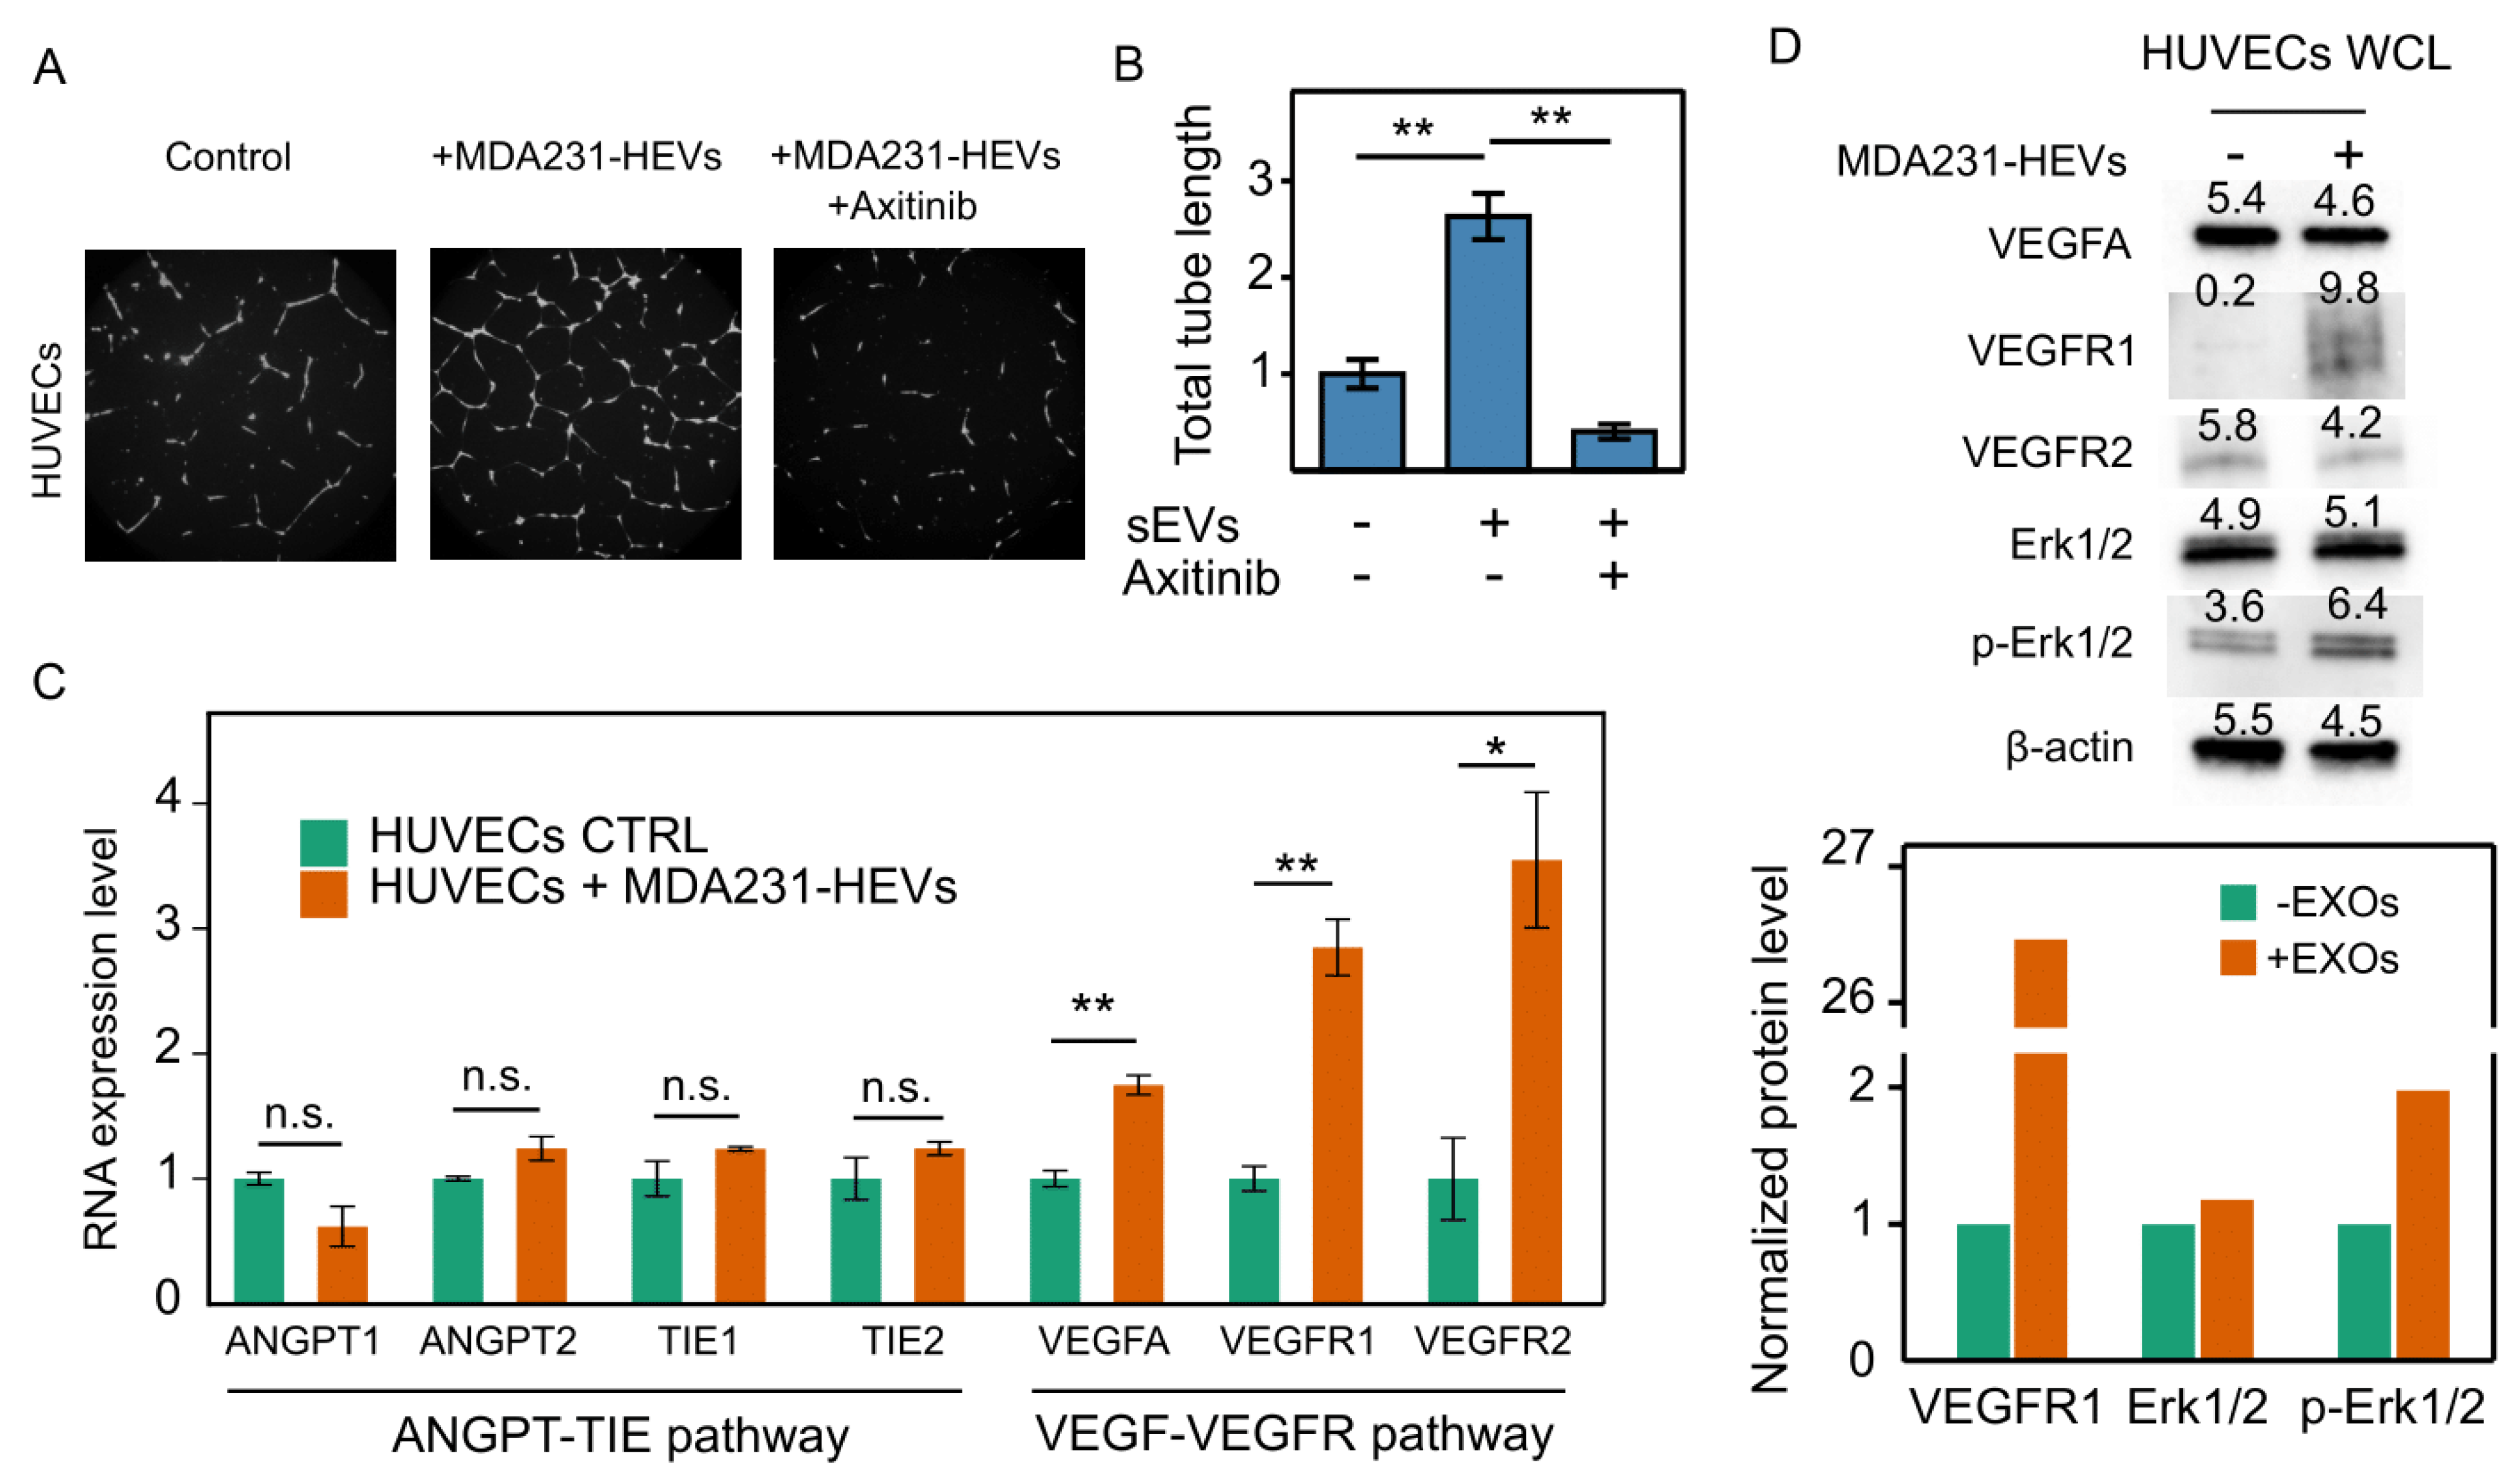
3.7. Cancer EVs Activated VEGFR-Dependent Angiogenesis in HUVECs
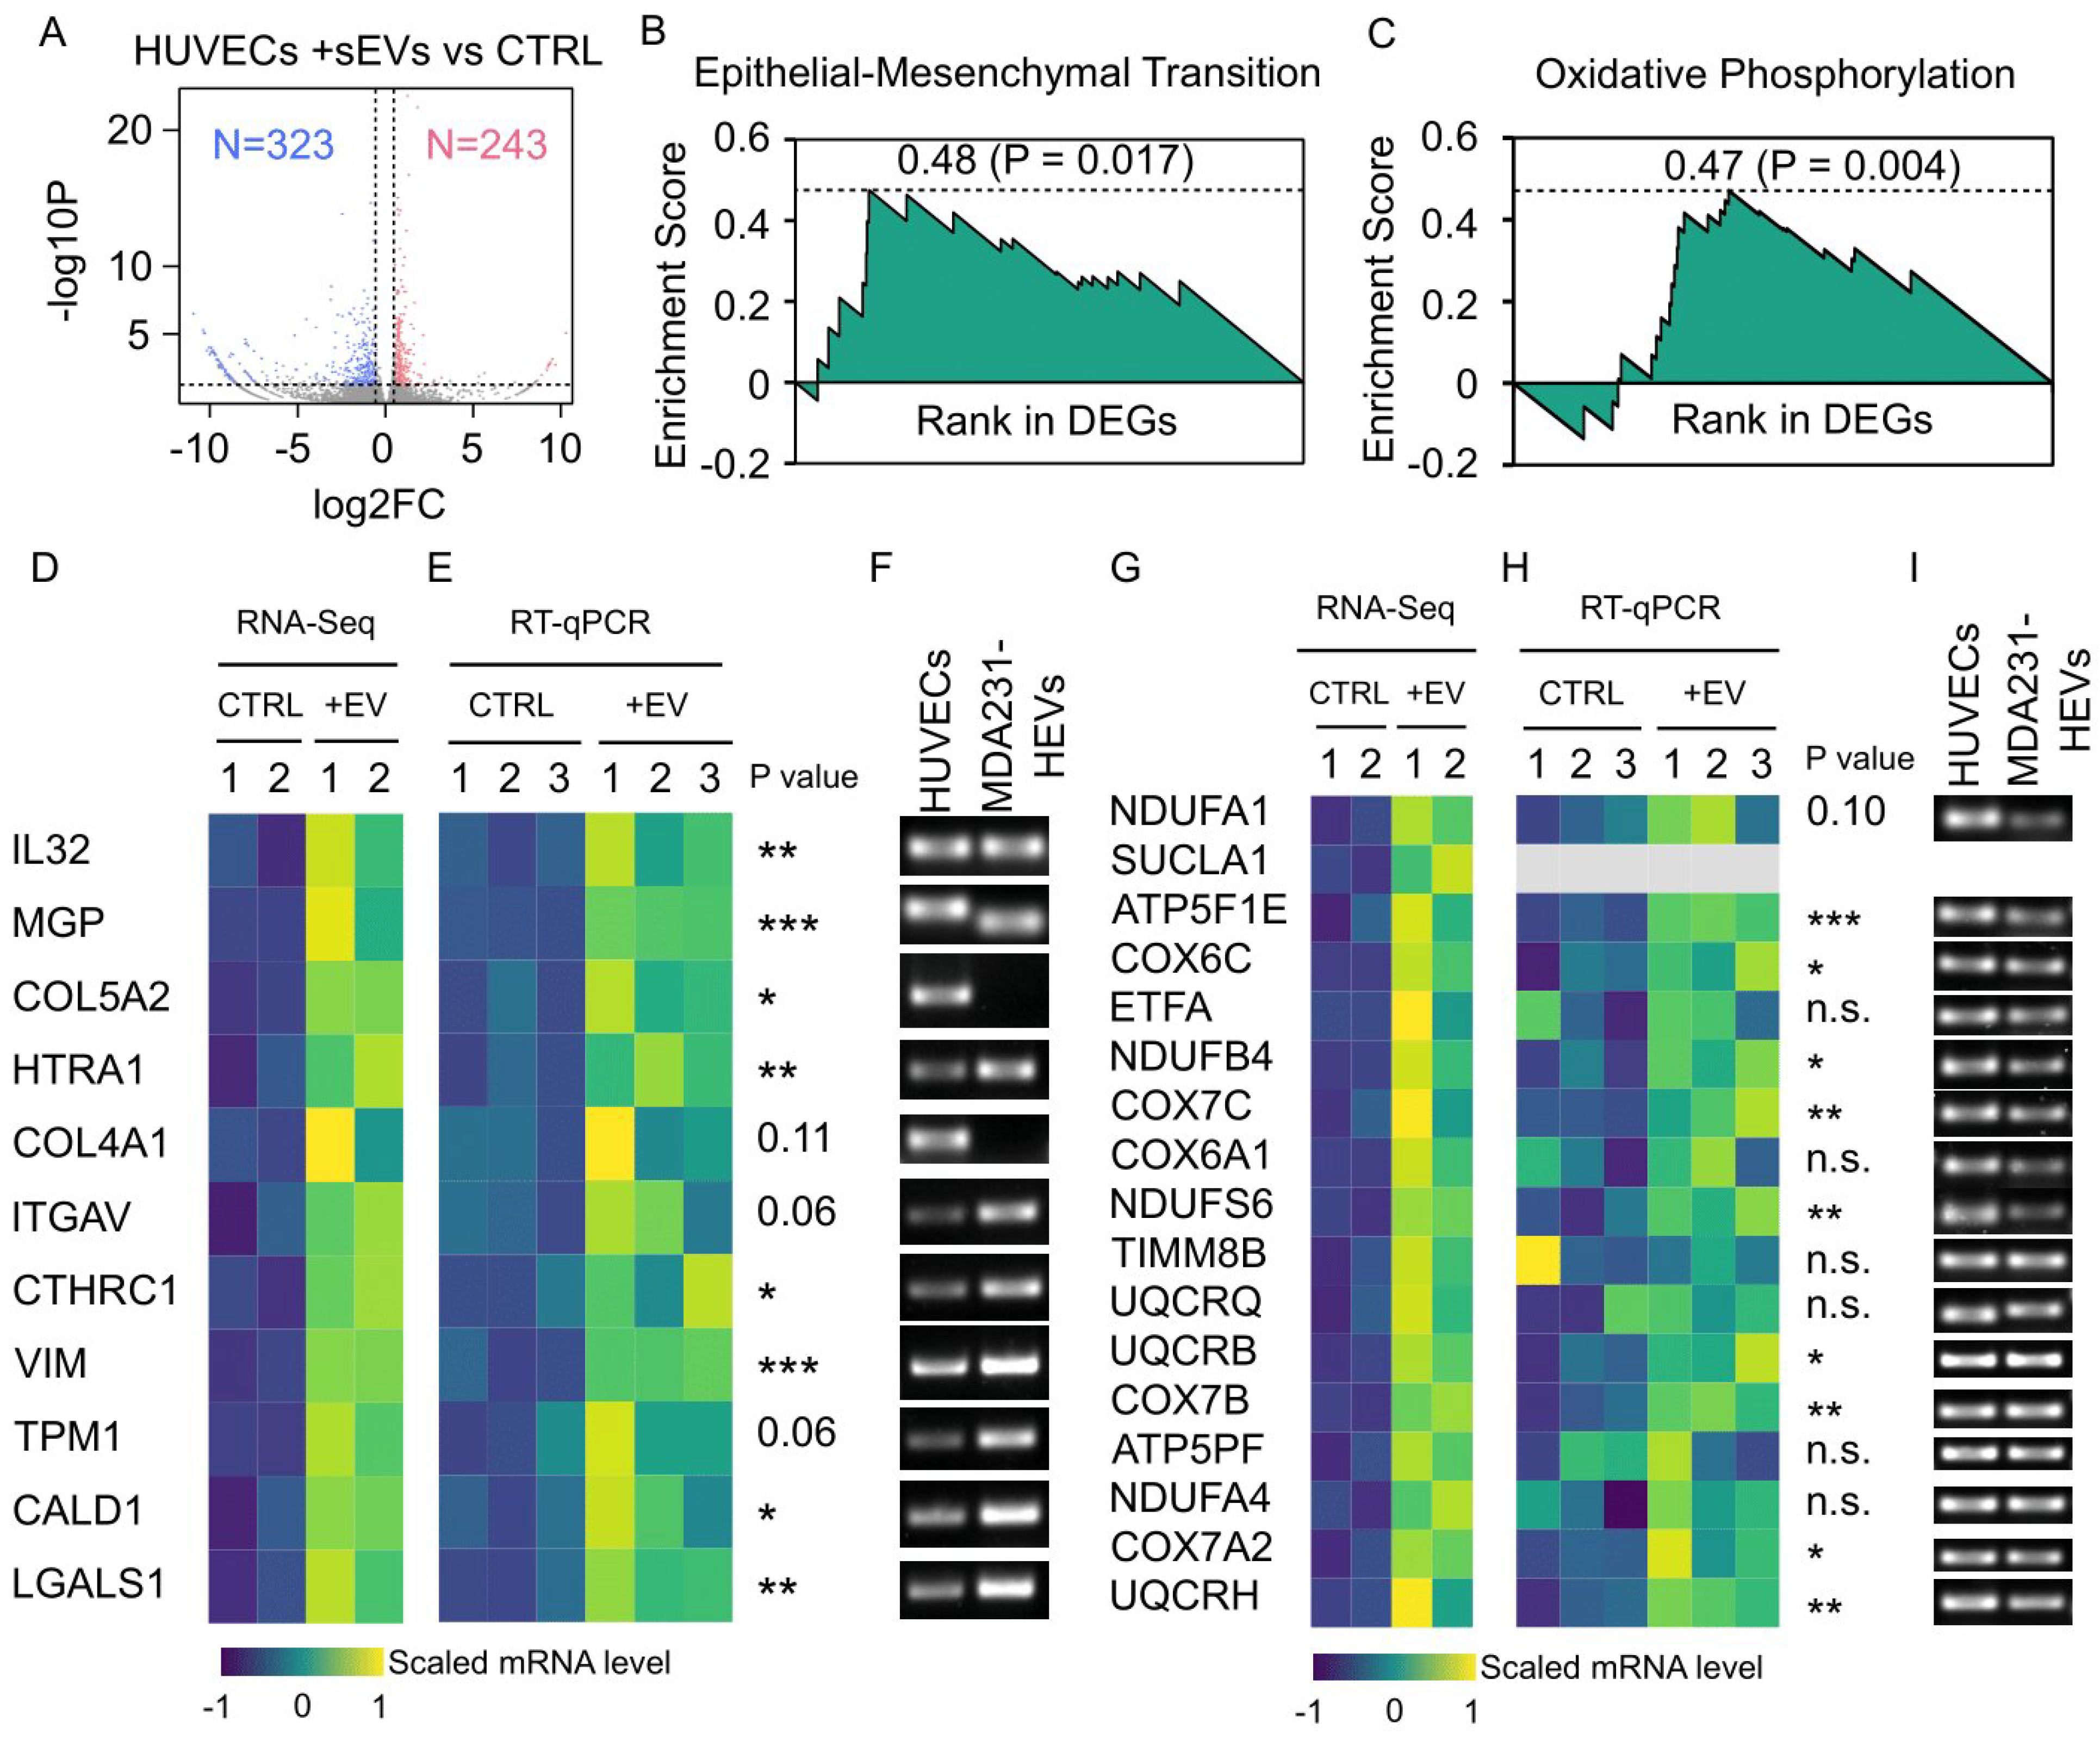
3.8. Cancer EV-Mediated Alterations in HUVEC Transcriptome Overrepresented Cell Motility and Metabolism
4. Discussion
5. Conclusions
Supplementary Materials
Author Contributions
Funding
Institutional Review Board Statement
Informed Consent Statement
Data Availability Statement
Acknowledgments
Conflicts of Interest
References
- Valadi, H.; Ekstrom, K.; Bossios, A.; Sjostrand, M.; Lee, J.J.; Lotvall, J.O. Exosome-mediated Transfer of mRNAs and microRNAs is a Novel Mechanism of Genetic Exchange between Cells. Nat. Cell Biol. 2007, 9, 654–659. [Google Scholar] [CrossRef] [PubMed] [Green Version]
- Raposo, G.; Stoorvogel, W. Extracellular Vesicles: Exosomes, Microvesicles, and Friends. J. Cell Biol. 2013, 200, 373–383. [Google Scholar] [CrossRef] [Green Version]
- Sun, H.; Burrola, S.; Wu, J.; Ding, W.Q. Extracellular Vesicles in the Development of Cancer Therapeutics. Int. J. Mol. Sci. 2020, 21, 6097. [Google Scholar] [CrossRef]
- Tan, S.; Xia, L.; Yi, P.; Han, Y.; Tang, L.; Pan, Q.; Tian, Y.; Rao, S.; Oyang, L.; Liang, J.; et al. Exosomal miRNAs in Tumor Microenvironment. J. Exp. Clin. Cancer Res. 2020, 39, 67. [Google Scholar] [CrossRef]
- Guglielmi, L.; Nardella, M.; Musa, C.; Cifola, I.; Porru, M.; Cardinali, B.; Iannetti, I.; Di Pietro, C.; Bolasco, G.; Palmieri, V.; et al. Circulating miRNAs in Small Extracellular Vesicles Secreted by a Human Melanoma Xenograft in Mouse Brains. Cancers 2020, 12, 1635. [Google Scholar] [CrossRef] [PubMed]
- Goncalves, N.P.; Yan, Y.; Ulrichsen, M.; Veno, M.T.; Poulsen, E.T.; Enghild, J.J.; Kjems, J.; Vaegter, C.B. Modulation of Small RNA Signatures in Schwann-Cell-Derived Extracellular Vesicles by the p75 Neurotrophin Receptor and Sortilin. Biomedicines 2020, 8, 450. [Google Scholar] [CrossRef]
- Castellana, D.; Kunzelmann, C.; Freyssinet, J.M. Pathophysiologic Significance of Procoagulant Microvesicles in Cancer Disease and Progression. Hamostaseologie 2009, 29, 51–57. [Google Scholar] [CrossRef] [Green Version]
- Lim, S.B.; Di Lee, W.; Vasudevan, J.; Lim, W.-T.; Lim, C.T. Liquid Biopsy: One Cell at a Time. NPJ Precis. Oncol. 2019, 3, 23. [Google Scholar] [CrossRef]
- Lim, S.B.; Lim, C.T.; Lim, W.T. Single-Cell Analysis of Circulating Tumor Cells: Why Heterogeneity Matters. Cancers 2019, 11, 1595. [Google Scholar] [CrossRef] [PubMed] [Green Version]
- Pang, B.; Zhu, Y.; Ni, J.; Thompson, J.; Malouf, D.; Bucci, J.; Graham, P.; Li, Y. Extracellular Vesicles: The Next Generation of Biomarkers for Liquid Biopsy-based Prostate Cancer Diagnosis. Theranostics 2020, 10, 2309–2326. [Google Scholar] [CrossRef] [PubMed]
- Jeppesen, D.K.; Fenix, A.M.; Franklin, J.L.; Higginbotham, J.N.; Zhang, Q.; Zimmerman, L.J.; Liebler, D.C.; Ping, J.; Liu, Q.; Evans, R.; et al. Reassessment of Exosome Composition. Cell 2019, 177, 428–445.e418. [Google Scholar] [CrossRef] [Green Version]
- Maisano, D.; Mimmi, S.; Russo, R.; Fioravanti, A.; Fiume, G.; Vecchio, E.; Nistico, N.; Quinto, I.; Iaccino, E. Uncovering the Exosomes Diversity: A Window of Opportunity for Tumor Progression Monitoring. Pharmaceuticals 2020, 13, 180. [Google Scholar] [CrossRef]
- Herreros-Villanueva, M.; Bujanda, L. Glypican-1 in Exosomes as Biomarker for Early Detection of Pancreatic Cancer. Ann. Transl. Med. 2016, 4, 64. [Google Scholar] [CrossRef] [PubMed]
- Fahrmann, J.F.; Mao, X.; Irajizad, E.; Katayama, H.; Capello, M.; Tanaka, I.; Kato, T.; Wistuba, I.I.; Maitra, A.; Ostrin, E.J.; et al. Plasma-Derived Extracellular Vesicles Convey Protein Signatures That Reflect Pathophysiology in Lung and Pancreatic Adenocarcinomas. Cancers 2020, 12, 1147. [Google Scholar] [CrossRef] [PubMed]
- Taylor, D.D.; Gercel-Taylor, C. MicroRNA Signatures of Tumor-derived Exosomes as Diagnostic Biomarkers of Ovarian Cancer. Gynecol. Oncol. 2008, 110, 13–21. [Google Scholar] [CrossRef] [PubMed]
- Kahlert, C.; Melo, S.A.; Protopopov, A.; Tang, J.; Seth, S.; Koch, M.; Zhang, J.; Weitz, J.; Chin, L.; Futreal, A.; et al. Identification of Double-stranded Genomic DNA Spanning All Chromosomes with Mutated KRAS and p53 DNA in the Serum Exosomes of Patients with Pancreatic Cancer. J. Biol. Chem. 2014, 289, 3869–3875. [Google Scholar] [CrossRef] [Green Version]
- Kucharzewska, P.; Christianson, H.C.; Welch, J.E.; Svensson, K.J.; Fredlund, E.; Ringner, M.; Morgelin, M.; Bourseau-Guilmain, E.; Bengzon, J.; Belting, M. Exosomes Reflect the Hypoxic Status of Glioma Cells and Mediate Hypoxia-dependent Activation of Vascular Cells during Tumor Development. Proc. Natl. Acad. Sci. USA 2013, 110, 7312–7317. [Google Scholar] [CrossRef] [Green Version]
- Muz, B.; de la Puente, P.; Azab, F.; Azab, A.K. The Role of Hypoxia in Cancer Progression, Angiogenesis, Metastasis, and Resistance to Therapy. Hypoxia 2015, 3, 83–92. [Google Scholar] [CrossRef] [Green Version]
- Shao, C.; Yang, F.; Miao, S.; Liu, W.; Wang, C.; Shu, Y.; Shen, H. Role of Hypoxia-induced Exosomes in Tumor Biology. Mol. Cancer 2018, 17, 120. [Google Scholar] [CrossRef]
- Thery, C.; Witwer, K.W.; Aikawa, E.; Alcaraz, M.J.; Anderson, J.D.; Andriantsitohaina, R.; Antoniou, A.; Arab, T.; Archer, F.; Atkin-Smith, G.K.; et al. Minimal Information for Studies of Extracellular Vesicles 2018 (MISEV2018): A Position Statement of the International Society for Extracellular Vesicles and Update of the MISEV2014 Guidelines. J. Extracell. Vesicles 2018, 7, 1535750. [Google Scholar] [CrossRef] [Green Version]
- Thery, C.; Amigorena, S.; Raposo, G.; Clayton, A. Isolation and Characterization of Exosomes from Cell Culture Supernatants and Biological Fluids. Curr. Protoc. Cell Biol. 2006, 30, 3.22.1–3.22.29. [Google Scholar] [CrossRef]
- Takov, K.; Yellon, D.M.; Davidson, S.M. Confounding Factors in Vesicle Uptake Studies Using Fluorescent Lipophilic Membrane Dyes. J. Extracell. Vesicles 2017, 6, 1388731. [Google Scholar] [CrossRef]
- Puzar Dominkus, P.; Stenovec, M.; Sitar, S.; Lasic, E.; Zorec, R.; Plemenitas, A.; Zagar, E.; Kreft, M.; Lenassi, M. PKH26 Labeling of Extracellular Vesicles: Characterization and Cellular Internalization of Contaminating PKH26 Nanoparticles. Biochim. Biophys. Acta Biomembr. 2018, 1860, 1350–1361. [Google Scholar] [CrossRef]
- Ravichandran, A.; Low, B.C. SmgGDS Antagonizes BPGAP1-induced Ras/ERK Activation and Neuritogenesis in PC12 Cell Differentiation. Mol. Biol. Cell 2013, 24, 145–156. [Google Scholar] [CrossRef] [PubMed]
- Schindelin, J.; Arganda-Carreras, I.; Frise, E.; Kaynig, V.; Longair, M.; Pietzsch, T.; Preibisch, S.; Rueden, C.; Saalfeld, S.; Schmid, B.; et al. Fiji: An Open-source Platform for Biological-image Analysis. Nat. Methods 2012, 9, 676–682. [Google Scholar] [CrossRef] [PubMed] [Green Version]
- Anders, S.; Pyl, P.T.; Huber, W. HTSeq–A Python Framework to Work with High-throughput Sequencing Data. Bioinformatics 2015, 31, 166–169. [Google Scholar] [CrossRef] [PubMed]
- Kim, D.; Langmead, B.; Salzberg, S.L. HISAT: A Fast Spliced Aligner with Low Memory Requirements. Nat. Methods 2015, 12, 357–360. [Google Scholar] [CrossRef] [Green Version]
- Patro, R.; Duggal, G.; Love, M.I.; Irizarry, R.A.; Kingsford, C. Salmon Provides Fast and Bias-aware Quantification of Transcript Expression. Nat. Methods 2017, 14, 417–419. [Google Scholar] [CrossRef] [PubMed] [Green Version]
- Love, M.I.; Huber, W.; Anders, S. Moderated Estimation of Fold Change and Dispersion for RNA-seq Data with DESeq2. Genome Biol. 2014, 15, 550. [Google Scholar] [CrossRef] [PubMed] [Green Version]
- Robinson, M.D.; McCarthy, D.J.; Smyth, G.K. edgeR: A Bioconductor Package for Differential Expression Analysis of Digital Gene Expression Data. Bioinformatics 2010, 26, 139–140. [Google Scholar] [CrossRef] [Green Version]
- Subramanian, A.; Tamayo, P.; Mootha, V.K.; Mukherjee, S.; Ebert, B.L.; Gillette, M.A.; Paulovich, A.; Pomeroy, S.L.; Golub, T.R.; Lander, E.S.; et al. Gene Set Enrichment Analysis: A Knowledge-based Approach for Interpreting Genome-wide Expression Profiles. Proc. Natl. Acad. Sci. USA 2005, 102, 15545–15550. [Google Scholar] [CrossRef] [Green Version]
- R: A Language and Environment for Statistical Computing. Available online: https://www.R-project.org/ (accessed on 9 March 2020).
- Liangsupree, T.; Multia, E.; Riekkola, M.L. Modern Isolation and Separation Techniques for Extracellular Vesicles. J. Chromatogr. A 2021, 1636, 461773. [Google Scholar] [CrossRef]
- Mathieu, M.; Martin-Jaular, L.; Lavieu, G.; Théry, C. Specificities of Secretion and Uptake of Exosomes and Other Extracellular Vesicles for Cell-to-cell Communication. Nat. Cell Biol. 2019, 21, 9–17. [Google Scholar] [CrossRef] [PubMed]
- Brennan, K.; Martin, K.; Fitz Gerald, S.P.; O’Sullivan, J.; Wu, Y.; Blanco, A.; Richardson, C.; Mc Gee, M.M. A Comparison of Methods for the Isolation and Separation of Extracellular Vesicles from Protein and Lipid Particles in Human Serum. Sci. Rep. 2020, 10, 1039. [Google Scholar] [CrossRef] [PubMed] [Green Version]
- Menard, J.A.; Cerezo-Magana, M.; Belting, M. Functional Role of Extracellular Vesicles and Lipoproteins in the Tumour Microenvironment. Philos. Trans. R. Soc. B Biol. Sci. 2018, 373. [Google Scholar] [CrossRef]
- Zhang, H.; Freitas, D.; Kim, H.S.; Fabijanic, K.; Li, Z.; Chen, H.; Mark, M.T.; Molina, H.; Martin, A.B.; Bojmar, L.; et al. Identification of Distinct Nanoparticles and Subsets of Extracellular Vesicles by Asymmetric Flow Field-flow Fractionation. Nat. Cell. Biol. 2018, 20, 332–343. [Google Scholar] [CrossRef] [PubMed]
- Gilkes, D.M.; Semenza, G.L. Role of Hypoxia-inducible Factors in Breast Cancer Metastasis. Future Oncol. 2013, 9, 1623–1636. [Google Scholar] [CrossRef] [Green Version]
- Schito, L.; Semenza, G.L. Hypoxia-Inducible Factors: Master Regulators of Cancer Progression. Trends Cancer 2016, 2, 758–770. [Google Scholar] [CrossRef] [Green Version]
- Guzman-Hernandez, M.L.; Potter, G.; Egervari, K.; Kiss, J.Z.; Balla, T. Secretion of VEGF-165 Has Unique Characteristics, Including Shedding from the Plasma Membrane. Mol. Biol. Cell 2014, 25, 1061–1072. [Google Scholar] [CrossRef]
- Skog, J.; Wurdinger, T.; van Rijn, S.; Meijer, D.H.; Gainche, L.; Sena-Esteves, M.; Curry, W.T., Jr.; Carter, B.S.; Krichevsky, A.M.; Breakefield, X.O. Glioblastoma Microvesicles Transport RNA and Proteins That Promote Tumour Growth and Provide Diagnostic Biomarkers. Nat. Cell Biol. 2008, 10, 1470–1476. [Google Scholar] [CrossRef]
- Tian, T.; Zhu, Y.L.; Zhou, Y.Y.; Liang, G.F.; Wang, Y.Y.; Hu, F.H.; Xiao, Z.D. Exosome Uptake through Clathrin-mediated Endocytosis and Macropinocytosis and Mediating miR-21 Delivery. J. Biol. Chem. 2014, 289, 22258–22267. [Google Scholar] [CrossRef] [Green Version]
- Krock, B.L.; Skuli, N.; Simon, M.C. Hypoxia-induced Angiogenesis: Good and Evil. Genes Cancer 2011, 2, 1117–1133. [Google Scholar] [CrossRef] [PubMed] [Green Version]
- Simons, M.; Gordon, E.; Claesson-Welsh, L. Mechanisms and Regulation of Endothelial VEGF Receptor Signalling. Nat. Rev. Mol. Cell Biol. 2016, 17, 611–625. [Google Scholar] [CrossRef]
- Chu, D.; Park, B.H. Liquid Biopsy: Unlocking the Potentials of Cell-free DNA. Virchows Arch. 2017, 471, 147–154. [Google Scholar] [CrossRef]
- Totaro, A.; Panciera, T.; Piccolo, S. YAP/TAZ Upstream Signals and Downstream Responses. Nat. Cell Biol. 2018, 20, 888–899. [Google Scholar] [CrossRef] [PubMed]
- Gjerdrum, C.; Tiron, C.; Hoiby, T.; Stefansson, I.; Haugen, H.; Sandal, T.; Collett, K.; Li, S.; McCormack, E.; Gjertsen, B.T.; et al. Axl is an Essential Epithelial-to-mesenchymal Transition-induced Regulator of Breast Cancer Metastasis and Patient Survival. Proc. Natl. Acad. Sci. USA 2010, 107, 1124–1129. [Google Scholar] [CrossRef] [PubMed] [Green Version]
- Asiedu, M.K.; Beauchamp-Perez, F.D.; Ingle, J.N.; Behrens, M.D.; Radisky, D.C.; Knutson, K.L. AXL Induces Epithelial-to-mesenchymal Transition and Regulates the Function of Breast Cancer Stem Cells. Oncogene 2014, 33, 1316–1324. [Google Scholar] [CrossRef] [Green Version]
- Ridley, A.J. Rho GTPase Signalling in Cell Migration. Curr. Opin. Cell Biol. 2015, 36, 103–112. [Google Scholar] [CrossRef] [Green Version]
- Li, W.; Zhang, X.; Wang, J.; Li, M.; Cao, C.; Tan, J.; Ma, D.; Gao, Q. TGFbeta1 in Fibroblasts-derived Exosomes Promotes Epithelial-mesenchymal Transition of Ovarian Cancer Cells. Oncotarget 2017, 8, 96035–96047. [Google Scholar] [CrossRef] [Green Version]
- Li, L.; Li, C.; Wang, S.; Wang, Z.; Jiang, J.; Wang, W.; Li, X.; Chen, J.; Liu, K.; Li, C.; et al. Exosomes Derived from Hypoxic Oral Squamous Cell Carcinoma Cells Deliver miR-21 to Normoxic Cells to Elicit a Prometastatic Phenotype. Cancer Res. 2016, 76, 1770–1780. [Google Scholar] [CrossRef] [Green Version]
- Welch-Reardon, K.M.; Ehsan, S.M.; Wang, K.; Wu, N.; Newman, A.C.; Romero-Lopez, M.; Fong, A.H.; George, S.C.; Edwards, R.A.; Hughes, C.C. Angiogenic Sprouting is Regulated by Endothelial Cell Expression of Slug. J. Cell Sci. 2014, 127, 2017–2028. [Google Scholar] [CrossRef] [PubMed] [Green Version]
- Ravasi, T.; Suzuki, H.; Pang, K.C.; Katayama, S.; Furuno, M.; Okunishi, R.; Fukuda, S.; Ru, K.; Frith, M.C.; Gongora, M.M.; et al. Experimental Validation of the Regulated Expression of Large Numbers of Non-coding RNAs from the Mouse Genome. Genome Res. 2006, 16, 11–19. [Google Scholar] [CrossRef] [PubMed] [Green Version]
- Batagov, A.O.; Kurochkin, I.V. Exosomes Secreted by Human Cells Transport Largely mRNA Fragments That are Enriched in the 3’-untranslated Regions. Biol. Direct 2013, 8, 12. [Google Scholar] [CrossRef] [Green Version]
- Bracht, J.W.P.; Gimenez-Capitan, A.; Huang, C.-Y.; Potie, N.; Pedraz-Valdunciel, C.; Warren, S.; Rosell, R.; Molina-Vila, M.A. Analysis of Extracellular Vesicle mRNA Derived from Plasma Using the nCounter Platform. Sci. Rep. 2021, 11, 3712. [Google Scholar] [CrossRef]
- Dong, L.; Huang, C.-Y.; Johnson, E.J.; Yang, L.; Zieren, R.C.; Horie, K.; Kim, C.-J.; Warren, S.; Amend, S.R.; Xue, W.; et al. High-throughput Simultaneous mRNA Profiling Using nCounter Technology Demonstrates That Extracellular Vesicles Contain Different mRNA Transcripts Than Their Parental Prostate Cancer Cells. Anal. Chem. 2021, 93, 3717–3725. [Google Scholar] [CrossRef] [PubMed]
- Xavier, C.P.R.; Caires, H.R.; Barbosa, M.A.G.; Bergantim, R.; Guimaraes, J.E.; Vasconcelos, M.H. The Role of Extracellular Vesicles in the Hallmarks of Cancer and Drug Resistance. Cells 2020, 9, 1141. [Google Scholar] [CrossRef]
- Hoshino, D.; Kirkbride, K.C.; Costello, K.; Clark, E.S.; Sinha, S.; Grega-Larson, N.; Tyska, M.J.; Weaver, A.M. Exosome Secretion is Enhanced by Invadopodia and Drives Invasive Behavior. Cell Rep. 2013, 5, 1159–1168. [Google Scholar] [CrossRef] [Green Version]
- O’Neill, P.R.; Castillo-Badillo, J.A.; Meshik, X.; Kalyanaraman, V.; Melgarejo, K.; Gautam, N. Membrane Flow Drives an Adhesion-independent Amoeboid Cell Migration Mode. Dev. Cell 2018, 46, 9–22.e4. [Google Scholar] [CrossRef] [Green Version]
- Tanaka, M.; Kikuchi, T.; Uno, H.; Okita, K.; Kitanishi-Yumura, T.; Yumura, S. Turnover and Flow of the Cell Membrane for Cell Migration. Sci. Rep. 2017, 7, 12970. [Google Scholar] [CrossRef] [Green Version]
- Sung, B.H.; von Lersner, A.; Guerrero, J.; Krystofiak, E.S.; Inman, D.; Pelletier, R.; Zijlstra, A.; Ponik, S.M.; Weaver, A.M. A Live Cell Reporter of Exosome Secretion and Uptake Reveals Pathfinding Behavior of Migrating Cells. Nat. Commun. 2020, 11, 2092. [Google Scholar] [CrossRef]
- King, H.W.; Michael, M.Z.; Gleadle, J.M. Hypoxic Enhancement of Exosome Release by Breast Cancer Cells. BMC Cancer 2012, 12, 421. [Google Scholar] [CrossRef] [PubMed] [Green Version]
- Ciardiello, C.; Migliorino, R.; Leone, A.; Budillon, A. Large Extracellular Vesicles: Size Matters in Tumor Progression. Cytokine Growth Factor Rev. 2020, 51, 69–74. [Google Scholar] [CrossRef] [PubMed]
- He, M.; Guo, S.; Li, Z. In situ Characterizing Membrane Lipid Phenotype of Breast Cancer Cells Using Mass Spectrometry Profiling. Sci. Rep. 2015, 5, 11298. [Google Scholar] [CrossRef] [PubMed] [Green Version]
- Wala, J.; Das, S. Mapping of Biomechanical Properties of Cell Lines on Altered Matrix Stiffness Using Atomic Force Microscopy. Biomech. Modeling Mechanobiol. 2020, 19, 1523–1536. [Google Scholar] [CrossRef]
- Risha, Y.; Minic, Z.; Ghobadloo, S.M.; Berezovski, M.V. The Proteomic Analysis of Breast Cell Line Exosomes Reveals Disease Patterns and Potential Biomarkers. Sci. Rep. 2020, 10, 13572. [Google Scholar] [CrossRef]


Publisher’s Note: MDPI stays neutral with regard to jurisdictional claims in published maps and institutional affiliations. |
© 2021 by the authors. Licensee MDPI, Basel, Switzerland. This article is an open access article distributed under the terms and conditions of the Creative Commons Attribution (CC BY) license (https://creativecommons.org/licenses/by/4.0/).
Share and Cite
Zhang, P.; Lim, S.B.; Jiang, K.; Chew, T.W.; Low, B.C.; Lim, C.T. Distinct mRNAs in Cancer Extracellular Vesicles Activate Angiogenesis and Alter Transcriptome of Vascular Endothelial Cells. Cancers 2021, 13, 2009. https://doi.org/10.3390/cancers13092009
Zhang P, Lim SB, Jiang K, Chew TW, Low BC, Lim CT. Distinct mRNAs in Cancer Extracellular Vesicles Activate Angiogenesis and Alter Transcriptome of Vascular Endothelial Cells. Cancers. 2021; 13(9):2009. https://doi.org/10.3390/cancers13092009
Chicago/Turabian StyleZhang, Pan, Su Bin Lim, Kuan Jiang, Ti Weng Chew, Boon Chuan Low, and Chwee Teck Lim. 2021. "Distinct mRNAs in Cancer Extracellular Vesicles Activate Angiogenesis and Alter Transcriptome of Vascular Endothelial Cells" Cancers 13, no. 9: 2009. https://doi.org/10.3390/cancers13092009