
Senolytic Targeting of Bcl-2 Anti-Apoptotic Family Increases Cell Death in Irradiated Sarcoma Cells

 , , and
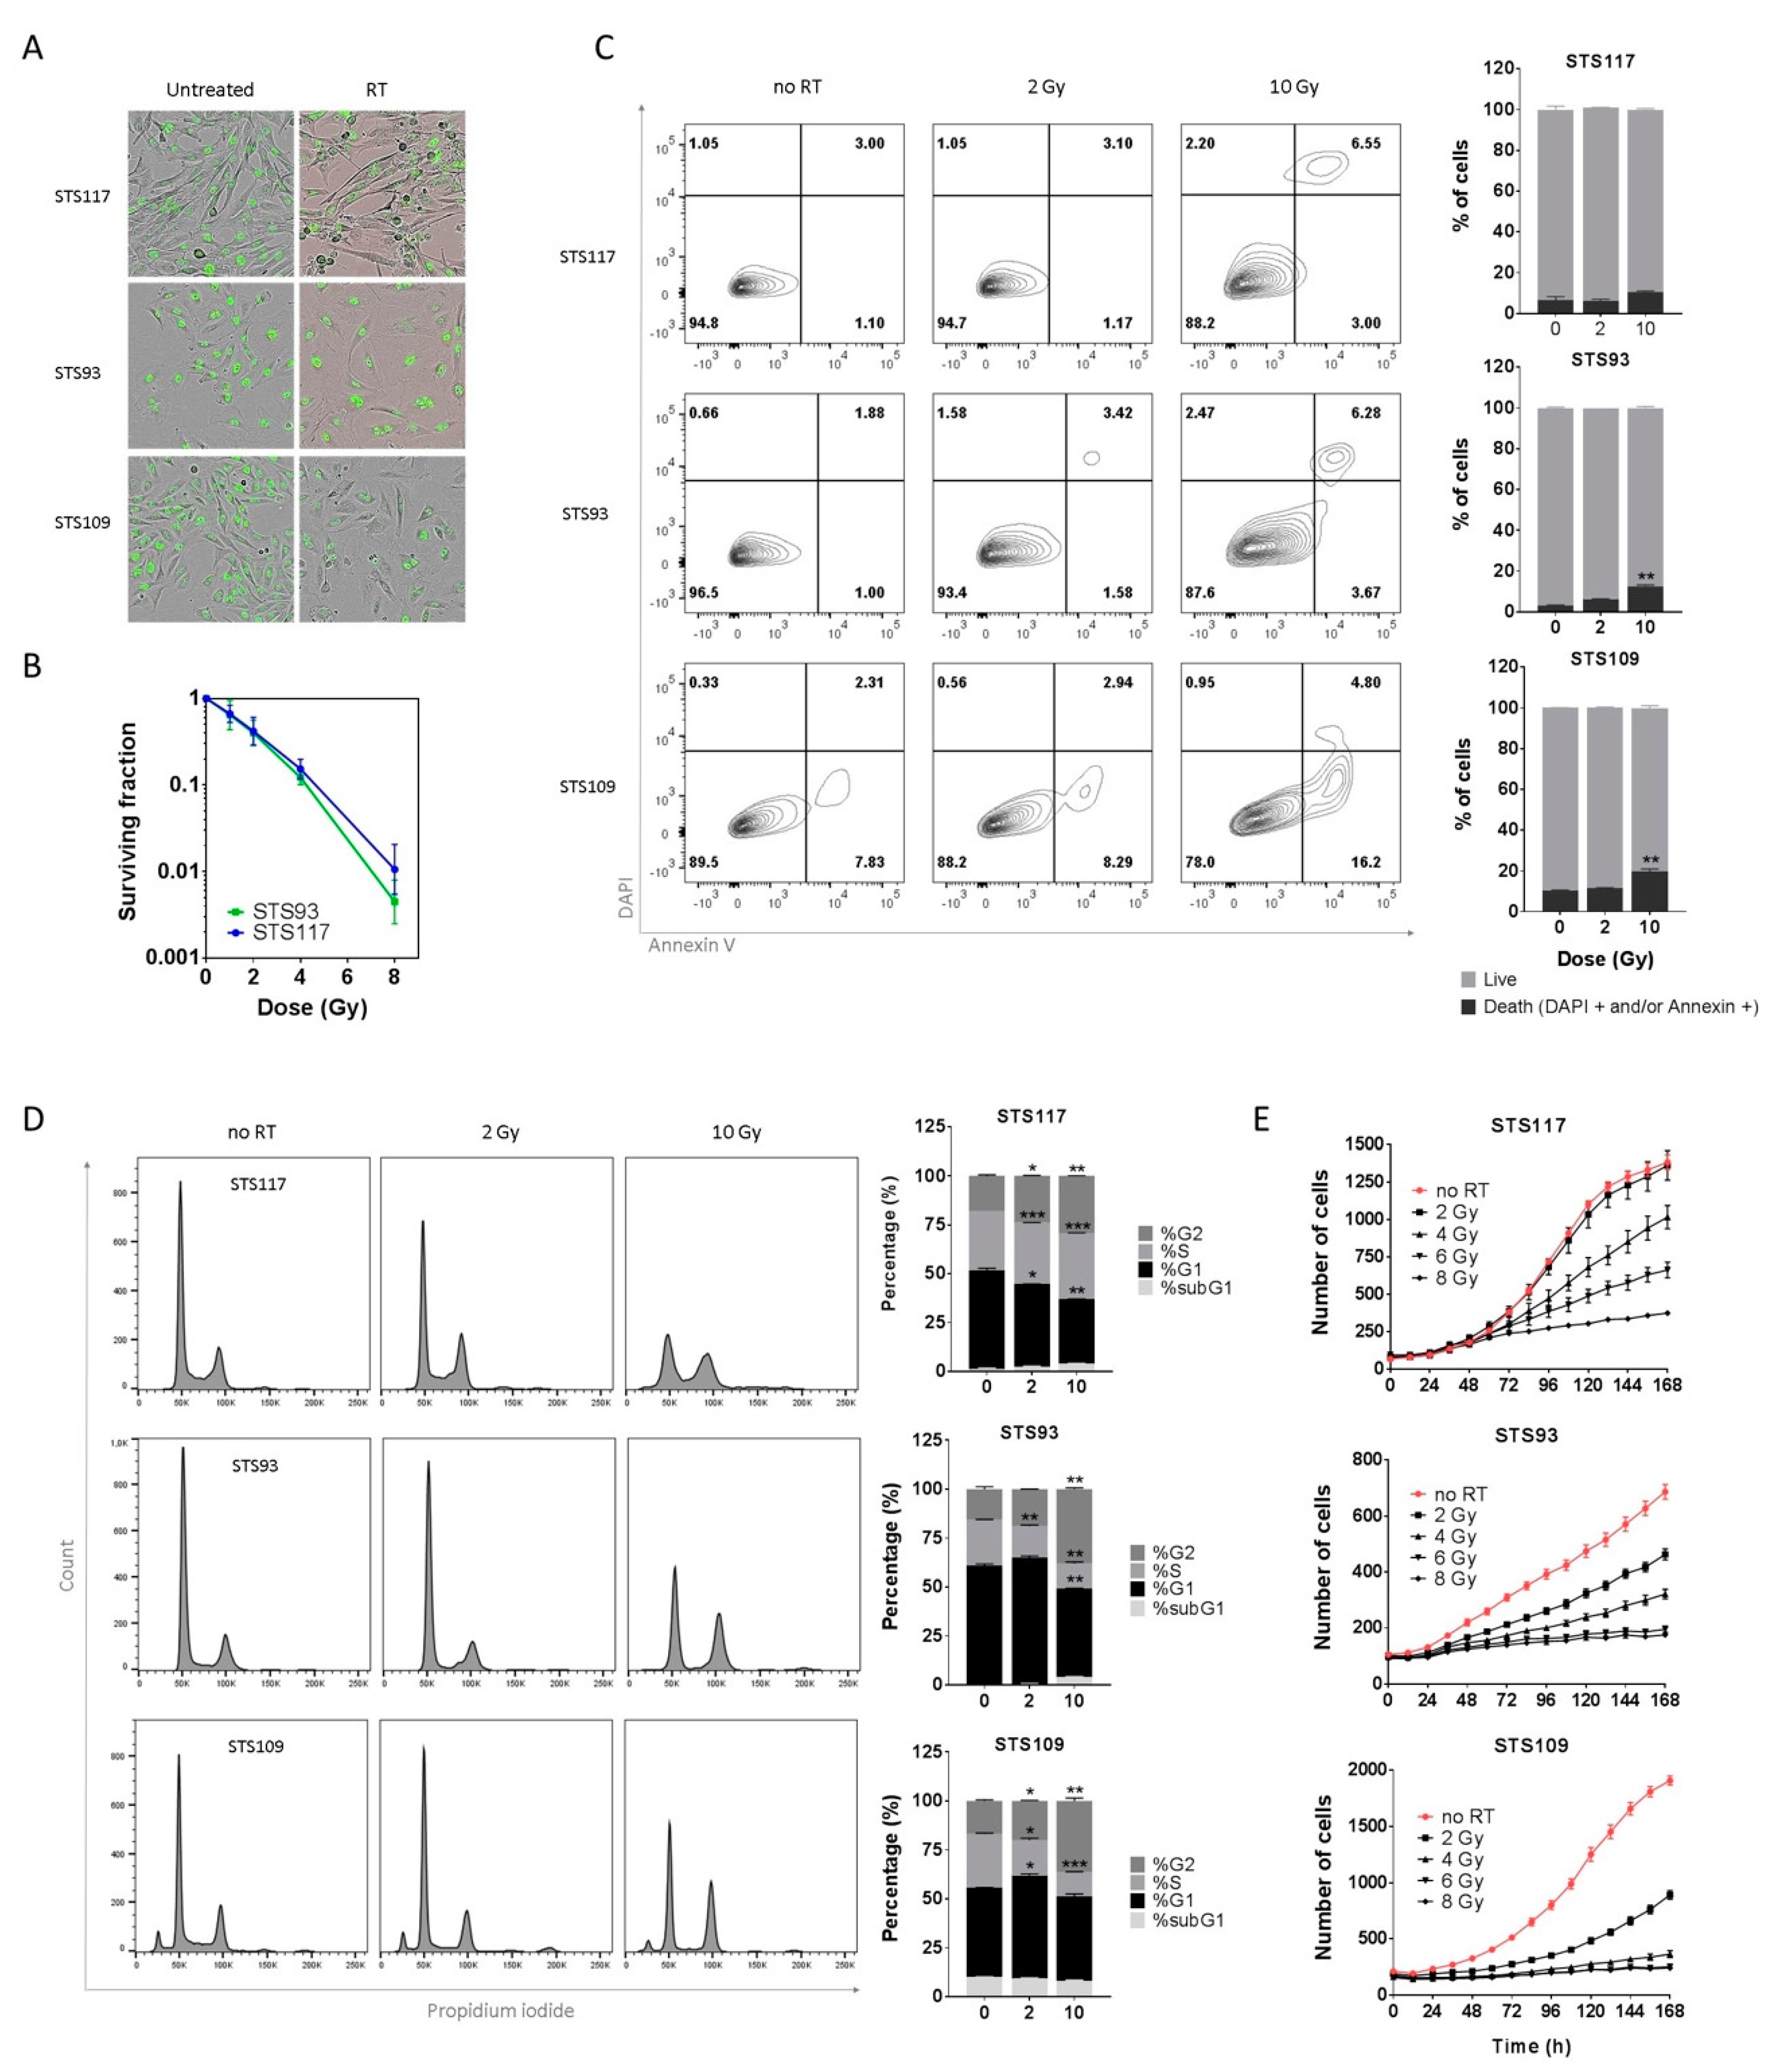
Abstract
:Simple Summary
Abstract
1. Introduction
2. Results
2.1. RT Induces Proliferative Arrest in Sarcoma Cell Lines
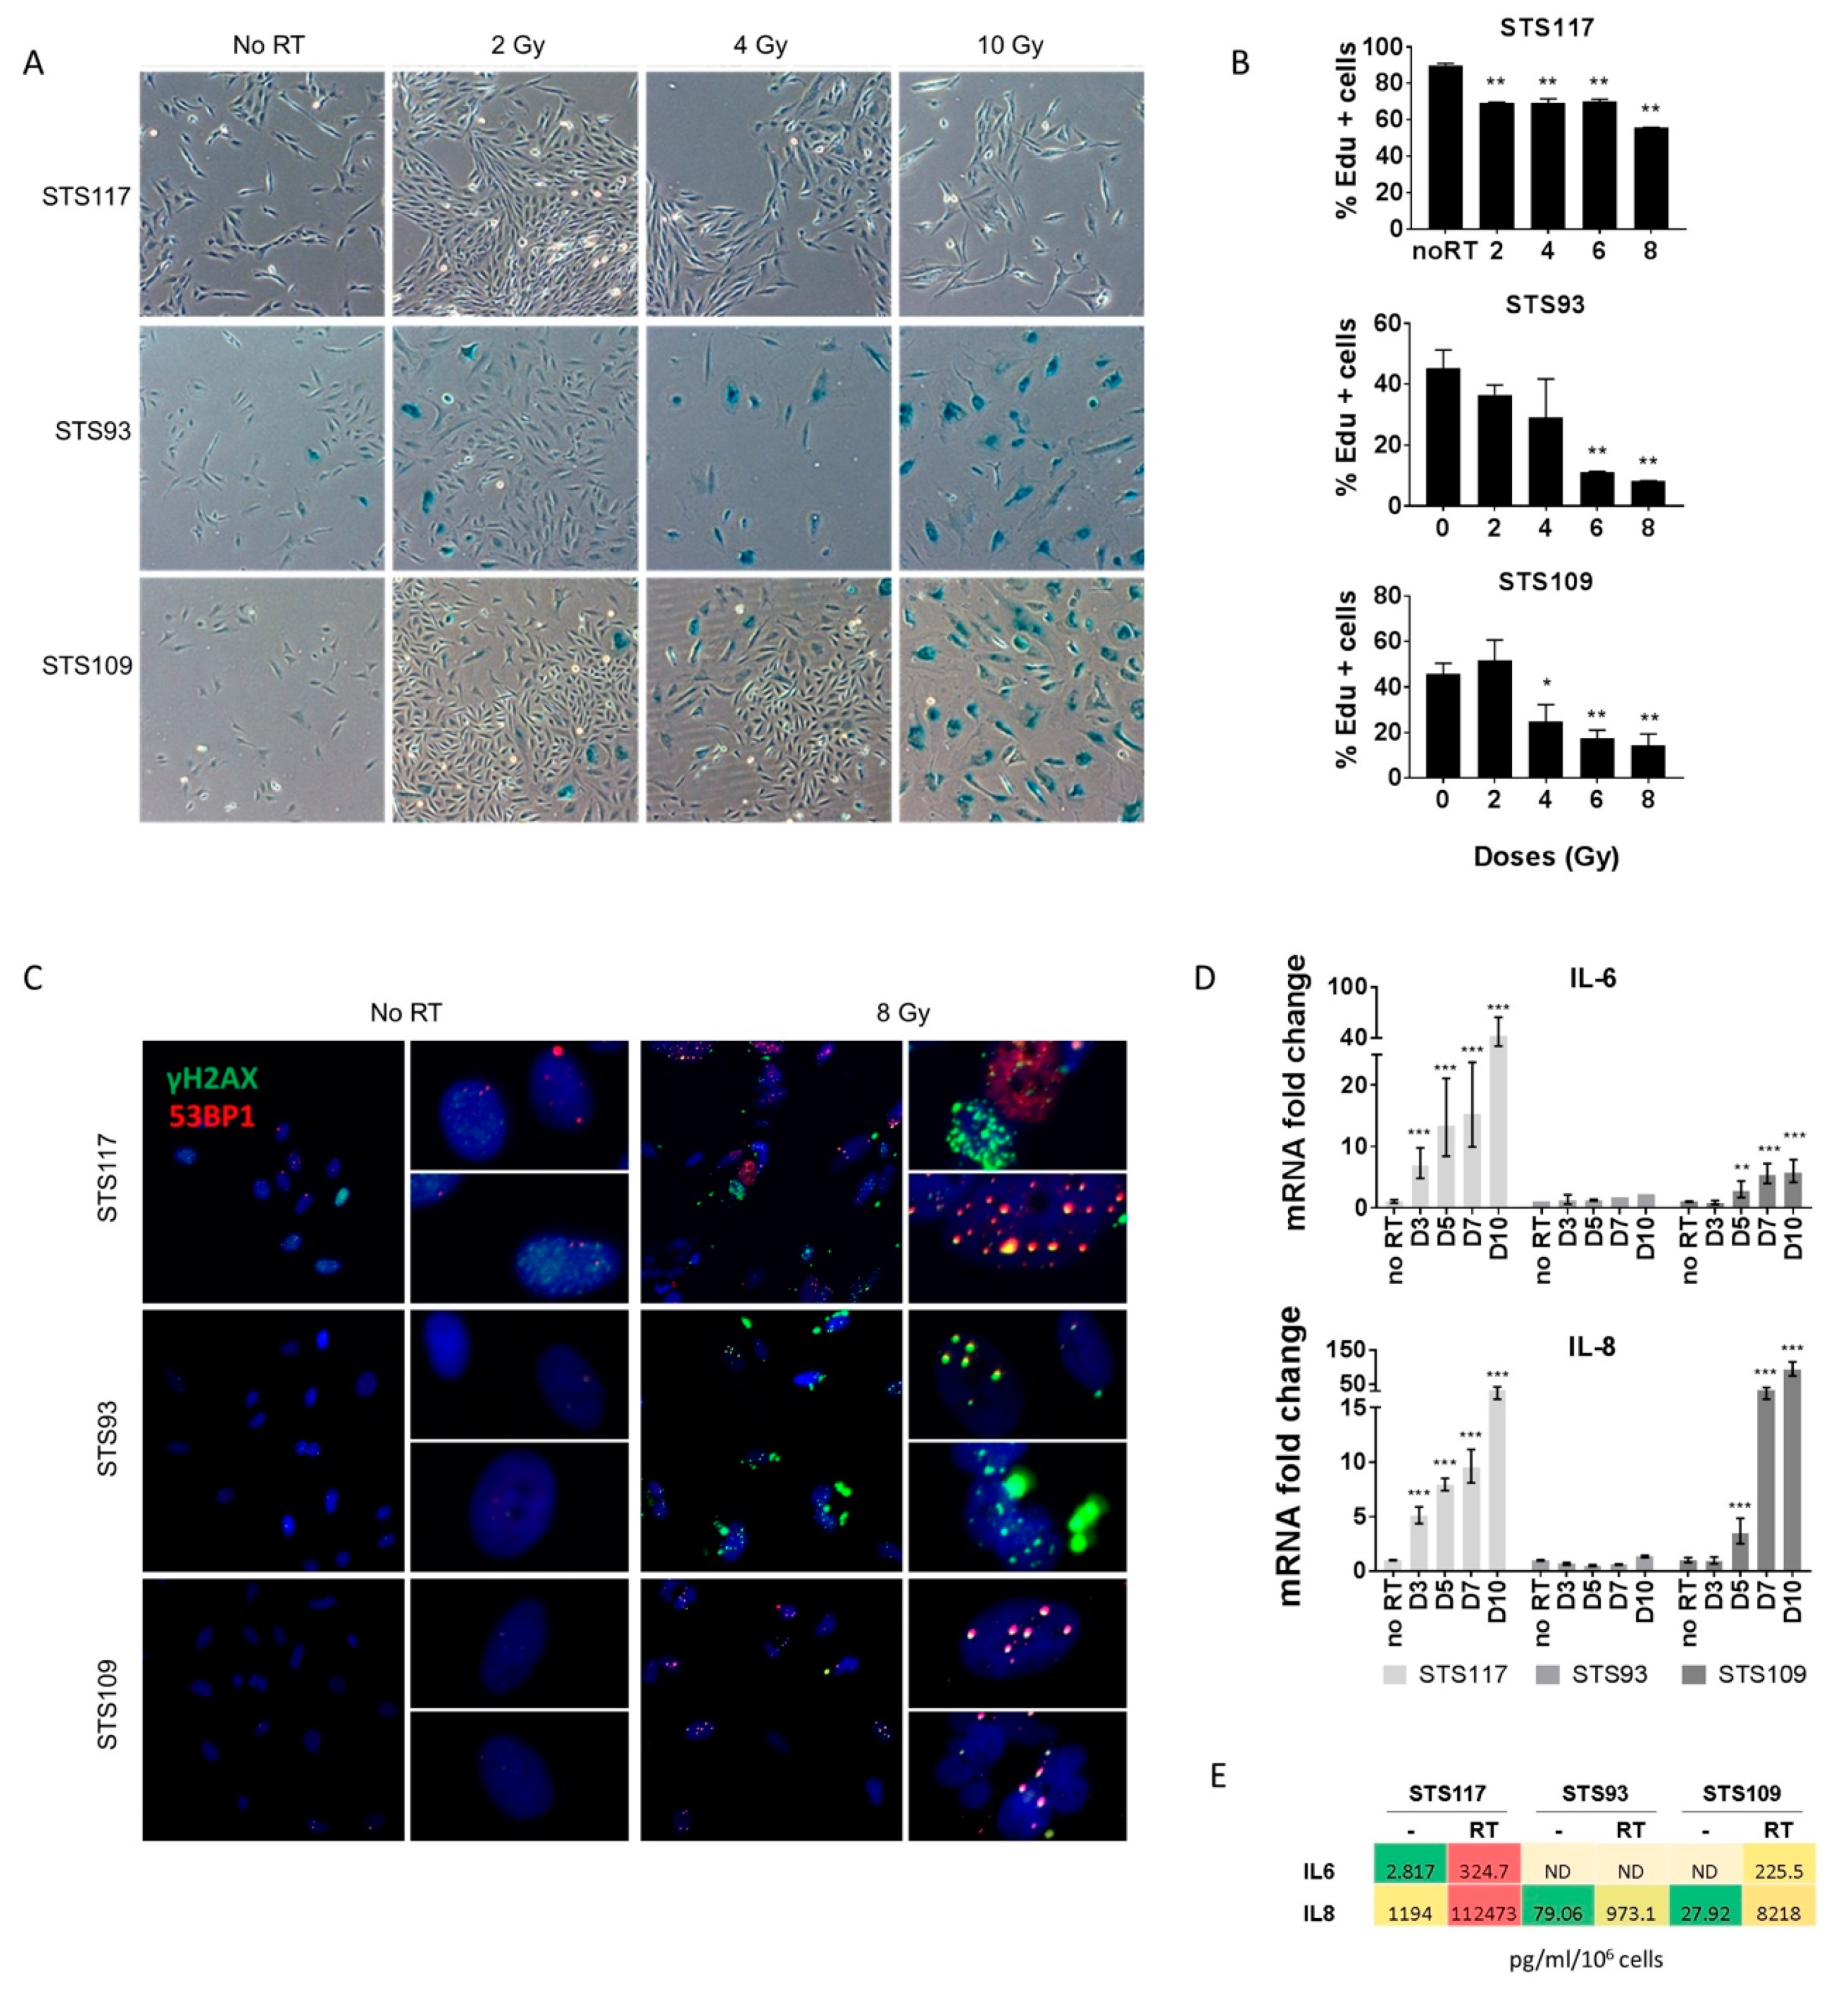
2.2. Sarcoma Cell Lines Exhibit a Senescence Phenotype after Treatment
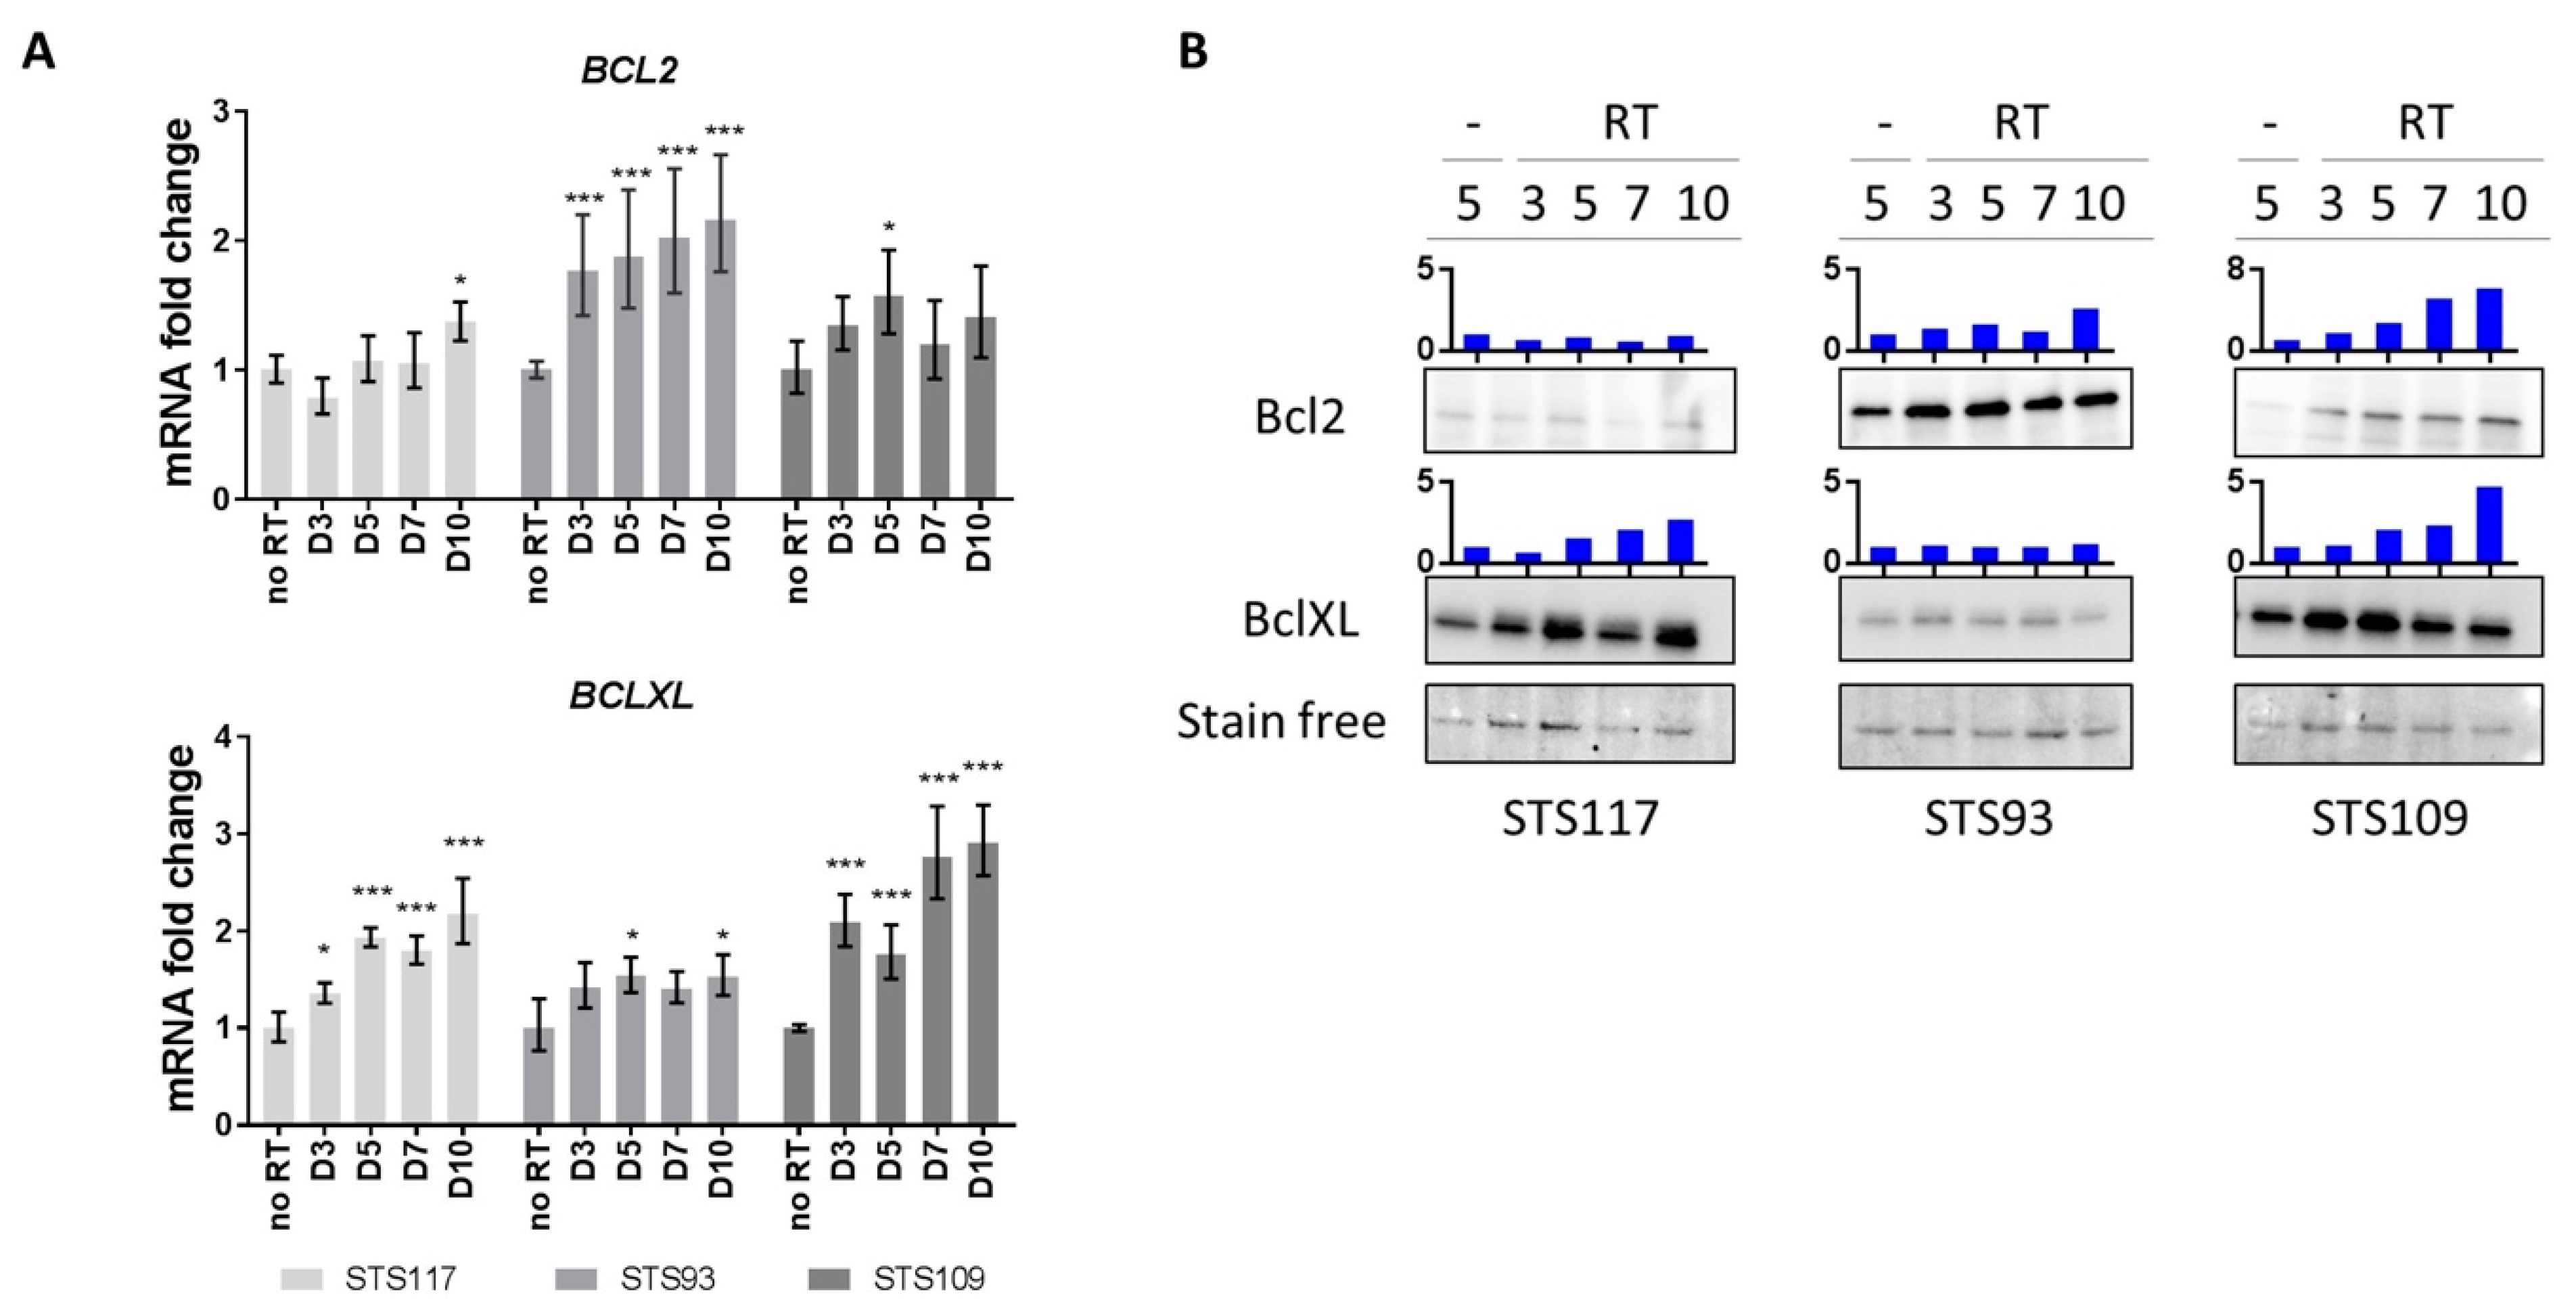
2.3. RT Modulates Bcl-2 Family of Anti-Apoptotic Proteins
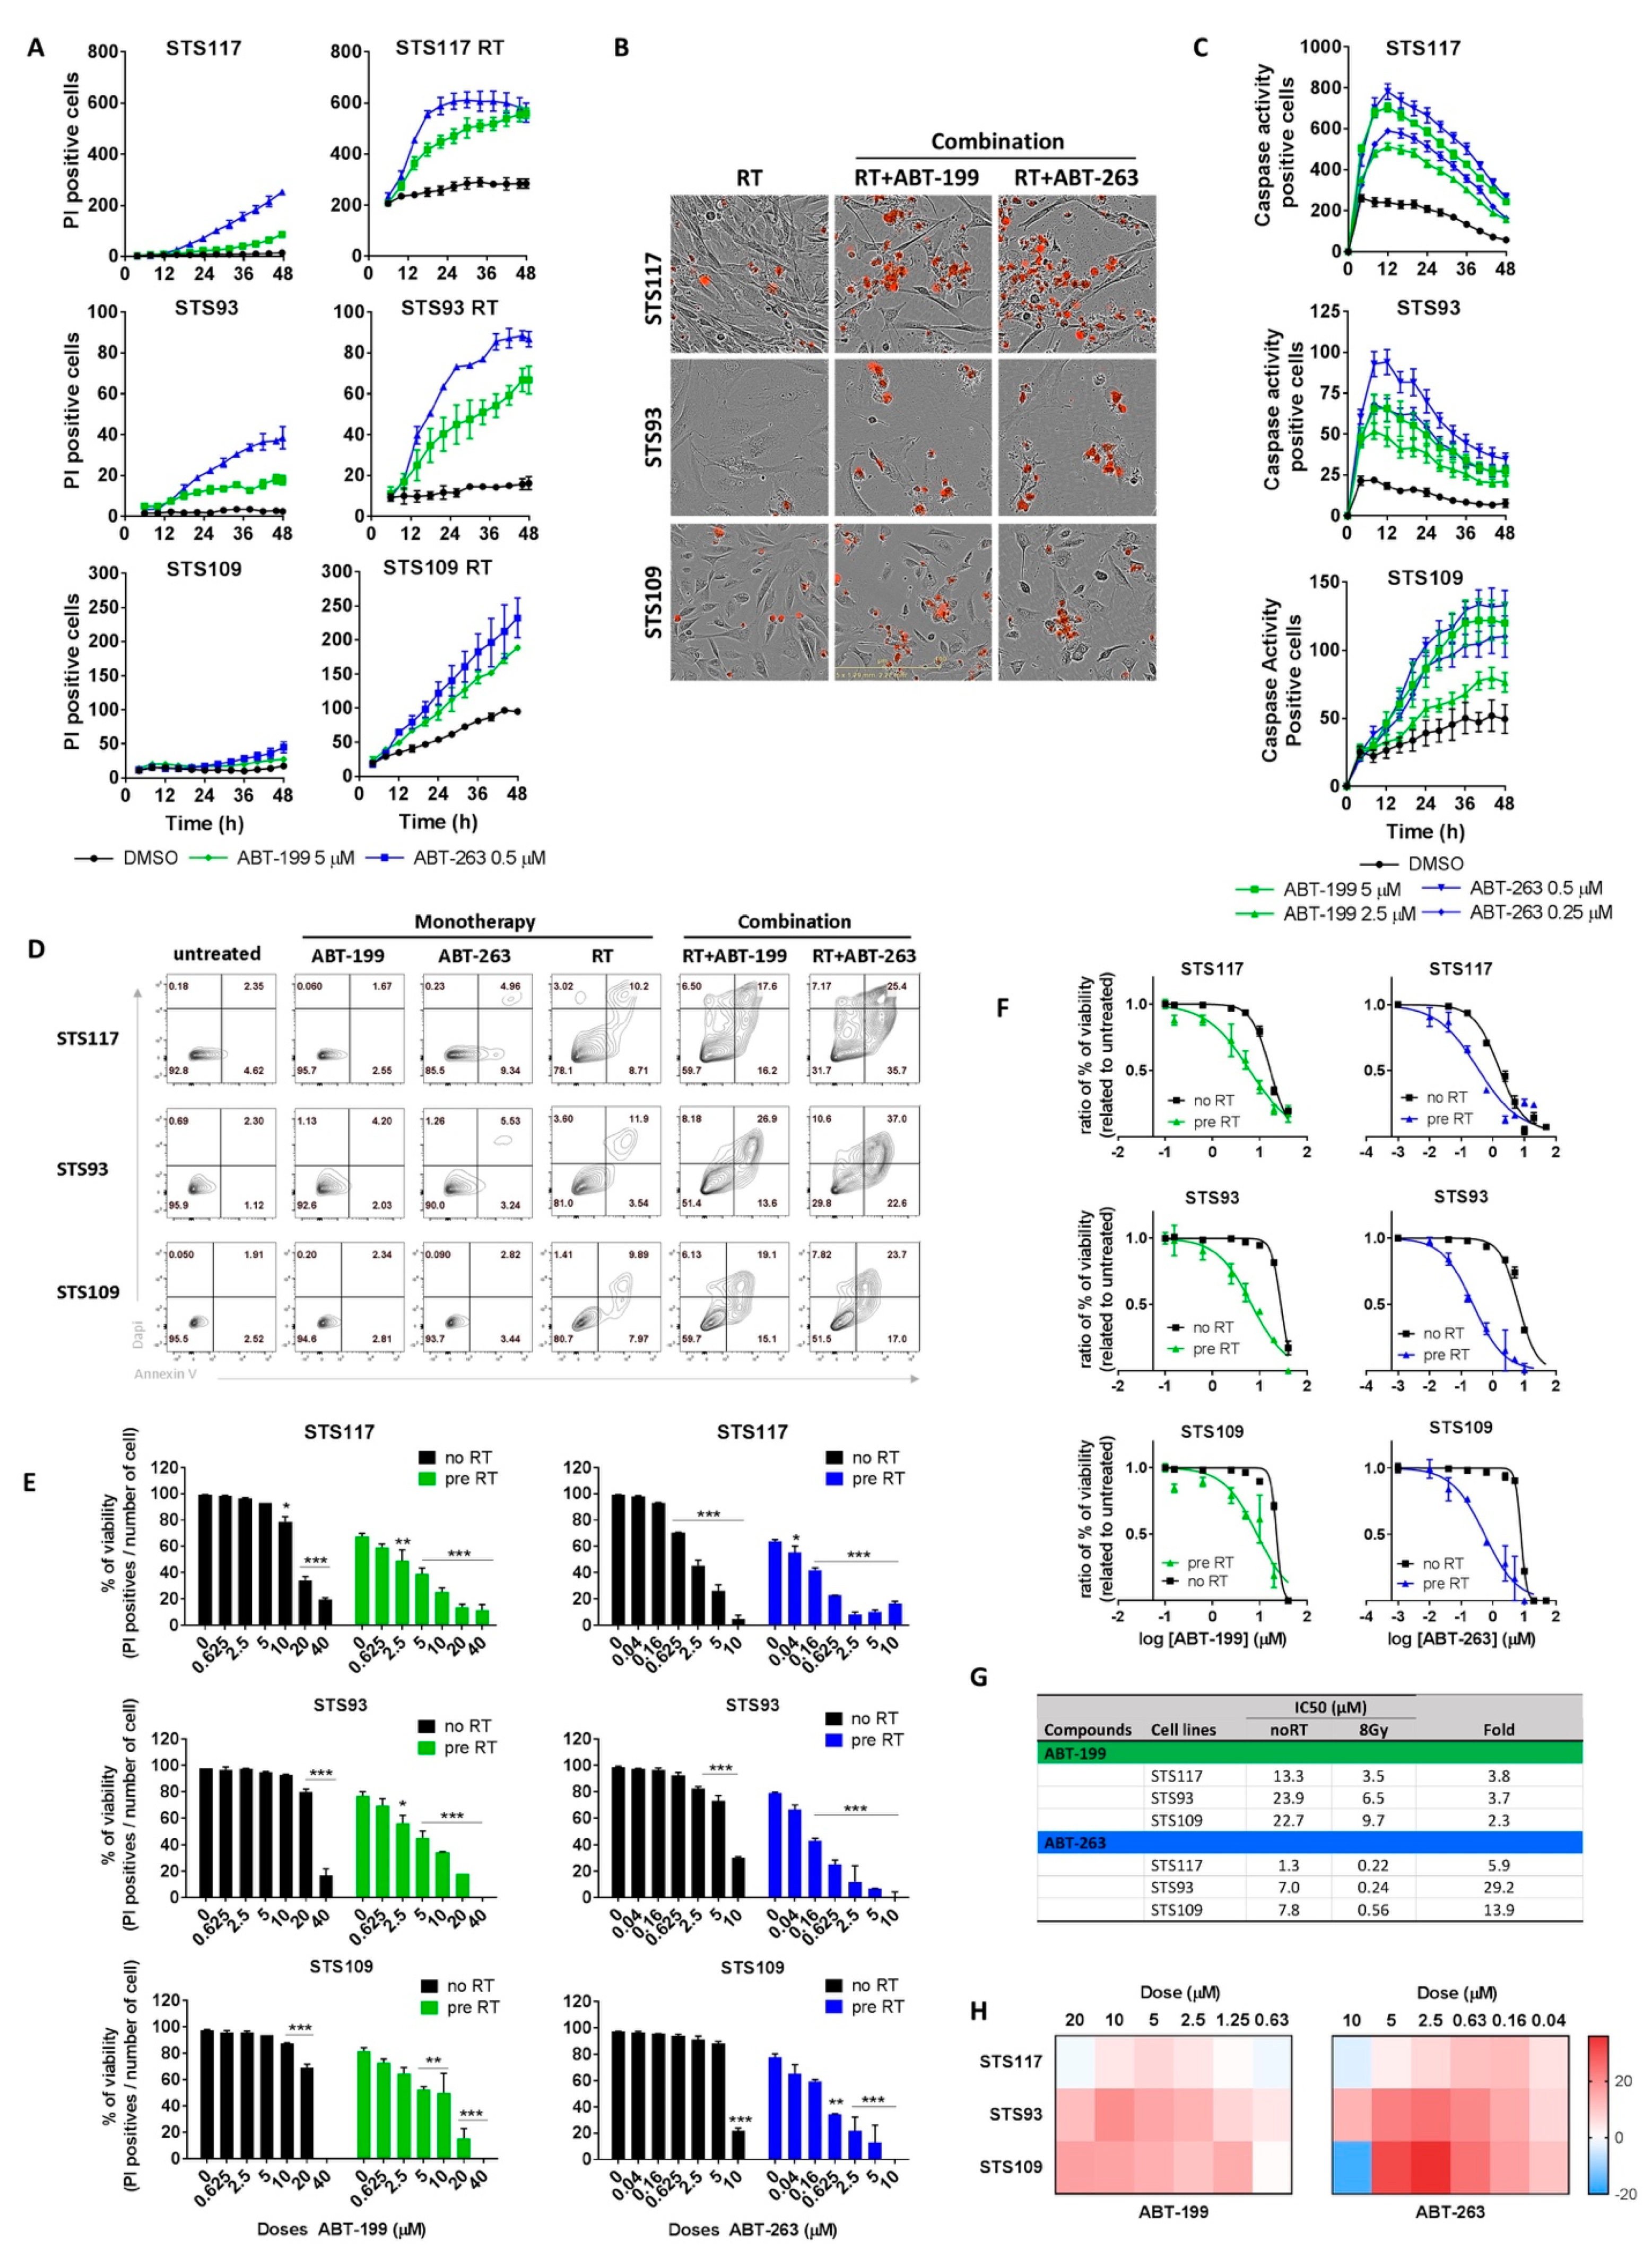
2.4. Targeting Bcl-2 Family Proteins Specifically Eliminates Irradiated Sarcoma Cells
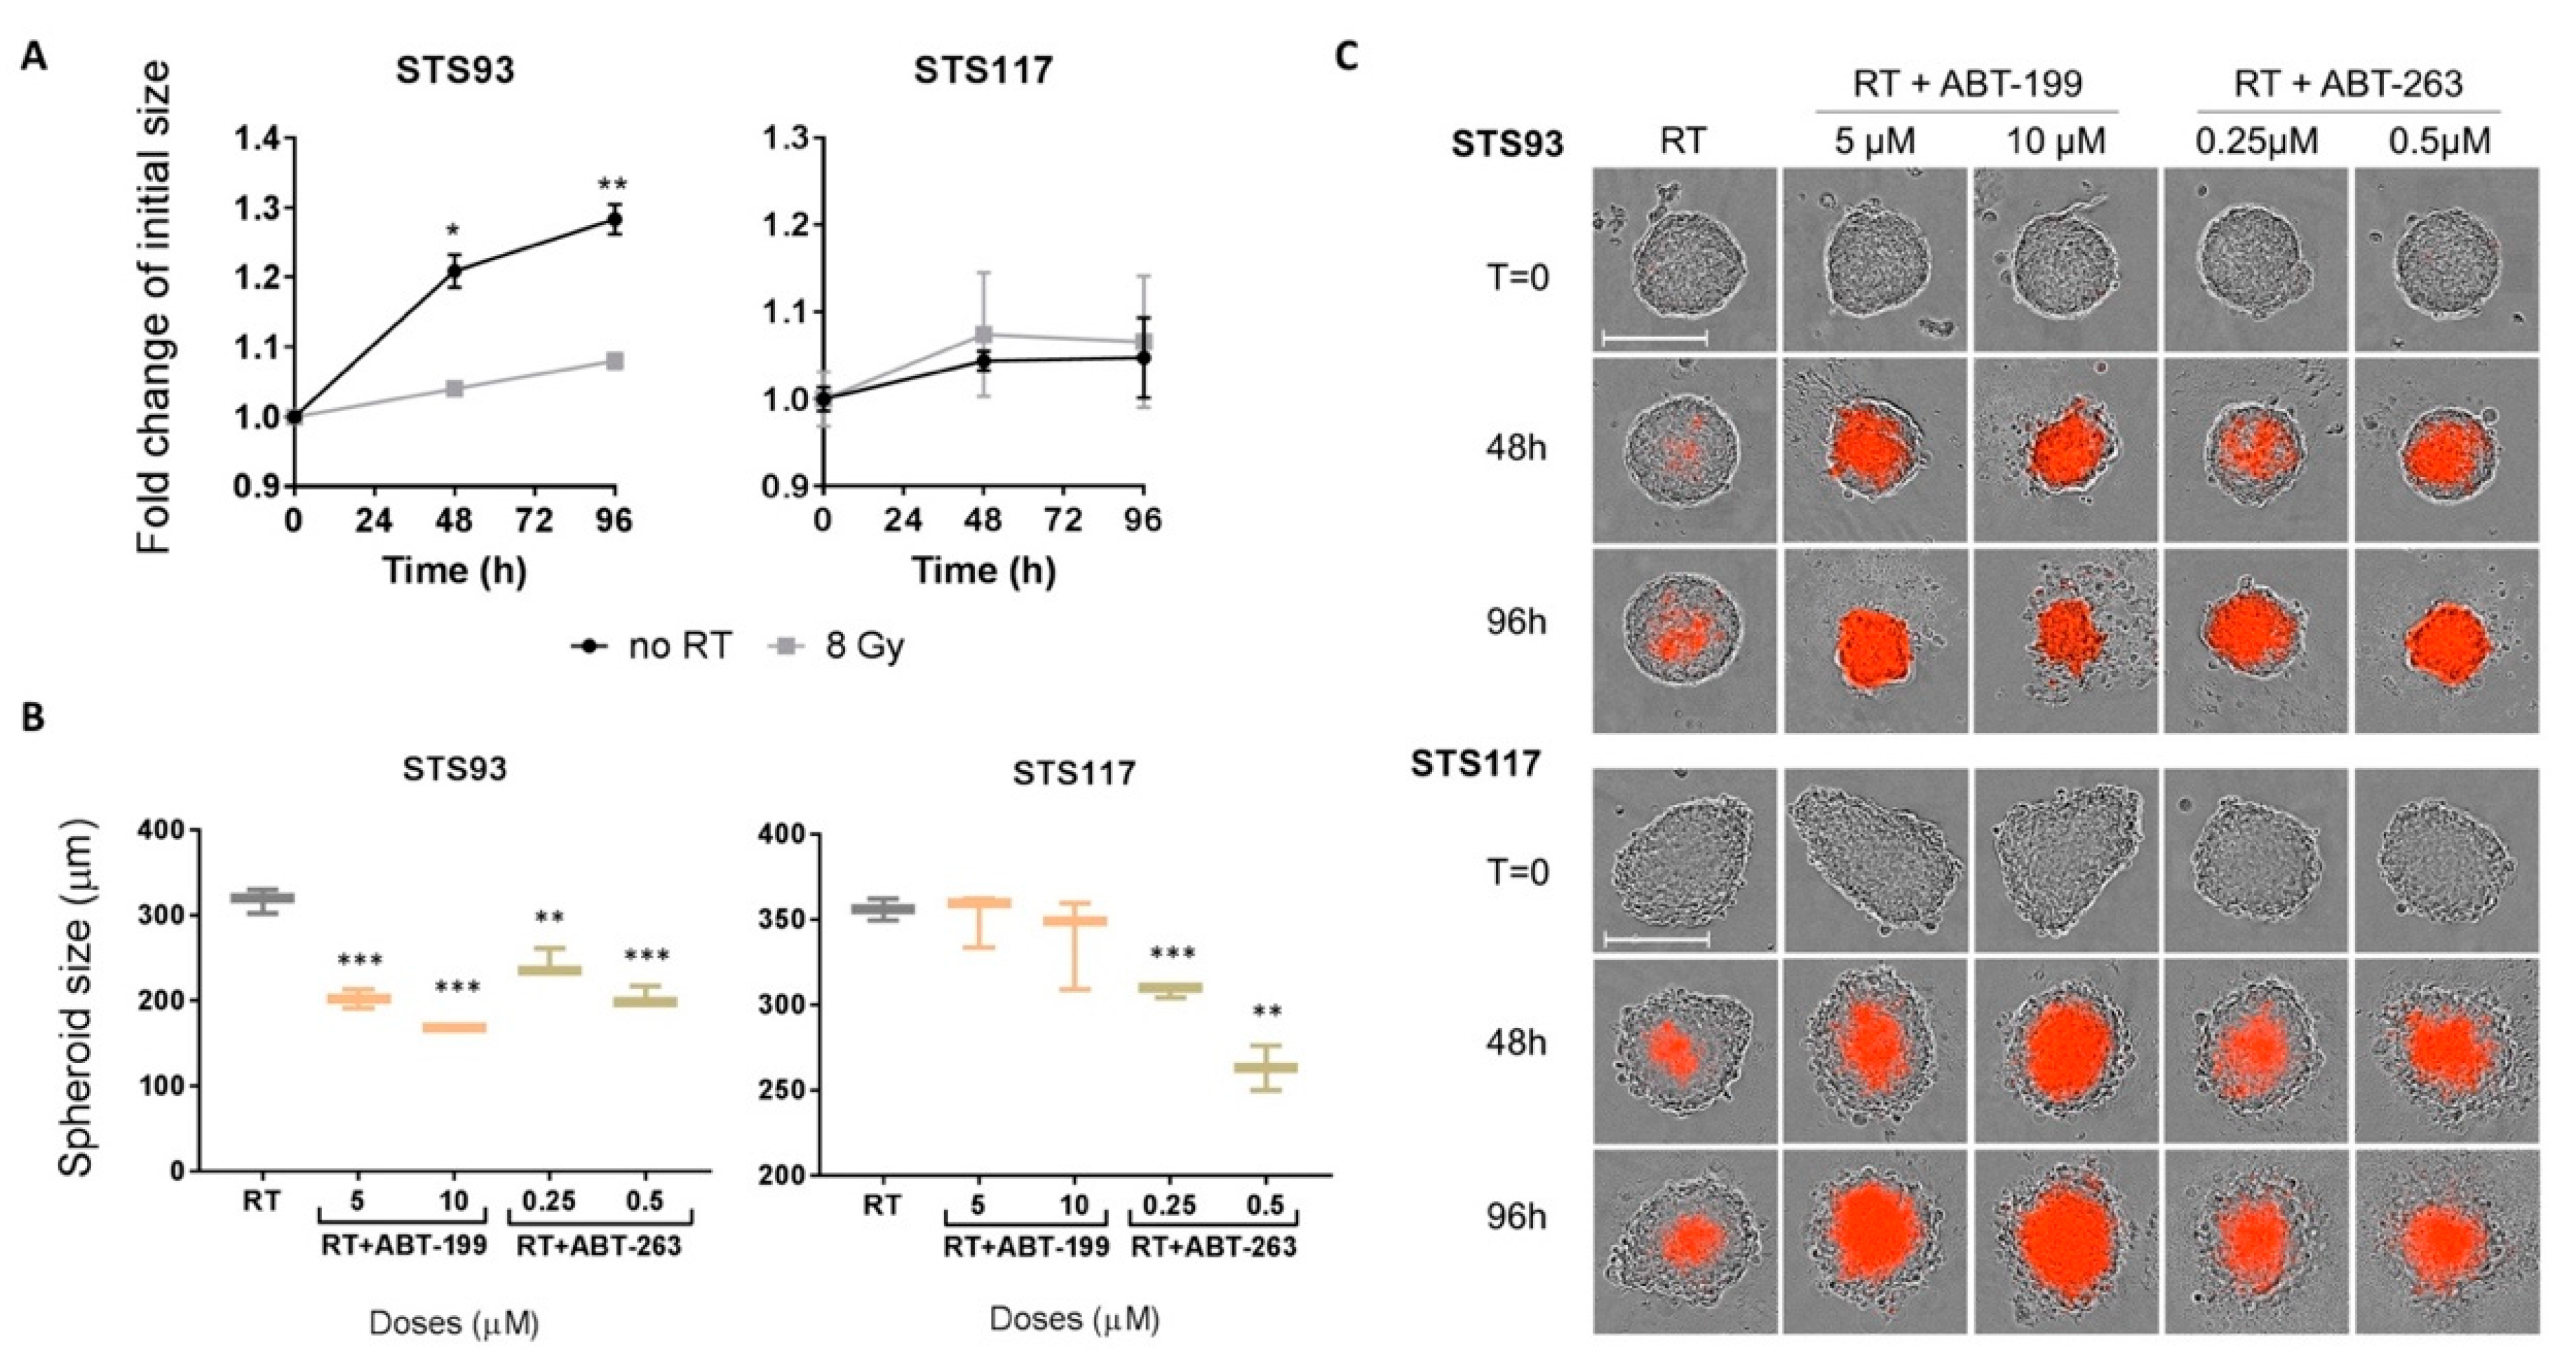
2.5. ABT-263 and ABT-199 Enhance Radiation Toxicity in a Three-Dimensional Model
3. Discussion
4. Materials and Methods
4.1. Cell Culture and Transduction
4.2. Irradiation and Senolytic Treatments
4.3. Clonogenic Assay
4.4. Cell Death and Cell Cycle Analysis by Flow Cytometry
4.5. Real-Time Imaging for Proliferation
4.6. Senescence-Associated β-Galactosidase Activity
4.7. EdU (5-Ethynyl-2′-Deoxyuridine) Detection
4.8. DNA-Damage Detection
4.9. Quantitative Real-Time PCR
4.10. List of Primers
4.11. Western Blot Analysis
4.12. Cytokine Secretion Measurement
4.13. Real-Time Imaging for Cell Death and Apoptosis
4.14. Drug Combination Analysis
4.15. 3D Cell Culture
4.16. Statistical Analysis
5. Conclusions
Supplementary Materials
Author Contributions
Funding
Institutional Review Board Statement
Informed Consent Statement
Data Availability Statement
Acknowledgments
Conflicts of Interest
Abbreviations
| 53BP1 | Tumor suppressor p53-binding protein 1 |
| Bcl-2 | B-cell lymphoma 2 |
| Bcl-xL | B-cell lymphoma-extra large |
| BH3 | Bcl-2 homology domain 3 |
| BSA | Bovine serum albumin |
| DAPI | 4′,6-diamidino-2-phenylindole fluorescent stain |
| DMEM | Dulbecco’s modified eagle medium |
| DMSO | Dimethyl sulfoxide |
| EdU | 5-Ethynyl-2’-deoxyuridine |
| FACS | Fluorescent activated cell sorting |
| FBS | Fetal bovine serum |
| FDA | Food and drug administration |
| GFP | Green fluorescent protein |
| H2B | Histone H2B |
| HRPT | Hypoxanthine Phosphoribosyltransferase 1 |
| HRP | Horseradish peroxidase |
| IL-6 | Interleukin 6 |
| IL-8 | Interleukin 8 |
| IMRT | Intensity-modulated radiation therapy |
| LR | Local recurrence |
| MCL-1 | Induced myeloid leukemia cell differentiation protein |
| PARP | Poly (ADP-ribose) polymerase |
| PBS | Phosphate-buffered saline |
| PI | Propidium iodide |
| PVDF | Polyvinylidene fluoride |
| RT | Radiation therapy |
| SASP | Senescence associated secretory phenotype |
| SA-β-gal | Senescence associated beta-galactosidase |
| SBRT | Stereotactic body radiation therapy |
| STS | Soft-tissue sarcoma |
| TBP | TATA-binding protein gene expression |
| TIS | Therapy-induced senescence |
| UPS | Undifferentiated pleomorphic sarcoma |
| γH2AX | Phosphorylated H2AX (Ser139) |
References
- Canadian Cancer Society and National Cancer Institute of Canada; Advisory Committee on Records and Registries. Canadian Canacer Statistics; Canadian Cancer Society: Toronto, ON, Canada, 2019. [Google Scholar]
- Beane, J.D.; Yang, J.C.; White, D.; Steinberg, S.M.; Rosenberg, S.A.; Rudloff, U. Efficacy of Adjuvant Radiation Therapy in the Treatment of Soft Tissue Sarcoma of the Extremity: 20-year Follow-Up of a Randomized Prospective Trial. Ann. Surg. Oncol. 2014, 21, 2484–2489. [Google Scholar] [CrossRef] [PubMed]
- O’Sullivan, B.; Davis, A.M.; Turcotte, R.; Bell, R.; Catton, C.; Chabot, P.; Wunder, J.; Kandel, R.; Goddard, K.; Sadura, A.; et al. Preoperative versus postoperative radiotherapy in soft-tissue sarcoma of the limbs: A randomised trial. Lancet 2002, 359, 2235–2241. [Google Scholar] [CrossRef]
- Rosenberg, S.A.; Tepper, J.; Glatstein, E.; Costa, J.; Baker, A.; Brennan, M.; DeMoss, E.V.; Seipp, C.; Sindelar, W.F.; Sugarbaker, P. The treatment of soft-tissue sarcomas of the extremities: Prospective randomized evaluations of (1) limb-sparing surgery plus radiation therapy compared with amputation and (2) the role of adjuvant chemotherapy. Ann. Surg. 1982, 196, 305–315. [Google Scholar] [CrossRef]
- Davis, A.M.; O’Sullivan, B.; Turcotte, R.; Bell, R.; Catton, C.; Chabot, P.; Wunder, J.; Hammond, A.; Benk, V.; Kandel, R. Late radiation morbidity following randomization to preoperative versus postoperative radiotherapy in extremity soft tissue sarcoma. Radiother. Oncol. 2005, 75, 48–53. [Google Scholar] [CrossRef]
- Diamantis, A.; Baloyiannis, I.; Magouliotis, D.E.; Tolia, M.; Symeonidis, D.; Bompou, E.; Polymeneas, G.; Tepetes, K. Perioperative radiotherapy versus surgery alone for retroperitoneal sarcomas: A systematic review and meta-analysis. Radiol. Oncol. 2020, 54, 14–21. [Google Scholar] [CrossRef] [Green Version]
- Greto, D.; Livi, L.; Saieva, C.; Bonomo, P.; Meattini, I.; Loi, M.; Di Brina, L.; Beltrami, G.; Campanacci, D.; Scoccianti, G.; et al. Neoadjuvant treatment of soft tissue sarcoma. Radiol. Med. 2013, 119, 195–200. [Google Scholar] [CrossRef]
- Wong, P.; Dickie, C.; Lee, D.; Chung, P.; O’Sullivan, B.; Letourneau, D.; Xu, W.; Swallow, C.; Gladdy, R.; Catton, C. Spatial and volumetric changes of retroperitoneal sarcomas during pre-operative radiotherapy. Radiother. Oncol. 2014, 112, 308–313. [Google Scholar] [CrossRef]
- Canter, R.J.; Martinez, S.R.; Tamurian, R.M.; Wilton, M.; Li, C.S.; Ryu, J.; Mak, W.; Monsky, W.L.; Borys, D. Radiographic and histologic response to neoadjuvant radiotherapy in patients with soft tissue sarcoma. Ann. Surg. Oncol. 2010, 17, 2578–2584. [Google Scholar] [CrossRef] [Green Version]
- Gui, C.; Morris, C.D.; Meyer, C.F.; Levin, A.S.; Frassica, D.A.; Deville, C.; Terezakis, S.A. Characterization and predictive value of volume changes of extremity and pelvis soft tissue sarcomas during radiation therapy prior to definitive wide excision. Radiat. Oncol. J. 2019, 37, 117–126. [Google Scholar] [CrossRef]
- Roberge, D.; Skamene, T.; Nahal, A.; Turcotte, R.E.; Powell, T.; Freeman, C. Radiological and pathological response following pre-operative radiotherapy for soft-tissue sarcoma. Radiother. Oncol. 2010, 97, 404–407. [Google Scholar] [CrossRef]
- Lauber, K.; Ernst, A.; Orth, M.; Herrmann, M.; Belka, C. Dying cell clearance and its impact on the outcome of tumor radiotherapy. Front. Oncol. 2012, 2, 116. [Google Scholar] [CrossRef] [Green Version]
- Wong, P.; Houghton, P.; Kirsch, D.G.; Finkelstein, S.E.; Monjazeb, A.M.; Xu-Welliver, M.; Dicker, A.P.; Ahmed, M.; Vikram, B.; Teicher, B.A.; et al. Combining Targeted Agents With Modern Radiotherapy in Soft Tissue Sarcomas. J. Natl. Cancer Inst. 2014, 106, dju329. [Google Scholar] [CrossRef] [Green Version]
- Rebbaa, A.; Zheng, X.; Chou, P.M.; Mirkin, B.L. Caspase inhibition switches doxorubicin-induced apoptosis to senescence. Oncogene 2003, 22, 2805–2811. [Google Scholar] [CrossRef] [Green Version]
- Chang, B.D.; Broude, E.V.; Dokmanovic, M.; Zhu, H.; Ruth, A.; Xuan, Y.; Kandel, E.S.; Lausch, E.; Christov, K.; Roninson, I.B. A senescence-like phenotype distinguishes tumor cells that undergo terminal proliferation arrest after exposure to anticancer agents. Cancer Res. 1999, 59, 3761–3767. [Google Scholar]
- Eriksson, D.; Stigbrand, T. Radiation-induced cell death mechanisms. Tumor Biol. 2010, 31, 363–372. [Google Scholar] [CrossRef]
- Te Poele, R.H.; Okorokov, A.L.; Jardine, L.; Cummings, J.; Joel, S.P. DNA damage is able to induce senescence in tumor cells in vitro and in vivo. Cancer Res. 2002, 62, 1876–1883. [Google Scholar]
- Gewirtz, D.A.; Holt, S.E.; Elmore, L.W. Accelerated senescence: An emerging role in tumor cell response to chemotherapy and radiation. Biochem. Pharmacol. 2008, 76, 947–957. [Google Scholar] [CrossRef]
- Patel, N.H.; Sohal, S.S.; Manjili, M.H.; Harrell, J.C.; Gewirtz, D.A. The Roles of Autophagy and Senescence in the Tumor Cell Response to Radiation. Radiat. Res. 2020, 194, 103–115. [Google Scholar] [CrossRef]
- Di Fagagna, F.D.A.; Reaper, P.M.; Clay-Farrace, L.; Fiegler, H.; Carr, P.; Von Zglinicki, T.; Saretzki, G.; Carter, N.P.; Jackson, S.P. A DNA damage checkpoint response in telomere-initiated senescence. Nature 2003, 426, 194–198. [Google Scholar] [CrossRef]
- Beauséjour, C.M.; Krtolica, A.; Galimi, F.; Narita, M.; Lowe, S.W.; Yaswen, P.; Campisi, J. Reversal of human cellular senescence: Roles of the p53 and p16 pathways. EMBO J. 2003, 22, 4212–4222. [Google Scholar] [CrossRef]
- Dimri, G.P.; Lee, X.; Basile, G.; Acosta, M.; Scott, G.; Roskelley, C.; Medrano, E.E.; Linskens, M.; Rubelj, I.; Pereira-Smith, O.; et al. A biomarker that identifies senescent human cells in culture and in aging skin in vivo. Proc. Natl. Acad. Sci. USA 1995, 92, 9363–9367. [Google Scholar] [CrossRef] [Green Version]
- Itahana, K.; Campisi, J.; Dimri, G.P. Methods to detect biomarkers of cellular senescence: The senescence-associated beta-galactosidase assay. Methods Mol. Biol. 2007, 371, 21–31. [Google Scholar]
- Rodier, F.; Coppé, J.-P.; Patil, C.K.; Hoeijmakers, W.A.M.; Muñoz, D.P.; Raza, S.R.; Freund, A.; Campeau, E.; Davalos, A.R.; Campisi, J. Persistent DNA damage signalling triggers senescence-associated inflammatory cytokine secretion. Nat. Cell Biol. 2009, 11, 973–979. [Google Scholar] [CrossRef]
- Rodier, F.; Muñoz, D.P.; Teachenor, R.; Chu, V.; Le, O.; Bhaumik, D.; Coppé, J.-P.; Campeau, E.; Beauséjour, C.M.; Kim, S.-H.; et al. DNA-SCARS: Distinct nuclear structures that sustain damage-induced senescence growth arrest and inflammatory cytokine secretion. J. Cell Sci. 2010, 124, 68–81. [Google Scholar] [CrossRef] [Green Version]
- Acosta, J.C.; O’Loghlen, A.; Banito, A.; Guijarro, M.V.; Augert, A.; Raguz, S.; Fumagalli, M.; Da Costa, M.; Brown, C.; Popov, N.; et al. Chemokine Signaling via the CXCR2 Receptor Reinforces Senescence. Cell 2008, 133, 1006–1018. [Google Scholar] [CrossRef] [Green Version]
- Kuilman, T.; Michaloglou, C.; Vredeveld, L.C.; Douma, S.; Van Doorn, R.; Desmet, C.J.; Aarden, L.A.; Mooi, W.J.; Peeper, D.S. Oncogene-Induced Senescence Relayed by an Interleukin-Dependent Inflammatory Network. Cell 2008, 133, 1019–1031. [Google Scholar] [CrossRef] [Green Version]
- Coppé, J.-P.; Patil, C.K.; Rodier, F.; Sun, Y.; Muñoz, D.P.; Goldstein, J.N.; Nelson, P.S.; Desprez, P.-Y.; Campisi, J. Senescence-Associated Secretory Phenotypes Reveal Cell-Nonautonomous Functions of Oncogenic RAS and the p53 Tumor Suppressor. PLoS Biol. 2008, 6, e301. [Google Scholar] [CrossRef]
- Hernandez-Segura, A.; Nehme, J.; DeMaria, M. Hallmarks of Cellular Senescence. Trends Cell Biol. 2018, 28, 436–453. [Google Scholar] [CrossRef]
- Wang, E. Senescent human fibroblasts resist programmed cell death, and failure to suppress bcl2 is involved. Cancer Res. 1995, 55, 2284–2292. [Google Scholar]
- Soto-Gamez, A.; Quax, W.J.; DeMaria, M. Regulation of Survival Networks in Senescent Cells: From Mechanisms to Interventions. J. Mol. Biol. 2019, 431, 2629–2643. [Google Scholar] [CrossRef]
- Rea, I.M.; Gibson, D.S.; McGilligan, V.; McNerlan, S.E.; Alexander, H.D.; Ross, O.A. Age and Age-Related Diseases: Role of Inflammation Triggers and Cytokines. Front. Immunol. 2018, 9, 586. [Google Scholar] [CrossRef]
- Milanovic, M.; Fan, D.N.Y.; Belenki, D.; Däbritz, J.H.M.; Zhao, Z.; Yu, Y.; Dörr, J.R.; Dimitrova, L.; Lenze, D.; Barbosa, I.A.M.; et al. Senescence-associated reprogramming promotes cancer stemness. Nat. Cell Biol. 2018, 553, 96–100. [Google Scholar] [CrossRef] [Green Version]
- Lee, S.; Schmitt, C.A. The dynamic nature of senescence in cancer. Nat. Cell Biol. 2019, 21, 94–101. [Google Scholar] [CrossRef]
- Ruhland, M.K.; Loza, A.J.; Capietto, A.-H.; Luo, X.; Knolhoff, B.L.; Flanagan, K.C.; Belt, B.A.; Alspach, E.; Leahy, K.; Luo, J.; et al. Stromal senescence establishes an immunosuppressive microenvironment that drives tumorigenesis. Nat. Commun. 2016, 7, 11762. [Google Scholar] [CrossRef]
- Zhu, Y.; Tchkonia, T.; Pirtskhalava, T.; Gower, A.C.; Ding, H.; Giorgadze, N.; Palmer, A.K.; Ikeno, Y.; Hubbard, G.B.; Lenburg, M.E.; et al. The Achilles’ heel of senescent cells: From transcriptome to senolytic drugs. Aging Cell 2015, 14, 644–658. [Google Scholar] [CrossRef]
- Chang, J.; Wang, Y.; Shao, L.; Laberge, R.-M.; DeMaria, M.; Campisi, J.; Janakiraman, K.; Sharpless, N.E.; Ding, S.; Feng, W.; et al. Clearance of senescent cells by ABT263 rejuvenates aged hematopoietic stem cells in mice. Nat. Med. 2016, 22, 78–83. [Google Scholar] [CrossRef] [Green Version]
- Wang, L.; De Oliveira, R.L.; Wang, C.; Neto, J.M.F.; Mainardi, S.; Evers, B.; Lieftink, C.; Morris, B.; Jochems, F.; Willemsen, L.; et al. High-Throughput Functional Genetic and Compound Screens Identify Targets for Senescence Induction in Cancer. Cell Rep. 2017, 21, 773–783. [Google Scholar] [CrossRef] [Green Version]
- Yosef, R.; Pilpel, N.; Tokarsky-Amiel, R.; Biran, A.; Ovadya, Y.; Cohen, S.; Vadai, E.; Dassa, L.; Shahar, E.; Condiotti, R.; et al. Directed elimination of senescent cells by inhibition of BCL-W and BCL-XL. Nat. Commun. 2016, 7, 11190. [Google Scholar] [CrossRef]
- Pan, J.; Li, D.; Xu, Y.; Zhang, J.; Wang, Y.; Chen, M.; Lin, S.; Huang, L.; Chung, E.J.; Citrin, D.E.; et al. Inhibition of Bcl-2/xl With ABT-263 Selectively Kills Senescent Type II Pneumocytes and Reverses Persistent Pulmonary Fibrosis Induced by Ionizing Radiation in Mice. Int. J. Radiat. Oncol. 2017, 99, 353–361. [Google Scholar] [CrossRef]
- Lagares, D.; Santos, A.; Grasberger, P.E.; Liu, F.; Probst, C.K.; Rahimi, R.A.; Sakai, N.; Kuehl, T.; Ryan, J.A.; Bhola, P.; et al. Targeted apoptosis of myofibroblasts with the BH3 mimetic ABT-263 reverses established fibrosis. Sci. Transl. Med. 2017, 9, eaal3765. [Google Scholar] [CrossRef] [Green Version]
- Fleury, H.; Malaquin, N.; Tu, V.; Gilbert, S.; Martinez, A.; Olivier, M.; Sauriol, A.; Communal, L.; Leclerc-Desaulniers, K.; Carmona, E.; et al. Exploiting interconnected synthetic lethal interactions between PARP inhibition and cancer cell reversible senescence. Nat. Commun. 2019, 10, 1–15. [Google Scholar] [CrossRef] [PubMed] [Green Version]
- Wong, P.; Hui, A.; Su, J.; Yue, S.; Haibe-Kains, B.; Gokgoz, N.; Xu, W.; Bruce, J.; Williams, J.; Catton, C.; et al. Prognostic microRNAs modulate the RHO adhesion pathway: A potential therapeutic target in undifferentiated pleomorphic sarcomas. Oncotarget 2015, 6, 39127–39139. [Google Scholar] [CrossRef] [PubMed] [Green Version]
- Patra, B.; Lafontaine, J.; Bavoux, M.; Zerouali, K.; Glory, A.; Ahanj, M.; Carrier, J.-F.; Gervais, T.; Wong, P. On-chip combined radiotherapy and chemotherapy testing on soft-tissue sarcoma spheroids to study cell death using flow cytometry and clonogenic assay. Sci. Rep. 2019, 9, 2214. [Google Scholar] [CrossRef] [PubMed]
- Bavous, M.; Kamio, Y.; Vigneux-Foley, E.; Lafontaine, J.; Najyb, O.; Refet, E.; Carrier, J.-F.; Gervais, T.; Wong, P. X-Ray on chip: Quantifying therapeutic synergies between radiotherapy and anticancer drugs using soft tissue sarcoma tumor spheroids. Radiother. Oncol. 2021, Accepted. [Google Scholar]
- Xu, B.; Sun, Z.; Liu, Z.; Guo, H.; Liu, Q.; Jiang, H.; Zou, Y.; Gong, Y.; Tischfield, J.A.; Shao, C. Replication Stress Induces Micronuclei Comprising of Aggregated DNA Double-Strand Breaks. PLoS ONE 2011, 6, e18618. [Google Scholar] [CrossRef] [PubMed] [Green Version]
- Ryu, S.J.; Oh, Y.S.; Park, S.C. Failure of stress-induced downregulation of Bcl-2 contributes to apoptosis resistance in senescent human diploid fibroblasts. Cell Death Differ. 2007, 14, 1020–1028. [Google Scholar] [CrossRef] [Green Version]
- Zhu, Y.; Tchkonia, T.; Fuhrmann-Stroissnigg, H.; Dai, H.M.; Ling, Y.Y.; Stout, M.B.; Pirtskhalava, T.; Giorgadze, N.; Johnson, K.O.; Giles, C.B.; et al. Identification of a novel senolytic agent, navitoclax, targeting the Bcl-2 family of anti-apoptotic factors. Aging Cell 2016, 15, 428–435. [Google Scholar] [CrossRef]
- Tse, C.; Shoemaker, A.R.; Adickes, J.; Anderson, M.G.; Chen, J.; Jin, S.; Johnson, E.F.; Marsh, K.C.; Mitten, M.J.; Nimmer, P.; et al. ABT-263: A Potent and Orally Bioavailable Bcl-2 Family Inhibitor. Cancer Res. 2008, 68, 3421–3428. [Google Scholar] [CrossRef] [Green Version]
- Souers, A.J.; Leverson, J.D.; Boghaert, E.R.; Ackler, S.L.; Catron, N.D.; Chen, J.; Dayton, B.D.; Ding, H.; Enschede, S.H.; Fairbrother, W.J.; et al. ABT-199, a potent and selective BCL-2 inhibitor, achieves antitumor activity while sparing platelets. Nat. Med. 2013, 19, 202–208. [Google Scholar] [CrossRef]
- Teicher, B.A.; Polley, E.; Kunkel, M.; Evans, D.; Silvers, T.; Delosh, R.; Laudeman, J.; Ogle, C.; Reinhart, R.; Selby, M. Sarcoma Cell Line Screen of Oncology Drugs and Investigational Agents Identifies Patterns Associated with Gene and microRNA Expression. Mol. Cancer Ther. 2015, 14, 2452–2462. [Google Scholar] [CrossRef] [Green Version]
- Leverson, J.D.; Phillips, D.C.; Mitten, M.J.; Boghaert, E.R.; Diaz, D.; Tahir, S.K.; Belmont, L.D.; Nimmer, P.; Xiao, Y.; Ma, X.M.; et al. Exploiting selective BCL-2 family inhibitors to dissect cell survival dependencies and define improved strategies for cancer therapy. Sci. Transl. Med. 2015, 7, 279ra40. [Google Scholar] [CrossRef] [PubMed]
- Bansal, M.; Yang, J.; Karan, C.; Menden, M.P.; Costello, J.C.; Tang, H.; Xiao, G.; Li, Y.; Allen, J.; Zhong, R.; et al. A community computational challenge to predict the activity of pairs of compounds. Nat. Biotechnol. 2014, 32, 1213–1222. [Google Scholar] [CrossRef] [PubMed]
- Han, K.; Pierce, S.E.; Li, A.; Spees, K.; Anderson, G.R.; Seoane, J.A.; Lo, Y.-H.; Dubreuil, M.; Olivas, M.; Kamber, R.A.; et al. CRISPR screens in cancer spheroids identify 3D growth-specific vulnerabilities. Nat. Cell Biol. 2020, 580, 136–141. [Google Scholar] [CrossRef] [PubMed]
- Virgone-Carlotta, A.; Lemasson, M.; Mertani, H.C.; Diaz, J.-J.; Monnier, S.; Dehoux, T.; Delanoë-Ayari, H.; Rivière, C.; Rieu, J.-P. In-depth phenotypic characterization of multicellular tumor spheroids: Effects of 5-Fluorouracil. PLoS ONE 2017, 12, e0188100. [Google Scholar] [CrossRef] [PubMed] [Green Version]
- Blay, J.-Y.; Honoré, C.; Stoeckle, E.; Meeus, P.; Jafari, M.; Gouin, F.; Anract, P.; Ferron, G.; Rochwerger, A.; Ropars, M.; et al. Surgery in reference centers improves survival of sarcoma patients: A nationwide study. Ann. Oncol. 2019, 30, 1143–1153. [Google Scholar] [CrossRef]
- Feeney, G.; Sehgal, R.; Sheehan, M.; Hogan, A.; Regan, M.; Joyce, M.; Kerin, M. Neoadjuvant radiotherapy for rectal cancer management. World J. Gastroenterol. 2019, 25, 4850–4869. [Google Scholar] [CrossRef]
- Wang, X.; Yin, C.; Su, S.; Li, X.; Wang, C.; Zhang, C.; Liu, M. Long-term effects of neoadjuvant radiotherapy, adjuvant radiotherapy, and chemotherapy-only on survival of locally advanced non-small cell lung Cancer undergoing surgery: A propensity-matched analysis. BMC Cancer 2018, 18, 1–9. [Google Scholar] [CrossRef] [Green Version]
- Singh, P.; Hoffman, K.; Schaverien, M.V.; Krause, K.J.; Butler, C.; Smith, B.D.; Kuerer, H.M. Neoadjuvant Radiotherapy to Facilitate Immediate Breast Reconstruction: A Systematic Review and Current Clinical Trials. Ann. Surg. Oncol. 2019, 26, 3312–3320. [Google Scholar] [CrossRef]
- Gandhi, L.; Camidge, D.R.; De Oliveira, M.R.; Bonomi, P.; Gandara, D.; Khaira, D.; Hann, C.L.; McKeegan, E.M.; Litvinovich, E.; Hemken, P.M.; et al. Phase I Study of Navitoclax (ABT-263), a Novel Bcl-2 Family Inhibitor, in Patients With Small-Cell Lung Cancer and Other Solid Tumors. J. Clin. Oncol. 2011, 29, 909–916. [Google Scholar] [CrossRef] [Green Version]
- Oltersdorf, T.; Elmore, S.W.; Shoemaker, A.R.; Armstrong, R.C.; Augeri, D.J.; Belli, B.A.; Bruncko, M.; Deckwerth, T.L.; Dinges, J.; Hajduk, P.J.; et al. An inhibitor of Bcl-2 family proteins induces regression of solid tumours. Nat. Cell Biol. 2005, 435, 677–681. [Google Scholar] [CrossRef]
- Wilson, W.H.; O’Connor, O.A.; Czuczman, M.S.; LaCasce, A.S.; Gerecitano, J.F.; Leonard, J.P.; Tulpule, A.; Dunleavy, K.; Xiong, H.; Chiu, Y.-L.; et al. Navitoclax, a targeted high-affinity inhibitor of BCL-2, in lymphoid malignancies: A phase 1 dose-escalation study of safety, pharmacokinetics, pharmacodynamics, and antitumour activity. Lancet Oncol. 2010, 11, 1149–1159. [Google Scholar] [CrossRef] [Green Version]
- Zhang, H.; Nimmer, P.; Tahir, S.K.; Chen, J.; Fryer, R.M.; Hahn, K.R.; Iciek, L.A.; Morgan, S.J.; Nasarre, M.C.; Nelson, R.J.; et al. Bcl-2 family proteins are essential for platelet survival. Cell Death Differ. 2007, 14, 943–951. [Google Scholar] [CrossRef]
- Vandenberg, C.J.; Cory, S. ABT-199, a new Bcl-2–specific BH3 mimetic, has in vivo efficacy against aggressive Myc-driven mouse lymphomas without provoking thrombocytopenia. Blood 2013, 121, 2285–2288. [Google Scholar] [CrossRef]
- Pan, R.; Hogdal, L.J.; Benito, J.M.; Bucci, D.; Han, L.; Borthakur, G.; Cortes, J.; DeAngelo, D.J.; DeBose, L.; Mu, H.; et al. Selective BCL-2 Inhibition by ABT-199 Causes On-Target Cell Death in Acute Myeloid Leukemia. Cancer Discov. 2014, 4, 362–375. [Google Scholar] [CrossRef] [Green Version]
- Whittle, J.R.; Vaillant, F.; Surgenor, E.; Policheni, A.N.; Giner, G.; Capaldo, B.D.; Chen, H.R.; Liu, H.K.; Dekkers, J.F.; Sachs, N.; et al. Dual Targeting of CDK4/6 and BCL2 Pathways Augments Tumor Response in Estrogen Receptor-Positive Breast Cancer. Clin. Cancer Res. 2020, 26, 4120–4134. [Google Scholar] [CrossRef] [Green Version]
- Cang, S.; Iragavarapu, C.; Savooji, J.; Song, Y.; Liu, D. ABT-199 (venetoclax) and BCL-2 inhibitors in clinical development. J. Hematol. Oncol. 2015, 8, 129. [Google Scholar] [CrossRef]
- Roberts, A.W.; Davids, M.S.; Pagel, J.M.; Kahl, B.S.; Puvvada, S.D.; Gerecitano, J.F.; Kipps, T.J.; Anderson, M.A.; Brown, J.R.; A Gressick, L.; et al. Targeting BCL2 with Venetoclax in Relapsed Chronic Lymphocytic Leukemia. N. Engl. J. Med. 2016, 374, 311–322. [Google Scholar] [CrossRef]
- Salem, A.H.; Agarwal, S.K.; Dunbar, M.; Enschede, S.L.H.; Humerickhouse, R.A.; Wong, S.L. Pharmacokinetics of Venetoclax, a Novel BCL-2 Inhibitor, in Patients With Relapsed or Refractory Chronic Lymphocytic Leukemia or Non-Hodgkin Lymphoma. J. Clin. Pharmacol. 2017, 57, 484–492. [Google Scholar] [CrossRef]
- Lok, S.W.; Whittle, J.R.; Vaillant, F.; Teh, C.E.; Lo, L.L.; Policheni, A.N.; Bergin, A.R.T.; Desai, J.; Ftouni, S.; Gandolfo, L.C.; et al. A Phase Ib Dose-Escalation and Expansion Study of the BCL2 Inhibitor Venetoclax Combined with Tamoxifen in ER and BCL2–Positive Metastatic Breast Cancer. Cancer Discov. 2018, 9, 354–369. [Google Scholar] [CrossRef]
- Ashkenazi, A.; Fairbrother, W.J.; Leverson, J.D.; Souers, A.J. From basic apoptosis discoveries to advanced selective BCL-2 family inhibitors. Nat. Rev. Drug Discov. 2017, 16, 273–284. [Google Scholar] [CrossRef]
- Kotschy, A.; Szlavik, Z.; Murray, J.; Davidson, J.; Maragno, A.L.; Le Toumelin-Braizat, G.; Chanrion, M.; Kelly, G.L.; Gong, J.-N.; Moujalled, D.M.; et al. The MCL1 inhibitor S63845 is tolerable and effective in diverse cancer models. Nature 2016, 538, 477–482. [Google Scholar] [CrossRef]
- Leverson, J.D.; Zhang, H.; Chen, J.; Tahir, S.K.; Phillips, D.C.; Xue, J.; Nimmer, P.; Jin, S.; Smith, M.T.; Xiao, Y.; et al. Potent and selective small-molecule MCL-1 inhibitors demonstrate on-target cancer cell killing activity as single agents and in combination with ABT-263 (navitoclax). Cell Death Dis. 2015, 6, e1590. [Google Scholar] [CrossRef] [Green Version]
- Caenepeel, S.; Brown, S.P.; Belmontes, B.; Moody, G.; Keegan, K.S.; Chui, D.; Whittington, D.A.; Huang, X.; Poppe, L.; Cheng, A.C.; et al. AMG 176, a Selective MCL1 Inhibitor, is Effective in Hematological Cancer Models Alone and in Combination with Established Therapies. Cancer Discov. 2018, 8, CD-18. [Google Scholar] [CrossRef] [Green Version]
- Tron, A.E.; Belmonte, M.A.; Adam, A.; Aquila, B.M.; Boise, L.H.; Chiarparin, E.; Cidado, J.; Embrey, K.J.; Gangl, E.; Gibbons, F.D.; et al. Discovery of Mcl-1-specific inhibitor AZD5991 and preclinical activity in multiple myeloma and acute myeloid leukemia. Nat. Commun. 2018, 9, 1–14. [Google Scholar] [CrossRef]
- Inoue-Yamauchi, A.; Jeng, P.S.; Kim, K.; Chen, H.-C.; Han, S.; Ganesan, Y.T.; Ishizawa, K.; Jebiwott, S.; Dong, Y.; Pietanza, M.C.; et al. Targeting the differential addiction to anti-apoptotic BCL-2 family for cancer therapy. Nat. Commun. 2017, 8, 16078. [Google Scholar] [CrossRef]
- Tahir, S.K.; Smith, M.L.; Hessler, P.; Rapp, L.R.; Idler, K.B.; Park, C.H.; Leverson, J.D.; Lam, L.T. Potential mechanisms of resistance to venetoclax and strategies to circumvent it. BMC Cancer 2017, 17, 1–10. [Google Scholar] [CrossRef]
- Lee, E.F.; Harris, T.J.; Tran, S.; Evangelista, M.; Arulananda, S.; John, T.; Ramnac, C.; Hobbs, C.; Zhu, H.; Gunasingh, G.; et al. BCL-XL and MCL-1 are the key BCL-2 family proteins in melanoma cell survival. Cell Death Dis. 2019, 10, 1–14. [Google Scholar] [CrossRef]
- Chang, B.-D.; Swift, M.E.; Shen, M.; Fang, J.; Broude, E.V.; Roninson, I.B. Molecular determinants of terminal growth arrest induced in tumor cells by a chemotherapeutic agent. Proc. Natl. Acad. Sci. USA 2002, 99, 389–394. [Google Scholar] [CrossRef] [Green Version]
- Ianzini, F.; Bertoldo, A.; Kosmacek, E.A.; Phillips, S.L.; Mackey, M.A. Lack of p53 function promotes radiation-induced mitotic catastrophe in mouse embryonic fibroblast cells. Cancer Cell Int. 2006, 6, 11. [Google Scholar] [CrossRef] [Green Version]
- Boden, R.A.; Clark, M.; Neuhaus, S.; A’hern, J.; Thomas, J.; Hayes, A. Surgical management of soft tissue sarcoma in patients over 80 years. Eur. J. Surg. Oncol. (EJSO) 2006, 32, 1154–1158. [Google Scholar] [CrossRef]
- Farshadpour, F.; Schaapveld, M.; Suurmeijer, A.; Wymenga, A.; Otter, R.; Hoekstra, H. Soft tissue sarcoma: Why not treated? Crit. Rev. Oncol. 2005, 54, 77–83. [Google Scholar] [CrossRef]
- Lahat, G.; Dhuka, A.R.; Lahat, S.; Lazar, A.J.; Lewis, V.O.; Lin, P.P.; Feig, B.; Cormier, J.N.; Hunt, K.K.; Pisters, P.W.T.; et al. Complete Soft Tissue Sarcoma Resection is a Viable Treatment Option for Select Elderly Patients. Ann. Surg. Oncol. 2009, 16, 2579–2586. [Google Scholar] [CrossRef]
- Blumenfeld, P.; Sen, N.; Abrams, R.A.; Wang, D. Advances in Radiation Therapy for Primary and Metastatic Adult Soft Tissue Sarcomas. Curr. Oncol. Rep. 2016, 18, 36. [Google Scholar] [CrossRef]
- Chen, Z.; Wu, Z.; Ning, W. Advances in Molecular Mechanisms and Treatment of Radiation-Induced Pulmonary Fibrosis. Transl. Oncol. 2019, 12, 162–169. [Google Scholar] [CrossRef]
- Schafer, M.J.; White, T.A.; Iijima, K.; Haak, A.J.; Ligresti, G.; Atkinson, E.J.; Oberg, A.L.; Birch, J.; Salmonowicz, H.; Zhu, Y.; et al. Cellular senescence mediates fibrotic pulmonary disease. Nat. Commun. 2017, 8, 14532. [Google Scholar] [CrossRef]
- Campeau, E.; Ruhl, V.E.; Rodier, F.; Smith, C.L.; Rahmberg, B.L.; Fuss, J.O.; Campisi, J.; Yaswen, P.; Cooper, P.K.; Kaufman, P.D. A Versatile Viral System for Expression and Depletion of Proteins in Mammalian Cells. PLoS ONE 2009, 4, e6529. [Google Scholar] [CrossRef] [Green Version]
- Lansu, J.; Bovée, J.V.; Braam, P.; Van Boven, H.; Flucke, U.; Bonenkamp, J.J.; Miah, A.B.; Zaidi, S.H.; Thway, K.; Bruland, Ø.S.; et al. Dose Reduction of Preoperative Radiotherapy in Myxoid Liposarcoma: A Nonrandomized Controlled Trial. JAMA Oncol. 2020. [Google Scholar] [CrossRef]


Publisher’s Note: MDPI stays neutral with regard to jurisdictional claims in published maps and institutional affiliations. |
© 2021 by the authors. Licensee MDPI, Basel, Switzerland. This article is an open access article distributed under the terms and conditions of the Creative Commons Attribution (CC BY) license (http://creativecommons.org/licenses/by/4.0/).
Share and Cite
Lafontaine, J.; Cardin, G.B.; Malaquin, N.; Boisvert, J.-S.; Rodier, F.; Wong, P. Senolytic Targeting of Bcl-2 Anti-Apoptotic Family Increases Cell Death in Irradiated Sarcoma Cells. Cancers 2021, 13, 386. https://doi.org/10.3390/cancers13030386
Lafontaine J, Cardin GB, Malaquin N, Boisvert J-S, Rodier F, Wong P. Senolytic Targeting of Bcl-2 Anti-Apoptotic Family Increases Cell Death in Irradiated Sarcoma Cells. Cancers. 2021; 13(3):386. https://doi.org/10.3390/cancers13030386
Chicago/Turabian StyleLafontaine, Julie, Guillaume B. Cardin, Nicolas Malaquin, Jean-Sébastien Boisvert, Francis Rodier, and Philip Wong. 2021. "Senolytic Targeting of Bcl-2 Anti-Apoptotic Family Increases Cell Death in Irradiated Sarcoma Cells" Cancers 13, no. 3: 386. https://doi.org/10.3390/cancers13030386