Article

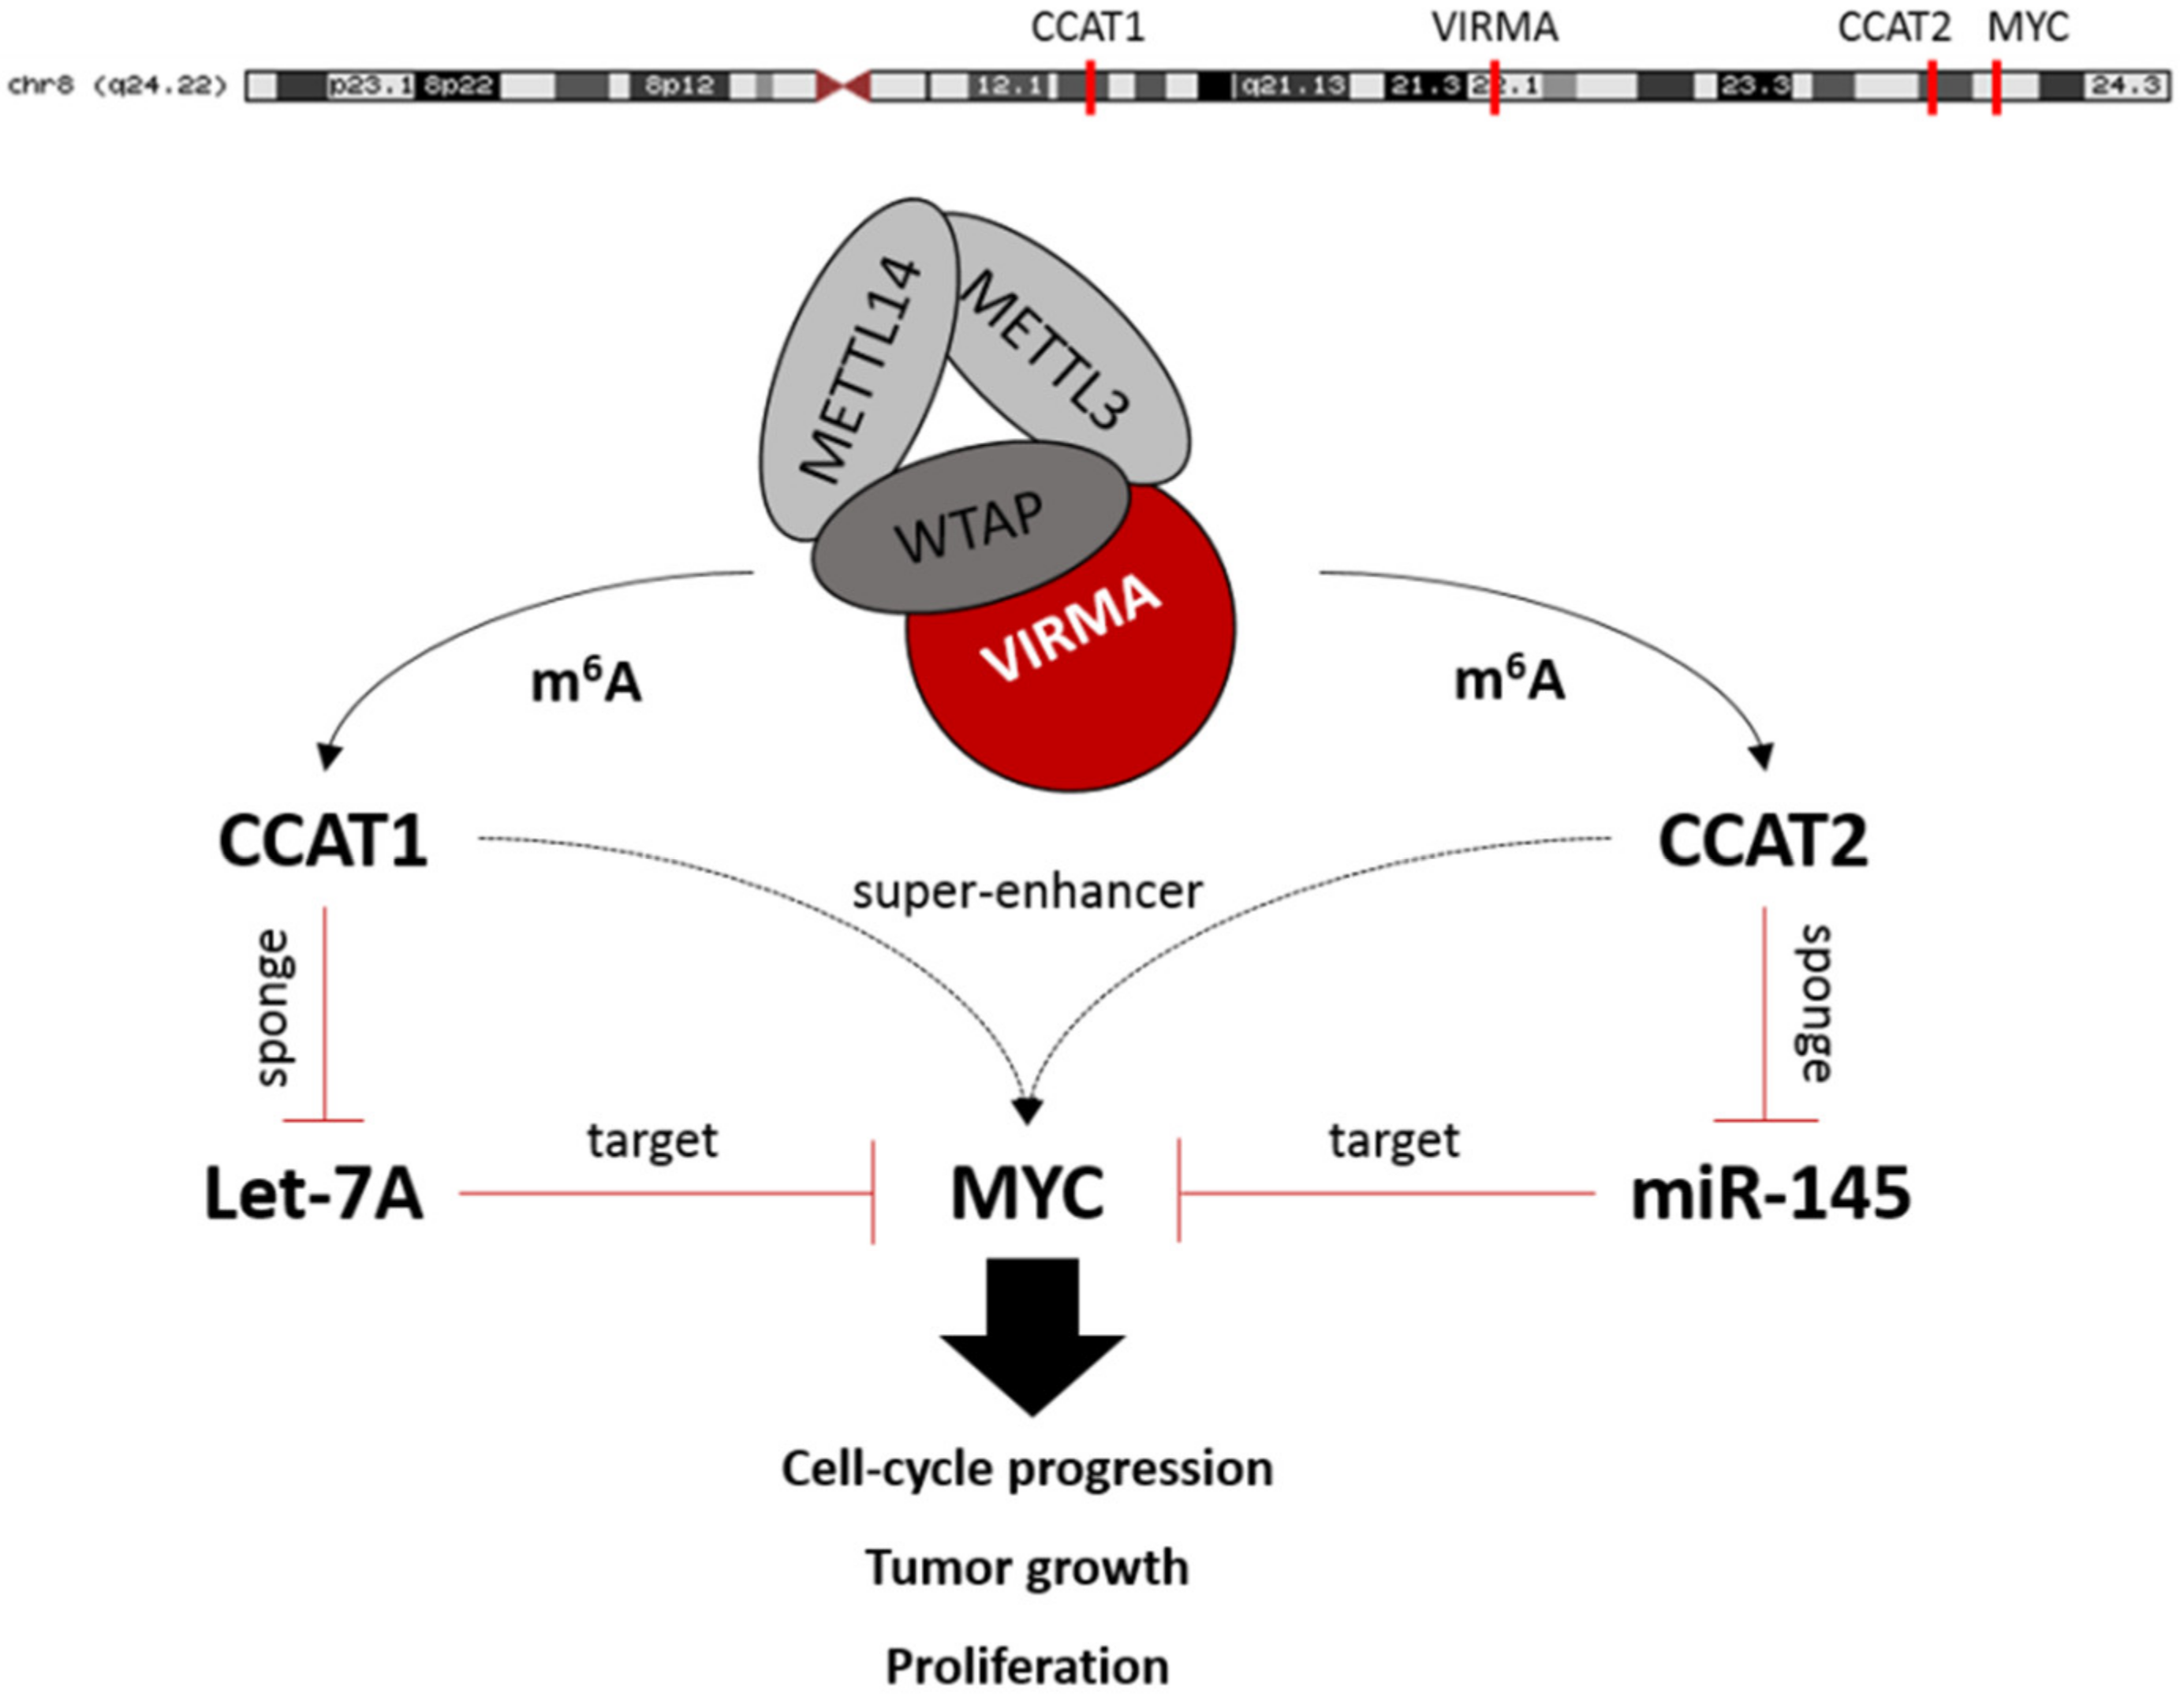
VIRMA-Dependent N6-Methyladenosine Modifications Regulate the Expression of Long Non-Coding RNAs CCAT1 and CCAT2 in Prostate Cancer

by
Daniela Barros-Silva
1,
João Lobo
1,2,
Catarina Guimarães-Teixeira
1,
Isa Carneiro
1,2,
Jorge Oliveira
3,
Elena S. Martens-Uzunova
4,
Rui Henrique
1,2,5 and
Carmen Jerónimo
1,2,5,*
1
Cancer Biology and Epigenetics Group, Research Center of Portuguese Oncology Institute of Porto (GEBC CI-IPOP) and Porto Comprehensive Cancer Center (P.CCC), R. Dr. António Bernardino de Almeida, 4200072 Porto, Portugal
2
Department of Pathology, Portuguese Oncology Institute of Porto (IPOP), R. Dr. António Bernardino de Almeida, 4200-072 Porto, Portugal
3
Department of Urology, Portuguese Oncology Institute of Porto (IPOP), R. Dr. António Bernardino de Almeida, 4200-072 Porto, Portugal
4
Department of Urology, Cancer Institute, Erasmus MC University Medical Center Rotterdam, Be-432A, PO Box 2040, 3000 CA Rotterdam, The Netherlands
5
Department of Pathology and Molecular Immunology, Institute of Biomedical Sciences Abel Salazar, University of Porto (ICBAS-UP), Rua Jorge Viterbo Ferreira 228, 4050-513 Porto, Portugal
*
Author to whom correspondence should be addressed.
Cancers 2020, 12(4), 771; https://doi.org/10.3390/cancers12040771
Submission received: 28 January 2020 / Revised: 18 March 2020 / Accepted: 24 March 2020 / Published: 25 March 2020

Abstract

:
RNA methylation at position N6 in adenosine (m6A) and its associated methyltransferase complex (MTC) are involved in tumorigenesis. We aimed to explore m6A biological function for long non-coding RNAs (lncRNAs) in prostate cancer (PCa) and its clinical significance. m6A and MTC levels in PCa cells were characterized by ELISA and western blot. Putative m6A-regulated lncRNAs were identified and validated by lncRNA profiler qPCR array and bioinformatics analysis, followed by m6A/RNA co-immunoprecipitation. Impact of m6A depletion on RNA stability was assessed by Actinomycin D assay. The association of m6A-levels with PCa prognosis was examined in clinical samples. Higher m6A-levels and VIRMA overexpression were detected in metastatic castration-resistant PCa (mCRPC) cells (p < 0.05). VIRMA knockdown in PC-3 cells significantly decreased m6A-levels (p = 0.0317), attenuated malignant phenotype and suppressed the expression of oncogenic lncRNAs CCAT1 and CCAT2 (p < 0.00001). VIRMA depletion and m6A reduction decreased the stability and abundance of CCAT1/2 transcripts. Higher expression of VIRMA, CCAT1, and CCAT2 as a group variable was an independent predictor of poor prognosis (HR = 9.083, CI95% 1.911–43.183, p = 0.006). VIRMA is a critical factor sustaining m6A-levels in PCa cells. VIRMA downregulation attenuates the aggressive phenotype of PCa by overall reduction of m6A-levels decreasing stability and abundance of oncogenic lncRNAs.

1. Introduction

Prostate cancer (PCa) is a highly prevalent malignancy, being the second most common cancer and the fifth leading cause of cancer-related death in men [1]. First line treatment of advanced PCa is androgen-deprivation therapy. Nevertheless, a proportion of patients develops resistance (Castration-Resistant Prostate Cancer, CRPC) and progresses to lethal metastatic disease (mCRPC). The molecular mechanisms underlying mCRPC are not yet fully understood. Hence, the discovery of new key players involved in PCa aggressiveness and CRPC phenotype are mandatory.
RNA activity in cells is tightly regulated by different chemical modifications that can be dynamic and adaptable [2]. RNA methylation at position N6 in adenosine (m6A) is a highly prevalent epitranscriptomic modification in messenger and non-coding RNAs (ncRNAs) that affects splicing, translation, and stability [3]. Alterations in m6A are implicated in several biological processes in eukaryotes [4]. The m6A modification of RNA is dynamically regulated by methyltransferases (“writers”), binding proteins (“readers”), and demethylases (“erasers”) [5]. M6A is installed by the methyltransferase complex (MTC), a multi-component protein complex including a heterodimer of two methyltransferase-like proteins, METTL3 and METTL14, the Wilms’ tumor 1-associating protein (WTAP), and the Vir-like m6A methyltransferase associated protein (VIRMA). METTL3 is the only subunit of the complex that has catalytic activity [6]. METTL14 is important for substrate recognition, activity and specificity, while WTAP and VIRMA function as regulatory components. WTAP stabilizes the heterodimer formed by METTL3/14, plays a critical role for the nuclear localization of MTC, and can affect RNA alternative splicing. It has been proposed that VIRMA is important for the deposition of m6A at 3′UTR of messenger RNA [7]. VIRMA is required for the full methylation program in mammals and its silencing causes a substantial reduction in m6A levels during embryonic development [8]. Eraser/demethylases, such as FTO and ALKBH5, have a crucial role in the dynamics and control of m6A modification in target RNAs. Additionally, specific reader proteins like YTHDF1/2/3, eIF3, IGF2BP1/2/3, and HNRNPA2B1 can bind to the m6A consensus motif (DRACH), directly or indirectly affecting RNA stability and function [5]. The functional analysis of writer, reader and eraser proteins that modulate RNA modifications is of major importance to further unveil their biological significance.
The recent development of new high-throughput sequencing techniques brought new insights into our understanding of the transcriptome versatility and revealed that epitranscriptome homeostasis is disrupted in cancer. Emerging evidence demonstrates the importance of m6A and MTC in several human cancers [9]. For example, reduction of m6A-levels promotes tumorigenesis in glioblastoma stem cells [10], whereas METTL3 [11] and FTO [12] are associated with therapeutic resistance in pancreatic and cervical squamous cell carcinoma, respectively, constituting putative predictive biomarkers. Nevertheless, the full extent of functionality and implication of RNA modifications in cancer initiation and progression remains largely unknown.
Long non-coding RNAs (lncRNAs) recently emerged as important players in prostate cancer biology. M6A is considered one of the most prevalent modifications in lncRNAs [13,14] and the characterization of lncRNA modifications occurring in PCa cells may disclose whether they affect key PCa signaling pathways [15].
To our knowledge, the m6A regulatory network underlying PCa onset and progression and its biological relevance are still largely unknown. In this study, we investigated the functions and specific mechanisms of m6A dynamics in the development of PCa aggressive phenotypes. VIRMA was found to play a pivotal role in establishment of m6A mark impacting also on PCa aggressiveness profile. Downregulation of screened m6A targeted-lncRNA was observed after VIRMA knockdown. Combination of VIRMA and lncRNAs expression independently predicted poor prognosis in PCa patients. Thus, we postulate a novel regulatory mechanism in which VIRMA knockdown decreases oncogenic lncRNA stability through reduction of m6A mark, attenuating the malignant features of PCa.

2. Results

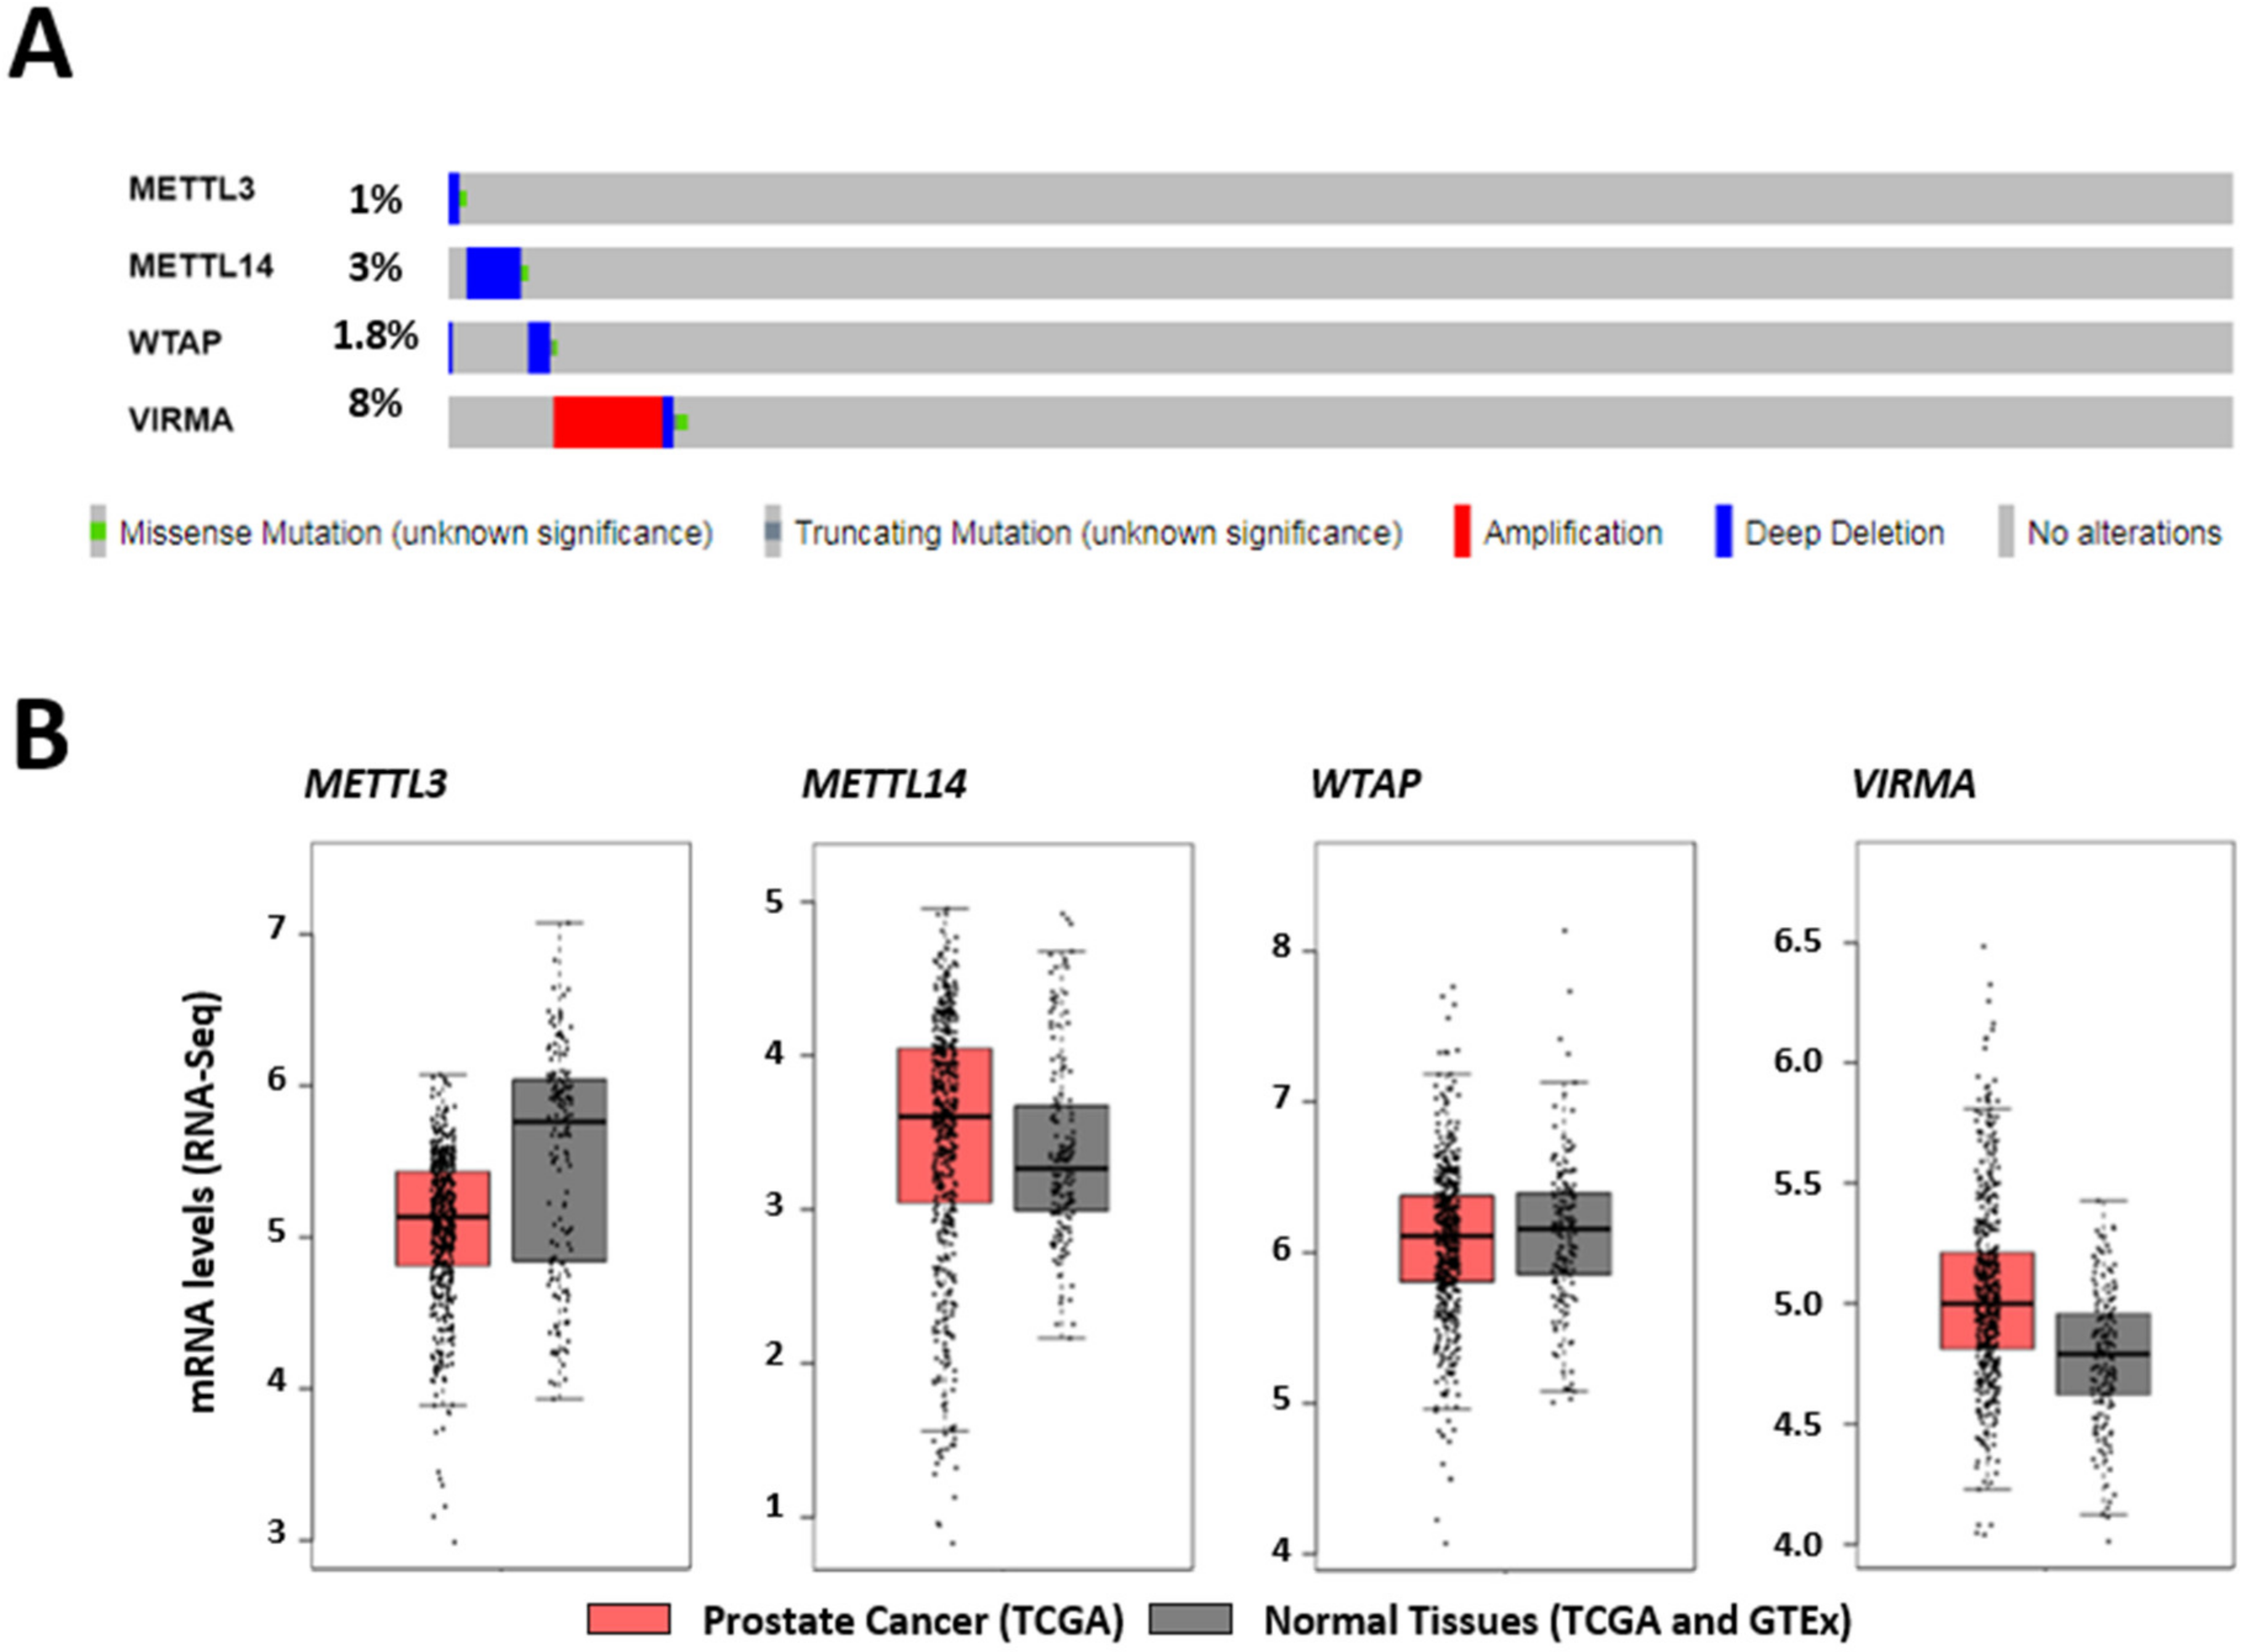
2.1. In Silico Analysis of Methyltransferase Complex Expression in Prostate Adenocarcinoma

To interrogate the biological function of m6A in PCa we examined the mutational and expression status of proteins composing the MTC in a cohort of 492 PCa patients/samples from The Cancer Genome Atlas (TCGA) database. Inspection of the genomic regions encoding each one of the MTC subunits revealed that VIRMA is the most commonly altered MTC protein in PCa (8% of the samples), whereas the other MTC subunits disclose lower frequencies of alterations (1% for METTL3, 3% for METTL14, and 1.8% for WTAP) (Figure 1A). In most cases, VIRMA was amplified, whereas strong downregulation was most common for the other subunits. Next, we examined MTC subunit expression levels in TCGA and GTEx cohorts [16]. The GTEx cohort was added to increase the number of normal samples, which are underrepresented in the TCGA cohort. The results demonstrated high mRNA expression levels of VIRMA in at least 25% of the tumor samples compared with normal controls (Figure 1B), indicating that genomic amplification is not the only mechanism determining VIRMA overexpression. To investigate for possible associations between VIRMA overexpression and PCa progression, survival analysis was also performed using the available data. Remarkably, although differences in VIRMA mRNA expression levels were not statistically significant (one-way ANOVA test), patients with high VIRMA expression endured significantly shorter disease-free survival (Hazard Ratio 2.7, p = 0.0043) (Figure 1C), suggesting clinical significance of VIRMA overexpression in PCa.

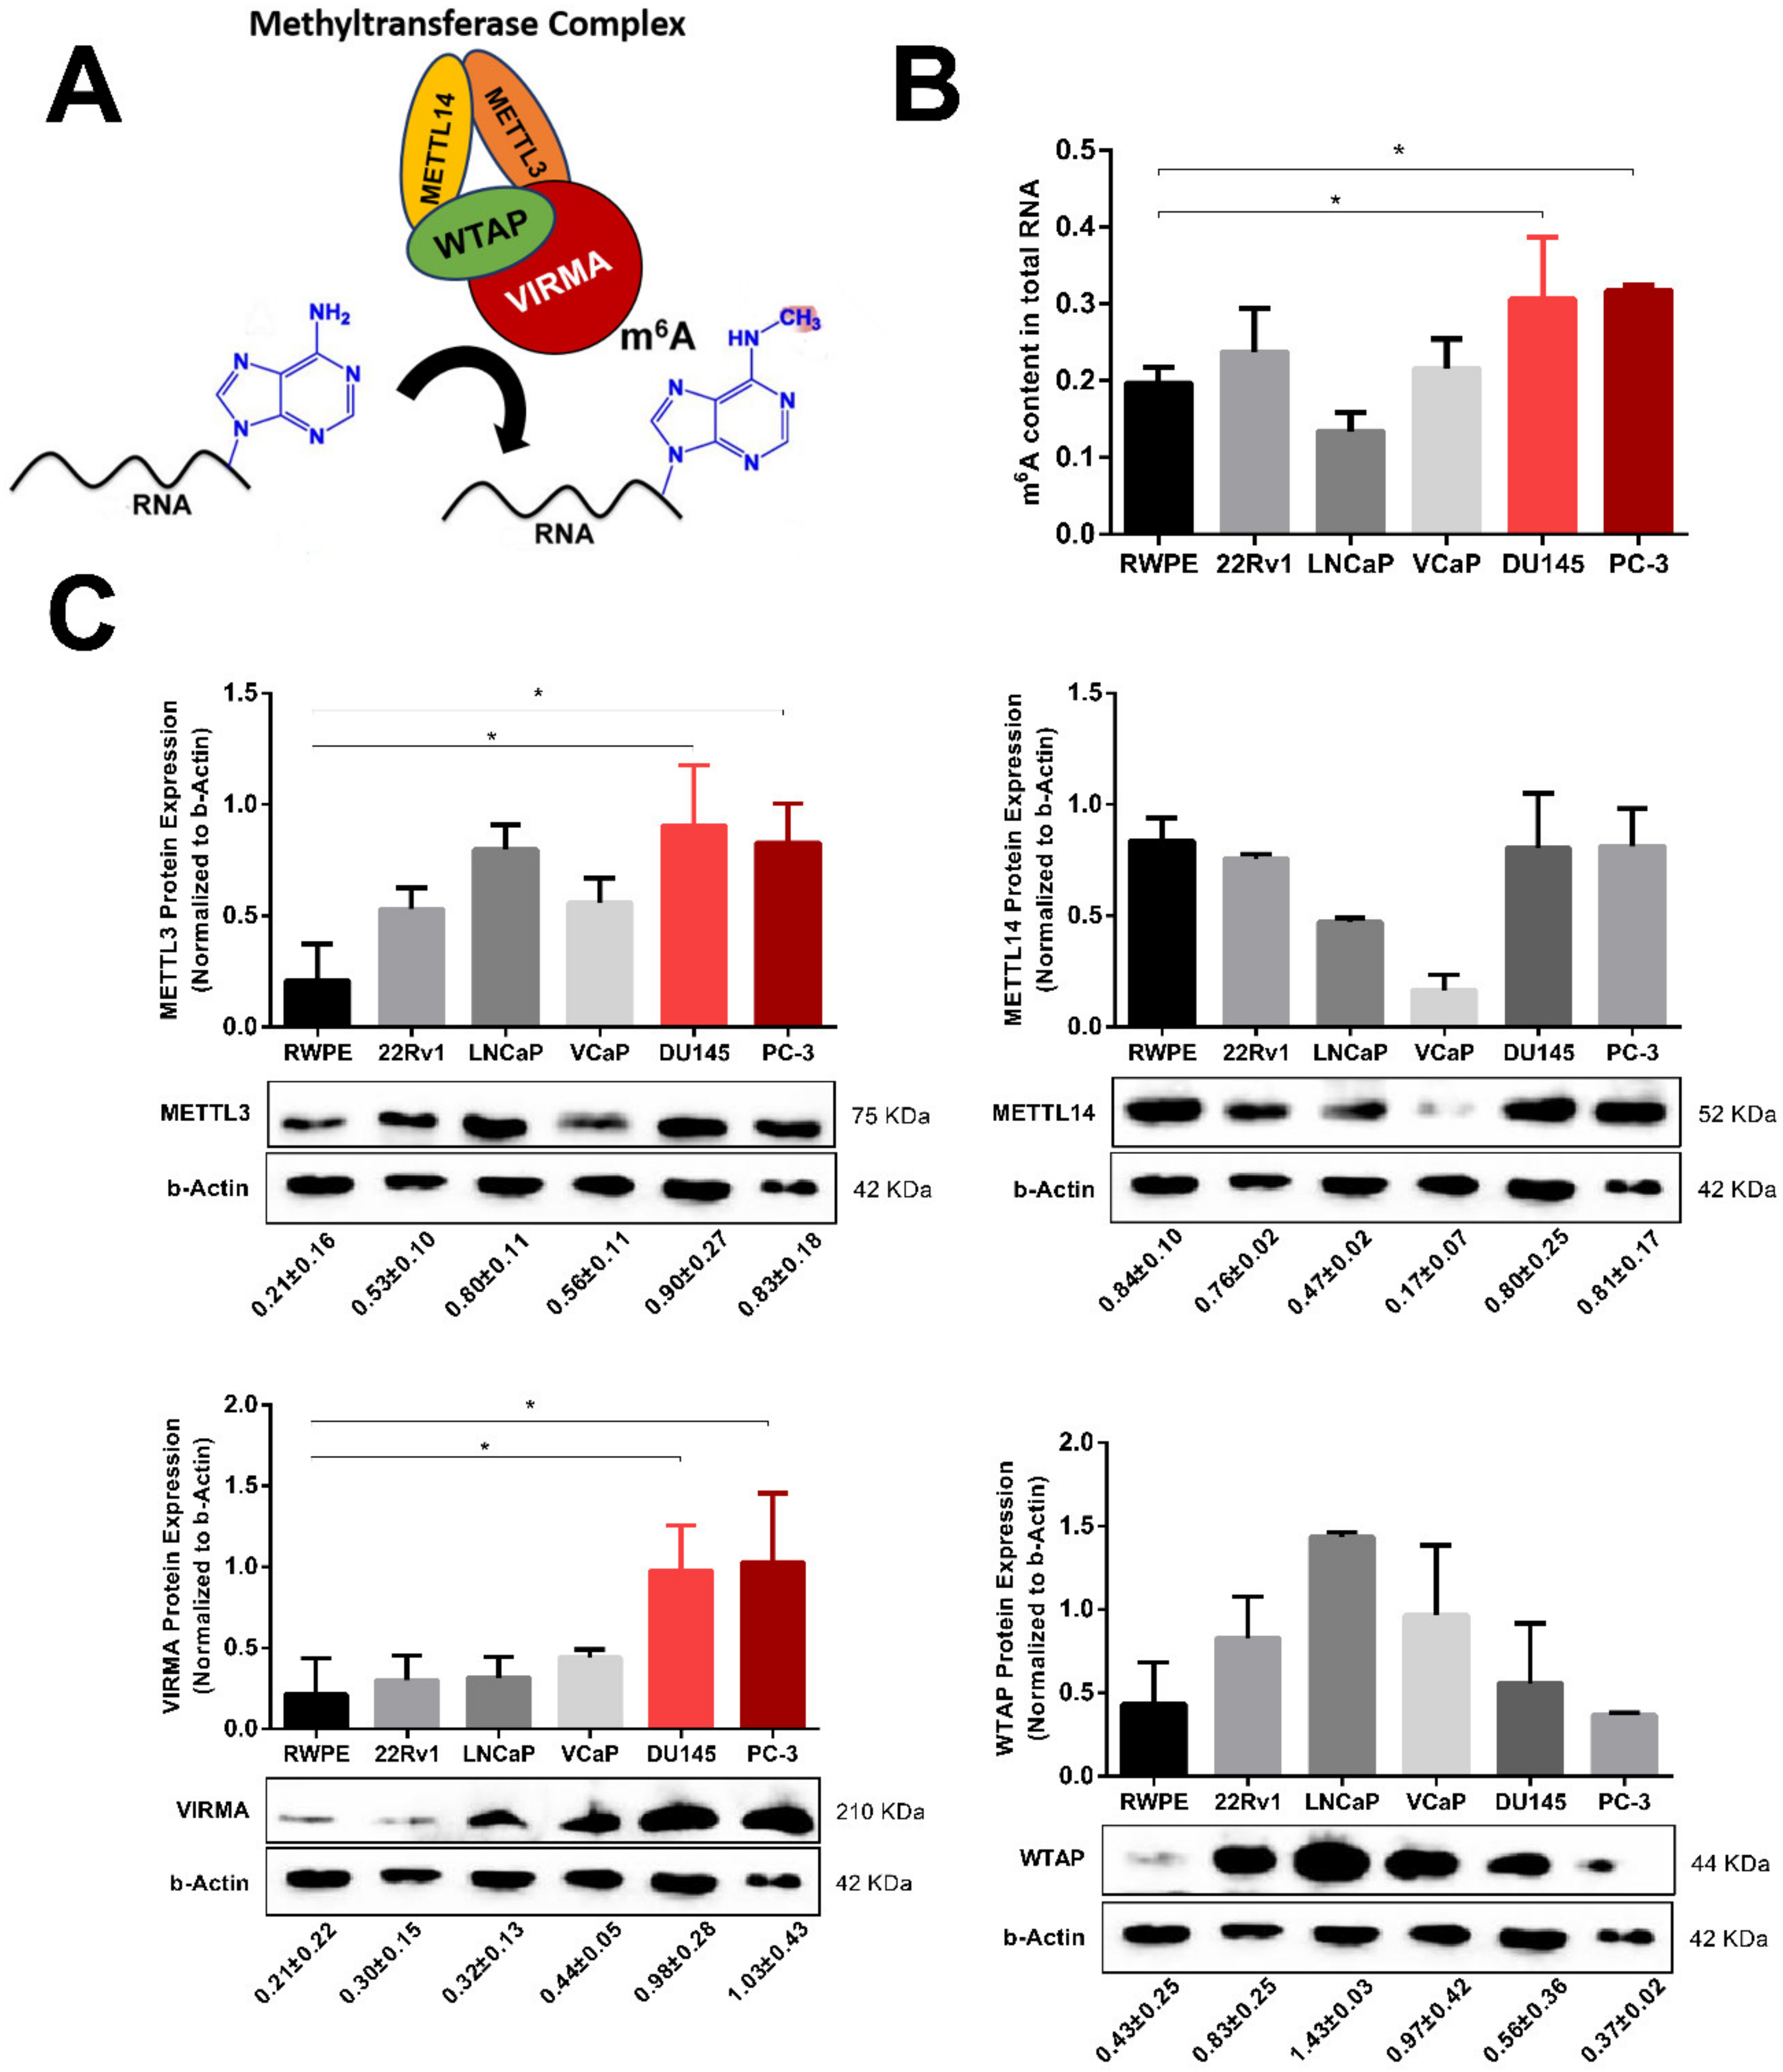
2.2. m6A RNA Methylation and VIRMA are Upregulated in Hormone-Insensitive PCa Cell Lines

To investigate the biological role of m6A RNA methylation in PCa, we quantified global m6A level in five human PCa cell lines (two androgen-dependent cell lines, LNCaP and VCaP) and three cell lines with androgen-independent growth, 22Rv1, DU145 and PC-3) and one benign prostate basal epithelium cell line (RWPE). Colorimetric m6A quantification assay showed higher m6A levels in androgen-independent versus androgen-dependent cells. Furthermore, androgen-independent DU145 and PC-3 PCa cells showed significantly increased m6A compared to RWPE cells (p = 0.0310 and p = 0.0160, respectively) (Figure 2B). Owing to the pivotal role of MTC in m6A modification (Figure 2A), we expected that increased m6A levels might be caused by alterations of m6A “writer” enzymes. To explore which one of the “writers” would be responsible for increased m6A levels in androgen-independent PCa cells, we assessed the protein levels of each enzyme using Western blot. The expression of VIRMA and associated levels of global m6A methylation in DU145 and PC-3 cancer cells were significantly higher compared to normal prostate cells (p = 0.0434 and p = 0.0298, respectively) (Figure 2C). The catalytic MTC subunit, METTL3 followed a similar pattern although to a lesser extent, suggesting that VIRMA might be the “writer” responsible for increased m6A methylation in advanced PCa.

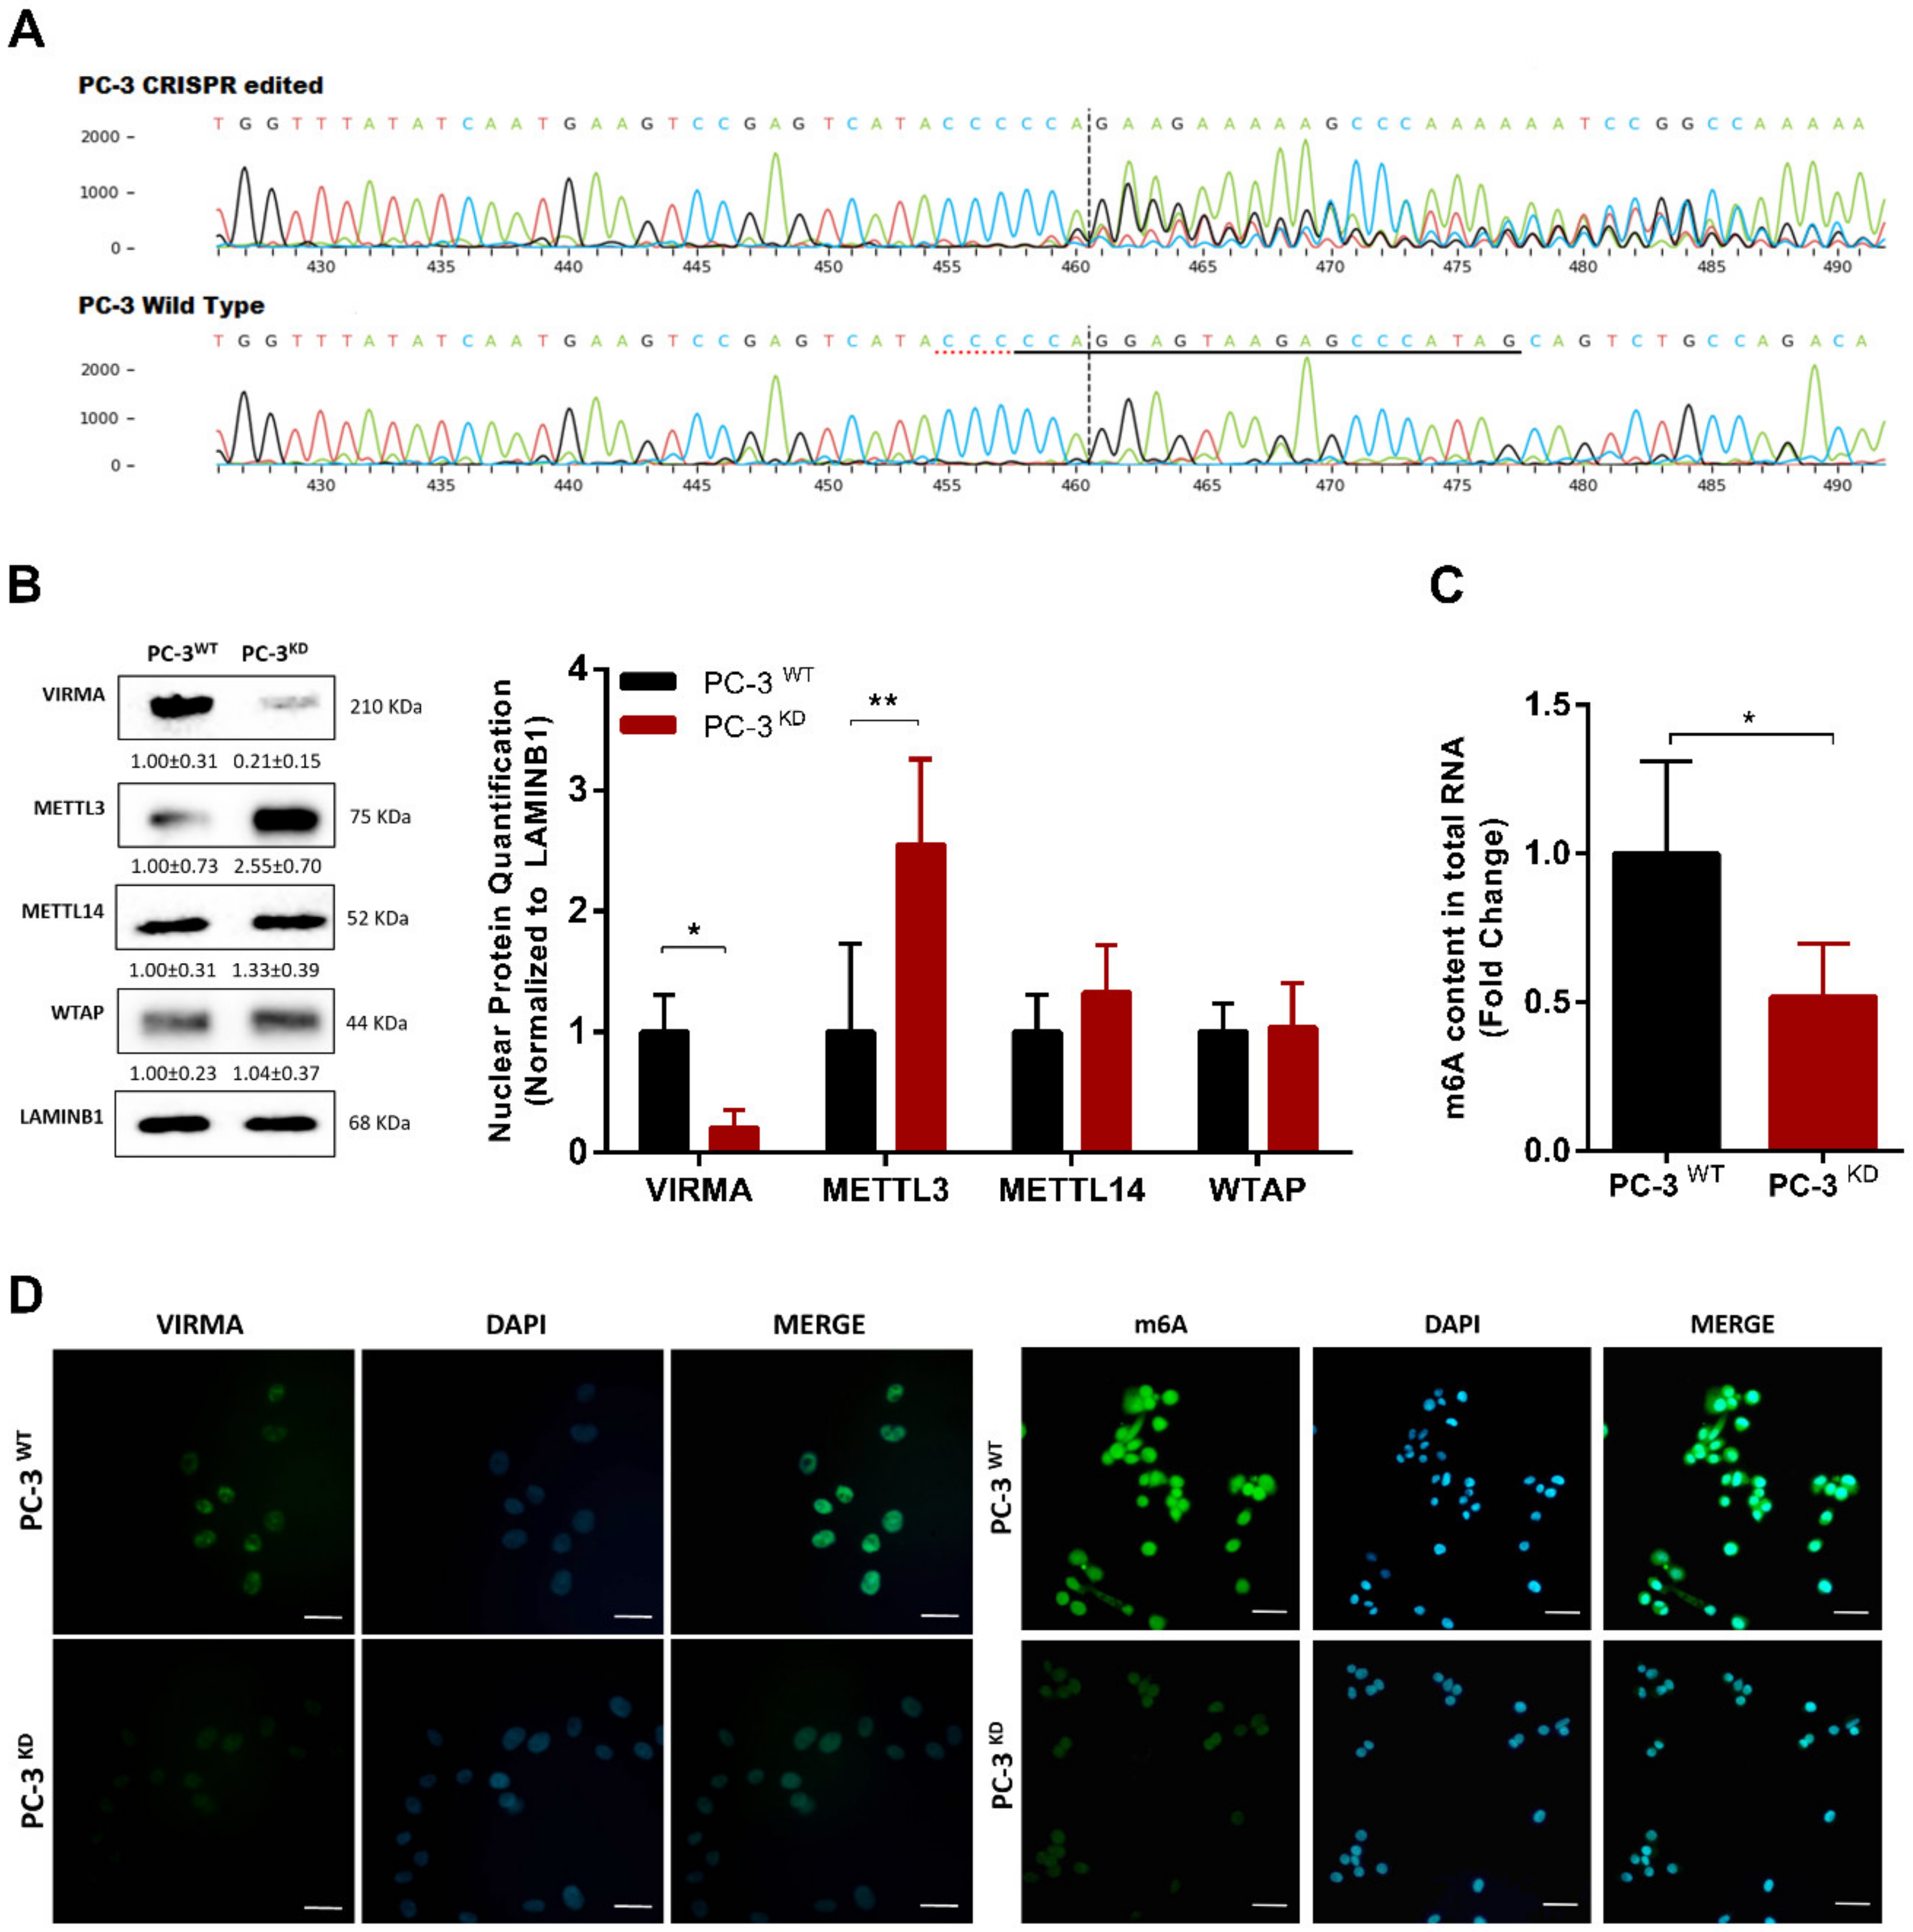
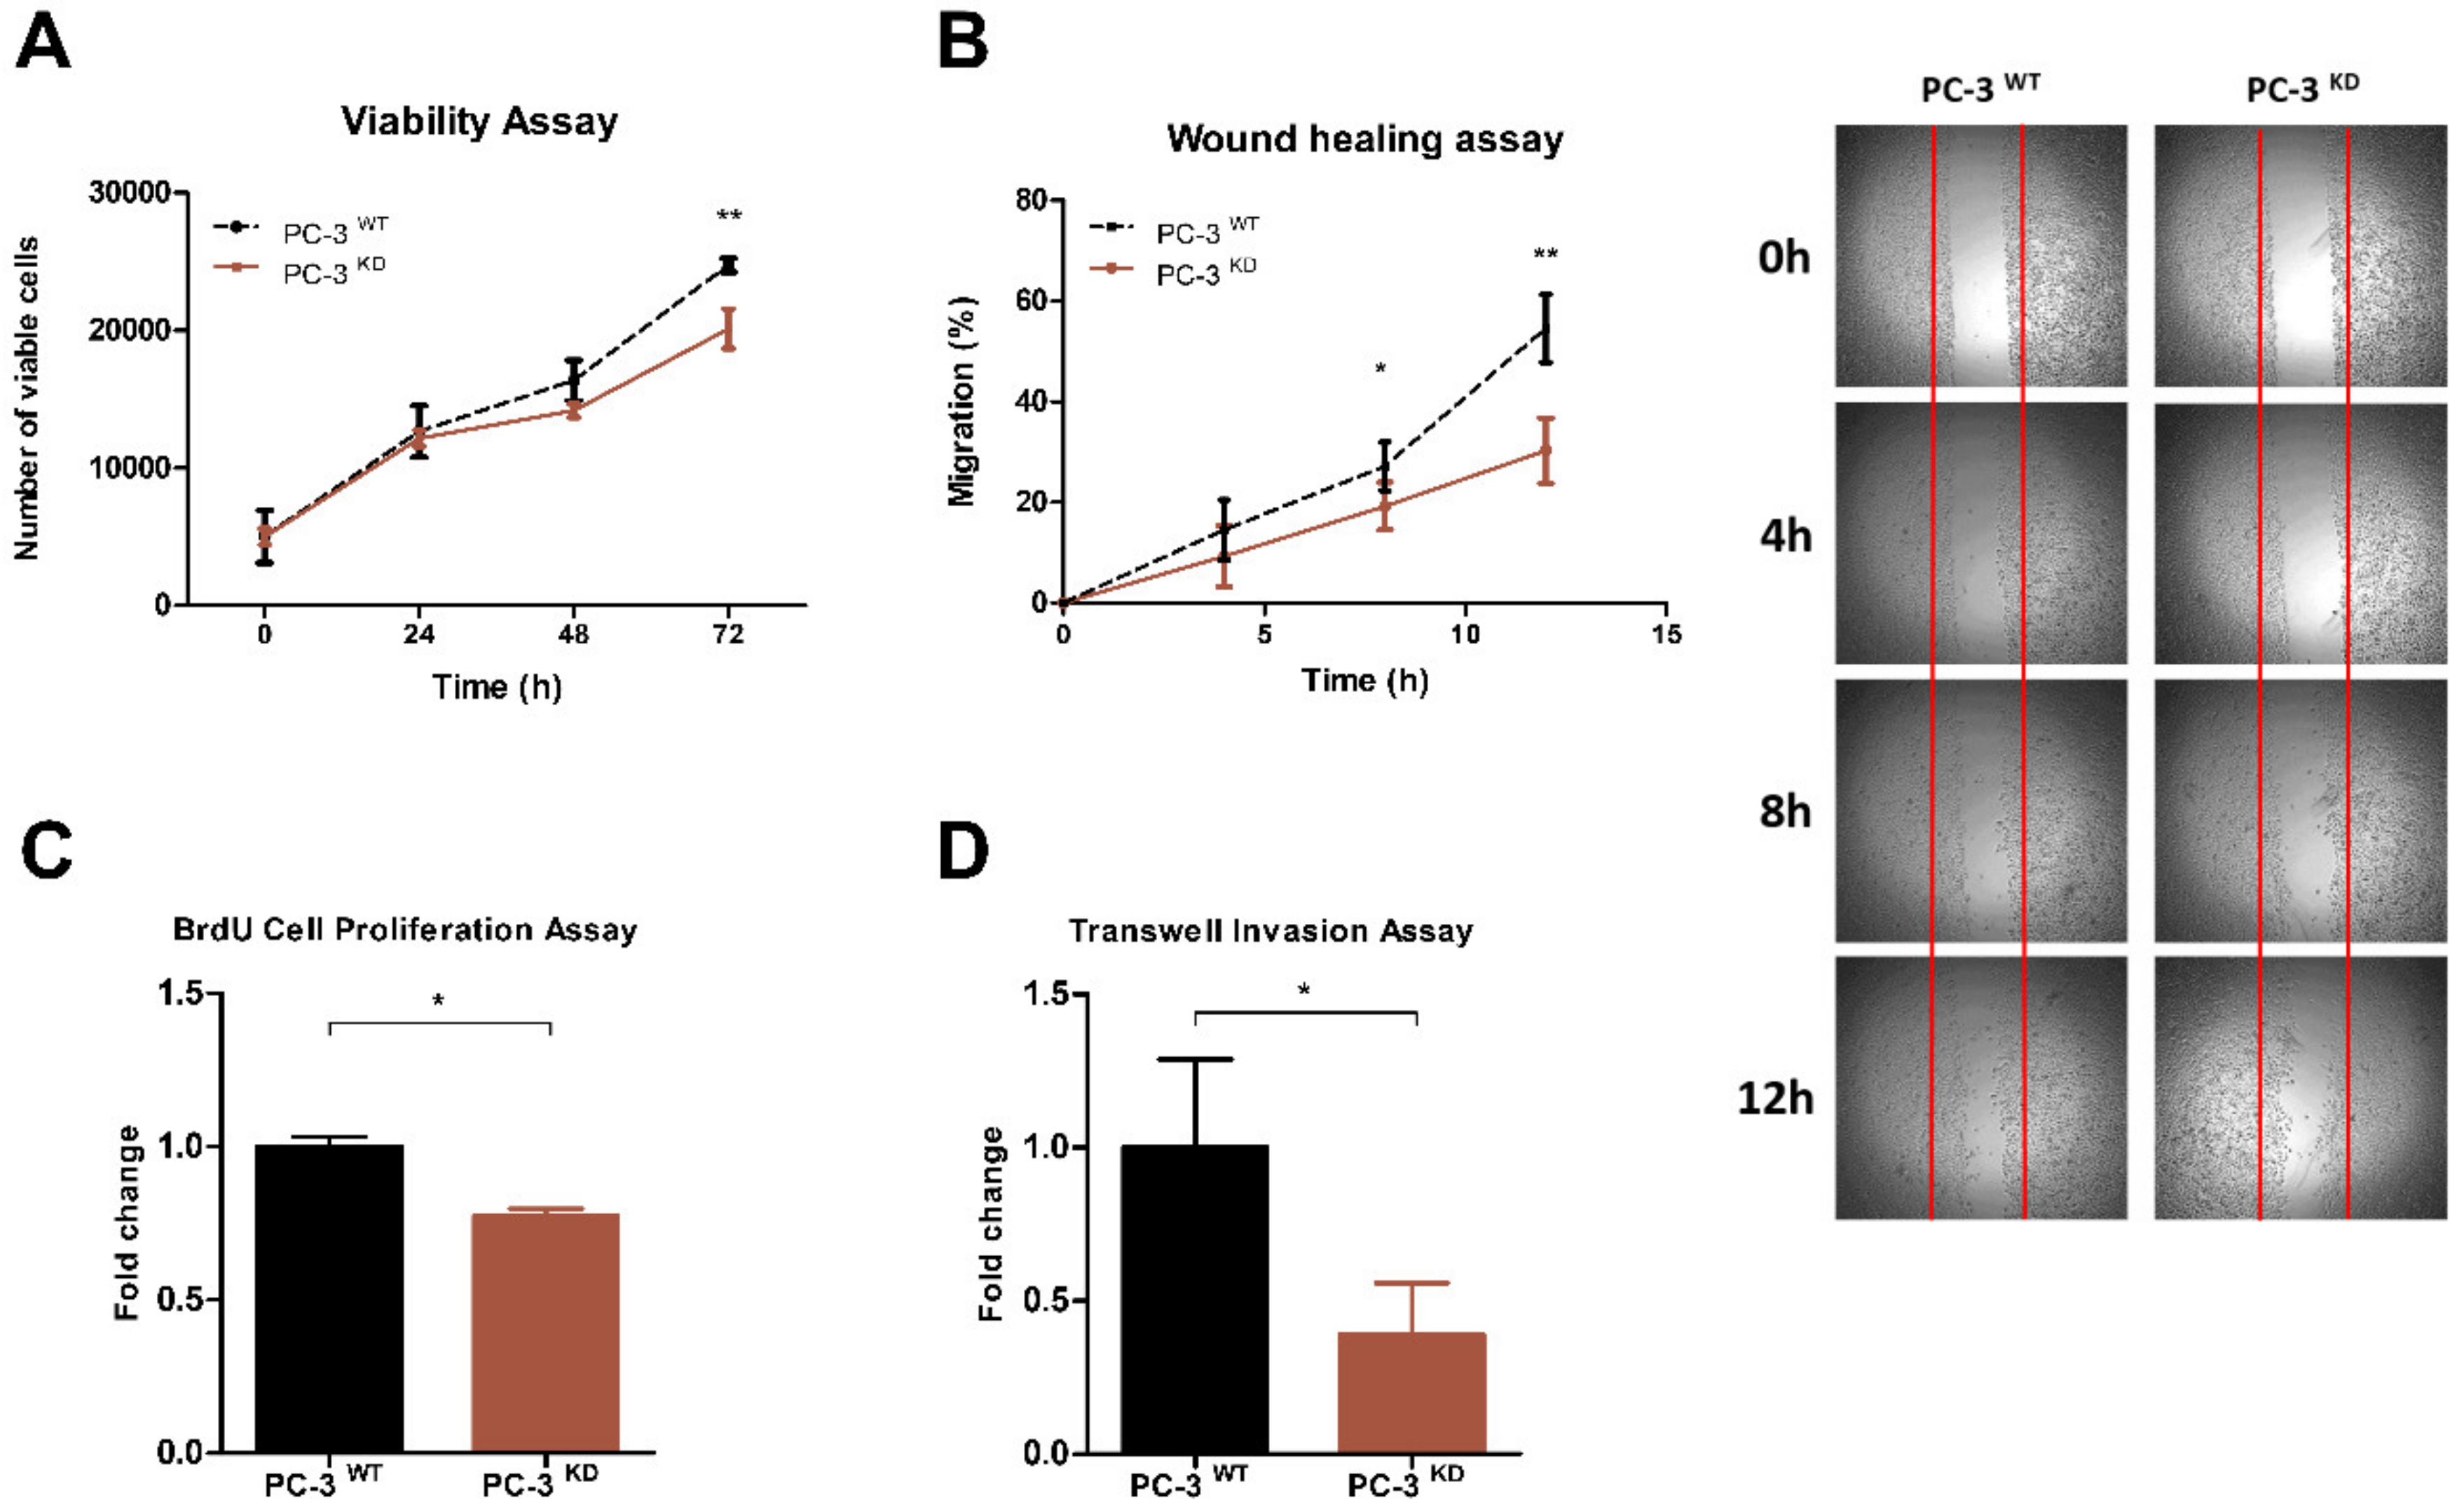
2.3. VIRMA Knockdown in PC-3 Causes m6A Reduction and Attenuate Cells Malignancy

To investigate whether VIRMA overexpression may directly cause increased m6A methylation levels in PCa and whether it associates with cellular features of aggressive phenotype, we used a CRISPR/Cas9 approach. CRISPR knockdown PC-3 cell line (PC-3KD) (Figure 3A) was purchased from Synthego Corporation. Assessment of protein levels of each of the MTC units demonstrated that VIRMA nuclear protein levels were significantly reduced to 21% in PC-3KD compared to wild type PC3 cells (PC-3WT) (Mann–Whitney U test, p < 0.05). In contrast, levels of METTL3 catalytic unit increased significantly—more than 2.5-fold (Mann–Whitney U test, p < 0.01)—in PC-3KD (Figure 3B).
Importantly, VIRMA depletion in PC-3 cells significantly decreased RNA m6A levels assessed by immunofluorescence (Figure 3D) and global RNA methylation quantification estimated by colorimetric assay (p = 0.0317) (Figure 3C). These findings strongly suggest that VIRMA knockdown triggers a compensatory feedback loop to enhance the expression of the catalytic METTL3 subunit. Nonetheless, compensatory overexpression of METTL3 is insufficient to preserve MTC functionality in the absence of VIRMA.
Next, we investigated whether the reduction of global m6A methylation levels affects PCa cells growth characteristics and malignant phenotype (Figure 4). VIRMA knockdown significantly decreased viability of PC3KD cells 72 h after transfection (20%, p < 0.01). Migration of PC3KD cells in wound healing assay was also significantly inhibited at 8h (p < 0.05) and even more evident at 12 h (p < 0.01). It should be noted, however, that this effect might also be due to reduction of PC-3KD cells proliferation (25%, p < 0.05) after VIRMA knockdown. Invasion capacity is also significantly decreased in PC-3KD cells comparatively to wild-type (60%, p < 0.05).

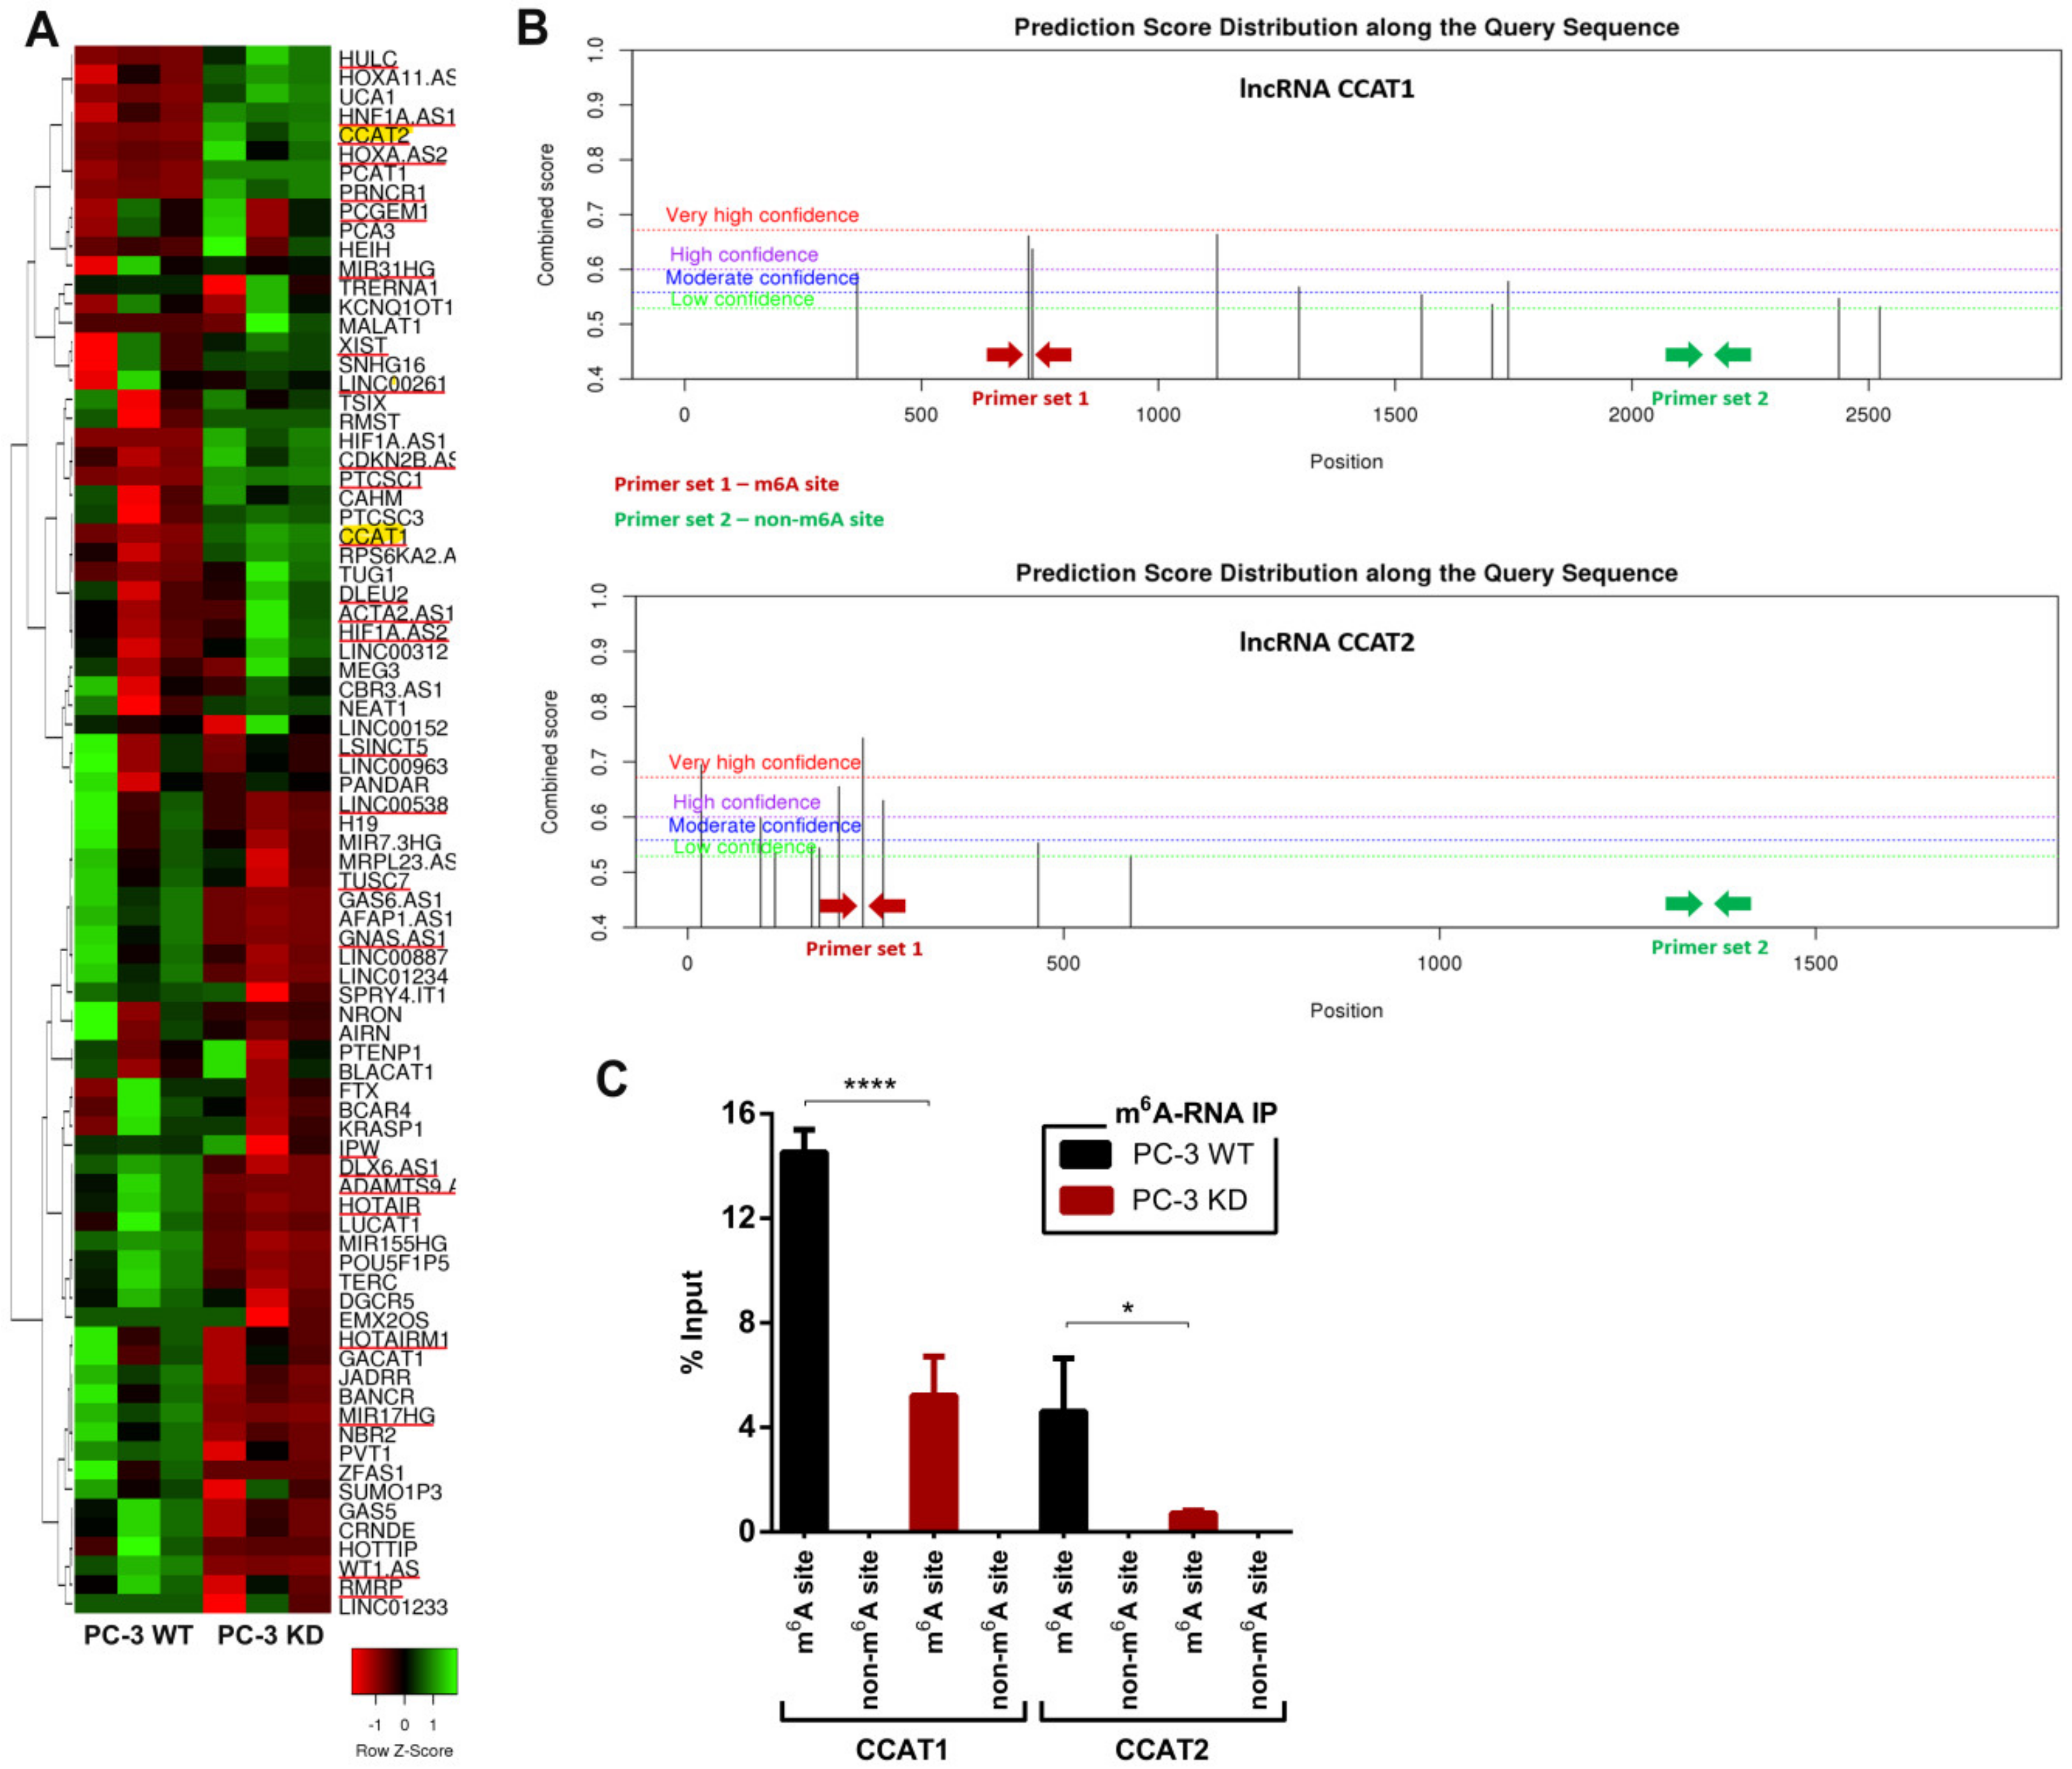
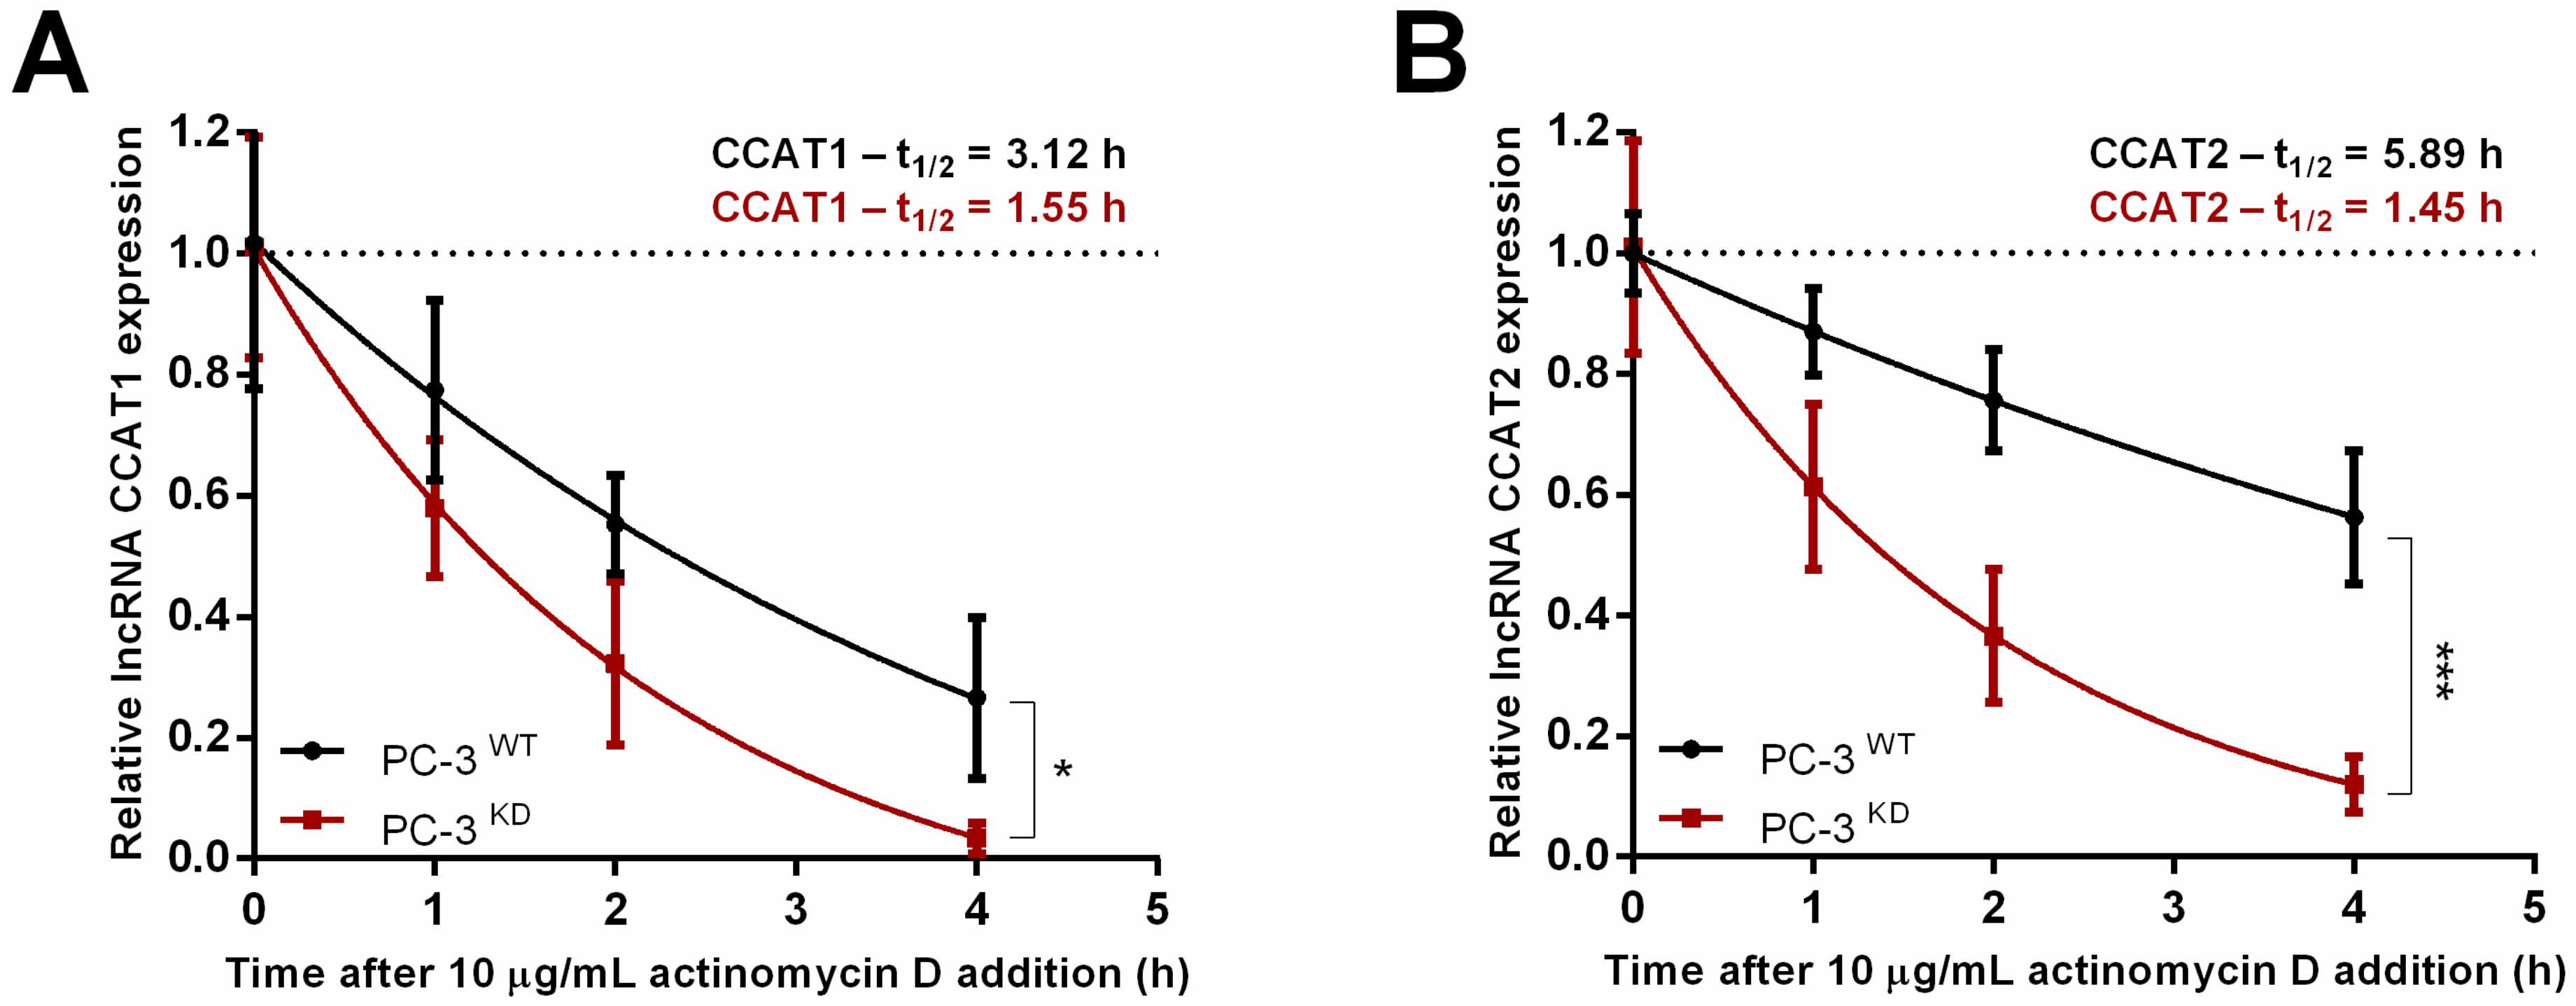
2.4. m6A Downregulation Suppresses Oncogenic Long Non-Coding RNAs Expression

It has been shown that m6A residues within the transcript body of lncRNAs may influence their biological function [17]. As lncRNAs are important players in PCa progression [18] we sought to examine the effects of m6A depletion on lncRNA expression. Using RT2 Profiler PCR array we tested for altered expression levels of a panel 84 cancer-associated lncRNAs, between PC-3WT and PC-3KD cells.
We identified 27 differentially expressed lncRNAs in PC-3KD compared to PC-3WT (Figure 5A and Table S1). From those, 17 lncRNAs were significantly downregulated in PC-3KD cells (p < 0.00001, Student’s t-test). Within this group, lncRNAs CCAT1 and CCAT2 displayed the strongest downregulation upon VIRMA depletion (fold change –3.7 and –8.5, respectively) and were selected for further validation.
Next, we identified putative m6A sites based on the presence of the DRACH consensus motifs in the sequence of CCAT1 and CCAT2 transcripts (Figure 5B). Although 10 predicted m6A sites were found for each of the transcripts, in CCAT1 the distribution was relatively uniform along the transcript body, whereas in CCAT2 they were mainly located at the 5′-terminal regions of the transcript. Specific primers targeting the regions with highest m6A methylation probability, as well as control non-methylated regions (Figure 5B), were designed to assess the number of CCAT1/2 transcripts immunoprecipitated from PC-3WT and PC-3KD cells. As expected, VIRMA knockdown decreased the number of CCAT1 and CCAT2 transcripts with detectable m6A methylation in the predicted targeted regions (p < 0.0001 and p < 0.05) (Figure 5C).
To dissect the mechanism by which m6A controls CCAT1/2 expression, we measured the stability of both lncRNAs. PC-3WT and PC-3KD cells were treated with 10 µg/mL actinomycin D, an inhibitor of RNA polymerase elongation. Over the course of 4 h, we observed a faster decay rate for both CCAT1 and CCAT2 lncRNAs in the absence of m6A methylation. To calculate the half-life of the tested lncRNAs we fitted the data into a non-linear regression model. CCAT1 half-life in PC-3KD cells was moderately reduced by 50% (p < 0.05) after 4 h of treatment, whereas half-life reduction was more expressive for CCAT2 (p < 0.0001), i.e., 76% after 4 h (Figure 6). Notably, differences between PC-3WT and PC-3KD decay rates were more pronounced for CCAT2 transcript, suggesting that the distribution of m6A is relevant for transcript stability.

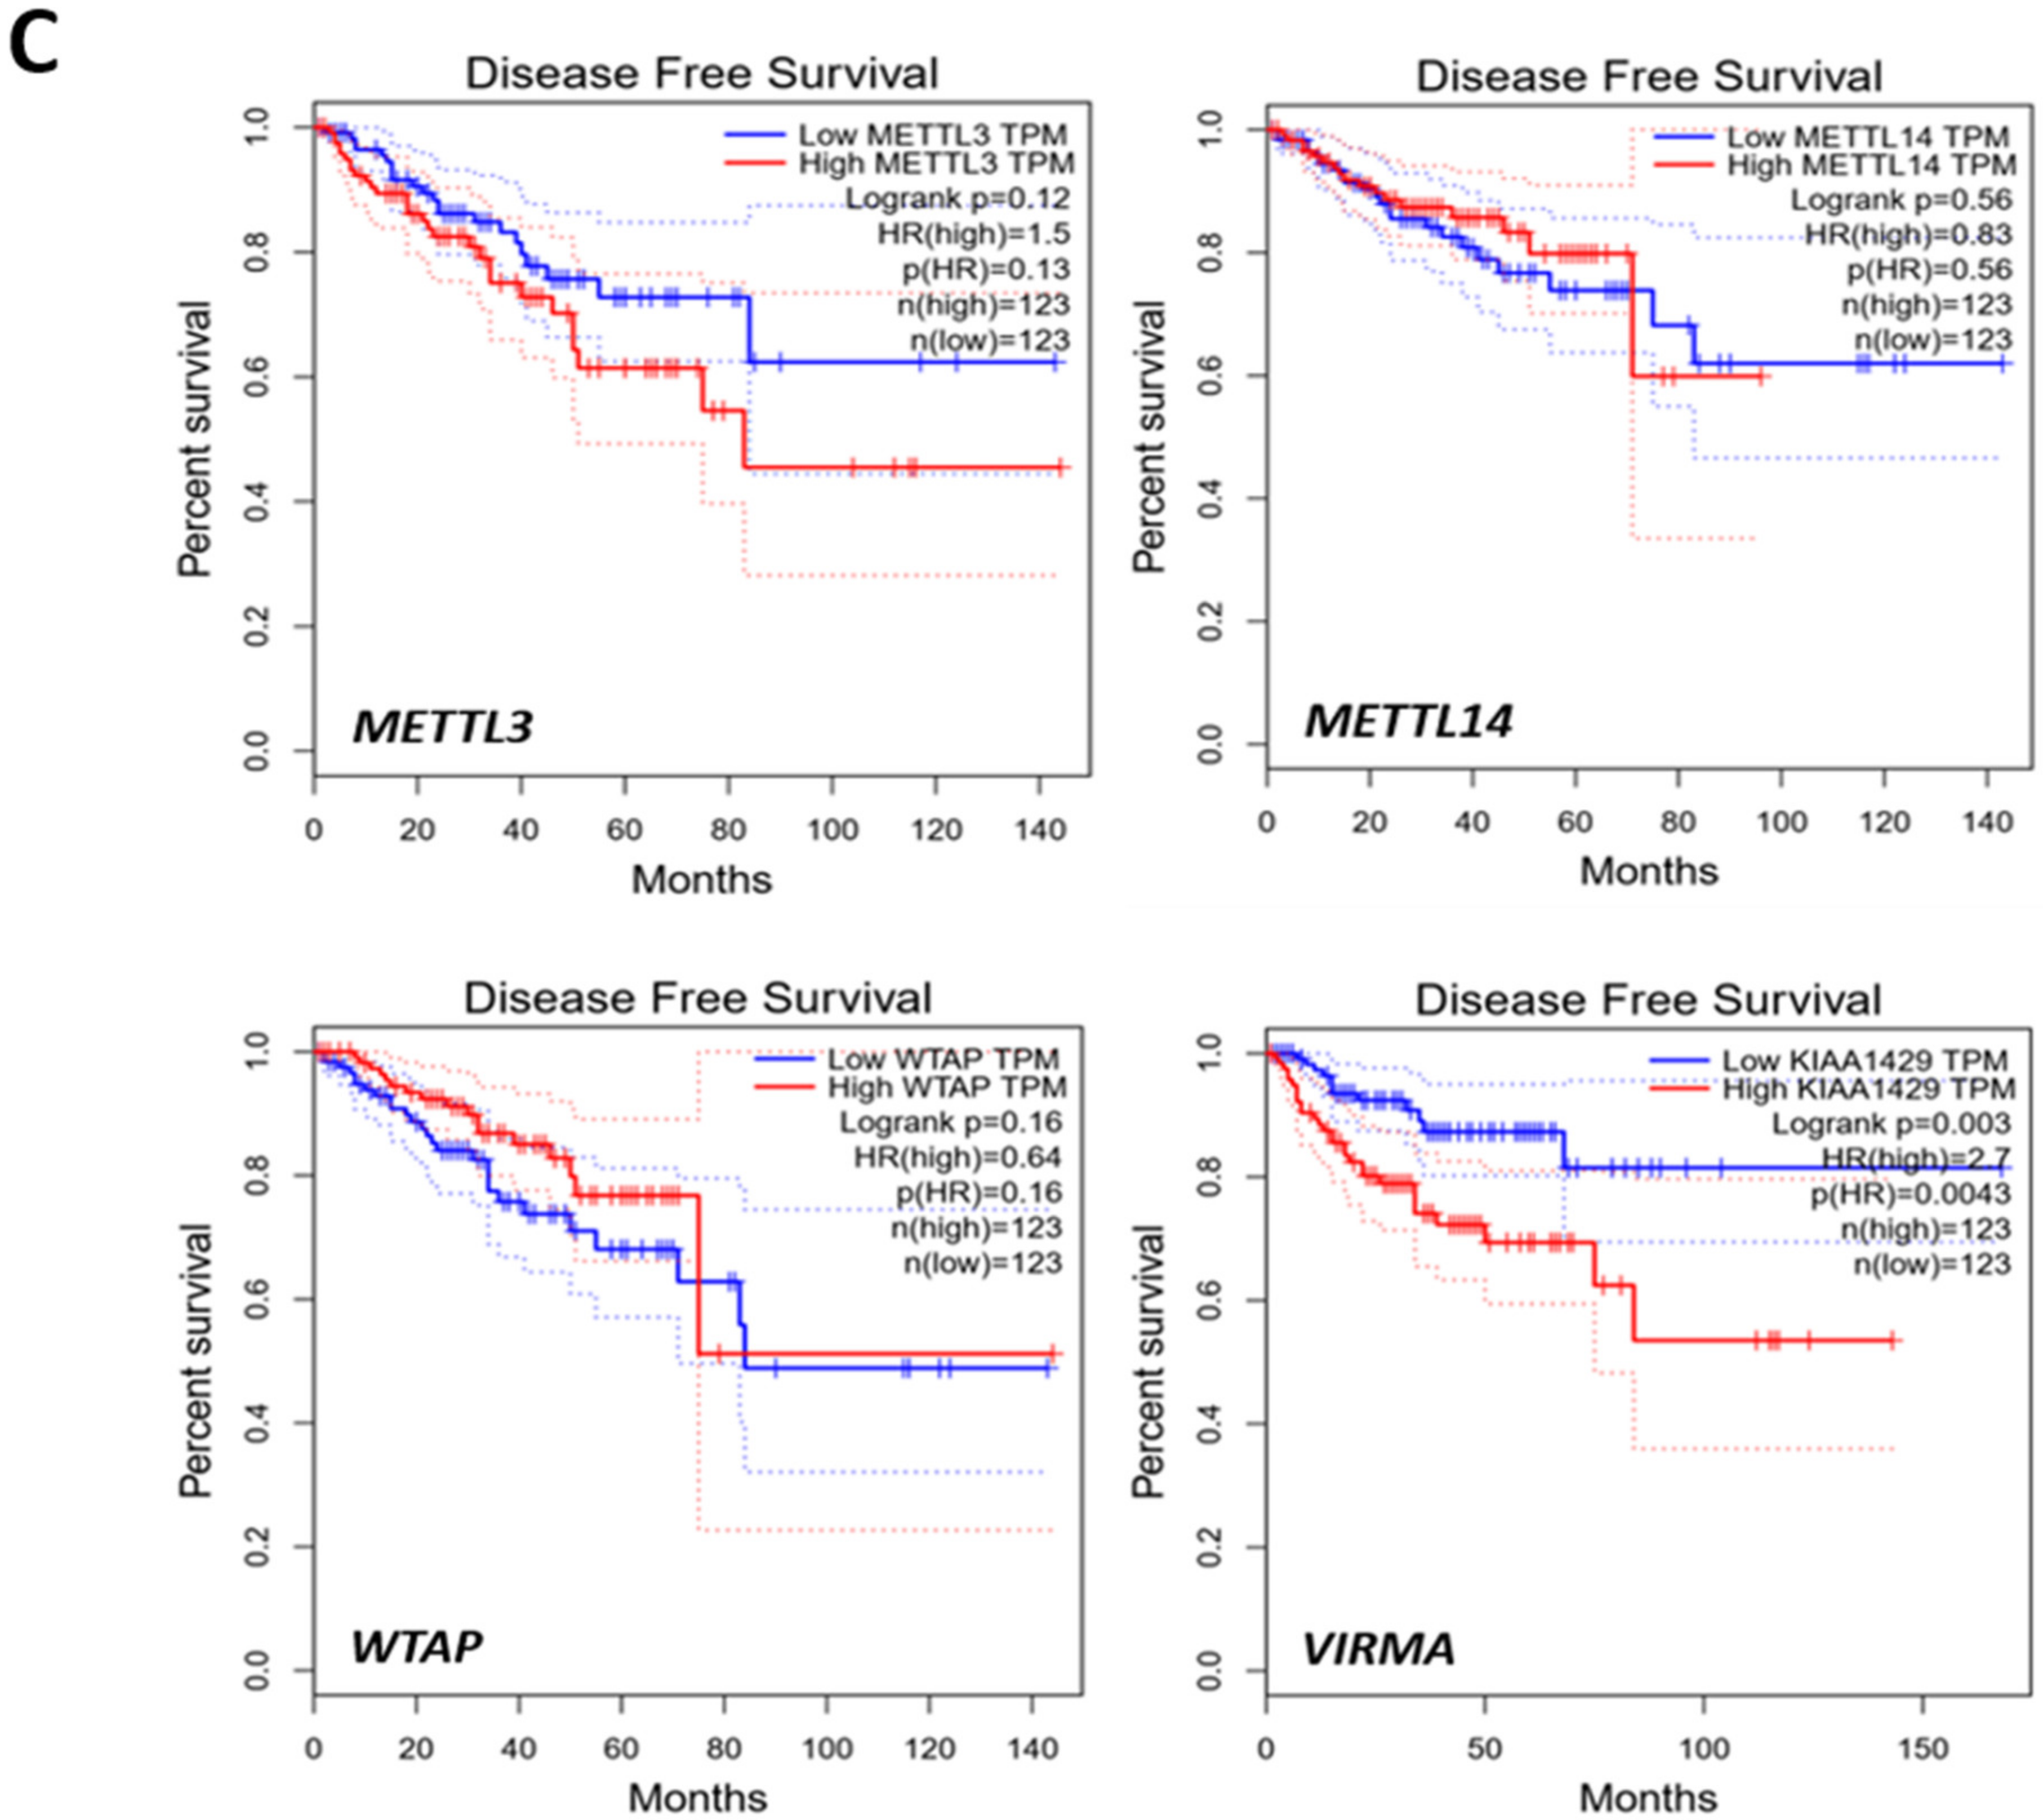
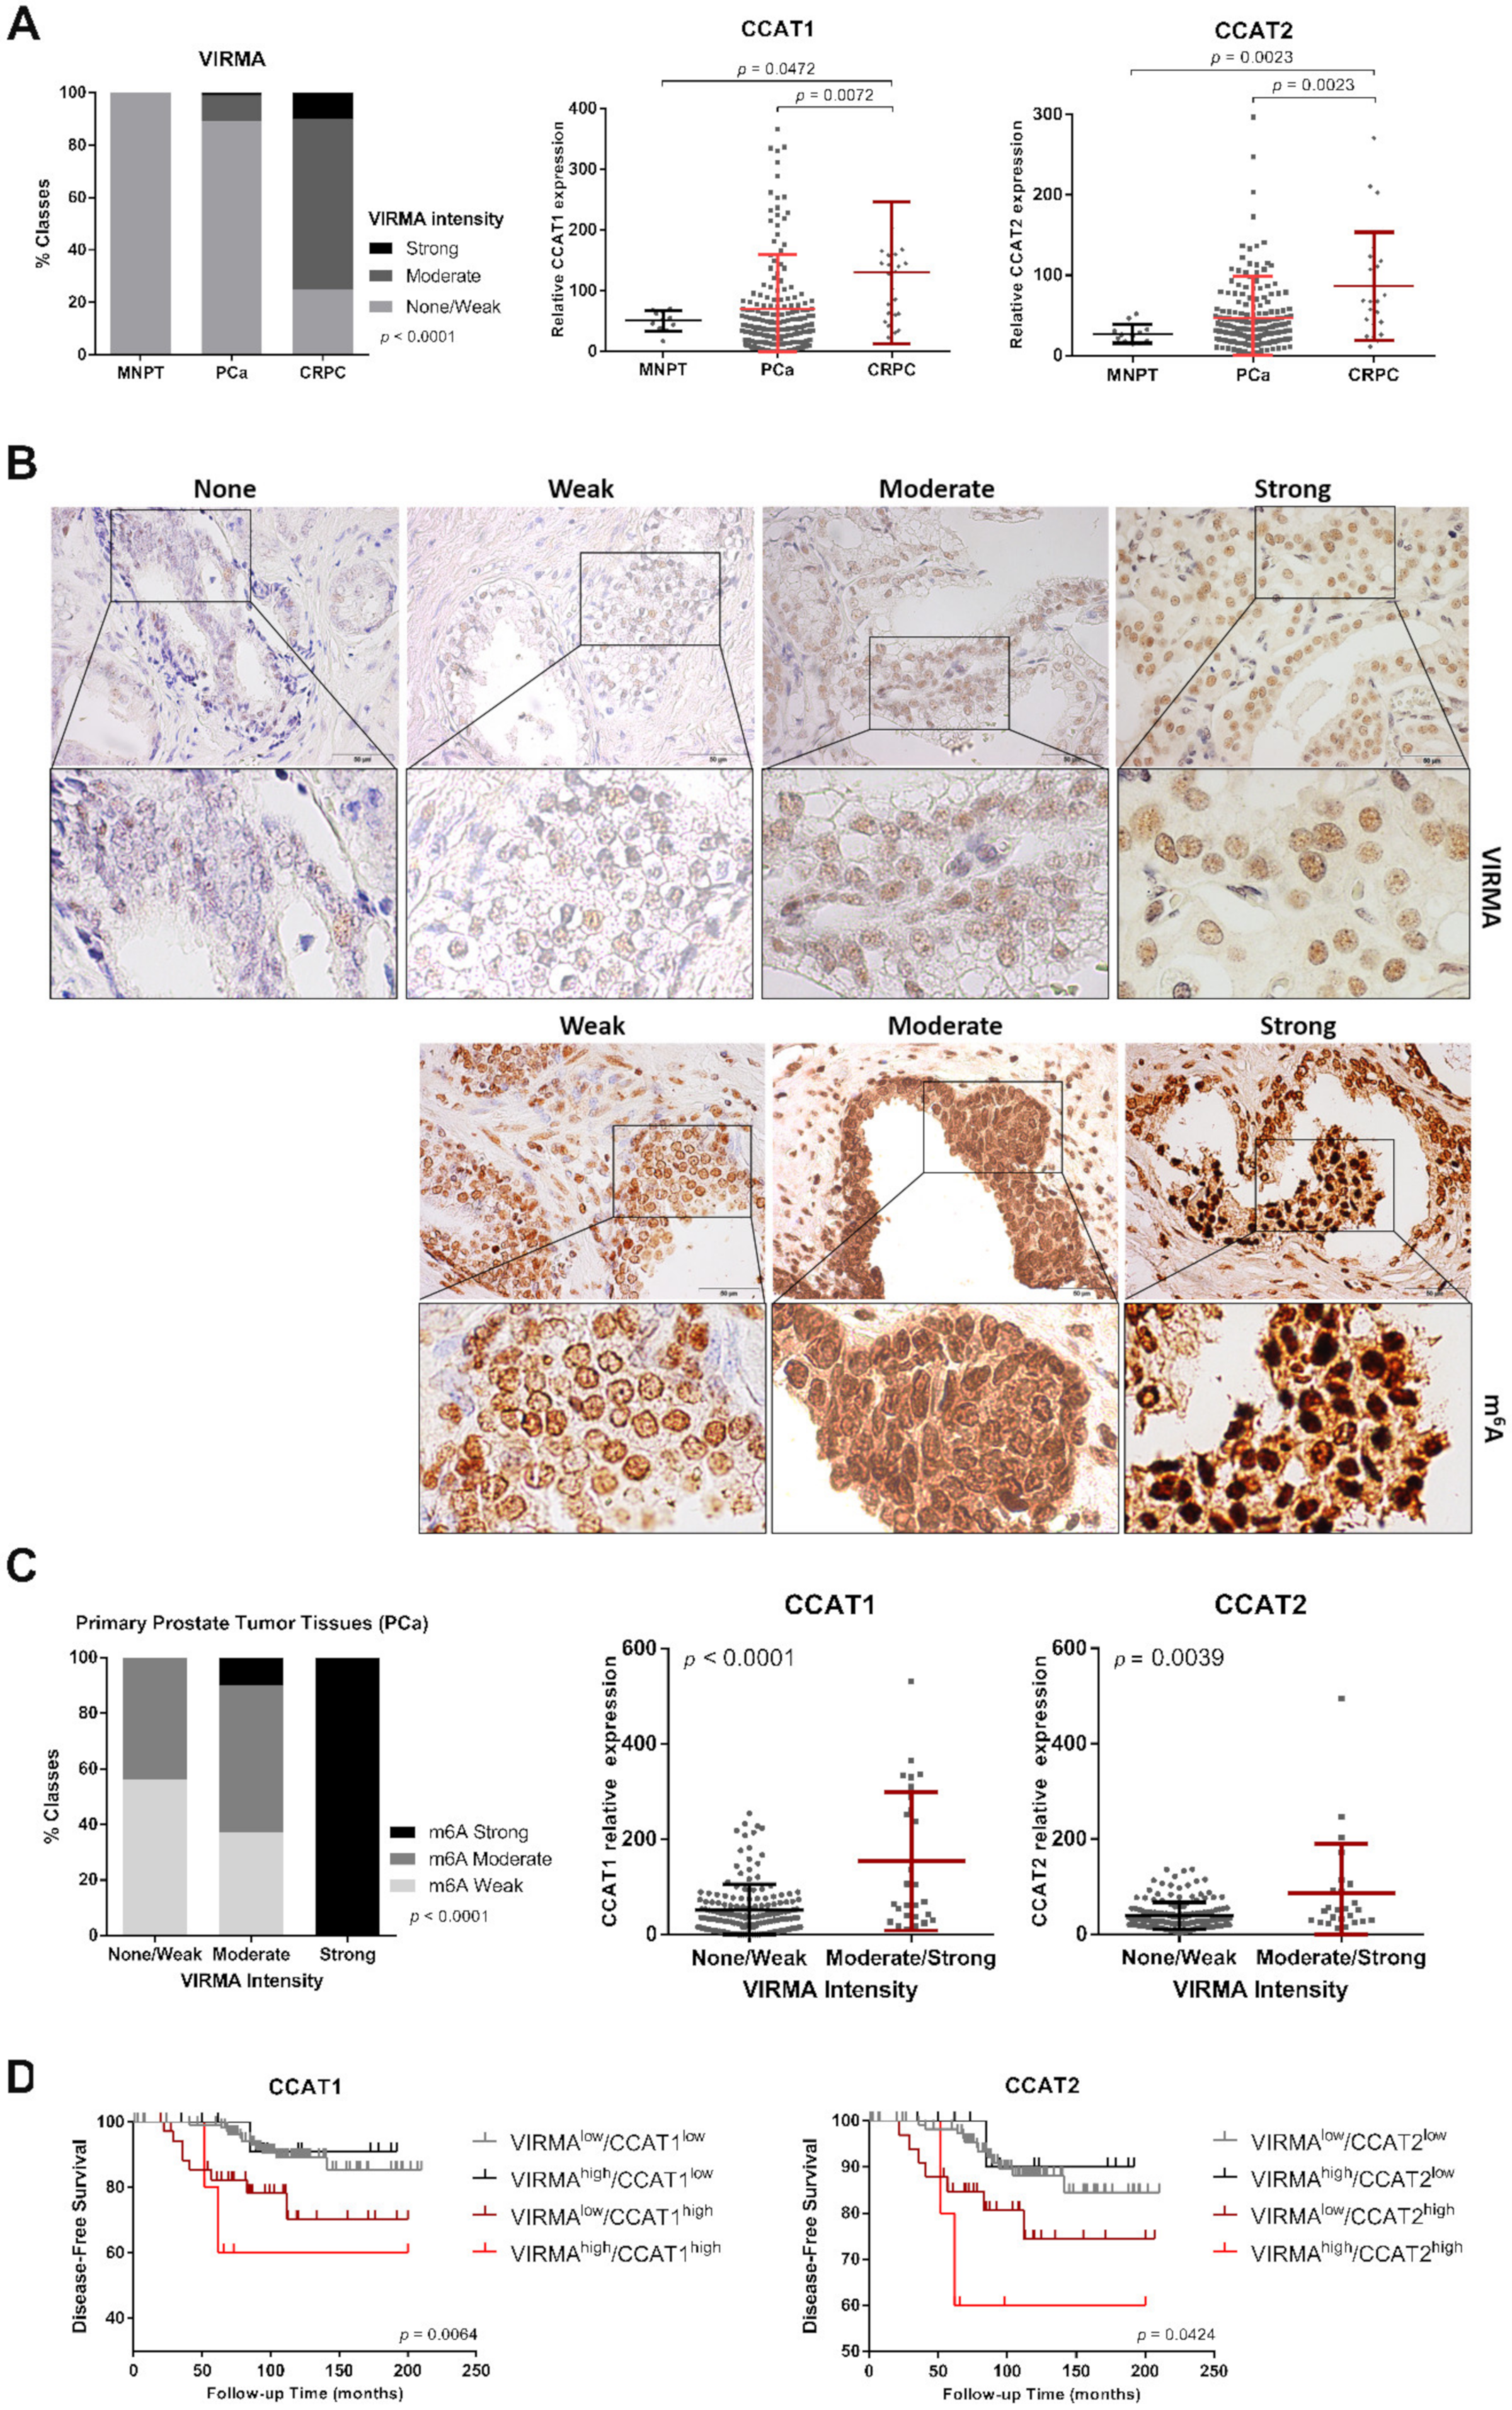
2.5. Higher VIRMA and lncRNAs Expression Predicts Poor Prognosis in PCa Patients

To evaluate whether our findings might hold clinical significance, an independent patient cohort of age matched prostate tissues comprising 198 hormone-naïve PCa, 24 CRPC and 13 morphologically normal prostates (MNPT), all collected at Portuguese Oncology Institute of Porto (IPO Porto), was examined. Immunohistochemistry was performed to evaluate m6A levels and VIRMA protein expression; lncRNA expression was measured using qPCR. Interestingly, VIRMA and lncRNAs CCAT1/2 disclosed higher expression in PCa tissues and were particularly upregulated in CRPC cases compared to hormone-naïve PCa (Figure 7A).
In hormone-naïve PCa, VIRMA expression and cellular m6A methylation levels were positively associated (chi-square test, p < 0.0001). Moreover, samples displaying moderate and strong VIRMA intensity had significantly higher CCAT1/2 lncRNA expression levels compared to samples with weak or absent VIRMA immunoexpression (Mann–Whitney U test, p < 0.0001 and p = 0.0039, respectively) (Figure 7B,C).
Because lncRNA CCAT1 and CCAT2 are involved in regulation of proto-oncogene MYC [20,21], the link between VIRMA-dependent m6A-regulated lncRNAs and their ability to increase MYC expression was also tested in these patient samples. Remarkably, a moderate/weak positive correlation was observed between CCAT1/2 and MYC transcript levels (Spearman r = 0.3 p < 0.0001 for CCAT1; Spearman r = 0.4 p < 0.0001 for CCAT2).
To evaluate the association with clinical parameters, we examined the expression of VIRMA and CCAT1/2 and compared it with standard clinicopathological data (Table S2) by univariate and multivariate analysis. Remarkably, patients with higher VIRMA and lncRNAs CCAT1/2 disclosed worse prognosis and shorter time to biochemical relapse (Figure 7D). Interestingly, higher expression of VIRMA and both lncRNAs (as a group variable) independently predicted shorter disease-free survival (HR = 9.083, CI95% 1.911–43.183, p = 0.006) (Table 1).

3. Discussion

PCa-related deaths are mostly due to advanced disease, refractory to currently used therapies; hence, uncovering the mechanisms involved in high-risk and castration-resistant PCa remains a challenge [22] and further research in this area is imperative. Emerging evidence demonstrates that dysregulation of the molecular machineries involved in RNA modification, and, specifically, of the complexes involved in m6A RNA methylation, may lead to cancer progression [23,24,25]. Nevertheless, findings regarding m6A function in tumor progression are still under debate as the involvement of individual protein factors appears to be tissue and context specific. For instance, m6A demethylase ALKBH5 was reported to induce gastric cancer metastasis by demethylating lncRNA NEAT1 [26], whereas an earlier study showed an important role for ALKBH5 in inhibiting pancreatic cancer progression [27]. Similarly, METTL14 seems to play an oncogenic function in acute myeloid leukemia [28], but in hepatocellular carcinoma, it behaves as metastasis suppressor by modulating m6A dependent microRNA processing [24]. Regarding m6A role in PCa, although still largely unexplored, overexpression of the m6A reader YTHDF2 has been associated with malignant progression [29].
Herein, we aimed to assess the role of m6A and MTC in PCa. TCGA dataset was examined, and VIRMA was identified as the most frequently altered gene of the complex involved in m6A establishment. VIRMA was often amplified, reflecting higher expression in cancer compared with normal tissues. Also, PCa patients with high VIRMA expression endured significantly shorter disease-free survival (DFS). No similar trend was observed for the other complex subunits (METTL3, METTL14 and WTAP). Although all four proteins participate together as MTC subunits, each of them can function independently in other cellular processes [5,30]. Thus, further characterization in a set of PCa cell lines and in an independent patient cohort was carried out. Our findings confirmed VIRMA overexpression and demonstrated increased m6A RNA methylation in androgen-independent PCa cells and CRPC samples, compared to normal cells/tissues. Remarkably, the higher percentage of amplification, and consequently expression, disclosed for VIRMA compared to the other core subunits might be explained by VIRMA genomic location at 8q chromosome, which is commonly altered in locally advanced and metastatic prostate cancers [31,32].
VIRMA is important for the proper establishment of the cellular m6A profile [33] and, indeed, its knockdown in the metastatic androgen-independent PC-3 cells led to significant m6A reduction. Recently, similar results were reported for METTL3 silencing in PCa cell lines [34]. Proteomic analyses established that VIRMA mediates the activity of MTC [35] whereas experimental evidence in Hela cells demonstrated functional protein-protein interaction between VIRMA and the other MTC core subunits METTL3, METTL14, and WTAP [7]. Based on these findings, we hypothesized that the same interaction might also occur in PCa cells and that once VIRMA is depleted, access of methyltransferases to specific RNA substrate is significantly reduced. However, additional studies are needed to further confirm our theory in PCa cell lines.
At the cellular level, VIRMA knockdown significantly inhibited the viability and proliferation of PC-3 cells and abated the malignant phenotype by reducing migration and invasion properties. In other tumor models, downregulation of m6A methylation is also associated with attenuation of malignant features through impairment of epithelial mesenchymal transition of cancer cells and translation of Snail [36]. VIRMA is also reported as regulator of CDK1 mRNA expression, an important cell cycle factor, in an m6A-independent manner [37]. Future research should clarify whether these downstream effects also occur in PCa. Globally, these findings indicate that VIRMA depletion mitigates cancer progression by decreasing m6A RNA methylation levels in PCa, similarly to other cancer types, such as gastric, breast and hepatocellular carcinomas [23,37,38].
The full extent of mechanisms by which m6A marks can modulate the function of mRNA and lncRNA remains to be elucidated. M6A residues can produce local change in the RNA scaffold that may alter RNA folding and affect the interaction with proteins and other RNAs [39,40]. Although most of the m6A studies focused on its role in mRNA function, recent reports showed that m6A may also regulate ncRNAs functions [17]. Similarly to mRNAs, lncRNAs are also dynamically m6A methylated and the modification levels depend on the cell line, tissue type and growth conditions [41,42]. In this study, we focused on potentially m6A-regulated lncRNAs with impact on PCa. Our results demonstrate that in PC-3 cells the cancer-associated lncRNAs CCAT1 and CCAT2 are specifically m6A methylated. Additionally, the reduction of m6A modification at lncRNAs’ specific sites negatively affects their stability, decreasing expression, and ultimately contributing to a less aggressive PCa phenotype. Remarkably, other studies also demonstrated that CCAT1 or CCAT2 knockdown through siRNAs inhibit cell growth, migration, and invasion in PC-3 and DU145 cells [21,43], indicating that CCAT1/2 silencing mimics VIRMA knockdown in metastatic androgen-independent PCa cells.
Interestingly, CCAT2 displayed a faster reduction rate than CCAT1 after Actinomycin D treatment in m6A depleted cells. Transcripts from distinct genes are degraded at substantially different rates and RNA modifications may alter these rates by influencing mRNA’s accumulation and steady-state abundance [44]. Indeed, transcript stability is highly dependent on m6A readers and the RNA-binding proteins that interact with them. Insulin-like growth factor 2 mRNA-binding proteins 1–3 (IGF2BP1-3), were found to stabilize target RNA in an m6A-dependent manner [45], and density and sequence contexts of m6A sites are also likely to be relevant [5]. Future CLASH experiments [46] may provide a more complete and detailed answer to this question. The preferential grouping of m6A sites in the first part of CCAT2 transcript body may contribute to a m6A-switch model, in which m6A regulates protein binding through its influence on RNA structure, as previously described for MALAT1 [47]. Thus, CCAT2 might be more prone to benefit from interaction with m6A reader proteins which could stabilize its structure and protect the transcript from RNA cleavage.
CCAT1 and CCAT2 were discovered as colorectal cancer associated transcripts but have also been shown to be involved in prostate tumorigenesis, among others [43,48]. In fact, in our set of primary tissue samples we found a direct correlation between CCAT1/2 and MYC transcript levels, which plays an oncogenic role in PCa [49]. In view of these results and currently available data, we postulate that stabilization of CCAT1/2 by m6A has an amplifying effect on MYC expression levels in cancer cells via 2 separate mechanisms: (i) Directly, through both lncRNAs acting as super-enhancers that positively regulate MYC mRNA [21]; (ii) Indirectly, by means of CCAT1/2 acting as microRNA sponges for MYC-targeting microRNAs let-7A and miR-145, respectively [50,51,52,53] (Figure 8). Accordingly, a moderate but highly significant correlation between CCTA1/2 and MYC transcript expression was depicted in our clinical samples set. It should be emphasized that this correlation may also be caused by the co-localization of all 4 genes (VIRMA, CCAT1, CCAT2, MYC) at 8q chromosome, which is commonly amplified in PCa, a feature that deserves future investigation.
Lastly, we confirmed that VIRMA expression is significantly associated with CCAT1/2 cellular m6A levels and expression in primary PCa tissues. Subsequent examination of CCAT1/2 expression in IPO-Porto tissue set confirmed that high lncRNA expression levels are a negative prognostic factor, impacting on DFS, in PCa patients and that the addition of VIRMA expression to the model significantly improves its predictive power. Our study is the first to report VIRMA overexpression, at protein level in PCa tissues, particularly in those from patients with castration-resistant disease.
Summarizing, our results suggest that VIRMA is involved in molecular mechanisms that may contribute to the development of mCRPC through m6A deregulation. We further showed that depletion of this methylation mark from cancer-associated lncRNAs specifically affects their expression. Although we have emphasized the importance of VIRMA and lncRNAs CCAT1 and CCAT2 methylation in high-risk PCa using molecular biology strategies, limitations must also be acknowledged. Indeed, in vivo experiments would be beneficial for the validation of these results in a more complex system. Furthermore, considering the observed associations between VIRMA, selected lncRNAs and clinical determinants of tumor behavior, assessment of expression levels in liquid biopsies, such as urine and plasma, should be performed in the future to investigate their potential use as prognostic markers, aiding clinical decision making and management of PCa patients.

4. Materials and Methods

4.1. Bioinformatics Analysis

In silico analysis of the integrity of the genomic regions encoding each one of the MTC subunits was performed on the PCa cohort (492 patients/samples) publicly available at The Cancer Genome Atlas (TCGA) database. The online resource cBioPortal for Cancer Genomics (https://www.cbioportal.org/; last access on 14/02/2020) [54] was used with the user-defined entry gene set “METTL3, METTL14, WTAP, VIRMA”.
RNA sequencing expression data based on TCGA and also in Genotype-Tissue Expression (GTEx) projects were analyzed with an interactive web server, the Gene Expression Profiling Interactive Analysis (GEPIA) server using default parameters (http://gepia.cancer-pku.cn/; last access on 14/02/2020) [16]. A total of 492 prostate adenocarcinoma (PRAD) and 152 normal adjacent tissue samples were analyzed for the expression of key genes involved in m6A establishment. For the generation of dot plots and for ANOVA, genes were considered differentially expressed when expression levels were changed at least two fold (log2 fold-change threshold value equal to or bigger than 1) and had an Benjamini and Hochberg false discovery rate adjusted q-value smaller then 0.01. For survival plots, samples were binned based on quartiles. Samples with expression levels of METTL3, METTL14, WTAP, and VIRMA, higher than 75th percentile were included in the high-expression cohort while samples with expression levels of METTL3, METTL14, WTAP, and VIRMA, lower than 25th percentile were included the low-expression cohort. All other samples were excluded of further analysis. Mantel–Cox test was used for hypothesis test.

4.2. Cell Lines and Cell Culture

Human PCa cell lines available in our lab (22Rv1, LNCaP, VCaP, DU145, and PC-3, all from ATCC) and a non-malignant prostate epithelial cell line (RWPE, kindly provided by Prof. Margarida Fardilha, University of Aveiro, Portugal) were used in this study. Genetically modified PC-3 VIRMA CRISPR knockdown (PC-3KD) was generated by Synthego Corporation with the following guide RNA sequence: 5′ CUAUGGGCUCUUACUCCUGG 3′. Cell culture were performed accordingly [55].

4.3. RNA Methylation Quantification

RNA was extracted with Trizol reagent (Invitrogen, Carlsbad, CA, USA) according to manufacturer’s instructions. The m6A RNA methylation quantification kit (ab185912; Abcam, Cambridge, United Kingdom) was used to measure the m6A content of total RNA following the manufacturer’s instructions. A standard curve was built from synthetic RNAs provided in the kit to infer the m6A levels.

4.4. Protein Extraction and Western Blot Analysis

Total nuclear protein was extracted using Nuclear Extract Kit (Active Motif, Carlsbad, CA, USA). Total cellular protein was extracted using the radioimmune precipitation assay buffer (RIPA) (Santa Cruz Biotechnology Inc, Dallas, TX, USA) with 10% Protease Inhibitor Cocktail (Merck Millipore, Burlington, MA, USA). Western blot analysis was performed as described in [55]. Primary antibodies used and respective dilutions and incubation times are depicted in Table S3. All blot images from direct Western Blot were captured by Bio-Rad ChemiDoc-Western Blot Digital Imaging System and the intensity of each band as well as respective ratio were quantified using Quantity One software (Bio-Rad Laboratories, Hercules, CA, USA), by comparing the protein band intensity with the loading control (β-Actin).

4.5. Immunofluorescence Analysis

Cells were fixed with 4% paraformaldehyde, permeabilized with 0.25% Triton-X and blocked with 5% bovine serum albumin at room temperature. Fixed cells were incubated firstly with primary antibody (Table S3) and then with secondary antibody anti-rabbit immunoglobulin G (Alexa FluorTM 488 goat, A11008, Invitrogen, Carlsbad, CA, USA). DNA staining was performed with 4′,6-diamidino-2-phenylindole (Boster Biological Technology, Pleasanton, CA, USA). Pictures were taken in a fluorescence microscope Olympus IX51 (400× magnification) with digital camera Olympus XM10, using CellSens software.

4.6. Phenotypic Assays

To evaluate the impact of VIRMA knockdown in PC-3, 3-(4,5-dimethylthiazol-2-yl)-2,5-diphenyltetrazolium (MTT; Sigma-Aldrich, St. Louis, MO, USA) assay was performed. To determine differences in cell proliferation the Cell Proliferation ELISA BrdU assay (Roche Applied Sciences, Basel, Switzerland) was used. Invasion ability of cells was analyzed using BD Biocoat™ Matrigel Invasion Chambers (BD Biosciences, San Jose, CA, USA). The procedures followed the published report [23]. For wound-healing assay cells were seeded and grown to 100% confluence and then scratched with a sterile 200 μL pipette tip to create an artificial wound. At 0, 4, 8, and 12 h after wounding, phase-contrast images of the wound healing process were photographed with a 10x objective lens. Eight images per condition were analyzed to determine averaging position of the migrating cells at the wound edges.

4.7. RT² lncRNA PCR Array Human Cancer PathwayFinder

First-strand cDNA synthesis was done with Quantitect Reverse Transcription (Qiagen Hilden, Germany). Real-time PCR was then performed with the commercially available Human Cancer Pathway Finder RT2 Profiler PCR array (Qiagen, Hilden, Germany) according to the manufacturer’s instructions. p-value < 0.0001 (Student’s t-test) and a fold change >3.0 were considered to indicate significant dysregulation.

4.8. N6-Methyladenosine Immunoprecipitation

Immunoprecipitation of m6A was adapted from the EpiMark® N6-Methyladenosine Enrichment Kit (New England Biolabs, Ipswich, MA, USA). RNA samples were fragmented by heating (95 °C 3 min) prior to immunoprecipitation. After immunoprecipitation, RNA was eluted subsequently purified using Purelink RNA Mini Kit (Ambion, Waltham, MA, USA), according to manufacture instructions. For quantification of RNA immunoprecipitation, both input samples and IP elutes were examined by qRT-PCR. Primer sequences are presented in Table S4. To analyze the results, the percentage input method was used [100 × 2^ (Adjusted input − Ct (IP)].

4.9. Actinomycin D Assay

PC-3WT and PC-3KD cells were grown in adequate medium prior addition of 10 µg/mL actinomycin D (Sigma-Aldrich, St. Louis, MO, USA), harvested at 4 different time points and used for RNA isolation. LncRNAs levels were determined using RT-qPCR with the same primers as in Table 1. The data were analyzed using the 2-ΔΔCt method and GUSβ mRNA was used as an endogenous control. Relative lncRNA levels were plotted against time after actinomycin D addition and fitted to a non-linear regression model in order to calculate CCAT1 and CCTA2 lncRNAs’ half-life.

4.10. Tissues and Ethical Statement

Tissues specimens from 198 patients harboring clinically localized prostate carcinoma (PCa), 24 CRPC and 13 morphologically normal prostate tissue (MNPT) samples were collected at Portuguese Oncology Institute of Porto (IPO-Porto). Histological slides from formalin-fixed paraffin-embedded tissue fragments were obtained from the surgical specimens and assessed for Gleason score and TNM stage. Relevant clinical data was collected from clinical charts. This study was approved by the institutional review board (Comissão de Ética para a Saúde-(CES-IPOFG-EPE 205/2013)) of IPO Porto.

4.11. Immunohistochemistry

Antigenic recovery was performed with EDTA buffer in water bath and endogenous peroxidase activity was blocked by 0.6% hydrogen peroxide. Nonspecific reactions were blocked with normal horse serum (dilution 1:50). Slides were incubated with the primary antibodies (Table S3) and with Novolink™ Polymer Detection System (Leica Biosystems, Wetzlar, Germany). Diaminobenzidine was used as chromogen and hematoxylin as counterstain. Normal testicle and normal brain tissue were used as positive controls for VIRMA and m6A, respectively. Immunoexpression intensity was estimated by an expert uropathologist, considering staining as “weak”, “moderate”, or “strong”.

4.12. Validation of Selected lncRNAs in Prostate Tissues

RNA was reverse transcribed and amplified using TransPlex Whole Transcriptome Amplification Kit (Sigma–Aldrich, St. Louis, MO, USA) with subsequent purification using QIAquick PCR Purification Kit (Qiagen, Hilden, Germany), according to manufacturer’s instructions. CCAT1 and CCAT2 levels were evaluated using Xpert Fast Sybr Master Mix (GRiSP Research Solutions, Porto, Portugal) and specific primers (Table S4). To determine the relative expression levels in each sample, the values of the target gene were normalized using an internal reference genes (GUSβ).

4.13. Statistical Analysis

Data was tabulated using Microsoft Excel 2016 and analyzed using IBM SPSS Statistics version 24 (IBM-SPSS Inc., Chicago, IL, USA) and GraphPad Prism 7 (GraphPad Software Inc., La Jolla, CA, USA). Differences in relative expression among groups were assessed by the non-parametric Mann–Whitney U test. Associations between categorical variables were determined by means of a Chi-square test. Prognostic significance was assessed by the Kaplan–Meier curves with log-rank test. Cox regression model analysis was used to compare performance between PSA levels, pathological stage and VIRMA/lncRNAs expression as prognostic variables. Disease-free survival (DFS) was calculated from the date of the radical prostatectomy (primary treatment) to the date of biochemical relapse (2 PSA tests ≥ 0.2 ng/mL after prostatectomy), date of last follow-up, or death if relapse-free. For the purposes of survival analyses, all cases were coded based on the expression levels of each lncRNA or VIRMA expression using the 75th percentile value as empirical threshold.

5. Conclusions

The methyltransferase associated protein VIRMA is the most commonly affected m6A writer in PCa cell line models and clinical samples. VIRMA is essential for the maintenance of m6A RNA methylation in PCa. Depletion of VIRMA in a mCRPC cell line model reduced global m6A levels leading to attenuation of phenotypic aggressive features. The removal of specific m6A marks from the investigated lncRNAs, CCAT1 and CCAT2, led to reduced transcript stability and abundance.
These results provide new insights on the role of RNA methylation associated with prostate cancer aggressiveness and may assist in the development of novel prognostic markers for high-risk PCa and CRPC. The functional importance of lncRNA methylation in PCa is yet to be elucidated in full depth.

Supplementary Materials

The following are available online at https://www.mdpi.com/2072-6694/12/4/771/s1; Table S1: RT² lncRNA PCR Array Human Cancer Pathway Finder data, Table S2: Clinical and pathological data of the fresh-frozen tissues included in this study, Table S3: Primary antibodies used in Western blot, immunofluorescence and immunohistochemistry, Table S4: Specific primer sequences. Full western blot images are provided in Supplementary information file.

Author Contributions

Formal analysis, D.B.-S.; Funding acquisition, C.J.; Investigation, D.B.-S., J.L., C.G.-T., I.C. and J.O.; Methodology, D.B.-S., C.G.-T. and I.C.; Project administration, R.H.; Supervision, E.S.M.-U., R.H. and C.J.; Writing – original draft, D.B.-S.; Writing – review & editing, E.S.M.-U., R.H. and C.J. All authors have read and agreed to the published version of the manuscript.

Funding

This research was funded by Fundação para a Ciência e Tecnologia—FCT (POCI-01-0145-FEDER-29030). Part of this work was carried out in the framework of the European COST Action EPITRAN CA16120. D.B.-S. and J.L. are supported by FCT—Fundação para a Ciência e Tecnologia (SFRH/BD/136007/2018 and SFRH/BD/132751/2017, respectively).

Acknowledgments

The authors are grateful to the patients that volunteered to provide samples and to all the personnel of the Department of Urology of the Portuguese Oncology Institute of Porto that kindly collaborated in this study.

Conflicts of Interest

The authors declare no conflict of interest.

References

  1. Rawla, P. Epidemiology of Prostate Cancer. World J. Oncol. 2019, 10, 63. [Google Scholar] [CrossRef] [PubMed] [Green Version]
  2. Esteller, M.; Pandolfi, P.P. The epitranscriptome of noncoding RNAs in cancer. Cancer Discov. 2017, 7, 359–368. [Google Scholar] [CrossRef] [PubMed] [Green Version]
  3. Meyer, K.D.; Jaffrey, S.R. Rethinking m6A readers, writers, and erasers. Ann. Rev. Cell Dev. Biol. 2017, 33, 319–342. [Google Scholar] [CrossRef] [Green Version]
  4. Tong, J.; Flavell, R.A.; Li, H.B. RNA m 6 A modification and its function in diseases. Front. Med. 2018, 12, 481–489. [Google Scholar] [CrossRef] [PubMed] [Green Version]
  5. Shi, H.; Wei, J.; He, C. Where, when, and how: Context-dependent functions of RNA methylation writers, readers, and erasers. Mol. Cell 2019, 74, 640–650. [Google Scholar] [CrossRef]
  6. Yang, Y.; Hsu, P.J.; Chen, Y.S.; Yang, Y.G. Dynamic transcriptomic m 6 A decoration: Writers, erasers, readers and functions in RNA metabolism. Cell Res. 2018, 28, 616–624. [Google Scholar] [CrossRef] [Green Version]
  7. Yue, Y.; Liu, J.; Cui, X.; Cao, J.; Luo, G.; Zhang, Z.; Cheng, T.; Gao, M.; Shu, X.; Ma, H. VIRMA mediates preferential m 6 A mRNA methylation in 3′ UTR and near stop codon and associates with alternative polyadenylation. Cell Discov. 2018, 4, 10. [Google Scholar] [CrossRef] [Green Version]
  8. Huang, J.; Yin, P. Structural insights into N6-methyladenosine (m6A) modification in the transcriptome. Genom. Proteom. Bioinform. 2018, 16, 85–98. [Google Scholar] [CrossRef]
  9. Zhang, S. Mechanism of N6-methyladenosine modification and its emerging role in cancer. Pharmacol. Ther. 2018, 189, 173–183. [Google Scholar] [CrossRef]
  10. Zhang, S.; Zhao, B.S.; Zhou, A.; Lin, K.; Zheng, S.; Lu, Z.; Chen, Y.; Sulman, E.P.; Xie, K.; Bögler, O. m6A demethylase ALKBH5 maintains tumorigenicity of glioblastoma stem-like cells by sustaining FOXM1 expression and cell proliferation program. Cancer Cell 2017, 31, 591–606. [Google Scholar] [CrossRef] [Green Version]
  11. Taketo, K.; Konno, M.; Asai, A.; Koseki, J.; Toratani, M.; Satoh, T.; Doki, Y.; Mori, M.; Ishii, H.; Ogawa, K. The epitranscriptome m6A writer METTL3 promotes chemo-and radioresistance in pancreatic cancer cells. Int. J. Oncol. 2018, 52, 621–629. [Google Scholar] [CrossRef] [PubMed] [Green Version]
  12. Zhou, S.; Bai, Z.L.; Xia, D.; Zhao, Z.J.; Zhao, R.; Wang, Y.Y.; Zhe, H. FTO regulates the chemo-radiotherapy resistance of cervical squamous cell carcinoma (CSCC) by targeting β-catenin through mRNA demethylation. Mol. Carcinog. 2018, 57, 590–597. [Google Scholar] [CrossRef] [PubMed]
  13. Shafik, A.; Schumann, U.; Evers, M.; Sibbritt, T.; Preiss, T. The emerging epitranscriptomics of long noncoding RNAs. Biochimica Biophysica Acta 2016, 1859, 59–70. [Google Scholar] [CrossRef] [PubMed]
  14. Jacob, R.; Zander, S.; Gutschner, T. The dark side of the epitranscriptome: Chemical modifications in long non-coding RNAs. Int. J. Mol. Sci. 2017, 18, 2387. [Google Scholar] [CrossRef] [PubMed] [Green Version]
  15. Ceder, Y.; Bjartell, A.; Culig, Z.; Rubin, M.A.; Tomlins, S.; Visakorpi, T. The molecular evolution of castration-resistant prostate cancer. Eur. Urol. Focus 2016, 2, 506–513. [Google Scholar] [CrossRef]
  16. Tang, Z.; Li, C.; Kang, B.; Gao, G.; Li, C.; Zhang, Z. GEPIA: A web server for cancer and normal gene expression profiling and interactive analyses. Nucl. Acids Res. 2017, 45, W98–W102. [Google Scholar] [CrossRef] [Green Version]
  17. Fazi, F.; Fatica, A. Interplay between N6-methyladenosine (m6A) and non-coding RNAs in cell development and cancer. Front. Cell Dev. Biol. 2019, 7, 116. [Google Scholar] [CrossRef]
  18. Martens-Uzunova, E.S.; Böttcher, R.; Croce, C.M.; Jenster, G.; Visakorpi, T.; Calin, G.A. Long noncoding RNA in prostate, bladder, and kidney cancer. Eur. Urol. 2014, 65, 1140–1151. [Google Scholar] [CrossRef]
  19. Zhou, Y.; Zeng, P.; Li, Y.H.; Zhang, Z.; Cui, Q. SRAMP: Prediction of mammalian N6-methyladenosine (m6A) sites based on sequence-derived features. Nucl. Acids Res. 2016, 44, e91–e91. [Google Scholar] [CrossRef] [Green Version]
  20. Ghafouri-Fard, S.; Taheri, M. Colon Cancer-Associated Transcripts 1 and 2: Roles and functions in human cancers. J. Cell. Physiol. 2019, 234, 14581–14600. [Google Scholar] [CrossRef]
  21. Hamilton, M.J.; Young, M.D.; Sauer, S.; Martinez, E. The interplay of long non-coding RNAs and MYC in cancer. AIMS Biophys. 2015, 2, 794. [Google Scholar] [CrossRef] [PubMed]
  22. Xie, L.; Li, J.; Wang, X. Updates in prostate cancer detections and treatments–Messages from 2017 EAU and AUA. Asian J. Urol. 2018, 5, 3. [Google Scholar] [CrossRef] [PubMed]
  23. Cheng, X.; Li, M.; Rao, X.; Zhang, W.; Li, X.; Wang, L.; Huang, G. Kiaa1429 regulates the migration and invasion of hepatocellular carcinoma by altering m6a modification of ID2 mRNA. OncoTargets Ther. 2019, 12, 3421. [Google Scholar] [CrossRef] [PubMed] [Green Version]
  24. Ma, J.Z.; Yang, F.; Zhou, C.C.; Liu, F.; Yuan, J.H.; Wang, F.; Wang, T.T.; Xu, Q.G.; Zhou, W.P.; Sun, S.H. METTL14 suppresses the metastatic potential of hepatocellular carcinoma by modulating N6-methyladenosine-dependent primary MicroRNA processing. Hepatology 2017, 65, 529–543. [Google Scholar] [CrossRef] [PubMed]
  25. Yue, B.; Song, C.; Yang, L.; Cui, R.; Cheng, X.; Zhang, Z.; Zhao, G. METTL3-mediated N6-methyladenosine modification is critical for epithelial-mesenchymal transition and metastasis of gastric cancer. Mol. Cancer 2019, 18, 142. [Google Scholar] [CrossRef] [PubMed] [Green Version]
  26. Zhang, J.; Guo, S.; Piao, H.Y.; Wang, Y.; Wu, Y.; Meng, X.Y.; Yang, D.; Zheng, Z.C.; Zhao, Y. ALKBH5 promotes invasion and metastasis of gastric cancer by decreasing methylation of the lncRNA NEAT1. J. Physiol. Biochem. 2019, 75, 379–389. [Google Scholar] [CrossRef] [Green Version]
  27. He, Y.; Hu, H.; Wang, Y.; Yuan, H.; Lu, Z.; Wu, P.; Liu, D.; Tian, L.; Yin, J.; Jiang, K. ALKBH5 inhibits pancreatic Cancer motility by decreasing long non-coding RNA KCNK15-AS1 methylation. Cell. Physiol. Biochem. 2018, 48, 838–846. [Google Scholar] [CrossRef]
  28. Weng, H.; Huang, H.; Wu, H.; Qin, X.; Zhao, B.S.; Dong, L.; Shi, H.; Skibbe, J.; Shen, C.; Hu, C. METTL14 inhibits hematopoietic stem/progenitor differentiation and promotes leukemogenesis via mRNA m6A modification. Cell Stem Cell 2018, 22, 191–205.e199. [Google Scholar] [CrossRef] [Green Version]
  29. Li, J.; Meng, S.; Xu, M.; Wang, S.; He, L.; Xu, X.; Wang, X.; Xie, L. Downregulation of N6-methyladenosine binding YTHDF2 protein mediated by miR-493-3p suppresses prostate cancer by elevating N6-methyladenosine levels. Oncotarget 2018, 9, 3752. [Google Scholar]
  30. Lobo, J.; Barros-Silva, D.; Henrique, R.; Jerónimo, C. The emerging role of epitranscriptomics in cancer: Focus on urological tumors. Genes 2018, 9, 552. [Google Scholar] [CrossRef] [Green Version]
  31. Silva, M.P.; Barros-Silva, J.D.; Vieira, J.; Lisboa, S.; Torres, L.; Correia, C.; Vieira-Coimbra, M.; Martins, A.T.; Jerónimo, C.; Henrique, R. NCOA2 is a candidate target gene of 8q gain associated with clinically aggressive prostate cancer. Genes Chromosom. Cancer 2016, 55, 365–374. [Google Scholar] [CrossRef] [PubMed]
  32. Steiner, T.; Junker, K.; Burkhardt, F.; Braunsdorf, A.; Janitzky, V.; Schubert, J. Gain in chromosome 8q correlates with early progression in hormonal treated prostate cancer. Eur. Urol. 2002, 41, 167–171. [Google Scholar] [CrossRef]
  33. Lesbirel, S.; Viphakone, N.; Parker, M.; Parker, J.; Heath, C.; Sudbery, I.; Wilson, S.A. The m 6 A-methylase complex recruits TREX and regulates mRNA export. Sci. Rep. 2018, 8, 13827. [Google Scholar] [CrossRef] [Green Version]
  34. Cai, J.; Yang, F.; Zhan, H.; Situ, J.; Li, W.; Mao, Y.; Luo, Y. RNA m 6 A Methyltransferase METTL3 Promotes The Growth Of Prostate Cancer By Regulating Hedgehog Pathway. OncoTargets Ther. 2019, 12. [Google Scholar] [CrossRef] [PubMed] [Green Version]
  35. Balacco, D.L.; Soller, M. The m6A writer: Rise of a machine for growing tasks. Biochemistry 2018, 58, 363–378. [Google Scholar] [CrossRef] [PubMed]
  36. Lin, X.; Chai, G.; Wu, Y.; Li, J.; Chen, F.; Liu, J.; Luo, G.; Tauler, J.; Du, J.; Lin, S. RNA m 6 A methylation regulates the epithelial mesenchymal transition of cancer cells and translation of Snail. Nat. Commun. 2019, 10, 1–13. [Google Scholar] [CrossRef]
  37. Qian, J.Y.; Gao, J.; Sun, X.; Cao, M.D.; Shi, L.; Xia, T.S.; Zhou, W.B.; Wang, S.; Ding, Q.; Wei, J.F. KIAA1429 acts as an oncogenic factor in breast cancer by regulating CDK1 in an N6-methyladenosine-independent manner. Oncogene 2019, 38, 6123–6141. [Google Scholar] [CrossRef]
  38. Miao, R.; Dai, C.C.; Mei, L.; Xu, J.; Sun, S.W.; Xing, Y.L.; Wu, L.S.; Wang, M.H.; Wei, J.F. KIAA1429 regulates cell proliferation by targeting c-Jun messenger RNA directly in gastric cancer. J. Cell Physiol. 2020. [Google Scholar] [CrossRef]
  39. Edupuganti, R.R.; Geiger, S.; Lindeboom, R.G.; Shi, H.; Hsu, P.J.; Lu, Z.; Wang, S.Y.; Baltissen, M.P.; Jansen, P.W.; Rossa, M. N 6-methyladenosine (m 6 A) recruits and repels proteins to regulate mRNA homeostasis. Nat. Struct. Mol. Biol. 2017, 24, 870. [Google Scholar] [CrossRef]
  40. Liu, N.; Dai, Q.; Zheng, G.; He, C.; Parisien, M.; Pan, T. N 6-methyladenosine-dependent RNA structural switches regulate RNA–protein interactions. Nature 2015, 518, 560. [Google Scholar] [CrossRef] [Green Version]
  41. Han, Y.; Feng, J.; Xia, L.; Dong, X.; Zhang, X.; Zhang, S.; Miao, Y.; Xu, Q.; Xiao, S.; Zuo, Z. CVm6A: A Visualization and Exploration Database for m6As in Cell Lines. Cells 2019, 8, 168. [Google Scholar] [CrossRef] [PubMed] [Green Version]
  42. Xiao, S.; Cao, S.; Huang, Q.; Xia, L.; Deng, M.; Yang, M.; Jia, G.; Liu, X.; Shi, J.; Wang, W. The RNA N 6-methyladenosine modification landscape of human fetal tissues. Nat. Cell Biol. 2019, 21, 651. [Google Scholar] [CrossRef] [PubMed]
  43. Zheng, J.; Zhao, S.; He, X.; Zheng, Z.; Bai, W.; Duan, Y.; Cheng, S.; Wang, J.; Liu, X.; Zhang, G. The up-regulation of long non-coding RNA CCAT2 indicates a poor prognosis for prostate cancer and promotes metastasis by affecting epithelial-mesenchymal transition. Biochem. Biophys. Res. Commun. 2016, 480, 508–514. [Google Scholar] [CrossRef] [PubMed]
  44. Eisen, T.J.; Eichhorn, S.W.; Subtelny, A.O.; Lin, K.S.; McGeary, S.E.; Gupta, S.; Bartel, D.P. The dynamics of cytoplasmic mRNA metabolism. Mol. Cell 2020, 77, 786–799. [Google Scholar] [CrossRef]
  45. Huang, H.; Weng, H.; Sun, W.; Qin, X.; Shi, H.; Wu, H.; Zhao, B.S.; Mesquita, A.; Liu, C.; Yuan, C.L. Recognition of RNA N 6-methyladenosine by IGF2BP proteins enhances mRNA stability and translation. Nat. Cell Biol. 2018, 20, 285–295. [Google Scholar] [CrossRef]
  46. Helwak, A.; Tollervey, D. Mapping the miRNA interactome by cross-linking ligation and sequencing of hybrids (CLASH). Nat. Protoc. 2014, 9, 711. [Google Scholar] [CrossRef] [Green Version]
  47. Zhou, K.I.; Parisien, M.; Dai, Q.; Liu, N.; Diatchenko, L.; Sachleben, J.R.; Pan, T. N6-methyladenosine modification in a long noncoding RNA hairpin predisposes its conformation to protein binding. J. Mol. Biol. 2016, 428, 822–833. [Google Scholar] [CrossRef] [Green Version]
  48. Chen, H.; He, Y.; Hou, Y.; Chen, D.; He, S.; Cao, Y.; Wu, X. Long non-coding RNA CCAT1 promotes the migration and invasion of prostate cancer PC-3 cells. Eur. Rev. Med. Pharmacol. Sci. 2018, 22, 2991–2996. [Google Scholar]
  49. Barros-Silva, D.; Costa-Pinheiro, P.; Duarte, H.; Sousa, E.J.; Evangelista, A.F.; Graça, I.; Carneiro, I.; Martins, A.T.; Oliveira, J.; Carvalho, A.L. MicroRNA-27a-5p regulation by promoter methylation and MYC signaling in prostate carcinogenesis. Cell Death Dis. 2018, 9, 167. [Google Scholar] [CrossRef]
  50. Zhuang, K.; Wu, Q.; Jiang, S.; Yuan, H.; Huang, S.; Li, H. CCAT1 promotes laryngeal squamous cell carcinoma cell proliferation and invasion. Am. J. Transl. Res. 2016, 8, 4338. [Google Scholar]
  51. Yu, Y.; Nangia-Makker, P.; Farhana, L.; Majumdar, A.P.N. A novel mechanism of lncRNA and miRNA interaction: CCAT2 regulates miR-145 expression by suppressing its maturation process in colon cancer cells. Mol. Cancer 2017, 16, 155. [Google Scholar] [CrossRef] [PubMed]
  52. Sampson, V.B.; Rong, N.H.; Han, J.; Yang, Q.; Aris, V.; Soteropoulos, P.; Petrelli, N.J.; Dunn, S.P.; Krueger, L.J. MicroRNA let-7a down-regulates MYC and reverts MYC-induced growth in Burkitt lymphoma cells. Cancer Res. 2007, 67, 9762–9770. [Google Scholar] [CrossRef] [PubMed] [Green Version]
  53. Chen, Z.; Zeng, H.; Guo, Y.; Liu, P.; Pan, H.; Deng, A.; Hu, J. miRNA-145 inhibits non-small cell lung cancer cell proliferation by targeting c-Myc. J. Exp. Clin. Cancer Res. 2010, 29, 151. [Google Scholar] [CrossRef] [PubMed] [Green Version]
  54. Cerami, E.; Gao, J.; Dogrusoz, U.; Gross, B.E.; Sumer, S.O.; Aksoy, B.A.; Jacobsen, A.; Byrne, C.J.; Heuer, M.L.; Larsson, E. The cBio cancer genomics portal: An open platform for exploring multidimensional cancer genomics data. Cancer Discov. 2012, 2, 401–404. [Google Scholar] [CrossRef] [PubMed] [Green Version]
  55. Graça, I.; Sousa, E.J.; Costa-Pinheiro, P.; Vieira, F.Q.; Torres-Ferreira, J.; Martins, M.G.; Henrique, R.; Jerónimo, C. Anti-neoplastic properties of hydralazine in prostate cancer. Oncotarget 2014, 5, 5950. [Google Scholar] [CrossRef] [PubMed] [Green Version]
Figure 1. VIRMA expression is increased in prostate cancer (PCa) and associates with tumor relapse. (A) Alteration frequency of METTL3, METTL14, WTAP, and VIRMA in PCa TCGA cohort (n = 492). (B) mRNA expression levels of m6A modifying enzymes in clinical tissue samples of The Cancer Genome Atlas (TCGA) and GTEx prostate adenocarcinoma (n = 492, red boxplot) and adjacent normal specimens (n = 152, grey boxplot). (C) Disease-free survival curves of patients with high mRNA expression (red line) and with low mRNA expression (blue line) (Mantel–Cox test).
Cancers 12 00771 g001aCancers 12 00771 g001b
Figure 2. m6A RNA methylation is increased in androgen-independent prostate cancer cells. (A) Schematic illustration representing the methyltransferase complex (MTC) subunits that establish the m6A methylation mark; (B) m6A modification levels of total RNA assessed by ELISA in normal prostate basal epithelium cells (RWPE) and 5 different PCa cell lines (22RV1, LNCaP, VCaP, Du145, PC-3); (C) Western blot analysis showing the protein levels of each of the MTC subunits in the same cells. Shown is the relative protein abundance (normalized to β-actin). Data are shown as means ± SD and are representative of at least three independent experiments. * p < 0.05, Mann–Whitney U test.
Cancers 12 00771 g002
Figure 3. VIRMA knockdown in PC-3 cells caused global m6A reduction. (A) Sanger sequencing of PC-3 Wild Type (control) and CRISPR edited sequences in the regions around the guide sequence (the horizontal black underlined region represents the RNA guide sequence, the horizontal red underline is the PAM site and the vertical black dotted line represents the cut site); (B) Western blot quantification of the total amount of METTL3, METTL14, WTAP, and VIRMA in the nuclear protein fraction after VIRMA knockdown. Relative protein abundance was determined by normalization with LAMINB1. Bars represent mean ± SD based on 3 independent experiments, * p < 0.05, Mann–Whitney U test. (C) Global m6A modification levels in total RNA after VIRMA silencing in PC-3 cells, * p < 0.05 and ** p < 0.001, Mann–Whitney U test; (D) VIRMA expression and m6A levels assessed by confocal immunofluorescent assay (scale bar = 20 µm).
Cancers 12 00771 g003
Figure 4. VIRMA expression promotes PC-3 cells growth and progression in vitro. (A) MTT assay for the number of viable PC-3WT and PC-3KD cells at 24 h, 48 h, and 72 h after seeding. (B) Quantitation of Wound-healing assay for PC-3WT and PC-3KD. Points and connecting line on the left panel represent the migration index of wound-healing assay over the course of 12 h. The distance migrated by PC-3KD cells is represented as relative to that migrated by PC-3WT cells in the same time period. Representative photos are shown in the panel on the right. (C) Proliferation of PC-3WT and PC-3KD cells assessed by BrdU assay at 24 h. (D) Invasion of PC-3WT and PC-3KD cells assessed by Matrigel transwell assay at 24 h. Column bars in (C) and (D) represent the average number of cells from 3 independent experiments. Error bars represent ± SD. ** p < 0.001 * p < 0.05, Mann–Whitney U test.
Cancers 12 00771 g004
Figure 5. VIRMA expression endorses long non-coding RNAs (lncRNAs) expression in m6A-dependent way. (A) Heat map and clustering analysis of lncRNAs expression in PC-3WT and PC-3KD cells, 3 biological replicates per condition. The 27 lncRNAs differentially expressed are underline red and the selected ones are further highlighted in yellow; (B) Potential m6A binding sites at lncRNAs CCAT1 and CCAT2 predicted with high and very high confidence (red and purple lines) by SRAMP (http://www.cuilab.cn/sramp/) [19]. Red and green arrows indicate the regions corresponding to PCR amplicons used for lncRNA quantification in immunoprecipitation experiments; (C) Abundance CCAT1 and CCAT2 transcripts in m6A-RNA IP pools from PC-3WT and PC-3KD cells. After purification precipitated RNA was used as a template for reverse transcription and real-time PCR with primers as indicated in 5b. Data is represented as percentage of input; **** p < 0.0001 and * p < 0.05, Mann–Whitney U test.
Cancers 12 00771 g005
Figure 6. m6A stabilizes CCAT1 and CCAT2 lncRNAs. VIRMA knockdown decreases the stability of lncRNA CCAT1 (A) and CCAT2 (B) in PC-3 cells upon treatment with Actinomycin D, * p < 0.05 and *** p < 0.0001, Sum of squares F test.
Cancers 12 00771 g006
Figure 7. VIRMA, CCAT1, and CCAT2 are overexpressed in PCa tissues and associate with poor prognosis. (A) On the left, the contingency graph displaying the immunostaining intensity of VIRMA (chi-square test) and, on the right, the scatter plot representing the relative lncRNA expression (Mann–Whitney U test) in morphologically normal prostate tissue (MNPT), hormone-naïve PCa (PCa) and castration-resistant PCa (CRPC); (B) Representative images of VIRMA and m6A immunostaining in the IPO-Porto patient cohort; (C) m6A immunostaining intensity and relative lncRNA expression in hormone-naïve PCa tissues stratified according to VIRMA immunostaining intensity; (D) Kaplan–Meier survival curves of VIRMA and CCAT1/2, log-rank test.
Cancers 12 00771 g007
Figure 8. Proposed mechanism of the interplay between the putative VIRMA-dependent m6A-regulated CCAT1/2 lncRNAs and MYC proto-oncogene.
Cancers 12 00771 g008
Table 1. Multivariate Cox Regression analysis.
Disease-Free Survival (DFS)VariableHR95% CI for HRp-Value
PSA levels<10 ng/mL1 (referent) 0.086
≥10 ng/mL2.6071.116–6.0890.027
Pathological stage (pT)pT21 (referent) 0.028
pT3a2.7740.983–7.8270.052
pT3b3.9021.264–12.0450.018
VIRMA/CCAT1/CCAT2 expressionVIRMAlow/lncRNAlow1 (referent) 0.033
VIRMAlow/lncRNAhigh2.4750.978–6.2590.041
VIRMAhigh/lncRNAhigh9.0831.911–43.1830.006
HR – Hazard ratio; CI – Confidence interval; Statistically significant p-values (<0.05) are highlighted in bold.

