Article

Ion Channel Expression in Human Melanoma Samples: In Silico Identification and Experimental Validation of Molecular Targets

by
Daniela D’Arcangelo
1,
Francesca Scatozza
1,
Claudia Giampietri
2,
Paolo Marchetti
3,
Francesco Facchiano
4 and
Antonio Facchiano
1,*
1
Istituto Dermopatico dell’Immacolata (IDI-IRCCS), 00167 Rome, Italy
2
Department of Anatomy, Histology, Forensic Medicine and Orthopedics, Unit of Histology and Medical Embryology, Sapienza University of Rome, 00161 Rome, Italy
3
Medical Oncology, Sapienza, University of Rome, 00161 Rome, Italy
4
Department of Oncology and Molecular Medicine, Istituto Superiore di Sanità (ISS), 00161 Rome, Italy
*
Author to whom correspondence should be addressed.
Cancers 2019, 11(4), 446; https://doi.org/10.3390/cancers11040446
Submission received: 5 March 2019 / Revised: 20 March 2019 / Accepted: 23 March 2019 / Published: 29 March 2019
(This article belongs to the Special Issue Ion Channels in Cancer)

Abstract

:
Expression of 328 ion channel genes was investigated, by in silico analysis, in 170 human melanoma samples and controls. Ninety-one members of this gene-family (i.e., about 28%) show a significant (p < 0.05) differential expression in melanoma- vs. nevi-biopsies, taken from the GEO database. ROC (receiver operating characteristic) analysis selected 20 genes as potential markers showing the highest discrimination ability of melanoma vs. nevi (AUC > 0.90 and p < 0.0001). These 20 genes underwent a first in silico-validation round in an independent patients-dataset from GEO. A second-in silico-validation step was then carried out on a third human dataset in Oncomine. Finally, five genes were validated, showing extremely high sensitivity and specificity in melanoma detection (>90% in most cases). Such five genes (namely, SCNN1A, GJB3, KCNK7, GJB1, KCNN2) are novel potential melanoma markers or molecular targets, never previously related to melanoma. The “druggable genome” analysis was then carried out. Miconazole, an antifungal drug commonly used in clinics, is known to target KCNN2, the best candidate among the five identified genes. Miconazole was then tested in vitro in proliferation assays; it dose-dependently inhibited proliferation up to 90% and potently induced cell-death in A-375 and SKMEL-28 melanoma cells, while it showed no effect in control cells. Moreover, specific silencing of KCNN2 ion channel was achieved by siRNA transfection; under such condition miconazole strongly increases its anti-proliferative effect. In conclusion, the present study identified five ion channels that can potentially serve as sensitive and specific markers in human melanoma specimens and demonstrates that the antifungal drug miconazole, known to target one of the five identified ion channels, exerts strong and specific anti-melanoma effects in vitro.

1. Introduction

Ion channels play a key role in the physiology of any cell- and tissue-type; this makes ion channels ideal potential therapeutic targets [1]. In a way, they represent the tollbooths filtering the molecular flux on the highways connecting the intracellular to the extracellular environment. Given the exceptional role of ion channels in controlling almost any cellular function, drugs targeting ion channels may cover a market of several billion USD [2]. Thus, it is no surprise the large interest pharmaceutical companies give to ion channels as molecular targets in many different pathological conditions, such as pain relief [3], cardiovascular diseases [4,5,6], diabetes [7], infectious diseases such as Hepatitis C virus [8] and influenza virus [9], CNS diseases [10,11,12,13], and cystic fibrosis [14,15]. Increasing interest is currently given to ion channels in cancers since they have been indicated as potential drug targets in many cancer conditions [16,17,18]. We have recently reported an extensive ion channels expression analysis in several solid tumors demonstrating relevant and significant alterations in bladder cancer, glioblastoma, melanoma, breast cancer, and lung carcinoma, in more than 3000 patients [19], further indicating ion channels as potential therapeutic targets or molecular markers in cancer field. Indeed, ion channels expression has been related to clinical outcome in breast cancer [20] and the role of different ion channels has been recently demonstrated in lung cancer [21,22] as well as prostate cancer [23,24,25]. Mutation in glutamate receptors have been related to increased survival in malignant melanoma [26]. In addition, directly targeting mitochondrial potassium channels exerts a potent antitumor effect in vivo in melanoma and in pancreatic adenocarcinoma mouse models [27]. These data confirm the crucial role ion channels play in many cancer conditions including melanoma and prompted us to investigate the expression level of 328 ion channels in human melanoma samples looking for ion channels genes acting as potential markers and molecular targets in a melanoma set up.

2. Results

The general procedure followed in the present study is summarized in Figure 1.

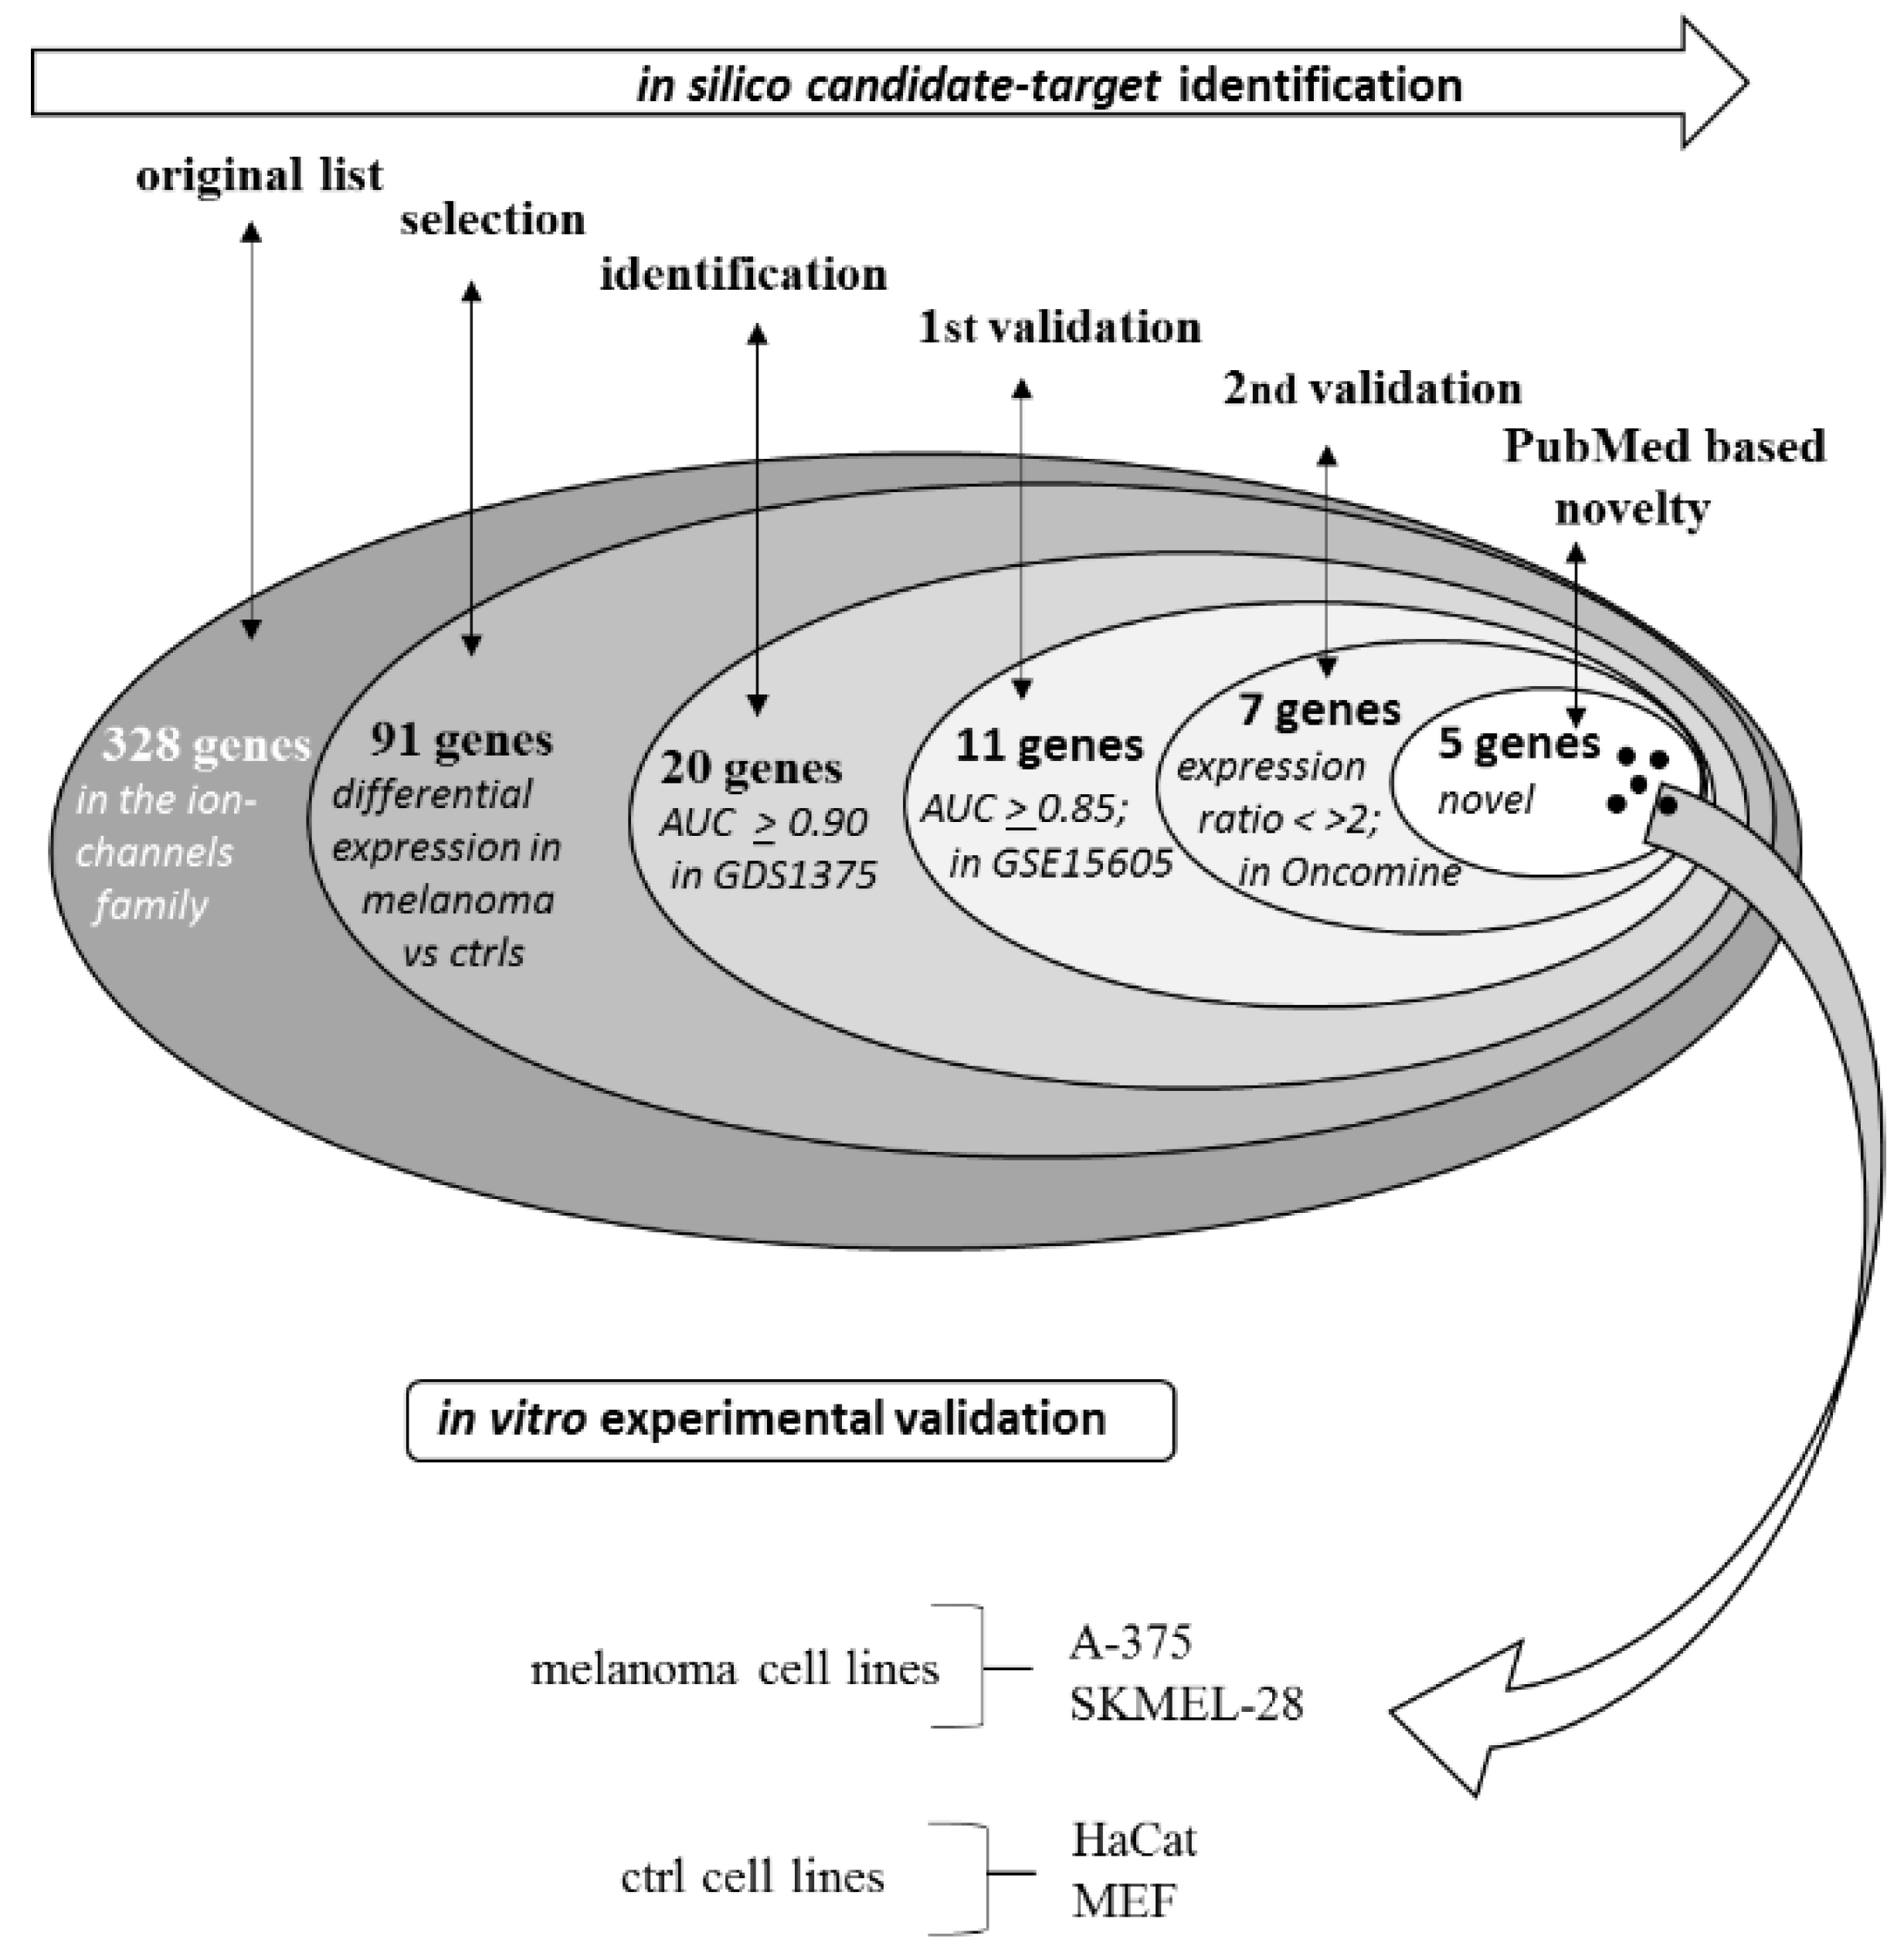
2.1. Selection Phase

The expression level of each of the 328 genes reported in Table 1 was compared in melanoma vs. controls. Table 2 reports the 91 genes showing a statistically different expression level in melanoma vs. controls (p < 0.05). The genes are reported in order of their p value, starting from the most significant (p > 10−18) down to the p > 0.05 threshold. Indeed, more than half of such genes fall within the p value below the 10−4 range, highlighting that a relevant number of members of the ion channels family are strongly and significantly modified in melanoma biopsies. For each gene, the computed fold change in melanoma vs. controls is also indicated, along with the AUC (area under the curve) according to the ROC (receiver operating characteristic) analysis. AUC indicates the ability to discriminate melanoma from nevi samples. Several genes show an extremely significant p value combined with a high fold change and high AUC value. Genes showing AUC > 0.90 and a p < 0.0001, i.e., a significant discriminating ability of at least 90%, were selected and are reported in Table 3, sorted according to the AUC level.
The analysis was carried out in GDS1375 dataset from the GEO database, containing data from 45 melanoma biopsies and 18 normal skin biopsies.

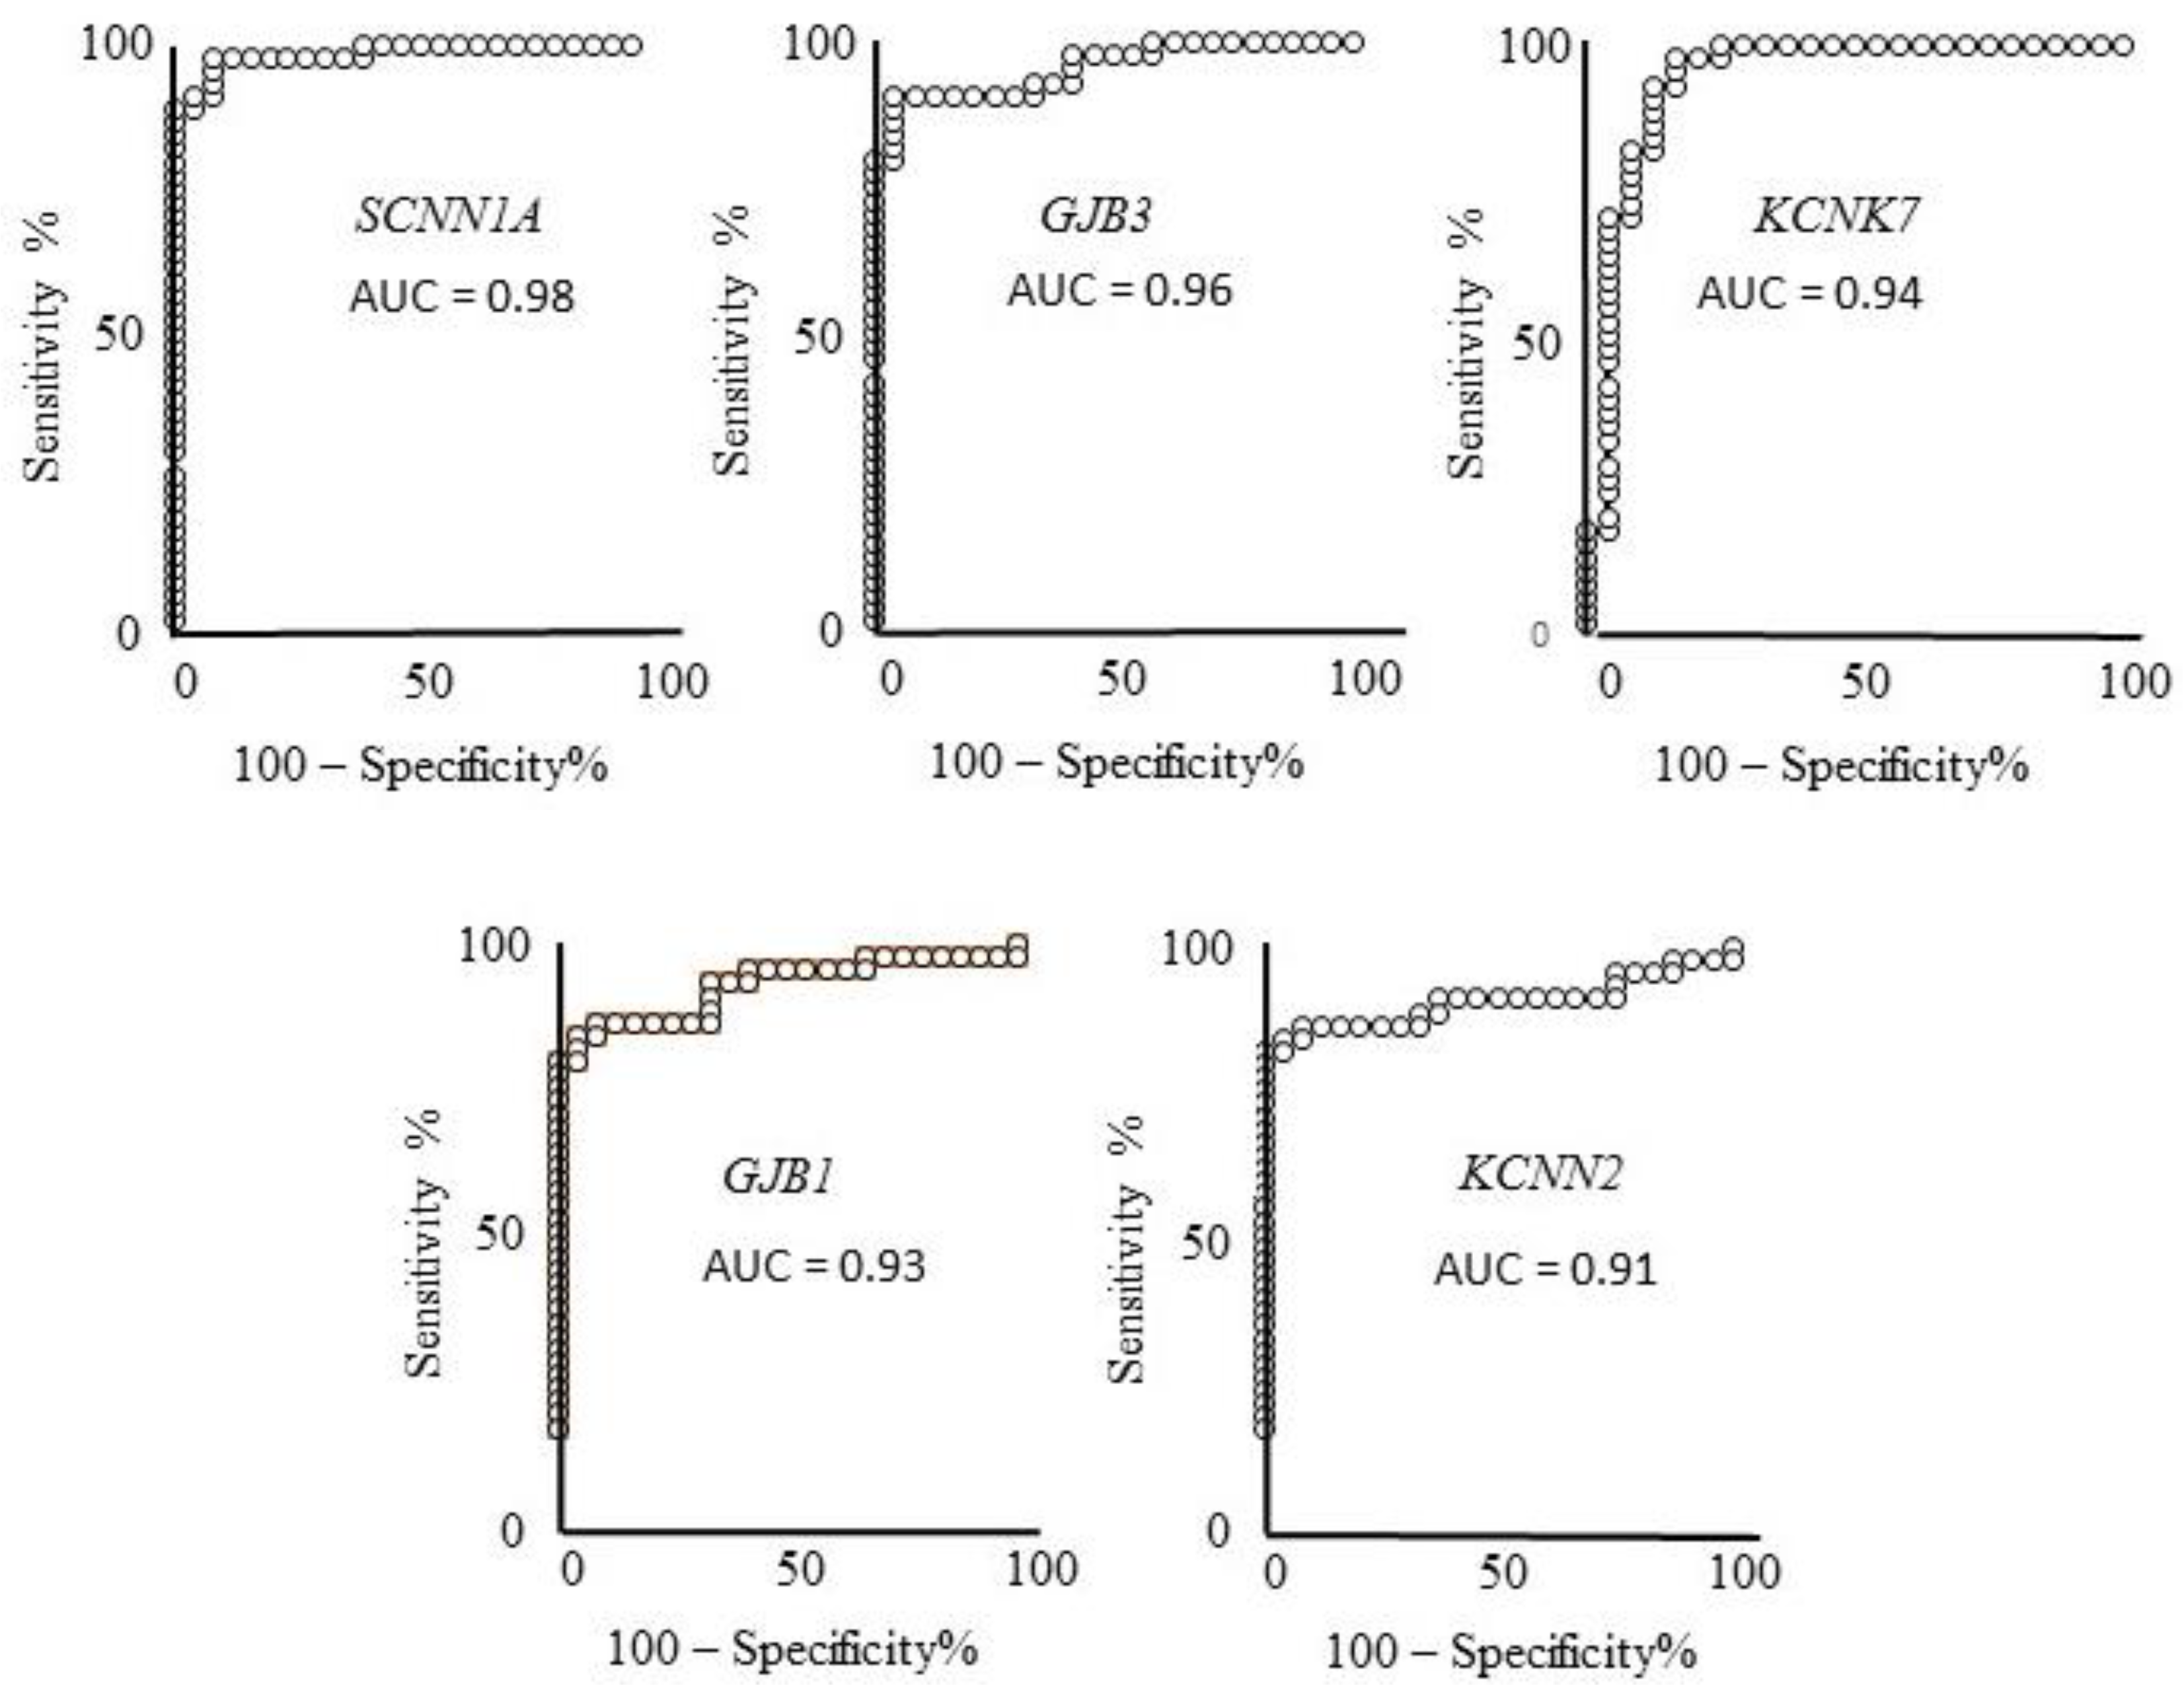
2.1.1. First-Round Validation Step

The 20 genes having AUC ≥ 0.90 according to the expression levels reported in the GEO dataset GDS1375 were then analyzed in a different human samples dataset (GEO GSE15605) presenting data from 62 patients. Eleven genes showing an AUC level ≥ 0.85 in the second dataset were selected as genes validated in the 1st round validation, namely: SCNN1A, ANO1, GJA1, GJB3, SCNN1B, GABRE, KCNK7, KCND3, KCNK1, GJB1, KCNN2 (see Table 3).

2.1.2. Second-Round Validation Step

The 11 genes analyzed in GDS1375 and first-round validated in GSE15605 were then analyzed in a third dataset, namely the Riker dataset from Oncomine database. The seven genes showing an expression ratio in melanoma/controls <0.5 or >2 were then identified, namely: SCNN1A, ANO1, GJB3, GABRE, KCNK7, GJB1, KCNN2 (see Table 3) and were considered second-round validated. Any known relation of these five genes with melanoma was then investigated according to a PubMed search, and they were all selected as novel genes:
SCNN1A (“Sodium Channel Epithelial 1 Alpha Subunit”, sodium channel, non-voltage-gated, amiloride sensitive),
GJB3 (“Gap Junction Protein Beta 3”, gap-junction component, connexin gene family member),
KCNK7 (“Potassium Two Pore Domain Channel Subfamily K Member 7”, potassium channel),
GJB1 (“Gap Junction Protein Beta 1”, gap-junction component, connexin gene family member),
KCNN2 (“Potassium Calcium-Activated Channel Subfamily N Member 2”, potassium channel).
No co-occurrence of their gene name or synonymous names is reported with “melanoma” word, in any field in PubMed searches (see Table 3, right end-side column). These five genes were then selected as the best novel candidates as melanoma markers and melanoma molecular targets. Figure 2 depicts the corresponding ROC curves of the five best candidates computed on the expression values reported in the GDS 1375 dataset. In all cases an AUC > 0.90 and p < 0.0001 is reported, i.e., a very high and significant ability to discriminate melanoma from healthy controls samples. The sensitivity and specificity values were computed as reported in the Methods section, indicating: 92% specificity and 97.7% sensitivity for SCNN1A; 96% specificity and 91% sensitivity for GJB3; 84% specificity and 97.7 sensitivity for KCNK7; 96% specificity and 84.4% sensitivity for GJB1; 100% specificity and 82.2% sensitivity for KCNN2.

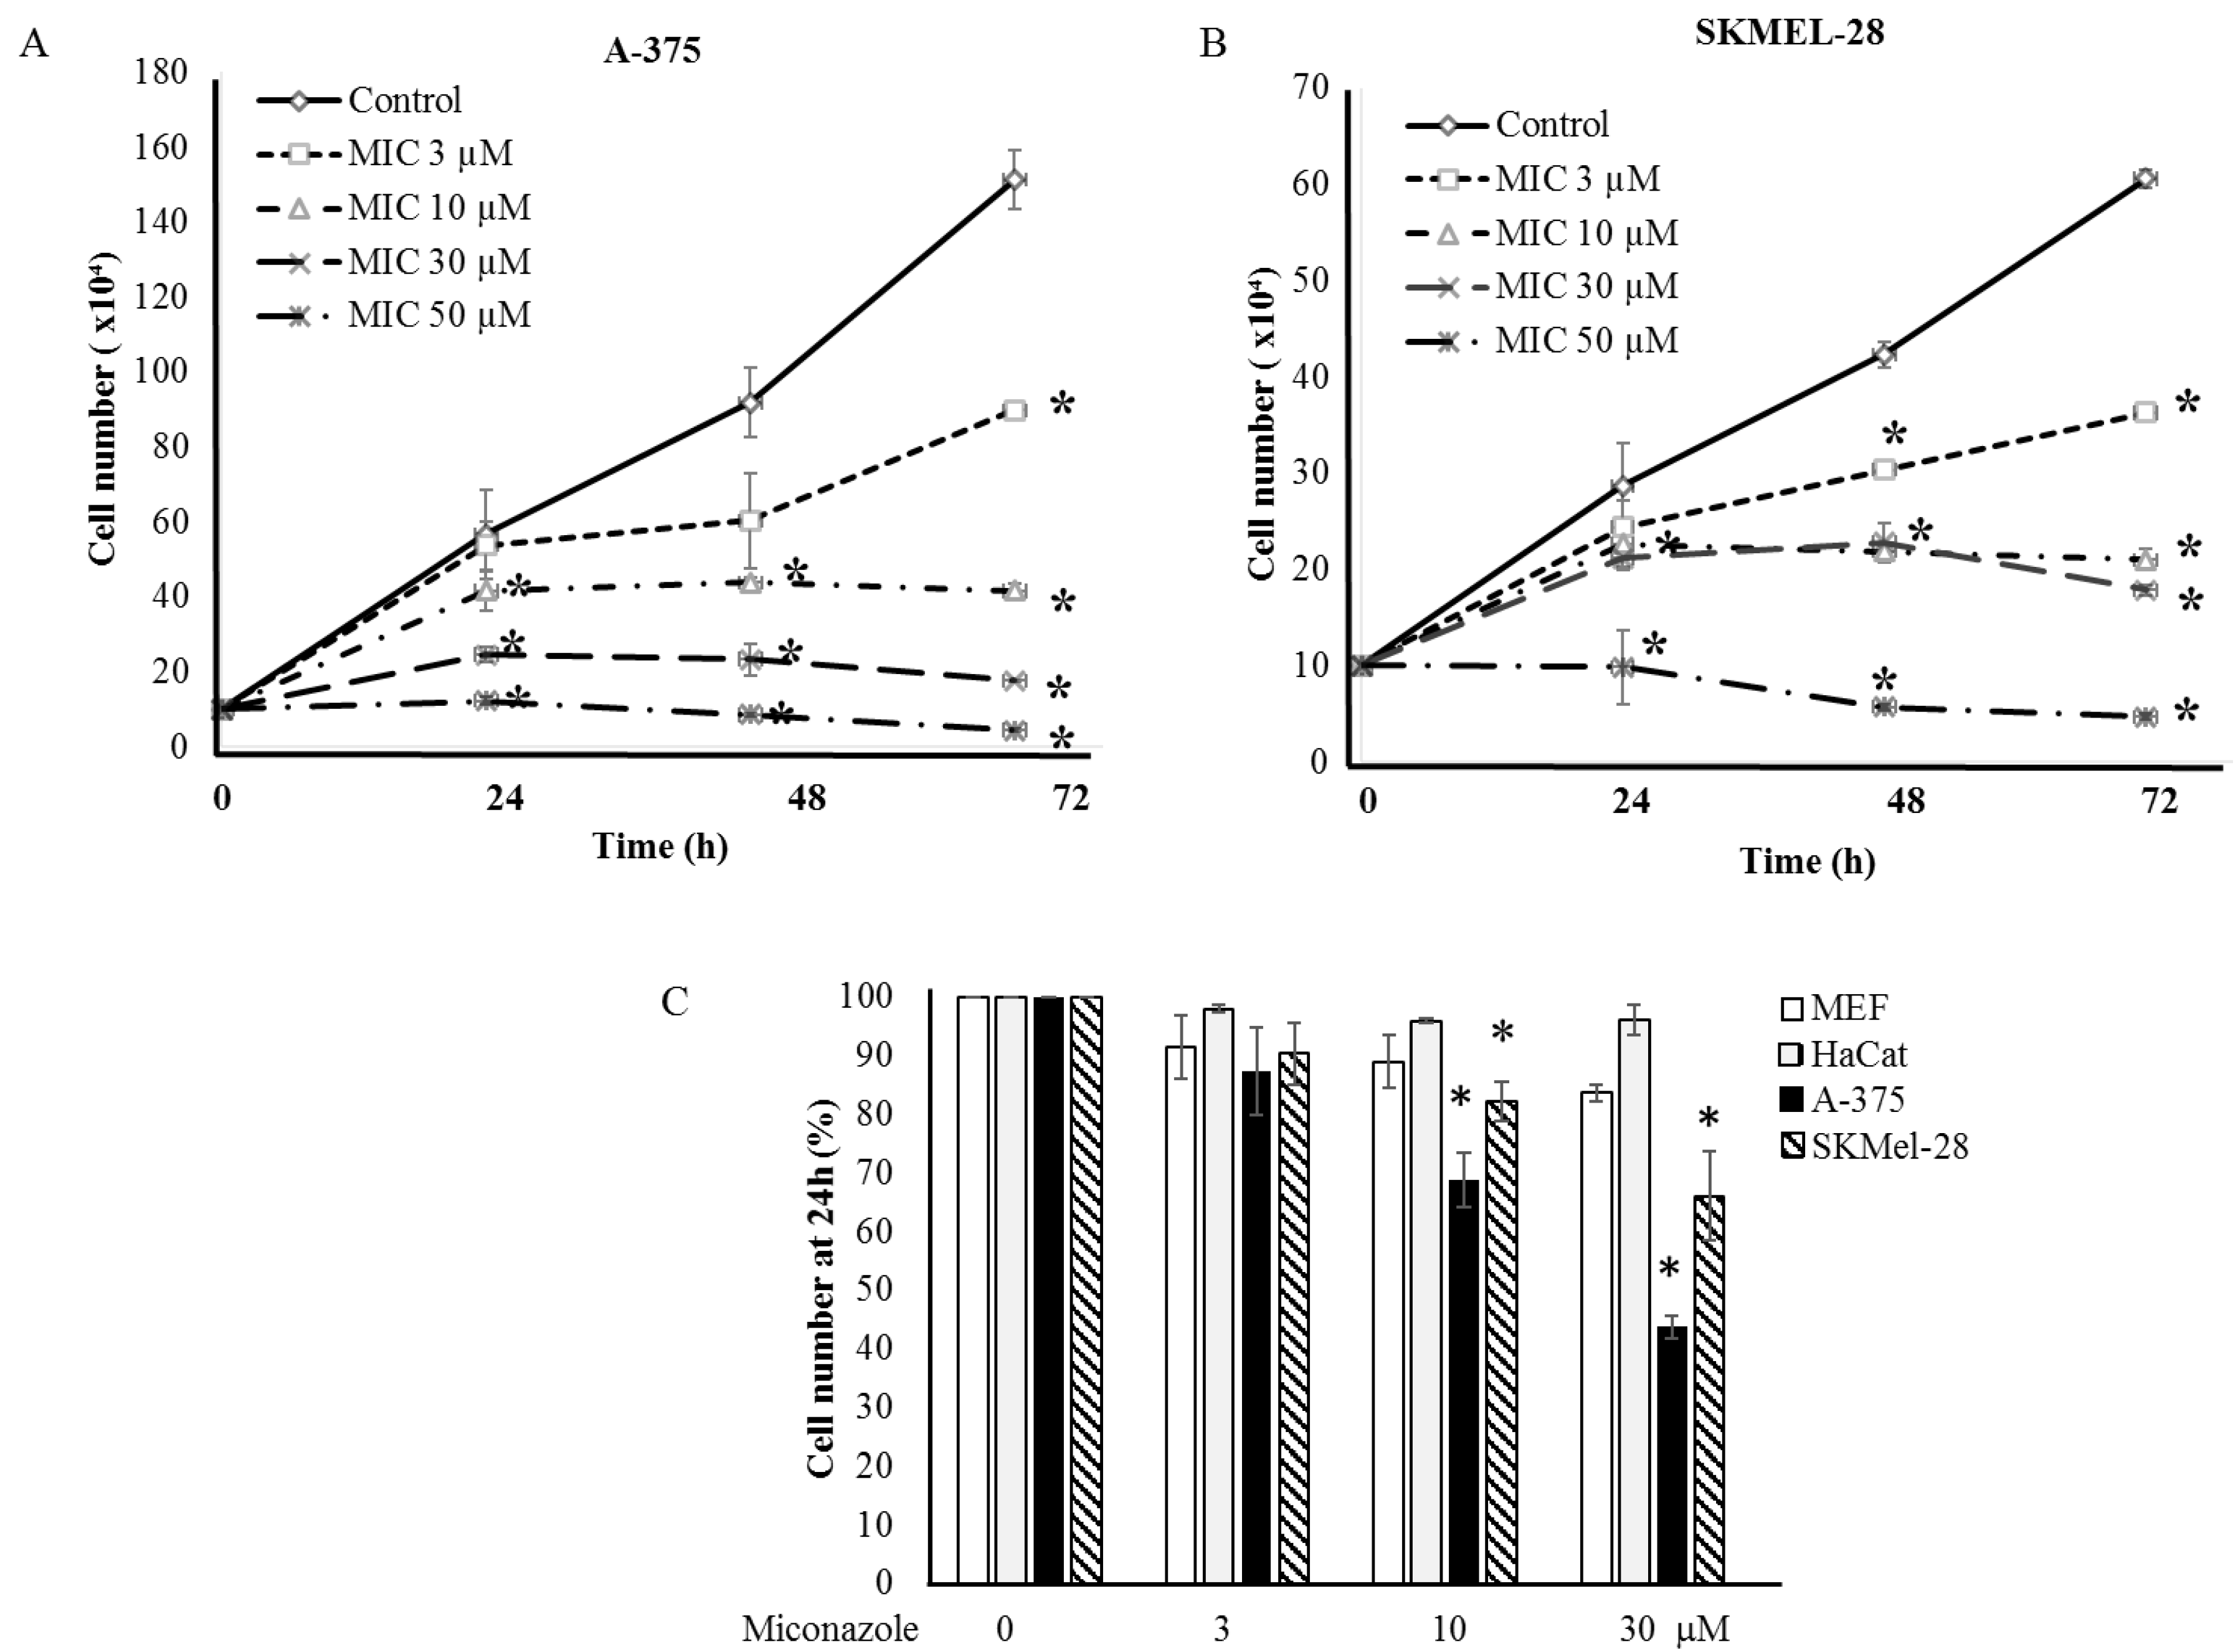
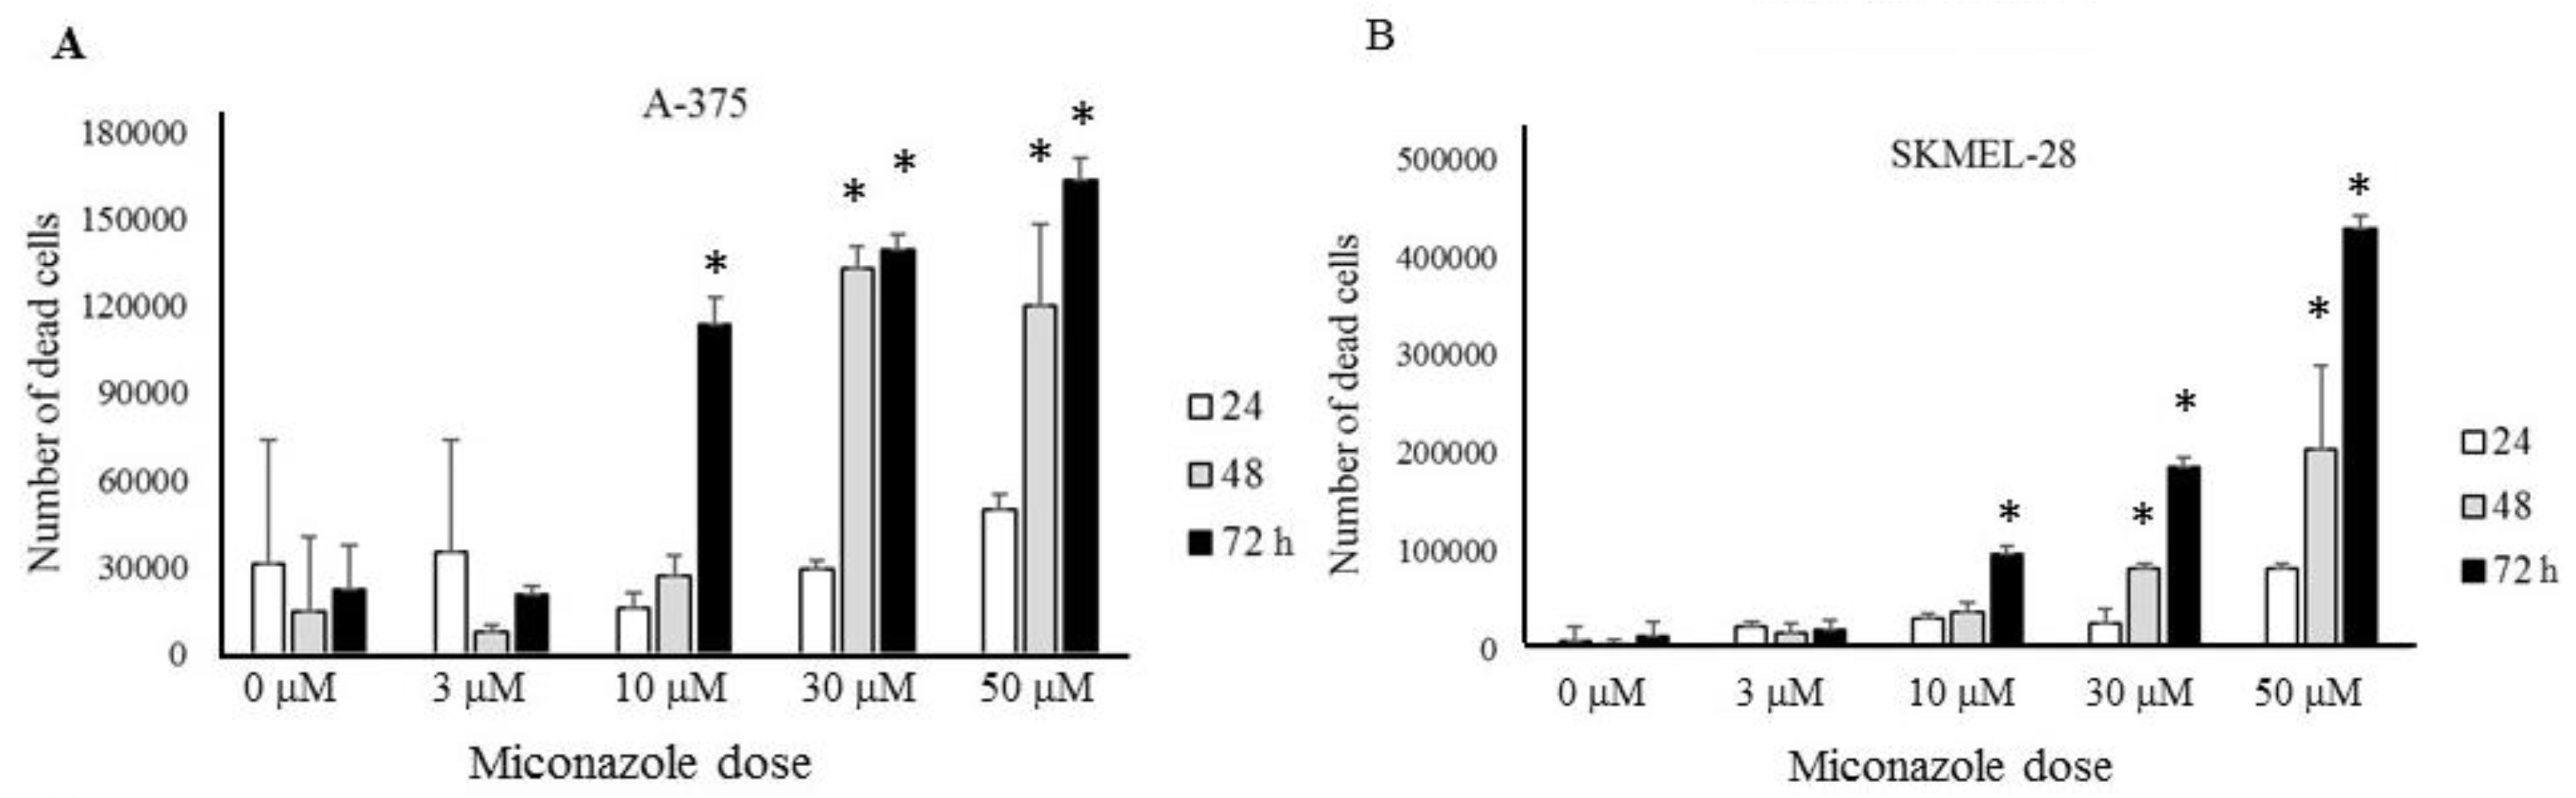
2.2. Experimental Validation

According to the in silico screening and validations steps carried out and described above, SCNN1A, GJB3, KCNK7, GJB1, KCNN2 genes were selected as best candidate melanoma markers and potential molecular targets. The five identified genes are down-regulated in three cases (namely SCNN1A, GJB3, KCNK7) and up-regulated in two cases (namely GJB1 and KCNN2). Interestingly, both down- and up-regulated molecules may represent suitable molecular targets, exploiting the available blockers or activators, respectively. The five genes were then analyzed as targets of known FDA-approved drugs. The analysis was carried out on http://www.dgidb.org/search_interactions. Table 4 reports the results of this analysis, indicating a number of drugs (namely triamterene, amiloride, flufenamic acid, carbenoxolone, miconazole, tubucurarine, and bendroflumethiazide) known to target the identified ion channels. Main known tissue targets and pharmacological actions are also reported; such drugs act on muscles, joints, kidney, CNS, and also act on systemic targets. We focused our attention onto miconazole, an antifungal compound commonly used to treat skin infections. Miconazole has known skin distribution and dermatological pharmacokinetics; we, therefore, hypothesized it may be suitable for other skin diseases.
A Chilibot analysis identifies literature-reported functional relationships within user-defined terms. It identified the known functional relationships reported in literature among melanoma, ion channels, miconazole and cytochrome P450, one of the best characterized targets of miconazole. Chilibot analysis is reported in Figure 3, highlighting that miconazole inhibits cytochrome P450; melanoma and cytochrome P450 are connected by both stimulatory and inhibitory relations; potassium channels are known to inhibit cytochrome P450 [28] and their inhibitors are known to inhibit melanoma [29]. According to this scenario, a potassium channel inhibitor and cytochrome P450 inhibitor such as miconazole may significantly affect melanoma proliferation. Miconazole was then tested in vitro in a proliferation assay on two human melanoma cell lines, i.e., one more aggressive (namely A-375) and the other less aggressive (namely SKMEL-28). Proliferation was measured in the presence of 10% FCS. The results of a dose-dependent and time-dependent proliferation assay are reported in Figure 4A,B. Miconazole 10, 30, and 50 μM doses show a strong dose-dependent inhibition of serum-induced proliferation. Figure 4C shows that miconazole does not have any inhibitory effect on keratinocytes ad fibroblast control cells. Figure 5 reports the number of dead cells in the presence of 10% serum, indicating 30 and 50 μM as more potent cell-death inducers both in A-375 and in SKMEL-28 cells.
We, therefore, investigated whether the anti-proliferation effect of miconazole may be affected by specifically modulating KCNN2 expression. Figure 6 reports the strong increase of miconazole anti-proliferation effect upon KCNN2 siRNA silencing (Figure 6A). Western blot analysis and densitometry quantification is reported in Figure 6B and confirms the strong downregulation of KCNN2 achieved by siRNA treatment. Since the molecular form of miconazole used in the present study is miconazole-nitrate, as control the effect of ammonium-nitrate was also evaluated. Figure 6C shows that nitrate, at the same doses used for miconazole, does not show any significant effect.

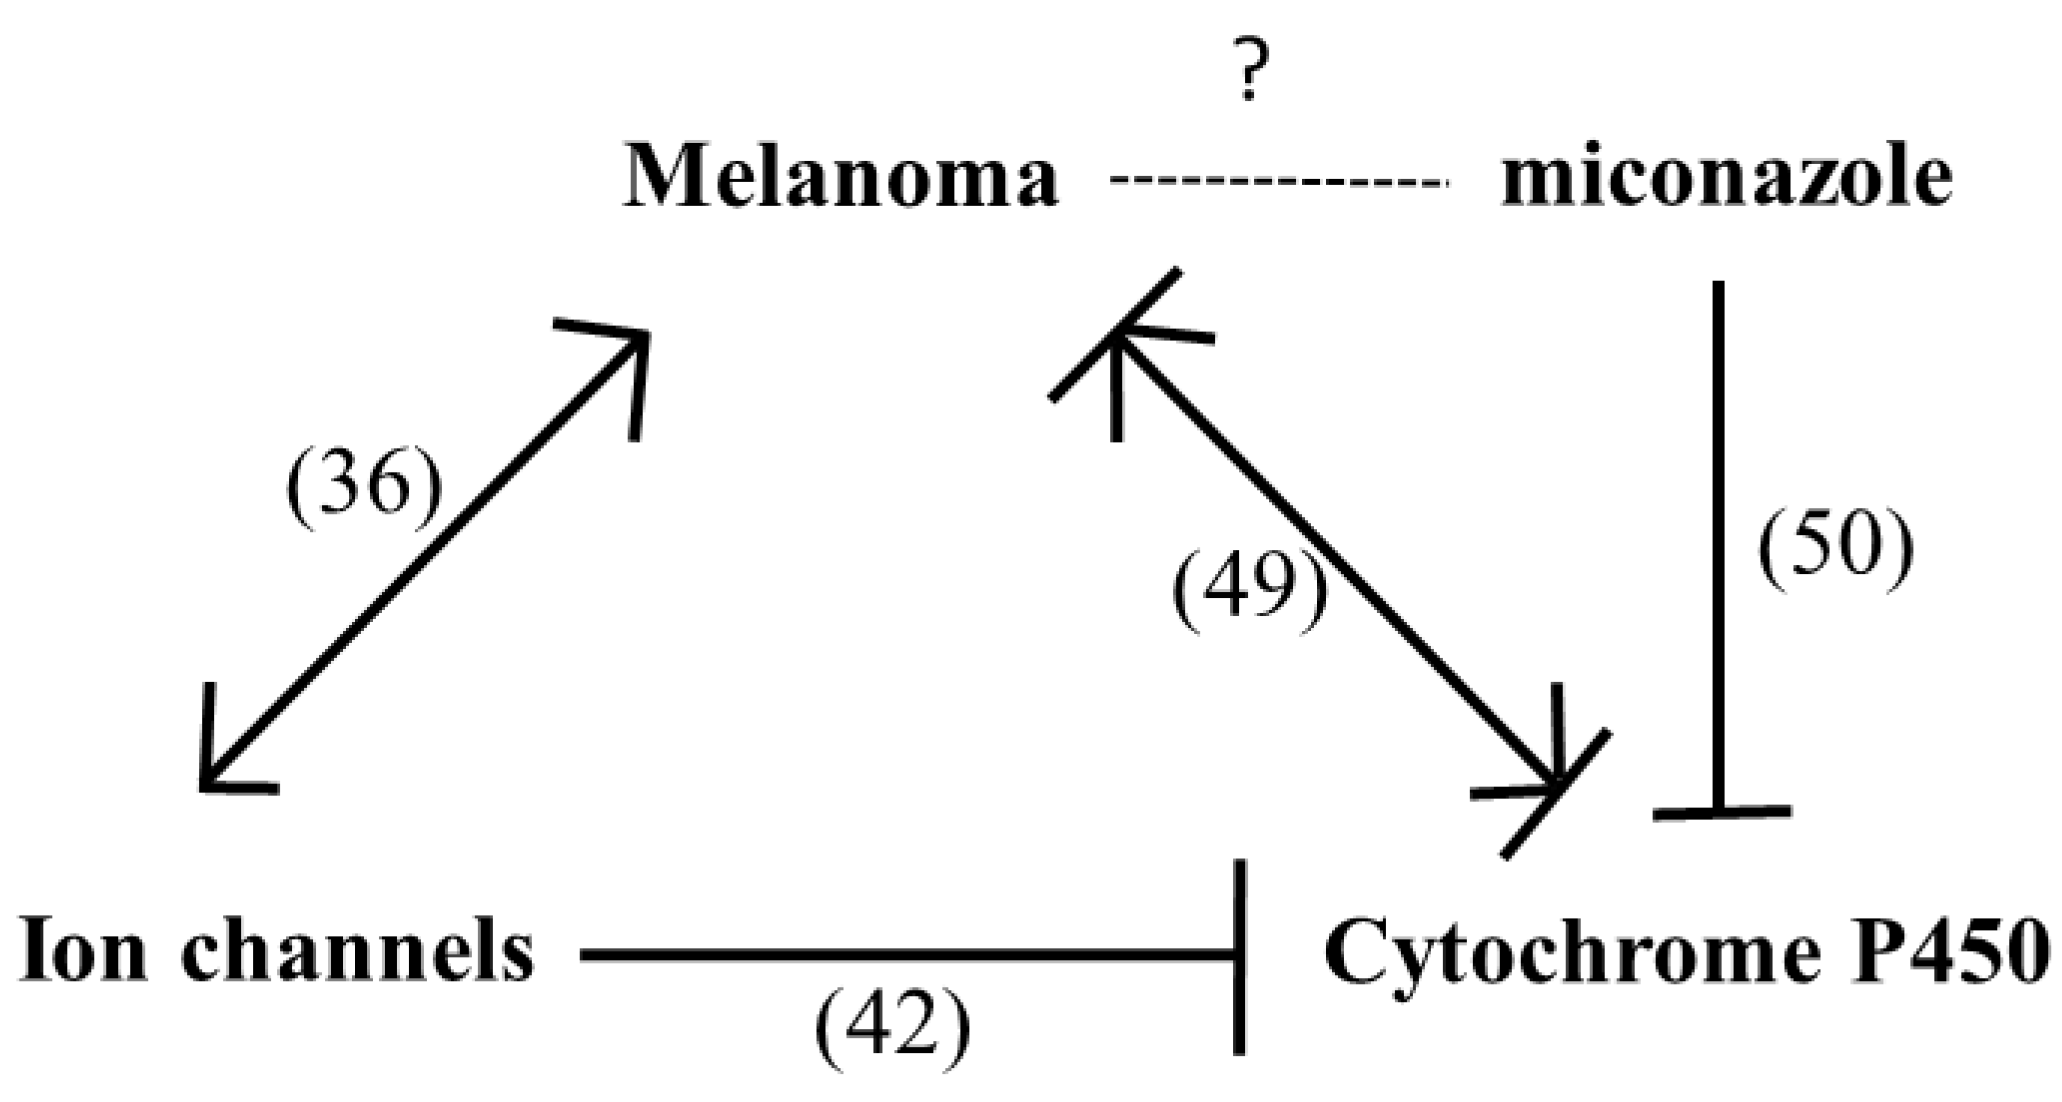
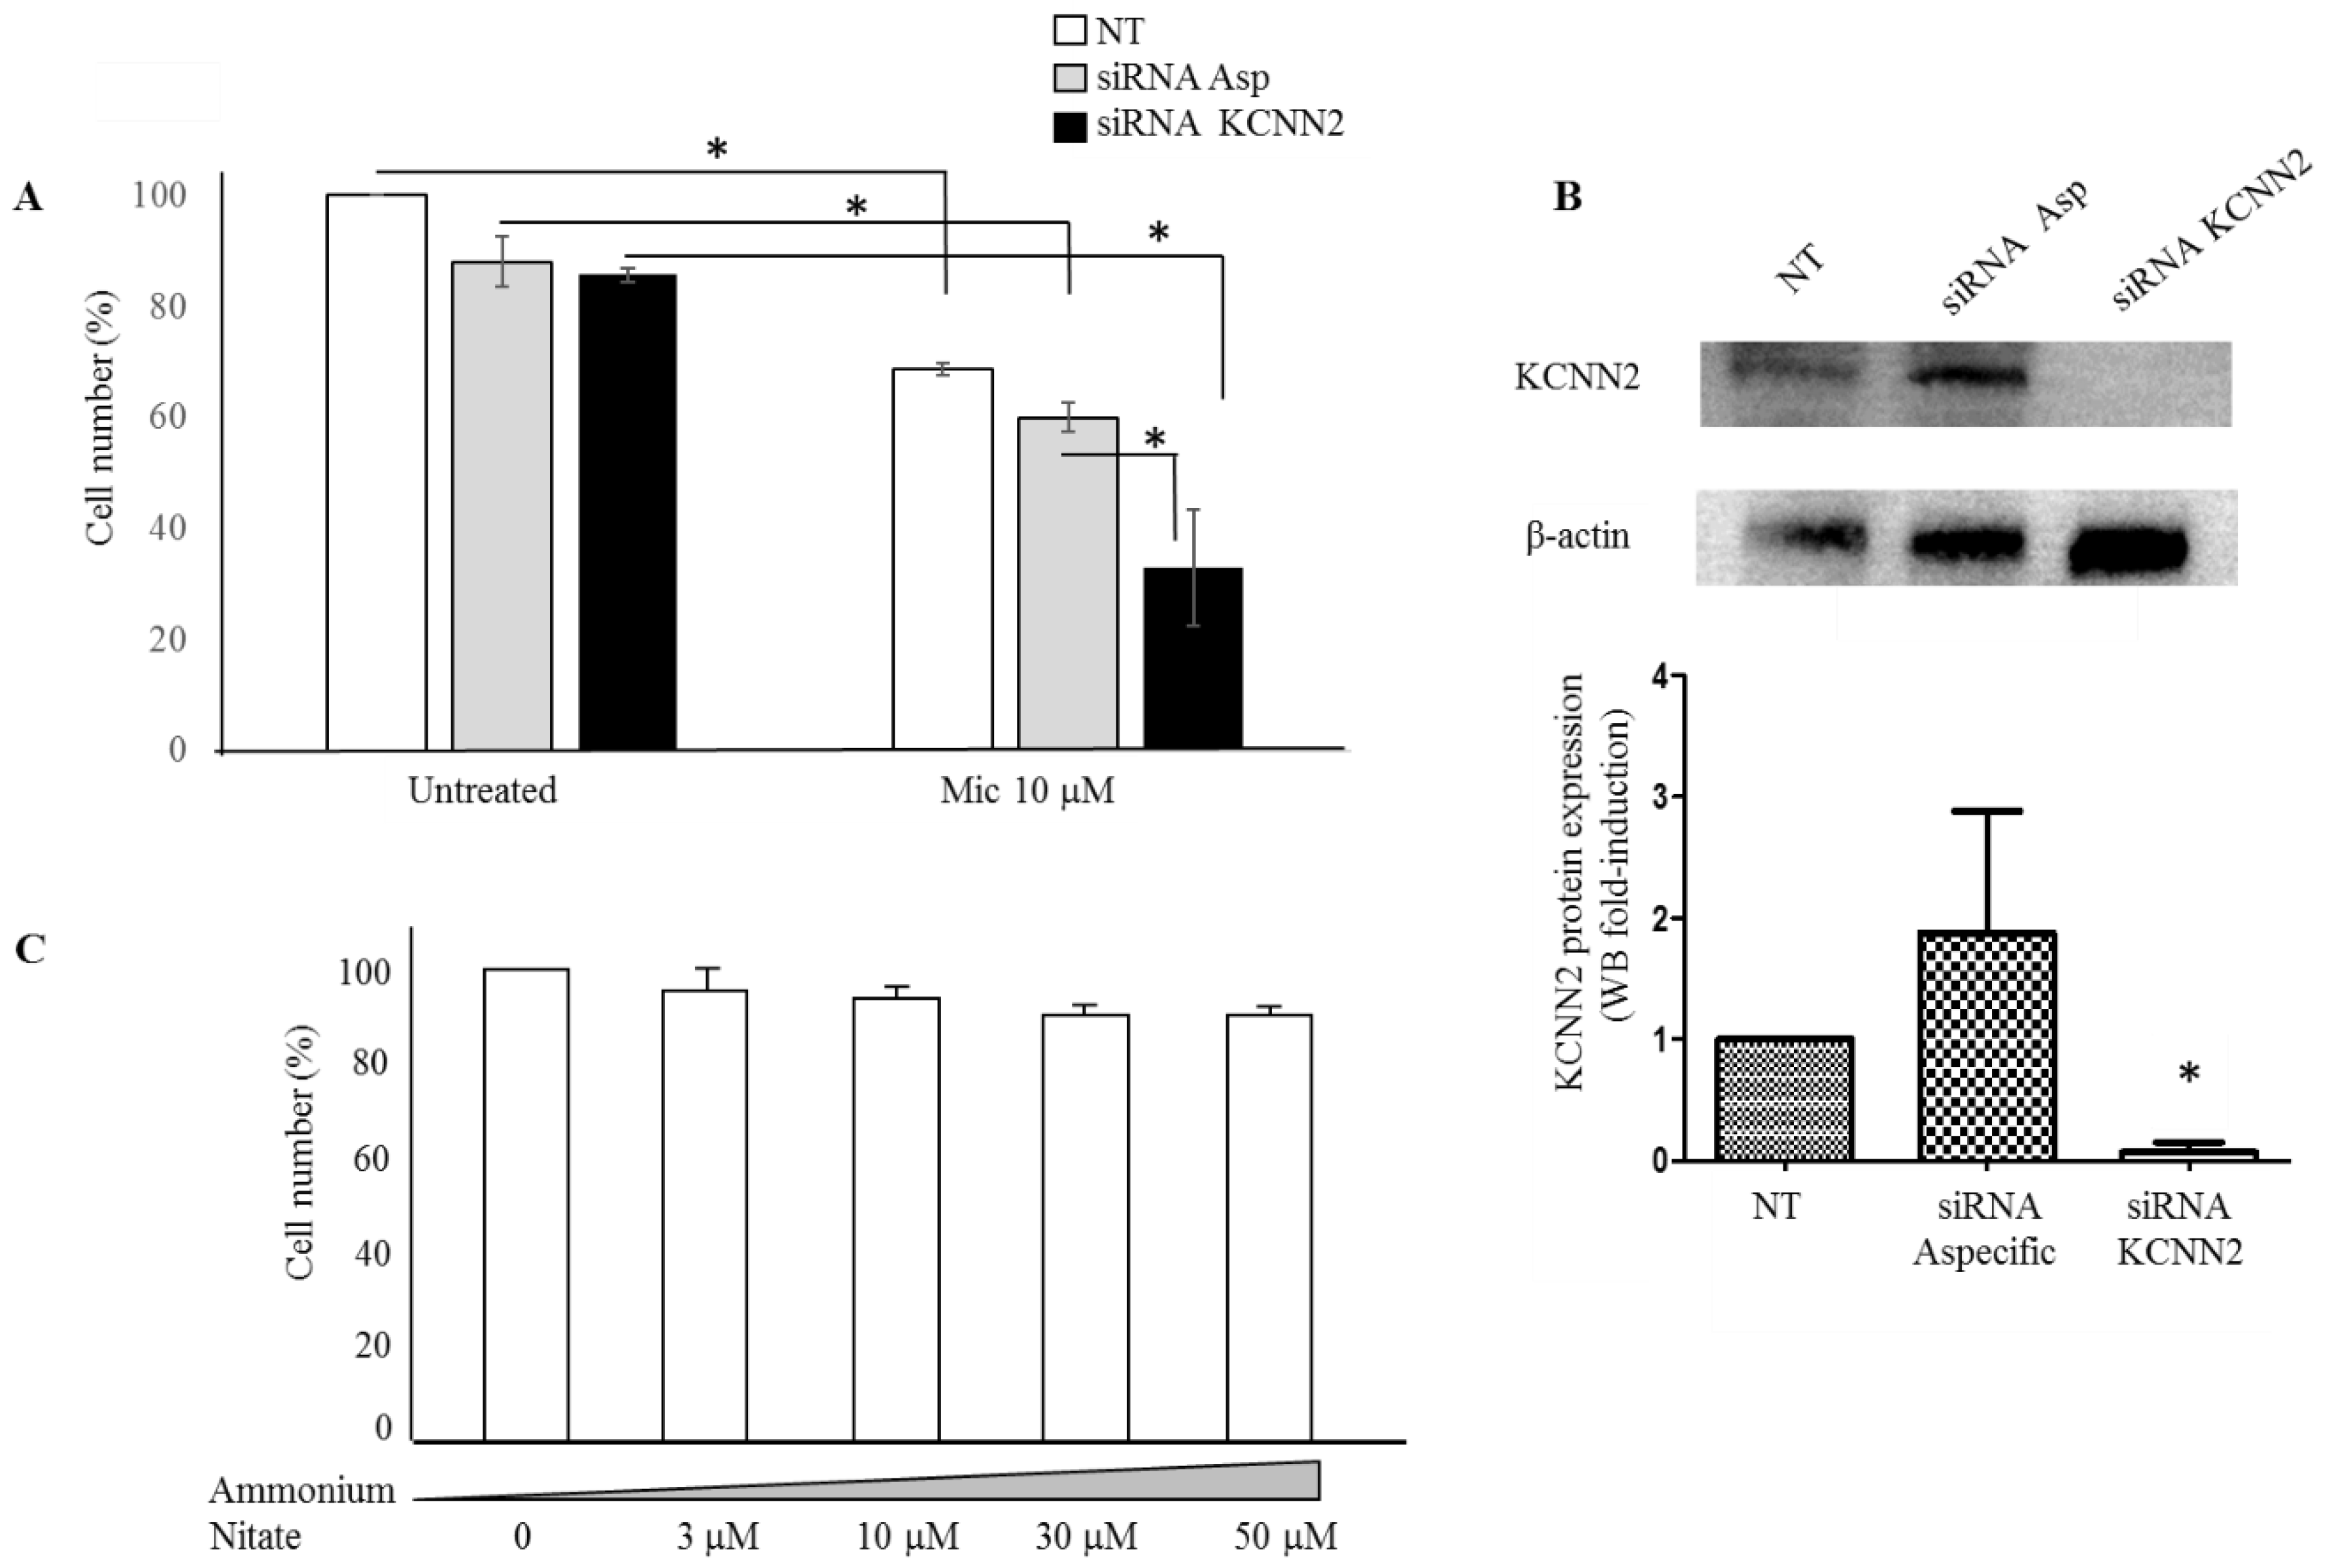
2.3. Mechanisms Underlying Miconazole Action

Miconazole is reported to primarily target 14-α demethylase, a cytochrome P-450 enzyme involved in conversion of lanosterol to ergosterol, an essential component of the fungal cell membrane (see Drug Bank at https://www.drugbank.ca/drugs/DB01110). Nevertheless, it also inhibits several other targets, including endothelial nitric oxide synthase and inducible nitric oxide synthase as well as several potassium channels, namely: calcium-activated potassium channel subunit alpha-1, calcium-activated potassium channel subunit beta-1, calcium-activated potassium channel subunit beta-2, calcium-activated potassium channel subunit beta-3, calcium-activated potassium channel subunit beta-4, intermediate conductance calcium-activated potassium channel protein 4, small conductance calcium-activated potassium channel protein 1, small conductance calcium-activated potassium channel protein 2, small conductance calcium-activated potassium channel protein 3, potassium voltage-gated channel subfamily H member 2, potassium voltage-gated channel subfamily H member 6, and potassium voltage-gated channel subfamily H member 7. It is also a partial agonist of nuclear receptor subfamily 1 group I member 2. According to a STRING analysis carried out at www.string-db.org, such proteins are strongly involved in arginine metabolism, potassium transport, control of guanylate cyclase, nitric oxide synthesis, blood circulation and synaptic transmission. Table 5 highlights the top 10 biological processes enriched in a statistically significant way by analyzing the above reported proteins, known miconazole targets.

3. Discussion

Ion channels have been shown to play a role in melanoma biology [42]. The number of studies relating ion channels to melanoma has increased in the last few years and ion channels are now recognized as potential co-targets in the new melanoma therapeutic strategies currently under continuous development [43]. We have previously reported strong and significant expression changes of several ion channels in solid tumors including glioblastoma, breast cancer, lung cancer, bladder cancer, and melanoma [19] and also proposed a possible role of ion channels in brain metastases onset [44]. Figure 3 of the present study also underlines that several studies identify reciprocal stimulatory relationships of melanoma and ion channels. The present study presents for the first time an extensive analysis of ion channels expression in human melanoma biopsies indicating a number of potential highly effective markers accurately validated in silico and never previously related to melanoma. An in silico procedure (summarized in Figure 1), after an initial screening on a first human biopsies dataset, progressively leads to the selection of five genes in a double-validation step carried out in two more human melanoma-patients datasets. The five ion channels selected as best candidates and never previously directly related to melanoma (namely SCNN1A, GJB3, KCNK7, GJB1, KCNN2) show very high AUC values (>0.90 in all cases) and very high specificity and sensitivity values (>90% in most cases). In a few cases these genes have been related to other cancers such as lung cancer [45], breast cancer [46], thyroid cancer [47], and ovarian cancer [48]. On the other hand, mir125B, which is known to target the SCNN1A gene [49] has been reported to control melanoma progression [50].
We have previously published a study involving a pure in silico four-step validation procedure carried out on autophagy-related genes in more than 500 melanoma patients [51]. In that study we demonstrated that many autophagy-related genes undergo relevant and significant expression changes in melanoma biopsies as compared to controls, and three genes, namely WIP1, PEX3 and BAG1, show impressive melanoma markers features, such as very high AUC values and sensibility and specificity values. Interestingly enough, ion channels recently emerged as key regulators of autophagy [52], further extending their potential clinical applications. We, therefore, underline here that ion channels may represent suitable molecular targets for novel therapeutic/diagnostic approaches in the melanoma field. The current study investigates this hypothesis. By analyzing ion channels expression in 170 human melanoma biopsies, we show that an accurate preliminary in silico validation is able to identify candidates as relevant markers or molecular targets (see Table 3). A number of drugs, commonly used in clinics in different pathological conditions, are known to target the 5 best candidates identified. This allowed us to hypothesize novel potential clinical applications in a melanoma set up, for the drugs indicated in Table 3, within a drug repositioning strategy. Although all drugs listed in Table 4 may be potentially effective, we focused our attention on miconazole, given its known skin-targeting properties [53]. Miconazole is a known cytochrome P-450 inhibitor targeting ion channels including KCNN2 [38,54]. In the clinical practice it is commonly used as an antifungal topic compound in skin infections or for systemic infections, and, within the drugs reported in Table 3, sounds as the best candidate for skin-related lesions or systemic lesions of skin origin such as melanoma. Further, miconazole targets the KCNN2 gene; this gene appears to be the best candidate among the five identified in Table 3, being the only one with AUC > 0.90 in both screening phase and first validation phase, and with very high melanoma vs. ctrl expression ratios (see Table 3). Figure 4 of the present study demonstrates that miconazole strongly reduces (up to 90%) the serum-induced proliferation of A-375 (more-aggressive) and SKMEL-28 (less-aggressive) melanoma cells [55]. A375 and SK-MEL-28 cells are largely studied human melanoma cells for their different aggressiveness and malignancy. We have recently correlated their aggressive phenotype with different molecular profiles [56]. In both cell types high levels of p53 have been demonstrated [57], while A-375 express higher Bax level [58]. Figure 4 also shows that the anti-proliferation effect of miconazole appears to be specific for melanoma cells, since proliferation of ctrl cells (keratinocytes and fibroblasts) is not affected. All together such data suggest a possible topical application of miconazole in the skin treatment of the excised primary melanoma.
Figure 5 shows that miconazole also induces a strong cell-death, possibly suggesting adjuvant applications in metastatic stages. Miconazole has been previously shown to have some anti-proliferative effect in mouse melanoma cells (about 50% inhibitory action) and a mild anti-melanogenesis effect [59], while we show for the first time a much stronger activity both as anti-proliferation and as cell-death inducer in human cells lines, particularly in A-375 cells, known to have an aggressive phenotype. Antitumor effects of miconazole have been previously reported in cancers setup different than melanoma [60,61,62,63], while the present study represents the first evidence indicating miconazole strong anti-proliferative and death-inducing activity in melanoma cells. Interestingly, we demonstrate in the present study that the KCNN2 ion channel strongly modulates miconazole anti-melanoma effect. In fact, in A375 cells, specific silencing by siRNA-KCNN2 leads to a strong increase of miconazole anti-proliferative effect.
Interestingly, miconazole, while known as a relevant antifungal drug, is also known to recognizes eukaryotic targets including several potassium channels. It has shown to induce cytoprotective effect under hypoxia conditions, likely by inhibiting HMGB1 and IL-8 release in Caco-2 intestinal cells [64]. Further, it has been shown to induce post-ischemic neurogenesis in rats [65], immune response in fish [66], to have promising anti Alzheimer’s disease activity [67] and to interact with the anticoagulant drug warfarin [68]. Further investigation on the underlying mechanism are currently under investigation. In agreement with findings of the present study, other antifungal compounds, namely itraconazole, show potent anti-melanoma action in vivo and in vitro on A-375 and SKMEL-28 cells, down-regulating different pathways including PI3K/mTOR [69]. Noteworthy, increased melanogenesis is a frequent sing in fungal infections [70], fungal infections in some cases mimicking melanoma lesions [71]. Accordingly, previous studies report anti-melanogenesis action of antifungal compounds such as clotrimazole by interfering on ERK and PI3K/AKT activity [72]. Table 5 underlines that the known targets of miconazole are primarily involved in potassium transport, arginine catabolism as well as guanylate cyclase activity and nitric oxide synthesis.
In conclusion all together these evidences support the role of ion channels in the melanoma setup and future investigation on anti-melanoma effect in vivo of miconazole and other anti-fungal compounds.

4. Materials and Methods

Ion channels investigated in the current study were taken from the list according to HUGO Gene Nomenclature Committee (HGNC), European Bioinformatics Institute (EMBL-EBI) at https://www.genenames.org/data/genegroup/#!/group/177. The ion channels list includes 328 genes and is reported in Table 1 in alphabetic order. The general procedure followed in the present study is depicted in Figure 1. It consists of a preliminary in silico phase (screening phase, first-round and second-round validation steps, and novelty assessment) and of a following experimental validation of one of the identified molecular targets in proliferation/cell-death assays.
In silico steps: screening phase and two validation steps. The screening and the two validation steps were carried out onto a total of 170 patients (63 in the screening phase + 62 in the first round validation + 45 in the third round validation).
Selection step: in silico selection of suitable melanoma markers. Expression of the 328 ion channels genes reported in Table 1 was investigated in a collection of human melanoma biopsies and controls. Namely, the melanoma GDS1375 dataset [73] (Talantov et al, 2005) from the GEO database (https://www.ncbi.nlm.nih.gov/gds/) was chosen, containing expression data from 63 samples (45 melanoma-patients and 18 nevi-patients) with free data download. The significance of the differential expression was evaluated according to Student t test analysis and fold change. ROC analysis, the well accepted test for binary assessments [74], was then performed to measure how effective is the expression-level of any given gene to discriminate healthy- from melanoma-biopsies. The computed area under curve (AUC) value ranges from 0.5 to 1, indicating a minimum of 50% to a maximum of 100% discrimination ability. Other datasets in the GEO database are available, such as GDS1989 and GDS1965, but with only few samples. The GDS1375 dataset used in this selection step and the GSE15605 dataset used in the following first validation step, were chosen due to the large number of melanoma biopsies and control biopsies. Transcriptomic data are from Affymetrix Human Genome U133A Array and from Affymetrix Human Genome U133 Plus 2.0 Array platforms, respectively.
In silico first validation step: validation of identified genes was carried out on a different GEO dataset, namely GSE15605 [75] containing expression data form 62 patients-biopsies (namely 16 controls, 46 primary melanoma and 12 metastatic melanoma samples). The 20 genes showing AUC > 0.90 computed according to the GDS1375 dataset, were analyzed in the GSE15605 dataset and were considered validated if the computed AUC was >0.85. Under such condition, 11 genes were validated.
In silico second validation step: a further validation of the genes passing the screening and the first validation step was carried out in the Riker melanoma dataset [76] within the Oncomine database (www.oncomine.org). Such dataset contains 45 human samples (40 metastatic melanoma samples and five controls) and reports the expression values as log2-median centered intensity. This value was used to calculate the ratio of melanoma vs. normal skin groups. A ratio higher than 2 or lower than 0.5 was considered effective to validate. Seven genes passed the second validation step. Five of these seven genes (namely: SCNN1A, GJB3, KCNK7, GJB1, and KCNN2) show not-previously recognized relation with melanoma, according to a PubMed search carried out in September 2018, highlighting any co-occurrence of any gene-name and “melanoma” words in ALL fields. Therefore, these five genes were considered novel in silico validated melanoma markers and potential therapeutic targets.

4.1. In Vitro Experimental Validation: Analysis of Potential “Druggability”

Drugs potentially targeting the in silico validated genes SCNN1A, GJB3, KCNK7, GJB1, and KCNN2 were then investigated on the database available at http://www.dgidb.org/search_interactions. The analysis allows to identify FDA-approved drugs known to target the given genes.

4.2. Chilibot Analysis

Known functional interactions were investigated by Chilibot analysis (www.chilibot.net) [77]. Chilibot identifies literature–reported relationships within user-defined terms. This is achieved by looking at their co-existence in the same sentence within Pubmed abstracts. Such procedure identifies closer relations as compared to a plain Pubmed search. Chilibot then associates same-sentence co-occurrence to stimulatory- or inhibitory- or non-interactive relationships. A pairwise search was carried out indicating “melanoma”, “ion channels”, “miconazole” and “cytochrome P450” terms. The “advanced options” button was turned on, to account for all known synonyms of the given terms and minimize false negative findings (i.e., using all known synonyms in the search reduces the risk of ignoring abstracts containing synonyms of the given term) and the analysis was performed on the maximum number of abstracts possible (i.e., 50 abstracts).

4.3. Cell Culture and Melanoma Cells In Vitro Proliferation Assay

Cells were used from the 3rd to 5th passages. SKMEL-28 and A-375 melanoma cells were from ATCC (Manassas, VA, USA) and were maintained in complete medium Dulbecco’s modified Eagle’s medium (DMEM; Hyclone, South Logan, UT, USA) and in complete medium Minimum Essential medium Eagle (MEM; Hyclone, South Logan, UT, USA) supplemented with 10% FBS (Hyclone), 2 mM L-glutamine and 100 IU/mL penicillin/streptomycin (Invitrogen, Carlsbad, CA, USA) respectively in humidified 5% CO2 atmosphere at 37 °C as described [78,79]. Human keratinocytes (HaCat) and mouse embryonic fibroblasts (MEF cells) were from American Type Culture Collection (ATCC).
In some experiments, A-375 cells were treated with 3, 10, 30, and 50 µM of ammonium nitrate (Merck, Darmstadt, Germany) as control of miconazole-nitrate, in 24 h proliferation assays.
The culture medium was changed every three days and when cells were sub-confluent; monolayers were harvested by 1 min exposure to 0.1% Trypsin-EDTA (Life Technologies Inc, Carlsbad, CA, USA).
Miconazole nitrate was from CliniSciences (Paris, France). SKMEL-28 and A-375 cells were plated at 10 × 105 and 8 × 10⁴ respectively, in p35 plates dishes at time 0. Then cells were starved for 18 h in serum-free medium and the next day treated with 3, 10, 30, and 50 µM of miconazole in complete fresh medium containing 10% FCS and DMSO at a final concentration of 50 µM. Control cells were treated with complete medium containing 10% FCS and DMSO at a final concentration of 50 µM. The effect of miconazole nitrate on cells proliferation in vitro was measured by directly counting the number of cells. At the end of incubation time (24, 48, and 72 h), cells were harvested and number of live cells and dead cells was counted. Dead cells were quantified by trypan blue incorporation.

4.4. KCNN2 Silencing by siRNA

One day after plating (4 × 10⁴ cells/mL), A-375 cells were transfected with Lipofectamine 2000 (Invitrogen) plus 50 nM small interfering RNA (siRNA) targeting KCNN2 gene (siRNA KCNN2) (Santa Cruz, CA, USA) or with the corresponding non-specific control siRNA (siRNA non-specific) (ThermoFisher, Waltham, MA, USA). After 5-h transfection, supernatant was discarded and fresh complete medium was added. The next day, KCNN2 expression in transfected cells was measured by Western blot analysis and miconazole treatment (10 μM) was started. After 24 h of miconazole treatment, cell proliferation was measured.

4.5. Western Blot Analysis

Cells were washed with cold PBS and then cell lysates were prepared in cell lysis buffer (Cell Signaling, Denvers, MA, USA), 1% sodium dodecylsulphate-polyacrylamide (SDS) (Sigma-Aldrich, St Louis, MO, USA) and 1 mM phenylmethanesulfonyl fluoride solution (PMSF) (Sigma-Aldrich, St Louis, MO, USA). Protein concentration was measured by a bicinchoninic acid protein assay kit (Pierce, Rockford, IL, USA) according to manufacturer’s instructions and then equal amounts of proteins (25 µg) were subjected to sodium dodecylsulphate-polyacrylamide gel electrophoresis (SDS-PAGE) and transferred onto nitrocellulose membrane (GE Healthcare, Life science, Wien, Austria). Membranes were saturated with 5% non-fat dry milk in T-TBS, incubated with the primary antibody overnight, and subsequently with horseradish peroxidase-conjugated (HRP) secondary antibody for 1 h at room temperature. Membranes were washed with T-TBS and developed using the chemiluminescence system (ECL Advance, Amersham Biosciences, San Diego, CA, USA). Antibody used: anti KCNN2/SK2 antibody was from Abcam (San Francisco, CA, USA); anti-β-actin was from Sigma (St Louis, MO, USA). Secondary antibody was HRP-goat anti-rabbit from Bio-Rad (Hercules, CA, USA). The intensity of Western blot bands was quantified by Bio-RAD Chemidoc Gel Imaging System with Image Lab 5.2.1. software (Bio-RAD, Hercules, CA, USA).

4.6. STRING Analysis

STRING analysis at https://string-db.org/ was performed to identify the biological processes most likely affected by the genes known to be miconazole targets. The “multiple proteins” search was carried out.

4.7. Statistics

Statistical significance was computed according to the Student’s t-test; p < 0.05 was chosen as significance threshold. ROC analysis was carried out with GraphPad Prism version 5 (GraphPad Software, San Diego, CA, USA, www.graphpad.com).
The sensitivity and specificity values were computed as previously reported [51] as the values corresponding to highest sensitivity-specificity product in each ROC curve data.

5. Conclusions

In conclusion, in the present study we show that many ion channels genes taken from the ion channels families (i.e., 91 out of 328 investigated genes) are differently expressed in melanoma vs. control human biopsies, according to an in silico analysis on 170 human samples. Five such genes (namely: SCNN1A, GJB3, KCNK7, GJB1, KCNN2) were identified as potential strong melanoma markers that had never been identified before. By in vitro experiments, one gene (namely: KCNN2) has been validated as a relevant molecular target in melanoma cell lines. Indeed, the antifungal drug miconazole shows an extremely high anti-proliferation activity in melanoma cell lines, mediated by KCNN2. We, therefore, conclude that ion channels are strongly involved in melanoma and that miconazole may exert a potent anti-melanoma activity.

Author Contributions

Conceptualization: D.D., C.G., P.M., F.F., and A.F.; formal analysis: D.D. and A.F.; funding acquisition: D.D., A.F., and P.M.; supervision: A.F.; validation: F.S.; visualization: F.S.; writing—original draft: D.D., F.F., and C.G.; writing—review and editing: F.F. and A.F.

Funding

The present study was supported in part by grants to D.D. and A.F. (RC2018, 3.4).

Conflicts of Interest

The authors declare no conflict of interest.

References

  1. Bagal, S.K.; Brown, A.D.; Cox, P.J.; Omoto, K.; Owen, R.M.; Pryde, D.C.; Sidders, B.; Skerratt, S.E.; Stevens, E.B.; Storer, R.I.; et al. Ion channels as therapeutic targets: A drug discovery perspective. J. Med. Chem. 2013, 56, 593–624. [Google Scholar] [CrossRef] [PubMed]
  2. Wickenden, A.; Priest, B.; Erdemli, G. Ion channel drug discovery: Challenges and future directions. Future Med. Chem. 2012, 4, 661–679. [Google Scholar] [CrossRef]
  3. Weyer-Menkhoff, I.; Lötsch, J. Human pharmacological approaches to TRP-ion-channel-based analgesic drug development. Drug Discov. Today 2018, 23, 2003–2012. [Google Scholar] [CrossRef] [PubMed]
  4. Ledwitch, K.V.; Roberts, A.G. Cardiovascular Ion Channel Inhibitor Drug-Drug Interactions with P-glycoprotein. AAPS J. 2017, 19, 409–420. [Google Scholar] [CrossRef] [PubMed]
  5. Robertson, G.A. Endocytic control of ion channel density as a target for cardiovascular disease. J. Clin. Investig. 2009, 119, 2531–2534. [Google Scholar] [CrossRef] [Green Version]
  6. Elliott, W.J.; Bistrika, E.A. Perindopril arginine and amlodipine besylate for hypertension: A safety evaluation. Expert Opin. Drug Saf. 2018, 17, 207–216. [Google Scholar] [CrossRef] [PubMed]
  7. Kwai, N.C.G.; Arnold, R.; Wickremaarachchi, C.; Lin, C.S.-Y.; Poynten, A.M.; Kiernan, M.C.; Krishnan, A. V Effects of axonal ion channel dysfunction on quality of life in type 2 diabetes. Diabetes Care 2013, 36, 1272–1277. [Google Scholar] [CrossRef]
  8. Pietschmann, T. Clinically Approved Ion Channel Inhibitors Close Gates for Hepatitis C Virus and Open Doors for Drug Repurposing in Infectious Viral Diseases. J. Virol. 2017, 91, e01914-16. [Google Scholar] [CrossRef]
  9. Moorthy, N.S.H.N.; Poongavanam, V.; Pratheepa, V. Viral M2 ion channel protein: A promising target for anti-influenza drug discovery. Mini Rev. Med. Chem. 2014, 14, 819–830. [Google Scholar]
  10. Bhattacharya, A.; Biber, K. The microglial ATP-gated ion channel P2x7 as a CNS drug target. Glia 2016, 64, 1772–1787. [Google Scholar] [CrossRef] [PubMed]
  11. Wei, F.; Yan, L.-M.; Su, T.; He, N.; Lin, Z.-J.; Wang, J.; Shi, Y.-W.; Yi, Y.-H.; Liao, W.-P. Ion Channel Genes and Epilepsy: Functional Alteration, Pathogenic Potential, and Mechanism of Epilepsy. Neurosci. Bull. 2017, 33, 455–477. [Google Scholar] [CrossRef] [PubMed]
  12. Seefeld, M.A.; Lin, H.; Holenz, J.; Downie, D.; Donovan, B.; Fu, T.; Pasikanti, K.; Zhen, W.; Cato, M.; Chaudhary, K.W.; et al. Novel KV7 ion channel openers for the treatment of epilepsy and implications for detrusor tissue contraction. Bioorg. Med. Chem. Lett. 2018, 28, 3793–3797. [Google Scholar] [CrossRef]
  13. Ullah, S.; Ali, N.; Khan, A.; Ali, S.; Nazish, H.R.; Uddin, Z. Epilepsy control with carbamazepine monotherapy from a genetic perspective. BMC Pharmacol. Toxicol. 2018, 19, 73. [Google Scholar] [CrossRef]
  14. Mayor, S. Cystic fibrosis: Triple drug regimens that target defective ion channel improve lung function, studies show. BMJ 2018, 363, k4377. [Google Scholar] [CrossRef]
  15. Sala, M.A.; Jain, M. Tezacaftor for the treatment of cystic fibrosis. Expert Rev. Respir. Med. 2018, 12, 725–732. [Google Scholar] [CrossRef] [PubMed]
  16. Zhang, G.; Wang, X.; Xue, Q. Combined targeted ion channel therapy: Can it be an alternative choice for esophageal cancer patients? Med. Hypotheses 2018, 117, 59–62. [Google Scholar] [CrossRef]
  17. Tuszynski, J.; Tilli, T.M.; Levin, M. Ion Channel and Neurotransmitter Modulators as Electroceutical Approaches to the Control of Cancer. Curr. Pharm. Des. 2017, 23, 4827–4841. [Google Scholar] [CrossRef]
  18. Vancauwenberghe, E.; Noyer, L.; Derouiche, S.; Lemonnier, L.; Gosset, P.; Sadofsky, L.R.; Mariot, P.; Warnier, M.; Bokhobza, A.; Slomianny, C.; et al. Activation of mutated TRPA1 ion channel by resveratrol in human prostate cancer associated fibroblasts (CAF). Mol. Carcinog. 2017, 56, 1851–1867. [Google Scholar] [CrossRef]
  19. Biasiotta, A.; D’Arcangelo, D.; Passarelli, F.; Nicodemi, E.M.; Facchiano, A. Ion channels expression and function are strongly modified in solid tumors and vascular malformations. J. Transl. Med. 2016, 14, 285. [Google Scholar] [CrossRef]
  20. Ko, J.-H.; Ko, E.A.; Gu, W.; Lim, I.; Bang, H.; Zhou, T. Expression profiling of ion channel genes predicts clinical outcome in breast cancer. Mol. Cancer 2013, 12, 106. [Google Scholar] [CrossRef]
  21. Li, H.; Ma, N.; Wang, J.; Wang, Y.; Yuan, C.; Wu, J.; Luo, M.; Yang, J.; Chen, J.; Shi, J.; et al. Nicotine Induces Progressive Properties of Lung Adenocarcinoma A549 Cells by Inhibiting Cystic Fibrosis Transmembrane Conductance Regulator (CFTR) Expression and Plasma Membrane Localization. Technol. Cancer Res. Treat. 2018, 17, 1533033818809984. [Google Scholar] [CrossRef] [PubMed]
  22. Berrout, J.; Kyriakopoulou, E.; Moparthi, L.; Hogea, A.S.; Berrout, L.; Ivan, C.; Lorger, M.; Boyle, J.; Peers, C.; Muench, S.; et al. TRPA1-FGFR2 binding event is a regulatory oncogenic driver modulated by miRNA-142-3p. Nat. Commun. 2017, 8, 947. [Google Scholar] [CrossRef] [PubMed]
  23. Xia, D.; Lai, D.V.; Wu, W.; Webb, Z.D.; Yang, Q.; Zhao, L.; Yu, Z.; Thorpe, J.E.; Disch, B.C.; Ihnat, M.A.; et al. Transition from androgenic to neurosteroidal action of 5α-androstane-3α, 17β-diol through the type A γ-aminobutyric acid receptor in prostate cancer progression. J. Steroid Biochem. Mol. Biol. 2018, 178, 89–98. [Google Scholar] [CrossRef] [PubMed]
  24. Camacho, N.; Van Loo, P.; Edwards, S.; Kay, J.D.; Matthews, L.; Haase, K.; Clark, J.; Dennis, N.; Thomas, S.; Kremeyer, B.; et al. Appraising the relevance of DNA copy number loss and gain in prostate cancer using whole genome DNA sequence data. PLoS Genet. 2017, 13, e1007001. [Google Scholar] [CrossRef] [PubMed]
  25. Sagredo, A.I.; Sagredo, E.A.; Cappelli, C.; Báez, P.; Andaur, R.E.; Blanco, C.; Tapia, J.C.; Echeverría, C.; Cerda, O.; Stutzin, A.; et al. TRPM4 regulates Akt/GSK3-β activity and enhances β-catenin signaling and cell proliferation in prostate cancer cells. Mol. Oncol. 2018, 12, 151–165. [Google Scholar] [CrossRef] [PubMed]
  26. Prickett, T.D.; Gartner, J.J.; Samuels, Y. Genetic and Functional Analysis of GRIN2A in Tumor Samples. Methods Mol. Biol. 2017, 1677, 93–116. [Google Scholar]
  27. Leanza, L.; Romio, M.; Becker, K.A.; Azzolini, M.; Trentin, L.; Managò, A.; Venturini, E.; Zaccagnino, A.; Mattarei, A.; Carraretto, L.; et al. Direct Pharmacological Targeting of a Mitochondrial Ion Channel Selectively Kills Tumor Cells In Vivo. Cancer Cell 2017, 31, 516–531. [Google Scholar] [CrossRef]
  28. Kacik, M.; Oliván-Viguera, A.; Köhler, R. Modulation of K(Ca)3.1 channels by eicosanoids, omega-3 fatty acids, and molecular determinants. PLoS ONE 2014, 9, e112081. [Google Scholar] [CrossRef]
  29. Bauer, D.; Werth, F.; Nguyen, H.A.; Kiecker, F.; Eberle, J. Critical role of reactive oxygen species (ROS) for synergistic enhancement of apoptosis by vemurafenib and the potassium channel inhibitor TRAM-34 in melanoma cells. Cell Death Dis. 2017, 8, e2594. [Google Scholar] [CrossRef] [Green Version]
  30. Busch, A.E.; Suessbrich, H.; Kunzelmann, K.; Hipper, A.; Greger, R.; Waldegger, S.; Mutschler, E.; Lindemann, B.; Lang, F. Blockade of epithelial Na+ channels by triamterenes—Underlying mechanisms and molecular basis. Pflugers Arch. 1996, 432, 760–766. [Google Scholar] [CrossRef]
  31. Planer, J.D.; Hulverson, M.A.; Arif, J.A.; Ranade, R.M.; Don, R.; Buckner, F.S. Synergy testing of FDA-approved drugs identifies potent drug combinations against Trypanosoma cruzi. PLoS Negl. Trop. Dis. 2014, 8, e2977. [Google Scholar] [CrossRef]
  32. Kandel, C.; Schmidt, P.; Perniss, A.; Keshavarz, M.; Scholz, P.; Osterloh, S.; Althaus, M.; Kummer, W.; Deckmann, K. ENaC in Cholinergic Brush Cells. Front. Cell Dev. Biol. 2018, 6, 89. [Google Scholar] [CrossRef]
  33. Canessa, C.M.; Schild, L.; Buell, G.; Thorens, B.; Gautschi, I.; Horisberger, J.D.; Rossier, B.C. Amiloride-sensitive epithelial Na+ channel is made of three homologous subunits. Nature 1994, 367, 463–467. [Google Scholar] [CrossRef] [PubMed]
  34. Pawson, A.J.; Sharman, J.L.; Benson, H.E.; Faccenda, E.; Alexander, S.P.H.; Buneman, O.P.; Davenport, A.P.; McGrath, J.C.; Peters, J.A.; Southan, C.; et al. The IUPHAR/BPS Guide to PHARMACOLOGY: An expert-driven knowledgebase of drug targets and their ligands. Nucleic Acids Res. 2014, 42, D1098–D1106. [Google Scholar] [CrossRef]
  35. Ramzan, I. Phytotherapies: Efficacy, Safety, and Regulation; Wiley: Hoboken, NJ, USA, 2015; ISBN 978-1-118-26806-3. [Google Scholar]
  36. Wörsdörfer, P.; Maxeiner, S.; Markopoulos, C.; Kirfel, G.; Wulf, V.; Auth, T.; Urschel, S.; von Maltzahn, J.; Willecke, K. Connexin expression and functional analysis of gap junctional communication in mouse embryonic stem cells. Stem Cells 2008, 26, 431–439. [Google Scholar] [CrossRef]
  37. Vessey, J.P.; Lalonde, M.R.; Mizan, H.A.; Welch, N.C.; Kelly, M.E.M.; Barnes, S. Carbenoxolone inhibition of voltage-gated Ca channels and synaptic transmission in the retina. J. Neurophysiol. 2004, 92, 1252–1256. [Google Scholar] [CrossRef]
  38. Alvarez, J.; Montero, M.; Garcia-Sancho, J. High affinity inhibition of Ca(2+)-dependent K+ channels by cytochrome P-450 inhibitors. J. Biol. Chem. 1992, 267, 11789–11793. [Google Scholar] [PubMed]
  39. Chang, H.-T.; Chen, W.-C.; Chen, J.-S.; Lu, Y.-C.; Hsu, S.-S.; Wang, J.-L.; Cheng, H.-H.; Cheng, J.-S.; Jiann, B.-P.; Chiang, A.-J.; et al. Effect of miconazole on intracellular Ca2+ levels and proliferation in human osteosarcoma cells. Life Sci. 2005, 76, 2091–2101. [Google Scholar] [CrossRef] [PubMed]
  40. Botana, L.M. Seafood and Freshwater Toxins: Pharmacology, Physiology, and Detection; CRC Press: Boca Raton, FL, USA, 2014; ISBN 9781466505148. [Google Scholar]
  41. Ko, C.; Park, W.-J.; Park, S.; Kim, S.; Windisch, M.P.; Ryu, W.-S. The FDA-approved drug irbesartan inhibits HBV-infection in HepG2 cells stably expressing sodium taurocholate co-transporting polypeptide. Antivir. Ther. 2015, 20, 835–842. [Google Scholar] [CrossRef] [PubMed]
  42. Comes, N.; Serrano-Albarrás, A.; Capera, J.; Serrano-Novillo, C.; Condom, E.; Ramón, Y.; Cajal, S.; Ferreres, J.C.; Felipe, A. Involvement of potassium channels in the progression of cancer to a more malignant phenotype. Biochim. Biophys. Acta 2015, 1848, 2477–2492. [Google Scholar] [CrossRef] [PubMed] [Green Version]
  43. Marshall, H.T.; Djamgoz, M.B.A. Immuno-Oncology: Emerging Targets and Combination Therapies. Front. Oncol. 2018, 8, 315. [Google Scholar] [CrossRef] [PubMed]
  44. D’Arcangelo, D.; Nicodemi, E.M.; Facchiano, A. Letter to the editor: “Ion channels in brain metastasis”—Ion channels in cancer set up and metastatic progression. Int. J. Mol. Sci. 2017, 18, 718. [Google Scholar] [CrossRef]
  45. He, M.; Liu, S.; Gallolu Kankanamalage, S.; Borromeo, M.D.; Girard, L.; Gazdar, A.F.; Minna, J.D.; Johnson, J.E.; Cobb, M.H. The Epithelial Sodium Channel (αENaC) Is a Downstream Therapeutic Target of ASCL1 in Pulmonary Neuroendocrine Tumors. Transl. Oncol. 2018, 11, 292–299. [Google Scholar] [CrossRef] [PubMed]
  46. Varley, K.E.; Gertz, J.; Roberts, B.S.; Davis, N.S.; Bowling, K.M.; Kirby, M.K.; Nesmith, A.S.; Oliver, P.G.; Grizzle, W.E.; Forero, A.; et al. Recurrent read-through fusion transcripts in breast cancer. Breast Cancer Res. Treat. 2014, 146, 287–297. [Google Scholar] [CrossRef] [PubMed] [Green Version]
  47. Jarzab, B.; Wiench, M.; Fujarewicz, K.; Simek, K.; Jarzab, M.; Oczko-Wojciechowska, M.; Wloch, J.; Czarniecka, A.; Chmielik, E.; Lange, D.; et al. Gene expression profile of papillary thyroid cancer: Sources of variability and diagnostic implications. Cancer Res. 2005, 65, 1587–1597. [Google Scholar] [CrossRef]
  48. Willis, S.; Villalobos, V.M.; Gevaert, O.; Abramovitz, M.; Williams, C.; Sikic, B.I.; Leyland-Jones, B. Single Gene Prognostic Biomarkers in Ovarian Cancer: A Meta-Analysis. PLoS ONE 2016, 11, e0149183. [Google Scholar] [CrossRef] [PubMed]
  49. Zhang, Z.; Chen, J.; He, Y.; Zhan, X.; Zhao, R.; Huang, Y.; Xu, H.; Zhu, Z.; Liu, Q. miR-125b inhibits hepatitis B virus expression in vitro through targeting of the SCNN1A gene. Arch. Virol. 2014, 159, 3335–3343. [Google Scholar] [CrossRef] [PubMed]
  50. Kappelmann, M.; Kuphal, S.; Meister, G.; Vardimon, L.; Bosserhoff, A.-K. MicroRNA miR-125b controls melanoma progression by direct regulation of c-Jun protein expression. Oncogene 2013, 32, 2984–2991. [Google Scholar] [CrossRef]
  51. D’Arcangelo, D.; Giampietri, C.; Muscio, M.; Scatozza, F.; Facchiano, F.; Facchiano, A. WIPI1, BAG1, and PEX3 Autophagy-Related Genes Are Relevant Melanoma Markers. Oxid. Med. Cell. Longev. 2018, 2018, 1471682. [Google Scholar] [CrossRef]
  52. Kondratskyi, A.; Kondratska, K.; Skryma, R.; Klionsky, D.J.; Prevarskaya, N. Ion channels in the regulation of autophagy. Autophagy 2018, 14, 3–21. [Google Scholar] [CrossRef]
  53. Mandy, S.J.; Garrott, T.C. Miconazole treatment for severe dermatophytoses. JAMA 1974, 230, 72–75. [Google Scholar] [CrossRef]
  54. Hatton, C.J.; Peers, C. Effects of cytochrome P-450 inhibitors on ionic currents in isolated rat type I carotid body cells. Am. J. Physiol. 1996, 271, C85–C92. [Google Scholar] [CrossRef] [PubMed]
  55. Verdoliva, V.; Senatore, C.; Polci, M.L.; Rossi, S.; Cordella, M.; Carlucci, G.; Marchetti, P.; Antonini-Cappellini, G.; Facchiano, A.; D’Arcangelo, D.; et al. Differential Denaturation of Serum Proteome Reveals a Significant Amount of Hidden Information in Complex Mixtures of Proteins. PLoS ONE 2013, 8, e57104. [Google Scholar] [CrossRef] [PubMed]
  56. Rossi, S.; Cordella, M.; Tabolacci, C.; Nassa, G.; D’Arcangelo, D.; Senatore, C.; Pagnotto, P.; Magliozzi, R.; Salvati, A.; Weisz, A.; et al. TNF-alpha and metalloproteases as key players in melanoma cells aggressiveness. J. Exp. Clin. Cancer Res. 2018, 37, 326. [Google Scholar] [CrossRef] [PubMed]
  57. Haapajärvi, T.; Pitkänen, K.; Laiho, M. Human melanoma cell line UV responses show independency of p53 function. Cell Growth Differ. 1999, 10, 163–171. [Google Scholar] [PubMed]
  58. Raisova, M.; Hossini, A.M.; Eberle, J.; Riebeling, C.; Wieder, T.; Sturm, I.; Daniel, P.T.; Orfanos, C.E.; Geilen, C.C. The Bax/Bcl-2 ratio determines the susceptibility of human melanoma cells to CD95/Fas-mediated apoptosis. J. Invest. Dermatol. 2001, 117, 333–340. [Google Scholar] [CrossRef] [PubMed]
  59. Mun, Y.-J.; Lee, S.-W.; Jeong, H.-W.; Lee, K.-G.; Kim, J.-H.; Woo, W.-H. Inhibitory effect of miconazole on melanogenesis. Biol. Pharm. Bull. 2004, 27, 806–809. [Google Scholar] [CrossRef]
  60. Wu, C.-H.; Jeng, J.-H.; Wang, Y.-J.; Tseng, C.-J.; Liang, Y.-C.; Chen, C.-H.; Lee, H.-M.; Lin, J.-K.; Lin, C.-H.; Lin, S.-Y.; et al. Antitumor effects of miconazole on human colon carcinoma xenografts in nude mice through induction of apoptosis and G0/G1 cell cycle arrest. Toxicol. Appl. Pharmacol. 2002, 180, 22–35. [Google Scholar] [CrossRef]
  61. Wang, Y.-J.; Jeng, J.-H.; Chen, R.-J.; Tseng, H.; Chen, L.-C.; Liang, Y.-C.; Lin, C.-H.; Chen, C.-H.; Chu, J.-S.; Ho, W.-L.; et al. Ketoconazole potentiates the antitumor effects of nocodazole: In vivo therapy for human tumor xenografts in nude mice. Mol. Carcinog. 2002, 34, 199–210. [Google Scholar] [CrossRef] [PubMed]
  62. Yuan, S.-Y.; Shiau, M.-Y.; Ou, Y.-C.; Huang, Y.-C.; Chen, C.-C.; Cheng, C.-L.; Chiu, K.-Y.; Wang, S.-S.; Tsai, K.-J. Miconazole induces apoptosis via the death receptor 5-dependent and mitochondrial-mediated pathways in human bladder cancer cells. Oncol. Rep. 2017, 37, 3606–3616. [Google Scholar] [CrossRef] [PubMed] [Green Version]
  63. Roan, C.-J.; Chou, C.-T.; Liang, W.-Z.; Chang, H.-T.; Kuo, D.-H.; Kuo, C.-C.; Chen, F.-A.; Shieh, P.; Jan, C.-R. Effect of Miconazole on [Ca2+]i and Cytotoxicity in ZR-75-1 Human Breast Cancer Cells. Chin. J. Physiol. 2015, 58, 377–384. [Google Scholar] [CrossRef] [PubMed]
  64. Torikai, M.; Ibara, S.; Ieiri, S.; Hamada, T.; Noguchi, H.; Sueyoshi, K.; Fukuda, T.; Abeyama, K. Prophylactic efficacy of enteral miconazole administration for neonatal intestinal perforation and its potential mechanism. Pediatr. Surg. Int. 2016, 32, 953–957. [Google Scholar] [CrossRef] [PubMed]
  65. Li, N.; Song, X.; Wu, L.; Zhang, T.; Zhao, C.; Yang, X.; Shan, L.; Yu, P.; Sun, Y.; Wang, Y.; et al. Miconazole stimulates post-ischemic neurogenesis and promotes functional restoration in rats. Neurosci. Lett. 2018, 687, 94–98. [Google Scholar] [CrossRef]
  66. Singh, M.; Saha, R.K.; Saha, H.; Parhi, J. Effect of miconazole nitrate on immunological response and its preventive efficacy in Labeo rohita fingerlings against oomycetes Saprolegnia parasitica. J. Fish Dis. 2018, 41, 1539–1548. [Google Scholar] [CrossRef] [PubMed]
  67. Lu, X.; He, S.-Y.; Li, Q.; Yang, H.; Jiang, X.; Lin, H.; Chen, Y.; Qu, W.; Feng, F.; Bian, Y.; et al. Investigation of multi-target-directed ligands (MTDLs) with butyrylcholinesterase (BuChE) and indoleamine 2,3-dioxygenase 1 (IDO1) inhibition: The design, synthesis of miconazole analogues targeting Alzheimer’s disease. Bioorg. Med. Chem. 2018, 26, 1665–1674. [Google Scholar] [CrossRef]
  68. Pemberton, M.N. Morbidity and mortality associated with the interaction of miconazole oral gel and warfarin. Br. Dent. J. 2018, 225, 129–132. [Google Scholar] [CrossRef]
  69. Liang, G.; Liu, M.; Wang, Q.; Shen, Y.; Mei, H.; Li, D.; Liu, W. Itraconazole exerts its anti-melanoma effect by suppressing Hedgehog, Wnt, and PI3K/mTOR signaling pathways. Oncotarget 2017, 8, 28510–28525. [Google Scholar] [CrossRef] [Green Version]
  70. Lee, S.W.; Kim, Y.C.; Kim, D.K.; Yoon, T.Y.; Park, H.J.; Cinn, Y.W. Fungal melanonychia. J. Dermatol. 2004, 31, 904–909. [Google Scholar] [CrossRef] [PubMed]
  71. Schwartz, R.A. Superficial fungal infections. Lancet 2004, 364, 1173–1182. [Google Scholar] [CrossRef]
  72. Chung, B.Y.; Kim, S.Y.; Jung, J.M.; Won, C.H.; Choi, J.H.; Lee, M.W.; Chang, S.E. The antimycotic agent clotrimazole inhibits melanogenesis by accelerating ERK and PI3K-/Akt-mediated tyrosinase degradation. Exp. Dermatol. 2015, 24, 386–388. [Google Scholar] [CrossRef] [PubMed] [Green Version]
  73. Talantov, D.; Mazumder, A.; Yu, J.X.; Briggs, T.; Jiang, Y.; Backus, J.; Atkins, D.; Wang, Y. Novel genes associated with malignant melanoma but not benign melanocytic lesions. Clin. Cancer Res. 2005, 11, 7234–7242. [Google Scholar] [CrossRef] [PubMed]
  74. Mandrekar, J.N. Receiver operating characteristic curve in diagnostic test assessment. J. Thorac. Oncol. 2010, 5, 1315–1316. [Google Scholar] [CrossRef] [PubMed]
  75. Raskin, L.; Fullen, D.R.; Giordano, T.J.; Thomas, D.G.; Frohm, M.L.; Cha, K.B.; Ahn, J.; Mukherjee, B.; Johnson, T.M.; Gruber, S.B. Transcriptome profiling identifies HMGA2 as a biomarker of melanoma progression and prognosis. J. Investig. Dermatol. 2013, 133, 2585–2592. [Google Scholar] [CrossRef] [PubMed]
  76. Riker, A.I.; Enkemann, S.A.; Fodstad, O.; Liu, S.; Ren, S.; Morris, C.; Xi, Y.; Howell, P.; Metge, B.; Samant, R.S.; et al. The gene expression profiles of primary and metastatic melanoma yields a transition point of tumor progression and metastasis. BMC Med. Genomics 2008, 1, 13. [Google Scholar] [CrossRef]
  77. Chen, H.; Sharp, B.M. Content-rich biological network constructed by mining PubMed abstracts. BMC Bioinform. 2004, 5, 147. [Google Scholar]
  78. Facchiano, F.; D’Arcangelo, D.; Lentini, A.; Rossi, S.; Senatore, C.; Pannellini, T.; Tabolacci, C.; Facchiano, A.M.; Facchiano, A.; Beninati, S. Tissue transglutaminase activity protects from cutaneous melanoma metastatic dissemination: An in vivo study. Amino Acids 2013, 44, 53–61. [Google Scholar] [CrossRef]
  79. D’Arcangelo, D.; Facchiano, F.; Nassa, G.; Stancato, A.; Antonini, A.; Rossi, S.; Senatore, C.; Cordella, M.; Tabolacci, C.; Salvati, A.; et al. PDGFR-alpha inhibits melanoma growth via CXCL10/IP-10: A multi-omics approach. Oncotarget 2016, 7, 77257. [Google Scholar] [CrossRef]
Figure 1. Procedure for the selection of the five best candidates and for the experimental validation.
Cancers 11 00446 g001
Figure 2. ROC analysis of the five genes expression showing a very high ability to discriminate controls from melanoma samples, validated in two samples datasets. These genes also show a strong expression ratio in the third dataset and are not reported to be related to melanoma according to PubMed searches. ROC analysis evaluates how the given measure (gene-expression level in this case) relates to sensitivity (ability to detect melanoma presence) and specificity (ability to detect melanoma absence). AUC (area under curve) of SCNN1A, GJB3, KCNK7, GJB1, and KCNN2 indicate very high ability of their expression levels to discriminate melanoma from controls, namely 98%, 96%, 94%, 93%, and 91%, respectively.
Cancers 11 00446 g002
Figure 3. Chilibot analysis of Pubmed reported interactive relationships. According to the linguistic analysis carried out by Chilibot, miconazole is known to inhibit cytochrome P450; melanoma and cytochrome P450 are connected by both stimulatory and inhibitory relations; ion channels inhibit cytochrome P450 and stimulate melanoma. In parenthesis indicate number of abstracts found in PubMed is reported.
Cancers 11 00446 g003
Figure 4. (A,B) Proliferation of A-375 (A) and SKMEL-28 (B) melanoma cells under miconazole treatment. * indicates p < 0.01; Miconazole strongly inhibits the growth of either melanoma cell lines in a dose-dependent manner; and (C) miconazole does not affect proliferation of control cells (HaCat keratinocytes and embryonic fibroblasts).
Cancers 11 00446 g004
Figure 5. Quantification of cell death as function of miconazole dose and time of treatment, (A) A-375 (B) SKMEL-28. * indicates p < 0.01.
Cancers 11 00446 g005
Figure 6. A-375 cells under KCNN2-siRNA and ammonium nitrate treatment. (A) Miconazole effect in A-375 cells transfected with siRNA-KCNN2 and non-specific siRNA control. Bars without miconazole (left end of the graph) are expressed as % of untreated cells (NT); bars with miconazole (right end of the graph) are expressed as % of the corresponding control (NT with miconazole vs. NT without miconazole; siRNA Asp with miconazole vs. siRNA Asp without miconazole; siRNA KCNN2 with miconazole vs. siRNA KCNN2 without miconazole). Miconazole anti-proliferative effect is almost doubled in siRNA KCNN2-treated cells as compared to siRNA non-specific-treated cells. (B) KCNN2 protein expression in siRNA treated cells. siRNA KCNN2 strongly reduces KCNN2 expression in A-375 cells. (C) Ammonium nitrate has no anti-proliferative effect on A-375 cells; therefore, we may conclude that the anti-proliferative action of miconazole-nitrate is due to miconazole. * indicate p < 0.01.
Cancers 11 00446 g006
Table 1. Ion channels genes investigated in the present study, selected according to HUGO Gene Nomenclature Committee at https://www.genenames.org/cgi-bin/genefamilies/.
No.Gene NameNo.Gene NameNo.Gene NameNo.Gene NameNo.Gene NameNo.Gene Name
1ANO156CACNG5111GABRB1166GRIN2D221KCNJ2276P2RX6
2ANO1057CACNG6112GABRB2167GRIN3A222KCNJ3277P2RX7
3ANO258CACNG7113GABRB3168GRIN3B223KCNJ4278PKD2
4ANO359CACNG8114GABRD169HCN1224KCNJ5279PKD2L1
5ANO460CATSPER1115GABRE170HCN2225KCNJ6280PKD2L2
6ANO561CATSPER2116GABRG1171HCN3226KCNJ8281RYR1
7ANO662CATSPER3117GABRG2172HCN4227KCNJ9282RYR2
8ANO763CATSPER4118GABRG3173HTR3A228KCNK1283RYR3
9ANO864CATSPERB119GABRP174HTR3B229KCNK10284SCN10A
10ANO965CATSPERD120GABRQ175HTR3C230KCNK12285SCN11A
11AQP166CATSPERG121GABRR1176HTR3D231KCNK13286SCN1A
12AQP1067CFTR122GABRR2177HTR3E232KCNK15287SCN1B
13AQP1168CHRNA1123GABRR3178HVCN1233KCNK16288SCN2A
14AQP12A69CHRNA10124GJA1179ITPR1234KCNK17289SCN2B
15AQP12B70CHRNA2125GJA10180ITPR2235KCNK18290SCN3A
16AQP271CHRNA3126GJA3181ITPR3236KCNK2291SCN3B
17AQP372CHRNA4127GJA4182KCNA1237KCNK3292SCN4A
18AQP473CHRNA5128GJA5183KCNA10238KCNK4293SCN4B
19AQP574CHRNA6129GJA6P184KCNA2239KCNK5294SCN5A
20AQP675CHRNA7130GJA8185KCNA3240KCNK6295SCN8A
21AQP776CHRNA9131GJA9186KCNA4241KCNK7296SCN9A
22AQP877CHRNB1132GJB1187KCNA5242KCNK9297SCNN1A
23AQP978CHRNB2133GJB2188KCNA6243KCNMA1298SCNN1B
24ASIC179CHRNB3134GJB3189KCNA7244KCNN1299SCNN1D
25ASIC280CHRNB4135GJB4190KCNB1245KCNN2300SCNN1G
26ASIC381CHRND136GJB5191KCNB2246KCNN3301TPCN1
27ASIC482CHRNE137GJB6192KCNC1247KCNN4302TPCN2
28ASIC583CHRNG138GJB7193KCNC2248KCNQ1303TRPA1
29BEST184CLCN1139GJC1194KCNC3249KCNQ2304TRPC1
30BEST285CLCN2140GJC2195KCNC4250KCNQ3305TRPC2
31BEST386CLCN3141GJC3196KCND1251KCNQ4306TRPC3
32BEST487CLCN4142GJD2197KCND2252KCNQ5307TRPC4
33BSND88CLCN5143GJD3198KCND3253KCNS1308TRPC5
34CACNA1A89CLCN6144GJD4199KCNF1254KCNS2309TRPC6
35CACNA1B90CLCN7145GJE1200KCNG1255KCNS3310TRPC7
36CACNA1C91CLCNKA146GLRA1201KCNG2256KCNT1311TRPM1
37CACNA1D92CLCNKB147GLRA2202KCNG3257KCNT2312TRPM2
38CACNA1E93CLIC1148GLRA3203KCNG4258KCNU1313TRPM3
39CACNA1F94CLIC2149GLRA4204KCNH1259KCNV1314TRPM4
40CACNA1G95CLIC3150GLRB205KCNH2260KCNV2315TRPM5
41CACNA1H96CLIC4151GRIA1206KCNH3261LRRC8A316TRPM6
42CACNA1I97CLIC5152GRIA2207KCNH4262LRRC8B317TRPM7
43CACNA1S98CLIC6153GRIA3208KCNH5263LRRC8C318TRPM8
44CACNA2D199CNGA1154GRIA4209KCNH6264LRRC8D319TRPV1
45CACNA2D2100CNGA2155GRID1210KCNH7265LRRC8E320TRPV2
46CACNA2D3101CNGA3156GRID2211KCNH8266MCOLN1321TRPV3
47CACNA2D4102CNGA4157GRIK1212KCNJ1267MCOLN2322TRPV4
48CACNB1103CNGB1158GRIK2213KCNJ10268MCOLN3323TRPV5
49CACNB2104CNGB3159GRIK3214KCNJ11269MIP324TRPV6
50CACNB3105GABRA1160GRIK4215KCNJ12270NALCN325VDAC1
51CACNB4106GABRA2161GRIK5216KCNJ13271P2RX1326VDAC2
52CACNG1107GABRA3162GRIN1217KCNJ14272P2RX2327VDAC3
53CACNG2108GABRA4163GRIN2A218KCNJ15273P2RX3328ZACN
54CACNG3109GABRA5164GRIN2B219KCNJ16274P2RX4
55CACNG4110GABRA6165GRIN2C220KCNJ18275P2RX5
Table 2. List of ion channels genes showing differential expression in nevi vs. melanoma (p < 0.05), sorted according to the AUC value. The analysis was carried out in the GEO GDS1375 dataset.
No.Gene Namet Test Nevi vs. MelanomaRatio Melanoma vs. NeviAUCNo.Gene Namet Test Nevi vs. MelanomaRatio Melanoma vs. NeviAUC
1ANO18.7 × 10−180.231 Cancers 11 00446 i0010.9847CACNB21.5 × 10−30.4388 Cancers 11 00446 i0010.73
2KCNK71.8 × 10−170.081 Cancers 11 00446 i0010.9448TRPV61.9 × 10−30.576 Cancers 11 00446 i0010.65
3SCNN1A1.0 × 10−140.07 Cancers 11 00446 i0010.9849CLIC22.0 × 10−30.319 Cancers 11 00446 i0010.87
4SCNN1B1.4 × 10−140.313 Cancers 11 00446 i0010.9650SCN3A2.2 × 10−30.382 Cancers 11 00446 i0010.64
5GABRE2.3 × 10−130.203 Cancers 11 00446 i0010.9551GRIN2A2.3 × 10−30.619 Cancers 11 00446 i0010.69
6GJB53.4 × 10−130.1277 Cancers 11 00446 i0010.9752CACNG42.6 × 10−31.317 Cancers 11 00446 i0020.74
7CLIC11.9 × 10−121.738 Cancers 11 00446 i0020.9553GABRB13.0 × 10−30.698 Cancers 11 00446 i0010.69
8KCND32.0 × 10−110.487 Cancers 11 00446 i0010.9454GJB43.7 × 10−30.588 Cancers 11 00446 i0010.63
9KCNK18.6 × 10−110.269 Cancers 11 00446 i0010.9355CACNB44.3 × 10−30.474 Cancers 11 00446 i0010.66
10GRIA18.7 × 10−110.1049 Cancers 11 00446 i0010.9356CACNA115.0 × 10−30.629 Cancers 11 00446 i0010.70
11VDAC12.0 × 10−101.8 Cancers 11 00446 i0020.9657KCNK25.0 × 10−30.512 Cancers 11 00446 i0010.64
12GJB32.1 × 10−100.2453 Cancers 11 00446 i0010.9658TRPC15.4 × 10−30.665 Cancers 11 00446 i0010.70
13KCNN23.6 × 10−104.337 Cancers 11 00446 i0020.9159TRPC75.7 × 10−31.396 Cancers 11 00446 i0020.74
14AQP15.5 × 10−100.268 Cancers 11 00446 i0010.8460GRIK16.3 × 10−31.885 Cancers 11 00446 i0020.72
15ITPR31.1 × 10−92.311 Cancers 11 00446 i0020.9361GRIN2D6.7 × 10−31.922 Cancers 11 00446 i0020.75
16RYR11.8 × 10−90.2414 Cancers 11 00446 i0010.8162CLIC46.8 × 10−30.671 Cancers 11 00446 i0010.69
17GJA12.1 × 10−90.086 Cancers 11 00446 i0010.9863CACNA1S7.7 × 10−31.91 Cancers 11 00446 i0020.77
18KCNJ131.9 × 10−80.266 Cancers 11 00446 i0010.8664CATSPER28.1 × 10−30.677 Cancers 11 00446 i0010.75
19TRPV23.0 × 10−81.77 Cancers 11 00446 i0020.8865GABRP8.1 × 10−30.3014 Cancers 11 00446 i0010.69
20GJB13.4 × 10−82.643 Cancers 11 00446 i0020.9366GJA49.0 × 10−30.5357 Cancers 11 00446 i0010.68
21CLIC34.0 × 10−80.118 Cancers 11 00446 i0010.8567KCNJ159.0 × 10−30.506 Cancers 11 00446 i0010.64
22LRRC8B4.4 × 10−80.459 Cancers 11 00446 i0010.9068CNGB31.0 × 10−20.63 Cancers 11 00446 i0010.69
23HCN22.1 × 10−73.88 Cancers 11 00446 i0020.8969SCNN1D1.0 × 10−20.735 Cancers 11 00446 i0010.69
24TRPM13.0 × 10−70.368 Cancers 11 00446 i0010.7770GRIA41.2 × 10−20.71 Cancers 11 00446 i0010.68
25BEST23.6 × 10−70.456 Cancers 11 00446 i0010.8671TRPM31.3 × 10−20.762 Cancers 11 00446 i0010.72
26AQP36.9 × 10−70.067 Cancers 11 00446 i0010.9772CHRNA101.5 × 10−20.759 Cancers 11 00446 i0010.68
27KCNN41.5 × 10−63.79 Cancers 11 00446 i0020.9373AQP91.9 × 10−20.56 Cancers 11 00446 i0010.75
28SCN1B1.5 × 10−60.657 Cancers 11 00446 i0010.8374VDAC31.9 × 10−21.27 Cancers 11 00446 i0020.78
29LRRC8E1.5 × 10−60.563 Cancers 11 00446 i0010.8275KCNV12.0 × 10−21.737 Cancers 11 00446 i0020.70
30CACNB12.9 × 10−60.614 Cancers 11 00446 i0010.8276VDAC22.0 × 10−21.15 Cancers 11 00446 i0020.71
31KCNJ123.5 × 10−60.388 Cancers 11 00446 i0010.8077CHRNB12.1 × 10−20.754 Cancers 11 00446 i0010.68
32KCNJ183.5 × 10−60.388 Cancers 11 00446 i0010.8078ANO22.4 × 10−20.67 Cancers 11 00446 i0010.68
33TRPM43.6 × 10−60.154 Cancers 11 00446 i0010.8779CHRNB22.6 × 10−21.383 Cancers 11 00446 i0020.70
34KCNS37.7 × 10−60.403 Cancers 11 00446 i0010.9380SCNN1G2.8 × 10−21.45 Cancers 11 00446 i0020.67
35PKD2L18.7 × 10−62.66 Cancers 11 00446 i0020.8681TRPC62.8 × 10−20.594 Cancers 11 00446 i0010.67
36P2RX41.0 × 10−51.756 Cancers 11 00446 i0020.8582KCNA13.0 × 10−20.79 Cancers 11 00446 i0010.67
37GRIK23.9 × 10−53.922 Cancers 11 00446 i0020.8683PKD2L23.0 × 10−20.447 Cancers 11 00446 i0010.52
38KCNJ45.0 × 10−52.87 Cancers 11 00446 i0020.8484GABRA63.9 × 10−20.622 Cancers 11 00446 i0010.65
39TRPM26.5 × 10−50.219 Cancers 11 00446 i0010.9385GRINB23.9 × 10−21.225 Cancers 11 00446 i0020.67
40CLCN71.2 × 10−41.753 Cancers 11 00446 i0020.8086KCNJ24.0 × 10−21.33 Cancers 11 00446 i0020.72
41MCOLN32.2 × 10−40.352 Cancers 11 00446 i0010.6287TRPV54.0 × 10−21.29 Cancers 11 00446 i0020.66
42SCN2B2.6 × 10−40.483 Cancers 11 00446 i0010.7188ASIC14.1 × 10−20.71 Cancers 11 00446 i0010.63
43LRRC8D2.8 × 10−41.39 Cancers 11 00446 i0020.7889AQP54.1 × 10−21.498 Cancers 11 00446 i0020.67
44MCOLN13.8 × 10−41.43 Cancers 11 00446 i0020.7290CACNG34.3 × 10−21.903 Cancers 11 00446 i0020.73
45CLCN65.0 × 10−40.74 Cancers 11 00446 i0010.7991TRPC44.3 × 10−22.097 Cancers 11 00446 i0020.69
46CNGA15.0 × 10−40.58 Cancers 11 00446 i0010.72
Table 3. Ion channels genes showing very high discriminating ability (AUC > 0.90) in the Talantov dataset were validated in a first round validation in the Raskin dataset. Genes passing the first validation were then validated in the Riker dataset. Genes passing screening phase and all two validations were searched in Pubmed to identify those never directly related to melanoma. Genes showing 0 value in the “Novelty” column are genes never related to melanoma according to Pubmed abstract. Five genes were selected according to this procedure (SCNN1A, GJB3, KCNK7, GJB1, KCNN2). Empty cells indicate lack of validation.
No.Gene NameScreening Phase (in the Talantov Dataset, GEO, GDS1375)First-Round Validation (in the Raskin Dataset, GEO GSE15605) *Second-Round Validation (in the Riker Dataset, Oncomine) **Novelty (in PubMeds Abstracts) ***Full in Silico Validation
63 Patients62 Patients59 Patients
t Test
Melanoma vs. Nevi
Ratio Melan. vs. NeviAUCValidation on AUC Value *Validation on Ratio ValueGene Name and Melanoma Words Co-Occurrence
1SCNN1A1.0 × 10−140.070.98Yes (0.85)Yes (−4.94)0 Cancers 11 00446 i003
2ANO18.6 × 10−180.2310.98Yes (0.87)
3GJA12.1 × 10−90.0860.98Yes (0.88)
4GJB53.4 × 10−130.12770.97
5GJB32.1 × 10−100.24530.96Yes (0.86)Yes (−6.662)0 Cancers 11 00446 i003
6AQP36.9 × 10−70.0670.97
7SCNN1B1.4 × 10−140.3130.96Yes (0.87)
8VDAC12.0 × 10−101.80.96
9CLIC11.9 × 10−121.7380.96
10GABRE2.3 × 10−130.2030.95Yes (0.88)Yes (−3.162)≥1
11KCNK71.8 × 10−170.0810.94Yes (0.86)Yes (−2.832)0 Cancers 11 00446 i003
12KCND32.0 × 10−110.4870.94Yes (0.89)
14KCNN41.5 × 10−63.790.93
13ITPR31.1 × 10−92.3110.93
15KCNK18.6 × 10−110.2690.93Yes (0.89)
16KCNS37.7 × 10−60.4030.93
17TRPM26.5 × 10−50.2190.93
18GRIA18.7 × 10−110.10490.93
19GJB13.4 × 10−82.6430.93Yes (0.87)Yes (3.303)0 Cancers 11 00446 i003
20KCNN23.6 × 10−104.3370.91Yes (0.91)Yes (2.284)0 Cancers 11 00446 i003
* validation in GSE15605 was considered effective if AUC > 0.85 (AUC is reported in parenthesis); ** validation in Riker dataset was considered effective if difference of melanoma vs. normal skin is <0.5 or >1.5 (difference is reported in parenthesis, calculated from log2 median-centered intensity according to Oncomine); *** Novelty was assessed onto the five genes validated in the first and second validations steps.
Table 4. Gene-drug interaction according to the Drug Gene Interaction Database (www.dgidb.org). The five genes selected in Table 3 are investigated. Drugs known to target the given genes and interaction type are according to www.dgidb.org. Main target tissues, pharmacological action and IUPAC (International Union of Pure and Applied Chemistry) are derived from Drugbank (https://www.drugbank.ca/drugs). EC50 of the indicated pharmacological actions are also reported with corresponding reference. References indicating the ion channel/drug interaction are reported.
Gene NameDrug Targeting the Gene, According to www.dgidb.org, and IUPAC NameReference (PMID)Interaction Type with the GeneMain Target TissueAction and IndicationsEC50
SCNN1ATriamterene
6-phenylpteridine-2,4,7-triamine
[30]channel blockerkidneydiuretic, anti-edema1660 nM [31]
Amiloride
3,5-diamino-6-chloro-N-(diaminomethylidene)pyrazine-2-carboxamide
[32]channel blockerkidneydiuretic; congestive heart failure; hypertension.0.1 μM [33]
GJB3Flufenamic acid
2-{[3-(trifluoromethyl)phenyl]amino}benzoic acid
[34]inhibitormuscles jointsanti-cancer100/200 μM [35]
Carbenoxolone
2S,4aS,6aR,6aS,6bR,8aR,10S,12aS,14bR)-10-(3-carboxypropanoyloxy)-2,4a,6a,6b,9,9,12a-heptamethyl-13-oxo-3,4,5,6,6a,7,8,8a,10,11,12,14b-dodecahydro-1H-picene-2-carboxylic acid
[34,36]inhibitordigestive tractanti-ulcer/neuro protection48 μM [37]
KCNK7Not found
GJB1Not found
KCNN2Miconazole
1-[2-(2,4-dichlorophenyl)-2-[(2,4-dichlorophenyl)methoxy]ethyl]-1H-imidazole
[38]Inhibitorsystemic, skinanti-fungal infections75 μM [39]
Tubocurarine
(1S,16R)-9,21-dihydroxy-10,25-dimethoxy-15,15,30-trimethyl-7,23-dioxa-15,30-diazaheptacyclo [22.6.2.23,6.18,12.118,22.027,31.016,34]hexatriaconta-3,5,8(34),9,11,18(33),19,21, 24, 26,31,35-dodecaen-15-ium
[34]channel blockerCNSdiagnostic in myastenia gravis; to treat smoking withdrawl syndrom1.3 μM [40]
Bendroflumethiazide
3-benzyl-1,1-dioxo-6-(trifluoromethyl)-3,4-dihydro-2H-1λ6,2,4-benzothiadiazine-7-sulfonamide
[34]channel blockerkidney smooth muscle cellsAnti HBV, diuretic; anti-edema; hypertension53 μM [41]
Table 5. Top 10 biological processes enriched in a statistically significant way by investigating in a STRING “multiple proteins” search the following molecules: CYP51A1, NOS3, NOS2, NOS1, KCNMA1, KCNMB3, KCNN4, KCNH2, KCNH7, KCNH6, KCNN2.
Biological ProcessPathway IDFalse Discovery Rate
Potassium ion transmembrane transportGO:007818051.9 × 10−7
Arginine catabolic processGO:00065276.4 × 10−6
Synaptic transmissionGO:00072686.4 × 10−6
Positive regulation of guanylate cyclase activityGO:00312844.2 × 10−5
Regulation of system processCO:00440574.2 × 10−5
Nitric oxide biosynthetic processGO:00068095.3 × 10−5
Regulation of potassium ion transportGO:00432665.7 × 10−5
Regulation of blood circulationGO:19035225.7 × 10−5
Nitric oxide mediated signal transductionGO:00072638.1 × 10−5
Blood circulationGO:00080158.3 × 10−5

