High-Performance Vanadium Redox Flow Batteries with Graphite Felt Electrodes

Department of Natural Sciences, University of Chester, Thornton Science Park, Pool Lane, Ince, Chester CH2 4NU, UK
*
Author to whom correspondence should be addressed.
C 2018, 4(1), 8; https://doi.org/10.3390/c4010008
Submission received: 11 December 2017
/
Revised: 16 January 2018
/
Accepted: 18 January 2018
/
Published: 25 January 2018
Abstract
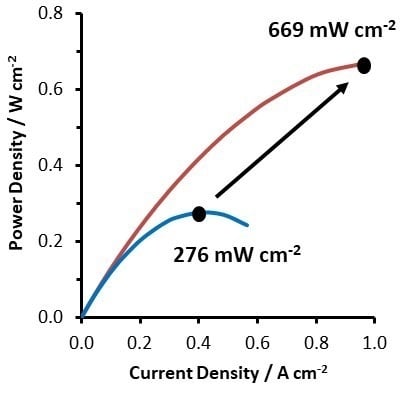
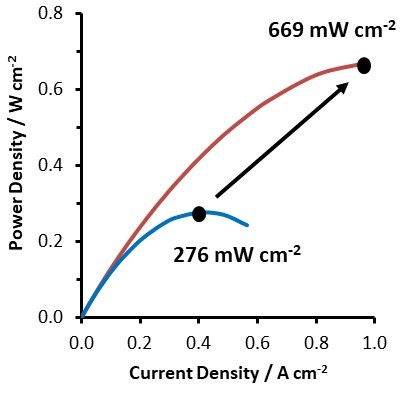
:A key objective in the development of vanadium redox flow batteries (VRFBs) is the improvement of cell power density. At present, most commercially available VRFBs use graphite felt electrodes under relatively low compression. This results in a large cell ohmic resistance and limits the maximum power density. To date, the best performing VRFBs have used carbon paper electrodes, with high active area compression pressures, similar to that used in fuel cells. This article investigates the use of felt electrodes at similar compression pressures. Single cells are assembled using compression pressures of 0.2–7.5 bar and tested in a VRFB system. The highest cell compression pressure, combined with a thin Nafion membrane, achieved a peak power density of 669 mW cm−2 at a flow rate of 3.2 mL min−1 per cm2 of active area, more than double the previous best performance from a felt-VRFB. The results suggest that felt electrodes can compete with paper electrodes in terms of performance when under similar compression pressures, which should help guide electrode development and cell optimization in this important energy storage technology.
1. Introduction
The accelerating growth of renewable intermittent electricity supplies (wind, solar, tidal) requires an accompanying growth of energy storage installations [1]. At present, lithium-ion batteries dominate electrochemical energy storage applications, their success driven by low cost, high energy density and proven reliability [2]. However, redox flow batteries (RFBs) are seen as an attractive alternative to lithium-ion. Despite their higher price per kWh, RFBs have longer lifetimes, reduced fire risk, and are recyclable [3,4]. More importantly, power and capacity are completely decoupled in a flow battery, with power determined by the size of the stack and capacity determined by the volume and concentration of electrolyte (i.e., size of the electrolyte tanks). Consequently, RFBs offer a versatile approach to energy storage, capable of both long and short duration applications, with their market impact expected to rapidly increase over the next 10–20 years. Conservative estimates value the cumulative global RFB market at €50 billion by 2030, corresponding to ~€3 billion per annum by that time [5].
Of the several flow battery chemistries available, the vanadium redox flow battery (VRFB) is by far the most commercialized due to its long lifetime and ease of recycling [6]. Indeed, the world’s largest battery will be a 200 MW/800 MWh VRFB in China [7]. Despite the success of VRFBs, system cost is a major issue and must decrease for the technology to be competitive. A key strategy in VRFB cost reduction is the improvement of cell power density and performance [8]. Compared to polymer electrolyte fuel cells (PEFCs), which possess similar cell architecture, VRFBs have incredibly poor performance. For example, conventional PEFCs can easily achieve current densities of 1.5 A cm−2 whereas most VRFBs installed today operate at current densities less than 0.2 A cm−2, an order of magnitude lower. Although a direct comparison is unfair (because VRFBs operate at higher efficiencies than PEFCs), the relatively poor performance of VRFB cells compared to PEFCs requires much larger cells for a given power. For example, a conventional 5 kW VRFB stack is of similar size to the 114 kW fuel cell stack in the Toyota Mirai. A number of researchers have analyzed the cost factors associated with VRFBs and found the stack contributes 30–32% of the overall system cost [6,9,10]. Thus, if fuel cell-like performance can be achieved, the size of VRFB stacks could decrease by an order of magnitude, with a dramatic effect on system cost.
The electrode material plays a key role in determining the performance of a flow battery cell. Due to its high conductivity, favorable permeability, electrochemical stability, and large surface area, graphite (or carbon) felt is presently the most favored electrode material for VRFBs [11,12]. In one of the earliest studies on VRFBs, Kazacos and Skyllas–Kazacos achieved a peak power density of 85 mW cm−2 using graphite felt electrodes [13]. Since then, a large number of researchers have improved performance via kinetic effects, modifying graphite felt electrodes to increase their reactivity and decrease the over potential associated with driving the electrochemical reactions [11,12]. Some studies improved cell performance by introducing more favorable mass transport of electrolyte through the felt electrodes [14,15]. Considerable gains in performance have been achieved by reducing the ohmic resistance of the cell, via increasing the compression of the felt electrode and decreasing the contact resistance within the cell [16,17,18,19]. Park et al. found compression values in the range 20–30% gave favorable performance (where the compression is the percentage reduction in thickness—i.e., 20% compression corresponds to a felt compressed to 80% of its initial thickness) [18], whereas Chang et al. further improved power density by increasing the compression to 40% [16]. One of the highest peak power densities recorded with felt electrodes was obtained by Chen et al., who achieved 311 mW cm−2 with a GFA5 felt electrode at a compression of 33% [20]. Their performance was slightly bettered by Zhao and coworkers, who achieved a peak power density of 350 mW cm−2 with a VRFB utilizing GFA5 electrodes at elevated temperature (55 °C) [21]. However, the compression of the electrodes was not reported. More recently, Brown et al. studied felt compressions up to 75% [17]. At a current density of 200 mA cm−2, an increase in felt compression from 25% to 75% raised power density from 157 to 200 mW cm−2. The researchers also showed the performance benefit was mostly caused by a decrease in contact resistance between the felt and the back plate. This suggests peak power density values greater than 350 mW cm−2 are possible with felt electrodes.
The most dramatic improvement in VRFB performance was made by researchers at the University of Tennessee, who used carbon paper (GDL 10AA) instead of graphite felt as the electrode material, achieving a peak power density of 557 mW cm−2 [22]. Their cell design, named “zero gap”, was essentially a conventional PEFC without the catalyst coating on the membrane. Consequently, the compression pressure on the active area was like that in PEFCs (8–10 bar), greatly reducing the ohmic resistance of the cell. Shortly after, the Tennessee group further increased peak power density to 767 mW cm−2 using pre-treated carbon paper electrodes in combination with thinner membranes [23]. More recently, the same group achieved a power density of 1290 mW cm−2 at current densities of over 1 A cm−2 by improving mass transport to the carbon paper electrodes [24]. Following the success of the “zero gap” VRFB, several groups performed studies into improving the kinetics and/or mass transport properties of carbon paper electrodes in VRFBs [8,25,26,27,28,29,30,31]. The most noticeable contribution came from United Technologies Research Centre (UTRC), who reported a peak power density of 1350 mW cm−2 at a current density of 1.6 A cm−2, although the exact cell details were not disclosed [32].
Reviewing the published results on VRFBs using graphite felt and carbon paper electrodes, the literature suggests the latter are required to achieve high power densities. However, there are suggestions that felt electrodes can perform better if the compression pressure is like that used with paper electrodes [17]. This work seeks to establish the performance limits of VRFBs with felt electrodes by conducting a thorough study of the effect of felt compression (from mild to extreme) on cell power density and a range of other important properties. The results will help guide the development of electrodes for high-performance flow batteries.
2. Results and Discussion
2.1. Ex-Situ Tests
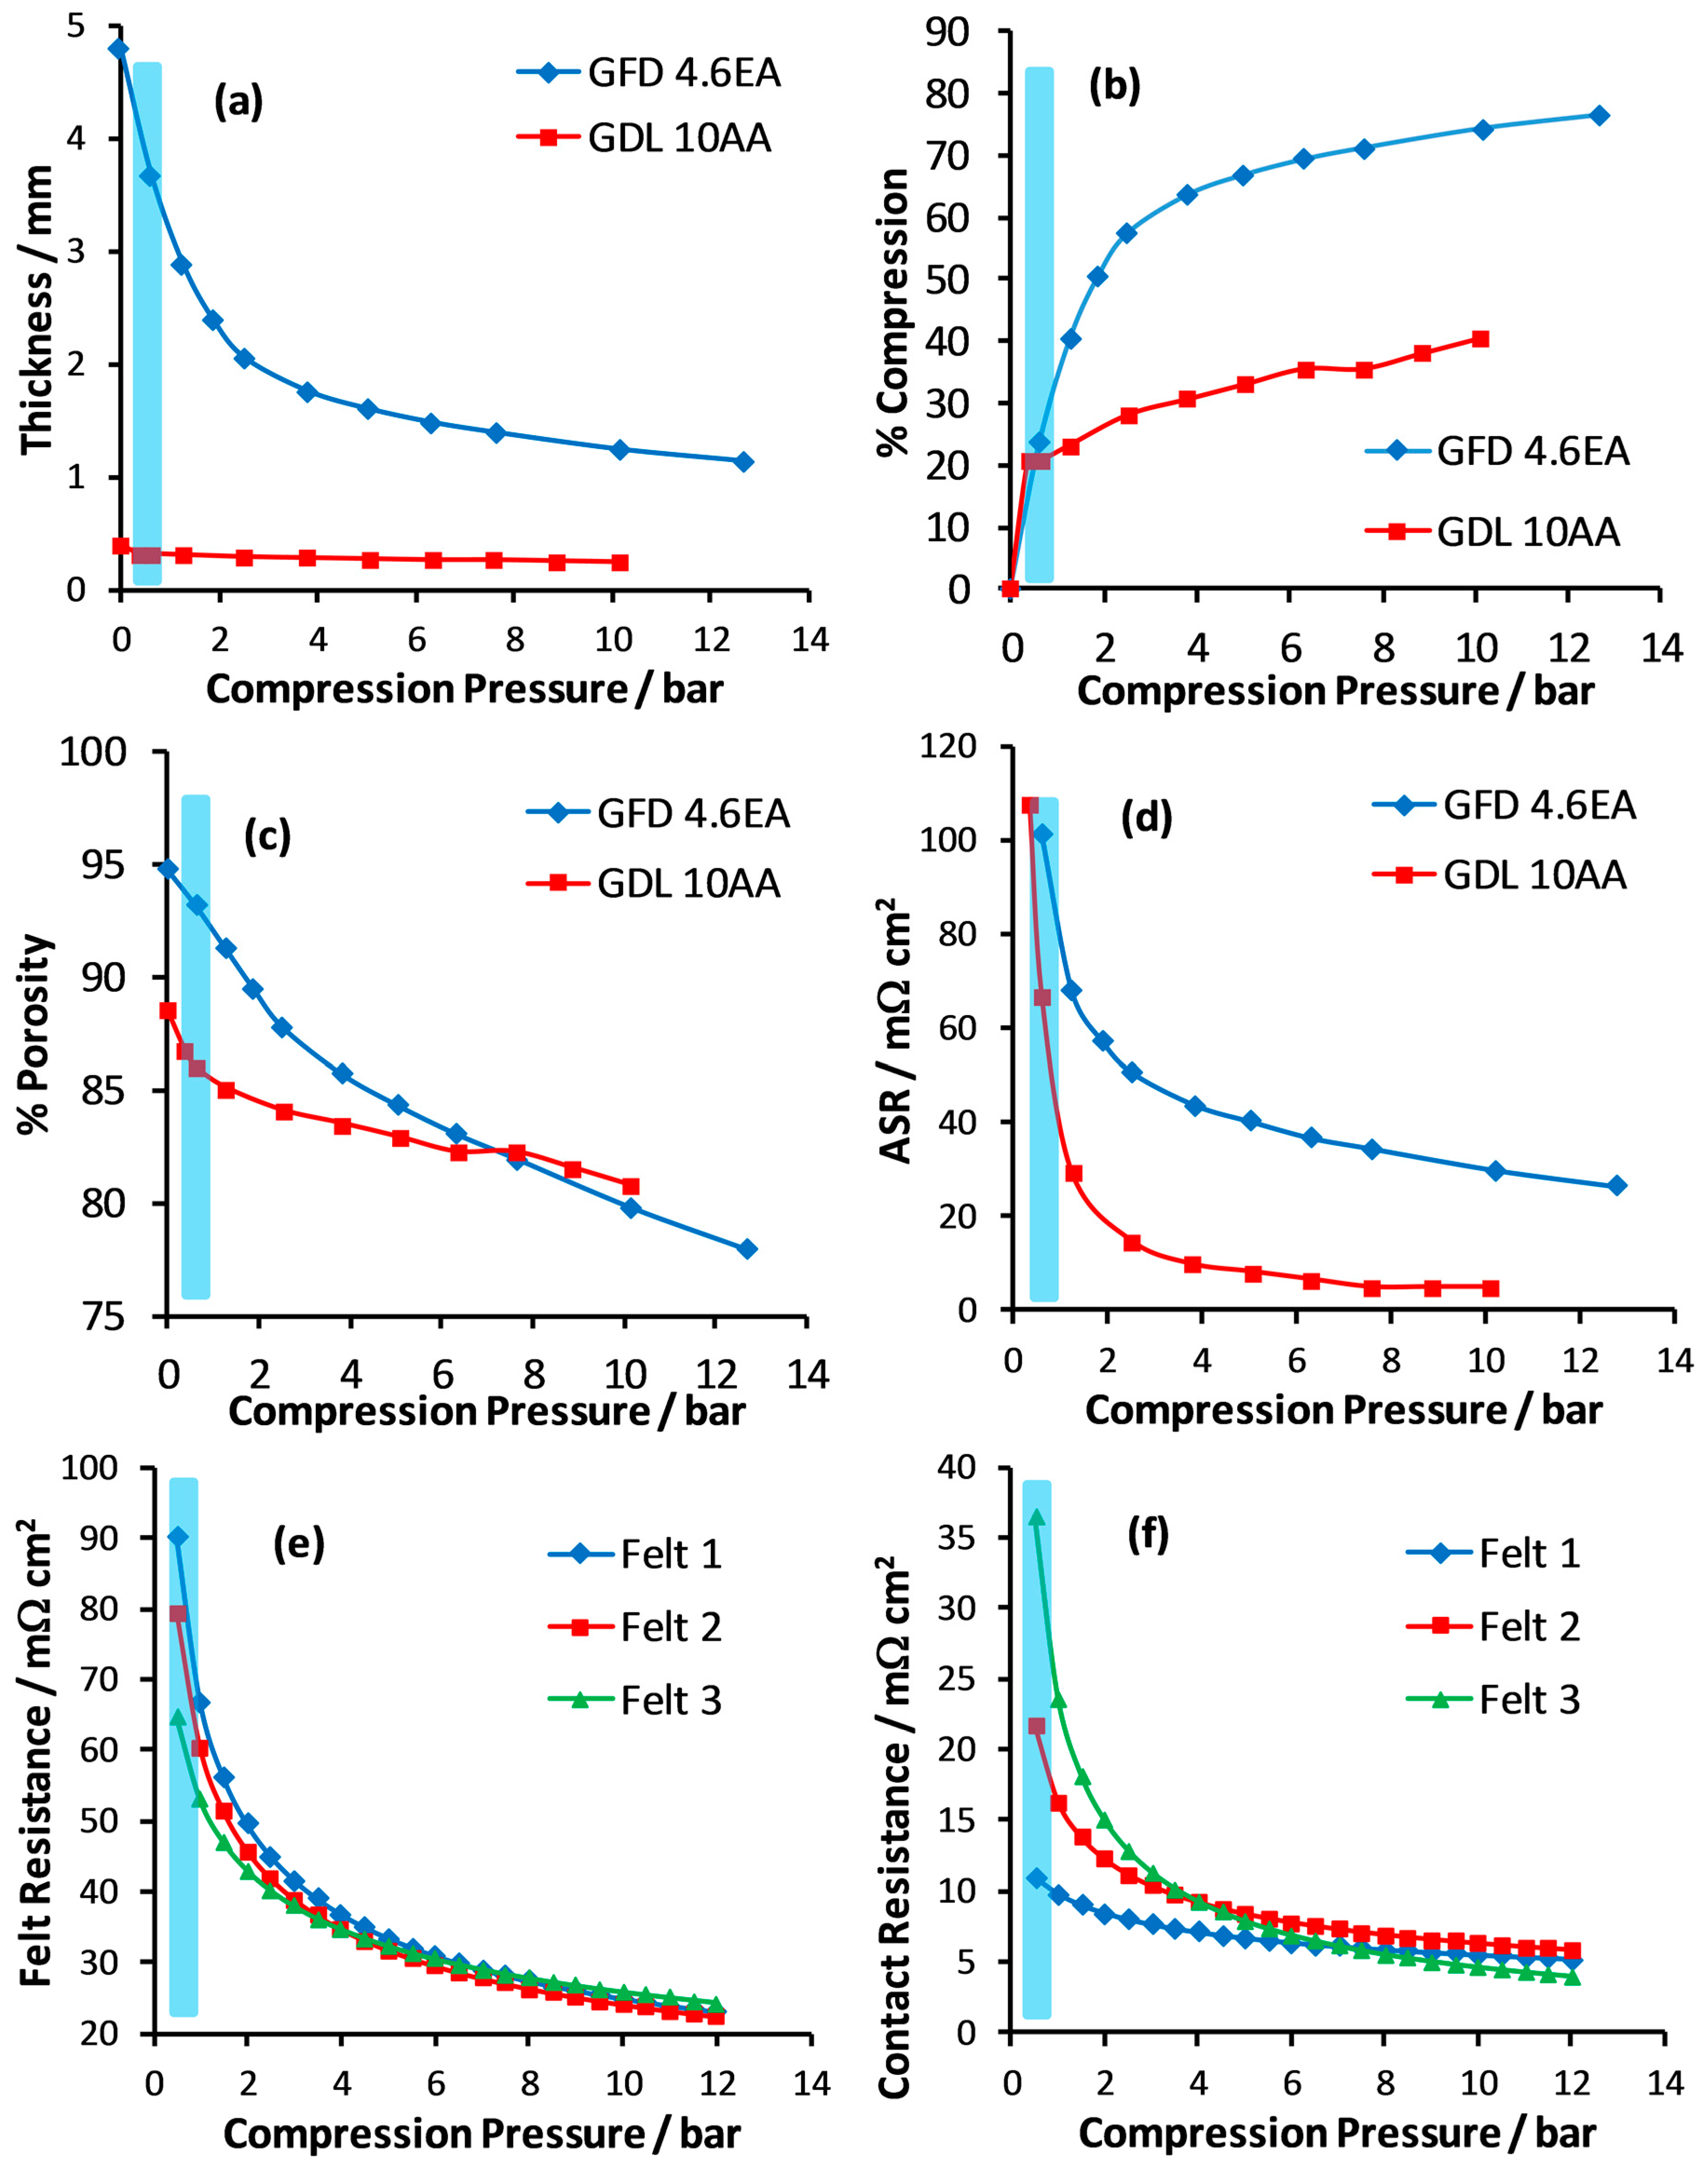
Figure 1a illustrates the effect of compression pressure on the thickness of the graphite felt GFD 4.6EA and the carbon paper GDL 10AA (where the compression pressure is the pressure experienced by the sample), recorded using the compression rig described in Section 3.4. Up to a compression pressure of 2 bar, there is a sharp decrease in felt thickness, which is followed by a gentler decrease in thickness from 2–12 bar. The blue zone represents 10–30% compression, which is often the range recommended by felt manufacturers for RFB applications. Figure 1b,c illustrate the corresponding compression and porosity relationships, respectively, where compression is defined as the percentage reduction in thickness (compared to the original felt sample) and porosity, , is estimated using:
where m is the mass of the felt sample, Dcf is the density of carbon fibers in the sample (assumed to be 1.8 g cm−3 [33]) and V is the total volume of the felt sample. As observed, the carbon paper displays a much higher compressive strength than the felt. In a typical felt electrode VRFB (i.e., 10–30% compression), the compression pressure will be 1 bar or less corresponding to a porosity of ~93%. This compares to ~83% for carbon paper electrodes (i.e., GDL 10AA) used in high-performance VRFBs, where the applied pressure is likely to be 5–10 bar. These “paper-like” porosities are also achievable for felt electrodes at compression pressures of 5–10 bar, corresponding to felt compression values above 65%.
Figure 1d shows the area specific resistance of the electrode material, sandwiched between 2 gold-coated steel plates (details in Section 3.4), under different compression pressures (where the active area is 31 cm2). For both materials the profile mimics that of Figure 1a, with a steep decrease in resistance up to 2 bar applied pressure, followed by a gentler decrease in resistance as the assembly is further compressed. At higher compression pressures the resistance of the paper electrode assembly is approximately 6 times less than the felt assembly. At the same pressures, the paper thickness is approximately five times less than that of the felt. This suggests the resistivities of the two materials are not too dissimilar and the main reason for the large difference in resistance is due to the thickness of the electrodes.
Assuming the gold-coated steel plates make a negligible contribution to the resistance of the assembly, for a given applied pressure, p, the measured resistance, R, can be approximated as:
where is the felt resistivity, t is the felt thickness, A is the felt area (31 cm2) and Rc is the contact resistance between the felt and the gold-coated steel plate. In this case, it is possible to estimate Rc and by repeating the measurement with a cut-down piece of the same felt, for example a section of GFD 4.6EA sliced to half its original thickness. For the same applied pressure, p, the resistivity and contact resistance of the cut-down felt should be the same as the original sample. Therefore, the resistance of the assembly containing the cut-down felt, R2, can be written as:
where t2 is the thickness of the cut-down felt.
When R, R2, A, t and t2 are all known for a given applied pressure, Equations (2) and (3) can be solved to obtain estimates for the felt resistivity and the contact resistance. Accordingly, samples of GFD 4.6EA and cut-down GFD 4.6 EA were used to estimate Rc and ρ for a range of pressures. On average, the resistivity of the bulk felt was ~2 mΩ cm and displayed a weak dependence on compression, with a change of around 5% over the range of applied pressures. This agrees with the X-ray tomography analysis of Brown et al. who found no significant increase in contact between carbon fibers in a highly compressed graphite felt electrode [17]. The resistivity was then used to calculate the bulk resistance of GFD 4.6EA. This is illustrated in Figure 1e and the total contact resistance (2Rc) is shown in Figure 1f, both in terms of area specific resistance. In each case, the results for three separate felt samples (i.e., three GFD 4.6EA vs. cut-down GFD 4.6EA combinations) are given, which represent the spread observed using this method. Both the felt bulk resistance and contact resistance decrease as the applied pressure increases, with a similar profile to that for the total assembly resistance. On average, the contact resistance accounts for approximately 20% of the total assembly resistance.
The high-performance carbon paper electrode VRFBs reported in the literature most likely use cell compression pressures of 8–10 bar, similar to that used in conventional PEFCs. The results in Figure 1 suggest conventional felt electrode VRFBs use cell compression pressures of approximately 1 bar or less, which are associated with high ohmic resistance (both bulk and contact). Increasing the felt compression pressure to 8–10 bar decreases the porosity to a value like that of paper electrodes (~80%) and reduces the associated ohmic resistance by two thirds. However, even at high compression pressures, the felt electrode still possesses a significantly higher ohmic resistance than the carbon paper due to its much larger thickness.
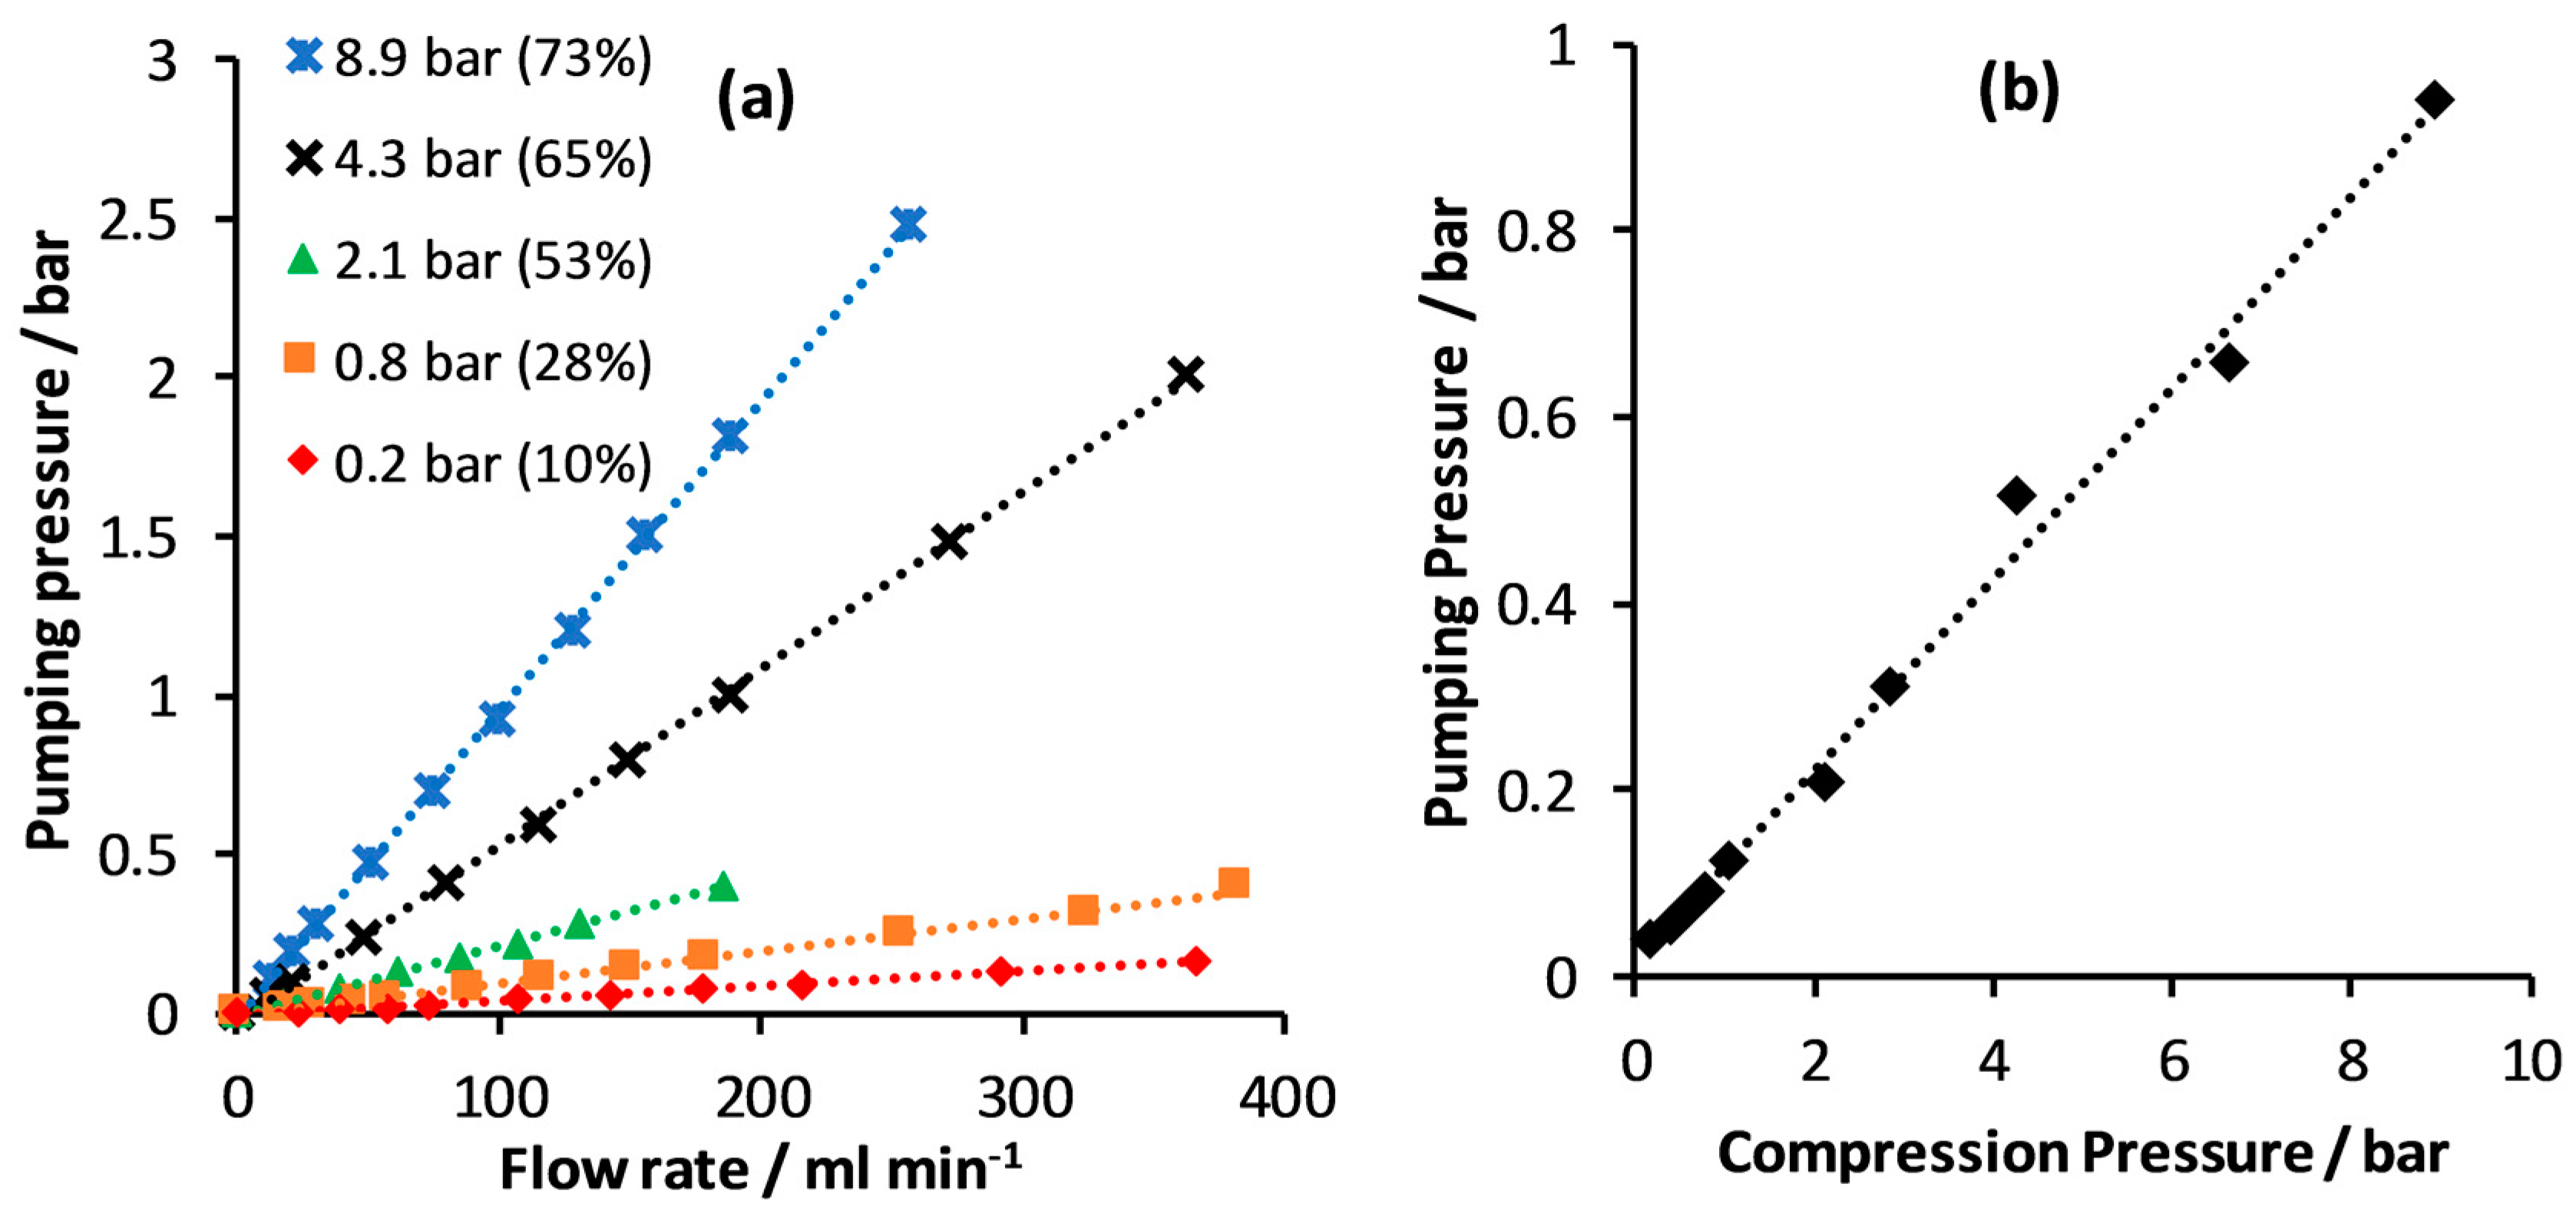
A major disadvantage of increasing felt compression is shown in Figure 2a where pumping pressure is plotted against water flow rate for a range of felt compression pressures (obtained by varying the half-cell well depth) in the flow rig described in Section 3.4. For all compression pressures, the relationship between pumping pressure and flow rate is linear (lines of best fit are plotted), in agreement with Darcy’s Law [34]. As felt compression pressure increases, the porosity of the material decreases, making fluid flow through the medium more difficult. This is further illustrated by Figure 2b, where pumping pressure required for a water (at 22 °C) flow rate of 100 mL min−1 is plotted against the felt compression pressure for a range of half-cells of varying well depth. In this case, increasing the compression pressure from 1 to 9 bar caused the pumping pressure to increase over 7 times. Given this was a one inlet-one outlet flow through arrangement, the use of a flow field could considerably decrease the pumping pressure and possibly improve the mass transport properties of the electrode, as seen with carbon paper electrodes [24,26].
2.2. VRFB Cell Performance
Table 1 lists details of the 10 cell builds studied in this report. The compression pressure (i.e., pressure on the active area) was determined using Figure 1a and the measured electrode well depth. Only untreated GFD 4.6EA was used as the electrode material for cell performance tests.
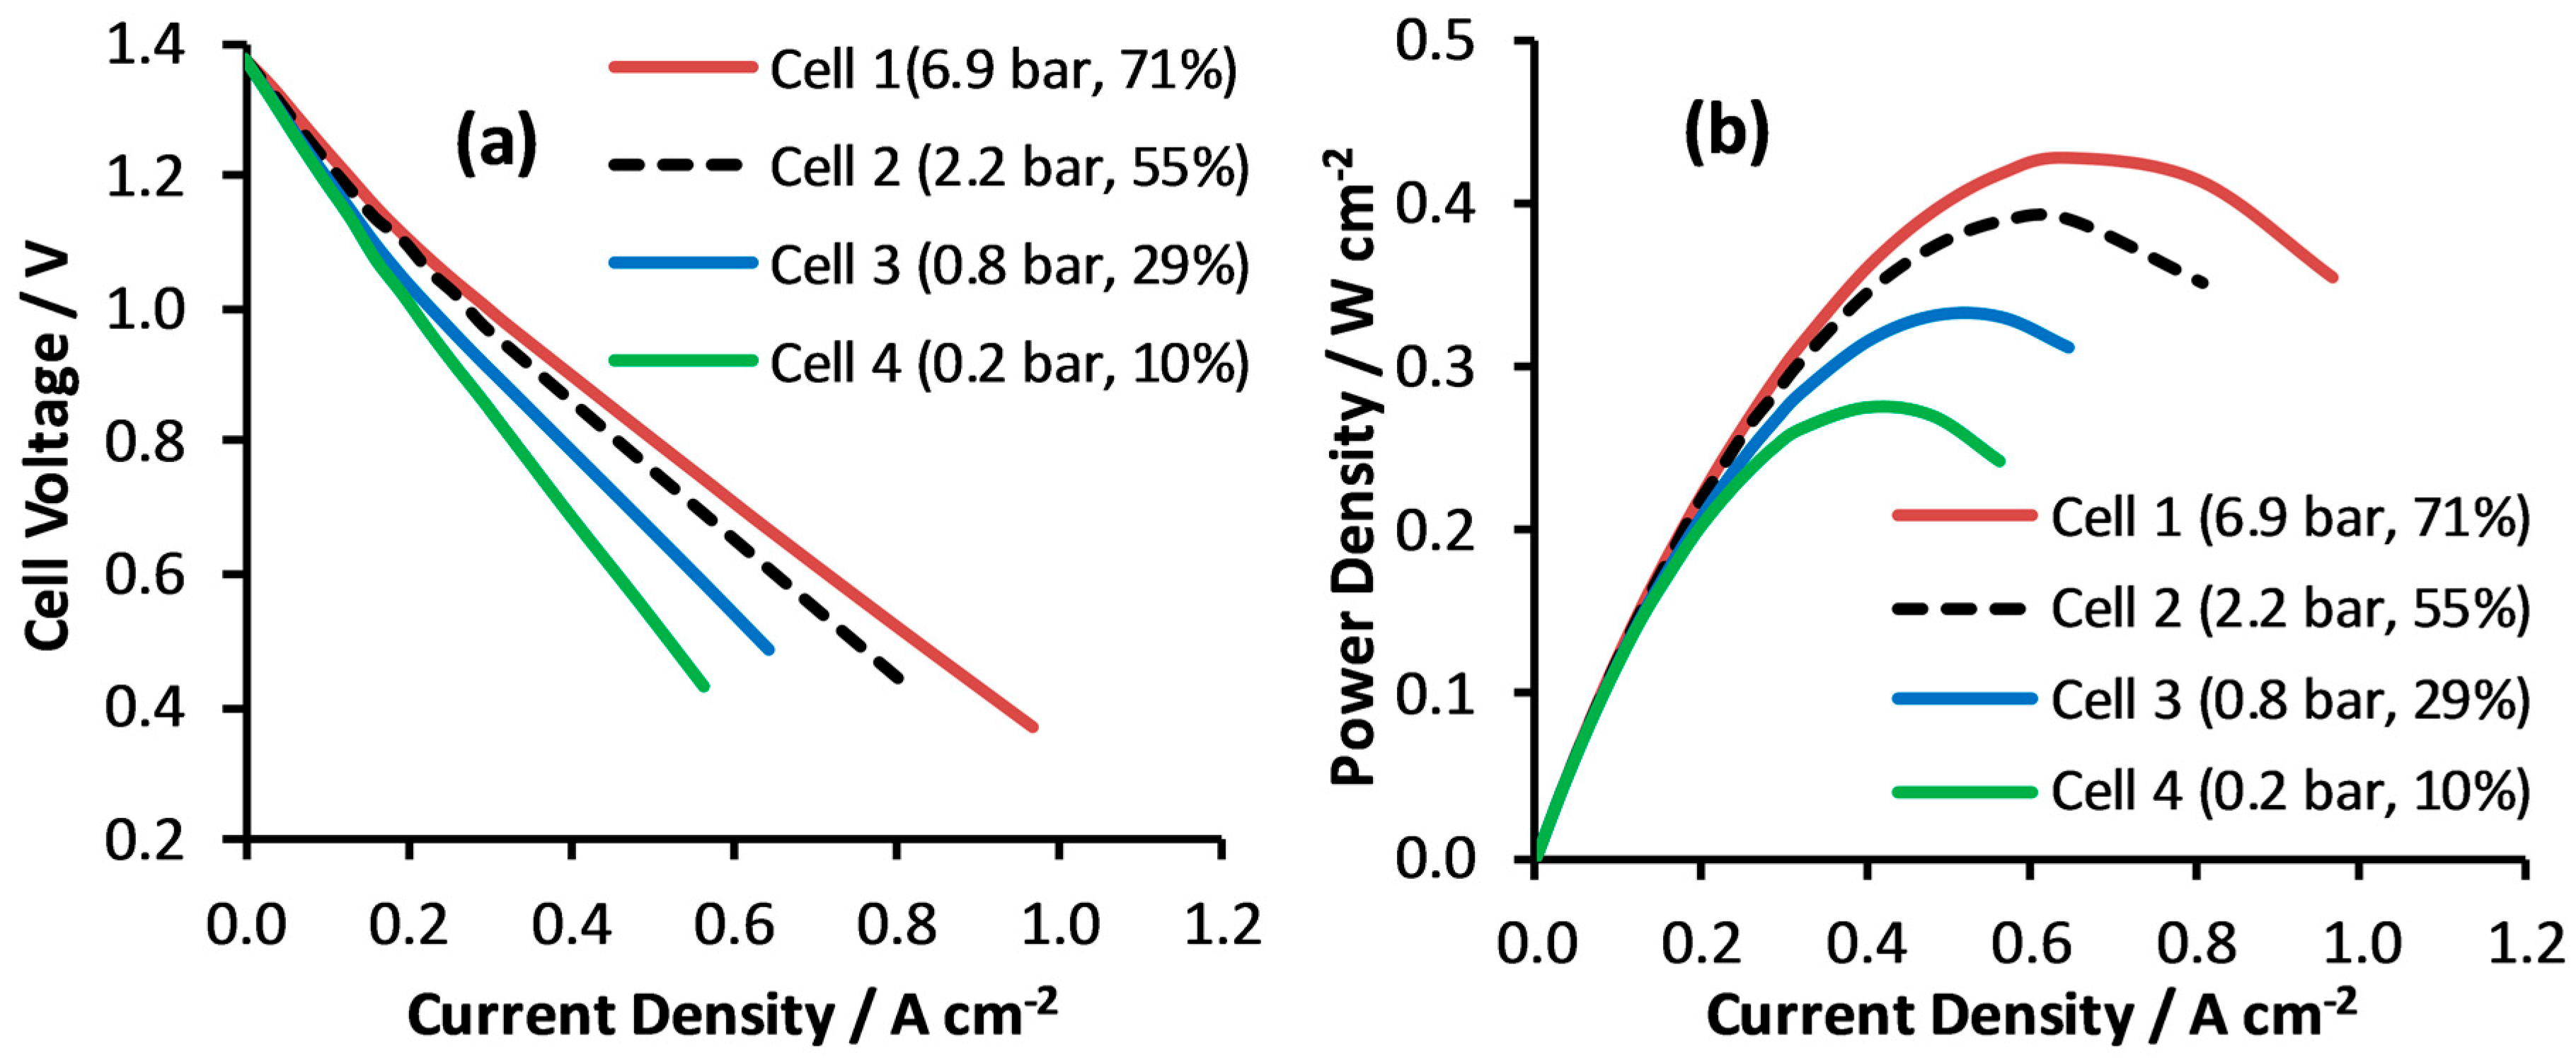
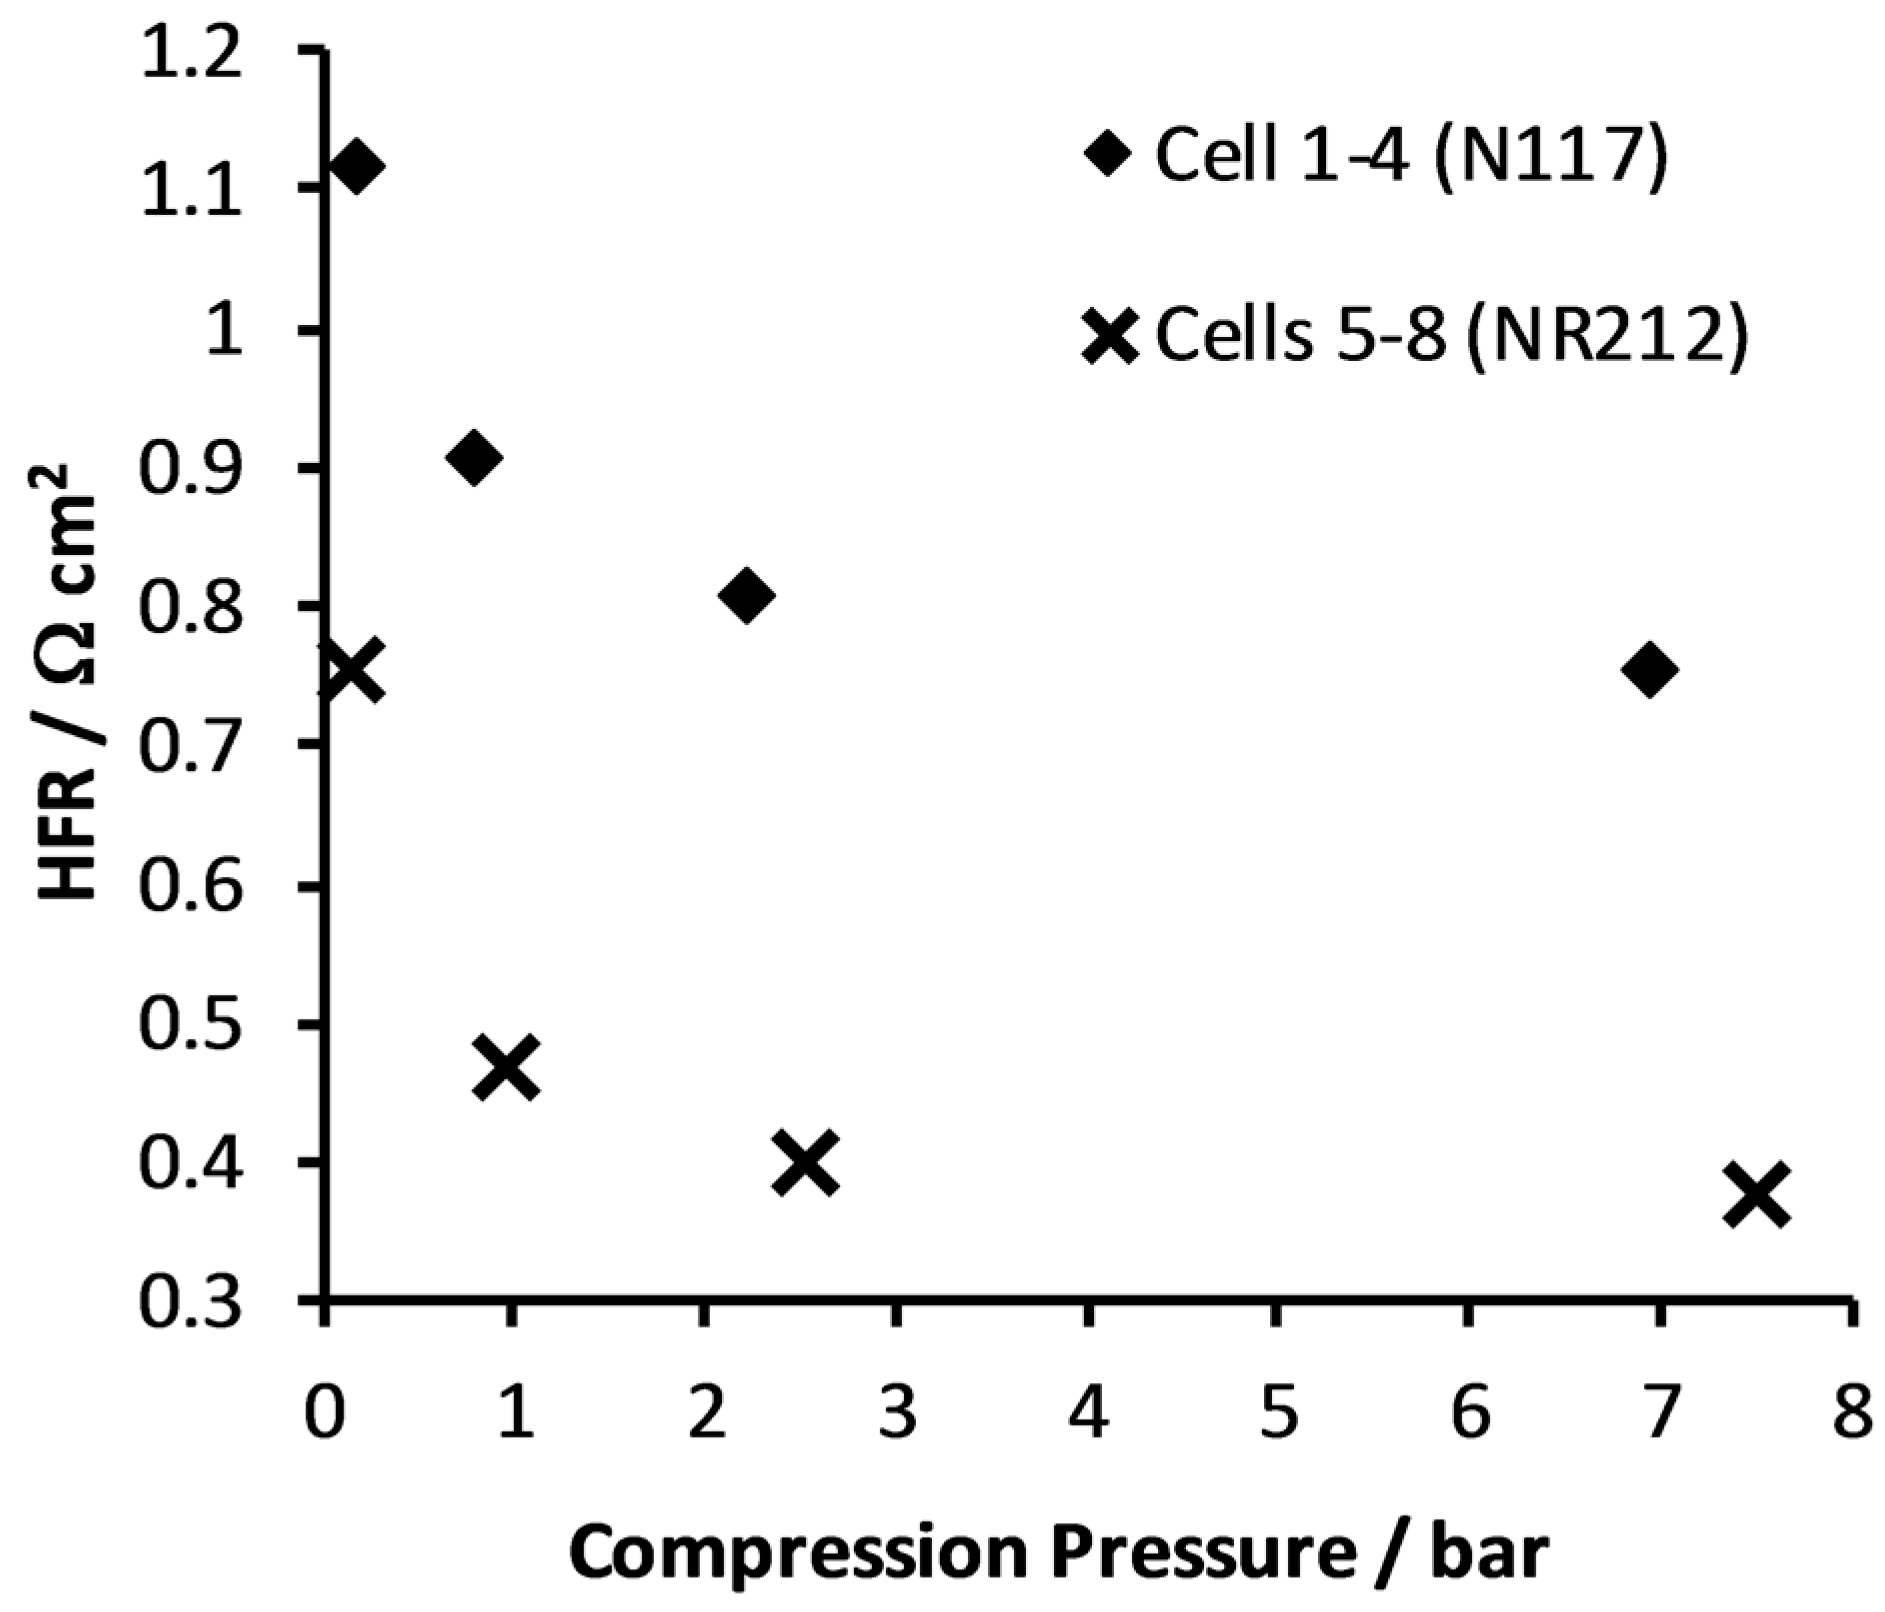
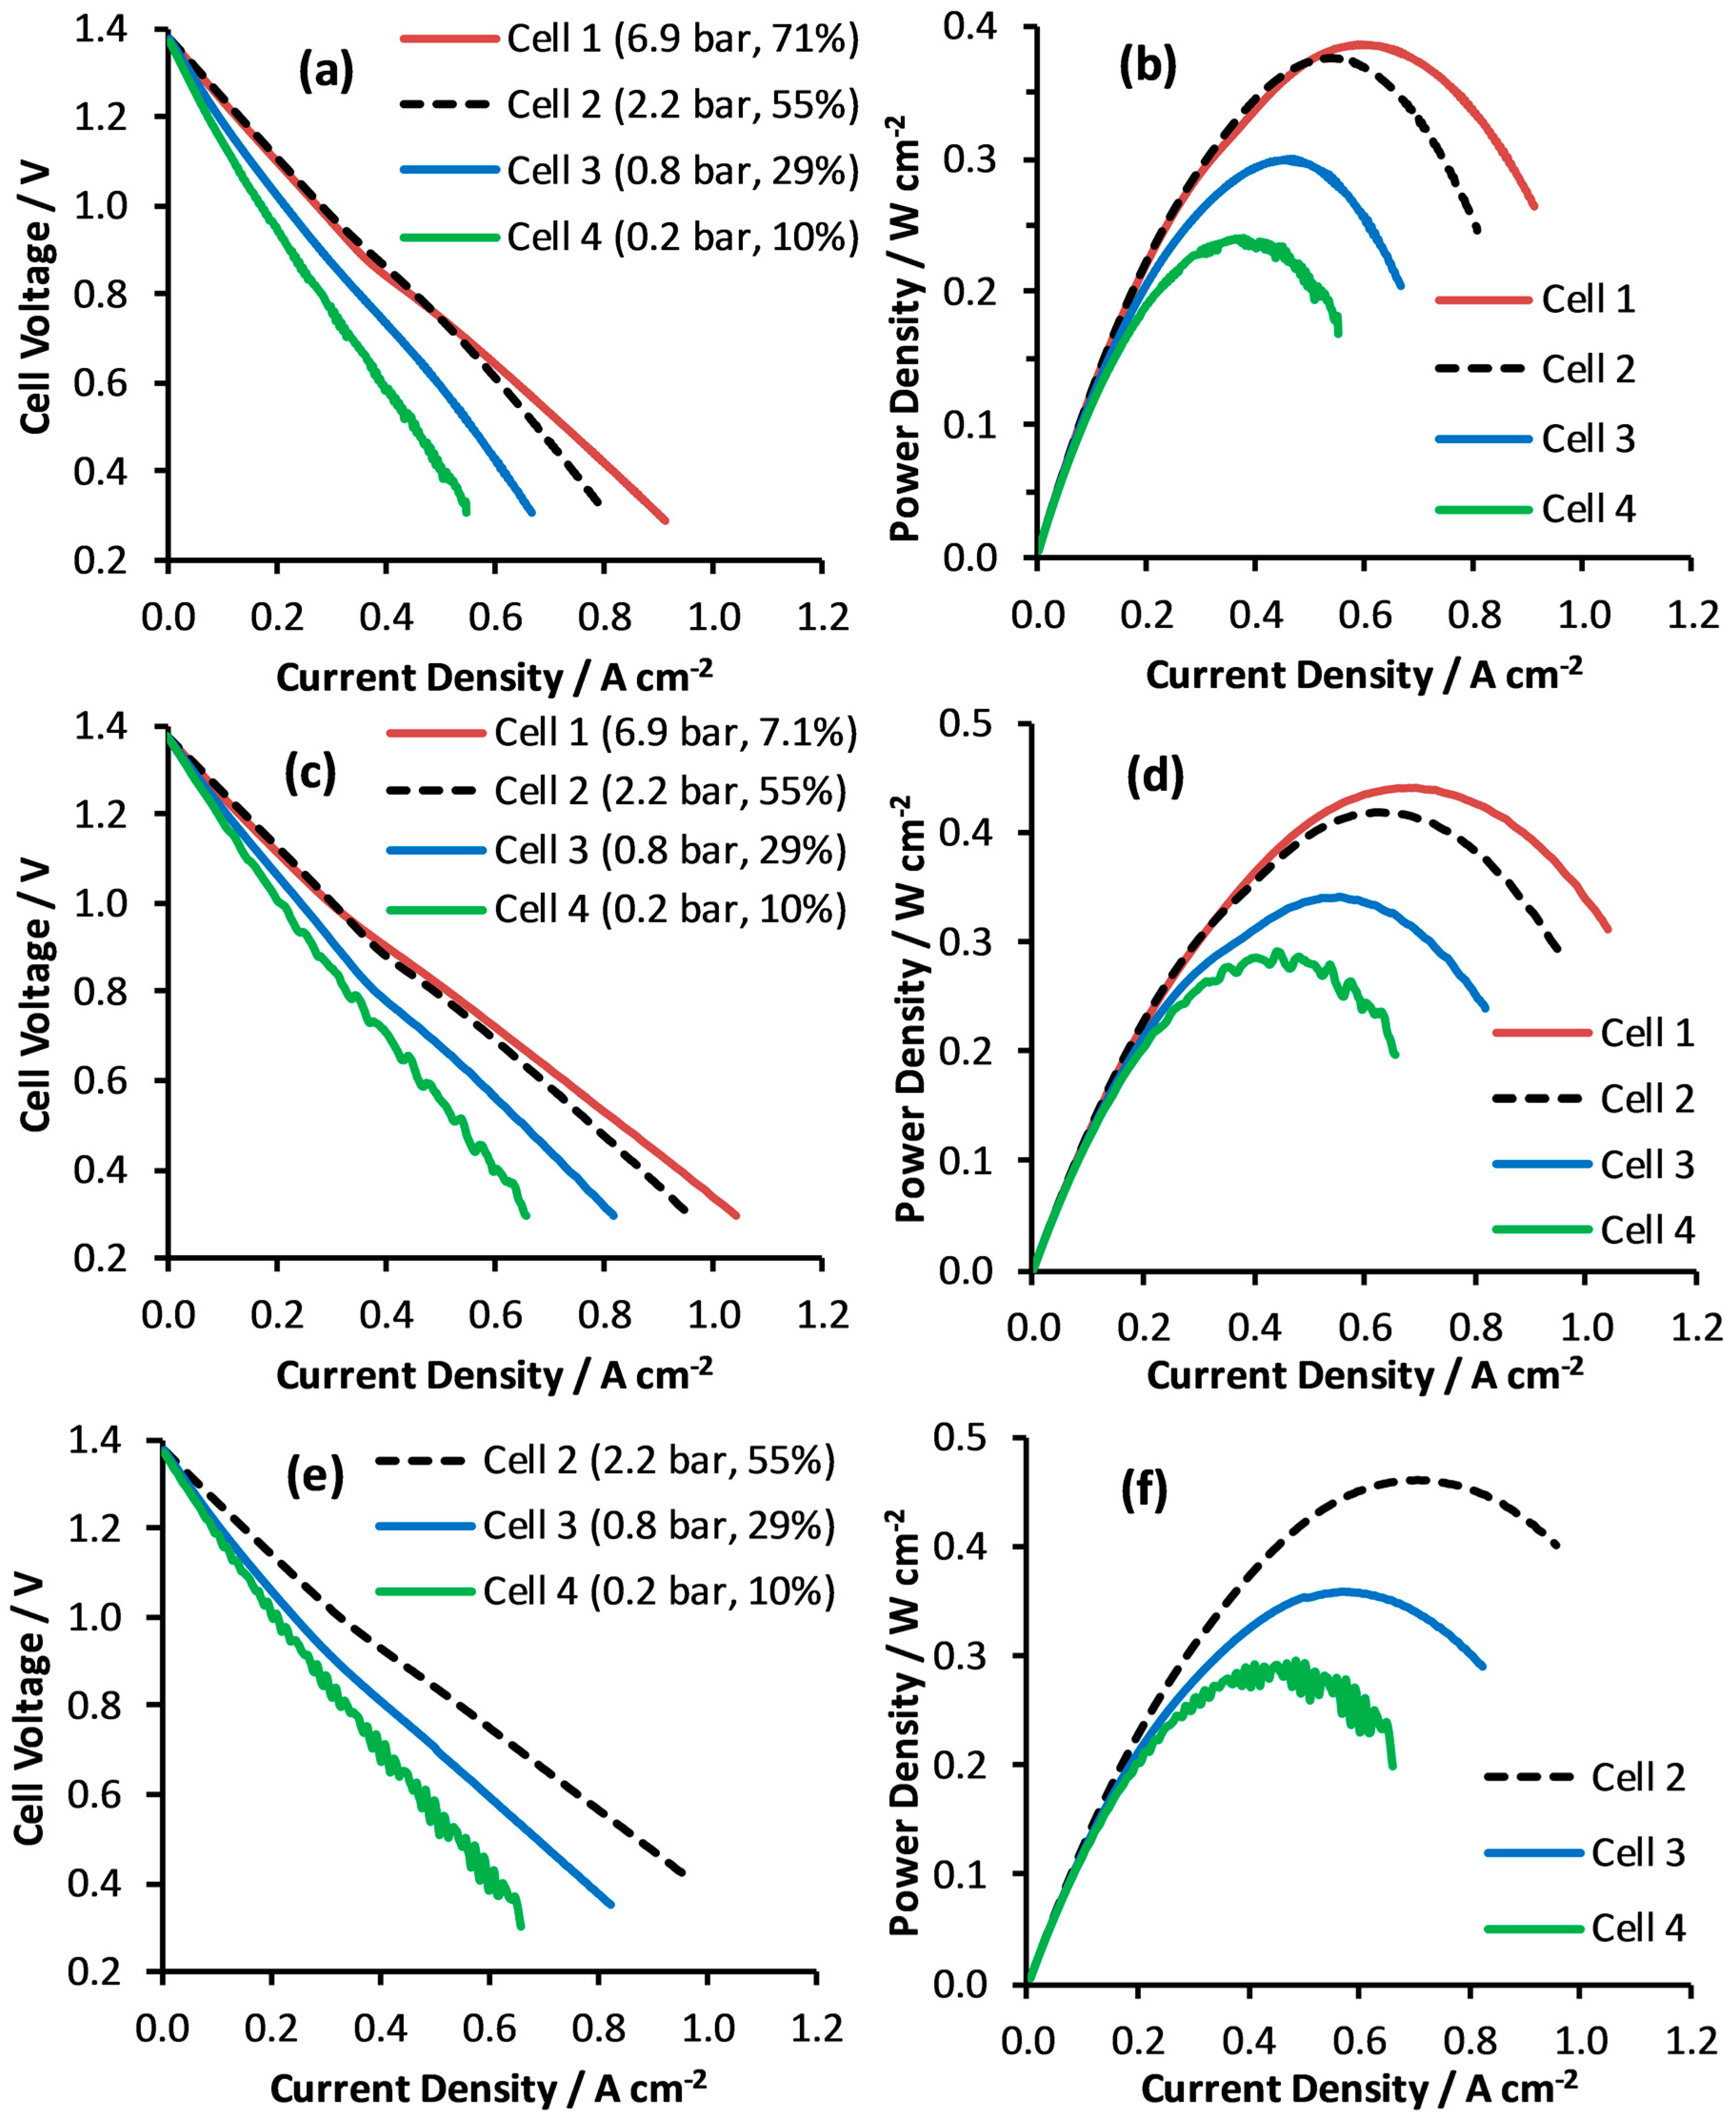
Initially, Nafion N117 (~0.2 mm thickness) was used as the membrane material. Figure 3 illustrates the effect of electrode compression on cell performance at a flow rate of 100 mL min−1, corresponding to 3.2 mL min−1 per cm2 of electrode area (31 cm2 cell active area). Similar performance results were observed at different flow rates (50 and 200 mL min−1) and are given in Appendix A. Figure 3a illustrates the steady state current density-voltage curves, with the corresponding power density-voltage curves given in Figure 3b. At current densities below 0.2 cm2, there is little difference between the four cells, the voltage drops and power densities are almost identical. However, as the current density increases, the reduced ohmic resistance associated with cell compression pressure becomes apparent and the performance of the cells becomes well separated. Increasing the compression pressure on the electrode from 0.2 bar (Cell 4) to 6.9 bar (Cell 1) results in an increase in maximum power density from 276 to 429 mW cm−2 (a 55% increase). Figure 4 illustrates area specific high-frequency resistance (HFR) values for each cell operating at 0.4 A cm−2 (at 50% state of charge). As the cell compression pressure increases from its lowest value there is a steep drop in HFR followed by a more gradual decline, as expected from the ex-situ resistance measurements in Figure 1d. The difference in cell performance can be mostly explained by the changes in ohmic resistance. For example, from the discharge curves in Figure 3a, the respective cell voltage of Cells 1 and 4 at 0.4 A cm−2 is 0.90 and 0.69 V, with corresponding HFR values of 0.753 and 1.115 Ω cm2. At this current density, the voltage-drop associated with the HFR of cell 4 is 0.145 V greater than that for Cell 1, accounting for almost 70% of the difference in operating voltage. The remaining 30% is most likely caused by electrolyte velocity and surface area effects.
Table 2 compares the results from Cell 1 (sixth row) with those from high performance VRFBs in the literature. The discharge voltage efficiency, VEd in column 9 is defined as the cell discharge voltage at a given current density, Vd, divided by the open circuit voltage, OCV:
One of the best performing felt-VRFBs was reported by Chen et al., who achieved 311 mW cm−2 with a GFA5 electrode at a compression of 33% (Table 2, row 5) [20]. Despite the much lower relative flow rate, the peak power density of 429 mW cm−2 obtained with Cell 1 is noticeably higher (a 38% increase) than the result of Chen et al. Furthermore, the discharge voltage efficiency at 0.5 A cm−2 is almost 20% higher for Cell 1. Note that Cell 3 with an electrode compression of 29%, has a maximum power density (331 mW cm−2) very similar to that of Chen et al. (311 mW cm−2), which suggests cell compression pressure is a key factor in the difference between Chen’s peak power of 311 mW cm−2 and the 429 mW cm−2 result from Cell 1.
Results from the first reported high-performance paper-VRFB are listed in the first row of Table 2. Although this cell has a similar discharge voltage efficiency to Cell 1, the maximum power density for the paper-VRFB is 557 mW cm−2. The key difference between the two cells appears to be their ohmic resistance, with HFR values of 0.753 Ω cm2 for Cell 1 vs. 0.50 Ω cm2 for the paper-VRFB of Aaron et al. [22]. The lower ohmic resistance of the paper-VRFB is most likely due to a combination of reduced contact resistance (i.e., a higher cell compression pressure) and a lower electrode resistance (the GDL 10AA electrode has a lower thickness and resistivity than the compressed GFD 4.6EA). Given that peak power for both cells occurred around 0.7 A cm−2, the difference in HFR values corresponds to 177 mV of extra voltage loss for Cell 1, which equates to an additional power density loss of 124 mW cm−2 (97% of the difference in peak power densities). Other factors contributing to the difference in performance could be variations in OCV and mass transport.
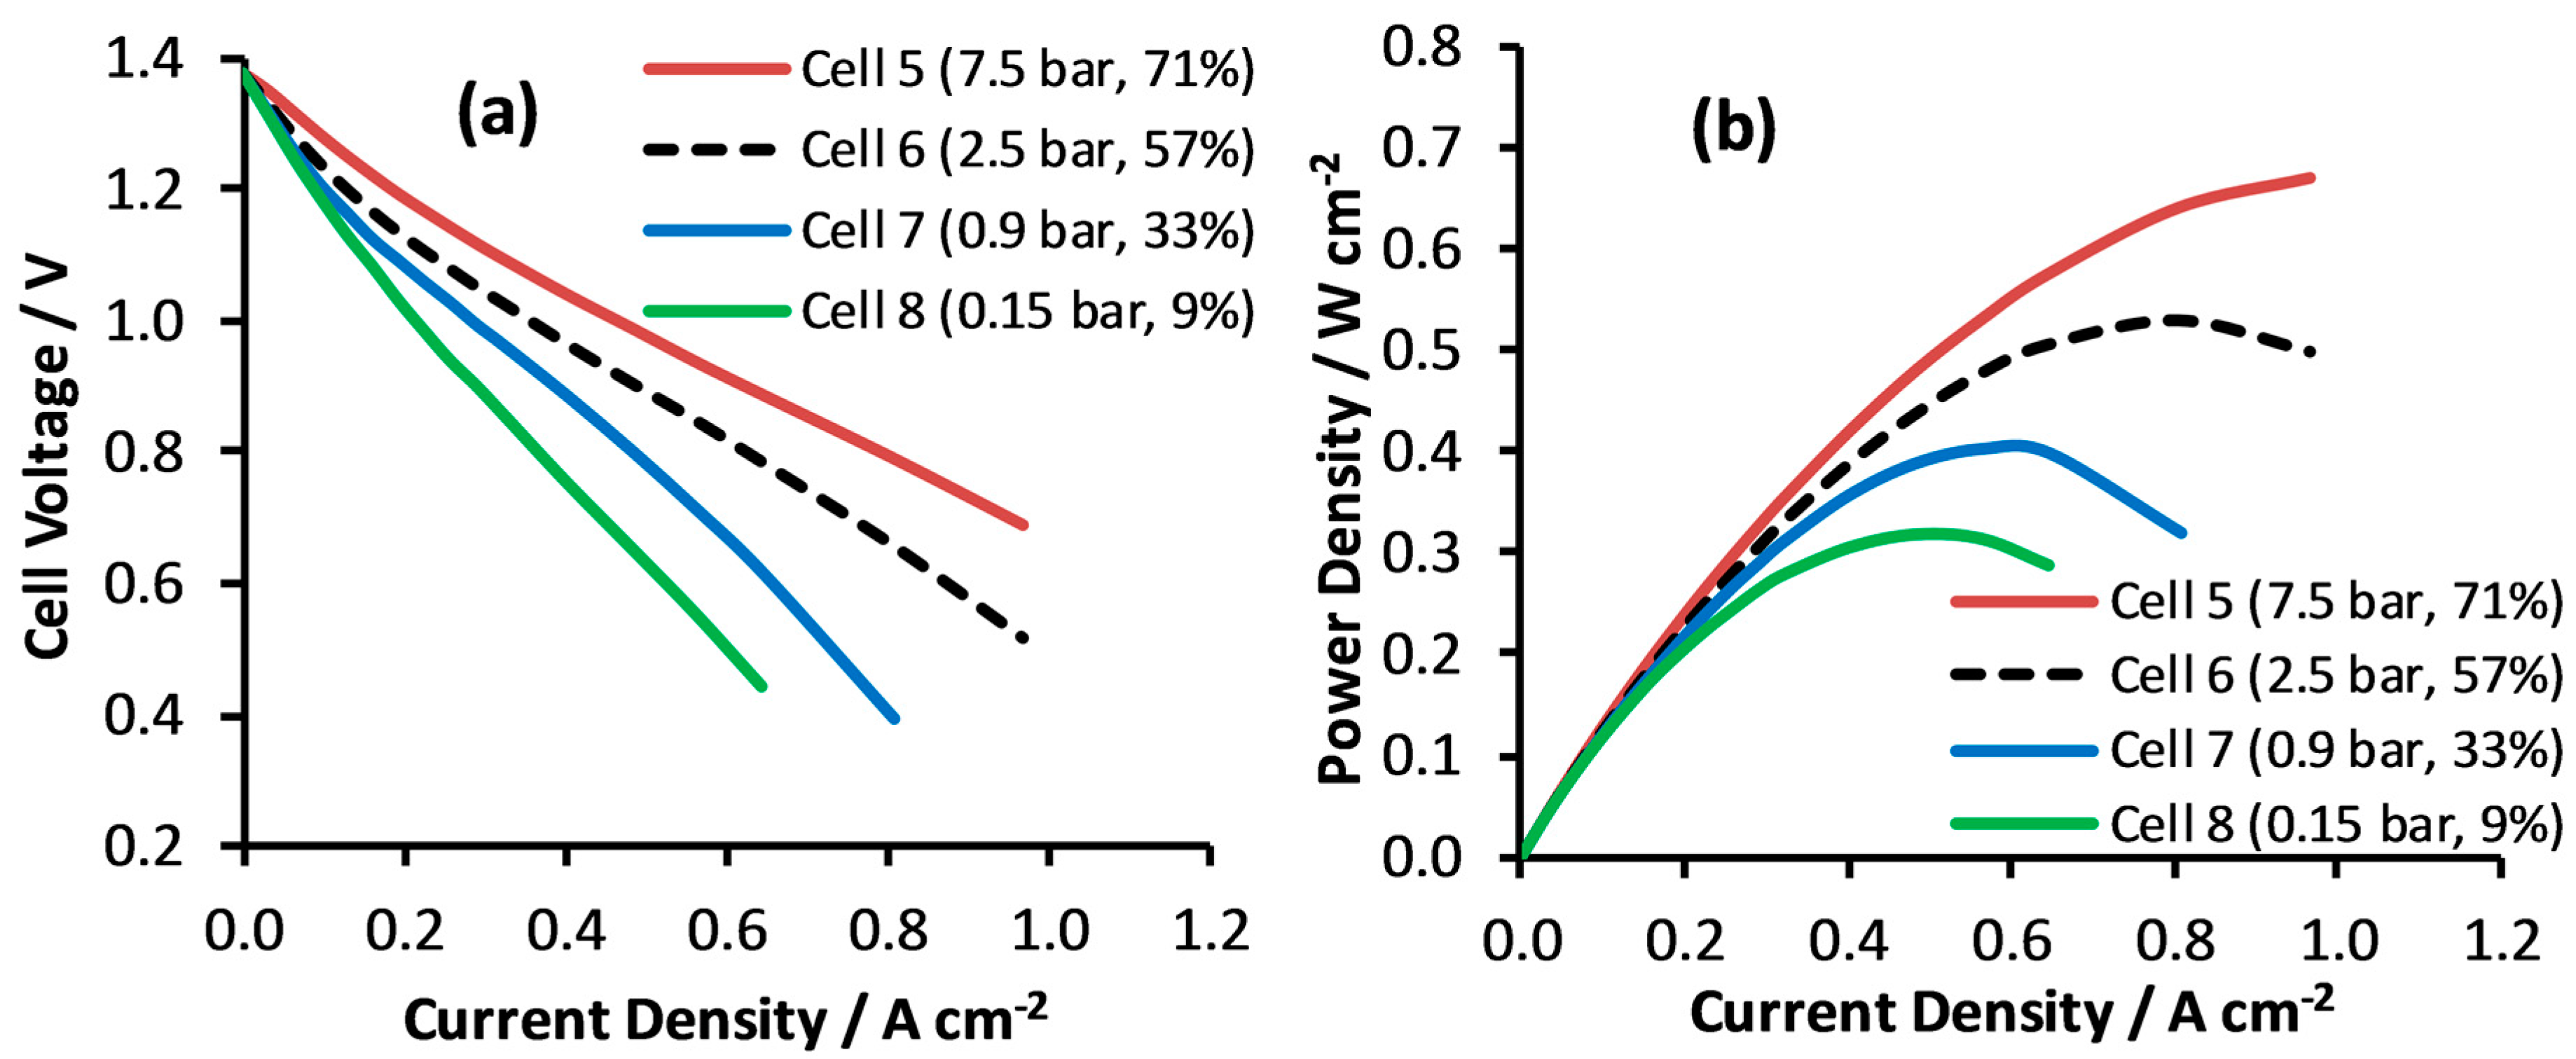
When optimizing the membrane for their high-performance paper-VRFB, Liu et al. found Nafion 212 gave the highest peak power density [23]. Consequently, cell builds 1–4 above were repeated using Nafion 212 as the membrane material. Figure 5 illustrates the discharge performance of Cells 5–8, with the corresponding HFR results given in Figure 4. The trends mimic those for Cells 1–4, with performance improving as the cell compression pressure is increased, mostly caused by changes in contact resistance and electrode resistance (i.e., ohmic resistance of the cells). However, the use of the thinner membrane results in a decrease in HFR of over 0.3 Ω cm2 for each cell build, leading to noticeably higher peak power densities than Cells 1–4. Key figures for the best performing felt-VRFB, Cell 5, are listed in the final row of Table 2. This cell represents the best high-performance felt-VFRB reported to date, with a peak power density of 669 mW cm−2 (obtained at 50% state of charge). Performance figures for the closest paper-VRFB equivalent are listed in the second row of Table 2, taken from a study into the effect of electrode treatment and membrane thickness by the Tennessee group [23]. As before, the paper-VRFB has a higher peak power density (767 vs. 669 mW cm−2) and lower HFR value (0.219 vs. 0.374 Ω cm2), although in this case the discharge voltage efficiencies at 0.5 A cm−2 are almost identical (0.76 for the paper-VRFB vs. 0.71 for Cell 5). Peak power for both cells occurred around 0.95 A cm−2. At this current density, the difference in HFR values corresponds to a 140 mW cm−2 additional power loss for Cell 5, which is more than the difference in peak power densities (98 mW cm−2). This suggests felt electrodes can match or possibly better the performance of paper electrodes if the compression pressures are high enough. However, Cell 5 is quite far from achieving the peak power density of 1290 mW cm−2 obtained with the Tennessee group’s best performing paper-VRFB, listed in row 3 of Table 2 [24]. This cell was the result of a thorough flow field optimization, which could also be possible for the felt-VRFBs in this study.
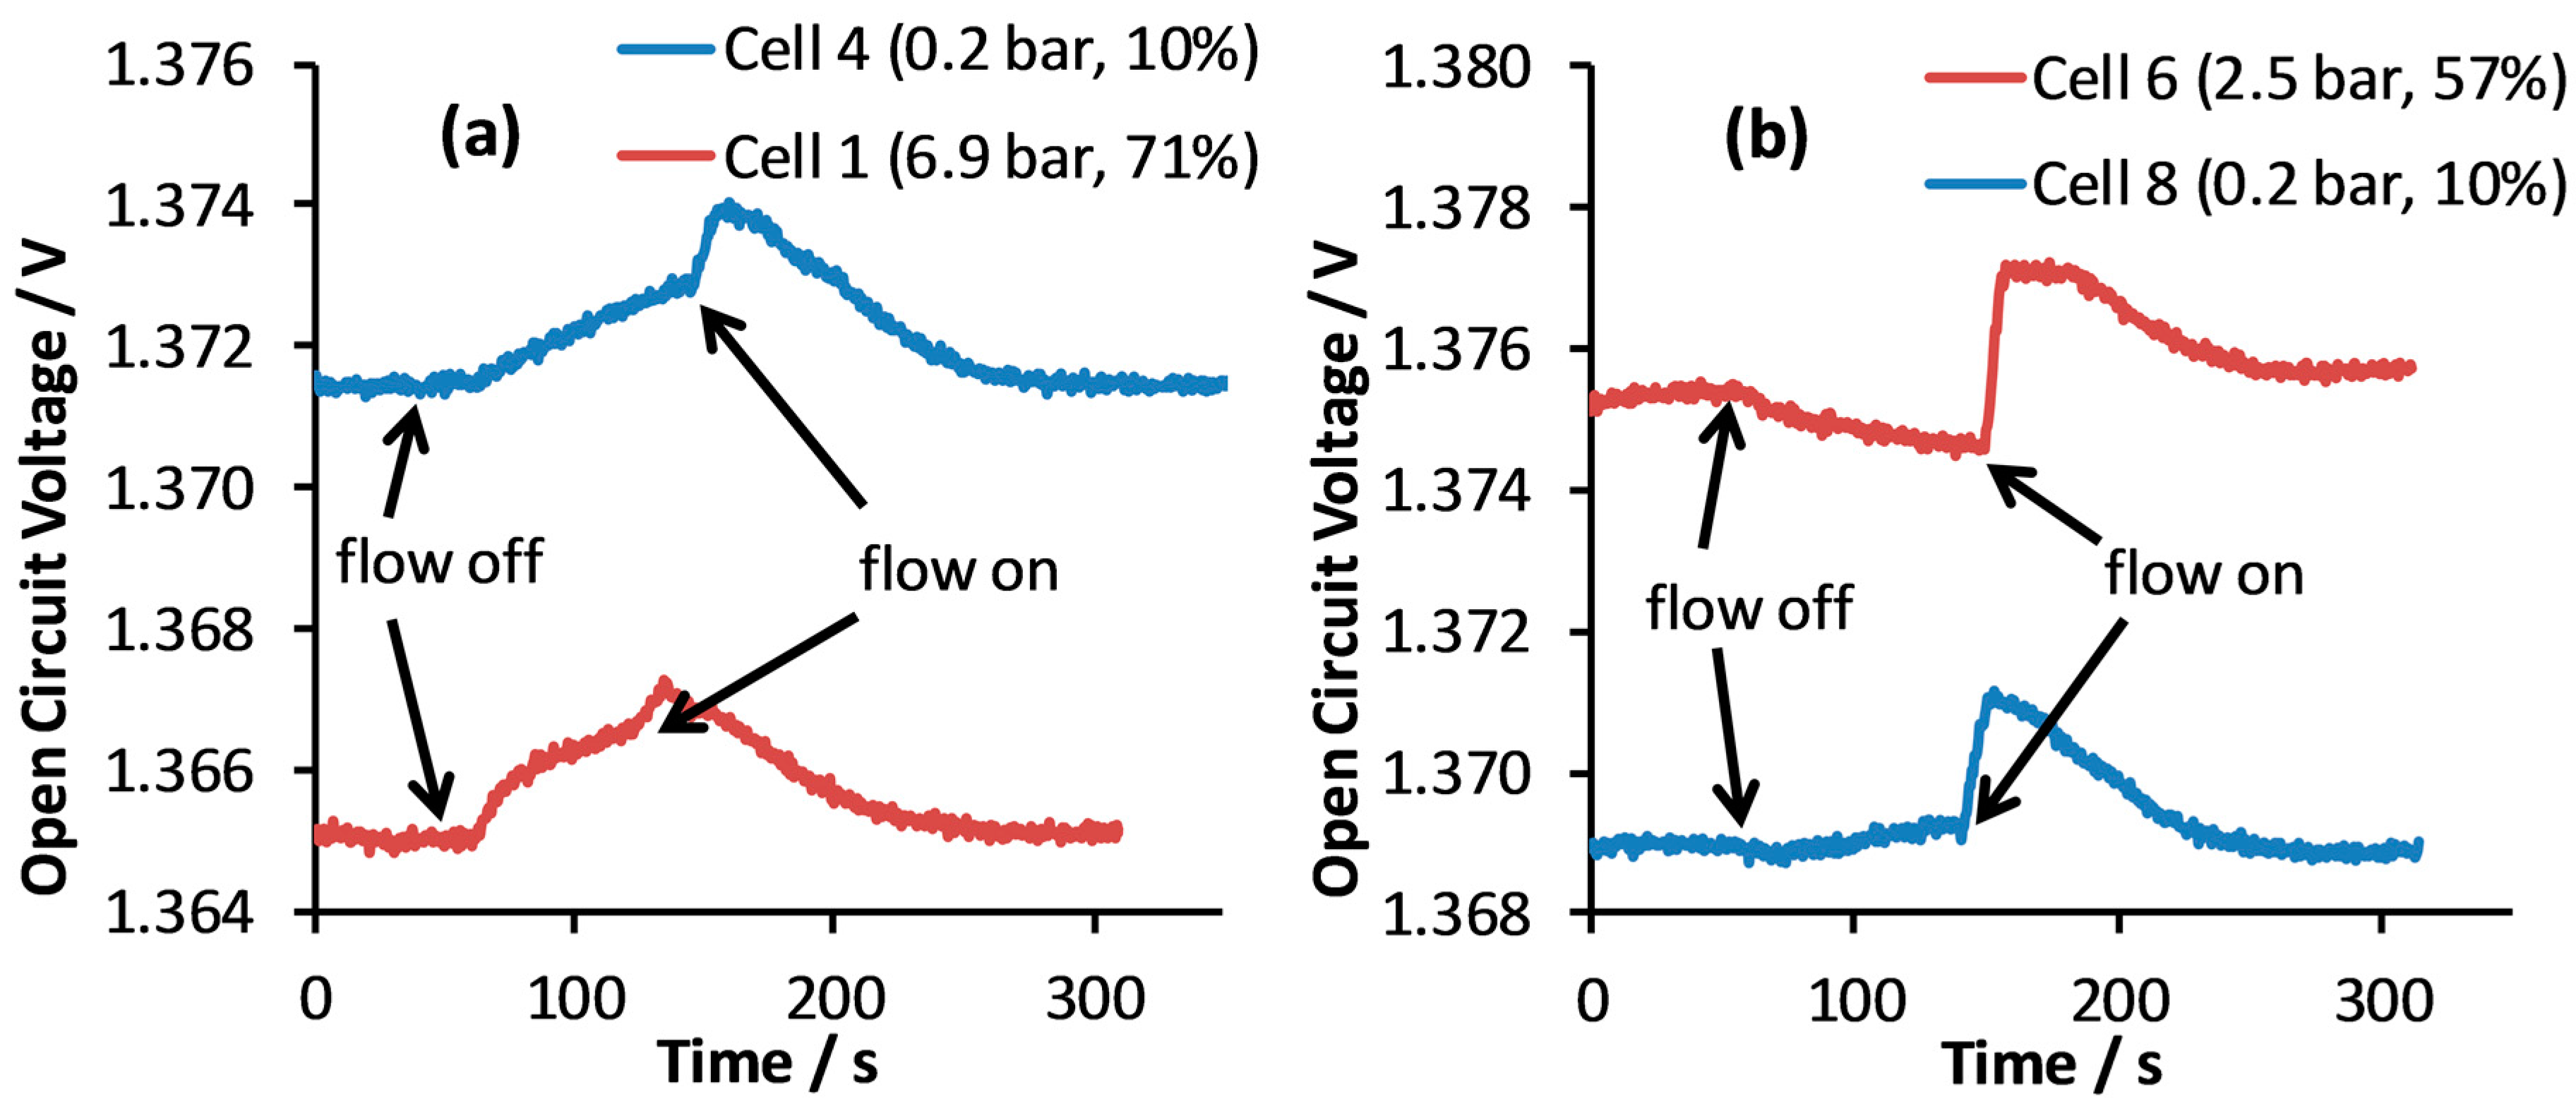
Unlike carbon papers, where the carbon fibers mostly lie in the xy plane, graphite felts have a 3-dimensional structure. Consequently, membrane punctures and short circuits are more likely when using graphite felt electrodes. Figure 6 illustrates the results of in-situ short circuit tests (recorded after 4 h of load testing) with Cells 1 and 4 (Nafion 117 membrane) and Cells 6 and 8 (Nafion 212 membrane). Throughout the test the cell is at open circuit and the voltage is recorded with time. Initially, the electrolytes are flowing, giving a steady open circuit voltage. The flow suddenly stops and the voltage is monitored. When negligible short circuits are present, the voltage gently increases, due to a decrease in cell and electrolyte temperature. This was the case for all the Nafion 117 cells. When electrolyte flow resumes, there is an initial increase in open circuit voltage, caused by the cooled electrolyte entering the cell, followed by a return to the initial value. For the Nafion 212 cells, Cells 5, 6 and 7 all showed signs of short circuits, with Figure 6b illustrating the results for Cell 6 (and Cell 8, which had negligible short circuits). When electrolyte flow stopped, there was a decrease in cell voltage, indicating depletion of reactants. Thus, the high-performance results of Cell 5 are tainted by poor durability, and membrane protection strategies must be employed if using thin membranes in combination with graphite felts at compression pressures greater than 1 bar.
During the cell performance experiments described above, each cell went through a large number of relatively small charge-discharge cycles around 50% state of charge (SOC), i.e., between 45% and 55% SOC. Upon completion of testing, there was a small difference in the anolyte (V2+/3+) and catholyte (V4+/5+) volumes (which were equal at the start of testing), although the total volume was approximately equal to the initial value. As commonly observed with VRFBs, there was net transfer of water from the anolyte to the catholyte, caused by the cross-over of V3+ and V2+ cations [35]. Interestingly, it appeared water transfer was highest for the cells with Nafion 212 membranes, suggesting vanadium cross-over rates increased when using thinner membranes. However, using this rudimentary method, it was not possible to determine if cell compression pressure affected the rate of vanadium cross-over (i.e., membrane permeability).
2.3. VRFB Cycling
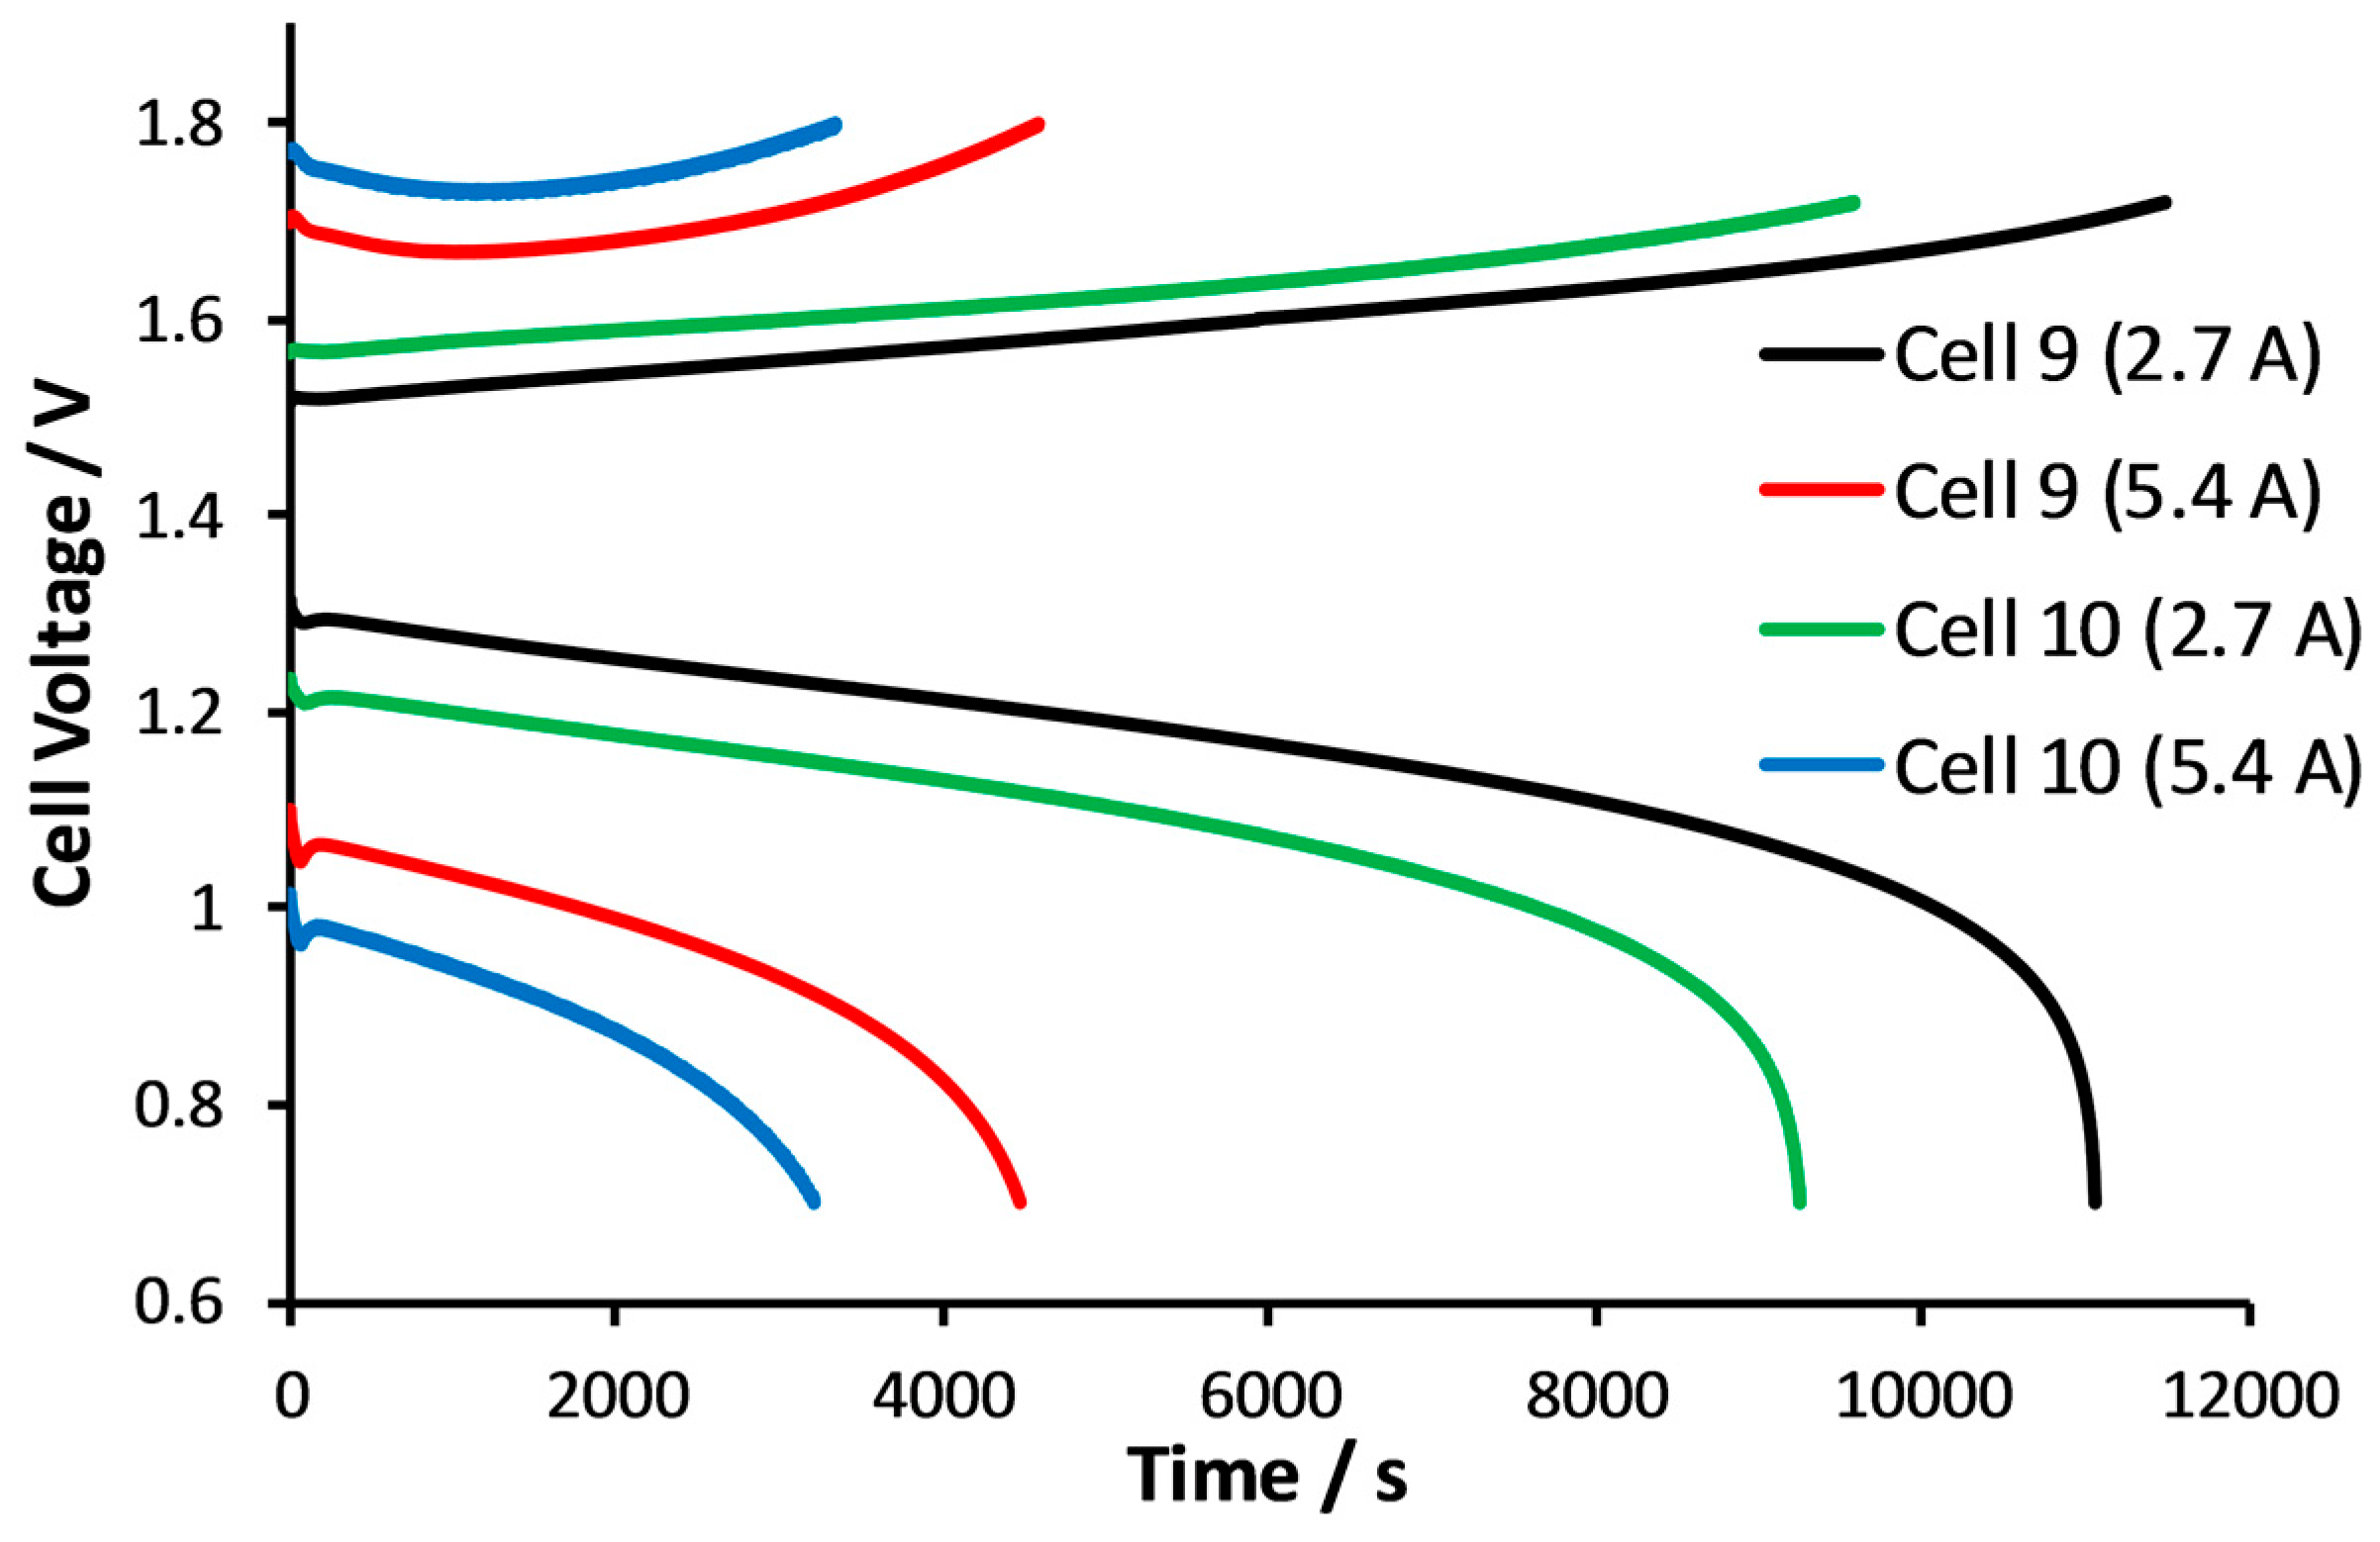
The effect of compression pressure on charge-discharge cycling was investigated using Cells 9 and 10, with 2.2 and 0.2 bar compression pressure on the active area, respectively (see Table 1 for cell details). Due to the membrane puncture issues associated with Nafion 212 membranes, these cells used Nafion 117 membranes. In addition, the highest cell compression pressure was avoided due to the requirement for a large pumping pressure over ~72 hours’ operation. Figure 7 illustrates typical charge-discharge curves for the two cells at 90 and 174 mA cm−2 (2.7 and 5.4 A), where the flow rate was 100 mL min−1. Although the performance is noticeably worse than the results in Figure 3 due to the large difference in operating temperature (see Section 3.3), the beneficial effect of increased compression pressure is clear. The voltage losses are smaller for the more compressed cell, which can also charge and discharge for longer within the voltage limits, utilizing more of the vanadium electrolyte.
The charge-discharge cycles were analyzed to determine current efficiency (CE), voltage efficiency (VE) and energy efficiency (EE) given by Equations (5)–(7) [17], where Qd is the charge passed during discharge, Qc is the charge passed during charge, Pd is the discharge power and Pc is the charging power. Table 3 lists the results for Cells 9 and 10 at each current density, i. The vanadium electrolyte utilization (U) is also given, defined as the percentage of the electrolyte’s total capacity used in discharge. Electrode compression appears to have a negligible effect on current efficiency, in agreement with the results of Brown et al. [17]. For a given load, the cell with the higher compression delivers the best voltage and energy efficiency with more of the battery’s capacity accessed. However, the results are considerably less impressive than the recently reported record-breaking performance obtained by Zhou et al., who used chemically activated GDL 10AA electrodes to achieve EE values of 82–88% at current densities of 200–400 mA cm−2 [25].
3. Materials and Methods
3.1. Cell Components
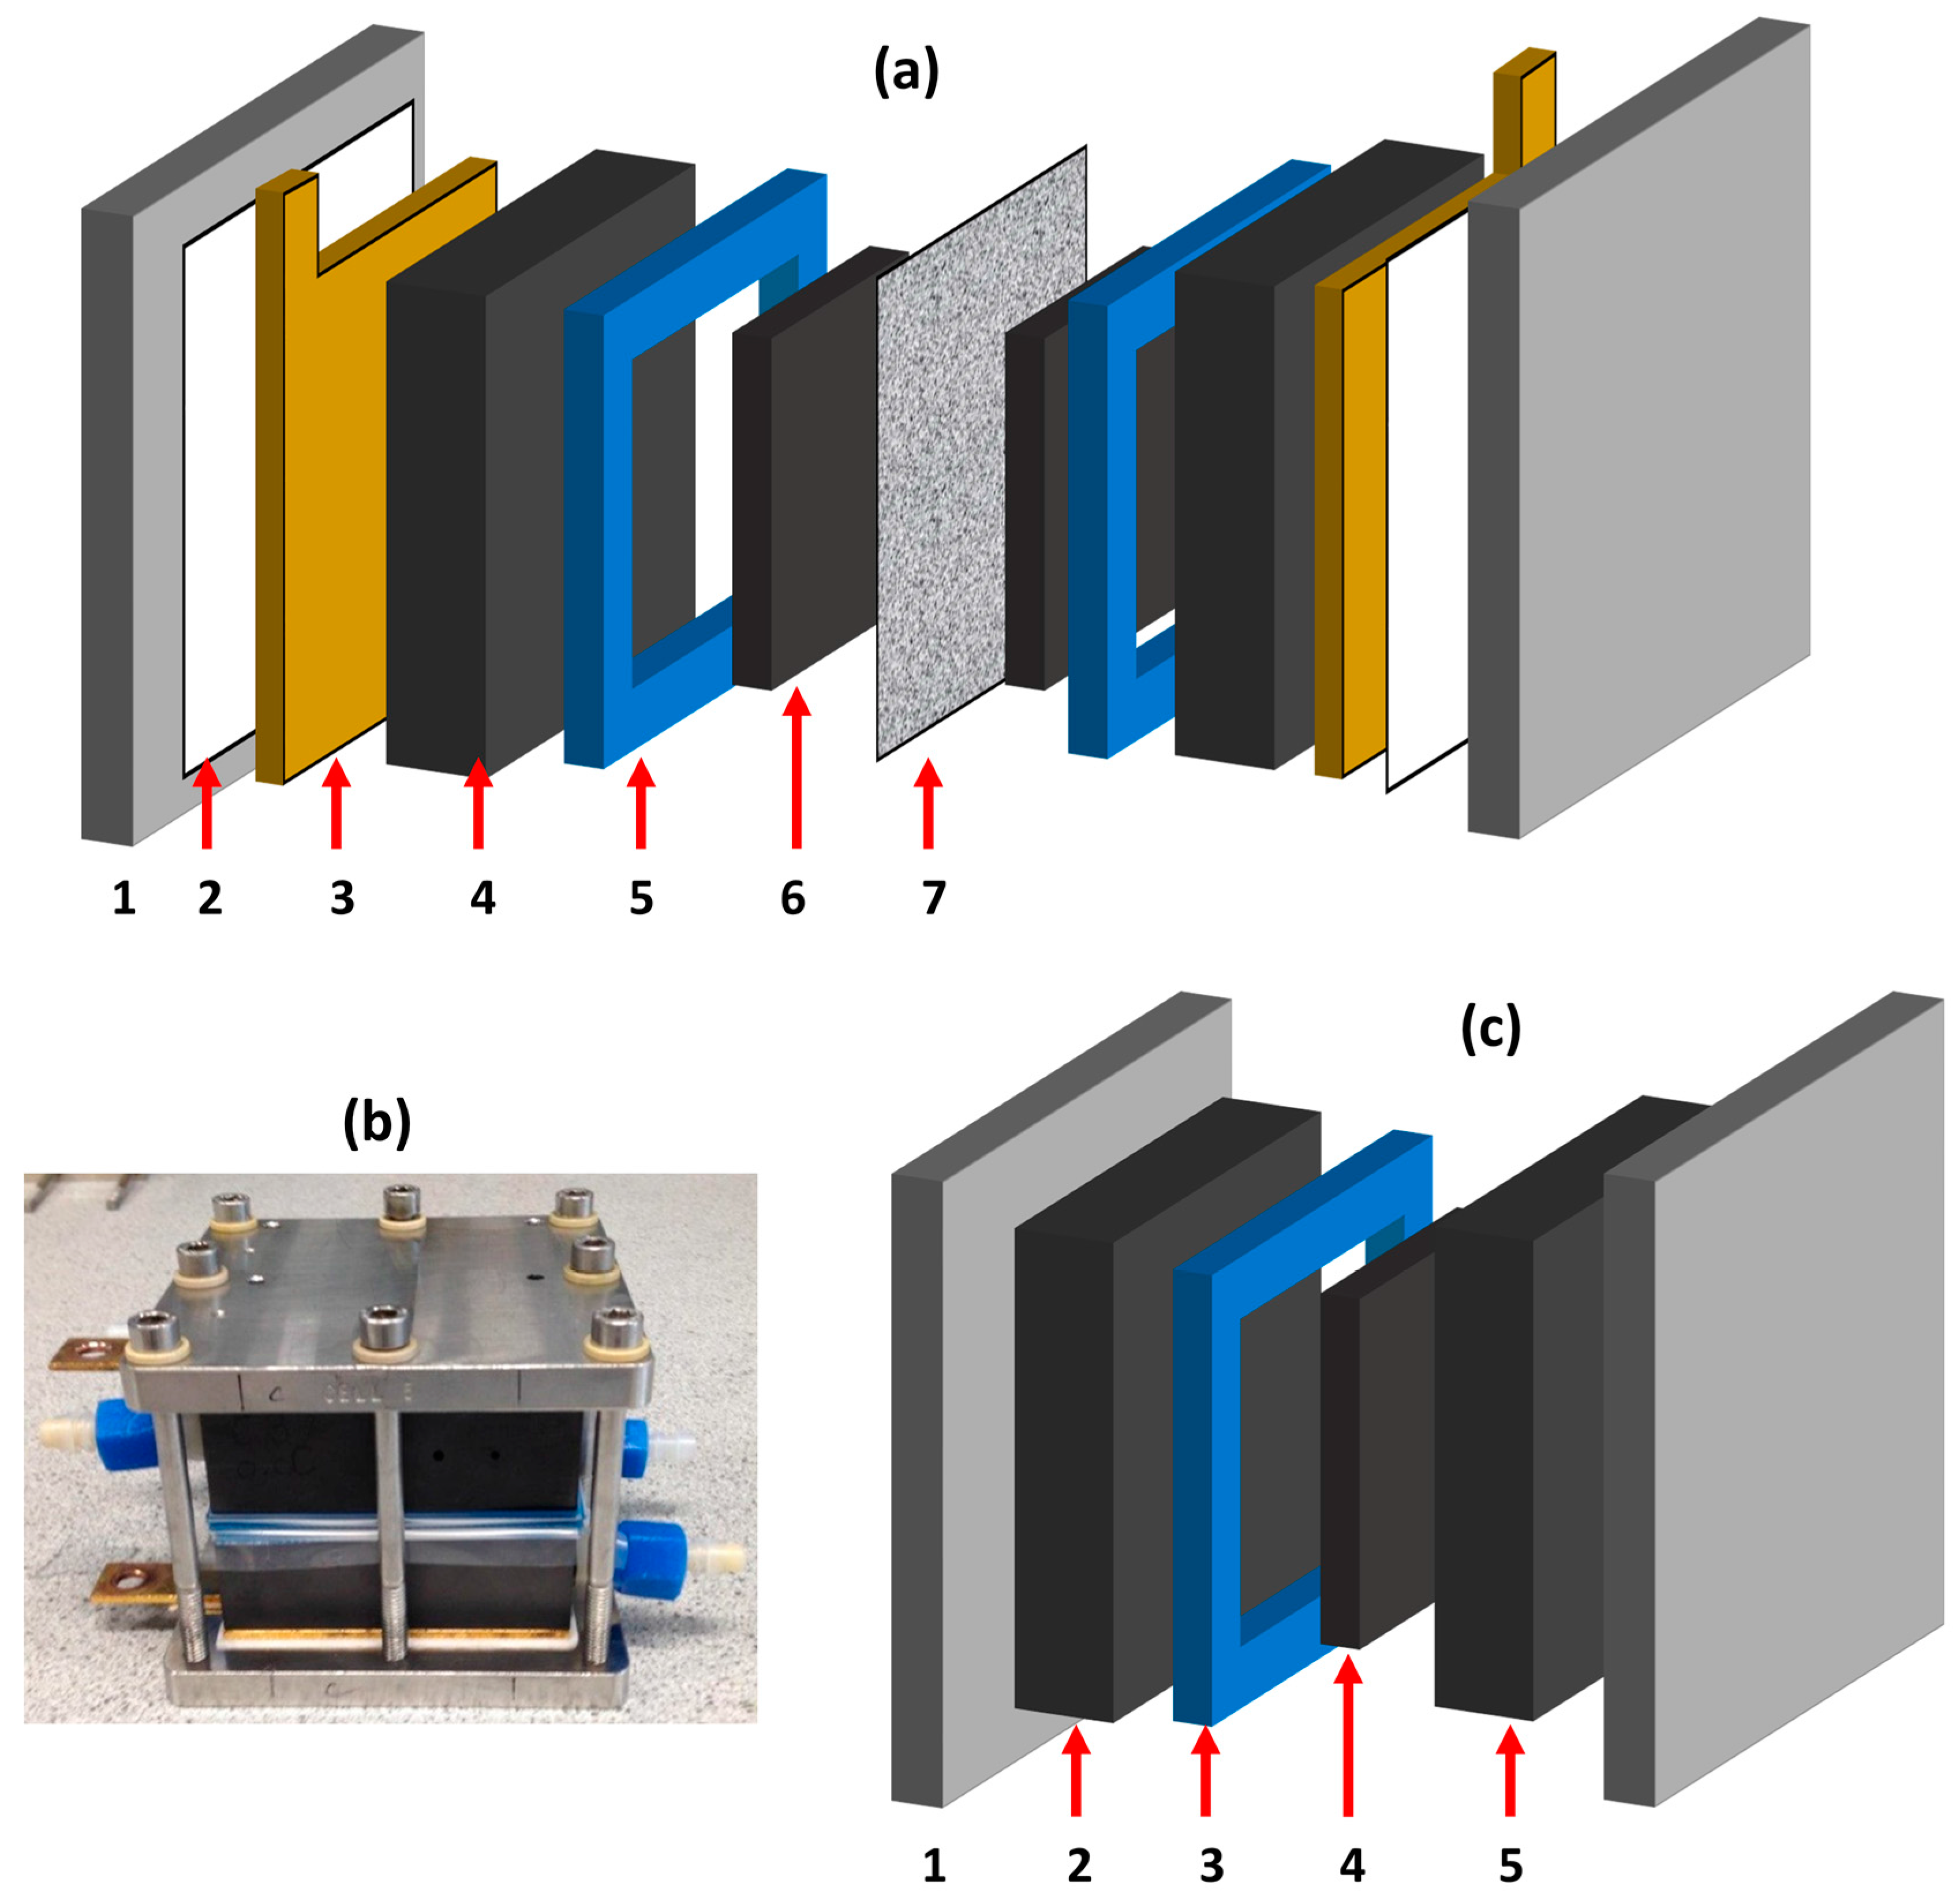
An expanded cell component diagram is given in Figure 8a with an assembled cell shown in Figure 8b. A 5 cm wide by 6.2 cm long piece section of untreated GFD 4.6EA (SGL Group, Wiesbaden, Germany) was used as the electrode material for both the anode and cathode. The membrane used was either Nafion N117 or NR212 (IonPower, EU online store). Before assembling the cell, the membrane was soaked in ultrapure water over night, then transferred to 1 M H2SO4 for 1 h. The electrode and membrane were sandwiched between two graphite blocks (JP945, Mersen, Portslade, UK) and multiple polyolefin gaskets (Freudenberg, Weinheim, Germany). One inlet and one outlet channel were machined into the graphite blocks and the electrode well depth was defined by the number of gaskets used. This resulted in a “flow-through” arrangement (with no flow fields). The polytetrafluoroethylene sheets (0.3 mm) provided an insulating layer between the current collectors (adjacent to the graphite blocks) and stainless steel endplates. The cell was compressed together using eight M6 bolts positioned evenly around the square end plates. The cell active area was 31 cm2.
After assembling a cell, the width of the components between the end plates was measured using Vernier calipers. Once testing had finished, the cell was disassembled, then reassembled without the gaskets, membrane, and electrodes, and the width of the components between the end plates was measured again. Using these two measurements, it was possible to estimate the thickness of the electrodes in the cell, and hence, deduce the electrode compression.
3.2. Electrolyte Solution
The electrolyte solution was provided by C-Tech Innovation (Chester, UK) and consisted of 1.6 M vanadium in 4 M H2SO4, where the average oxidation state of vanadium was +3.5 (i.e., 0.8 M vanadium(IV) and 0.8 M vanadium(III)). For performance tests, 400 mL of electrolyte was used for both the anolyte and catholyte. All discharge polarization curves were obtained using an initial open circuit voltage of 1.38 V, corresponding to 50% state of charge. Although spent electrolyte returned to the feeder tanks, the effect on the state of charge was minimal, with the decrease in open circuit voltage no more than 8 mV per test. After each discharge test, the system was charged back to 50% SOC. For charge/discharge cycles, the volume of anolyte and catholyte was 230 mL.
3.3. Cell Testing
The flow battery test rig was purchased from C-Tech Innovation (UK) and is shown in Appendix B. Peristaltic pumps (Cole Parmer, St. Neots, UK) were used to pump the electrolytes at flow rates in the range 50–200 mL min−1, corresponding to 1.6–6.5 mL min−1 per cm2 of electrode area. Nalgene (Cole Parmer) and PFA (Swagelok, Manchester, UK) tubing was used to transport the electrolyte between the feeder tanks and the cell. The feeder tanks were continuously stirred (via a magnetic stirrer) and kept under nitrogen at all times (to prevent the oxidation of vanadium species). The temperature of the electrolyte in the feeder tanks was maintained at 45 ± 1 °C, which resulted in a cell temperature of 37 ± 1 °C.
All electrochemical measurements were made using an HCP 803 potentiostat (Bio-Logic, Seyssinet-Pariset, France), with current cables connected to the current collectors and voltage sense cables connected to the graphite blocks of the cell. Polarization curves were obtained in both transient and steady-state modes, with little difference observed between the two. For transient discharge, the cell current was increased at a rate of 200 mA s−1 until the cell voltage decreased to 0.3 V. For steady-state measurements, each discharge current step lasted 1 min and was proceeded by a charge current step of the same coulombic value (to maintain a 50% SOC). Electrochemical impedance was performed at a discharge current of 12.5 A (corresponding to 400 mA cm−2) with a frequency range of 50 kHz to 0.1 Hz. For selected cells, charge-discharge cycles were performed three times at 2.7, 5.4, and 13.5 A (corresponding to current densities of 90, 174 and 435 mA cm−2). To avoid evaporative losses over the 2–3-day test, these experiments were conducted at room temperature (18 ± 1 °C). In-situ short circuit tests were performed by monitoring the change in the cell open circuit voltage when stopping and starting electrolyte flow.
3.4. Ex-Situ Testing
Electrode compression/resistance tests were performed using a bespoke compression rig shown in the Appendix B. A 62 cm × 50 cm piece of electrode material was sandwiched between two gold-coated steel plates and inserted between a 100 mm diameter piston and a fixed top plate. The air pressure inside the piston was gradually increased and a depth gauge recorded the change in thickness. At the same time, 2.7 A was passed through the electrode material and the voltage drop across the gold-coated steel plates was recorded. This produced a data set of applied pressure vs. thickness vs. electrical resistance. The tests were repeated with several samples of GDL 10AA (SGL Group, Wiesbaden, Germany), GFD 4.6EA and cut-down GFD 4.6EA. The latter samples were produced by slicing sections of GFD4.6EA using a skin graft blade, approximately halving the thickness of the felt. All samples were weighed on a 4-point mass balance prior to compression testing.
A series of flow tests were performed with half-cells to determine the effect of cell compression on pumping pressure. For these tests the cell assembly in Figure 8c was used. A 62 cm × 50 cm piece of GFD 4.6EA was sandwiched between two graphite blocks (JP945, Mersen, Portslade, UK), one with flow inlet and outlet channels, the other flat (resulting in the same flow-through arrangement in the full cells above). The number of polyolefin gaskets (Freudenberg, Weinheim, Germany) determined the electrode well depth and felt compression. Stainless steel end plates and eight M6 bolts were used to clamp the assembly together and a depth gauge recorded the thickness of the cell (from which the felt thickness was determined). The half-cell was then placed in a bespoke flow rig. A gear pump (Micropump, Vancouver, WA, USA) supplied deionized water (20 ± 1 °C) at different flow rates through the half cell. Pressure sensors at the cell inlet and outlet allowed the measurement of the pressure drop across the electrode for a given flow rate.
4. Conclusions
This work has demonstrated that VRFBs made with felt electrodes can perform at similar levels to the paper electrode VRFBs that have recently dominated research and development in high-performance cells. The key issue is the cell ohmic resistance. At high cell compression pressures (7.5 bar) using a relatively thin membrane (Nafion 212), an area specific HFR of 0.374 Ω cm2 was recorded, which is the lowest value reported to date for felt-VRFBs and is close to the HFRs obtained in high-performance paper-VRFBs. Consequently, a new record peak power density of 669 mW cm−2 was achieved, which is almost double that of the previous best felt-VRFB reported in the literature.
Although the performance of felt-VRFBs can be further improved via flow field optimization and modifications to the electrode surface chemistry, a key issue is durability. Felt electrodes appear to be more prone to membrane punctures (and cell short circuits) than paper electrodes. Consequently, a membrane protection strategy is required if further work on high-performance felt-VRFBs is to continue.
Acknowledgments
This study was partly funded by the HEFCE (Higher Education Funding Council for England) Innovation Fund. The authors thank John Collins, Andy Leck, David Hall and John McCarthy (all C-Tech Innovation, UK) for supplying vanadium electrolyte and for their technical support. The authors also thank David Ward (University of Chester), Natasha Gunn (University of Chester), Matthew Herbert (University of Chester) and Joshua Denne (Advanced Propulsion Centre, UK) for their help and advice.
Author Contributions
Trevor J. Davies conceived and designed the experiments; Trevor J. Davies and Joseph J. Tummino performed the experiments; Trevor J. Davies and Joseph J. Tummino analyzed the data; Trevor J. Davies wrote the paper.
Conflicts of Interest
The authors declare no conflict of interest.
Appendix A
Figure A1 illustrates the transient performance of Cells 1–4 (Nafion 117 membranes) at flow rates of 50, 100 and 200 mL min−1 (corresponding to 1.6, 3.2 and 6.5 mL min−1 per cm2 of active area). Note, it was not possible to use Cell 1 at 200 mL min−1 as the required pumping pressure exceeded the maximum safe working value of the rig. Increasing flow rate improves performance for all cells, as expected, with the peak power density achieved with Cell 2 increasing from 375 to 460 mW cm−2 over the range of flow rates.
Appendix B
A photograph of the VRFB test rig is shown Figure A2a. The anolyte and catholyte tanks are on the bottom left and right of the picture, respectively. The cell, in the center of the picture, is connected to the tanks via Neoprene and PFA tubing. Two peristaltic pumps provide the electrolyte flow. Temperature and pressure sensors monitor the electrolyte before the inlet and after the outlet of each electrode. The bespoke rig used to measure electrode resistance and thickness under different compression pressures is shown in Figure A2b. For these measurements, the electrode material was sandwiched between two gold-coated steel plates, as shown in Figure A2c, which was then placed between a piston and an upper plate. A DC power supply passed 2.7 A through the assembly and a multi-meter recorded the voltage drop across the metal plates.
Figure A1.
Transient cell performance. Cell operating voltage vs. current density for Cells 1–4 (labeled) at flow rates of (a) 50 mL min−1, (c) 100 mL min−1 and (e) 200 mL min−1. Cell power density vs. current density for Cells 1–4 (labeled) at flow rates of (b) 50 mL min−1, (d) 100 mL min−1 and (f) 200 mL min−1. Felt compression pressures and % compression values for each cell are given in brackets.

Figure A2.
Photographs of (a) the VRFB test rig, (b) the bespoke rig used to measure electrode resistance and thickness under different compressions and (c) the electrode-metal plate assembly placed in the compression rig in (b).
Figure A2.
Photographs of (a) the VRFB test rig, (b) the bespoke rig used to measure electrode resistance and thickness under different compressions and (c) the electrode-metal plate assembly placed in the compression rig in (b).

References
- Dunn, B.; Kamath, H.; Tarascon, J.-M. Electrical Energy Storage for the Grid: A Battery of Choices. Science 2011, 334, 928–935. [Google Scholar] [CrossRef] [PubMed]
- Deng, D. Li-ion Batteries: Basics, Progress, and Challenges. Energy Sci. Eng. 2015, 3, 385–418. [Google Scholar] [CrossRef]
- Leung, P.; Li, X.; Ponce de León, C.; Berlouis, L.; Low, C.T.J.; Walsh, F.C. Progress in Redox Flow Batteries, Remaining Challenges and Their Applications in Energy Storage. RSC Adv. 2012, 2, 10125–10156. [Google Scholar] [CrossRef]
- Weber, A.Z.; Mench, M.M.; Meyers, J.P.; Ross, P.N.; Gostick, J.T.; Liu, Q. Redox Flow Batteries: A Review. J. Appl. Electrochem. 2011, 41, 1137–1164. [Google Scholar] [CrossRef]
- Pieper, C.; Rubel, H. Revisiting Energy Storage: There Is a Business Case. Boston Consulting Group, 2011. Available online: https://www.bcg.com/documents/file72092.pdf (accessed on 29 November 2017).
- Ulaganathan, M.; Aravindan, V.; Yan, Q.; Madhavi, S.; Skyllas-Kazacos, M.; Lim, T.M. Recent Advancements in All-Vanadium Redox Flow Batteries. Adv. Mater. Interfaces 2016, 3, 1500309. [Google Scholar] [CrossRef]
- Engineering.com. Available online: http://www.engineering.com/DesignerEdge/DesignerEdgeArticles/ArticleID/12312/Massive-800-MegaWatt-hour-Battery-to-Be-Deployed-in-China.aspx (accessed on 29 November 2017).
- Zhou, X.L.; Zhao, T.S.; An, L.; Zeng, Y.K.; Wei, L. Critical Transport Issues for Improving the Performance of Aqueous Redox Flow Batteries. J. Power Sources 2017, 339, 1–12. [Google Scholar] [CrossRef]
- Zhang, M.; Moore, M.; Watson, J.S.; Zawodzinski, T.A.; Counce, R.M. Capital Cost Sensitivity Analysis of an All-Vanadium Redox-Flow Battery. J. Electrochem. Soc. 2012, 159, A1183–A1188. [Google Scholar] [CrossRef]
- Kear, G.; Shah, A.A.; Walsh, F.C. Development of the All-Vanadium Redox Flow Battery for Energy Storage: A Review of Technological, Financial and Policy Aspects. Int. J. Energy Res. 2012, 36, 1105–1120. [Google Scholar] [CrossRef]
- Parasuraman, A.; Lim, T.M.; Menictas, C.; Skyllas-Kazacos, M. Review of Material Research and Development for Vanadium Redox Flow Battery Applications. Electrochim. Acta 2013, 101, 27–40. [Google Scholar] [CrossRef]
- Chakrabarti, M.H.; Brandon, N.P.; Hajimolana, S.A.; Tariq, F.; Yufit, V.; Hashim, M.A.; Hussain, M.A.; Low, C.T.J.; Aravind, P.V. Application of Carbon Materials in Redox Flow Batteries. J. Power Sources 2014, 253, 150–166. [Google Scholar] [CrossRef]
- Kazacos, M.; Skyllas-Kazacos, M. Performance Characteristics of Carbon Plastic Electrodes in the All-Vanadium Redox Cell. J. Electrochem. Soc. 1989, 136, 2759–2760. [Google Scholar] [CrossRef]
- Bhattarai, A.; Wai, N.; Schweiss, R.; Whitehead, A.; Lim, T.M.; Hng, H.H. Advanced Porous Electrodes with Flow Channels for Vanadium Redox Flow Battery. J. Power Sources 2017, 341, 83–90. [Google Scholar] [CrossRef]
- Xu, Q.; Zhao, T.S.; Zhang, C. Performance of a Vanadium Redox Flow Battery with and without Flow Fields. Electrochim. Acta 2014, 142, 61–67. [Google Scholar] [CrossRef]
- Chang, T.-C.; Zhang, J.-P.; Fuh, Y.-K. Electrical, Mechanical and Morphological Properties of Compressed Carbon Felt Electrodes in Vanadium Redox Flow Battery. J. Power Sources 2014, 245, 66–75. [Google Scholar] [CrossRef]
- Brown, L.D.; Neville, T.P.; Jervis, R.; Mason, T.J.; Shearing, P.R.; Brett, D.J.L. The Effect of Felt Compression on the Performance and Pressure Drop of All-Vanadium Redox Flow Batteries. J. Energy Storage 2016, 8, 91–98. [Google Scholar] [CrossRef]
- Park, S.-K.; Shim, J.; Yang, J.H.; Jin, C.-S.; Lee, B.S.; Lee, Y.-S.; Shin, K.-H.; Jeon, J.-D. The Influence of Compressed Carbon Felt Electrodes on the Performance of a Vanadium Redox Flow Battery. Electrochim. Acta 2014, 116, 447–452. [Google Scholar] [CrossRef]
- Oh, K.; Won, S.; Ju, H. Numerical Study of the Effects of Carbon Felt Electrode Compression in All-Vanadium Redox Flow Batteries. Electrochim. Acta 2015, 181, 13–23. [Google Scholar] [CrossRef]
- Chen, D.; Hickner, M.A.; Agar, E.; Kumbur, E.C. Optimizing Membrane Thickness for Vanadium Redox Flow Batteries. J. Membr. Sci. 2013, 437, 108–113. [Google Scholar] [CrossRef]
- Zhang, C.; Zhao, T.S.; Xu, Q.; An, L.; Zhao, G. Effects of Operating Temperature on the Performance of Vanadium Redox Flow Batteries. Appl. Energy 2015, 155, 349–353. [Google Scholar] [CrossRef]
- Aaron, D.S.; Liu, Q.; Tang, Z.; Grim, G.M.; Papandrew, A.B.; Turhan, A.; Zawodzinski, T.A.; Mench, M.M. Dramatic Performance Gains in Vanadium Redox Flow Batteries Through Modified Cell Architecture. J. Power Sources 2012, 206, 450–453. [Google Scholar] [CrossRef]
- Liu, Q.H.; Grim, G.M.; Papandrew, A.B.; Turhan, A.; Zawodzinski, T.A.; Mench, M.M. High Performance Vanadium Redox Flow Batteries with Optimized Electrode Configuration and Membrane Selection. J. Electrochem. Soc. 2012, 159, A1246–A1252. [Google Scholar] [CrossRef]
- Houser, J.; Pezeshki, A.; Clement, J.T.; Aaron, D.; Mench, M.M. Architecture for Improved Mass Transport and System Performance in Redox Flow Batteries. J. Power Sources 2017, 351, 96–105. [Google Scholar] [CrossRef]
- Zhou, X.L.; Zeng, Y.K.; Zhu, X.B.; Wei, L.; Zhao, T.S. A High-Performance Dual-Scale Porous Electrode for Vanadium Redox Flow Batteries. J. Power Sources 2016, 325, 329–336. [Google Scholar] [CrossRef]
- Darling, R.M.; Perry, M.L. The Influence of Electrode and Channel Configurations on Flow Battery Performance. J. Electrochem. Soc. 2014, 161, A1381–A1387. [Google Scholar] [CrossRef]
- Won, S.; Oh, K.; Ju, H. Numerical Studies of Carbon Paper-Based Vanadium Redox Flow Batteries. Electrochim. Acta 2016, 201, 286–299. [Google Scholar] [CrossRef]
- Liu, T.; Li, X.; Xu, C.; Zhang, H. Activated Carbon Fiber Paper Based Electrodes with High Electrocatalytic Activity for Vanadium Flow Batteries with Improved Power Density. ACS Appl. Mater. Interfaces 2017, 9, 4626–4633. [Google Scholar] [CrossRef] [PubMed]
- Dennison, C.R.; Agar, E.; Akuzum, B.; Kumbur, E.C. Enhancing Mass Transport in Redox Flow Batteries by Tailoring Flow Field and Electrode Design. J. Electrochem. Soc. 2016, 163, A5163–A5169. [Google Scholar] [CrossRef]
- Mayrhuber, I.; Dennison, C.R.; Kalra, V.; Kumbur, E.C. Laser-Perforated Carbon Paper Electrodes for Improved Mass-Transport in High Power Density Vanadium Redox Flow Batteries. J. Power Sources 2014, 260, 251–258. [Google Scholar] [CrossRef]
- You, X.; Ye, Q.; Cheng, P. Scale-Up of High Power Density Redox Flow Batteries by Introducing Interdigitated Flow Fields. Int. Commun. Heat Mass Transf. 2016, 75, 7–12. [Google Scholar] [CrossRef]
- Perry, M.L.; Darling, R.M.; Zaffou, R. High Power Density Redox Flow Battery Cells. ECS Trans. 2013, 53, 7–16. [Google Scholar] [CrossRef]
- McCreery, R. Carbon Electrodes: Structural Effects on Electron Transfer Kinetics. In Electroanalytical Chemistry; Bard, A.J., Ed.; Marcel Dekker, Inc.: New York, NY, USA, 1991; Volume 17, pp. 221–374. ISBN 9780824784096-CAT# DK5885. [Google Scholar]
- Tilton, J.N. Fluid and Particle Dynamics. In Perry’s Chemical Engineers’ Handbook, 7th ed.; Green, D.W., Maloney, J.O., Eds.; McGraw-Hill: New York, NY, USA, 1997; ISBN 0-07-049841-5. [Google Scholar]
- Mohammadi, T.; Chieng, S.C.; Skyllas-Kazacos, M. Water Transport Study across Commercial Ion Exchange Membranes in the Vanadium Redox Flow Battery. J. Membr. Sci. 1997, 133, 151–159. [Google Scholar] [CrossRef]
Figure 1.
Plots of (a) thickness; (b) compression; (c) porosity and (d) total area specific resistance against compression pressure for samples of GFD 4.6EA and GDL 10AA; (e) Bulk felt area specific resistance and (f) total area specific contact resistance vs. compression pressure for samples of GFD 4.6EA. Blue zone represents the 10–30% felt compression range.

Figure 2.
(a) Plot of pumping pressure vs. flow rate for water at ambient temperature through samples of GFD 4.6EA at different compression pressures (% compression given in brackets); (b) Plot of pumping pressure for a 100 mL min−1 flow rate of water at ambient temperature through GFD 4.6EA at different compression pressures.

Figure 3.
Plots of (a) cell operating voltage and (b) cell power density against current density for Cells 1–4 (labeled) with a range of active area compression pressures and % compression values.
Figure 3.
Plots of (a) cell operating voltage and (b) cell power density against current density for Cells 1–4 (labeled) with a range of active area compression pressures and % compression values.

Figure 4.
Plot of area specific high-frequency resistance against active area compression pressure for Cells 1–4 (Nafion 117 membranes) and Cells 5–8 (Nafion 212 membranes), where the current density was 0.4 A cm−2.
Figure 4.
Plot of area specific high-frequency resistance against active area compression pressure for Cells 1–4 (Nafion 117 membranes) and Cells 5–8 (Nafion 212 membranes), where the current density was 0.4 A cm−2.

Figure 5.
Plots of (a) cell operating voltage and (b) cell power density against current density for Cells 5–8 (labeled) with a range of active area compression pressures and % compression values.
Figure 5.
Plots of (a) cell operating voltage and (b) cell power density against current density for Cells 5–8 (labeled) with a range of active area compression pressures and % compression values.

Figure 6.
Plots of open circuit voltage vs. time for (a) Cells 1 and 4 (Nafion 117 membranes) and (b) Cells 6 and 8 (Nafion 212 membranes). Compression pressures and % compression values are given in brackets for each cell. Initially the flow rate was 100 mL min−1. Arrows indicate when the flow was turned off and then reactivated.

Figure 7.
Charge-discharge curves obtained in a VRFB using Cells 9 and 10 at 90 and 174 mA cm−2 (2.7 and 5.4 A), with a flow rate of 100 mL min−1.
Figure 7.
Charge-discharge curves obtained in a VRFB using Cells 9 and 10 at 90 and 174 mA cm−2 (2.7 and 5.4 A), with a flow rate of 100 mL min−1.

Figure 8.
(a) Components in a single cell used for VRFB tests: 1 stainless steel endplate; 2 polytetrafluoroethylene sheet; 3 gold-plated copper current collector; 4 JP945 graphite block containing flow inlet and outlet (not shown); 5 polyolefin gaskets; 6 GFD 4.6EA felt electrode; 7 Nafion membrane; (b) Photograph of an assembled cell; (c) Components in a cell used for flow tests: 1 stainless steel endplate; 2 JP945 graphite block containing flow inlet and outlet (not shown); 3 polyolefin gaskets; 4 GFD 4.6EA felt electrode; 5 JP945 graphite block with no flow inlet or outlet.


Table 1.
Details of the cell builds used in vanadium redox flow batteries (VRFB) tests. The electrode material was GFD 4.6EA.
Table 1.
Details of the cell builds used in vanadium redox flow batteries (VRFB) tests. The electrode material was GFD 4.6EA.
| Cell Number | Membrane | Electrode Thickness/mm | Compression Pressure/bar | % Compression |
|---|---|---|---|---|
| 1 | Nafion 117 | 1.43 | 6.95 | 71 |
| 2 | Nafion 117 | 2.21 | 2.20 | 54 |
| 3 | Nafion 117 | 3.47 | 0.77 | 29 |
| 4 | Nafion 117 | 4.37 | 0.17 | 10 |
| 5 | Nafion 212 | 1.40 | 7.49 | 71 |
| 6 | Nafion 212 | 2.07 | 2.52 | 57 |
| 7 | Nafion 212 | 3.26 | 0.93 | 33 |
| 8 | Nafion 212 | 4.42 | 0.15 | 9 |
| 9 | Nafion 117 | 2.21 | 2.23 | 55 |
| 10 | Nafion 117 | 4.31 | 0.21 | 11 |
Table 2.
Details of high performance VRFBs reported in the literature. The last two rows concern Cells 1 and 5 from the present study.
Table 2.
Details of high performance VRFBs reported in the literature. The last two rows concern Cells 1 and 5 from the present study.
| Electrode Material | Electrode Pre-Treatment | % Comp. 1 | Electrolyte | OCV 2/V | Membrane (Thickness 3) | Flow Rate/mL min−1 cm−2 | E at 0.5 A cm−2/V | VEd at 0.5 A cm−2 | Peak Power/mW cm−2 | HFR 4/Ω cm2 | Ref. |
|---|---|---|---|---|---|---|---|---|---|---|---|
| Paper GDL 10AA | None | - | 1 M V 4 M H2SO4 | 1.68 5 | Nafion 117 (183 μm) | 4 | 0.99 | 0.59 | 557 | 0.50 | [22] |
| Paper GDL 10AA | Thermal | - | 1 M V 5 M H2SO4 | 1.66 5 | Nafion 212 (50.8 μm) | 18 | 1.26 | 0.76 | 767 | 0.219 | [23] |
| Paper GDL 10AA | None | - | 1.7 M V 3.3 M H2SO4 | 1.43 | Nafion 117 (183 μm) | 5.6 | 1.0 | 0.70 | 1290 | - | [24] |
| Felt GFA5 | Thermal | 33% | 1.4 M V 2 M H2SO4 | 1.5 | SFPAE 6 (45 μm) | 10 | 0.47 | 0.31 | 311 | - | [20] |
| Felt GFA5 | None | - | 1 M V 4 M H2SO4 | 1.65 | Nafion 115 (127 μm) | 10 | 0.70 | 0.42 | 350 | - | [21] |
| Felt GFD 4.6EA | None | 71% | 1.6 M V 4 M H2SO4 | 1.38 | Nafion 117 (183 μm) | 3.2 | 0.81 | 0.59 | 429 | 0.753 | Cell 1 |
| Felt GFD 4.6EA | None | 71% | 1.6 M V 4 M H2SO4 | 1.38 | Nafion 212 (50.8 μm) | 3.2 | 0.98 | 0.71 | 669 | 0.374 | Cell 5 |
1 Compression; 2 Open circuit voltage; 3 Approximate; 4 Area specific high-frequency resistance; 5 Discharge performance curves started at 100% state of charge. However, battery state of charge was 50–60% by time peak power achieved; 6 Fluorinated sulfonated poly(arylene ether).
Table 3.
Analysis of charge-discharge cycling for Cells 9 and 10.
| Cell | i/mA cm−2 | CE/% | VE/% | EE/% | U/% |
|---|---|---|---|---|---|
| Cell 9, 2.2 bar 55% compressed | 90 | 96.1 | 72.4 | 69.5 | 83.7 |
| 174 | 97.6 | 56.1 | 54.8 | 68.2 | |
| 435 | 96.7 | 28.1 | 27.1 | 43.1 | |
| Cell 10, 0.2 bar 11% compressed | 90 | 97.3 | 67.3 | 65.5 | 70.8 |
| 174 | 96.6 | 50.8 | 49.0 | 49.0 | |
| 435 | - | - | - | - |
© 2018 by the authors. Licensee MDPI, Basel, Switzerland. This article is an open access article distributed under the terms and conditions of the Creative Commons Attribution (CC BY) license (http://creativecommons.org/licenses/by/4.0/).
Share and Cite
MDPI and ACS Style
Davies, T.J.; Tummino, J.J. High-Performance Vanadium Redox Flow Batteries with Graphite Felt Electrodes. C 2018, 4, 8. https://doi.org/10.3390/c4010008
AMA Style
Davies TJ, Tummino JJ. High-Performance Vanadium Redox Flow Batteries with Graphite Felt Electrodes. C. 2018; 4(1):8. https://doi.org/10.3390/c4010008
Chicago/Turabian StyleDavies, Trevor J., and Joseph J. Tummino. 2018. "High-Performance Vanadium Redox Flow Batteries with Graphite Felt Electrodes" C 4, no. 1: 8. https://doi.org/10.3390/c4010008
Note that from the first issue of 2016, this journal uses article numbers instead of page numbers. See further details here.