Prediction of the Seismic Response of Multi-Storey Multi-Bay Masonry Infilled Frames Using Artificial Neural Networks and a Bilinear Approximation


Abstract
:1. Introduction
2. Experimental Database of Infilled Frames, EDIF
- a—height to length ratio,
- b—ratio of moments of inertia of beam to column,
- g—ratio of column width to the thickness of masonry infill,
- rc—reinforcement ratio of column,
- fy—yield strength of the reinforcing steel,
- λh—stiffness ratio (Equation (1)),
- V—axial load on columns.
- h—height of frame between the beam axis,
- hw—height of masonry infill,
- Ec—modulus of elasticity of column,
- Ei—modulus of elasticity of masonry infill,
- I—moment of inertia of the column,
- θ—whose tangent is equal to the relation between height and length of infill.
3. Neural Network Modelling
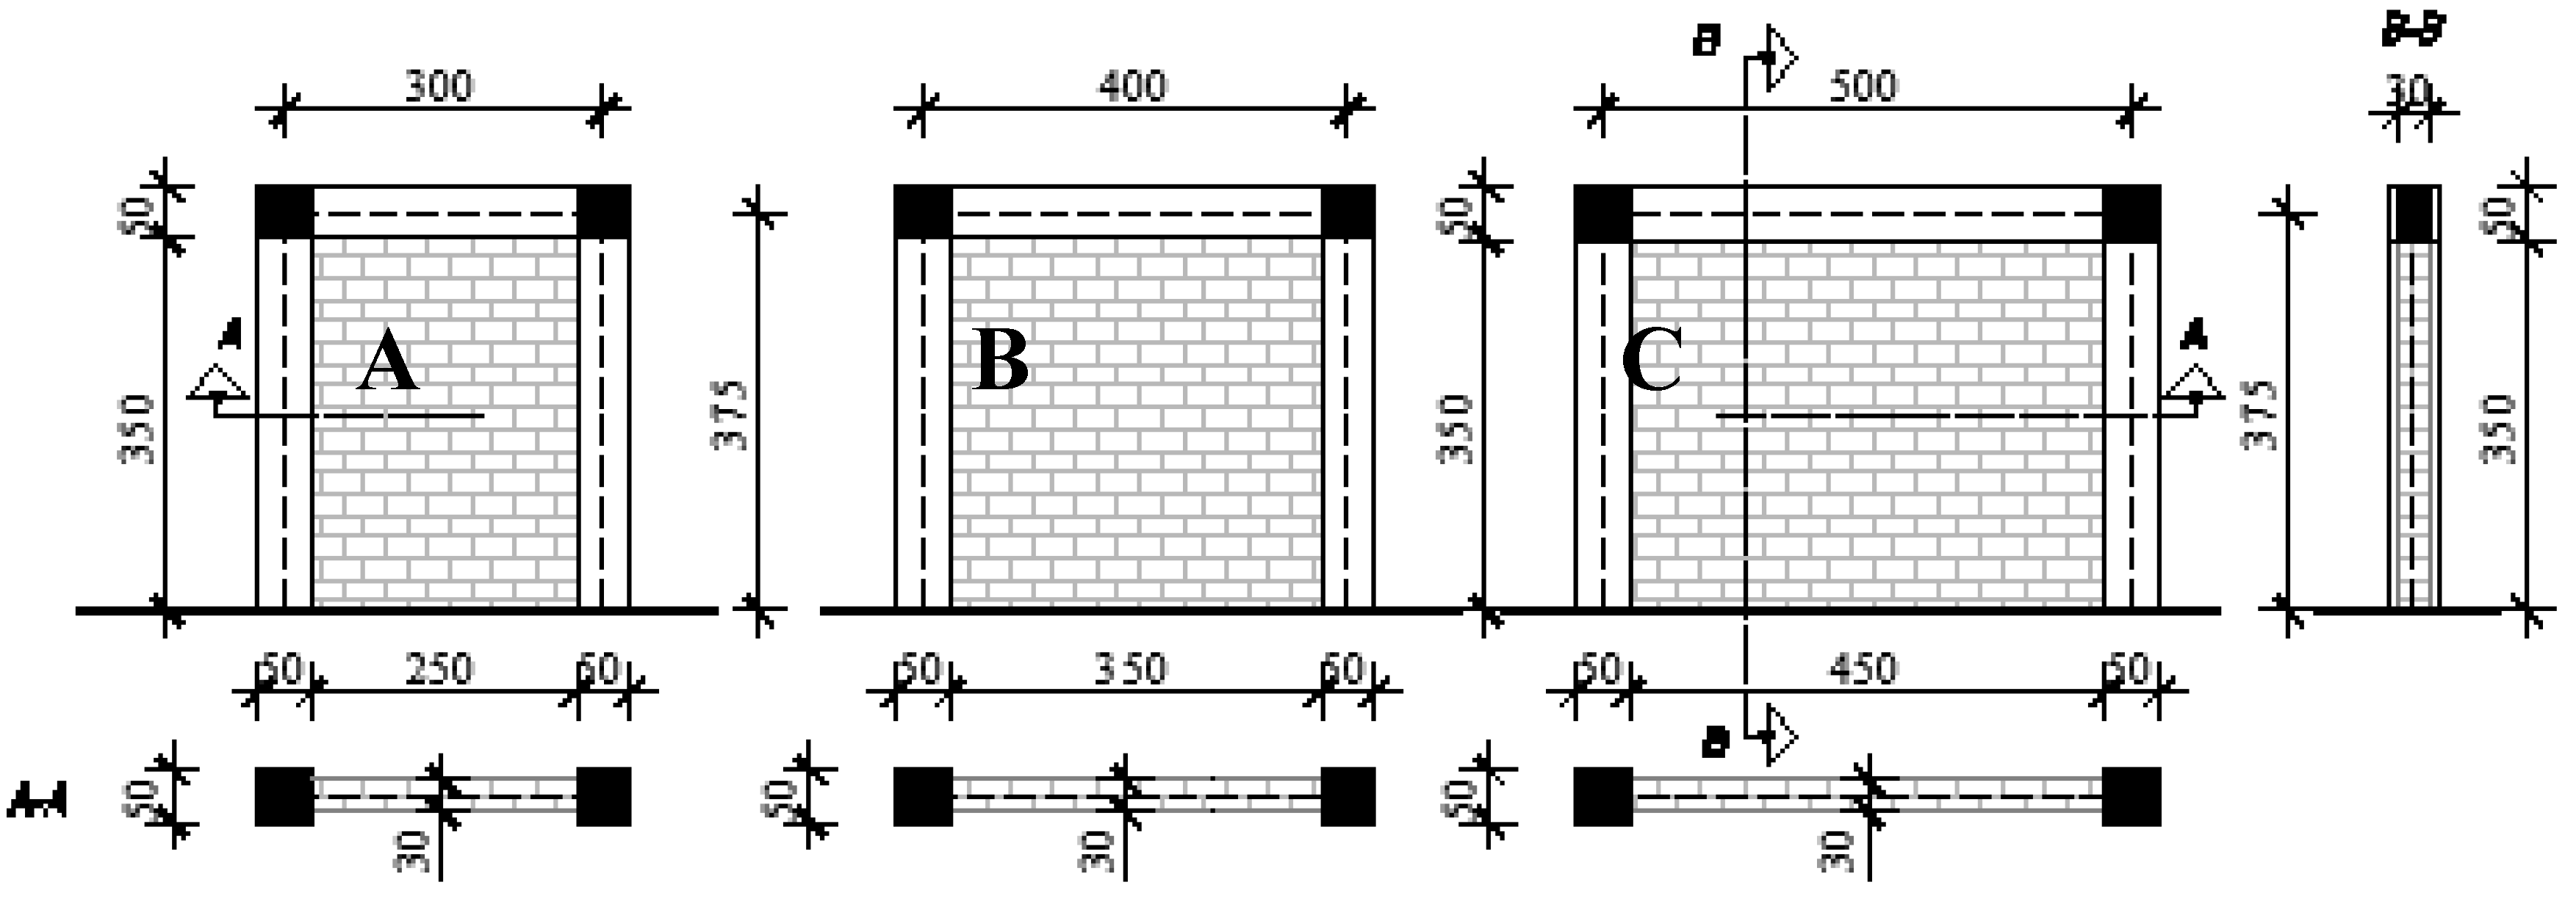
4. Definition of Models for Numerical Nonlinear FEM Analysis and Neural Network Processing
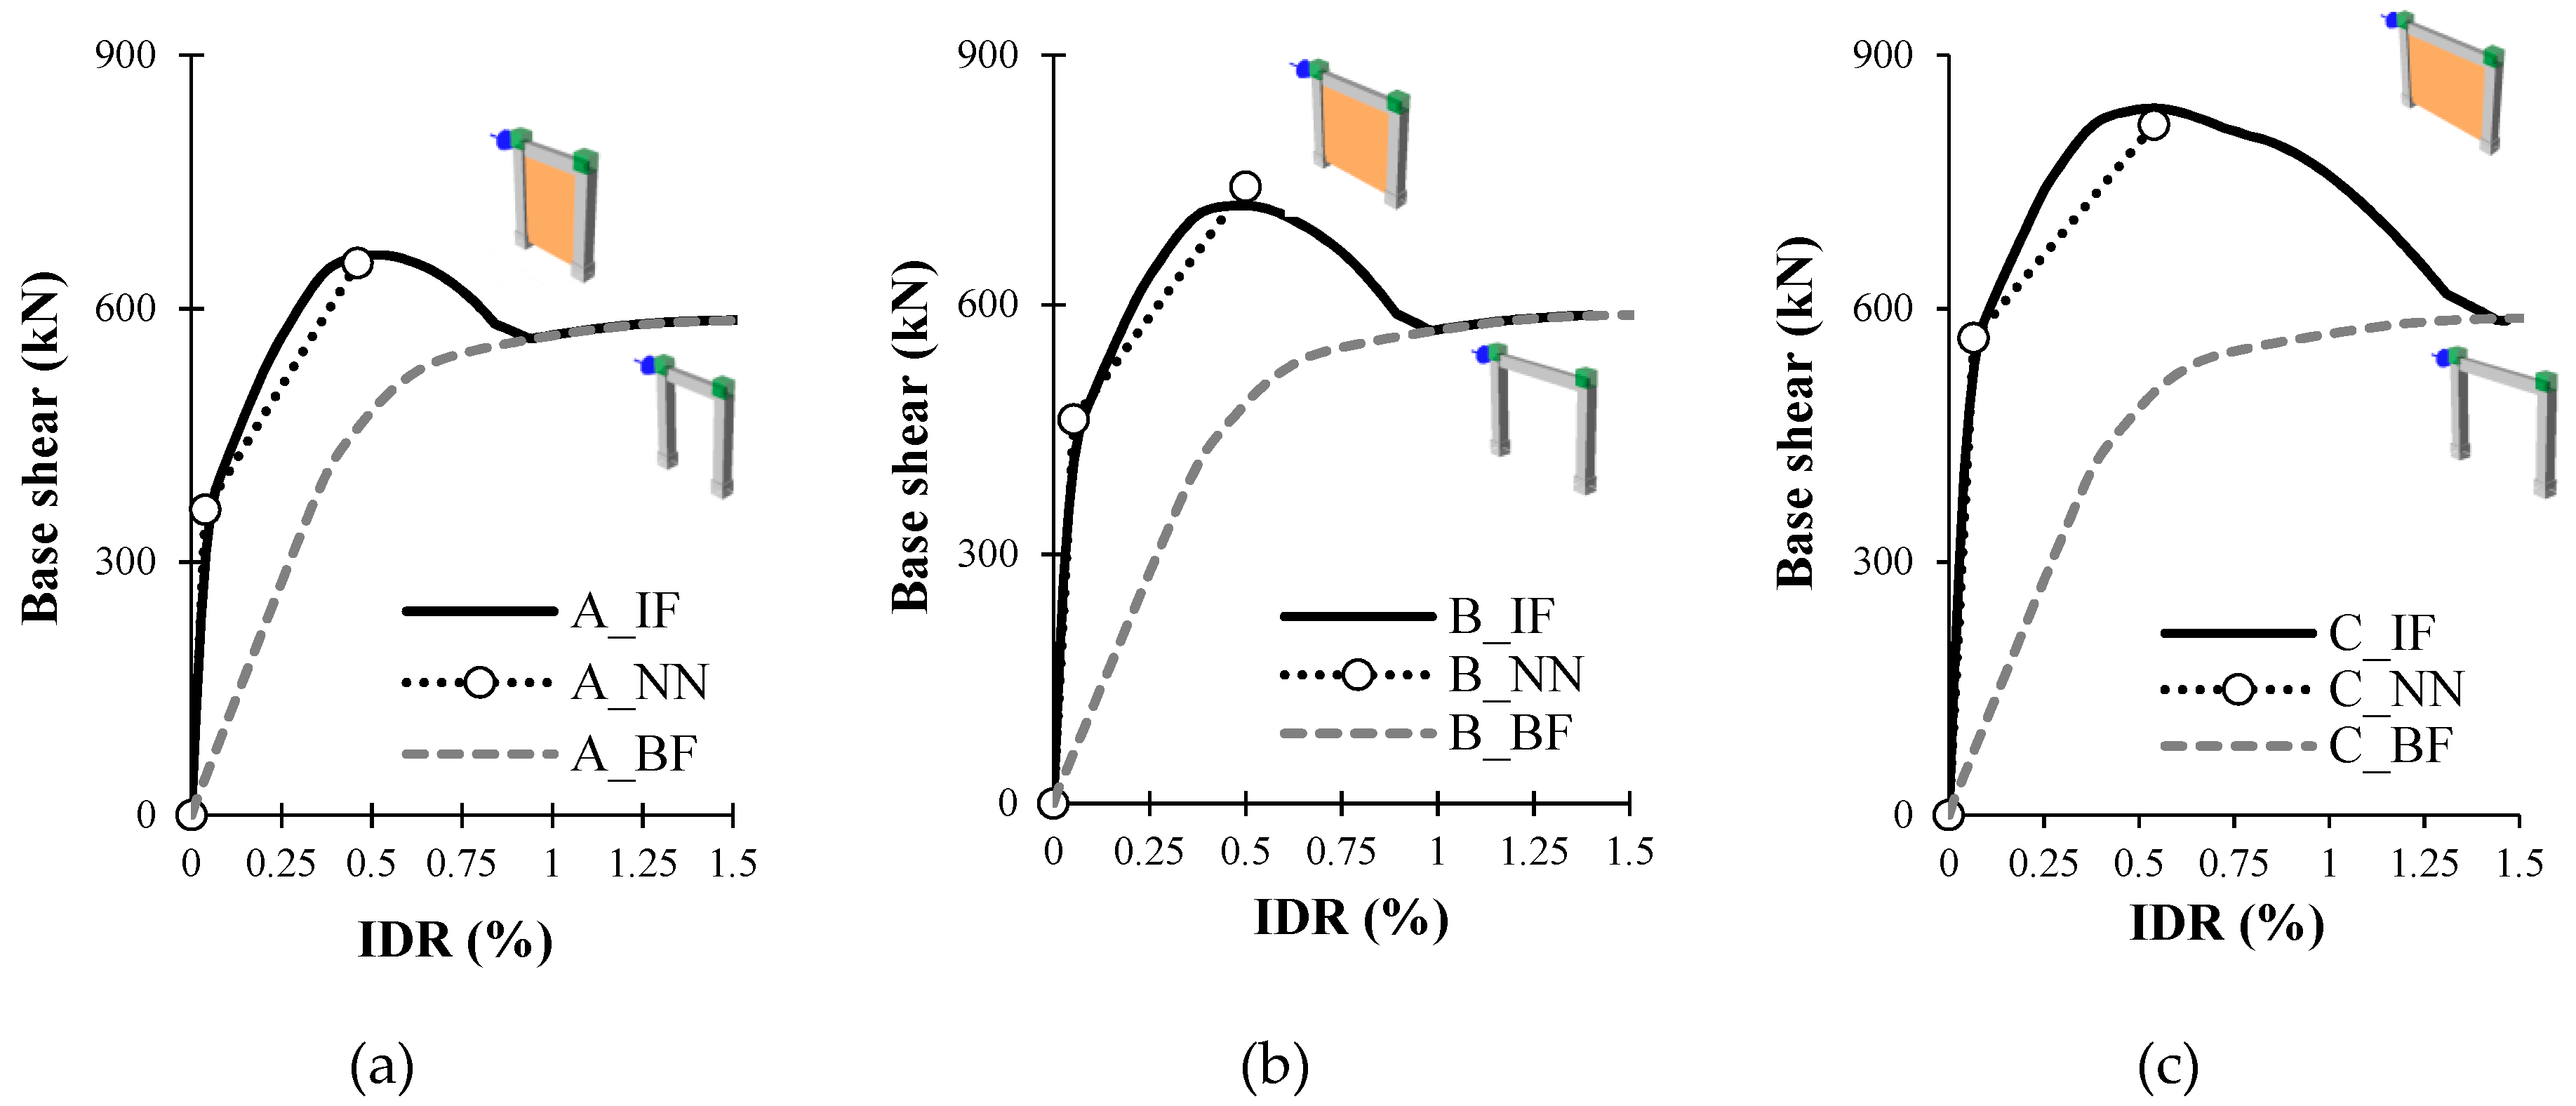
4.1. Results of Analysis and Prediction of Neural Networks
- in the cracking area the infill wall retains 80% load capacity, while the RC frame assumes 20% load capacity (10% per column);
- in the area of the maximum strength, the infill takes on average 40%, while the frame or each of the columns assume 30% of the load capacity.
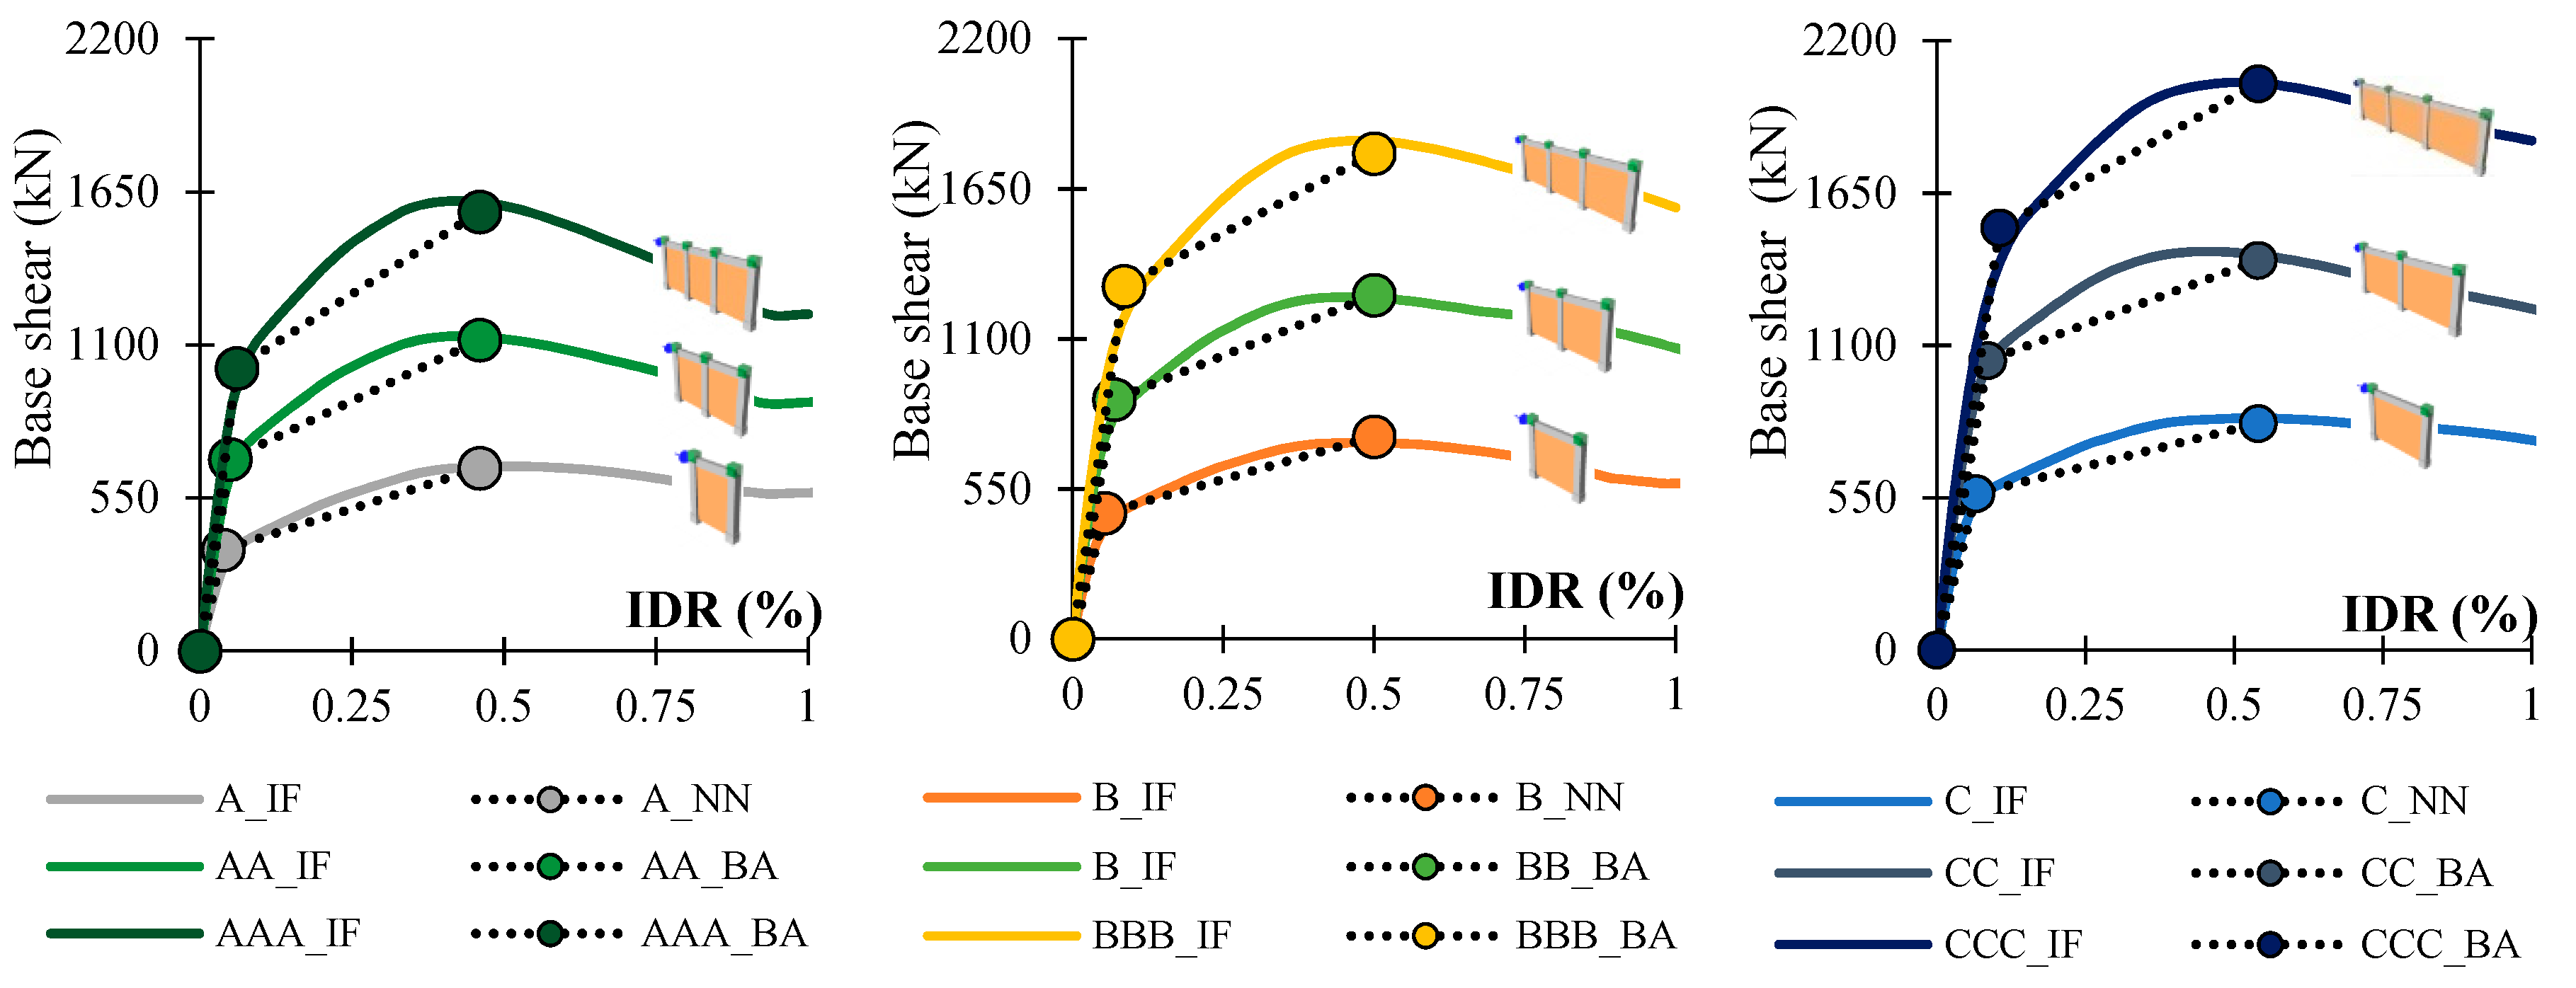
4.2. Application of Neural Networks on Multi-bay Frames with Same Bay Length
- IDRc,i—inter-storey drift Ratio at cracking point of multi-bay infilled frame,
- IDRm,i—inter-storey drift Ratio at maximum capacity point of multi-bay infilled frame,
- BSc,I—base shear at first cracking point of multi-bay infilled frame,
- BSm,i—base shear at maximum capacity point of multi-bay infilled frame,
- IDRcy (NN)—inter-storey drift ratio at cracking point of one story one bay infilled frame obtained by NN
- IDRm (NN)—inter-storey Drift Ratio at maximum point of one story one bay infilled frame obtained by NN
- BSc (NN)—base shear at cracking point of one story one bay infilled frame obtained by NN
- BSm (NN)—base shear at maximum point of one story one bay infilled frame obtained by NN
- i = 2 ..., n—number of bays of multi-bay frame.
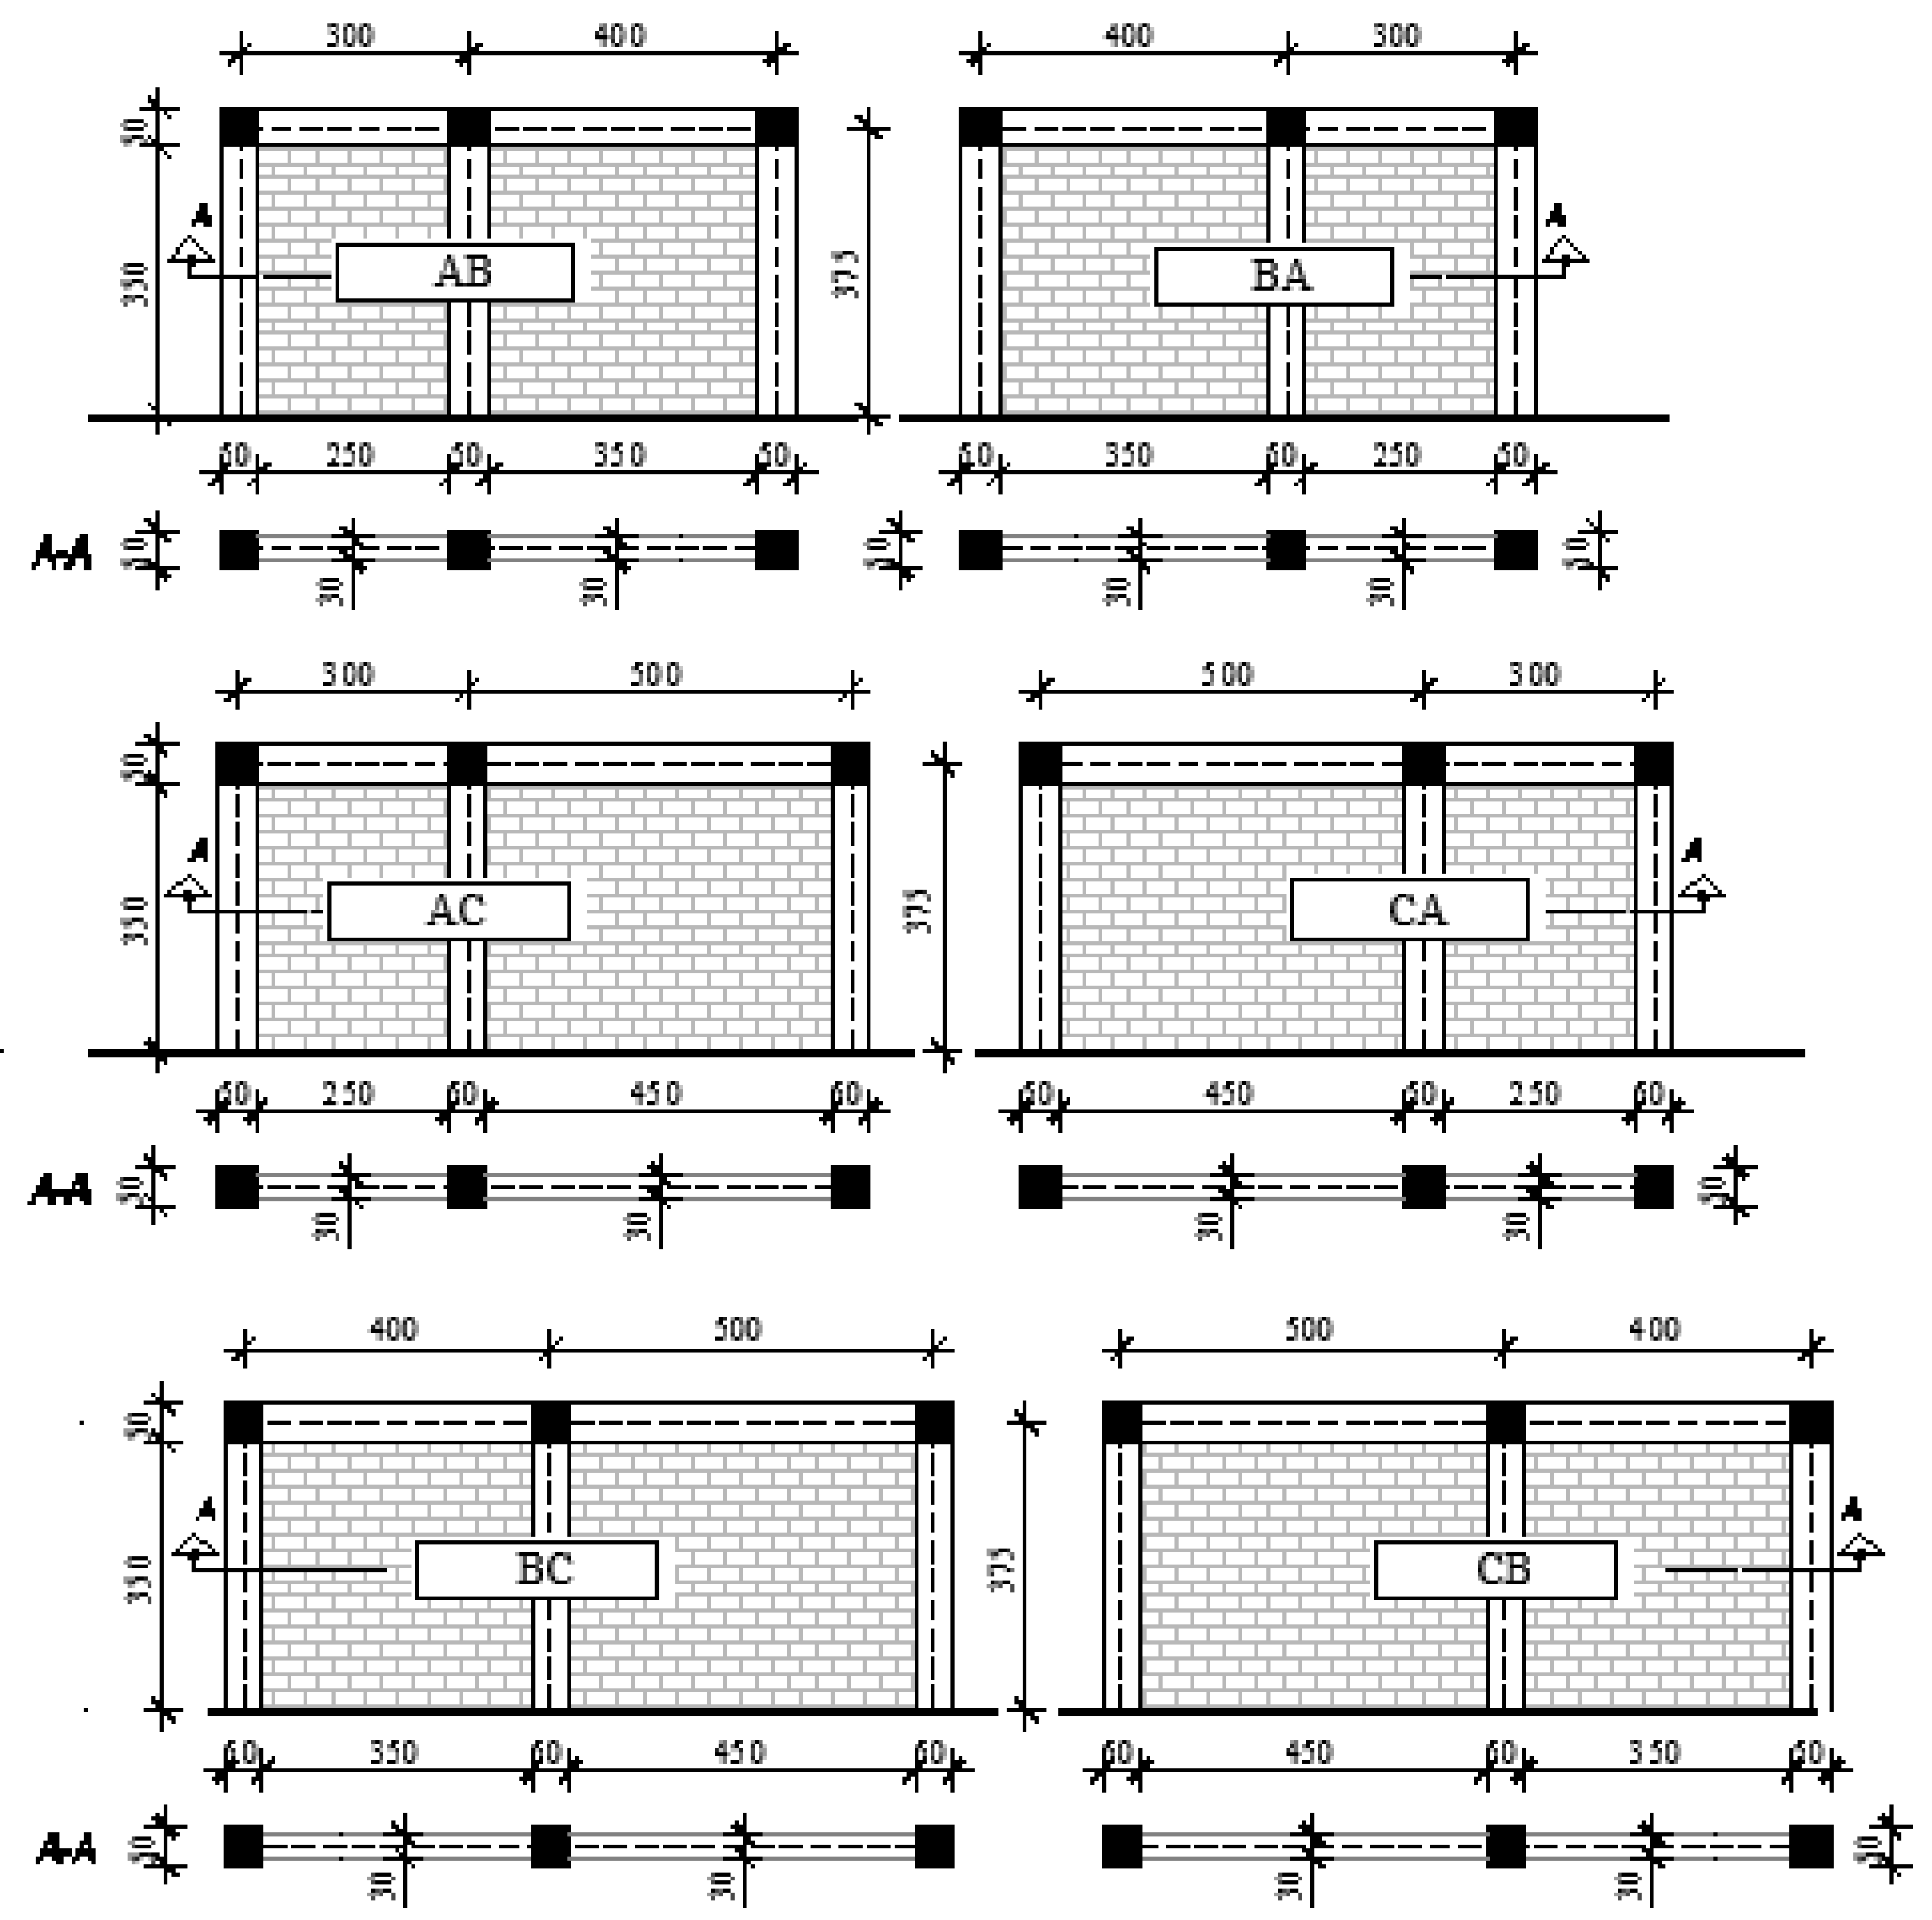
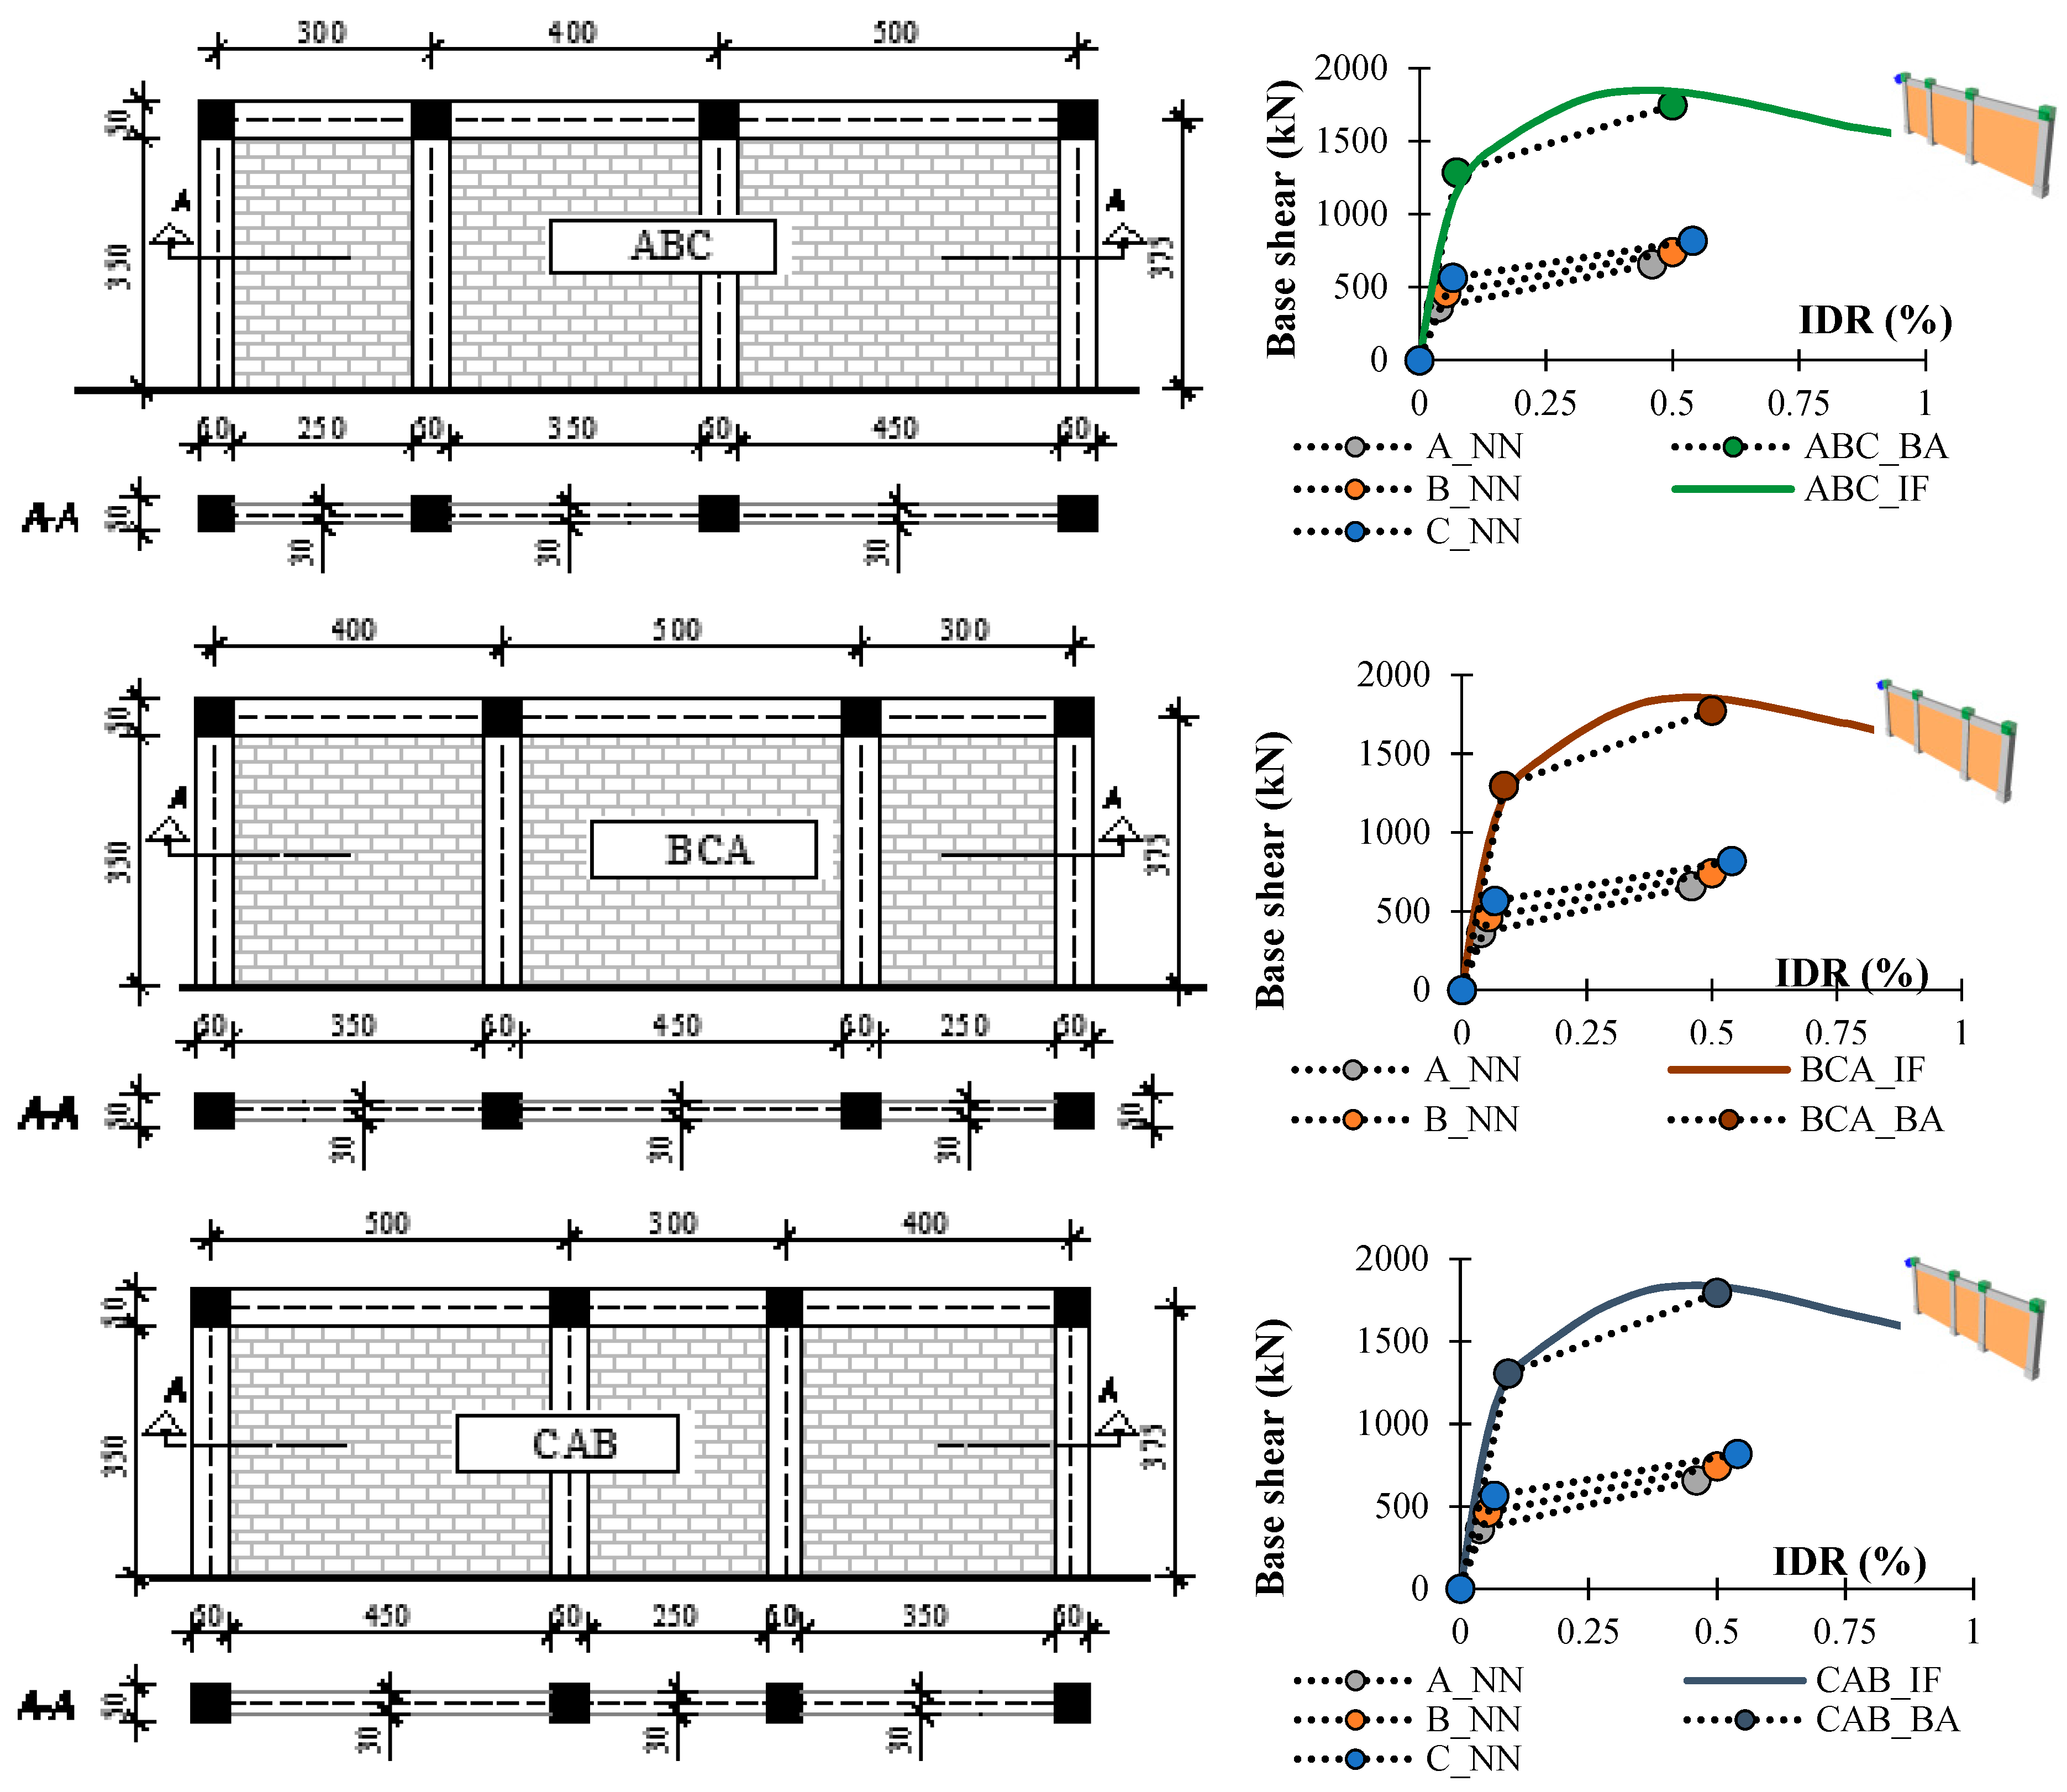
4.3. Application of Neural Networks on Multi-Bay Frames with Different Bay Length
- IDRcr,i—inter-storey drift ratio at cracking point of multi-bay infilled frame with different bay length,
- IDRmr,i—inter-storey drift ratio at maximum capacity point of multi-bay infilled frame with different bay length,
- BScr,I—base shear at first cracking point of multi-bay infilled frame with different bay length,
- BSmr,i—base shear at maximum point of multi-bay infilled frame with different bay length,
- IDRcj (NN)—inter-storey drift ratio at cracking point of one story one bay infilled frame obtained by NN
- IDRmj (NN)—inter-storey drift ratio at maximum capacity point of one story one bay infilled frame obtained by NN
- BScj (NN)—base shear at cracking point of one story one bay infilled frame obtained by NN
- BSmj (NN)—base shear at maximum point of one story one bay infilled frame obtained by NN
- i = 2, ..., n—number of bays of multi-bay frame
- j = 1, ..., n—ordinal number of bay in multi-bay frame
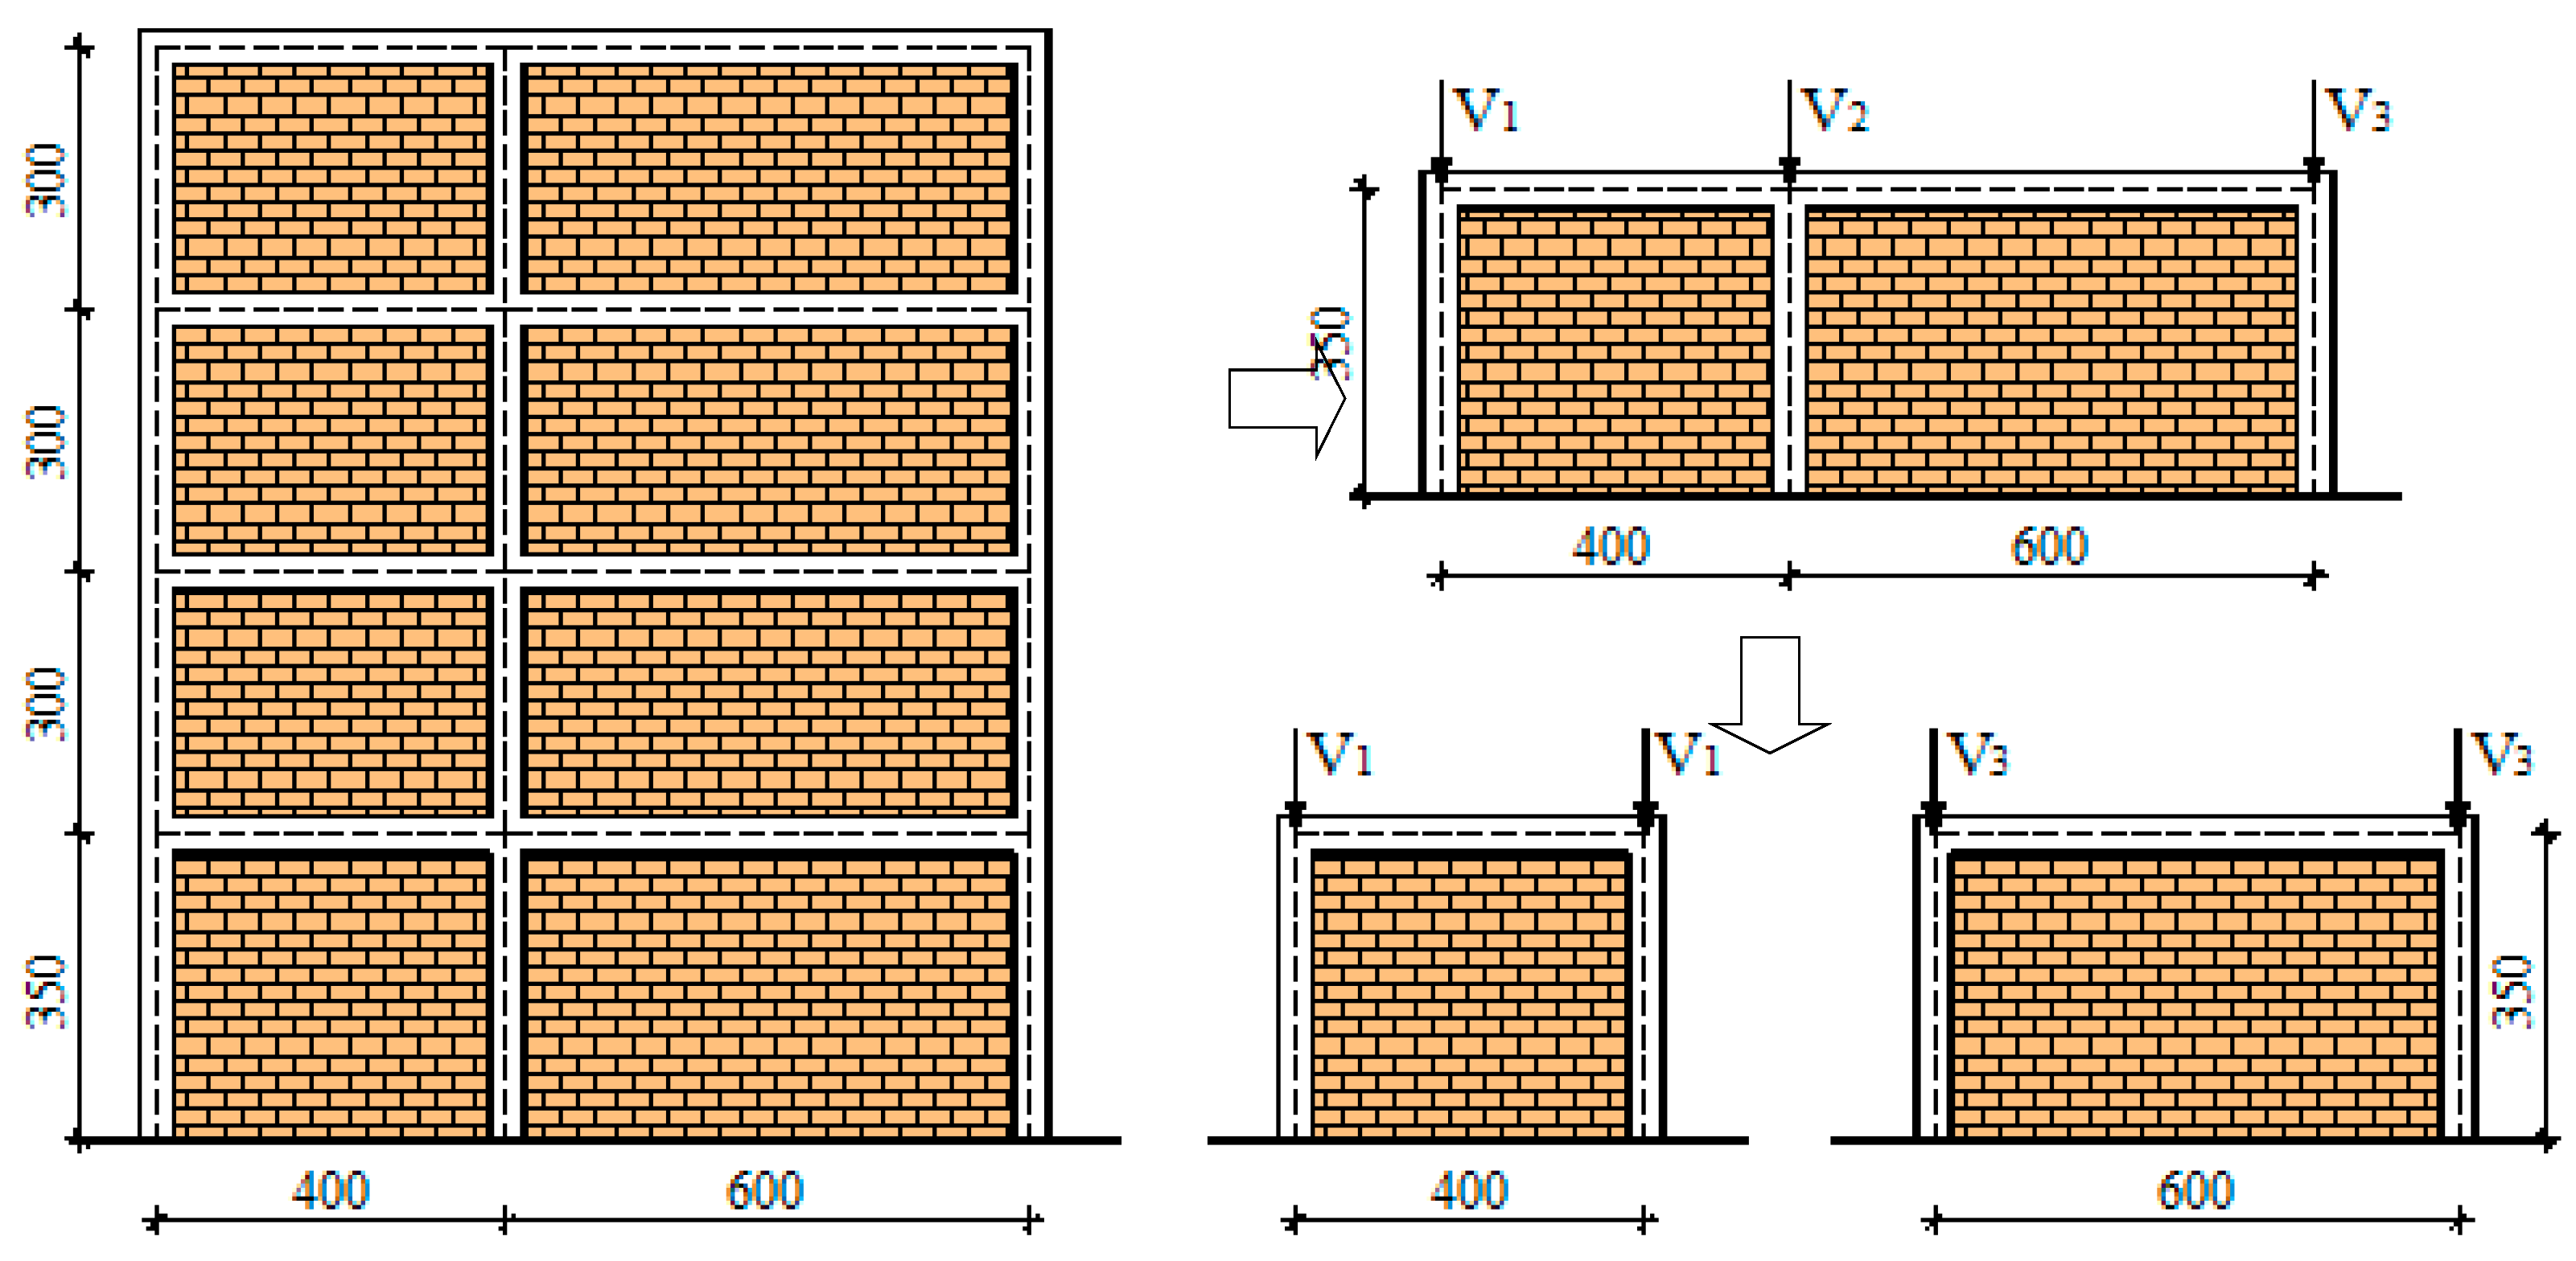
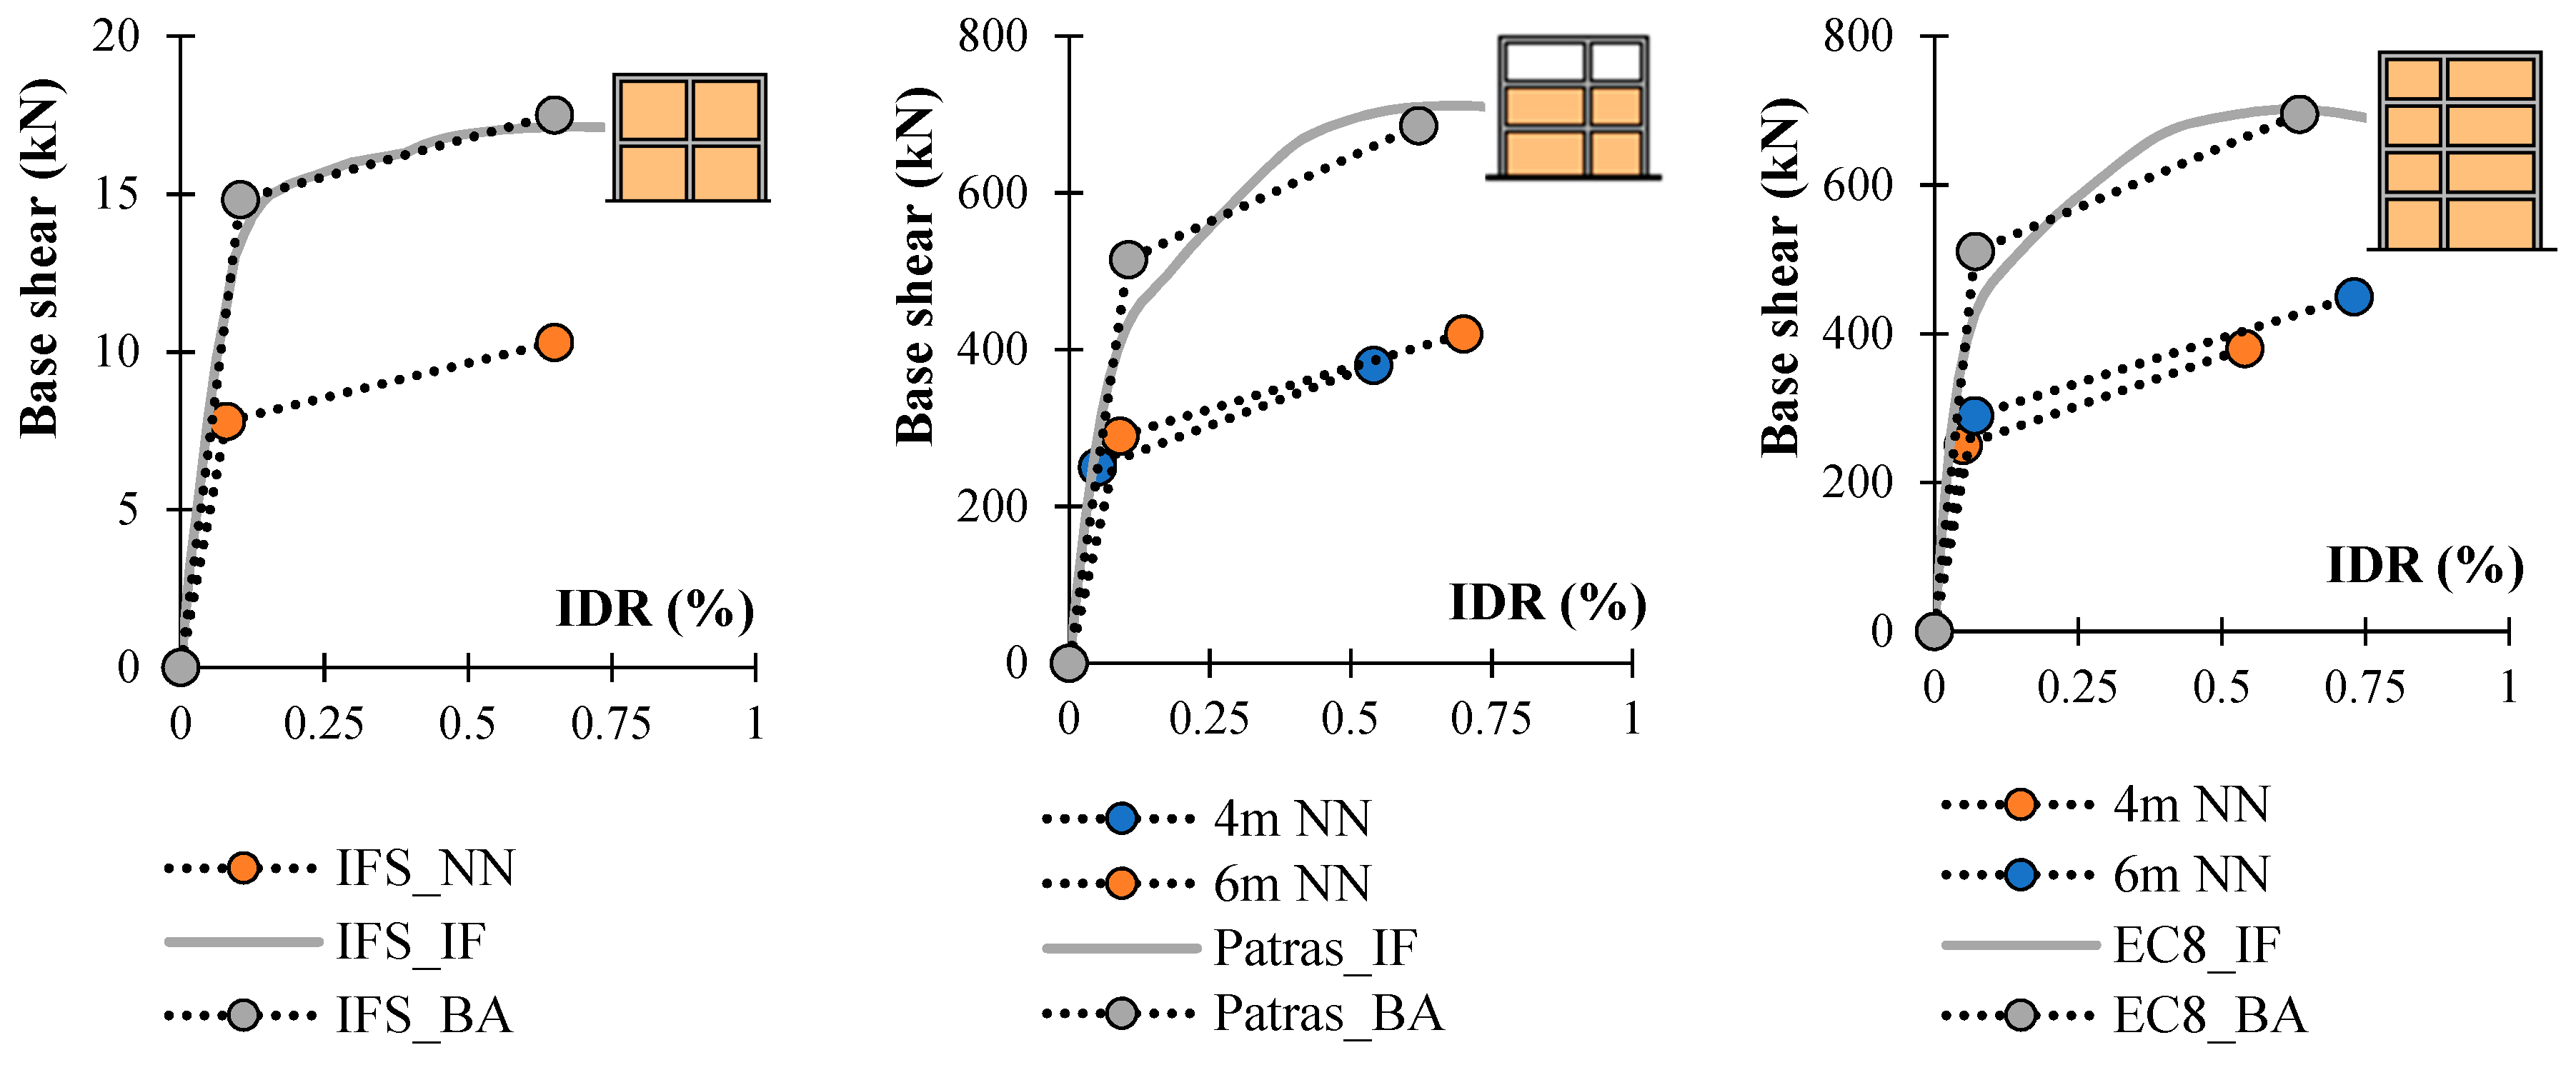
5. Validation of Proposed Equations on Mult-Storey Multi-Bay Infilled Frames
6. Conclusions
Author Contributions
Funding
Conflicts of Interest
References
- Asteris, P.G.; Cotsovos, D.; Chrysostomou, C.; Mohebkhah, A.; Al-Chaar, G. Mathematical micromodelling of infilled frames: State of the art. Eng. Struct. 2013, 56, 1905–1921. [Google Scholar] [CrossRef]
- Asteris, P.G.; Antoniou, S.T.; Spophianopoulos, D.S.; Chrysostomou, C.Z. Mathematical Macromodeling of Infilled Frames: State of the Art. J. Struct. Eng. 2011, 137, 1508–1517. [Google Scholar] [CrossRef]
- Furtado, A.; Rodrigues, H.; Arêde, A.; Kalman Šipoš, T.; Varum, H. Masonry Infill Walls Participation in the Seismic Response of RC Structures. In Masonry: Design, Materials and Techniques; Nova Science Publishing, Inc.: New York, NY, USA, 2019; pp. 113–147. [Google Scholar]
- Cascardi, A.; Micelli, F.; Aiello, M.A. An Artificial Neural Networks model for the prediction of the compressive strength of FRP-confined concrete circular columns. Eng. Struct. 2017, 140, 199–208. [Google Scholar] [CrossRef]
- Cascardi, A.; Micelli, F.; Aiello, M.A. Analytical model based on artificial neural network for masonry shear walls strengthened with FRM systems. Composites Part B 2016, 95, 252–263. [Google Scholar] [CrossRef]
- Asteris, P.G.; Repapis, C.C.; Repapi, E.V.; Cavaleri, L. Fundamental period of infilled reinforced concrete frame structures. Struct. Infrastruct. Eng. 2016, 13, 929–941. [Google Scholar] [CrossRef]
- Kalman Šipoš, T.; Sigmund, V.; Hadzima-Nyarko, M. Earthquake performance of infilled frames using neural networks and experimental database. Eng. Struct. 2013, 51, 113–127. [Google Scholar] [CrossRef]
- Asteris, P.G.; Nikoo, M. Artificial bee colony-based neural network for the prediction of the fundamental period of infilled frame structures. In Neural Computing and Applications; Springer: London, UK, 2019; pp. 1–11. [Google Scholar]
- Marinilli, A.; Castilla, E. Experimental evaluation of confined masonry walls with several confining-columns. In Proceedings of the 13th World Conference on Earthquake Engineering, Vancouver, BC, Canada, 1–6 August 2004. [Google Scholar]
- Combescure, D.; Pegon, P. Application of local to global approach to the study of infilled frame structures under seismic loading. Nucl. Eng. Des. 2000, 196, 17–40. [Google Scholar] [CrossRef]
- Colangelo, F. Pseudo-Dynamic Seismic Response and Phenomenological Models of Brick-Infilled RC Frames; Report DISAT 1/99; University of L’Aquila: L’Aquila, Italy, 1999. (In Italian) [Google Scholar]
- Cavaleri, L.; Fossetti, M.; Papia, M. Effect of vertical loads on lateral response of infilled frames. In Proceedings of the 13th World Conference on Earthquake Engineering, Vancouver, BC, Canada, 1–6 August 2004. [Google Scholar]
- Lafuente, M.; Castilla, E.; Genatios, C. Experimental and Analytical Evaluation of the Seismic Resistant Behavior of Masonry Walls. J. Br. Masonry Soc. 1998, 11, 65–101. [Google Scholar]
- Kakaletsis, D.J. Influence of masonry strength and rectangular spiral shear reinforcement on infilled RC frames under cyclic loading. WIT Trans. Model. Simul. 2007, 46, 643–653. [Google Scholar]
- Dukuze, A. Behaviour of Reinforced Concrete Frames Infilled with Brick Masonry Panels. Ph.D. Thesis, The University of New Brunswick, Fredericton, NB, Canada, December 2000. [Google Scholar]
- Žarnić, R. The Analysis of R/C Frames with Masonry Infill under Seismic Actions. Master’s Thesis, FGG, Ljubljana, Slovene, 1985. (In Slovene). [Google Scholar]
- Žarnić, R. Inelastic Response of r/c Frames with Masonry Infill. Ph.D. Thesis, University of Ljubljana, Ljubljana, Slovenia, December 1992. [Google Scholar]
- Al-Chaar, G. Non-ductile behavior of reinforced concrete frames with masonry infill panels subjected to in-plane loading. Ph.D. Thesis, University of Illinois at Chicago, Chicago, IL, USA, December 1998. [Google Scholar]
- Angel, R.; Abrams, D.; Shapiro, D.; Uzarski, J.; Webster, M. Behavior of Reinforced Concrete Frames with Masonry Infills; University of Illinois Engineering Experiment Station, College of Engineering, University of Illinois at Urbana-Champaign: Urbana, IL, USA, February 1994. [Google Scholar]
- Mehrabi, A.B.; Shing, P.B.; Schuller, M.P.; Noland, J.L. Performance of Masonry Infilled R/C Frames under in-Plane Lateral Loads; National Science Foundation: Arlington, VA, USA, October 1994. [Google Scholar]
- Crisafulli, F.J. Seismic Behavior of Reinforced Concrete Sructures with Masony Infills. Ph.D. Thesis, University of Canterbury, Christchurch, New Zealand, December 1997. [Google Scholar]
- Fiorato, A.E.; Sozen, M.A.; Gamble, W.L. Investigation of the Interaction of Reinforced Concrete Frames with Masonry Filler Walls; University of Illinois Engineering Experiment Station, College of Engineering, University of Illinois at Urbana-Champaign: Urbana, IL, USA, November 1970. [Google Scholar]
- Yorulmaz, M.; Sozen, M.A. Behavior of Single-Story Reinforced Concrete Frames with Filler Walls; University of Illinois Engineering Experiment Station, College of Engineering, University of Illinois at Urbana-Champaign: Urbana, IL, USA, May 1968. [Google Scholar]
- Benjamin, J.R.; Williams, H.A. The Behavior of One-Story Brick Shear Walls. J. Struct. Div. 1957, 83, 1–49. [Google Scholar]
- Zovkić, J.; Sigmund, V.; Guljaš, I. Cyclic testing of a single bay reinforced concrete frames with various types of masonry infill. Earthquake Eng. Struct. Dyn. 2012, 41, 41–60. [Google Scholar] [CrossRef]
- Vafaei, M.; Alih, S.C.; Shad, H.; Falah, A.; Halim, N.H.F.A. Prediction of strain values in reinforcements and concrete of a RC frame using neural networks. Int. J. Adv. Struct. Eng. 2018, 10, 29–35. [Google Scholar] [CrossRef]
- Yam, L.H.; Yan, Y.J.; Jiang, J.S. Vibration-based damage detection for composite structures using wavelet transform and neural network identification. Compos. Struct. 2013, 60, 403–412. [Google Scholar] [CrossRef]
- Zang, C.; Imregun, M. Structural damage detection using artificial neural networks and measured FRF data reduced via principal component projection. J. Sound Vib. 2001, 242, 813–827. [Google Scholar] [CrossRef]
- Gnana Sheela, K.; Deepa, S.N. Review on methods to fix number of hidden neurons in neural networks. Math. Prob. Eng. 2013. [Google Scholar] [CrossRef]
- Sonmez, H.; Gokceoglu, C.; Nefeslioglu, H.A.; Kayabasi, A. Estimation of rock modulus: For intact rocks with an artificial neural network and for rock masses with a new empirical equation. Int. J. Rock Mech. Min. Sci. 2006, 43, 224–235. [Google Scholar] [CrossRef]
- Özturan, M.; Kutlu, B.; Özturan, T. Comparison of concrete strength prediction techniques with artificial neural network approach. Build. Res. J. 2008, 56, 23–36. [Google Scholar]
- Seismosoft. SeismoStruct.—A Computer Program for Static and Dynamic Nonlinear Analysis of Framed Structures. Available online: http://www.seismosoft.com (accessed on 30 May 2018).
- Kalman Šipoš, T.; Rodrigues, H.; Grubišić, M. Simple design of masonry infilled reinforced concrete frames for earthquake resistance. Eng. Struct. 2018, 171, 961–981. [Google Scholar] [CrossRef]
- CEN Eurocode 8—Design of Structures for Earthquake Resistance. Part 3: Brussels. 2005. Available online: http://files.isec.pt/DOCUMENTOS/SERVICOS/BIBLIO/Documentos%20de%20acesso%20remoto/Eurocode-8-1-Earthquakes-general.pdf (accessed on 21 April 2018).
- Hendry, A.W.; Malek, M.H. Characteristic compressive strength of brickwork walls from collected test results. Masonry Int. 1986, 7, 15–24. [Google Scholar]
- Kaushik, H.B.; Rai, D.C.; Jain, S.K. Stress-strain characteristics of clay brick masonry under uniaxial compression. J. Mater. Civ. Eng. 2007, 19, 728–739. [Google Scholar] [CrossRef]
- Mander, J.B.; Priestley, M.J.N.; Park, R. Theoretical stress-strain model for confined concrete. J. Struct. Eng. 1988, 114, 1804–1826. [Google Scholar] [CrossRef]
- Menegotto, M.; Pinto, P.E. Method of Analysis for Cyclically Loaded Reinforced Concrete Plane Frames Including Changes in Geometry and Non-Elastic Behavior of Elements under Combined Normal Force and Bending. In Proceedings of the IABSE Symposium on Resistance and Ultimate Deformability of Structures Acted on by Well Defined Repeated Loads, Lisbon, Portugal, 1973; pp. 15–22. [Google Scholar]
- Stafford-Smith, B.; Carter, C. A method for the analysis of infilled frames. Proc. Inst. Civ. Eng. 1969, 44, 31–48. [Google Scholar] [CrossRef]
- Decanini, L.D.; Fantin, G.E. Modelos simplificados de la mampostería incluida en porticos. Caracteristicas de stiffnessy resistencia lateral en estado limite. Jornadas Argentinas de Ingeniería Estructural 1986, 2, 817–836. [Google Scholar]
- Kalman Šipoš, T.; Hadzima-Nyarko, M.; Miličević, I.; Grubišić, M. Structural performance levels for masonry infilled frames. In Proceedings of the 16th European Conference on Earthquake Engineering, Thessaloniki, Greece, 18–21 June 2018; pp. 1–12. [Google Scholar]
- Žarnić, R.; Gostič, S.; Crewe, A.J.; Taylor, C.A. Shaking table tests of 1:4 reduced-scale models of masonry infilled reinforced concrete frame buildings. Earthquake Eng. Struct. Dyn. 2001, 30, 819–834. [Google Scholar] [CrossRef]
- Fardis, M.N. Experimental and Numerical Investigations on the Seismic Response of RC Infilled Frames and Recommendations for Code Provisions; Laboratório Nacional de Engenharia Civil: Lisbon, Portugal, 1996. [Google Scholar]
- Negro, P.; Pinto, A.V.; Verzeletti, G.; Magonette, G.E. PsD test on four-story RC building designed according to Eurocodes. J. Struct. Eng. 1996, 122, 1409–1417. [Google Scholar] [CrossRef]


| Author | Year | Laboratory | Scale | Load | No of Samples |
|---|---|---|---|---|---|
| Combescure [10] | 2000. | LNEC, Lisbon | 1:1.5 | C | 1 |
| Colangelo [11] | 1999. | L’aquila, Italy | 1:2 | C | 11 |
| Cavaleri [12] | 2004. | - | 1:2 | C | 1 |
| Lafuente [13] | 1998. | U.C.V. Caracas, Venezuela | 1:2 | C | 10 |
| Kakaletsis [14] | 2007. | - | 1:3 | C | 2 |
| Dukuze [15] | 2000. | - | 1:3 | M | 23 |
| Žarnić [16,17] | 1985. | Institute for Testing and Research in Materials and Structures (ZRMK), Ljubljana | 1:2 | C | 1 |
| 1992. | 1:3 | 3 | |||
| Al-Charr [18] | 1998. | USACERL, Illinois | 1:2 | M | 2 |
| Angel [19] | 1994. | University of Illinois, Champaign | 1:1 | C | 7 |
| Mehrabi [20] | 1994. | University of Colorado, Boulder | 1:2 | C | 8 |
| M | 3 | ||||
| Crisafulli [21] | 1997. | - | 1:1.33 | M | 2 |
| Fiorato [22] | 1970. | University of Illinois, Urbana | 1:8 | C | 3 |
| Yorulmaz [23] | 1968. | University of Illinois, Urbana | 1:8 | M | 7 |
| Benjamin [24] | 1958. | Stanford University, California | 1:2.94 | M | 5 |
| 1:1.33 | 2 | ||||
| 1:1 | 1 | ||||
| 1:4 | 5 | ||||
| 1:2.38 | 7 | ||||
| Zovkić [25] | 2012. | Faculty of Civil Engineering, Osijek, Croatia | 1:2.5 | C | 9 |
| Statistical Function | Input Data | Output Data | |||||||||
|---|---|---|---|---|---|---|---|---|---|---|---|
| a | b | g | rc | fy (MPa) | λh | V (kN) | IDRc | IDRc | BSc (kN) | BSc (kN) | |
| min | 0.33 | 0.60 | 1 | 0.01 | 203.37 | 1.78 | 0 | 0.01 | 0.03 | 55.9 | 76.95 |
| max | 2.28 | 8.00 | 6.1 | 0.04 | 607 | 8.56 | 2343.75 | 0.55 | 2.91 | 2278.4 | 2563.2 |
| average | 0.74 | 2.04 | 2.01 | 0.02 | 406.94 | 3.68 | 599.06 | 0.13 | 0.72 | 594.64 | 878.22 |
| Parameters | ANN |
|---|---|
| Number of input layer units | 7 |
| Number of hidden layers | 1 |
| Number of hidden layer units | 3, 5, 8 |
| Number of output layer units | 1 |
| Learning rate | 0.01 |
| Performance goal | 0 |
| Maximum number of epochs | 10,000 |
| No | Method and Reference | Nh | Number of Nh |
|---|---|---|---|
| 1. | Hecht-Nielsen (1987) [30] | ≤2·Ni | 14 |
| 2. | Hush (1989) [30] | 3·Ni | 21 |
| 3. | Popovics (1990) [31] | (Ni + No)/2 | 4 |
| 4. | Gallant (1993) [31] | 2·Ni | 11 |
| 5. | Wang (1994) [30] | 2·Ni/3 | 5 |
| 6. | Masters (1994) [30] | (Ni + No)1/2 | 3 |
| 7. | Li (1995) [29] | ((1 + 8 Ni)1/2 − 1)/2 | 3 |
| 8. | Tamura (1997) [29] | Ni + 1 | 8 |
| 9. | Lai (1997) [31] | Ni | 7 |
| 10. | Nagendra (1998) [31] | Ni + No | 8 |
| 11. | Zhang (2003) [29] | 2Ni/n + 1 | 19 |
| 12. | Shibata (2009) [29] | (Ni·No)1/2 | 3 |
| 13. | Sheela (2013) [29] | (4 Ni2 + 3)/(Ni2 − 8) | 5 |
| ANN Model | ||||||
|---|---|---|---|---|---|---|
| Neural Network Label | Learning Algorithm | No. of Hidden Nodes | MAE 1 | RMSE 2 | MAPE 3 (%) | R 4 |
| LM_3 | Levenberg-Marquardt | 3 | 13.709 | 0.926 | 13.157 | 0.829 |
| LM_5 | 5 | 10.0265 | 0.481 | 11.633 | 0.919 | |
| LM_8 | 8 | 12.189 | 0.558 | 17.844 | 0.886 | |
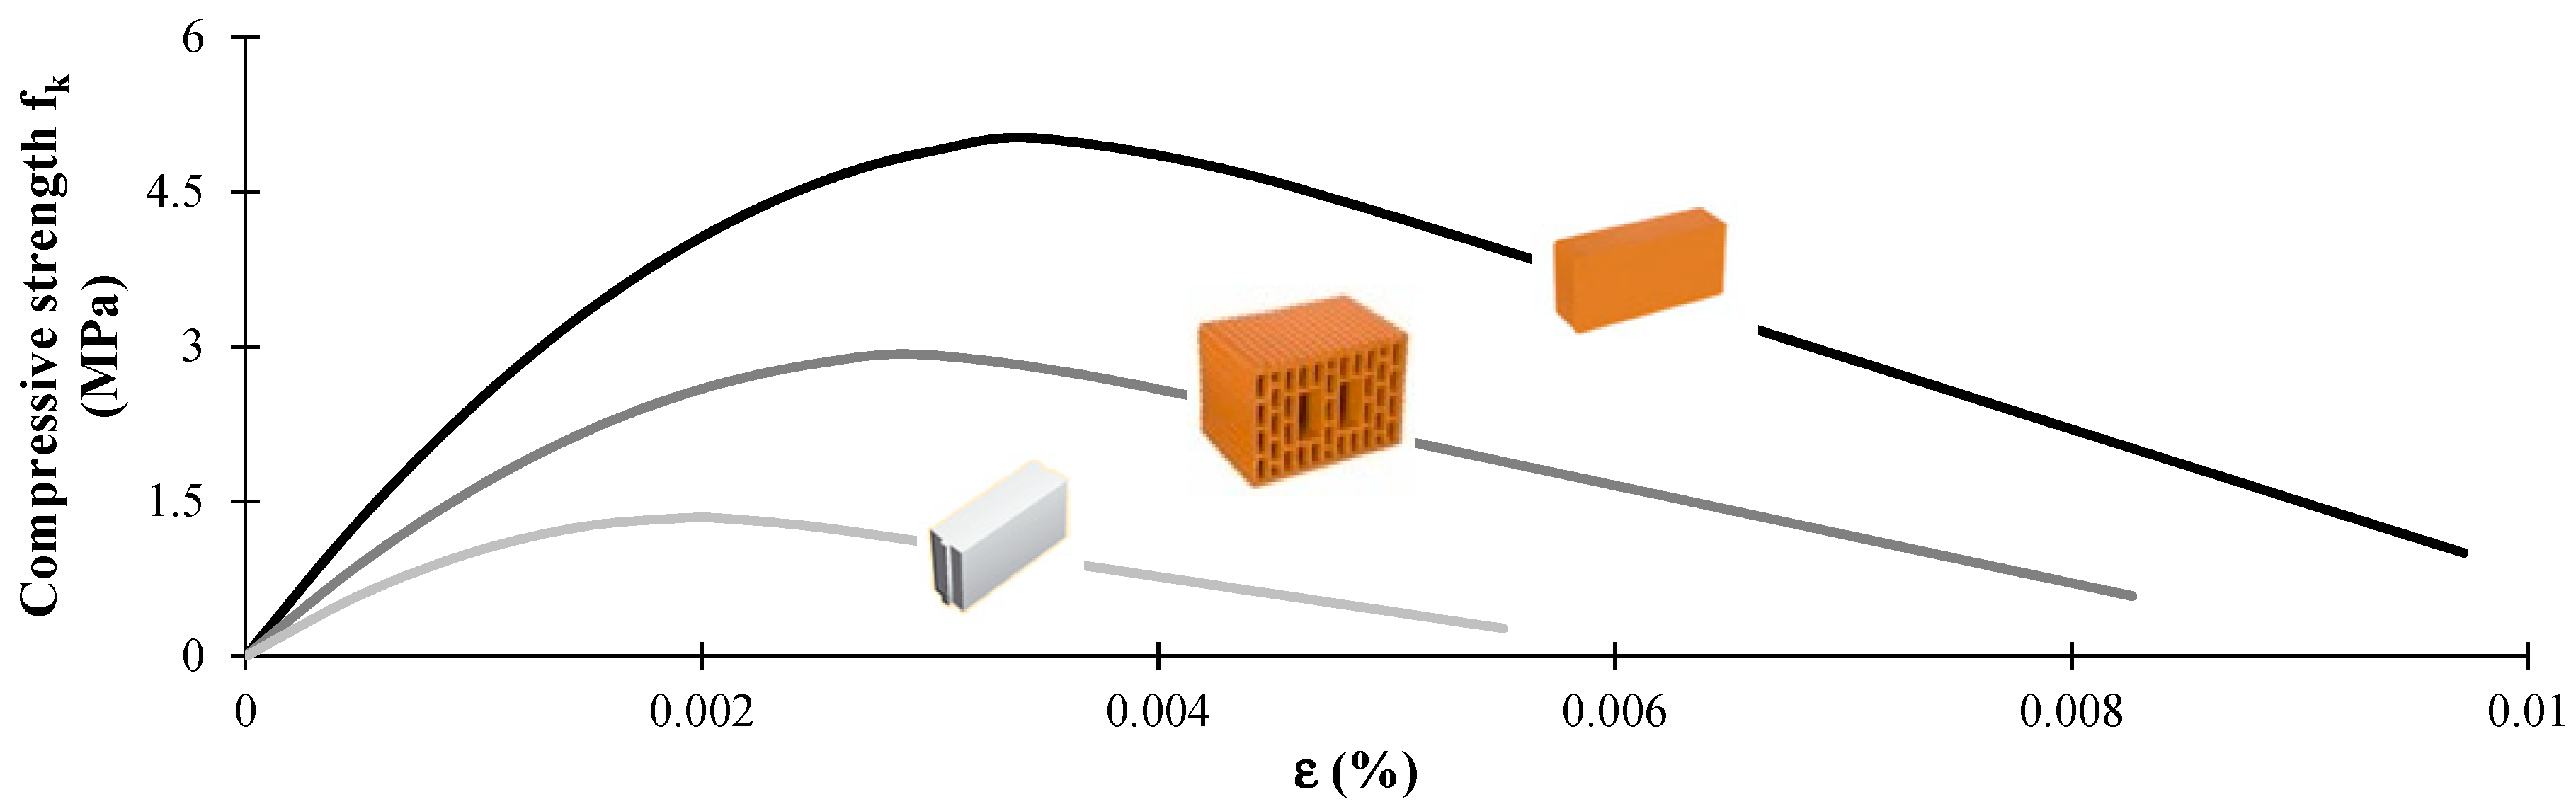
| Masonry Infill Type | Compressive Strength | ||
|---|---|---|---|
| Masonry Unit fb (MPa) | Mortar fm (MPa) | Masonry Infill fk (MPa)–Equation (2) | |
| Weak—ytong block | 3 | 10 | 1.35 |
| Medium—hollow clay block | 10 | 5 | 2.92 |
| Strong—solid brick | 20 | 5 | 5.01 |
| Masonry Infill | fk (MPa) | Ei (MPa) | εm | εu | ε1 | ε2 | λh | fmθ∗ (MPa) | Ams1 (m2) | Ams2 (%Ams1) |
|---|---|---|---|---|---|---|---|---|---|---|
| A | 2.92 | 1610 | 0.0030 | 0.0083 | 0.001 | 0.0045 | 2.47 | 0.273 | 0.494 | 76.37 |
| B | 2.51 | 0.563 | 76.17 | |||||||
| C | 2.48 | 0.637 | 76.28 |
| Capacity Curve Data | A_IF | B_IF | C_IF | A_NN | B_NN | C_NN |
|---|---|---|---|---|---|---|
| IDRc (%) | 0.04 | 0.054 | 0.067 | 0.038{5} | 0.053{2} | 0.066{1} |
| IDRm (%) | 0.49 | 0.50 | 0.51 | 0.46{8} | 0.5{2} | 0.54{6} |
| BSc (kN) | 357.92 | 447.04 | 545.96 | 363{2} | 462{3} | 565{3} |
| BSm (kN) | 663.83 | 719.69 | 815.47 | 658{1} | 742{3} | 818{1} |
| Frame Type | Frame Combination | IDRc (%) | IDRm (%) | BSc (kN) | BSm (kN) |
|---|---|---|---|---|---|
| A | AA_IF | 0.053 | 0.47 | 656.83 | 1129.91 |
| AAA_IF | 0.067 | 0.47 | 996.97 | 1617.87 | |
| AA_BA (3)-(6) | 0.049{5} | 0.46{1} | 689.7{9} | 1118.6 {2} | |
| AAA_BA (3)-(6) | 0.061{10} | 0.46{2} | 1016.4 {2} | 1579.2 {2} | |
| B | BB_IF | 0.08 | 0.48 | 846.43 | 1253.28 |
| BBB_IF | 0.093 | 0.47 | 1219.77 | 1827.99 | |
| BB_BA (3)-(6) | 0.069{14} | 0.5{4} | 877.8{4} | 1261.4{1} | |
| BBB_BA (3)-(6) | 0.085{9} | 0.5{6} | 1293.6{6} | 1780.8{3} | |
| C | CC | 0.08 | 0.55 | 1005.25 | 1386.18 |
| CCC | 0.107 | 0.55 | 1405.98 | 2046.39 | |
| CC_BA (3)-(6) | 0.086{7} | 0.54{2} | 1045.25{4} | 1406.96{2} | |
| CCC_BA (3)-(6) | 0.1056{1} | 0.54{2} | 1525.5{9} | 2045{1} |
| Frame Type | Frame Combination | IDRc (%) | IDRm (%) | BSc (kN) | BSm (kN) |
|---|---|---|---|---|---|
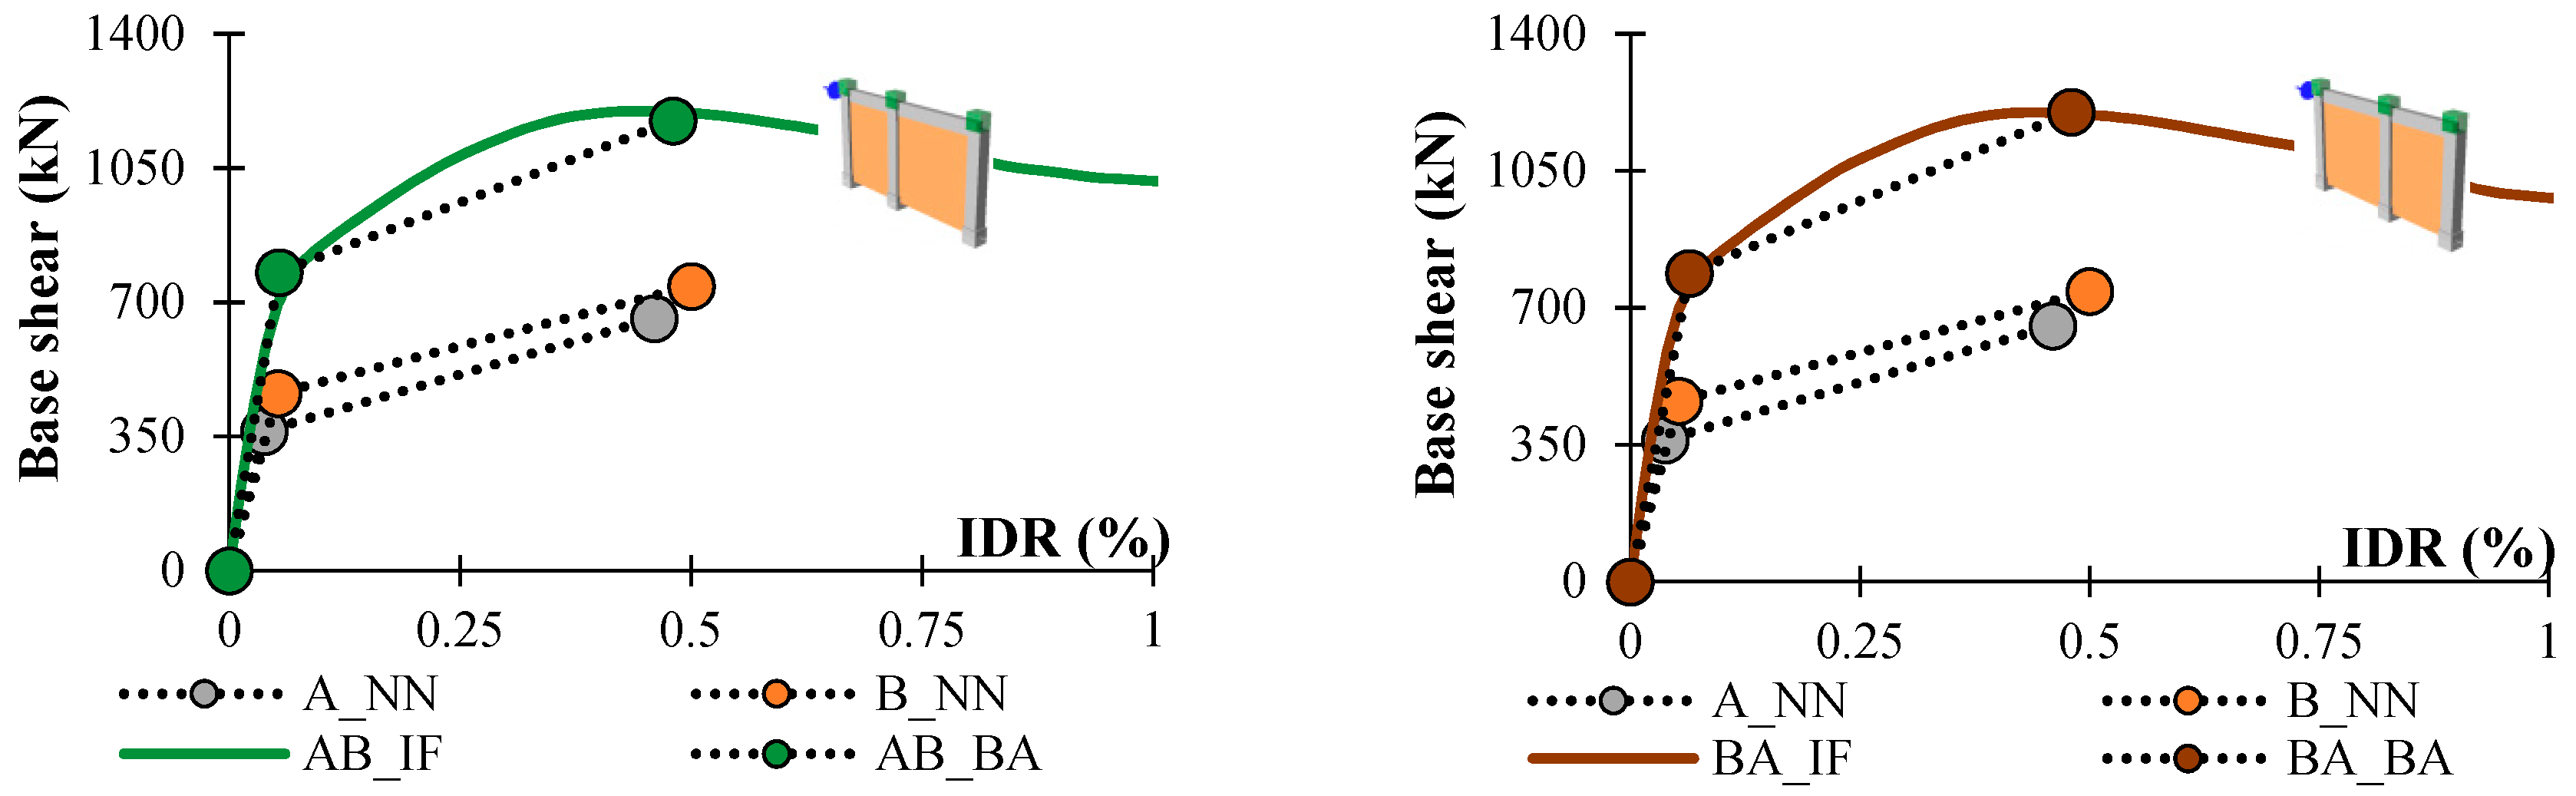
| A/B | AB_IF | 0.06 | 0.44 | 764.33 | 1198.25 |
| BA_IF | 0.06 | 0.44 | 765.62 | 1198.61 | |
| AB_BA (7)-(10) | 0.054{10} | 0.48{9} | 777.8{2} | 1173.4{2} | |
| BA_BA (7)-(10) | 0.064{7} | 0.48{9} | 787.8{3} | 1199.8{0} | |
| A/C | AC_IF | 0.067 | 0.48 | 829.41 | 1292.75 |
| CA_IF | 0.08 | 0.48 | 898.88 | 1291.81 | |
| AC_BA (7)-(10) | 0.058{13} | 0.5{4} | 870.5{5} | 1226.6{5} | |
| CA_BA (7)-(10) | 0.077{3} | 0.5{4} | 890.8{1} | 1275.8{1} | |
| B/C | BC_IF | 0.08 | 0.49 | 934.02 | 1359.93 |
| CB_IF | 0.08 | 0.49 | 986.58 | 1357.18 | |
| BC_BA (7)-(10) | 0.073{9} | 0.52{6} | 970.5{4} | 1314.6{3} | |
| CB_BA (7)-(10) | 0.082{2} | 0.52{6} | 980.8{1} | 1337.4{1} |
| Frame Type | Frame Combination | IDRc (%) | IDRm (%) | BSc (kN) | BSm (kN) |
|---|---|---|---|---|---|
| A/B/C | ABC_IF | 0.08 | 0.45 | 1197.65 | 1848.31 |
| ABC_BA (7)-(10) | 0.073{8} | 0.5{11} | 1286.3{7} | 1746{6} | |
| BCA_IF | 0.085 | 0.47 | 1275.44 | 1857.63 | |
| BCA_BA (7)-(10) | 0.084{1} | 0.5{6} | 1296.3{2} | 1772.4{5} | |
| CAB_IF | 0.09 | 0.48 | 1285.47 | 1840.39 | |
| CAB_BA (7)-(10) | 0.093{4} | 0.5{4} | 1306.6{2} | 1795.2{3} |
| Buildings | a | b | g | rc | fy | λh | N | |
|---|---|---|---|---|---|---|---|---|
| IFS | 0.87 | 1 | 2.66 | 1.76 | 240 | 2.65 | 21.2 | |
| Patras | 4m | 0.875 | 0.76 | 3.57 | 2.00 | 555.0 | 2.22 | 194.9 |
| 6m | 0.583 | 0.76 | 3.57 | 2.00 | 555.0 | 2.12 | 146.7 | |
| EC8 | 4m | 0.875 | 0.76 | 3.57 | 2.35 | 553.5 | 2.47 | 233.3 |
| 6m | 0.583 | 0.76 | 3.57 | 2.35 | 553.5 | 2.38 | 309.5 | |
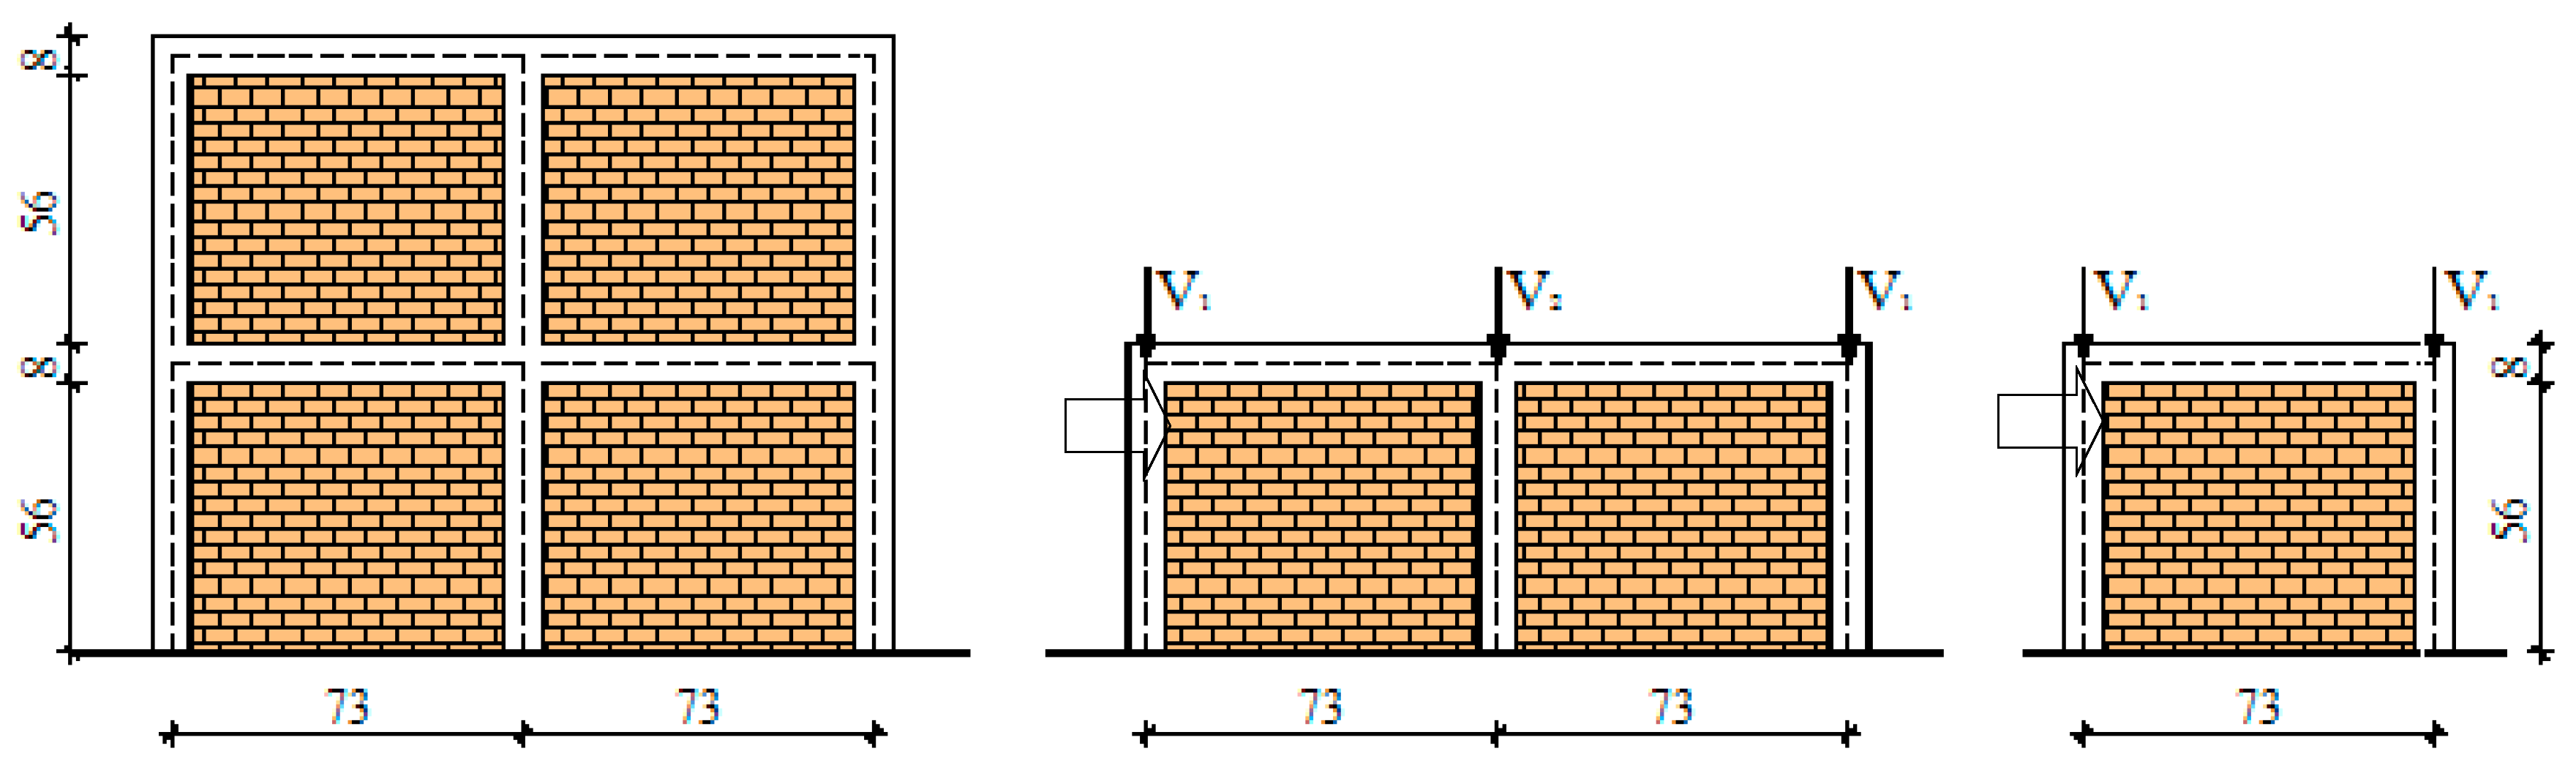
| Buildings | V1 (kN) | V2 (kN) | V3 (kN) |
|---|---|---|---|
| IFS | 21.2 | 21.2 | - |
| Patras | 194.85 | 292.49 | 146.66 |
| EC8 | 233.26 | 464.02 | 309.52 |
| Buildings | Approximation | IDRc (%) | IDRm (%) | BSc (kN) | BSm (kN) |
|---|---|---|---|---|---|
| IFS | IFS_NN | 0.08 | 0.65 | 7.8 | 10.3 |
| IFS_IF | 0.104 | 0.65 | 14.82 | 17.51 | |
| IFS_BA (7)-(10) | 0.104{0} | 0.67{3} | 13.7{8} | 17.13{2} | |
| Patras | Patras 6m_NN | 0.09 | 0.7 | 290 | 420 |
| Patras 4m_NN | 0.05 | 0.54 | 250 | 380 | |
| Patras_IF | 0.11 | 0.69 | 446.24 | 711.25 | |
| Patras_BA (7)-(10) | 0.105{5} | 0.62{9} | 515{14} | 686{4} | |
| EC8 | EC8 4m_NN | 0.05 | 0.54 | 250 | 380 |
| EC8 6m_NN | 0.07 | 0.73 | 290 | 450 | |
| EC8_IF | 0.071 | 0.635 | 511 | 695 | |
| EC8_BA (7)-(10) | 0.08{11} | 0.615{3} | 451.15{13} | 701.65{1} |
© 2019 by the authors. Licensee MDPI, Basel, Switzerland. This article is an open access article distributed under the terms and conditions of the Creative Commons Attribution (CC BY) license (http://creativecommons.org/licenses/by/4.0/).
Share and Cite
Kalman Šipoš, T.; Strukar, K. Prediction of the Seismic Response of Multi-Storey Multi-Bay Masonry Infilled Frames Using Artificial Neural Networks and a Bilinear Approximation. Buildings 2019, 9, 121. https://doi.org/10.3390/buildings9050121
Kalman Šipoš T, Strukar K. Prediction of the Seismic Response of Multi-Storey Multi-Bay Masonry Infilled Frames Using Artificial Neural Networks and a Bilinear Approximation. Buildings. 2019; 9(5):121. https://doi.org/10.3390/buildings9050121
Chicago/Turabian StyleKalman Šipoš, Tanja, and Kristina Strukar. 2019. "Prediction of the Seismic Response of Multi-Storey Multi-Bay Masonry Infilled Frames Using Artificial Neural Networks and a Bilinear Approximation" Buildings 9, no. 5: 121. https://doi.org/10.3390/buildings9050121