1. Introduction
On average, more than 1000 tornadoes are reported annually nationwide; however, regions in the Midwest and South experience a very high frequency of tornadoes [
1]. Tornadoes often result in significant injuries and deaths, as well as significant financial losses. In an average year, 80 deaths and 1500 injuries are reported due to tornadoes [
2]. According to a 2009 study, the average annual losses resulting from tornadoes are estimated to be $982 million. This is more than double the previous government estimates of $462 million [
3].
One of the most destructive and deadly tornado years in U.S. history was 2011 which set numerous records. Several studies focusing on that season as a whole have been presented in papers over the last year [
4]. There were 1691 tornadoes reported in 2011 as compared to the previous decade average of 1274. In the month of April, 758 tornadoes were reported, which set the record for the highest number of tornadoes observed in a single month [
5]. The May 22nd tornado in Joplin, Missouri resulted in a record setting $3 billion in damage. Similarly, since standardization of tornado reporting began in 1950, the Joplin tornado broke the record for the most fatalities from a single tornado with 158 deaths. Total damages from tornado outbreaks in 2011 amounted to $28 billion [
6].
The literature is substantial with meteorological and structural engineering studies focusing on the formation and occurrence of tornadoes, tornado dynamics, wind pressure distribution, and missile risk analysis [
7,
8]. Over the past several decades a number of studies have also focused on forensic investigations and design of structures against tornadoes [
9,
10,
11].
Light-frame wood construction comprises the majority (approximately 90%) of the residential building stock in the U.S. [
12]. These types of structures are extremely susceptible to natural hazards, especially tornadoes, due to their light weight. Current structural design codes do not consider design against tornadoes mainly due to the fact that they possess such a low occurrence probability compared with the high cost of retrofitting against a strong tornado. There is a very low probability of a structure being directly impacted by a tornado when considering the area of a tornado compared to the area of the U.S. Therefore, buildings in the U.S. are typically designed using loads from ASCE Standard 7 which were developed for straight line winds. However, tornadoes have been shown to produce uplift pressures that are significantly higher than straight line winds [
13].
In early 2012 a winter tornado struck a two-story, single family house near the Koffman area of Tuscaloosa County, Alabama, in the Southeastern United States. After the building was hit by the tornado, a very thorough site investigation was conducted by the authors to determine the manner in which the roof system failed. This structure is used as an illustrative example in this paper to demonstrate the application of the fragility methodology to probabilistically study loss of a roof system in a residential wood-frame structure under tornado loads. In addition, fragilities can be used as a supplement to the Enhanced Fujita (EF) ratings provided by National Weather Service (NWS) meteorologists when unique structural (or other) conditions exist.
2. Background
2.1. Tornado Forces on a Structure
When subjected to wind loads, structures experience simultaneous uplift and lateral forces, as shown in
Figure 1. Lateral forces are resisted by the main wind force resisting system (MWFRS), while uplift forces are transferred from roof sheathing to roof-to-wall connection and finally to the foundation. A main wind-force resisting system is defined as the assemblage of structural elements that provide support and stability for the overall structure. Components and cladding, on the other hand, are the part of the building envelope that transfers the load to the MWFRS.
Figure 1.
Wind forces on a structure.
Figure 1.
Wind forces on a structure.
The effect of straight line winds on structures has been studied extensively and has led to the development of the current design provisions [
14]. However, research has been less robust in terms of understanding the effects of tornadoes on structures with only a limited number of studies conducted on this topic [
13,
15,
16,
17]. Many of these studies present a combination of theoretical and experimental work with the main purpose of comparing the effects of tornadoes versus straight line winds. In all the studies, the authors concluded that, for the same reference wind speed, tornadoes result in higher wind loads (approximately 1.5–2 times) than straight winds.
More specifically, Haan
et al. [
13] simulated tornadoes on a one-story, gable roof building and compared the results with the wind provisions of ASCE 7-05. The authors found that the uplift coefficients for tornadoes exceeded the values specified in the provisions by a factor of 1.8–3.2 for the MWFRS. For components and cladding, the pressure coefficients obtained from the tornado simulations were found to be 1.4–2.4 times those of a straight line wind for the same reference wind velocity. Results obtained by Haan
et al. are exclusively used as a basis of comparison between straight winds, e.g., hurricane, and tornado winds. These results were combined with the ASCE 7 wind provisions to form the basis for the tornado wind analysis in the present study.
2.2. Wind Fragility
The probability of a function or a limit state subjected to loading can be expressed as
where
P(
D = x) is the probability that a demand will have a value of
x and
P(
LS|D = x) is the conditional probability of the function. Demand can be any random variable describing intensity based on the type of analysis performed, e.g., 3-s gust wind speed for wind analysis, or spectral acceleration for earthquake analysis. For example, for wind speed, it is the probability that the wind speed, D, will have a value of 100 Km/h (62 mph). The conditional probability of the limit state given a certain demand is defined as the fragility [
12,
18,
19]. The limit state can be any type of performance expectation that is defined in terms of component or system response. For example, the limit state investigated in this study is the failure of roof-to-wall connections. Equation 1 shown above presents a fully coupled risk analysis; however, often structural engineers are more interested in determining the probability of failure given a certain demand, which is termed a fragility.
The fragility of a structural system or component is often modeled using a lognormal distribution [
12,
18,
19], which can be written as
where Ф(.) is the standard normal cumulative distribution function;
λR represents the logarithmic median of capacity
R; and
ξR is the logarithmic standard deviation of capacity
R.
Figure 2 shows a suite of fragilities that is provided only for illustrative purposes. Each curve corresponds to a certain component. The fragilities are developed as a function of a certain demand, which in this study is the 3-s gust wind speed.
Figure 2.
Suite of fragilities for illustration.
Figure 2.
Suite of fragilities for illustration.
3. Case Study
On January 23, 2012 a tornado touched down near the intersection of Alabama Hwy 171 and Koffman Ranch Rd. and struck a single family residence located in Tuscaloosa County, Alabama. It started around 2:42 am and ended at 2:43 am with a damage path length of approximately 0.74 km (0.46 miles) and a damage width of 366 m (400 yards) at its widest point [
20]. The house is a two story building built in 2005 and has approximately 336 sq.m (3614 sq.ft) of living area. Properties of the structure are given in
Table 1 and the building plan and elevations are shown in
Figure 3. The roof was constructed of LP 210 Joists spaced at 0.4 m (16 inch) on center. The joist were connected to the exterior walls using (5)10d toe nails while H3 hurricane clips with 1 inch. drywall screws were used at interior wall to joist connections.
Table 1.
Properties of the structure.
Table 1.
Properties of the structure.
| Properties of the structure |
|---|
| Plan dimension | 7.3 m × 7.9 m (24.0 ft × 26.0 ft) |
| No. of stories | 2 |
| Roof type | mono slope |
| Roof slope | 3:12 ( ~13◦) |
| Roof framing spacing | 0.4 m o.c. (16” o.c.) |
| Overhang | 0.9 m (3 ft) |
Figure 3.
Building plan and elevation (All dimensions are given in meters).
Figure 3.
Building plan and elevation (All dimensions are given in meters).
As mentioned previously, a detailed site inspection was conducted to investigate the loss of the roof system for the structure.
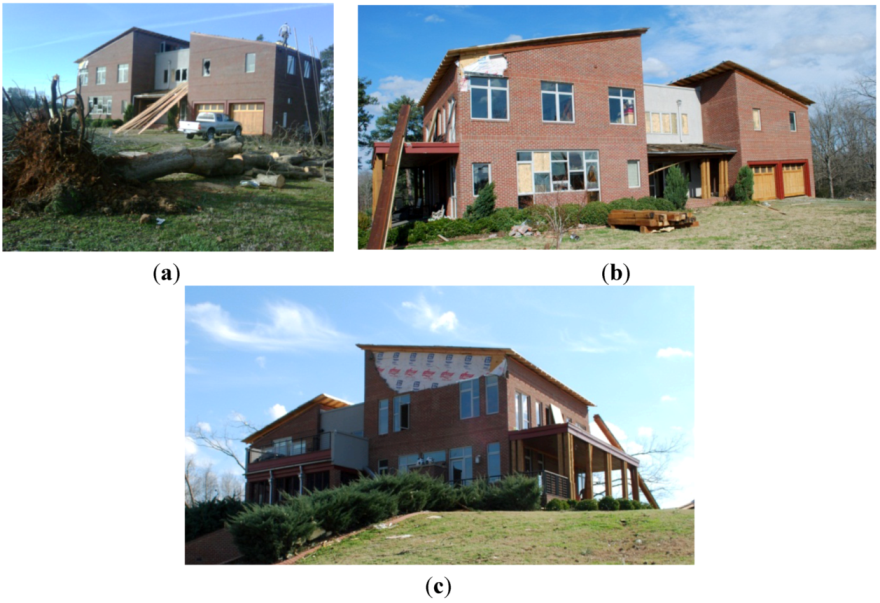
Figure 4 provides an overview of the site along with the extent and type of damage sustained. The entire roof system was removed without any further damage to the roof sheathing. Windows were broken due to wind-borne debris and some walls were partially damaged due to roof failure which are shown in
Figure 5(a–c). In addition to structural damage to the building, trees around the structure also sustained damage with several trees snapped off at the trunk and several others uprooted, which is typical in moderate to strong tornadoes.
Figure 4.
Site plan and damage overview.
Figure 4.
Site plan and damage overview.
Figure 5.
(a) Roof entirely removed; (b) Windows broken due to wind-borne debris; (c) Walls partially damaged.
Figure 5.
(a) Roof entirely removed; (b) Windows broken due to wind-borne debris; (c) Walls partially damaged.
4. Enhanced Fujita Scale
The Enhanced Fujita (EF) scale [
21] is a method used to rate the intensity of tornadoes based on observed damages to structural and non-structural components following a wind event. The EF scale defines a number of Damage Indicators (DI) along with the descriptions for different Degrees of Damage (DOD) associated with the DIs. The DODs range from visible damage to total destruction.
Table 2 shows the EF ratings and the estimated range of wind speeds associated with them.
Table 2.
Enhanced Fujita (EF) scale for tornado damage.
Table 2.
Enhanced Fujita (EF) scale for tornado damage.
| EF Scale |
|---|
| EF rating | 3 Second gust, Km/h (mph) |
|---|
| 0 | 105–138 (65–85) |
| 1 | 139–178 (86–110) |
| 2 | 179–219 (111–135) |
| 3 | 220–267 (136–165) |
| 4 | 268–322 (166–200) |
| 5 | Over 323 (200) |
5. Fragility Development
As mentioned previously, uplift forces on a structure are transferred from roof sheathing to roof-to-wall connections and then to the foundation. A continuous vertical load path is important for structural stability. The vertical load path is analogous to a series system, meaning that these elements define the full vertical load path from roof to foundation. Since the roof sheathing and the walls did not sustain any significant damage based on visual inspection, the roof-to-wall connection failure was determined to be the main cause of failure. Therefore, fragilities were developed for this component of the vertical load path under the calculated uplift forces. To perform a fragility analysis, the limit states must be defined and statistics for different parameters are obtained.
5.1. Limit States
Wind induced uplift forces can result in failure of the roof-to-wall connections. Structural performance of the roof-to-wall connection is influenced by three main parameters: dead load, wind load, and resistance, thus the limit state can be written as
where
D is the dead load;
W is the uplift force due to wind acting on the roof-to-wall connection; and
R is the uplift resistance capacity of the roof-to-wall connection. From the equation, it is observed that the dead load counteracts the wind load indicating its beneficial effect on performance. Based on Equation 3, a fragility curve is obtained using the conditional probability of
g(
x)
< 0 [
19].
5.2. Wind Load Statistics
Wind loading on a structure can be expressed using the following equation [
14]:
where
qh is the base pressure evaluated at mean roof height;
G is defined as the gust factor;
Cp is an external pressure coefficient; and
Cpi is the internal pressure coefficient. The product of the gust factor and pressure coefficient is treated as a single variable and can be found in ASCE 7-10 [
14]. The base pressure is calculated using the following equation:
where
Kc is the tornado amplification factor which is a dimensionless quantity based on the work discussed earlier;
Kz is the velocity pressure exposure coefficient;
Kd is the wind directionality factor;
Kzt is a the topographic factor;
V is the basic wind speed (3-s gust wind speed at 10 m (33 ft) above the ground in an open terrain); and
I is the importance factor.
For the purpose of reliability analysis, each of the variables defined in Equations 4 and 5 are treated as random variables determined using information provided by Ellingwood and Tekie [
22] and Lee and Rosowsky [
19]. Statistics for wind load parameters are summarized in
Table 3 below. The wind directionality factor,
Kd, is taken as unity assuming that the wind direction is known. The topographic factor,
Kzt, is also set equal to unity so the results will be independent of the local topography. For the purpose of this study, the tornado amplification factor,
Kc, is treated as a random variable with a uniform distribution. The roof-to-wall connection is modeled as MWFRS; therefore, it is modeled as a uniformly distributed random variable in the range of 1.8 to 3.2.
The internal pressure condition is assumed to remain “enclosed” throughout the entire analysis. A “partially enclosed” condition is assumed to occur only if elements of the building envelope, such as doors or windows, are breached. In this case, the building envelope is assumed to remain intact. The analysis performed by Haan
et al. [
13] was based on an open terrain condition; therefore, the velocity pressure exposure coefficient,
Kz, in this study is only evaluated for Exposure C (the open terrain condition). In addition, in contrast to straight line winds, tornado winds are not dependent on the fetch length, thus exposure type does not have an effect.
Table 3.
Summary of wind load statistics.
Table 3.
Summary of wind load statistics.
| Parameters | Category | Nominal | Mean | COV | Distribution type |
|---|
| Kc | Tornado wind amplificationFactor-MWFRS | 1.8–3.2 | - | - | Uniform |
| GCpi* | Enclosed | 0.18 | 0.15 | 0.33 | Normal |
| partially enclosed | 0.55 | 0.46 | 0.33 |
| Kz | Exposure C | 0.9 | 0.84 | 0.14 | Normal |
| GCp | - | 1.04 | 0.83 | 0.17 | Normal |
| Kd | deterministic (1.0) |
| Kzt | deterministic (1.0) |
| I | deterministic (1.0) |
5.3. Dead Load Statistics
The dead load is defined as the self-weight of the members and is assumed to be constant in time. Dead load statistics are summarized in
Table 4. For the roof-to-wall connection, the dead load is taken as 0.717 kPa (15 psf) with a COV of 0.10.
Table 4.
Summary of dead load statistics.
Table 4.
Summary of dead load statistics.
| Summary of dead load statistics |
|---|
| Connection type | Roof-to-wall connection |
| Mean | 0.717 kPa |
| (15 psf) |
| COV | 0.10 |
| Distribution type | Normal |
| Source | [12] |
5.4. Roof-to-Wall Connection Resistance
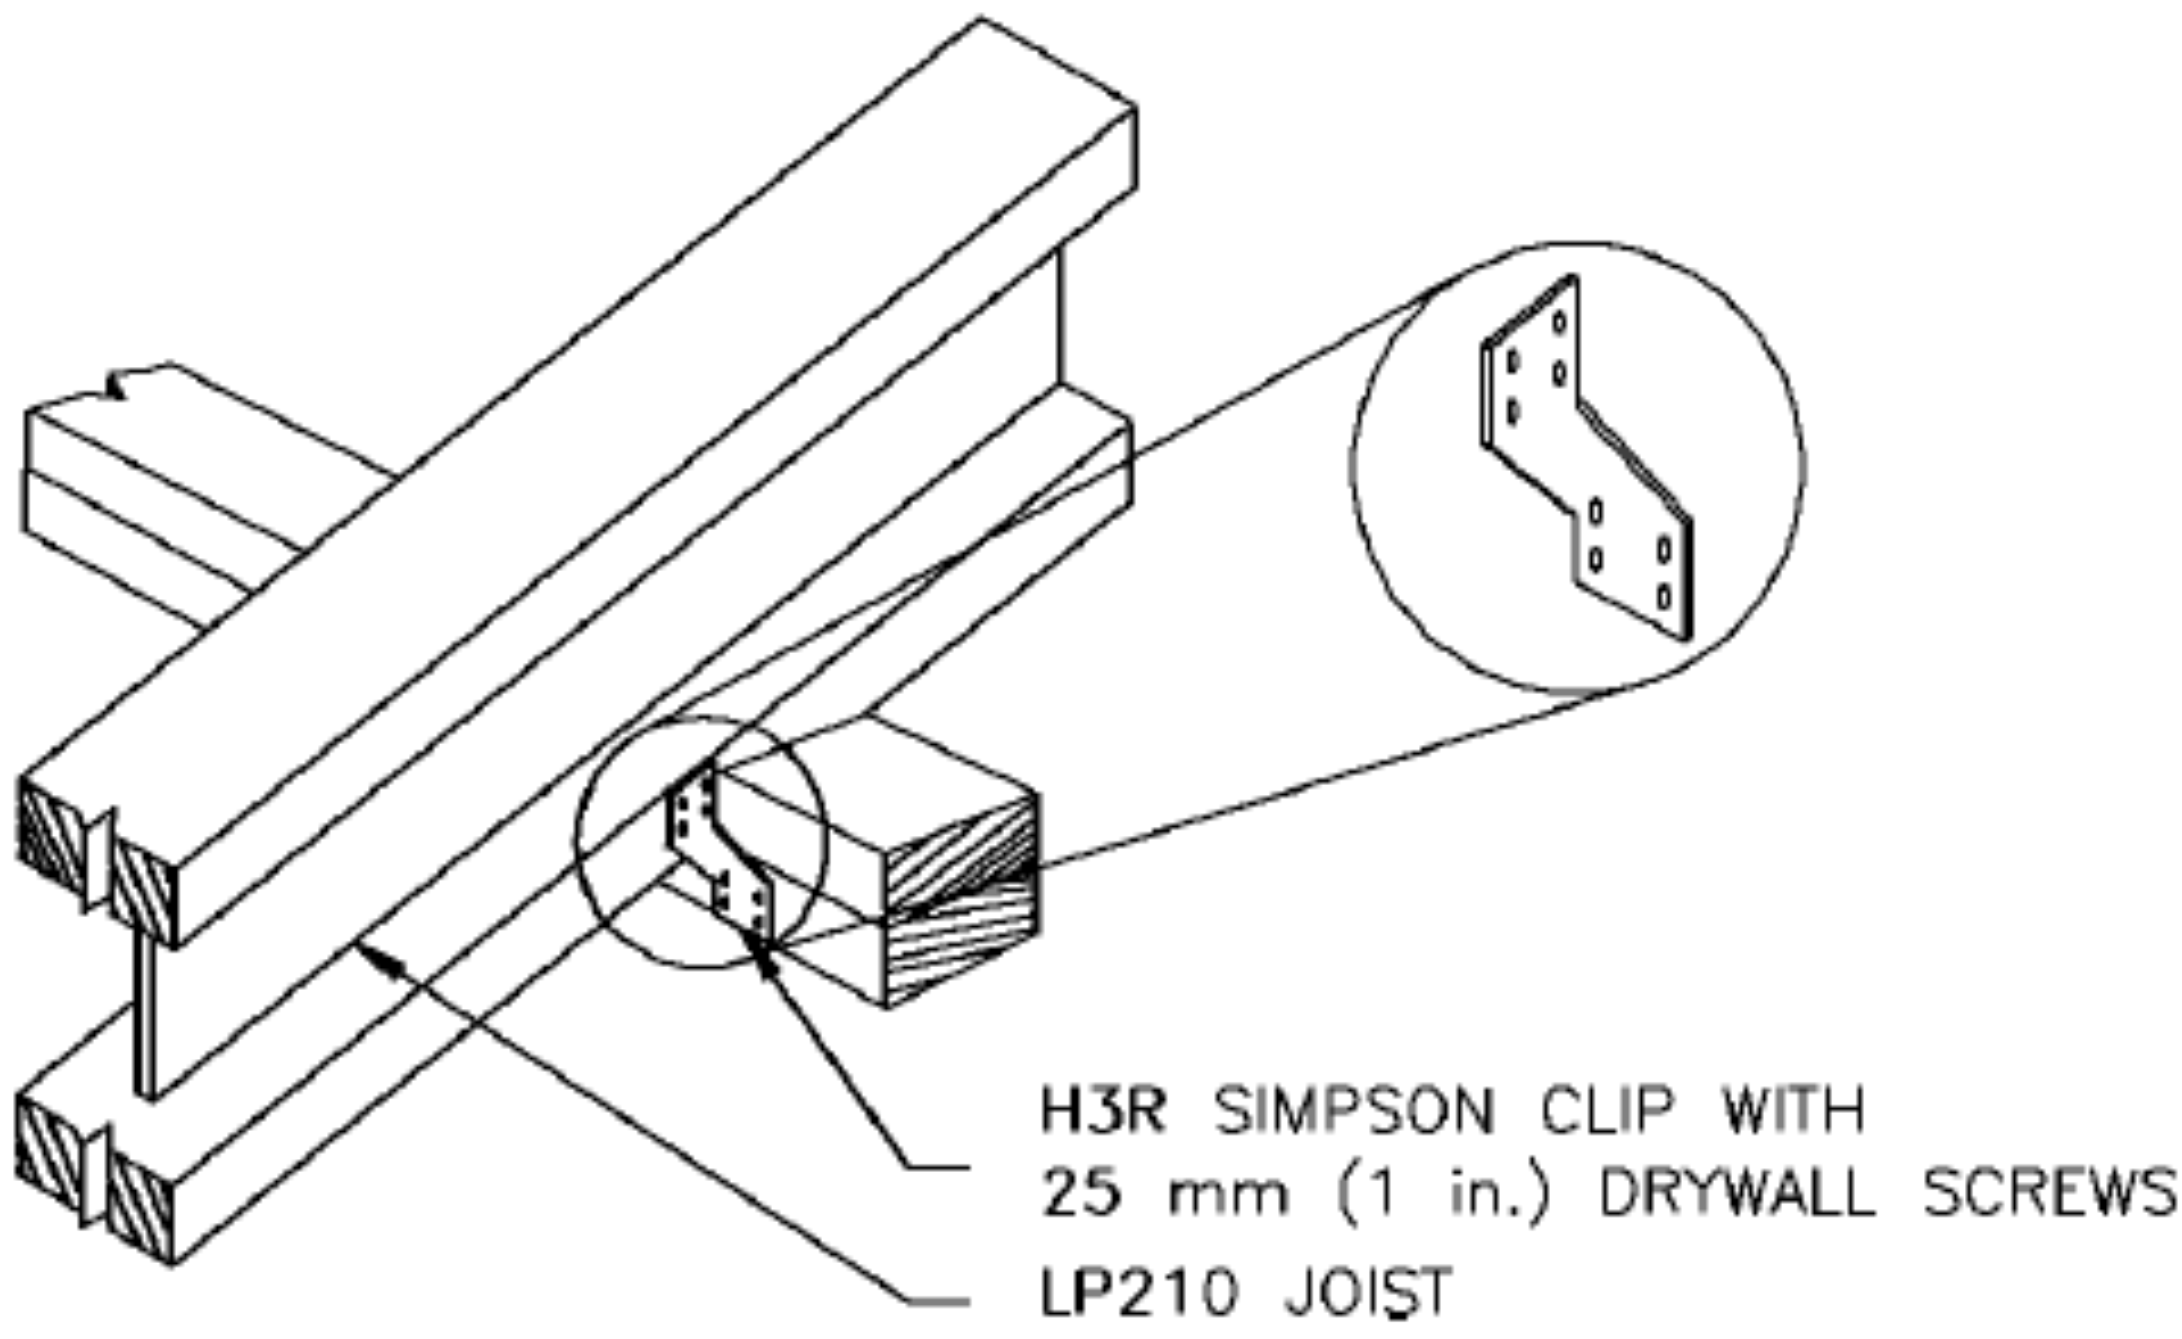
Two types of roof-to-wall connections were observed during the site inspection, (5)10d and H3 hurricane clips. In the first type of connection, 10d common nails (3.76 mm (0.148 inch) diameter × 76 mm (3 in.) long) were used to connect the joists to the top plate of the exterior walls. In the second type, the joists were connected to the interior wall using an H3 hurricane clip; a schematic for this type of connection is shown in. This hardware is installed per manufacturer recommendations. The ultimate capacity of an H3 hurricane clip was not specifically known, only the design capacity. However, the ultimate and design capacities for an H2.5 hurricane clip were both known. Therefore, the ultimate capacity of the H3 clip was computed by multiplying its design capacity by the ratio of the ultimate to design capacity of the H2.5 clip. Overstrength consistency was assumed from the product manufacturer. In a similar manner, for (5)10d roof-to-wall connection, the mean capacity was obtained using the data for (2)16d fasteners. In both cases, Spruce-Pine-Fir (SPF) was used in the analysis. This procedure of using the ratio is explained Equation 6. The combined capacity and then the coefficient of variation (COV) for the combined section is presented in Equation 7. Specifically, the combined connection statistics were obtained by statistically combining the capacities of the H3 clip and the (5)10d connection. The mean was obtained by summing the means and the variance was obtained by taking the square root of the sum of the squares of variances for all the connections. This is possible since they are being modeled as normal variables. This is then used in developing the fragility for the combined resistance of these connections. The statistics for roof-to-wall connections used in the analysis are provided in
Table 5.
Table 5.
Roof-to-wall connection resistance statistics.
Table 5.
Roof-to-wall connection resistance statistics.
| Connection type | Mean | COV | Distribution type | Source |
|---|
| H3 clip | 5.12 kN | 0.12 | Normal | Equation 6 and [12] |
| (1150.2 lbs) |
| (5)10d toe nails | 1.56 kN | 0.16 | Normal | [4] |
| (351.6 lbs) |
| Combined | 8.2 kN | 0.09 | Normal | Equation 7 |
| (1805.4 lbs) |
Figure 6.
Joist connection to the top plates.
Figure 6.
Joist connection to the top plates.
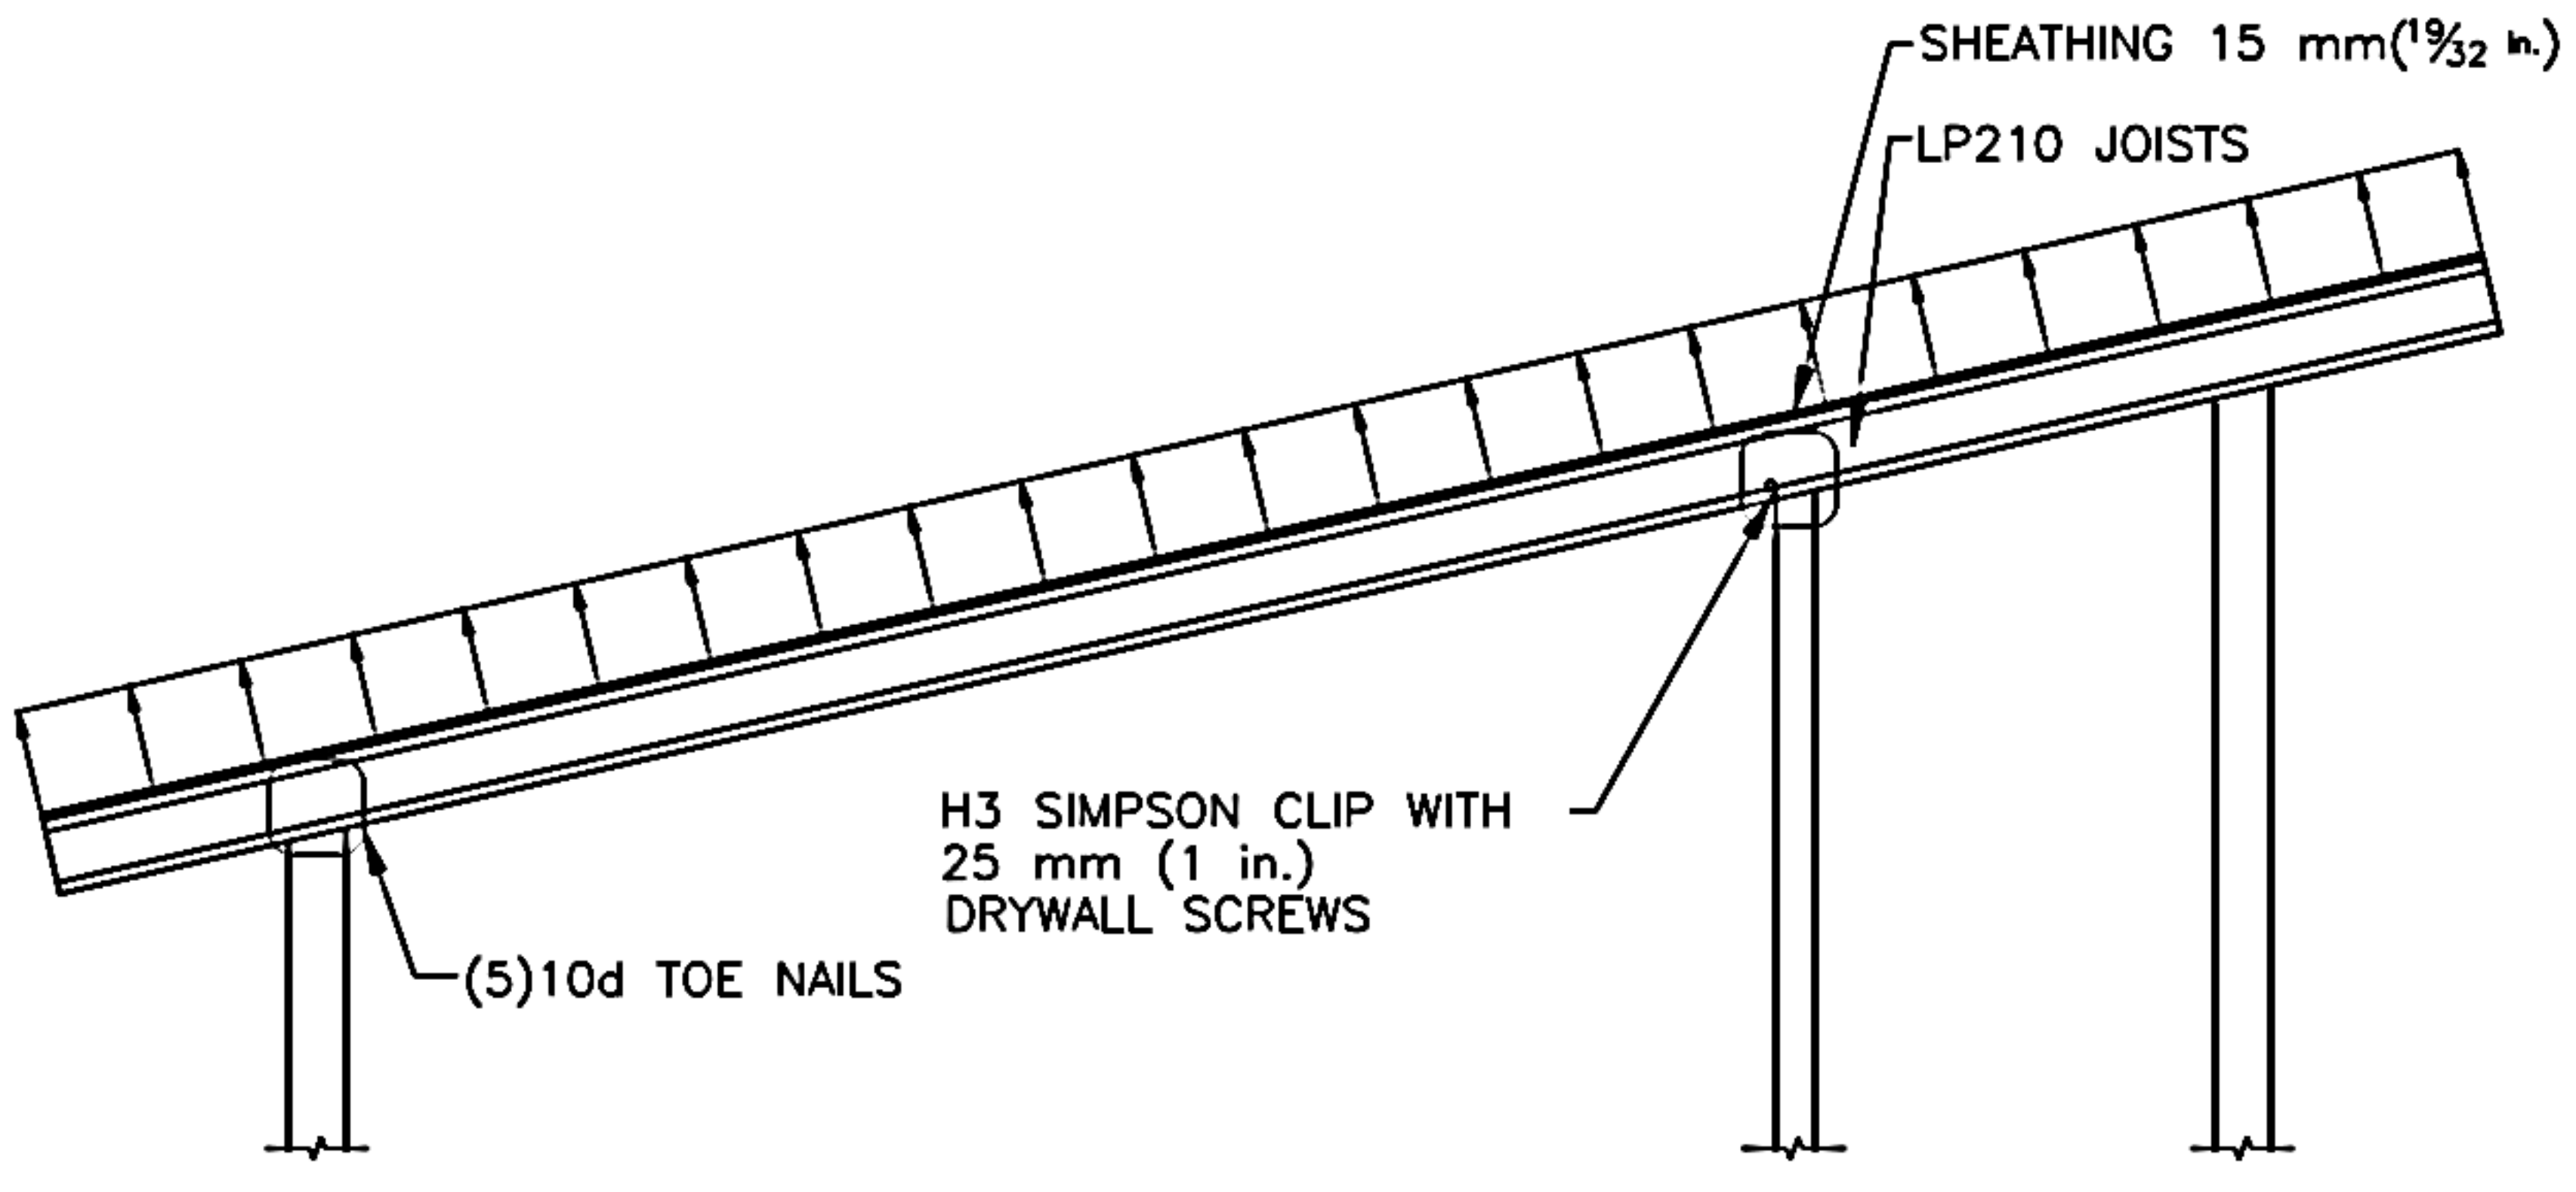
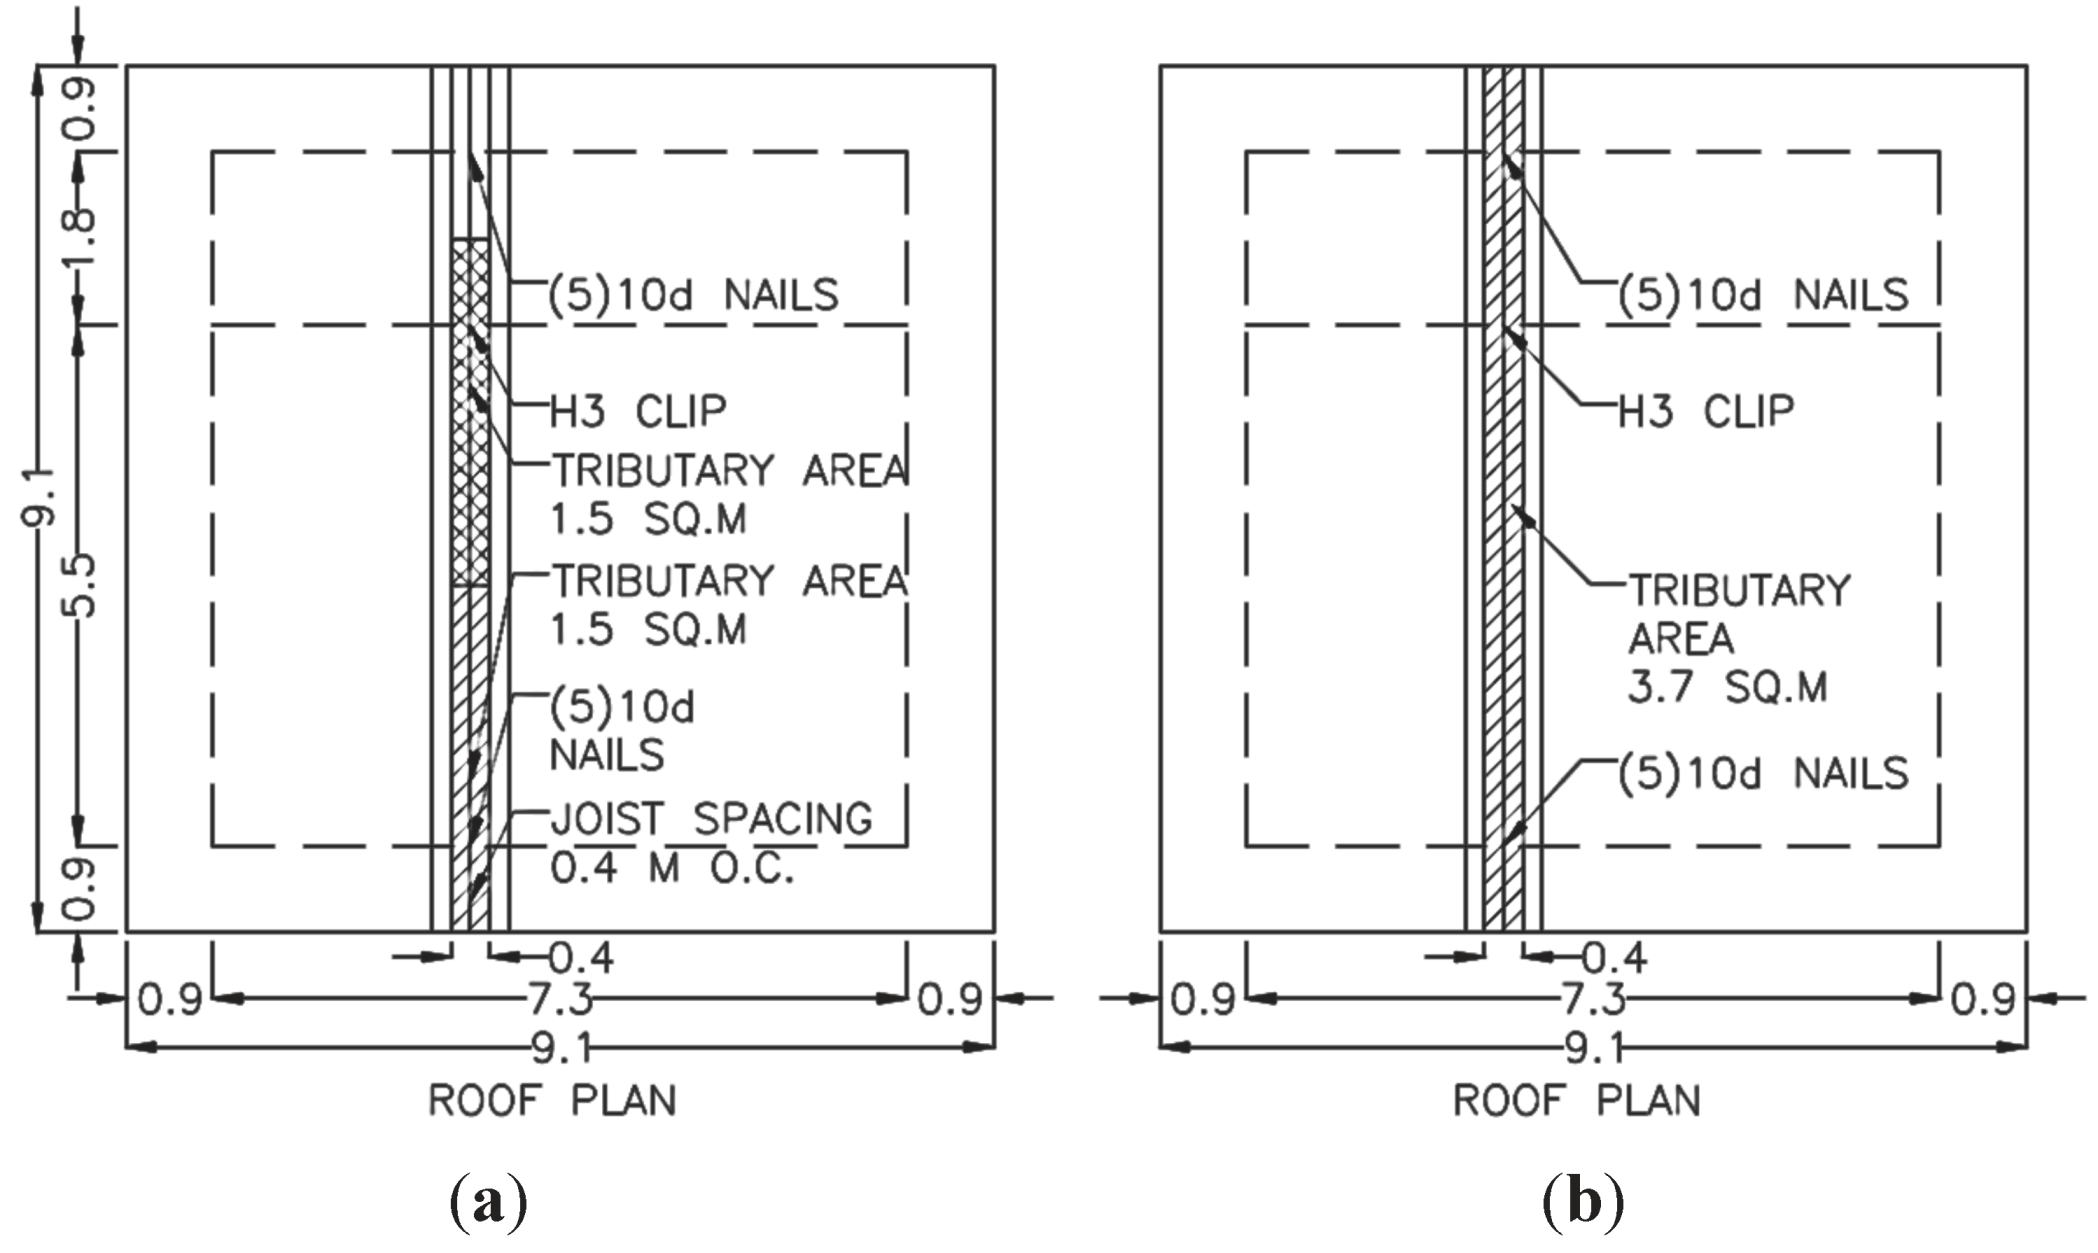
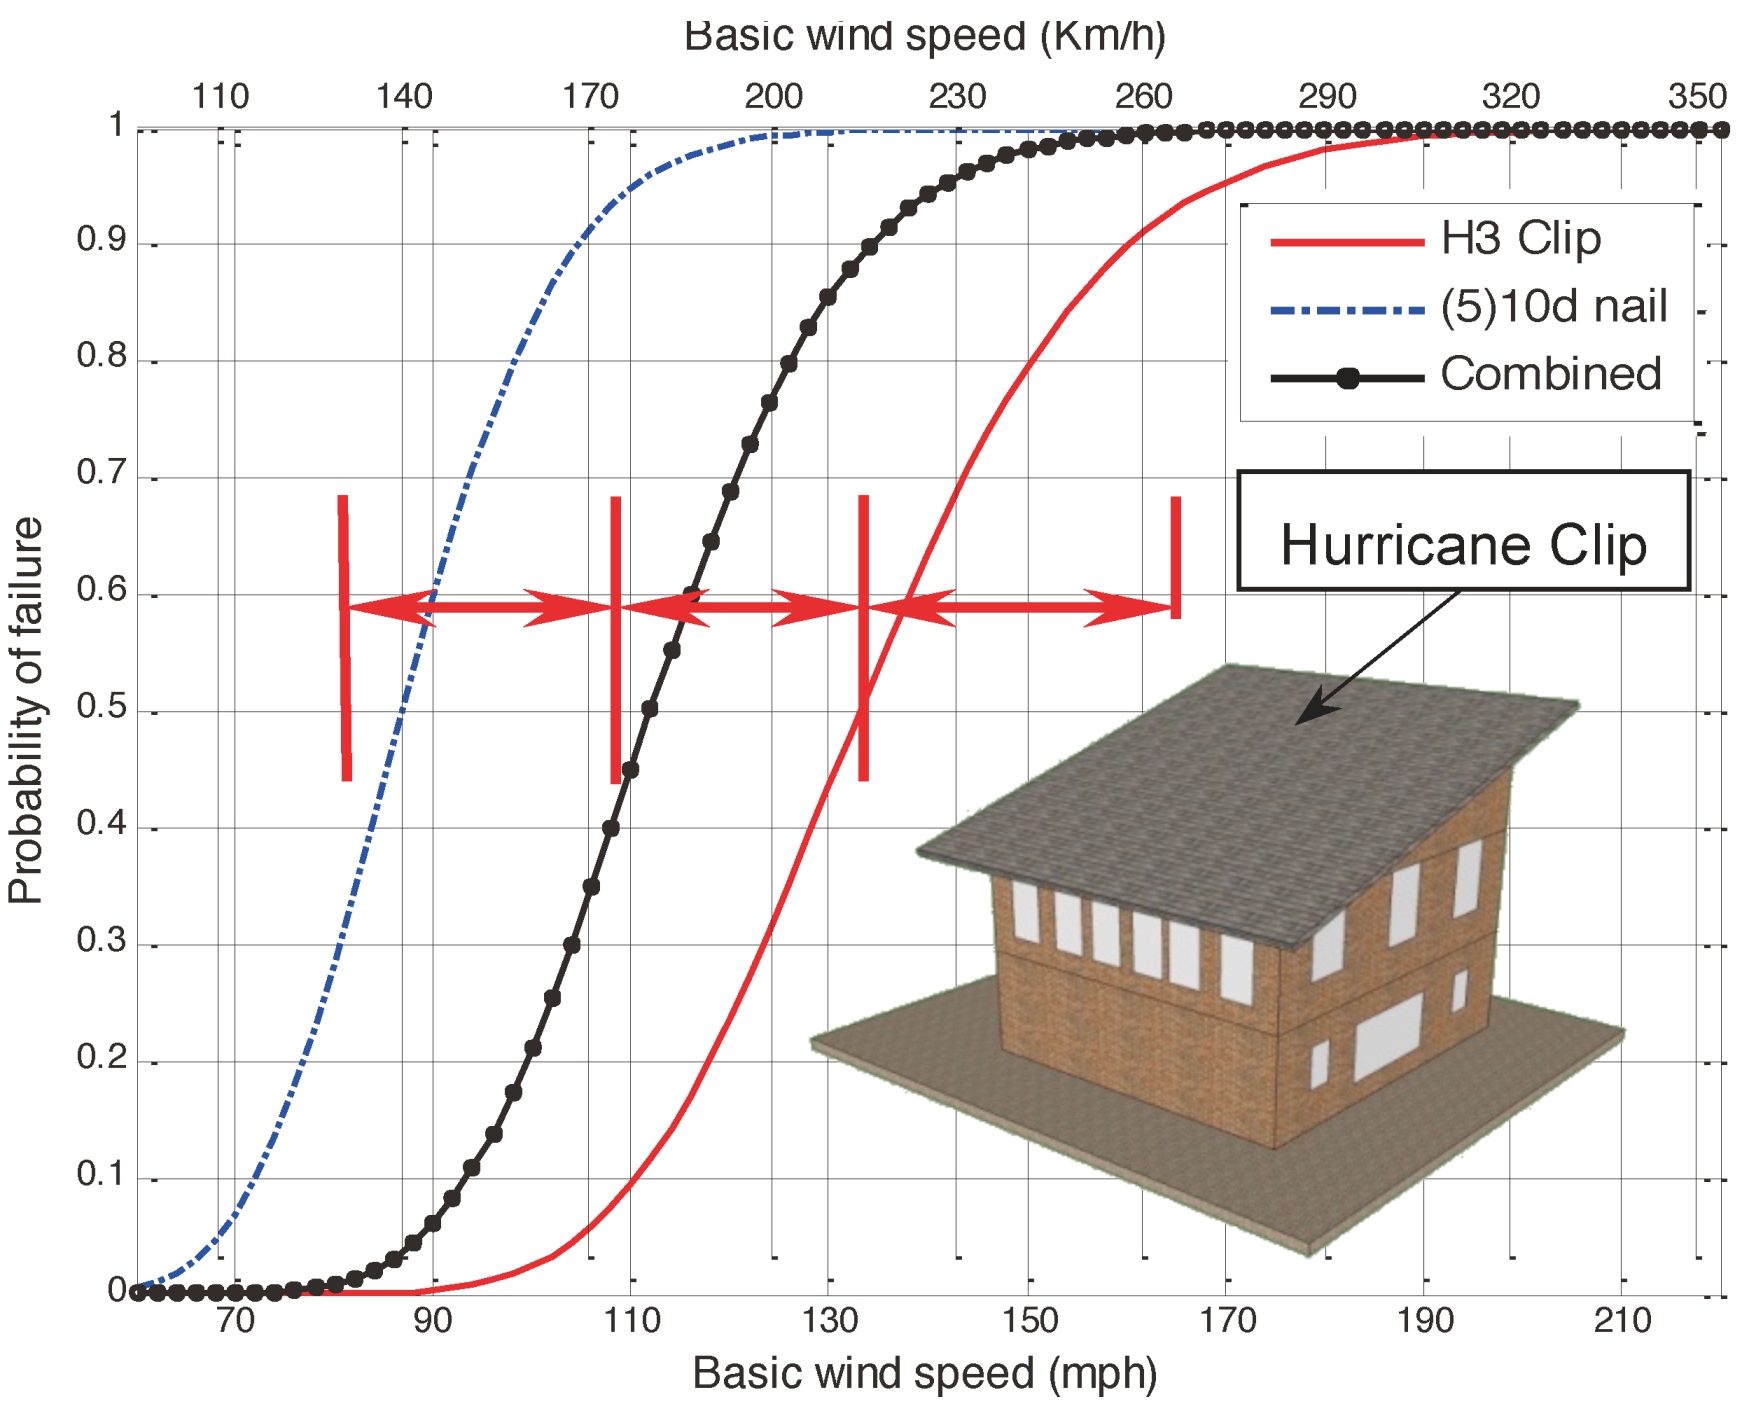
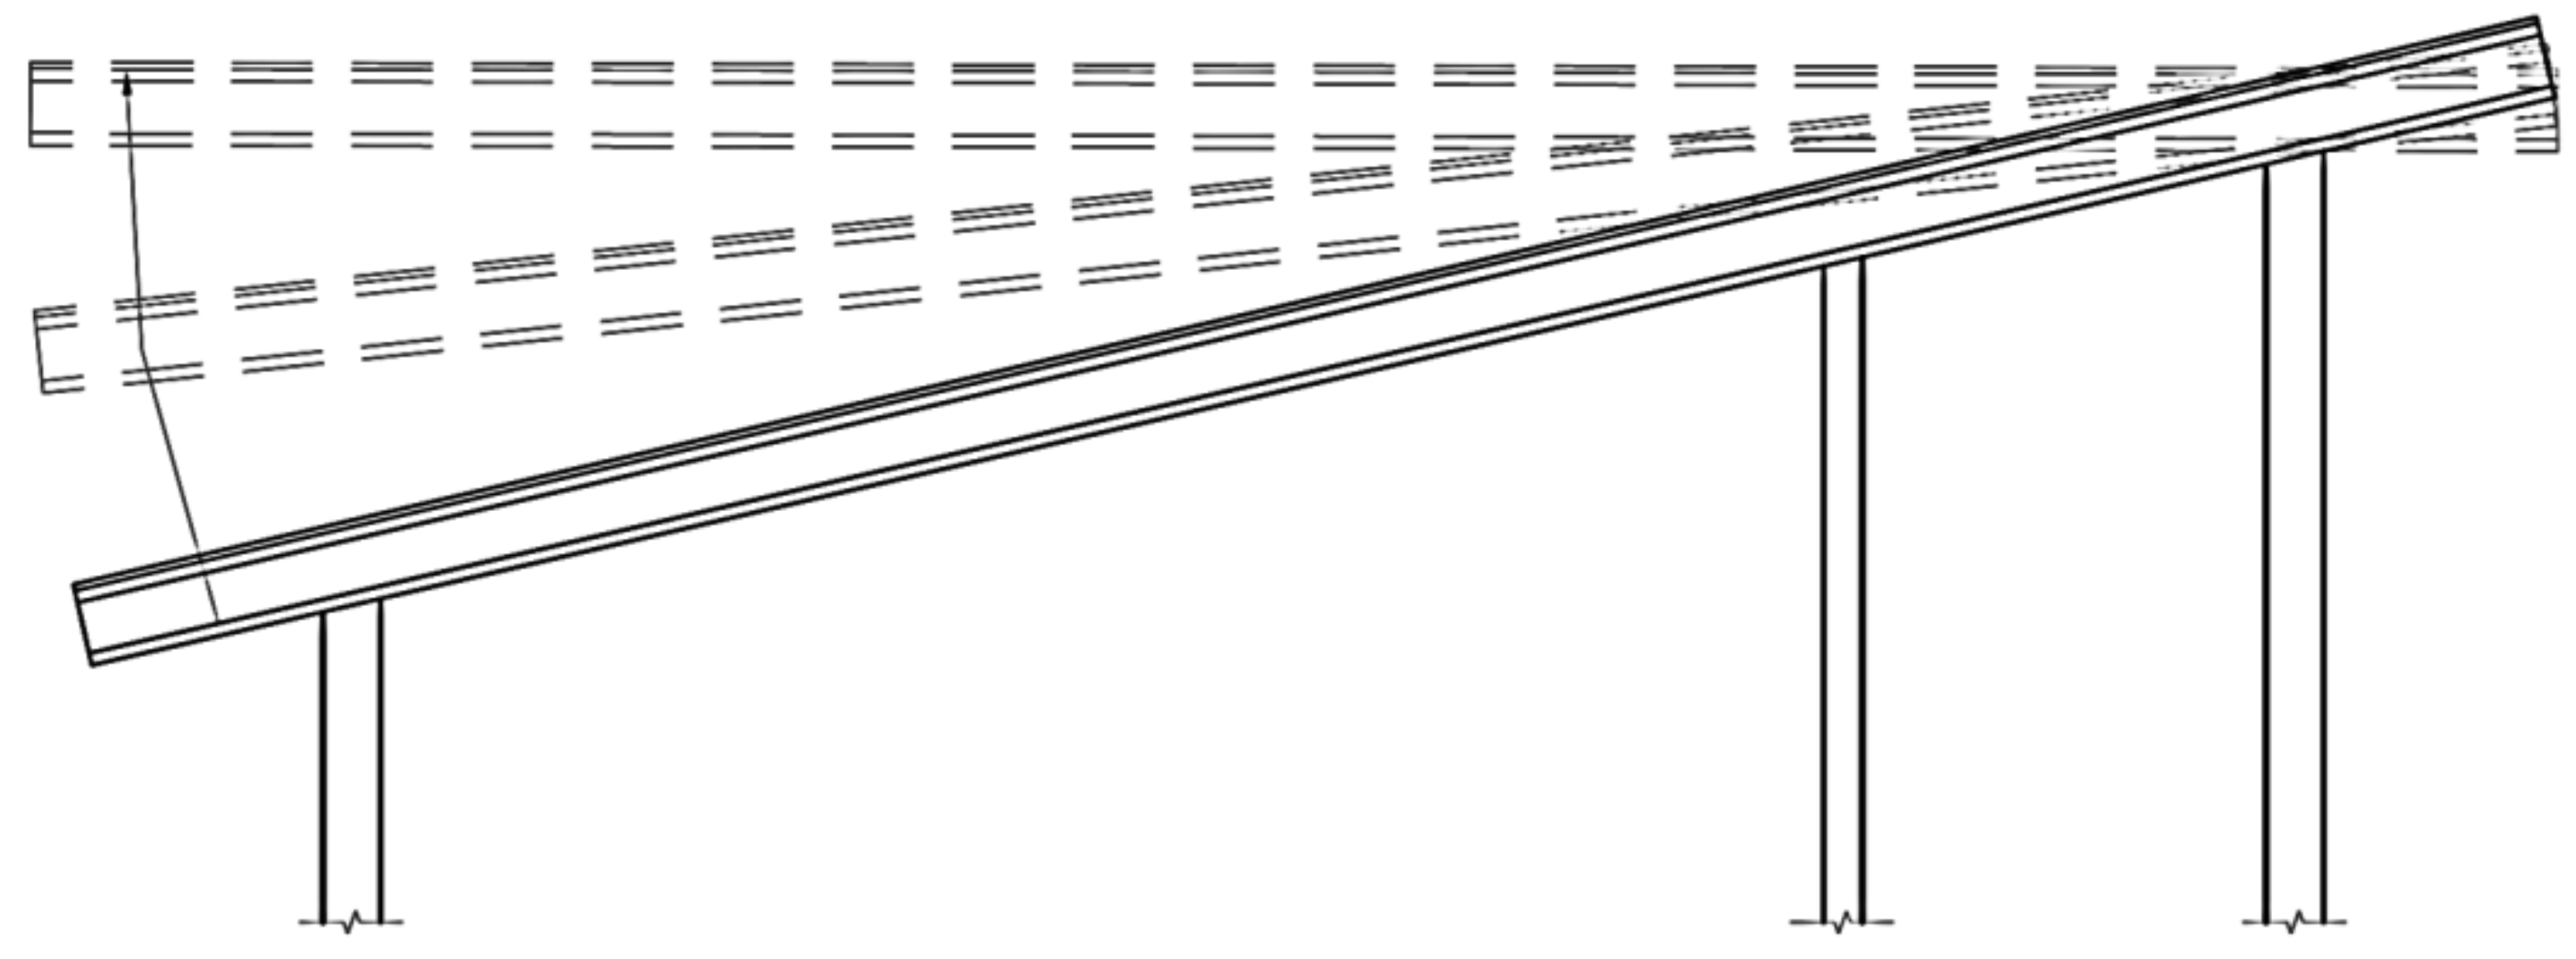
Figure 7 presents a lateral section of the roof with the applied wind pressure. Fragilities for the roof-to-wall connections were developed as defined in Equation 3. The analysis was performed using Monte-Carlo simulation with the statistics for wind, dead load, and uplift resistance described above. Fragilities were developed for two different conditions, individual and combined.
Figure 8 illustrates the tributary area and the loading condition considered in the analysis.
Figure 8a presents the loading considered for the individual cases while the combined case is explained in
Figure 8b.
Figure 7.
Roof uplift pressure.
Figure 7.
Roof uplift pressure.
Figure 8.
Loading conditions considered for fragility analysis (a) Individual case; (b) Combined case.
Figure 8.
Loading conditions considered for fragility analysis (a) Individual case; (b) Combined case.
6. Results and Discussion
Fragilities for all three different conditions are shown in
Figure 9. The individual case examines individual failure of each of these connections, and in the combined case, simultaneous failure of both of these connections is investigated. The combined case used in this study is performed since the order of the failure is not known and likely occurred at the same time. This condition, along with the other individual conditions, provides insight into the failure mechanism of the roof system.
Figure 9.
Fragilities for roof-to-wall connection.
Figure 9.
Fragilities for roof-to-wall connection.
Recall that fragilities are often modeled as lognormal distributions; therefore, the lognormal parameters of these fragilities are given in
Table 6.
Table 6.
Lognormal parameters for roof-to-wall connections.
Table 6.
Lognormal parameters for roof-to-wall connections.
| Connection Type | Parameters |
|---|
| λ | ξ |
|---|
| H3 | 4.891 | 0.1448 |
| (5)10d | 4.464 | 0.1458 |
| Combined | 4.718 | 0.1409 |
As seen in
Figure 9, for an EF2 (111–135 mph) tornado, there is a probability of failure greater than 95% for the (5)10d connection. However, the probability of failure is 10%–55% and 40%–90% for the H3 hurricane clip and the combined condition, respectively. This indicates that the nail connection is a much weaker link in the roof-to-wall connection than the hurricane clip, as expected. Roofs generally have a reasonable degree of redundancy associated with them; however, in this case it is believed that a single connection failure led to progressive failure and eventual loss of the entire roof system. Based on the site inspection and examination of
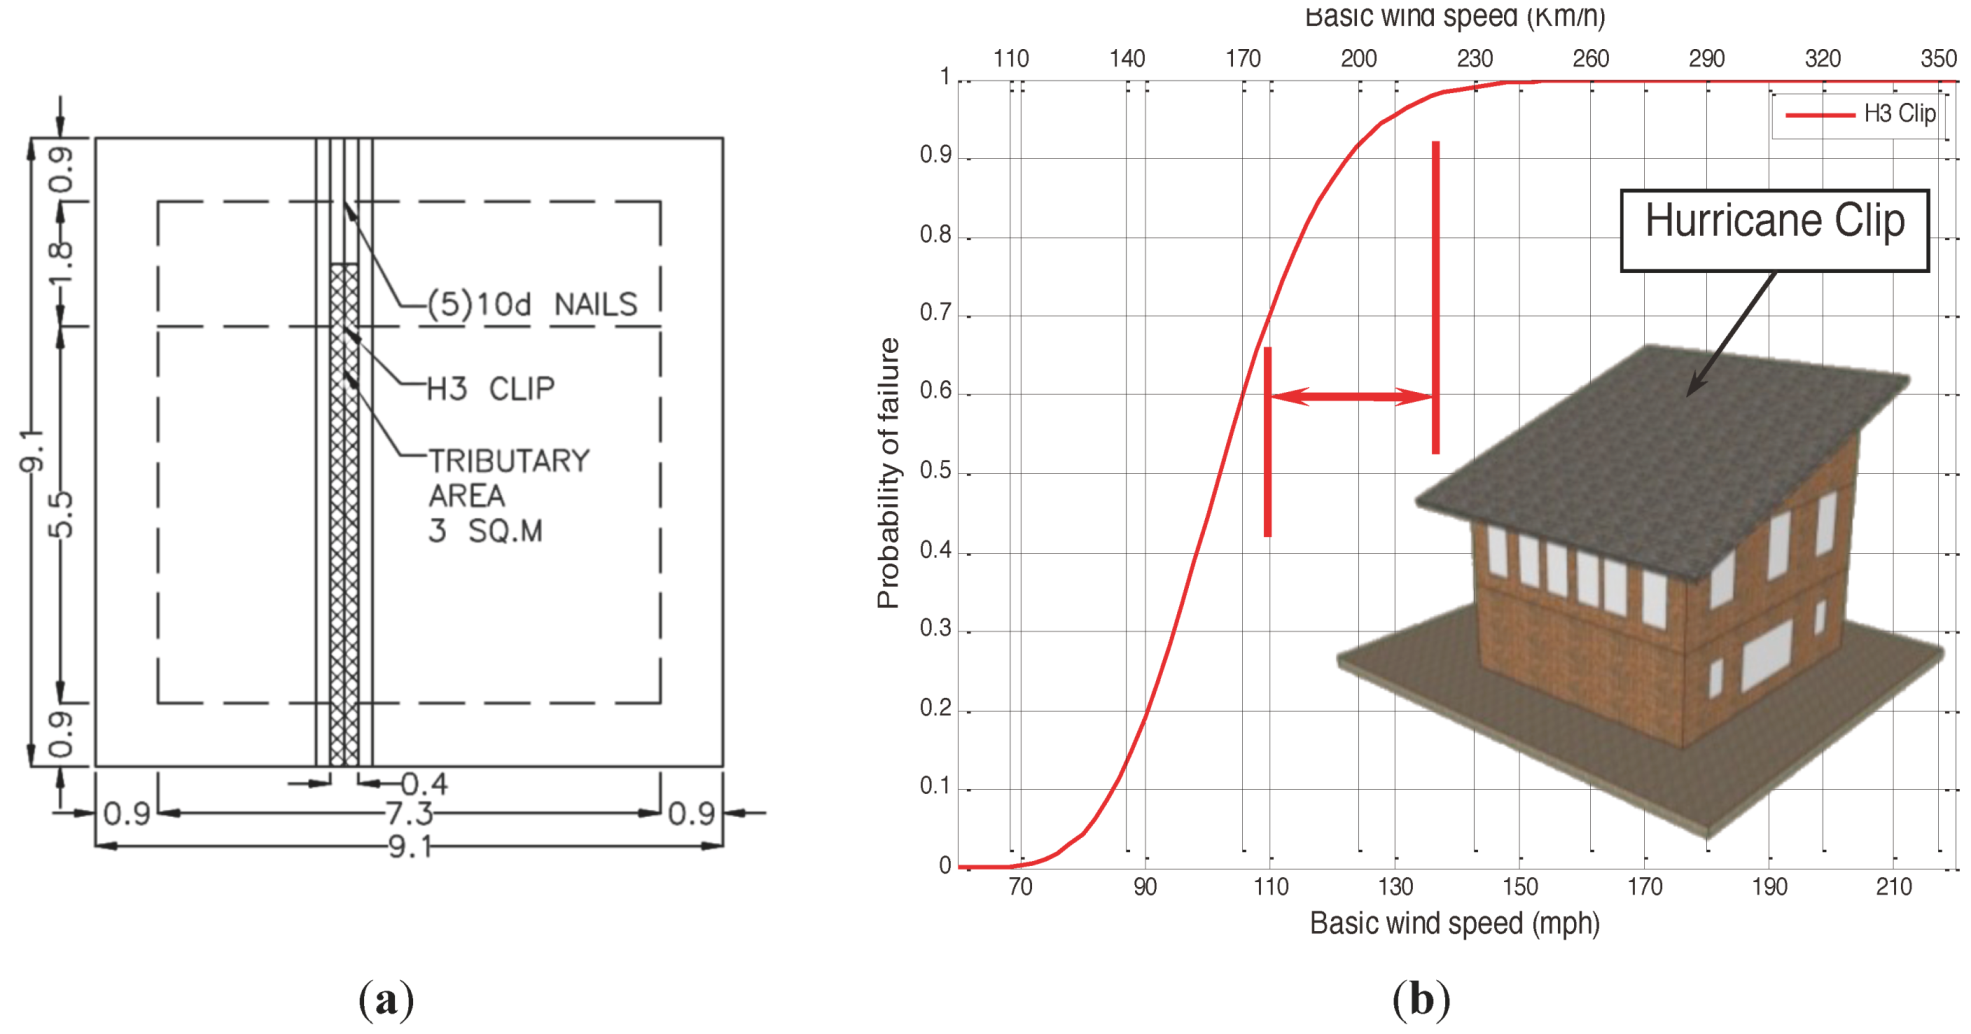
Figure 9, it is believed that failure of the (5)10d connection might have initiated the roof failure. This failure mechanism can be best explained by
Figure 10 and
Figure 11 which examine a condition when the (5)10d nail connection has failed and the wind pressure is redistributed to the hurricane clip. Looking at
Figure 10b, for an EF2 tornado there is 70% to approximately 100% probability of failure for an H3 clip after the nailed connection has failed. However, in reality this probability is much higher than shown in the figure, since the capacity statistics normally used for an H3 clip are based on using (4)8d nails while in the home investigated, the actual connection had used drywall screws. The use of drywall screws reduces the capacity of the connection, which in turn, increases the failure probability of the connection.
Figure 10.
(a) Loading condition considered for the fragility analysis; (b) Fragility for H3 hurricane clip when nail connection has failed.
Figure 10.
(a) Loading condition considered for the fragility analysis; (b) Fragility for H3 hurricane clip when nail connection has failed.
Figure 11.
Roof failure mechanism.
Figure 11.
Roof failure mechanism.
The results indicate the importance of construction methods and practices on the performance of a structure under natural hazards loading such as a moderate tornado. Use of nail connections proved to be the weaker link in a roof-to-wall connection in comparison to a hurricane clip as one would expect. The tornado resulted in the loss of the roof system as well as other significant financial losses.
7. Conclusions
This paper presented a systematic assessment of the loss of a roof system in a two-story residential wood frame residential building that was impacted by a winter tornado in Tuscaloosa County, Alabama. A site inspection was conducted following the tornado and the roof-to-wall connection failure was determined to be the main cause of failure. Fragilities were developed for different roof-to-wall connections to determine the manner in which the roof failed. This also provided an insight into the tornado wind speed that resulted in the observed failure and formed the basis for a more quantitative analysis of the EF rating for this particular case study.
Based on the discussion presented in the previous section, an EF2 tornado most likely resulted in the loss of the roof system for the building under consideration. The Enhanced Fujita scale was used to rate the intensity of the tornadoes based on observed damage during the site survey. The tornado was initially rated as an EF3 tornado but following a site inspection by the authors, the tornado rating was downgraded to an EF2 tornado. In specific cases, it may be possible to assist in determining EF ratings using the fragility methodology described herein, particularly when buildings are atypical. It is important to note that the results of this study are probabilistic and quantitative and that there are uncertainties involved in the analysis.
This study demonstrates the application of the fragility methodology in probabilistic assessment of structures against tornado loads with a focus on the roof-to-wall connection component of the vertical load path. Since tornado wind speeds are difficult to measure directly, the EF scale is used to rate the intensity of the tornadoes based on the damage observed. The approach offered in this study can be used as a supplement to the EF ratings.


