Article

Investigation of Sensible Cooling Performance in the Case of an Air Handling Unit System with Indirect Evaporative Cooling: Indirect Evaporative Cooling Effects for the Additional Cooling System of Buildings

Department of Building Services and Building Engineering, Faculty of Engineering, University of Debrecen, Ótemető Str. 2-4, 4028 Debrecen, Hungary
*
Author to whom correspondence should be addressed.
Buildings 2023, 13(7), 1800; https://doi.org/10.3390/buildings13071800
Submission received: 26 June 2023 / Revised: 7 July 2023 / Accepted: 10 July 2023 / Published: 14 July 2023
(This article belongs to the Special Issue Healthy, Digital and Sustainable Buildings and Cities)

Abstract

:
Previous studies have shown that the amount of energy consumed by mechanical cooling can be significantly reduced by the indirect evaporative cooling (IEC) process. By increasing the heat recovery efficiency of air handling units (AHUs), sensible cooling performance can be achieved with the IEC process for a significant part of the cooling season. This study determined the sensible cooling performance under which outdoor air conditions can be achieved. With IEC, the indoor humidity load cannot be adequately managed and must be solved by a supplementary cooling system, which may require additional cooling energy. This study shows the effect of the set indoor humidity on the amount of cooling energy required. The increase in energy consumption of the supplementary cooling system has been determined by simulation and for which indoor air conditions the amount of cooling energy used can be optimized if only IEC cooling is used in the air handling unit.

1. Introduction

With ever-increasing outdoor peak temperatures and energy prices, system solutions that increase cooling efficiency are becoming essential. Direct evaporative cooling (DEC) has been used for a long time in industrial refrigeration systems [1]. The cooling process is also often used to improve the operating conditions of the cooling circuit [2,3]. For outdoor, or semi-open areas, DEC is also ideal [4]. The direct evaporative cooling process in dry hot climates is also suitable for treating higher-quality comfort areas [5]. Higher comfort requirements are difficult to achieve in regions with a humid climate with DEC [6]. DEC cooling solutions have a limitation in comfort areas as the evaporated water vapor influences the sense of comfort [7]. Keeping the relative humidity in the comfort space within a given zone limits the maximum cooling capacity of DEC systems compared to the cooling capacity that can potentially be achieved [8]. In recent years, several studies have investigated the potential of indirect evaporative air cooling [9]. With indirect evaporative cooling (IEC), the treated air is not directly supplied to the comfort space and therefore does not affect it [10]. One of the most common applications of indirect evaporative cooling is to cool the air exhausted by air handling units [11]. Using a heat recovery unit, it is possible to pre-cool the outdoor air without mass transfer [9]. Due to the efficiency of the IEC process, the cooling demand of air handling units produced by the refrigeration circuit can be significantly reduced, saving a significant amount of energy [12]. With the increase in heat recovery efficiencies, it is now possible to achieve isothermal inflow or sensible cooling power input using only IEC cooling methods, which creates an opportunity to review the technical design of building mechanical systems. As the efficiency of the indirect cooling process depends on several parameters, a complex assessment is required to determine the energy savings that can be expected using IEC alone and the operating range at which sensible cooling performance or isothermal inflow can be achieved [13]. Determination of isothermal inflow boundary parameters helps to design predictive control of supplementary cooling systems. If the outdoor weather conditions do not reach the isothermal inflow threshold for the whole cooling season, it is possible to treat the air with IEC only [14]. In this case, however, it must be considered that the humidity of the external air cannot always be treated properly by the IEC procedure. The humidity level of the external air may exceed the level that should be maintained indoors, so the management of the humidity level falls to the low-temperature supplementary cooling system. The humidity level of the external air may exceed the level that should be maintained indoors, leaving the task of managing the humidity level to the low-temperature supplementary cooling system. A good example of this is where the air handling unit supplies 100% fresh air to the occupied zone and the premises are cooled by low-temperature supplementary cooling systems (VRF, fan-coil, etc.). The additional cooling energy demand due to humidity load should be considered when designing the supplementary cooling system [15].
This study presents the theoretical basis of the DEC and IEC processes. It will show how to define the operating zone in which the sensible cooling performance of the IEC process can be achieved. The performance of an air handling unit using only IEC cooling was investigated under laboratory conditions when the supplementary cooling energy was provided by a fan-coil system for high-quality comfort space. Based on several years of meteorological data, it was simulated how much cooling energy can be saved by using the IEC procedure and how much the additional cooling system varies the amount of cooling energy depending on the amount of humidity load from the external environment.

2. Materials and Methods

When designing office comfort areas, the primary aim is to create ideal working conditions. Employee well-being is necessary for effective work [16]. Many factors affect human comfort, a major part of which is influenced by the ventilation system. The air handling unit, which is part of the air handling system, influences the air temperature, humidity, and air quality in the comfort space. A significant amount of energy is used to set and maintain these comfort parameters [17]. The air distribution system associated with air handling units influences the movement of air in the occupied zone and the variability of air movement [18]. The sizing of air handling systems in practice is carried out according to several standards (ISO 7730:2006; CR 1752:2000; ASHRAE 55) [19,20,21]. The standards contain several methods for determining the amount of fresh air. The required volumetric flow rate of fresh air can be determined, for example, based on the headcount method, where the amount of necessary fresh air is determined by the performed activities and the number of workers [20]. Another method is the coverage method, where the minimum air volume required to flush the room is determined [20]. Calculating the amount of fresh air needed to dilute pollutant concentration is another option for determining the minimum fresh air requirement (in offices, this usually means measuring CO2 concentration) [22]. According to standard recommendations, by selecting the highest value from the minimum fresh air requirements determined using the methods for determining the amount of fresh air, we can serve the treated area with an adequate amount of fresh air from all aspects. Treating fresh air during the cooling season results in significant cooling energy consumption, which is usually provided by chillers and heat pumps [23]. The cooling solutions employed have a significant impact on the extent of peak summer electricity consumption [24]. By employing direct and indirect evaporative cooling solutions, we can significantly reduce the consumption of cooling systems [25]. In sizing the air handling system, optimizing between energy and comfort considerations is of immense importance. Increasing the amount of fresh air is advantageous from a comfort perspective but requires additional energy investment from an energy perspective. Additionally, the desired indoor air conditions significantly influence the cooling energy requirements of the room. When designing internal air conditions, it is important to examine what level of comfort provides adequate comfort for people while keeping the cooling energy demand low [26]. In our study, we present our calculations for an indoor target temperature of 25 °C, which, according to standards, can provide high-quality comfort during the summer season [21]. The sizing steps presented can be applied to other indoor design air conditions as well.

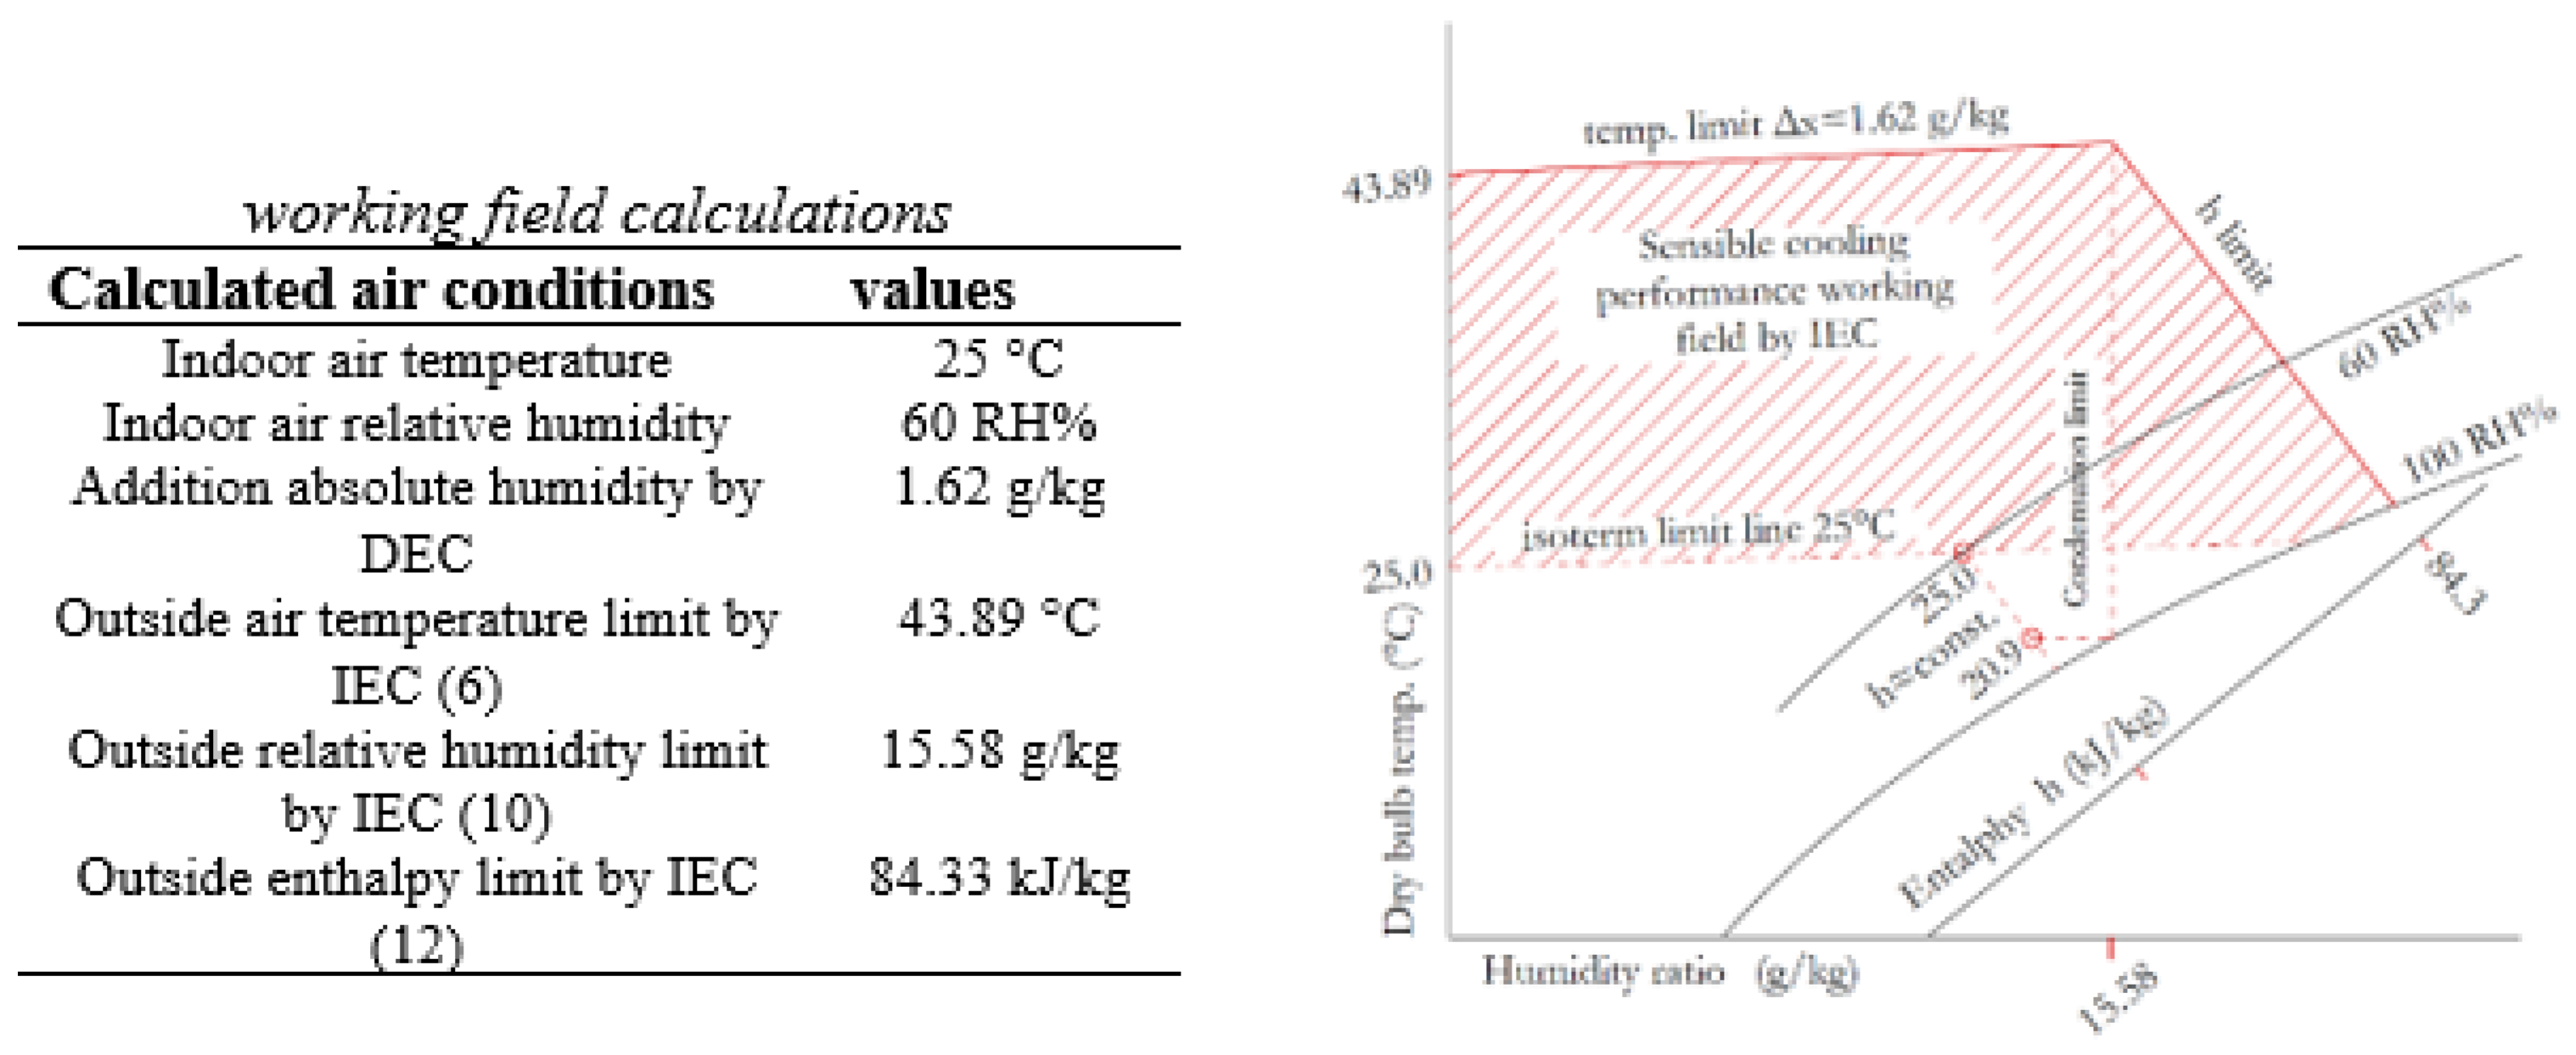
2.1. Calculation Methods

Heat recovery units have been used in air handlers for a long time for the pre-treatment of outdoor air. With the help of heat recovery units, the relative cooling energy of the exhaust air can be used to pre-cool the outdoor air. The efficiency of heat recovery can be described by the ratio of the enthalpy change between the inlet and outlet points of the heat exchanger. If the temperature of the exhaust air from the indoor space is higher than the dew point temperature of the outdoor air, no condensation will occur during heat recovery. In this case, the efficiency of heat recovery can be determined from the temperature change (assuming that the mass flow rates on both sides are equal) [27].
η r e c . = h r s h i h x h 0 = h x h r e h x h 0 = ~ T x T r e T x T o
In direct evaporative cooling, the air is forced to flow through a wetting pad. Heat and mass transfer occur simultaneously between the moving air mass and the large water film. The energy required for evaporation comes from the medium adjacent to the water surface (air), so the temperature of the air decreases depending on the amount of water evaporated. The energy taken from the medium returns to the gaseous mixture along with the evaporating material, so during the process, the enthalpy of the water vapor–air mixture changes only slightly [28]. If no external heat is added or removed from the system during the process, meaning that the process occurs adiabatically, the enthalpy of the medium increases with the enthalpy of the evaporated water vapor [29]:
h = x × c p v × t v k J / k g
Practical calculation methods disregard the change in the enthalpy of the medium since its magnitude and effect are negligible compared to the absolute enthalpy value of the system. In the following, we calculate taking into account the above simplification. If we consider the enthalpy of the air–water vapor mixture to be constant (h ≈ constant) during the process, the resulting air temperature after the procedure can be expressed as a function of the initial air state (temperature, humidity) and the amount of evaporated water using Equation (3):
t e = r × x c p a + c p v × x + t x [ ° C ]
The amount of evaporable water depends on the state of the treated air and the efficiency of the evaporative cooling system.
ε = T i n T o u t T i n T w b   o u t [ ]
If the initial air state is known, it is possible to determine the required evaporative cooling efficiency to achieve a given amount of moisture uptake. The table shows that, in addition to the initial temperature, the relative humidity greatly influences the amount of water that can be evaporated.
The achievable evaporative efficiency greatly depends on the method of humidification. The formation of a large free water surface required for adiabatic humidification can be achieved in several ways: water spray, cooling pad technology, etc. [30,31]. Our measurements were performed using cellulose cooling pads. Previous research has shown that the efficiency of evaporative cooling with cellulose-based filters ranges from around 60 to 90% depending on the thickness of the filter and the flow rate [32]. Taking this into account, the amount of evaporated water corresponding to the highlighted efficiency value in Table 1 is expected to depend on the internal air condition.
As a function of the evaporating water, the treated air cools and becomes more humid, which results in an increase in the cooling performance of the heat recovery system (see Figure 1). With the help of this process, the treated outdoor air can be cooled below room temperature. The boundary value of the external temperature for isothermal supply air can be derived from (5)–(7).
t i t s = 0   [ ° C ]
t i t o , l i m i t η t 0 , l i m i t t e = 0   ° C
t o , l i m i t = t i η t e 1 η = t i η r x c p a + c p v x + t i 1 η = t i η r x c p a + c p v x 1 η   [ ° C ]
If the outdoor temperature is lower than the calculated limit, then with indirect evaporative cooling, we can achieve a supply air temperature lower than the indoor temperature, which means that we can introduce a sensible cooling performance into the room with the cooling process, provided that the absolute humidity of the external air does not reach the condensation limit. Based on the above, we also need to determine an absolute humidity limit in addition to the temperature limit to write the operating range of indirect evaporative cooling. The humidity limit is the saturated humidity corresponding to the air state after the evaporative cooling. If the air at the temperature limit contains more humidity than this limit, then the condensation heat of this humidity will be higher than that of the air cooled by the evaporative path involved in the heat exchange. This results in condensation, and its energy requirement reduces the temperature difference created. To determine the humidity limit, we need to determine the saturation vapor pressure of the air after evaporative cooling, which can be determined using the Antoine equation [33]:
p w s = e 23.752 + 4134.9088 238.5104 + t e   [ P a ]
Given the knowledge of saturation vapor pressure and atmospheric pressure, the limit of absolute humidity can be determined as a function of the temperature that occurs after evaporative cooling.
x o , l i m i t = 0.622 p w s p 0 p w s   [ k g / k g ]
If we assume that p0 is equal to the normal atmospheric pressure (101,325 Pa), and the relationship derived from the Antoine equation is inserted, then:
x o , l i m i t = 0.622 e 23.752 + 4134.9088 238.5104 + t e 101325 e 23.752 + 4134.9088 238.5104 + t e   [ k g / k g ]
The equation can be used to determine the air temperature after evaporative cooling as a function of the initial air temperature and the amount of evaporated water, according to Equation (3), which can be inserted into Equation (10) to obtain the following relationship:
x o , l i m i t = 0.622 e 23.752 + 4134.9088 238.5104 + r x c p a + c p v x + t i 101325 e 23.752 + 4134.9088 238.5104 + r x c p a + c p v x + t i   [ k g / k g ]
If the humidity level of the external air is higher than the critical humidity level, condensation occurs during heat exchange. The enthalpy line of the air state determined by the critical temperature and critical humidity represents the limit where the air can be cooled down to the indoor air state.
h o , l i m i t = c p a t o , l i m i t + x o , l i m i t r + c p v t o , l i m i t   [ k J / k g ]
h o , l i m i t = c p a t i η r 0 x c p a + c p v x 1 η + 0.622 e 23.752 + 4134.9088 238.5104 + r x c p a + c p v x + t i 101325 e 23.752 + 4134.9088 238.5104 + r x c p a + c p v x + t i r + c p v t i η r x c p a + c p v x 1 η
The limit values t0,limit, x0,limit, and h0,limit determine the operating range using Equations (7), (11) and (13), where the treated air has a dry bulb temperature equal to or lower than the indoor air temperature after indirect evaporative air cooling. The boundaries of the operating zone can be determined based on the indoor air temperature, the amount of evaporated water, and the heat recovery efficiency. For example, assuming a heat recovery efficiency of 80% and an indoor air state of 25 °C and 40% RH, the operating range varies depending on the amount of evaporated water, as shown in Figure 2. Using the above formulas, it can be analyzed whether the indirect cooling process can be applied independently for air treatment based on the desired internal comfort level and the degree of evaporation.
If the outdoor air condition does not cross the determined boundary during the summer season, the perceptible cooling effect can be achieved with the supplied air. If the outdoor air condition is at the boundary, isothermic supply can be realized. For example, by adiabatic evaporation of 1.5 g/kg water from the air extracted from the room during the IEC process, at 80% heat recovery efficiency, it is possible to reach a supplied air temperature below 25 °C up to 39.8 °C and an absolute humidity of 15.9 g/kg. If the outdoor air humidity exceeds the value of 15.9 g/kg, then the boundary is defined by the enthalpy line corresponding to the air condition of 39.8 °C and 15.9 g/kg humidity (83.1 kJ/kg). Taking into account the indoor air condition and the meteorological data of the installation area, it can be assessed whether the IEC process can be applied independently in air treatment equipment. This question is particularly relevant in the case of building renovations. Numerous office buildings are constructed so that an air handling system takes care of the treatment of fresh air and its introduction into the occupied zones, while a separate heat emitter system takes care of the supply of cooling and heating energy (e.g., fan-coil, VRF systems). These cooling systems generally have low–medium temperatures, which allow for handling of moisture load in the rooms.

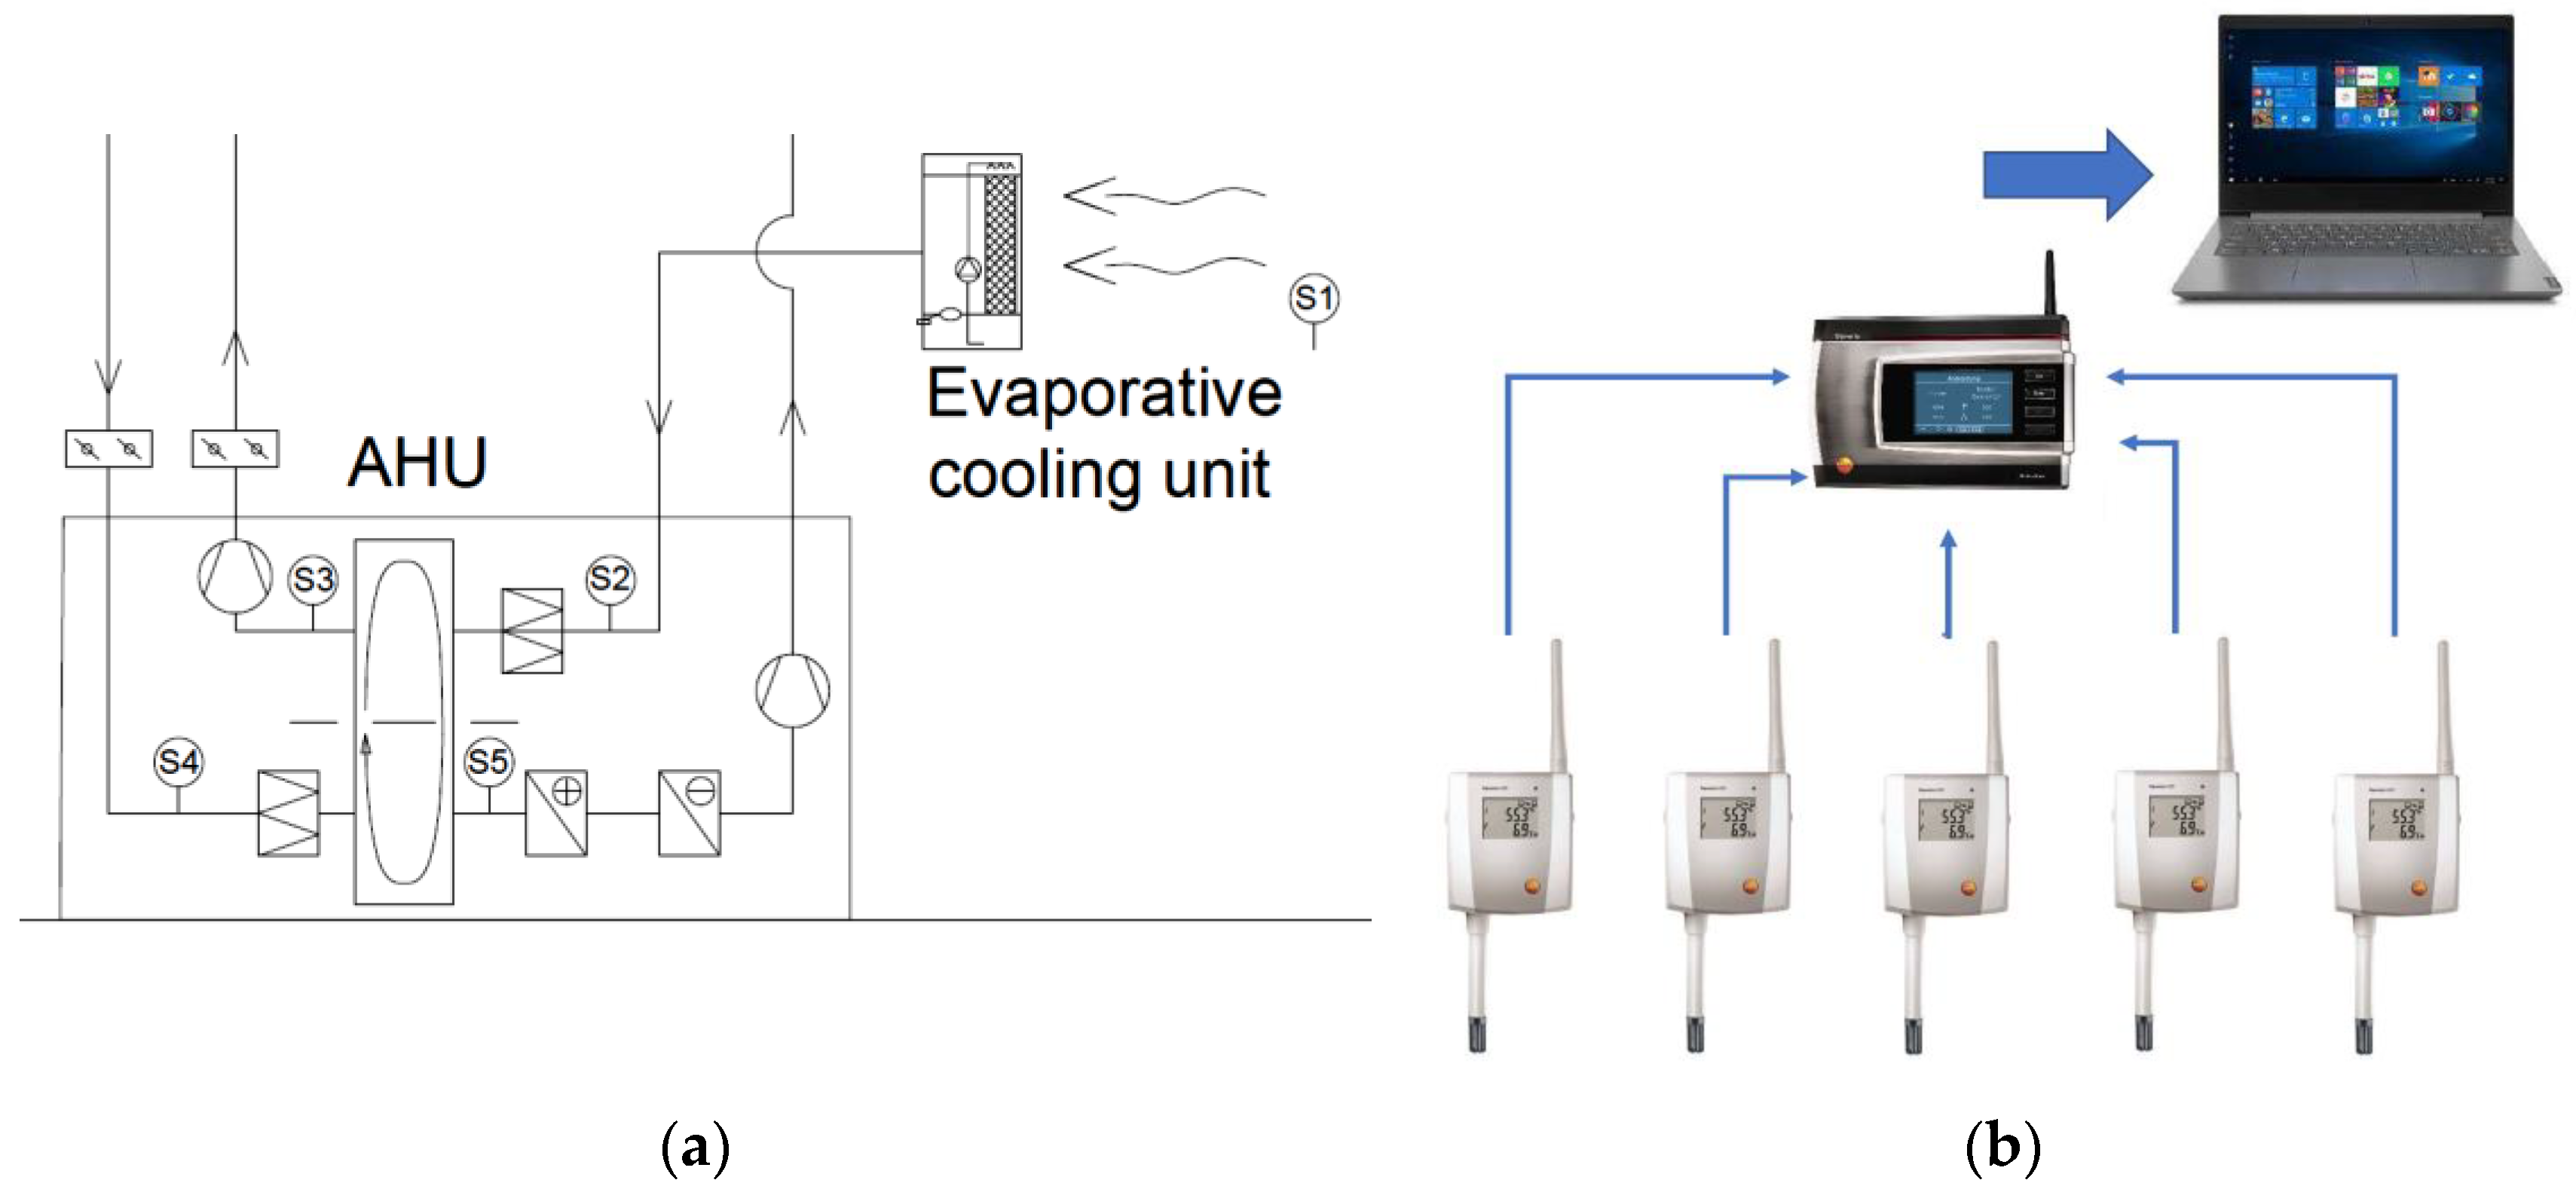
2.2. Measuring Methods

A unique measuring system was set up in the air conditioning laboratory of the Building Services and Building Engineering Department at the University of Debrecen to investigate the effect of indirect evaporative cooling on the energy consumption of the air conditioning system. A unique direct evaporative cooling unit (DEC) was installed in the laboratory’s air conditioning system as can be seen in Figure 3, creating a dry IEC air handling unit.
The evaporative cooling unit was connected to the drinking water network. The water level in the unit is regulated by a float valve. A distribution network with a pump is responsible for wetting the evaporative cooling pad. The size of the evaporative cooling pad is 0.89 × 0.72 m with a thickness of 100 mm. During the operation of the system, the evaporative efficiency was calculated according to Equation (4). The DEC unit is connected to the exhaust branch of the air handling unit. The air conditioning system was designed according to Figure 4.
We closed off the exhaust branches connected to the air handling system, and air was only extracted from the interior through the evaporative cooling unit. The air handling system delivers 100% fresh air to the laboratory and does not have a recirculation branch. During the measurements, balanced ventilation was implemented. A volumetric flow rate of 1000 m3h−1 was set during the measurements. A rotary heat recovery unit was installed in the air handling system.
The measurements were carried out between 26 July and 17 September 2021 and were conducted for 19 days (2592 observations). During the measurement period, close attention was paid to time intervals lasting from 12 to 16 h, which were the most critical periods considering the outdoor temperature. The measurements started with a room temperature of 25 °C, and the room temperature was maintained using the laboratory fan-coil system. During the measurement period, there were summer [Figure A1], hot [Figure A2], and torrid days [Figure A3] (Table 2) at the installation site, which therefore enabled us to analyze the system’s operation for all outdoor air conditions that occurred during the cooling season.
The measurements were carried out using the Testo Saversis Monitoring system (Figure 5). The central unit of the system communicates with the sensors via radio frequency. If the sensors go out of range or become shaded during data collection, their own memory is capable of collecting data, and when the radio frequency connection is restored, the data stored in the sensors are downloaded to the central unit.
The capabilities of the measurement system allowed us to place the sensors inside the air handling unit. At the end of each measurement cycle, the sensors that were shaded by the unit body were able to connect to the central unit by opening the service doors, so it could summarize the measured results at the end of each measurement cycle.
Control measurements were conducted to verify if there is a significant transfer of substances that would modify the moisture content of the treated fresh air from outside while maintaining appropriate indoor air conditions for the external and office areas during summer. As none of the media involved in heat exchange reached the dew point of the other medium during the entire measurement series, the observed changes in moisture content could be a consequence of measurement error and substance transfer occurring through the regenerative heat exchanger.
Based on the measured data, as can be seen in Figure 6, a slight material transfer was observed; however, considering the margin of error of the instruments (Table 3), the result was not significant.

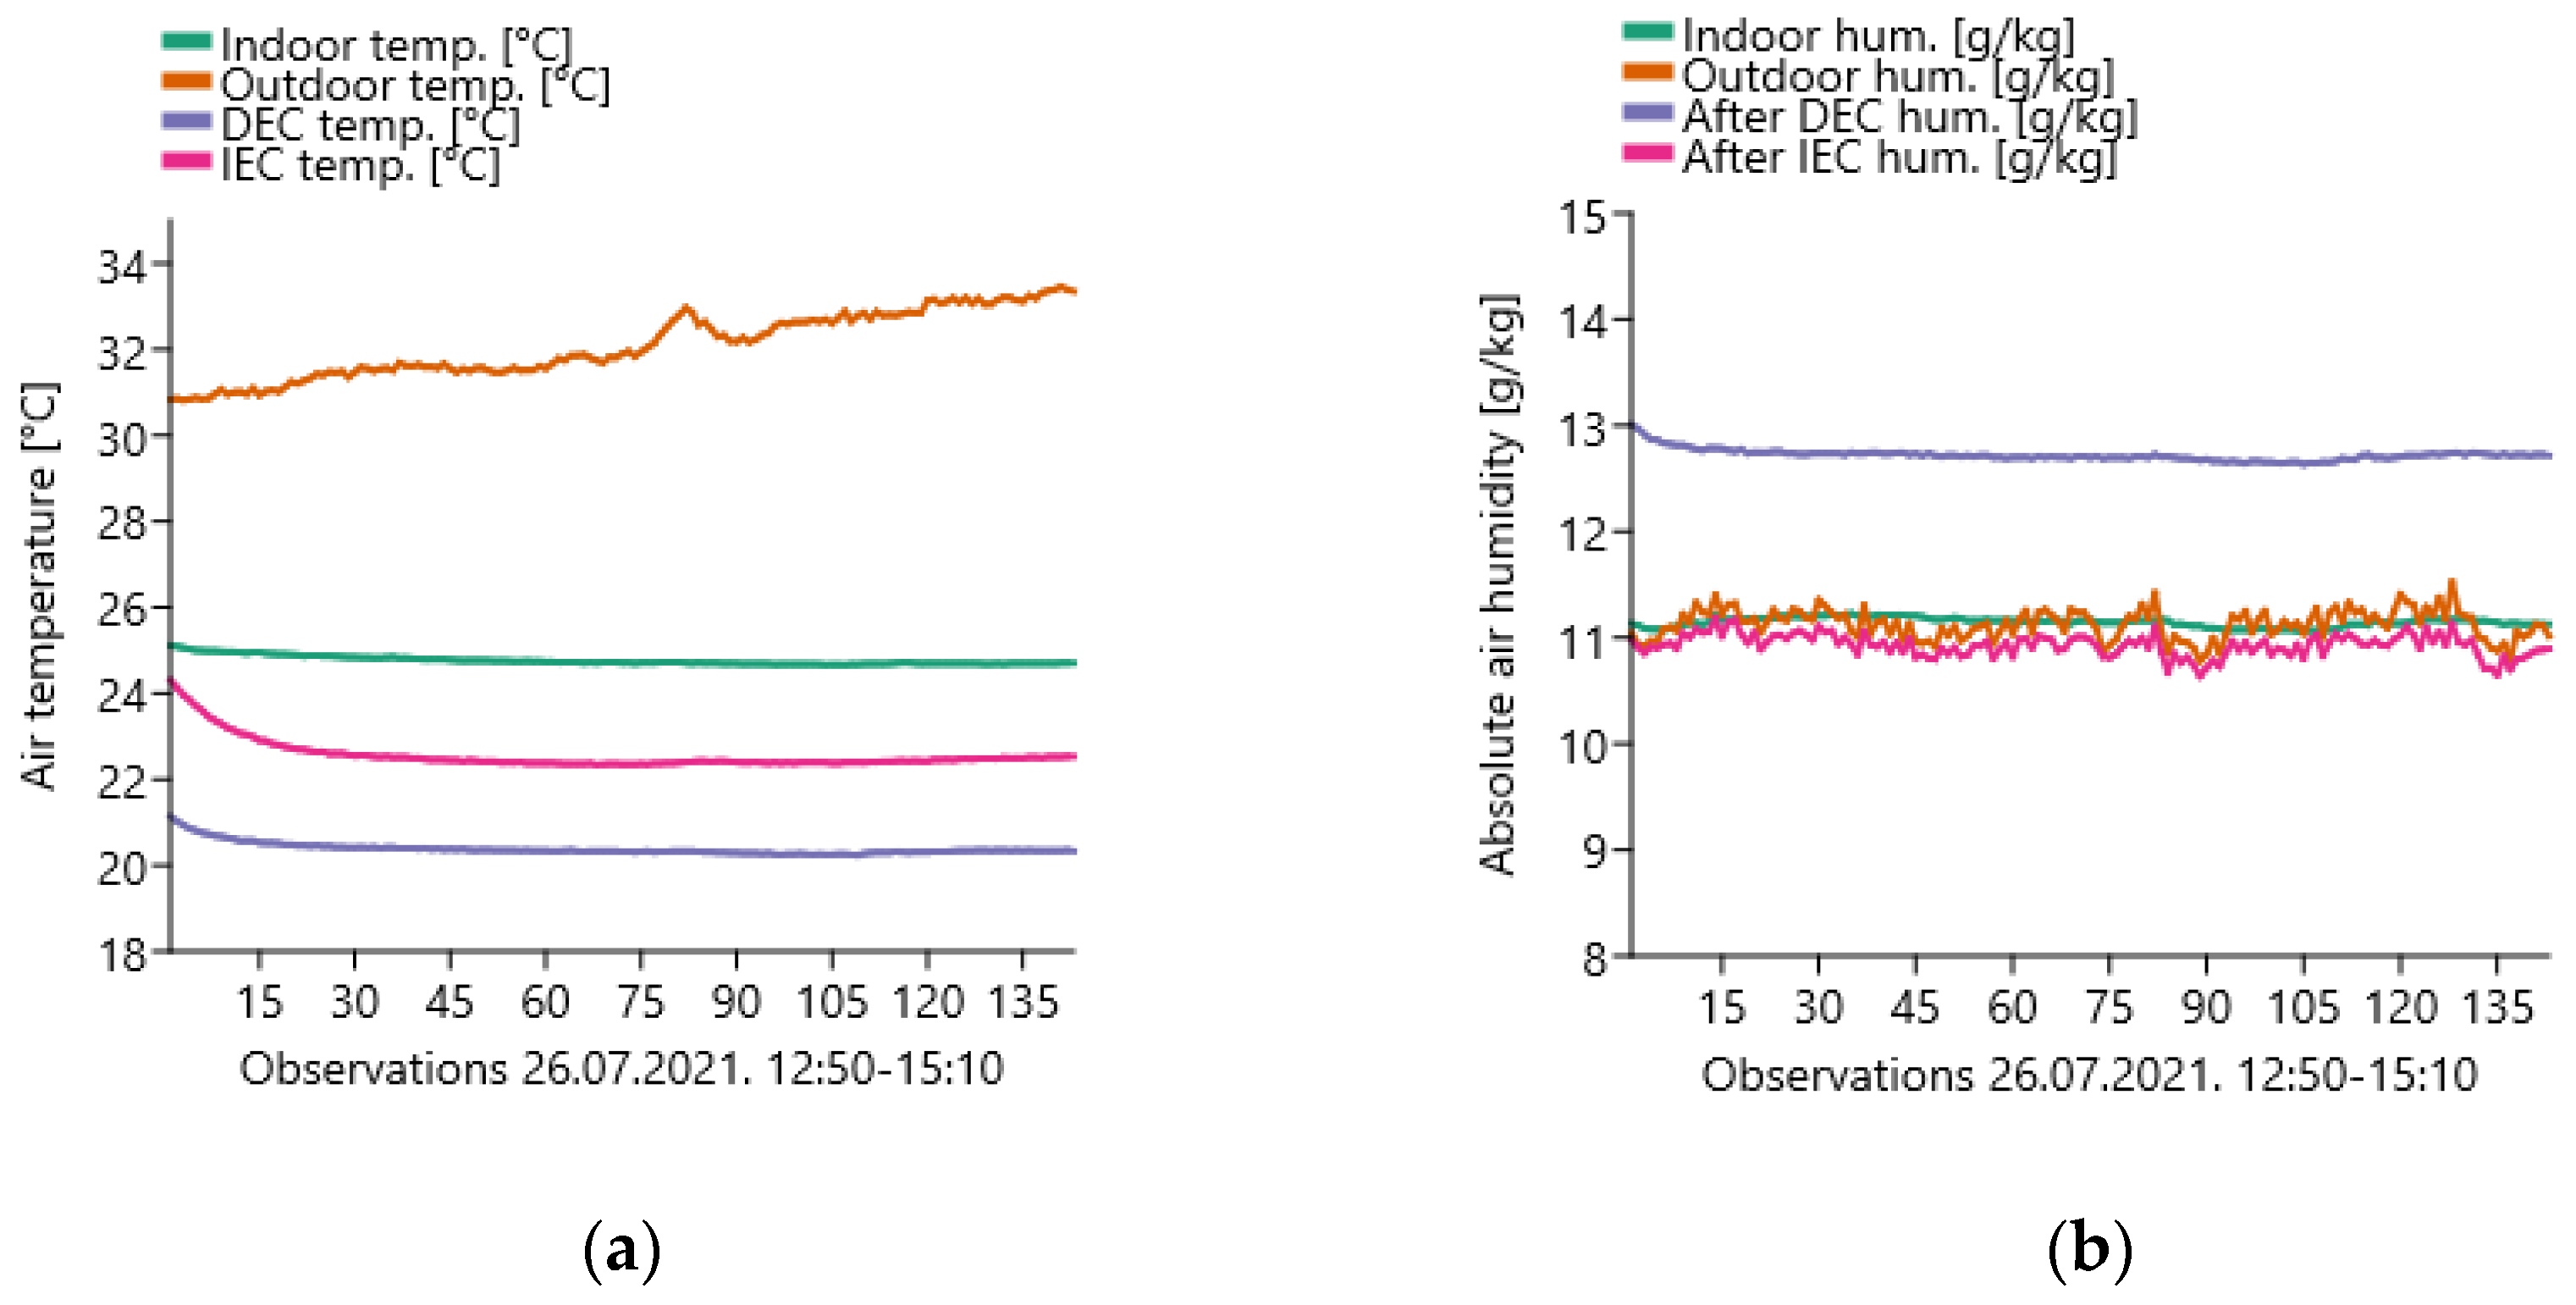
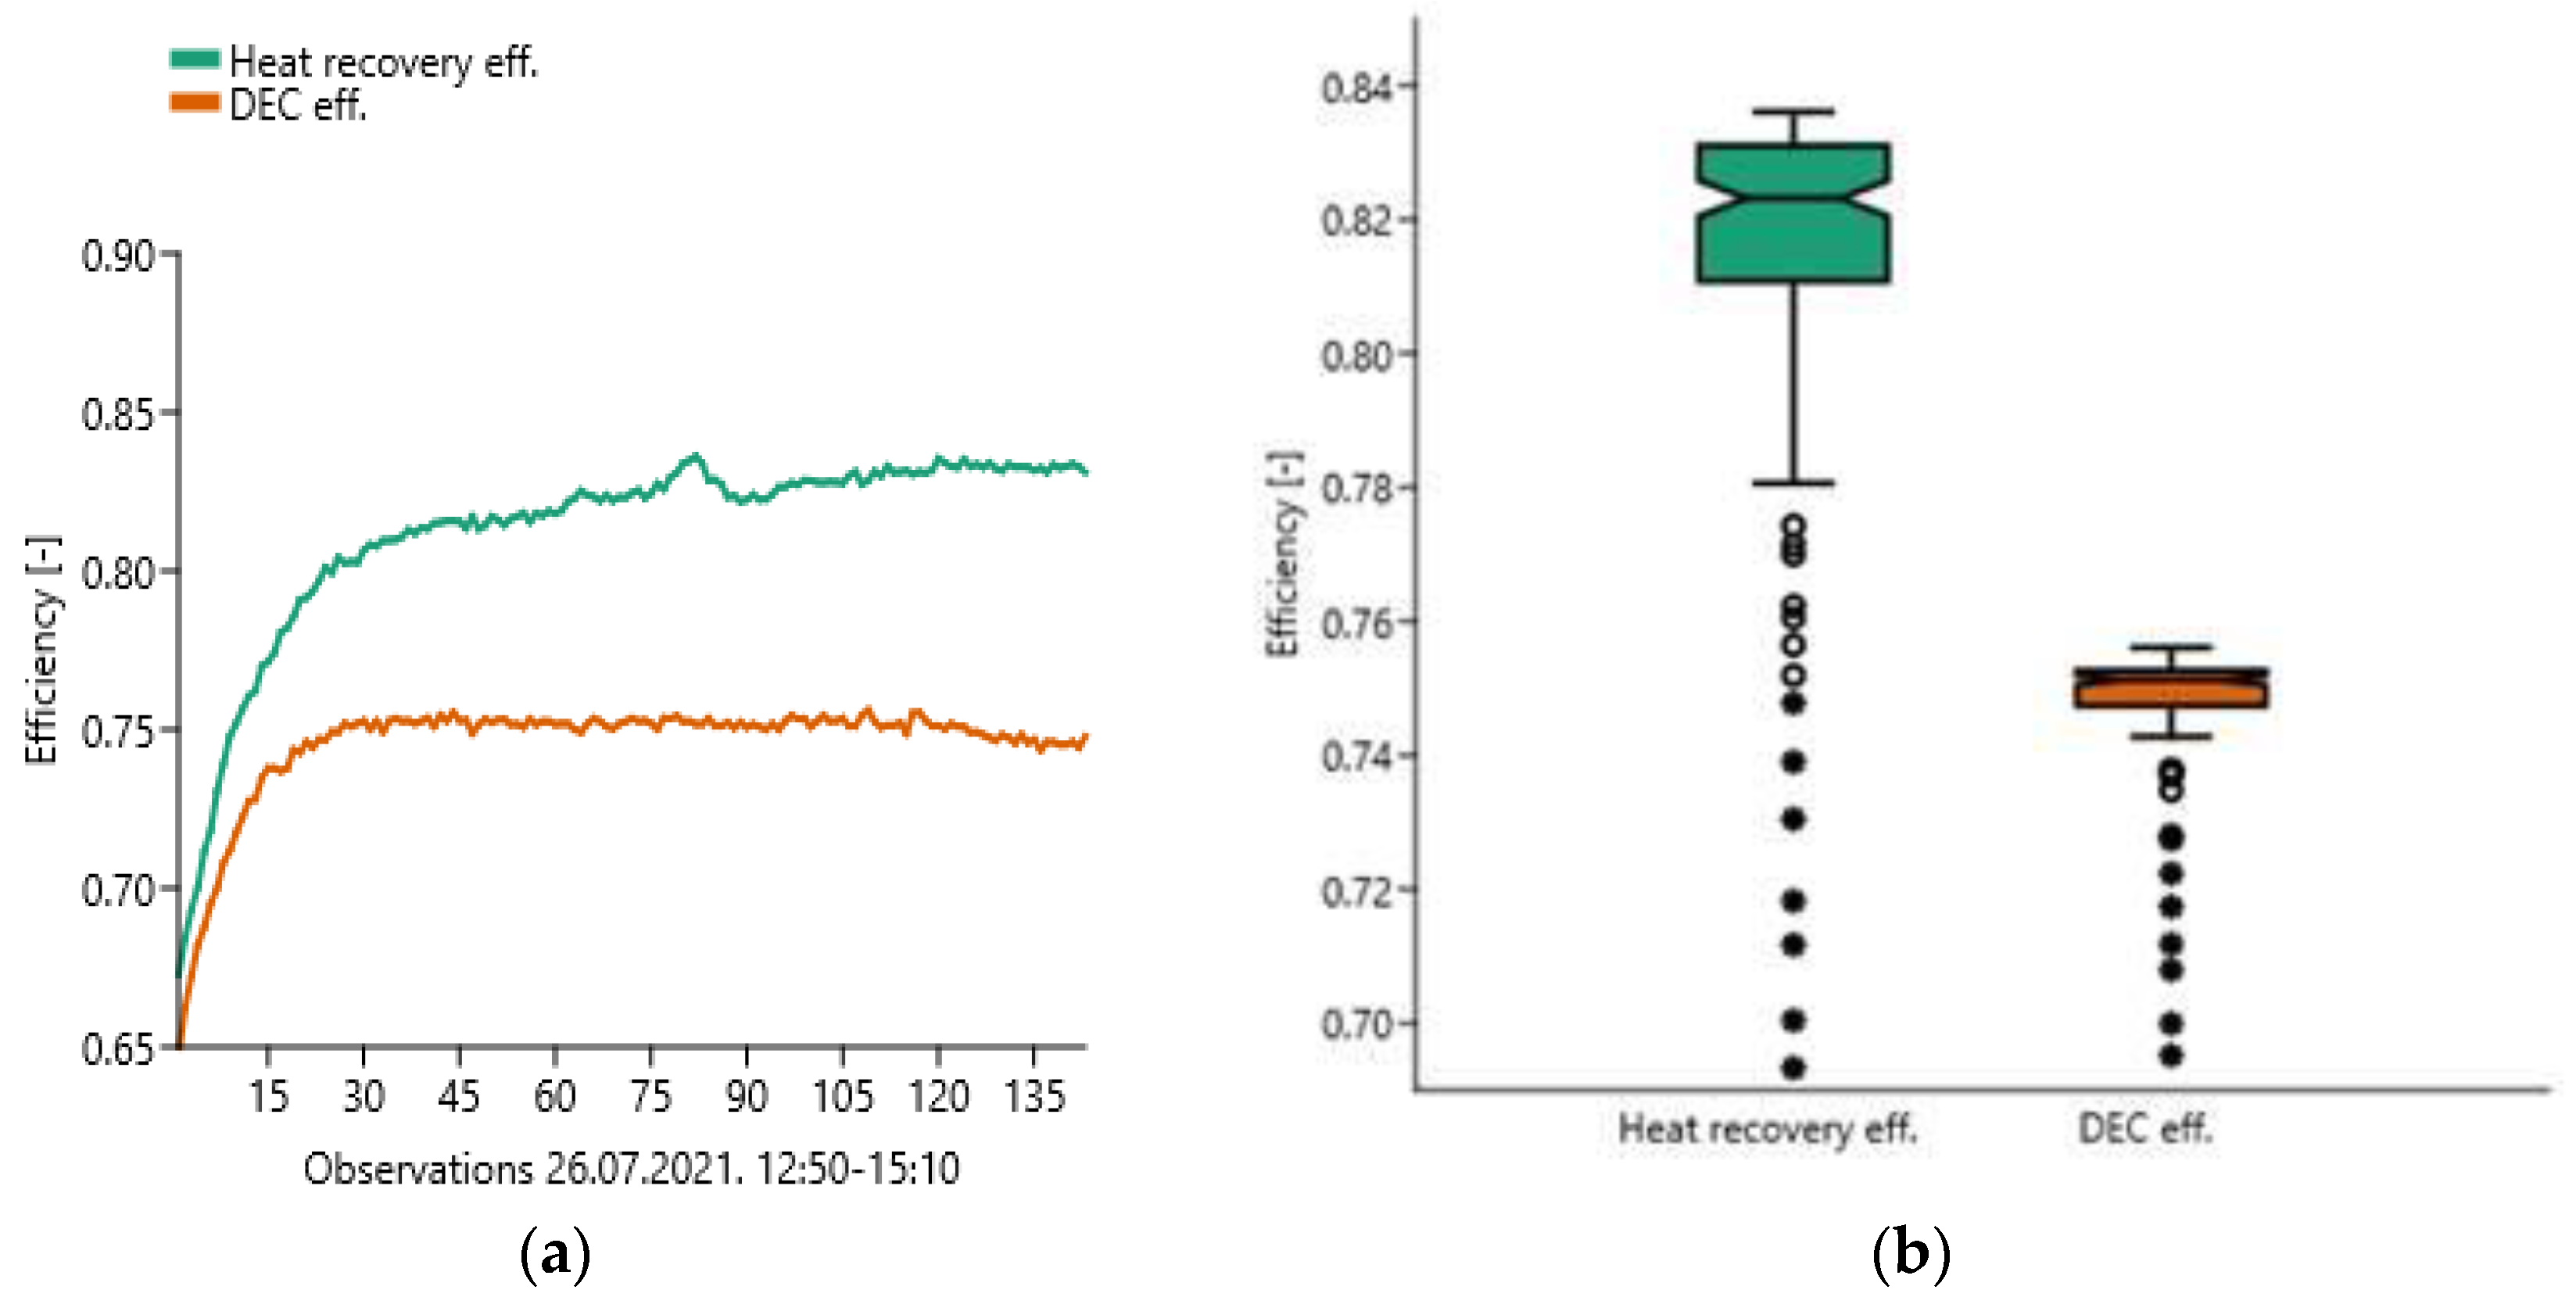
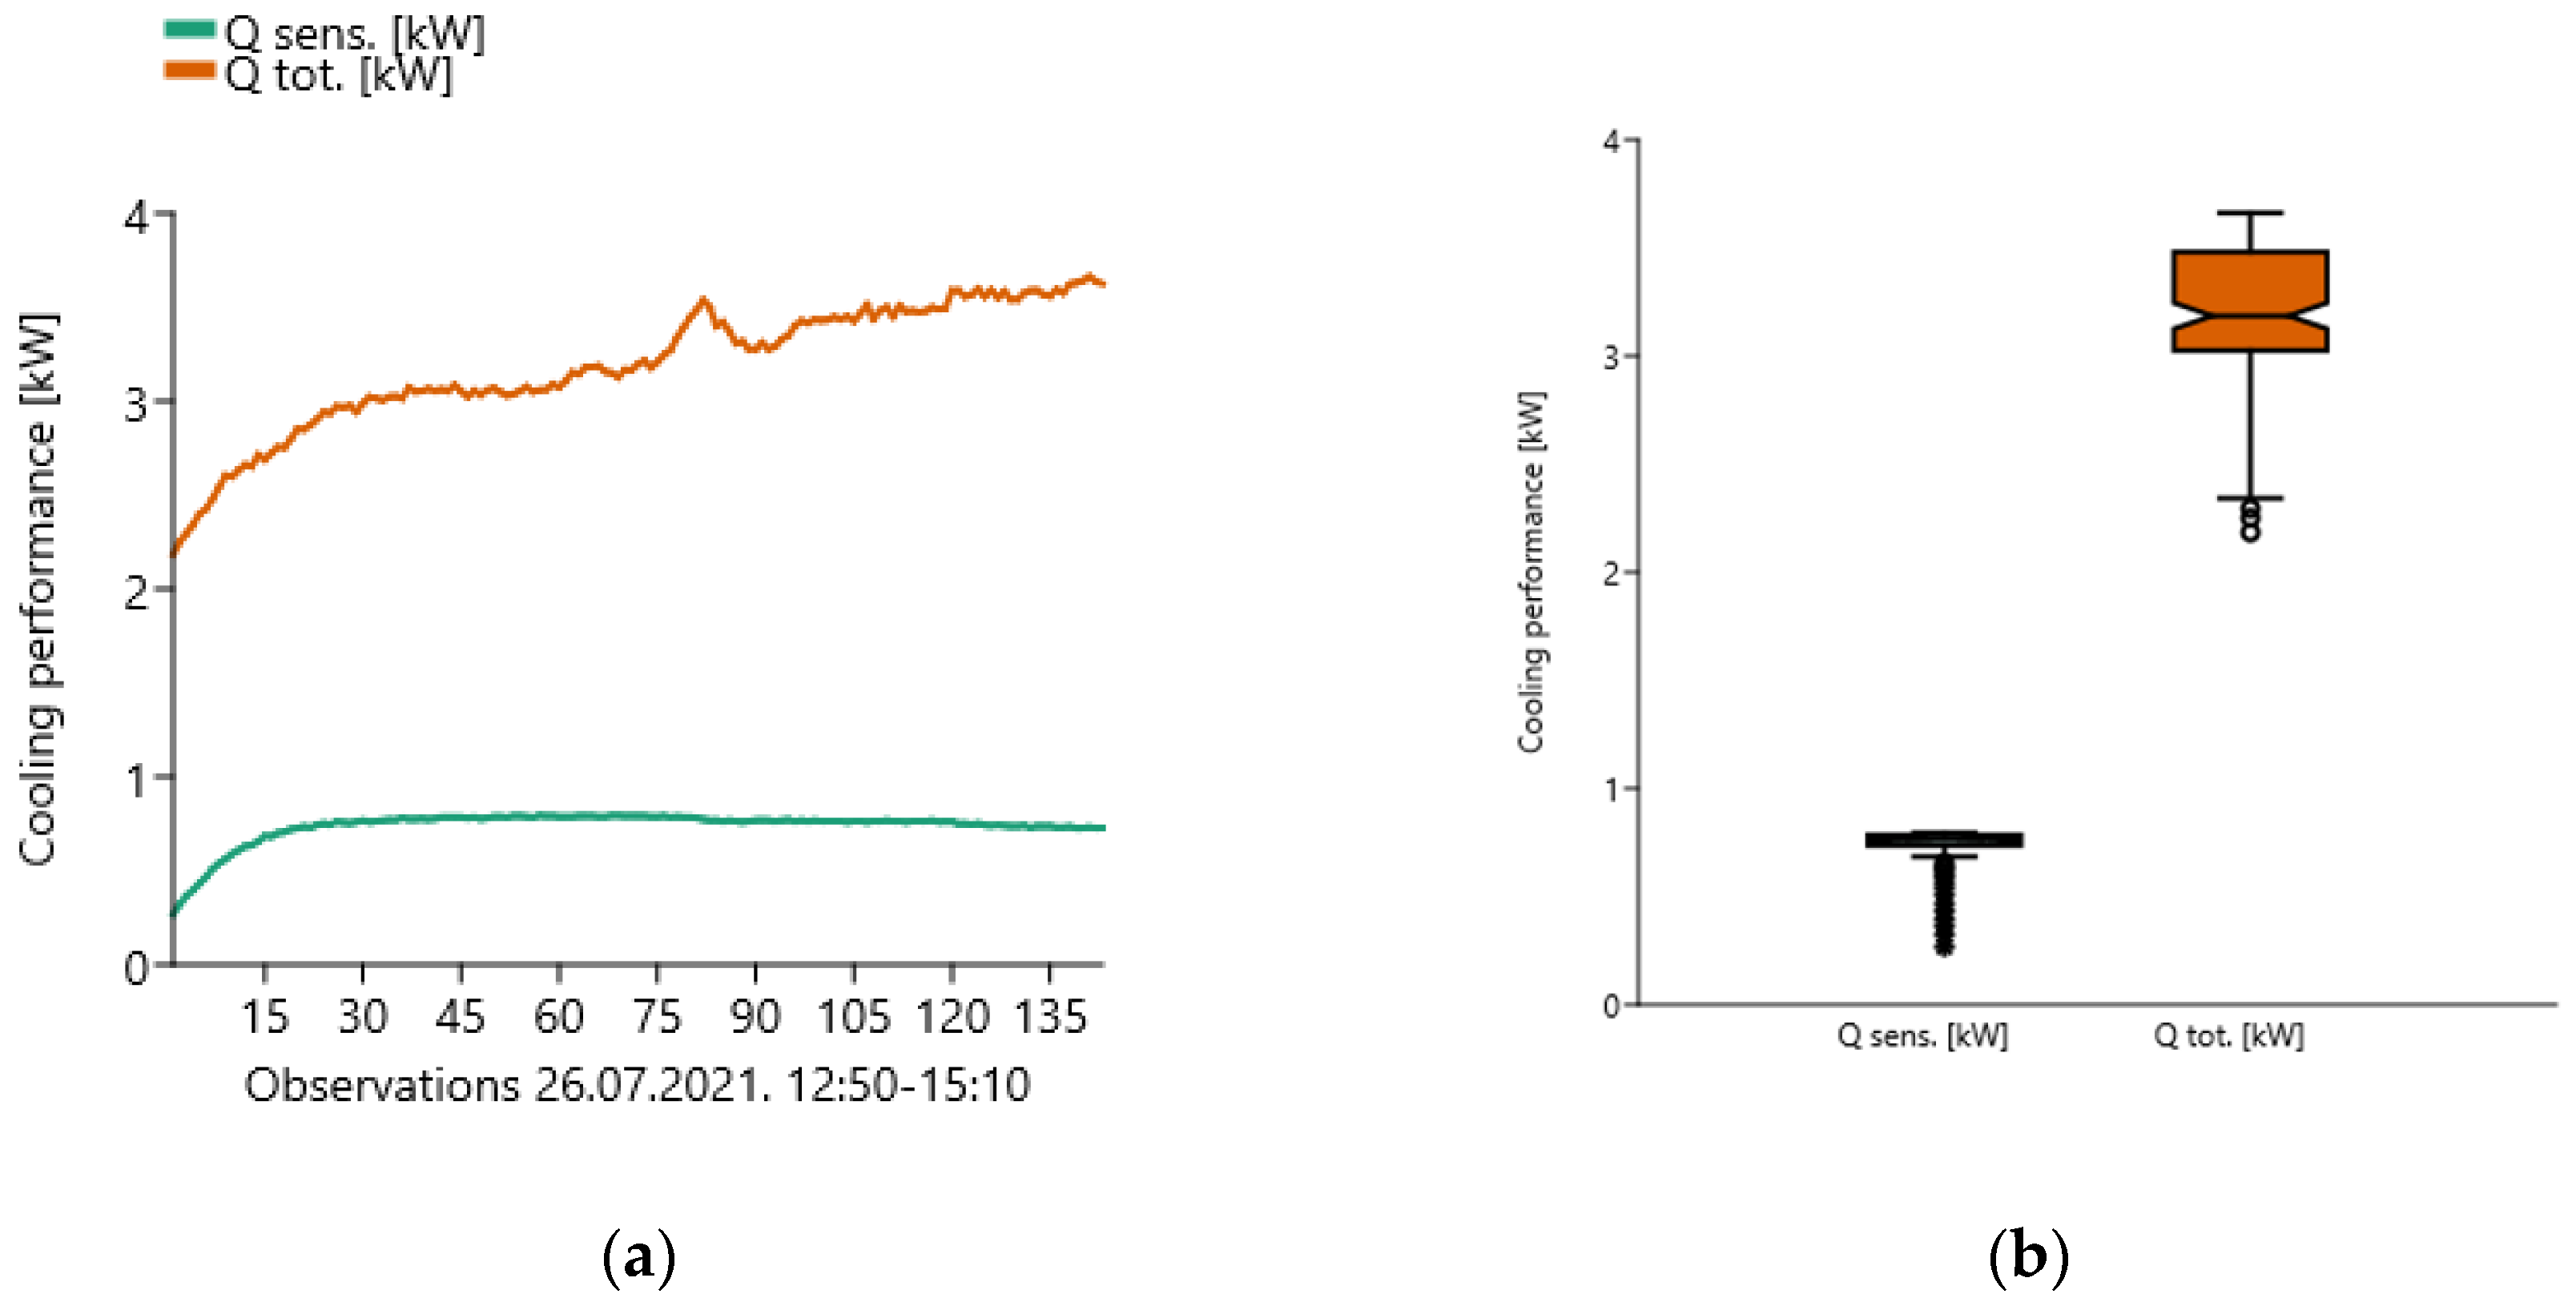
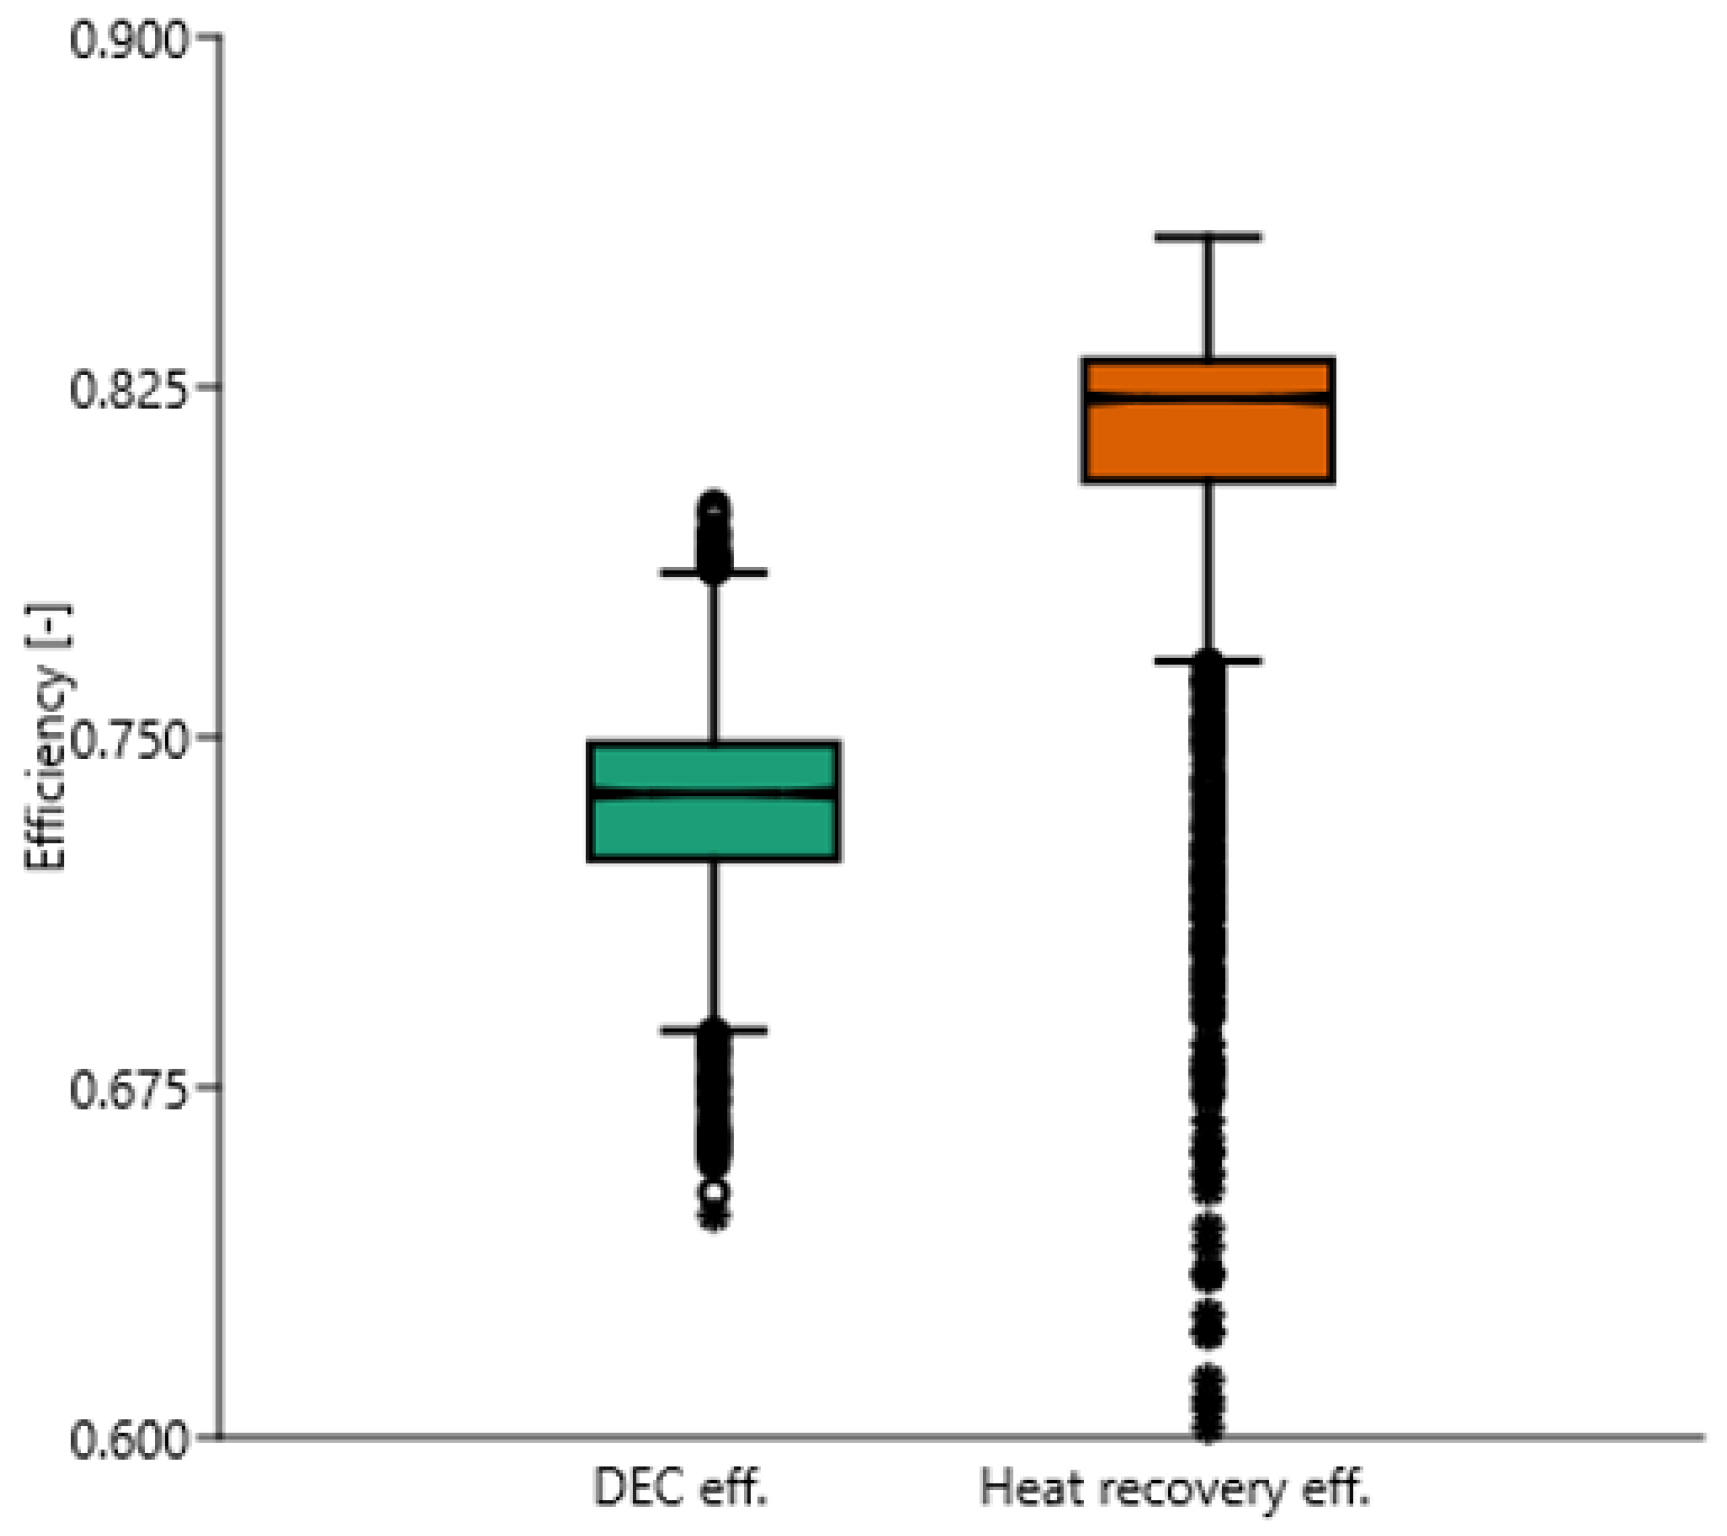
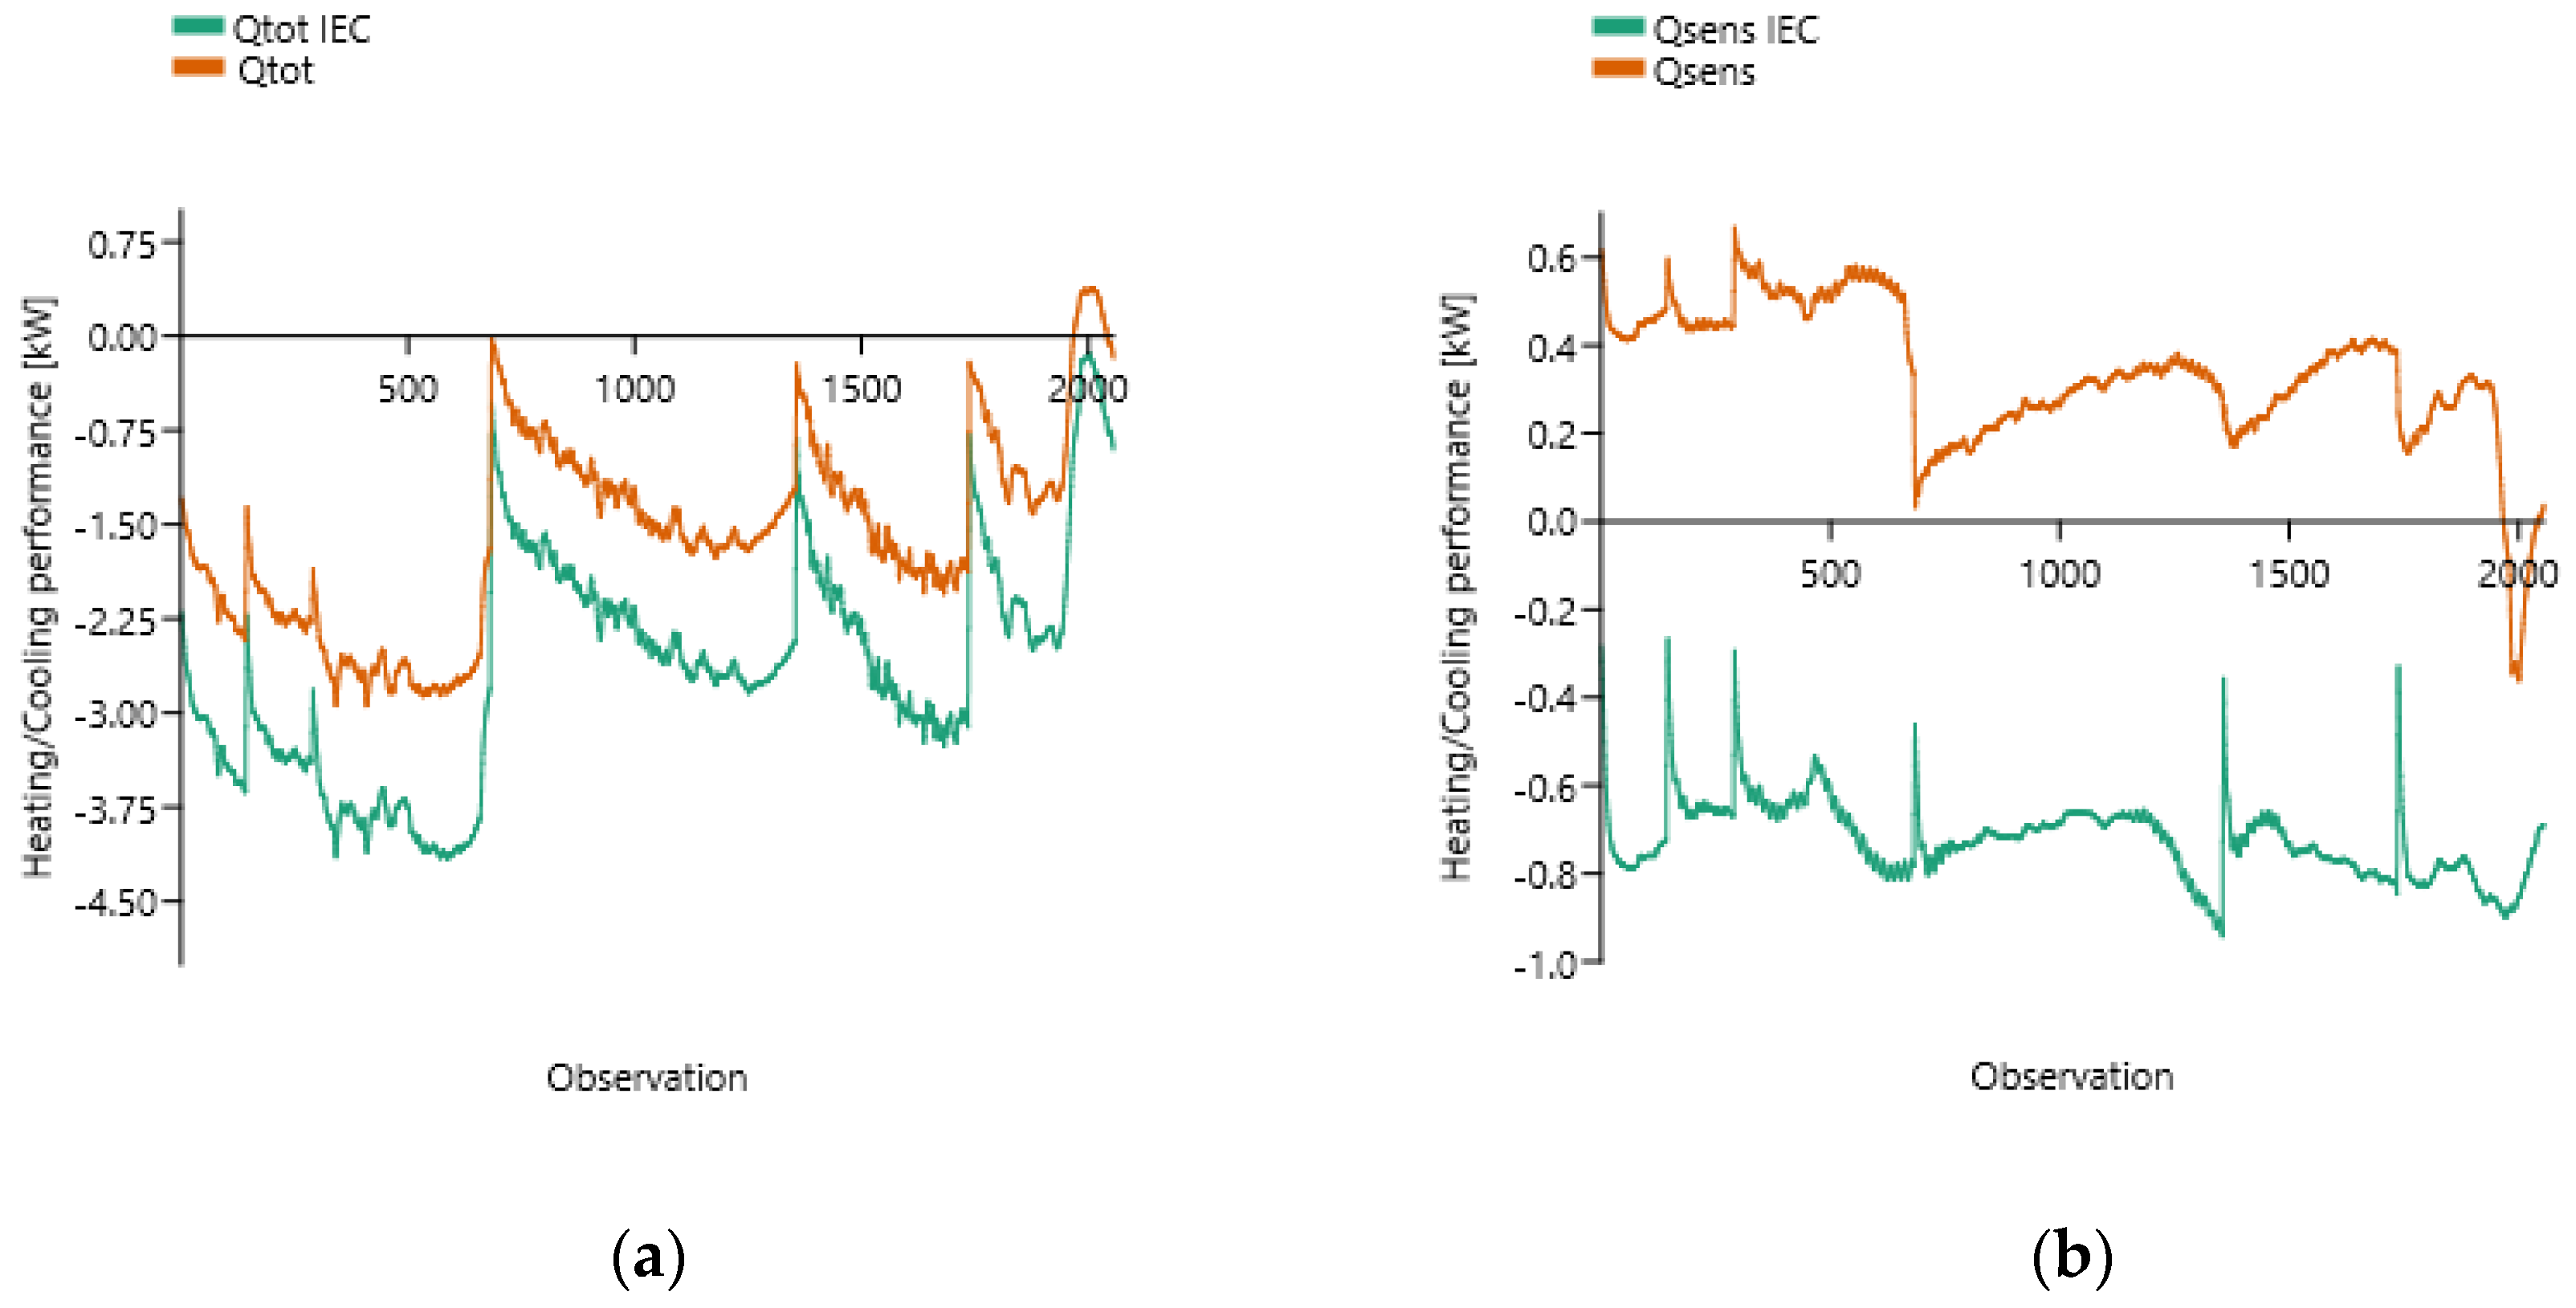
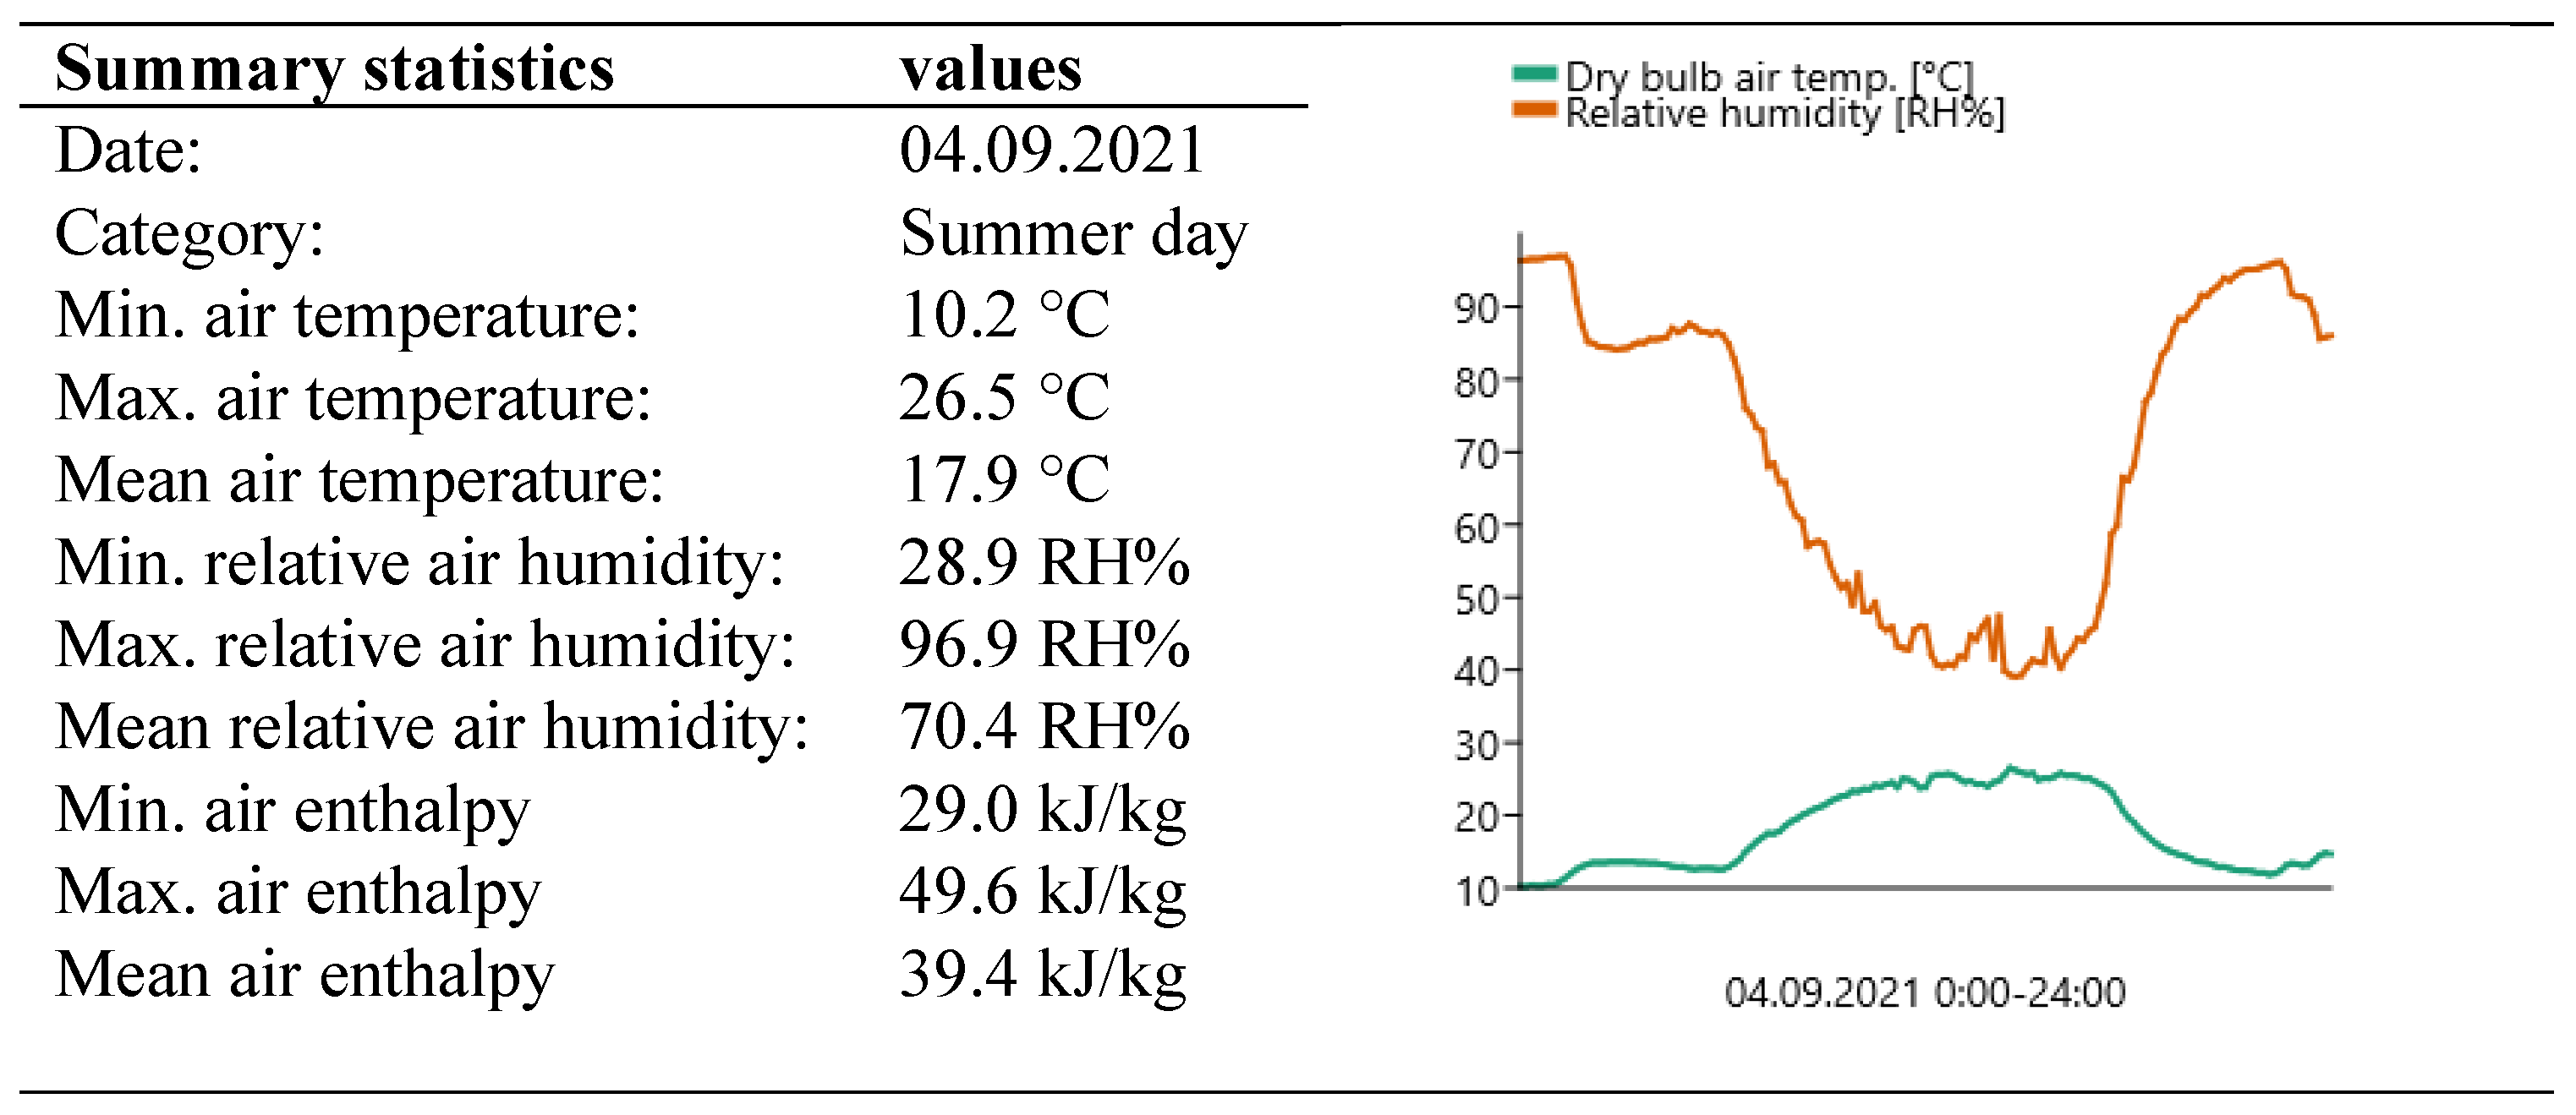
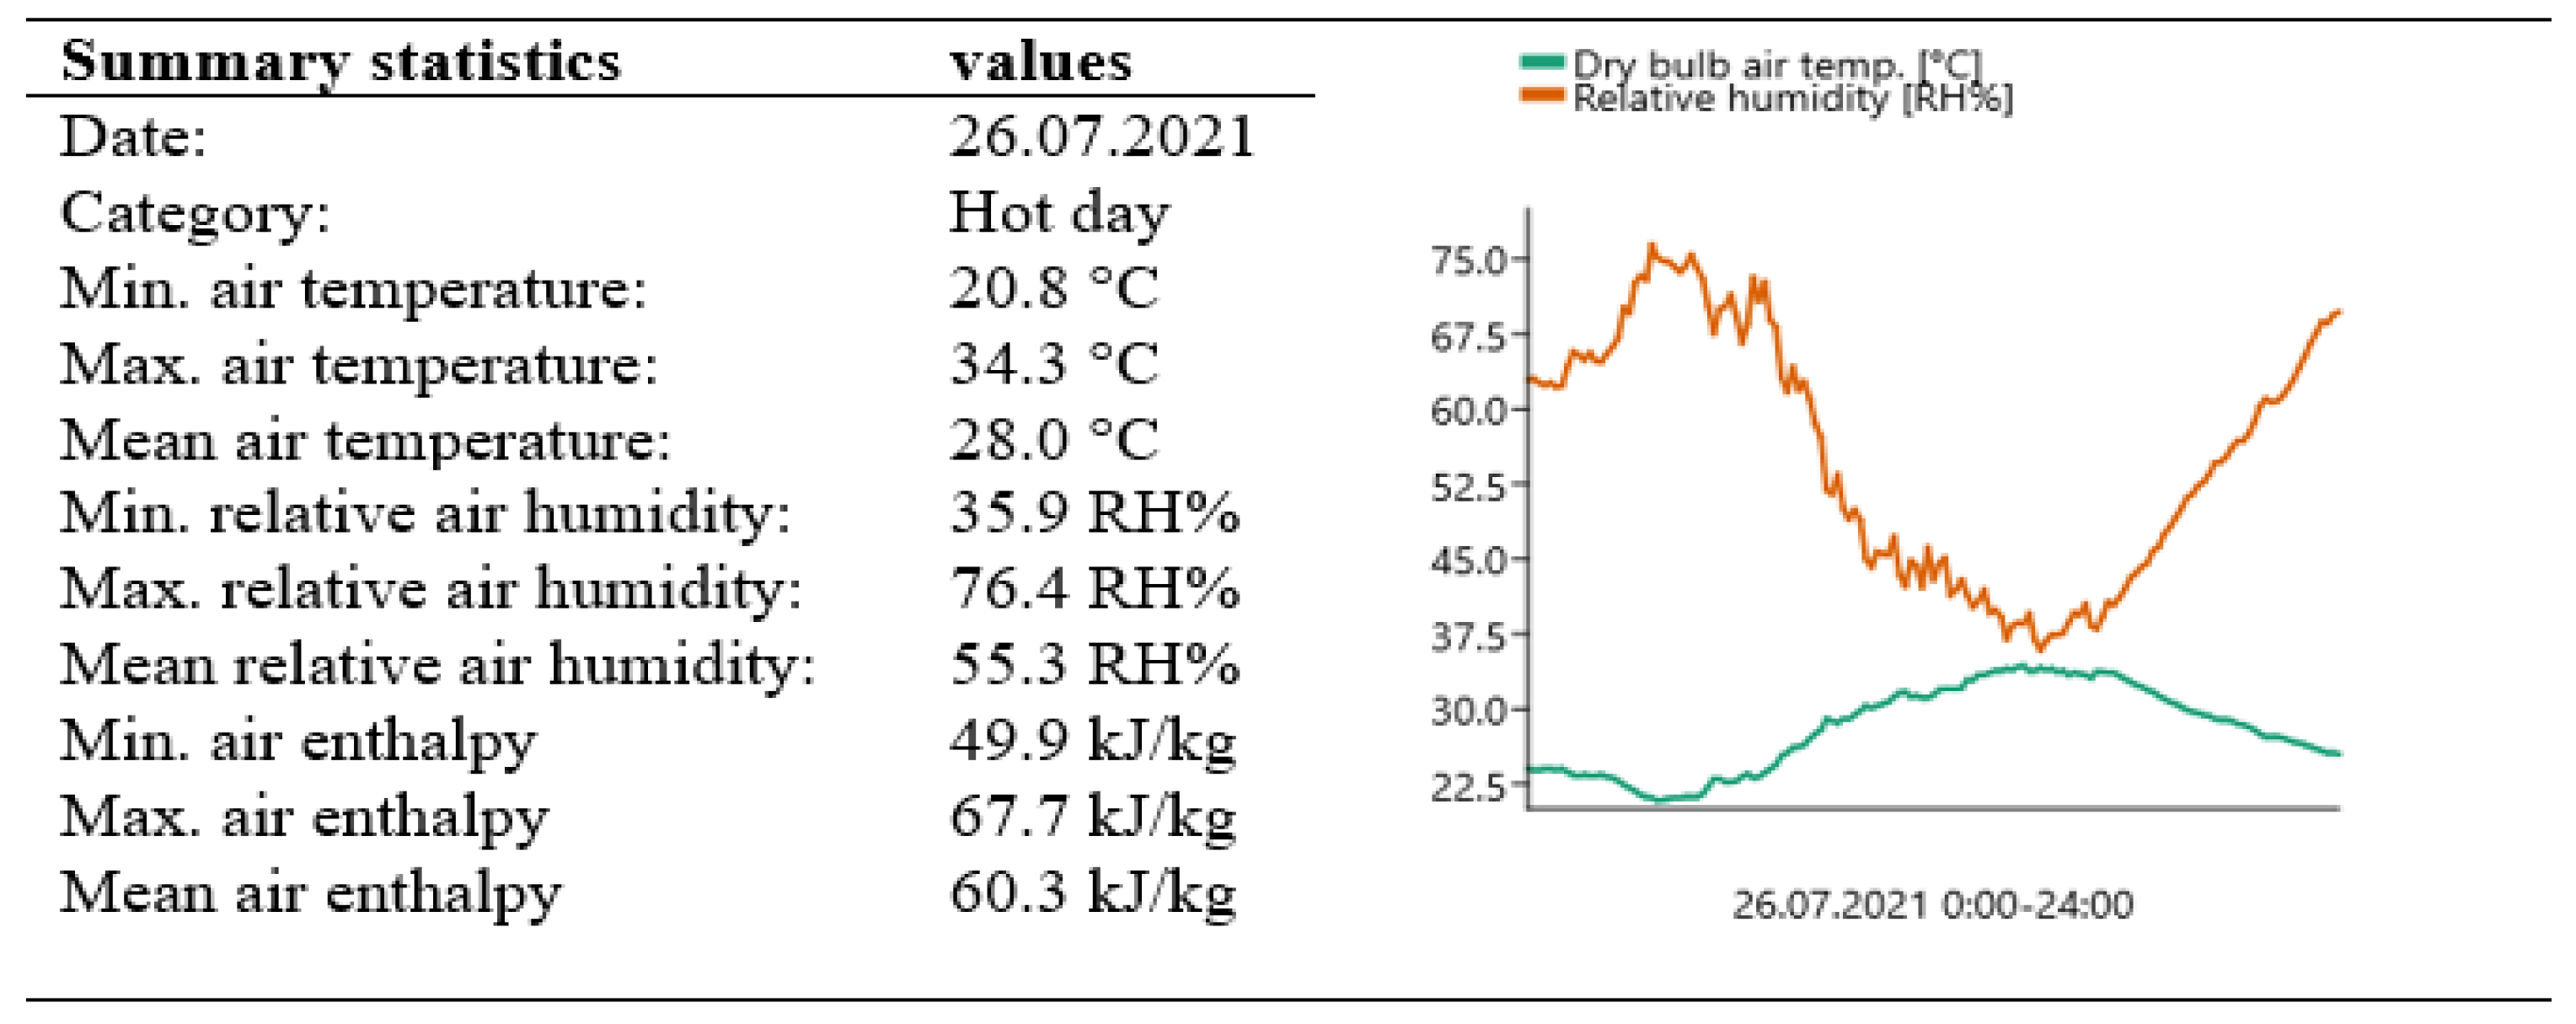
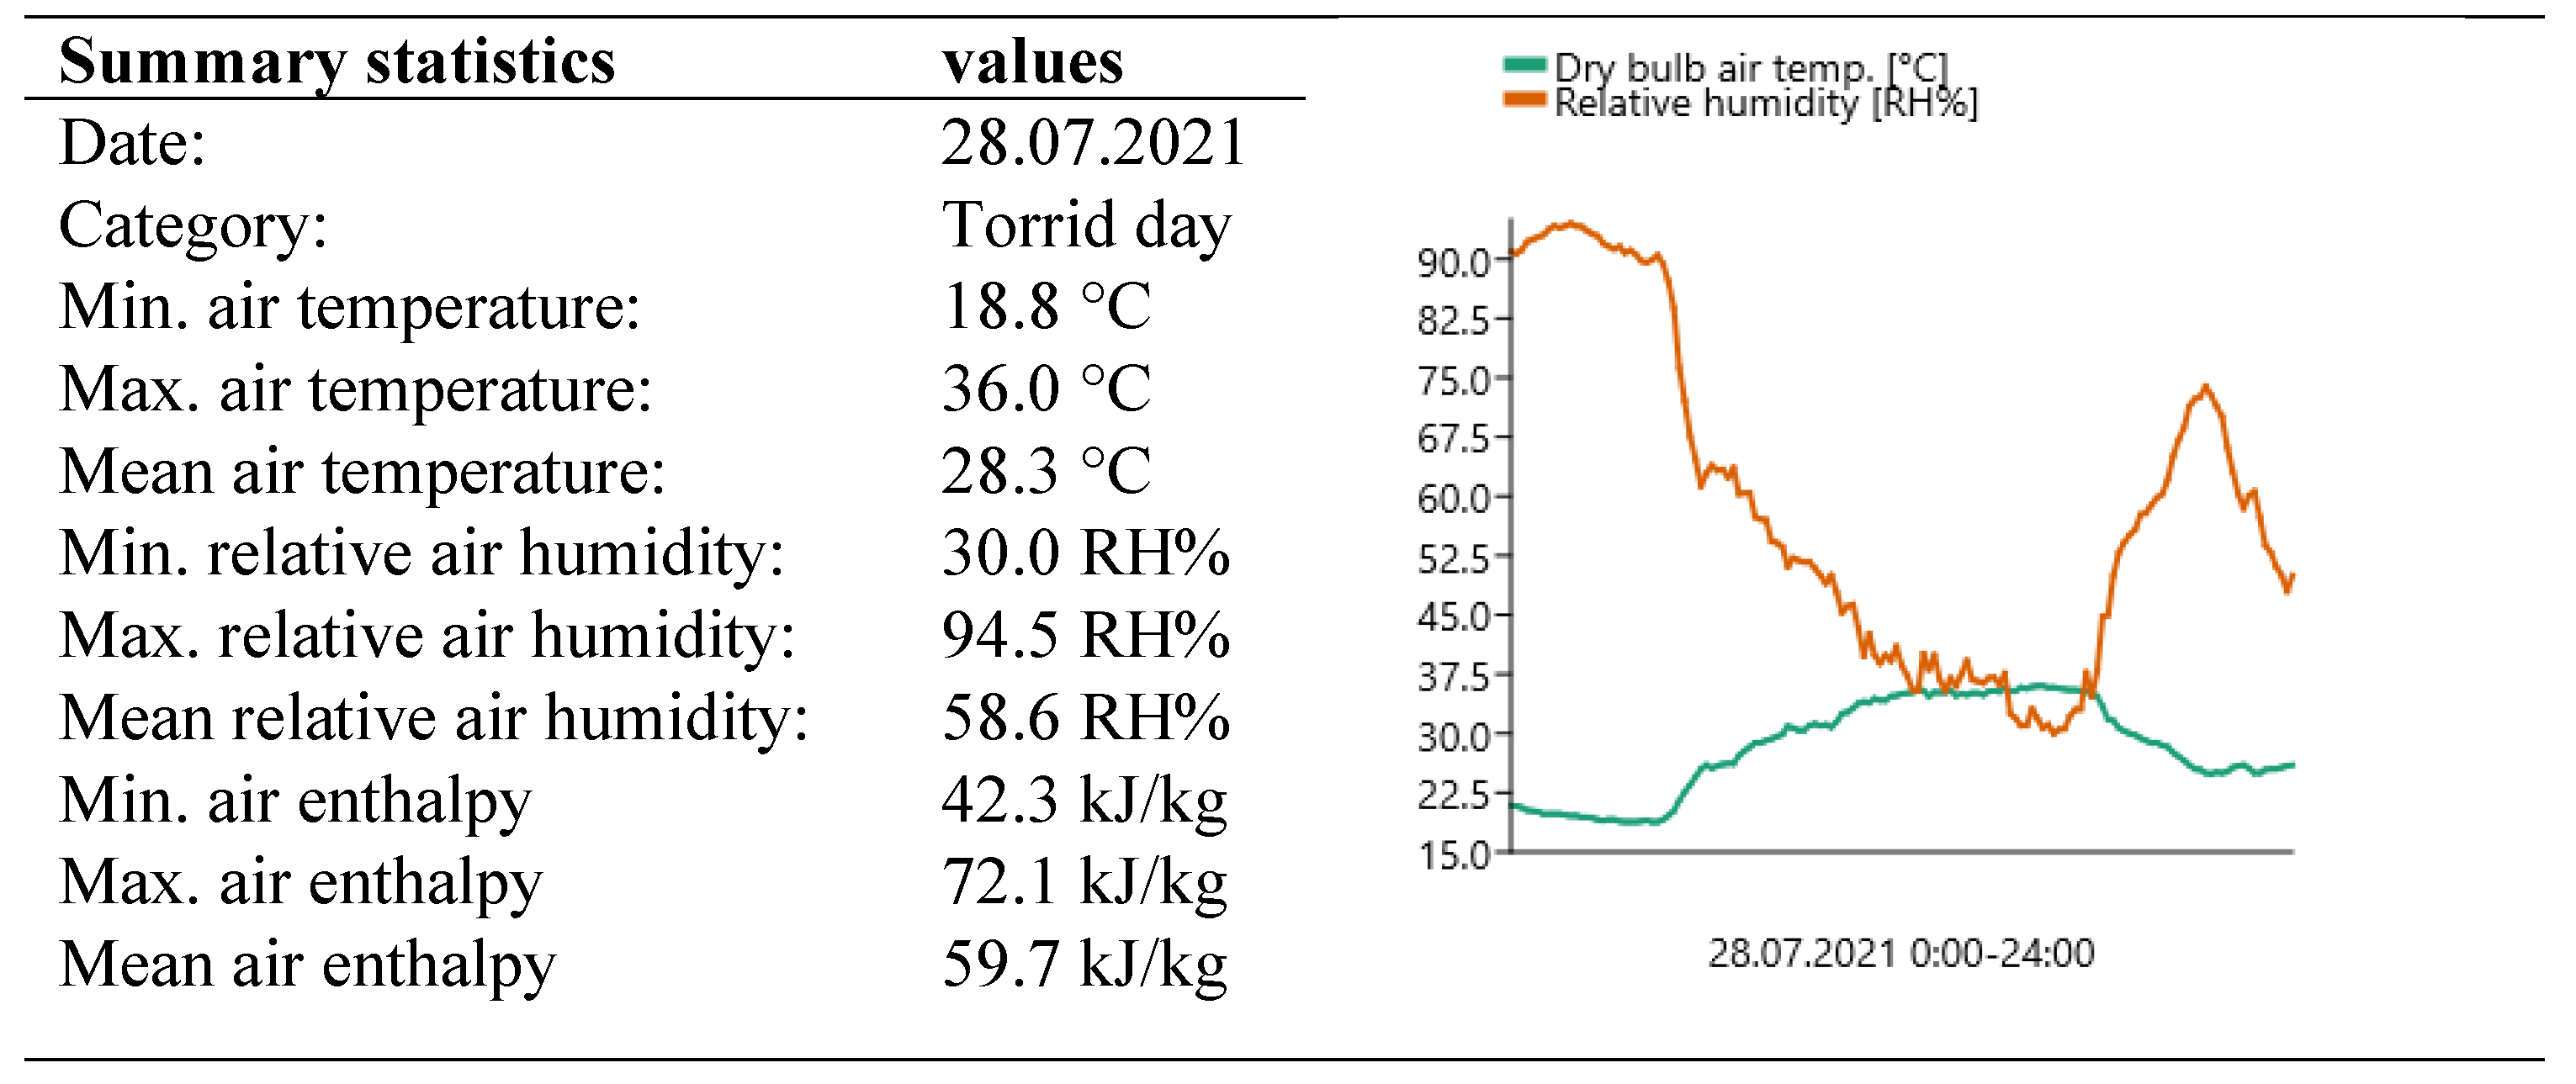
2.3. Presentation of Daily Measurements

The daily measurements were started simultaneously with the operation of the air handling unit and the evaporative cooling unit. The results of the measurement method are presented for the day of 26 July 2021, and the general data of that day are included in the Appendix A [Figure A2]. The measurements were carried out in the same way every day of measurement. The figure shows the changes in temperature and humidity during the measurement period. Since the indoor air state changed only slightly, its treatment with DEC resulted in almost the same air temperature, with little variability. The fresh air treated with the IEC procedure resulted in a lower supply air temperature than the indoor air temperature (Figure 7), so the HVAC system provided sensible cooling performance in the room throughout the measurement period.
Figure 8 demonstrates how the heat recovery and evaporative cooling efficiency (1) build up after the start of the equipment until the quasi-stationary state of the system components is reached. The outlier data points shown in the box plot were also generated during the start-up and ramp-up phases. On the presented measurement day (26 July 2021), the median value of the heat recovery efficiency of the air handling unit was 82.3%, and the median value of the efficiency of the DEC process (4) was 75.1%.
The total and sensible cooling performance values achievable by the IEC procedure can be determined with the help of the measured results. Based on the results of the measurements taken on a given day, the median value of the total cooling performance was 3.18 kW, while the median value of the sensible cooling performance was 0.76 kW (Figure 9).

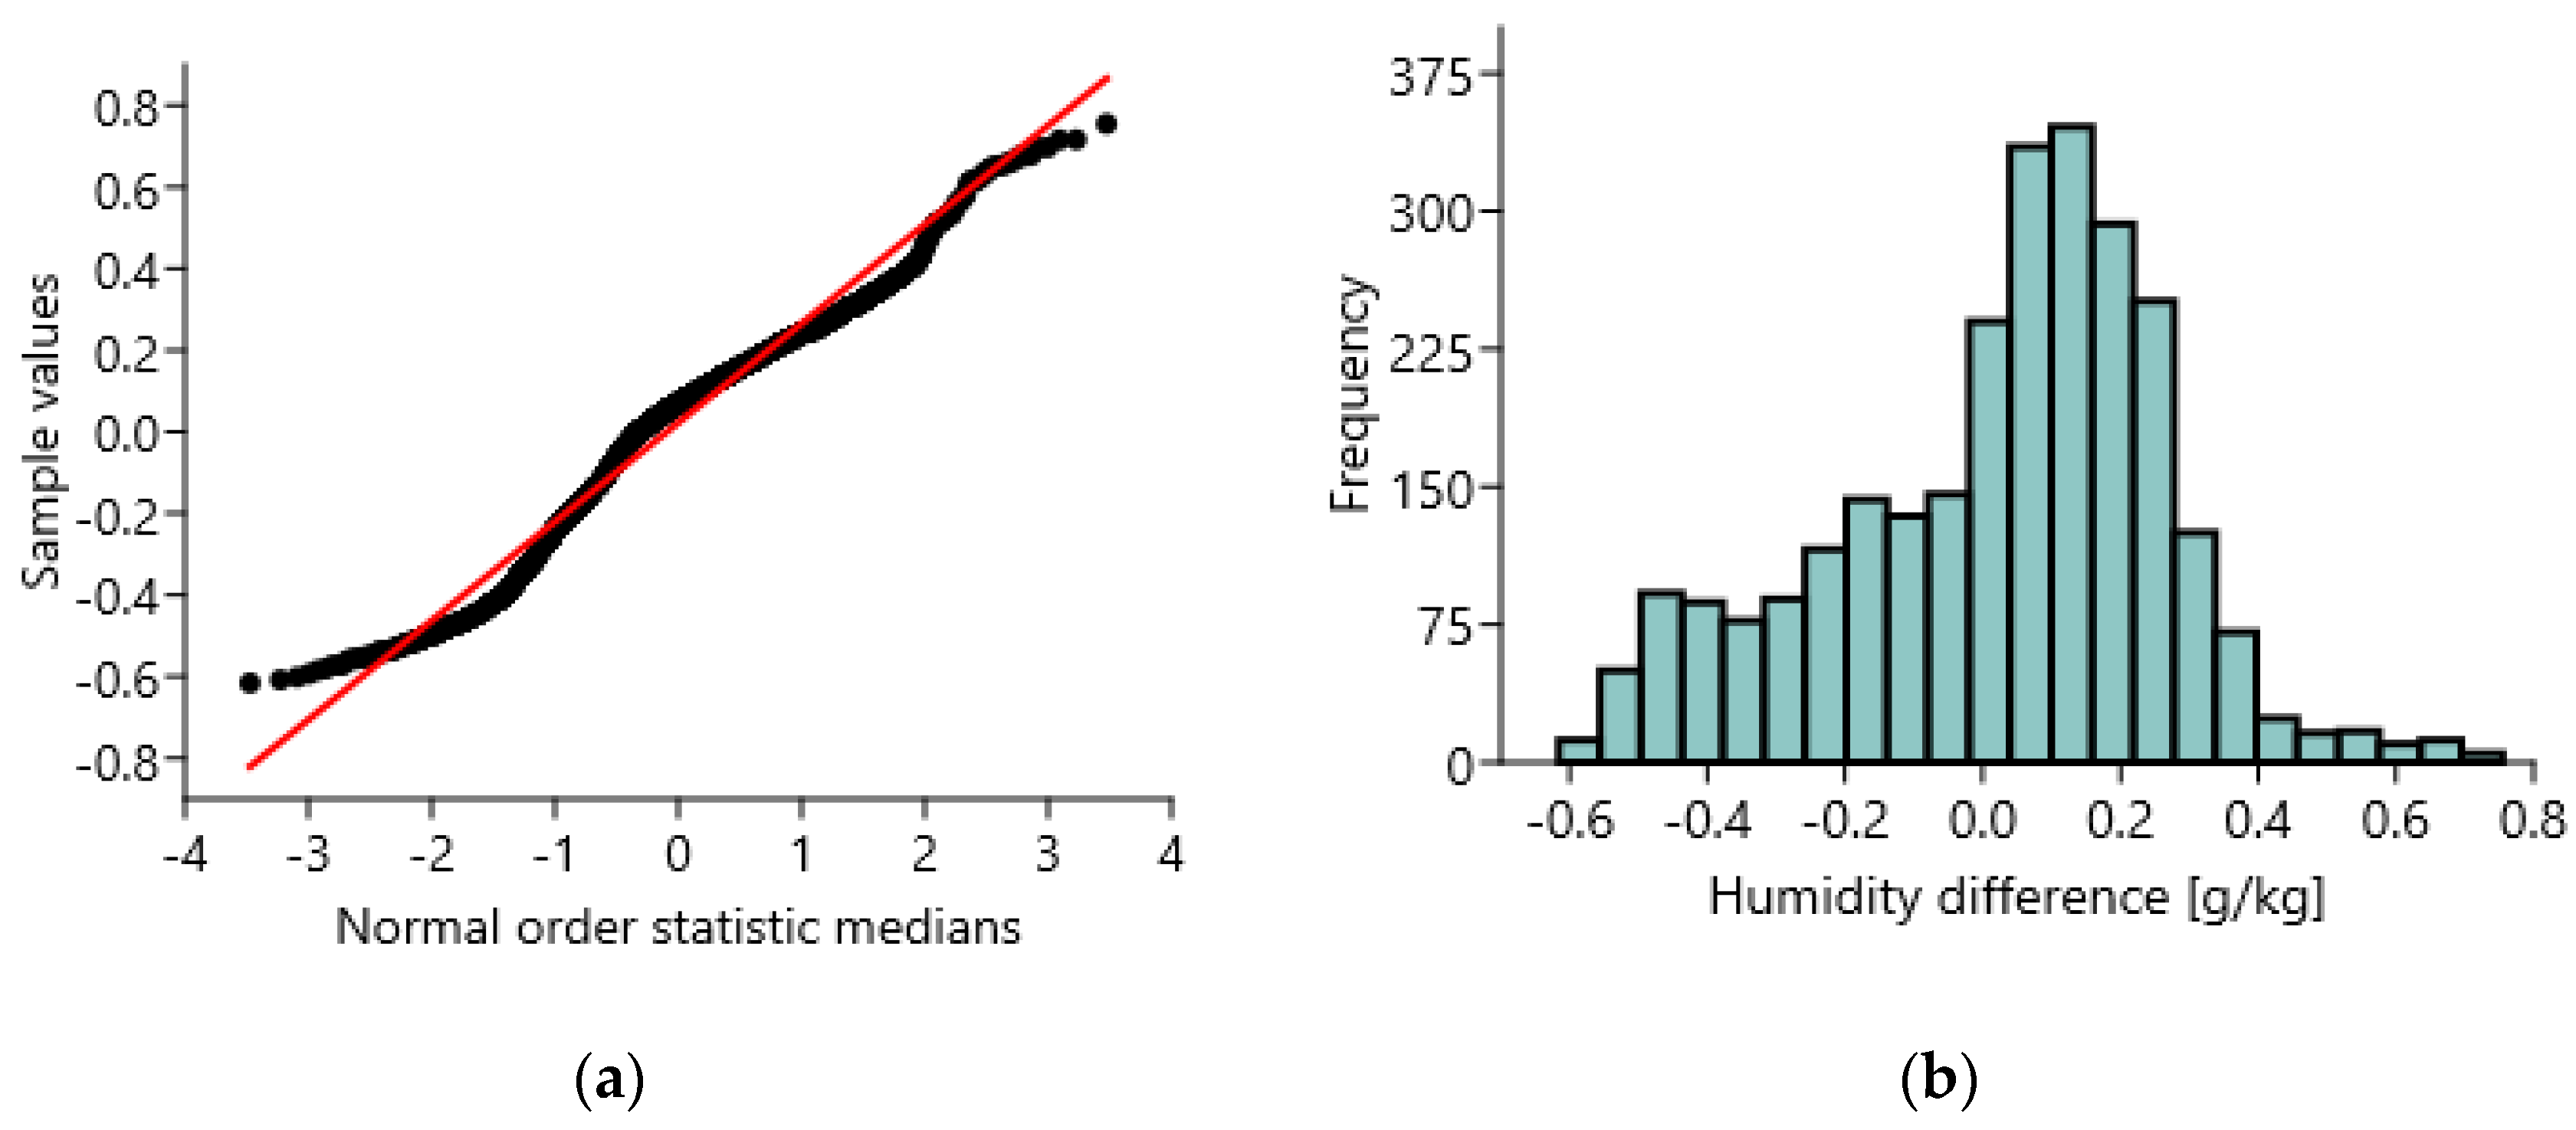
2.4. The Conclusions of the Measurement Series

The above measurements were carried out in the same way on every measurement day. Based on the combined results of the measurement days (Figure 10), the median value of the evaporative efficiency (4) was 0.737 throughout the entire measurement series (19 measurement days). The measured results are consistent with the expected efficiency value according to the literature examined when using cellulose cooling pads [32]. Since the outdoor air conditions have no influence on the DEC, and only the indoor air conditions affect the DEC, these can be combined into one figure (see Figure 10). Similarly, the heat recovery efficiency primarily depends on the technical design of the air handling unit (AHU) and is only slightly affected by the external and internal air conditions. The outlier data points shown in the box plot as mentioned earlier in this paper were generated during the start-up and ramp-up phases of the measurements.
The heat recovery efficiency of the air handling unit was determined using Equation (1). Throughout the entire test period, the median value of the heat recovery efficiency was 0.824. The measured heat recovery efficiency meets the expectations of modern times, so the results of the laboratory tests can be extended to real air handling units. During the measurements, the aim was to examine whether the air handling unit is capable of properly treating the fresh air using only indirect evaporative air cooling. During the measurement period, the total and sensible cooling performance of the heat recovery was examined under the assumption of the same heat recovery efficiency, with an airflow rate of 1000 m3h−1, in both conventional and IEC applications.
Based on the results, significant total cooling performance can be achieved in both cases, but significant sensible cooling performance could only be achieved with the use of the IEC as can be seen in Figure 11. It is important to note that the outdoor absolute humidity load affects the room if the outdoor air humidity is higher than the desired indoor value. The IEC procedure is not capable of handling this humidity load. It is necessary to handle the extra humidity load, which can be achieved either with a built-in condensation temperature below the surface temperature of the cooling coil or with a low-temperature cooling system in the room (fan-coil, VRF systems). With the use of the IEC, the total cooling energy demand of the building is significantly reduced. However, when used alone, the cooling energy required to handle the humidity load must be provided by the supplementary cooling system, which can increase the energy consumption of the supplementary cooling system. Based on the above, there are both reducing and increasing effects on the energy consumption of the supplementary cooling system, so how much cooling energy the supplementary cooling system needs to provide with the use of the IEC cannot be determined simply. This can be examined by using real meteorological data and regulating indoor air conditions.

3. Simulation

The aim of this study was to determine at what internal moisture content unchanged supplementary cooling energy consumption with the application of IEC can be achieved. The results largely depend on the meteorological conditions of the installation area. The investigation was carried out using data from the accredited Agricultural Meteorological Station of the University of Debrecen for the period between 2019 and 2021, from 1 May to 30 September. During the examined periods, the operation of IEC was simulated taking into account the measured data, determining the amount of extra energy required if the indoor target temperature is 25 °C and the allowable maximum indoor relative humidity is 30, 40, 50, 60, 70, 80 RH%. In the calculations, a 0.737 evaporative efficiency was assumed, which determines the amount of evaporated water, and a 0.824 heat recovery efficiency, which can determine the achievable supply air temperature and the felt cooling capacity inside the building.
During the simulation, the calculations were performed while the air handling unit was providing a volume flow rate of 1000 m3h−1, ensuring balanced ventilation. The total cooling energy generated by the IEC during the investigated period (EIEC tot.) was determined, as well as the sensible cooling energy (EIEC sens.). The difference between the extra drying energy demand caused by the supplied air (Edehum.) and the sensible cooling performance determines how much the cooling energy requirement of the additional cooling system changes (ΔEadd.c).
E a d d . c . = E I E C   s e n s . E d e h u m .
The change in the cooling energy used by the supplementary cooling system and the difference between the total cooling energy generated by the IEC determine the total cooling energy that does not need to be covered by any other mechanical cooling when using the IEC (Etot).
E t o t = E I E C   t o t . E a d d . c .
The simulated results are summarized in Table 4, Table 5 and Table 6. The highlighted values in the table represent the most favorable values for each column, while the bolded row shows the results corresponding to the indoor air state with the smallest difference between the sensible cooling and dehumidification energy generated by the IEC.
If the set relative humidity is low in indoor environments, the cooling energy that can be extracted by the IEC process increases because the indoor air, at a given evaporative efficiency, can absorb more moisture. Therefore, in the examined cases, EIEC tot. and EIEC sens. are at their maximum at 25 °C and 30% RH. However, the lower the maximum relative humidity set in the indoor environment, the higher the moisture load introduced by the outdoor air, which increases the cooling energy demand of the additional cooling systems due to the increased energy required for dehumidification. In terms of minimizing the energy devoted to managing the moisture load (Edehum.), the most favorable indoor air condition among the examined cases is at a maximum allowable condition of 25 °C and 80% RH for the purpose of minimizing the energy devoted to managing the moisture load.
Since the energy devoted to managing the moisture load is at a maximum at 25 °C and 30% RH, the largest decrease in cooling energy with the application of the IEC (Etot) does not necessarily coincide with the maximum value of EIEC tot. Based on the simulation results, it can be seen that the maximum Etot is at 25 °C and 50% RH in 2019, 25 °C and 70% RH in 2020, and 25 °C and 60% RH in 2021.
According to the simulated results, based on the results of the years 2019, 2020, and 2021, if the acceptable maximum humidity inside is 60RH%, the excess dehumidification energy and the IEC-induced sensible cooling energy input almost balance each other during the cooling season. In this study, at the examined 25 °C indoor temperature, the 60RH% air condition is at the limit and falls into the acceptable range under office conditions (0.5 clo; 1.1 met, 0.1 m/s) [21]. The maximum relative humidity inside was determined by the above simulation, so the simulated limit air condition can only be considered as an upper limit.
Based on the above simulation, the acceptable hottest and most humid indoor air condition in this case is 25 °C 60 RH%. For this indoor air condition, it is necessary to examine which outdoor air conditions can be efficiently handled only using the IEC procedure in the air handling unit (Figure 12). Knowing the indoor air condition (25 °C, 60 RH%), the evaporative efficiency (0.737), and the heat recovery efficiency (0.824), the isotherm or the sub-isotherm inlet temperature working field can be determined using Equations (6), (10) and (12), as can be seen in Figure 12.
Based on the determined limit values and operational parameters, it can be concluded that, considering the examined meteorological data, the air handling unit is capable of achieving sensible cooling performance solely by utilizing the IEC throughout the entire cooling season at the installation site.

4. Conclusions

By using IEC (Indirect Evaporative Cooling), the cooling demand of air handling units can be significantly reduced. With the increase in heat recovery efficiency of air handling units, it has become possible to achieve supply air temperatures lower than the indoor air temperature and achieve sensible cooling performance during a significant part or even the entire cooling season, exclusively through the application of IEC.
With the help of the presented connections in this study, it is possible to determine the operating range where sensible cooling performance can be achieved exclusively through the application of IEC, considering the specific equipment characteristics and desired indoor air conditions. Based on the measurements and taking into account meteorological data, it can be stated that in the investigated area with a continental European climate, significant cooling performance can be achieved throughout the entire cooling season. The presented diagnostic and computational method can be extended and implemented in any installation location.
The fact that sensible cooling performance can be achieved over a wide operational range with the IEC procedure does not necessarily mean that the cooling energy generated by supplementary cooling systems decreases, as the moisture load from the outdoor environment cannot be fully or partially managed with the IEC procedure. It is recommended to combine the IEC procedure with supplementary cooling systems operating below the dew point temperature to serve high-quality comfort spaces.
Under conditions of equilibrium absolute humidity corresponding to the given supply air volume flow rate, the HVAC system does not cause changes in cooling energy from the perspective of supplementary cooling systems serving the indoor space (the cooling energy demand of the air handling unit decreases significantly).
If we want to maintain absolute humidity in the indoor environment lower than the equilibrium state, efforts should be made to minimize the quantity of fresh air and the associated moisture load for reducing the cooling energy demand. However, if the acceptable absolute humidity in the indoor environment is above the equilibrium state, increasing the airflow managed by the IEC can reduce the energy demand of supplementary cooling systems.
Based on the examined meteorological data, it has been determined at what indoor air conditions the additional energy required for dehumidification and the decreased cooling energy demand due to the sensible cooling performance of the IEC procedure balance each other, considering a given airflow rate. In the studied case, the near-equilibrium state can be achieved with a maximum allowable indoor air condition of 25 °C and 60% relative humidity, resulting in acceptable comfort conditions in an office environment.

Author Contributions

Conceptualization, A.K., S.S. and I.C.; methodology, A.K., S.S. and I.C.; software, A.K., S.S. and I.C.; validation, A.K., S.S. and I.C.; formal analysis, A.K., S.S. and I.C.; investigation, A.K., S.S. and I.C.; resources, A.K., S.S. and I.C.; data curation, A.K., S.S. and I.C.; writing—original draft preparation, A.K., S.S. and I.C.; writing—review and editing, A.K., S.S. and I.C.; visualization, A.K., S.S. and I.C.; supervision, I.C.; project administration, A.K., S.S. and I.C.; funding acquisition, A.K., S.S. and I.C. All authors have read and agreed to the published version of the manuscript.

Funding

Project no. TKP2021-NKTA-34 has been implemented with support provided by the National Research, Development and Innovation Fund of Hungary, financed under the TKP2021-NKTA funding scheme.

Institutional Review Board Statement

Not applicable.

Informed Consent Statement

Not applicable.

Data Availability Statement

Not applicable.

Conflicts of Interest

The authors declare no conflict of interest.

Abbreviations

List of symbols
cpaspecific heat of the air at constant pressure [kJ kg−1K−1]
cpvspecific heat of the water vapor at constant pressure [kJ kg−1K−1]
Ecooling energy [kJ; kWh]
henthalpy [kJ kg−1]
Ttemperature [°C]
Twbwet-bulb temperature [°C]
xhumidity ratio of air [kgv/kga]
rlatent heat of vaporization [kJ kg−1]
Qcooling performance [kW]
Greek symbols
ηeffectiveness of heat recovery unit [%]
εeffectiveness of direct evaporative cooling [%]
Δthe sum of differences [-]
Abbreviations
DECdirect evaporative air cooling
IECindirect evaporative air cooling
RHrelative humidity
Subscripts
add. cvalue of the additional cooling system
dehumdehumidification value
eafter evaporative cooling
iindoor
ininput value
ooutdoor
o, limitlimit of the outdoor value
outoutput value
rsrecovery unit, supply side
rerecovery unit, exhaust side
ssupply
senssensible
xextract
out wbwet-bulb value of the output value
vwater vapor
tottotal

Appendix A

Figure A1. Main information about a typical “Summer day” during the measurement.
Buildings 13 01800 g0a1
Figure A2. Main information about a typical “Hot day” during the measurement.
Buildings 13 01800 g0a2
Figure A3. Main information about a typical “Torrid day” during the measurement.
Buildings 13 01800 g0a3

References

  1. Fisenko, S.; Brin, A.; Petruchik, A. Evaporative cooling of water in a mechanical draft cooling tower. Int. J. Heat Mass Transf. 2004, 47, 165–177. [Google Scholar] [CrossRef]
  2. Harby, K.; Gebaly, D.R.; Koura, N.S.; Hassan, M.S. Performance improvement of vapor compression cooling systems using evaporative condenser: An overview. Renew. Sustain. Energy Rev. 2016, 58, 347–360. [Google Scholar] [CrossRef]
  3. Ketwong, W.; Deethayat, T.; Kiatsiriroat, T. Performance enhancement of air conditioner in hot climate by condenser cooling with cool air generated by direct evaporative cooling. Case Stud. Therm. Eng. 2021, 26, 101127. [Google Scholar] [CrossRef]
  4. He, J. A design supporting simulation system for predicting and evaluating the cool microclimate creating effect of passive evaporative cooling walls. Build. Environ. 2011, 46, 584–596. [Google Scholar] [CrossRef]
  5. Bishoyi, D.; Sudhakar, K. Experimental performance of a direct evaporative cooler in composite climate of India. Energy Build. 2017, 153, 190–200. [Google Scholar] [CrossRef] [Green Version]
  6. Xuan, Y.; Xiao, F.; Niu, X.; Huang, X.; Wang, S. Research and applications of evaporative cooling in China: A review (II)—Systems and equipment. Renew. Sustain. Energy Rev. 2012, 16, 3523–3534. [Google Scholar] [CrossRef]
  7. Tewari, P.; Mathur, S.; Mathur, J.; Loftness, V.; Abdul-Aziz, A. Advancing building bioclimatic design charts for the use of evaporative cooling in the composite climate of India. Energy Build. 2019, 184, 177–192. [Google Scholar] [CrossRef]
  8. Sonawane, T.; Patil, S.; Dube, A.; Chaudhari, B.D.; Sonawane, T.R.; Patil, S.M. A Review on Evaporative Cooling Technology Performance assesment of green supply chain practice View project Design of off grid solar roof top system View project A Review on Evaporative Cooling Technology. Int. J. Res. Advent Technol. 2015, 3, 88–96. Available online: https://www.researchgate.net/publication/295448903 (accessed on 9 July 2023).
  9. Duan, Z.; Zhan, C.; Zhang, X.; Mustafa, M.; Zhao, X.; Alimohammadisagvand, B.; Hasan, A. Indirect evaporative cooling: Past, present and future potentials. Renew. Sustain. Energy Rev. 2012, 16, 6823–6850. [Google Scholar] [CrossRef]
  10. Xuan, Y.; Xiao, F.; Niu, X.; Huang, X.; Wang, S. Research and application of evaporative cooling in China: A review (I)—Research. Renew. Sustain. Energy Rev. 2012, 16, 3535–3546. [Google Scholar] [CrossRef]
  11. Min, Y.; Chen, Y.; Shi, W.; Yang, H. Applicability of indirect evaporative cooler for energy recovery in hot and humid areas: Comparison with heat recovery wheel. Appl. Energy 2021, 287, 116607. [Google Scholar] [CrossRef]
  12. Delfani, S.; Esmaeelian, J.; Pasdarshahri, H.; Karami, M. Energy saving potential of an indirect evaporative cooler as a pre-cooling unit for mechanical cooling systems in Iran. Energy Build. 2010, 42, 2169–2176. [Google Scholar] [CrossRef]
  13. Min, Y.; Chen, Y.; Yang, H. A statistical modeling approach on the performance prediction of indirect evaporative cooling energy recovery systems. Appl. Energy 2019, 255, 113832. [Google Scholar] [CrossRef]
  14. Noor, S.; Ashraf, H.; Sultan, M.; Khan, Z.M. Evaporative Cooling Options for Building Air-Conditioning: A Comprehensive Study for Climatic Conditions of Multan (Pakistan). Energies 2020, 13, 3061. [Google Scholar] [CrossRef]
  15. Shi, W.; Ma, X.; Gu, Y.; Min, Y.; Yang, H. Indirect evaporative cooling maps of China: Optimal and quick performance identification based on a data-driven model. Energy Convers. Manag. 2022, 268, 116047. [Google Scholar] [CrossRef]
  16. Al Horr, Y.; Arif, M.; Katafygiotou, M.; Mazroei, A.; Kaushik, A.; Elsarrag, E. Impact of indoor environmental quality on occupant well-being and comfort: A review of the literature. Int. J. Sustain. Built Environ. 2016, 5, 1–11. [Google Scholar] [CrossRef]
  17. Kusiak, A.; Xu, G.; Tang, F. Optimization of an HVAC system with a strength multi-objective particle-swarm algorithm. Energy 2011, 36, 5935–5943. [Google Scholar] [CrossRef]
  18. Cheng, Y.; Niu, J.; Du, Z.; Lei, Y. Investigation on the thermal comfort and energy efficiency of stratified air distribution systems. Energy Sustain. Dev. 2015, 28, 1–9. [Google Scholar] [CrossRef]
  19. MSZ EN ISO 7730:2005; Ergonomics of the Thermal Environment. Analytical Determination and Interpretation of Thermal Comfort Using Calculation of the PMV and PPD Indices and Local Thermal Comfort Criteria. Hungarian Standard Commitment: Budapest, Hungary, 2000.
  20. MSZ CR 1752:2000; Ventilation for Buildings. Hungarian Standard Commitment: Budapest, Hungary, 2000.
  21. ANSI/ASHRAE Standard 55-2013; Thermal Environmental Conditions for Human Occupancy. ASHRAE Standard: Atlanta, GA, USA, 1992.
  22. Sun, Z.; Wang, S.; Ma, Z. In-situ implementation and validation of a CO2-based adaptive demand-controlled ventilation strategy in a multi-zone office building. Build. Environ. 2011, 46, 124–133. [Google Scholar] [CrossRef]
  23. Kusiak, A.; Zeng, Y.; Xu, G. Minimizing energy consumption of an air handling unit with a computational intelligence approach. Energy Build. 2013, 60, 355–363. [Google Scholar] [CrossRef]
  24. Ürge-Vorsatz, D.; Cabeza, L.F.; Serrano, S.; Barreneche, C.; Petrichenko, K. Heating and cooling energy trends and drivers in buildings. Renew. Sustain. Energy Rev. 2015, 41, 85–98. [Google Scholar] [CrossRef] [Green Version]
  25. Al Horr, Y.; Tashtoush, B.; Chilengwe, N.; Musthafa, M. Operational mode optimization of indirect evaporative cooling in hot climates. Case Stud. Therm. Eng. 2020, 18, 100574. [Google Scholar] [CrossRef]
  26. Yang, L.; Yan, H.; Lam, J.C. Thermal comfort and building energy consumption implications—A review. Appl. Energy 2014, 115, 164–173. [Google Scholar] [CrossRef]
  27. Roulet, C.-A.; Heidt, F.; Foradini, F.; Pibiri, M.-C. Real heat recovery with air handling units. Energy Build. 2001, 33, 495–502. [Google Scholar] [CrossRef]
  28. Fouda, A.; Melikyan, Z. A simplified model for analysis of heat and mass transfer in a direct evaporative cooler. Appl. Therm. Eng. 2011, 31, 932–936. [Google Scholar] [CrossRef]
  29. Kovačević, I.; Sourbron, M. The numerical model for direct evaporative cooler. Appl. Therm. Eng. 2017, 113, 8–19. [Google Scholar] [CrossRef]
  30. Montazeri, H.; Blocken, B.; Hensen, J. Evaporative cooling by water spray systems: CFD simulation, experimental validation and sensitivity analysis. Build. Environ. 2015, 83, 129–141. [Google Scholar] [CrossRef]
  31. Wu, J.; Huang, X.; Zhang, H. Theoretical analysis on heat and mass transfer in a direct evaporative cooler. Appl. Therm. Eng. 2009, 29, 980–984. [Google Scholar] [CrossRef]
  32. Malli, A.; Seyf, H.R.; Layeghi, M.; Sharifian, S.; Behravesh, H. Investigating the performance of cellulosic evaporative cooling pads. Energy Convers. Manag. 2011, 52, 2598–2603. [Google Scholar] [CrossRef]
  33. Alklaibi, A. Experimental and theoretical investigation of internal two-stage evaporative cooler. Energy Convers. Manag. 2015, 95, 140–148. [Google Scholar] [CrossRef]
Figure 1. Heat recovery process presented in Mollier h-x diagram (a) AHU without IEC (b) AHU with IEC.
Buildings 13 01800 g001
Figure 2. Operating range depends on the additional water vapor by IEC to reach sensible cooling performance.
Buildings 13 01800 g002
Figure 3. (a) Scheme of the evaporative air cooler (b) Built evaporative air cooler unit.
Buildings 13 01800 g003
Figure 4. (a) Scheme of the laboratory measurement (b) Direct evaporative air cooler unit applied to the AHU exhaust branch (without insulation).
Buildings 13 01800 g004
Figure 5. (a) The positions of the instruments (b) Scheme of the Testo Saveris measurements system. S1—Testo Saveris H3 D-2 sensor (T.S.s.); Measured area: air extracted from the room. S2—T.S.s.; air extracted from the room treated with evaporative cooling. S3—T.S.s.; air extracted from the room after passing through the heat recovery unit. S4—T.S.s.; external air. S5—T.S.s.; external air after passing through the heat recovery unit.
Buildings 13 01800 g005
Figure 6. (a) Normal probability test of the air leakage (b) Histogram of the absolute air humidity difference (before and after the heat recovery unit).
Buildings 13 01800 g006
Figure 7. (a) Measured temperatures (b) Measured absolute humidity on 26 July 2021.
Buildings 13 01800 g007
Figure 8. (a) Measured efficiency of heat recovery and direct evaporative air cooler units (b) Box plots of measured values on 26 July 2021.
Buildings 13 01800 g008
Figure 9. (a) Measured total and sensible cooling performance of the AHU by IEC (b) Box plots of measured values on 26 July 2021.
Buildings 13 01800 g009
Figure 10. Box plots of measured efficiency of the heat recovery and direct evaporative air cooler units 26 July–17 September 2021. Measurements were conducted for 19 days (2592 observations).
Buildings 13 01800 g010
Figure 11. (a) Measured total cooling performance by IEC and calculated total cooling performance by original heat recovery unit (without IEC) (b) Measured sensible cooling performance by IEC and calculated sensible cooling performance by original heat recovery unit (without IEC).
Buildings 13 01800 g011
Figure 12. Estimated working field of sensible cooling performance by IEC.
Buildings 13 01800 g012
Table 1. Required evaporative efficiency in function of added water vapor (in several relative humidity cases).
Handled Air Starting ParametersΔx Added Evaporated Water (g/kg)
25 °C0.250.500.751.001.251.501.752.002.252.502.753.003.253.50
30 RH%6%12%18%23%29%35%41%47%52%58%64%70%76%81%
40 RH%7%14%21%28%35%42%49%56%63%70%77%84%91%98%
50 RH%9%17%26%34%43%52%60%69%77%86%95%---
60 RH%11%22%33%44%55%66%77%88%99%-----
70 RH%15%30%45%60%75%90%--------
80 RH%23%46%68%91%----------
Table 2. Categories of days during the measurements.
Summer Days
30 °C > tmax > 25 °C
Hot Days
35 °C > tmax ≥ 30 °C
Torrid Days
tmax ≥ 35 °C
Number of days (pc)1072
Table 3. Main properties of the instruments.
Measuring InstrumentsMeasured ParameterRangeAccuracyResolution
Hygro-thermometer
(T.S.s. H3 D-2)
Temperature
Relative humidity
−20… + 50 °C
0…100% RH
+/−0.5 °C
+/−3% RH
0.1 °C
0.1%
Digital differential pressure manometer
(Testo 400)
Pressure drop−100… + 200 hPa+/−0.3 Pa0.001 hPa
Table 4. 1 May 2019–30 September 2019, Debrecen, Hungary simulation values.
Indoor Air ConditionEIEC tot. [kWh]EIEC sens. [kWh]Edehum. [kWh]ΔEadd.c. [kWh]Etot [kWh]
25 °C 30 RH%1492.16954.031605.26651.23840.93
25 °C 40 RH%1337.44794.67845.4350.761286.68
25 °C 50 RH%1185.62638.30305.33−332.971518.59
25 °C 60 RH%1036.79485.0047.77−437.231474.02
25 °C 70 RH%891.01334.840.81−334.031225.04
25 °C 80 RH%748.36187.920.00−187.92936.28
Table 5. 1 May 2020–30 September 2020, Debrecen, Hungary simulation values.
Indoor Air ConditionEIEC tot. [kWh]EIEC sens. [kWh]Edehum. [kWh]ΔEadd.c. [kWh]Etot [kWh]
25 °C 30 RH%1831.451202.003587.292385.29−553.84
25 °C 40 RH%1637.801002.552515.631513.08124.72
25 °C 50 RH%1447.79806.841507.97701.13746.66
25 °C 60 RH%1261.51614.97672.2857.311204.20
25 °C 70 RH%1079.05427.04166.95−260.091339.14
25 °C 80 RH%900.52243.1516.69−226.461126.98
Table 6. 1 May 2021–30 September 2021, Debrecen, Hungary simulation values.
Indoor Air ConditionEIEC tot. [kWh]EIEC sens. [kWh]Edehum. [kWh]ΔEadd.c. [kWh]Etot [kWh]
25 °C 30 RH%2449.921418.844026.322608.32−158.4
25 °C 40 RH%2213.701175.532724.891549.36664.34
25 °C 50 RH%1981.90936.791558.38621.591360.31
25 °C 60 RH%1754.66702.72675.18−81.121835.78
25 °C 70 RH%1532.08473.47169.39−303.611835.69
25 °C 80 RH%1314.30249.1513.17−235.981550.28
Disclaimer/Publisher’s Note: The statements, opinions and data contained in all publications are solely those of the individual author(s) and contributor(s) and not of MDPI and/or the editor(s). MDPI and/or the editor(s) disclaim responsibility for any injury to people or property resulting from any ideas, methods, instructions or products referred to in the content.

