
The Development of Soil-Based 3D-Printable Mixtures: A Mix-Design Methodology and a Case Study
by

Jana Daher
1,2,
Joelle Kleib
1,2,
Mahfoud Benzerzour
1,2,
Nor-Edine Abriak
1,2 and
Georges Aouad
1,2,* 1
IMT Nord Europe, Institut Mines-Télécom, Centre for Materials and Processes, F-59000 Lille, France
2
University of Lille, Institut Mines-Télécom, University Artois, Junia, ULR 4515—LGCgE—Laboratoire de Génie Civil et géoEnvironnement, F-59000 Lille, France
*
Author to whom correspondence should be addressed.
Buildings 2023, 13(7), 1618; https://doi.org/10.3390/buildings13071618
Submission received: 5 June 2023
/
Revised: 22 June 2023
/
Accepted: 23 June 2023
/
Published: 26 June 2023
(This article belongs to the Special Issue Advances in Building Materials and Methods)
Abstract
:Concrete 3D printing is one of the newest technologies in the field of construction. However, despite the various opportunities that this technique offers today, it still has a high environmental impact, as most 3D-printable materials contain high amounts of cement. On the other hand, due to the large volumes of soil excavated each year across the world, there is a pressing need for proper management to dispose of it or reuse it efficiently. This study aims to develop sustainable and resistant 3D-printable materials with low environmental impact using excavated soil. Firstly, a series of tests were carried out to find the most appropriate superplasticizer and the amount required to develop the printable mixtures. Next, the extrudability and buildability were evaluated and verified to validate the printability of the developed mixtures. A 3D laboratory printer was also used to validate the printability of the mixtures on a larger scale. Then, the fresh and hardened properties of the printable mixtures were investigated. Three printable mixtures were developed, with the most environmentally friendly mixture having a soil content of 1602 kg/m3 and a cement content of 282 kg/m3. The mixtures demonstrated satisfactory characteristics and properties in both fresh and hardened states. On the one hand, the mixtures were extrudable and buildable at two laboratory scales. On the other hand, the mixtures presented sufficient compressive strengths, ranging from 16 MPa to 34 MPa, despite their high soil content and low cement content. In addition, their compressive strengths were found to be higher than the minimum strength required for structural concrete. Consequently, this study highlights the possibility of developing ecological, sustainable and resistant mixtures that can be used in 3D-printing construction applications using excavated soil.
1. Introduction
The industrial sector is currently benefiting from the automation of various construction techniques because of all the advantages it can offer to the construction field. Today, the latest automated technique used in the field of construction is the 3D printing of concrete [1]. This technique is based on the principle of extrusion-based additive manufacturing (AM) and is defined as the process of assembling materials to create printed objects using computer-aided design (CAD) modeling software by depositing consecutive layers on top of each other [2]. Over the years, 3D printing has become a well-known and widespread construction technique worldwide due to its technological features that open up new opportunities and endless possibilities for free architectural design compared to traditional construction methods [3,4]. Nowadays, several industrial sectors are using 3D printing for its various advantages, production speed in particular. In addition, several materials are now used in 3D printing, such as ceramics [5], metals [6], polymers [7], cementitious materials and concrete [8]. However, due to the novelty of 3D printing in the construction field, a constant research effort is still underway to better understand this new technology and reach its maximum potential [9]. In addition, today’s researchers are also focusing on finding new ways to improve 3D printing techniques and 3D-printed materials in all sectors. For example, some studies are using nanomaterials to improve the 3D printing of polymeric resins [10,11], while others are using fibers to improve the mechanical properties of cementitious printed materials [12,13]. Currently, there is a lack of in-depth knowledge and understanding of all the performance properties related to the rheological behavior of printable materials as well as the mechanical and structural performance of printed elements [14,15,16].
The 3D printing of concrete offers many advantages over traditional construction techniques [17,18,19,20]; however, a 3D-printable mortar must meet several printing parameters, such as extrudability and buildability. The extrudability of a printable material is related to the first step of the printing process, which consists of extruding the material through the printer’s nozzle, where the material must be sufficiently workable and fluid so as not to cause blockage or segregation at the nozzle. The buildability of a printed material is related to the second step of printing, which is the deposition of the extruded material. The printed material must be sufficiently rigid and firm to allow the stability of its shape once deposited, so that it can support its own weight as well as that of additional layers at a very early stage to ensure stability and avoid the collapse of the entire printed structure. The printable material must therefore undergo a state transition between liquid behavior (during pumping) and solid behavior (after deposition), and therefore have complete control over its rheological properties. However, in order to meet these rheological requirements for printable concrete, large amounts of Portland cement are often required and used [21,22,23,24]. This leads to an increase in the environmental and economic impact of 3D-printable concrete, due to the high costs, CO2 emissions and energy consumption associated with cement manufacturing [25]. Therefore, in recent years, the environmental impact of printable concrete has received special attention, and studies have focused mainly on finding solutions and alternatives to solve this particular problem. For example, some researchers have used supplementary cementitious materials [21,23,26,27,28] and partially replaced cement with alternative pozzolanic materials, such as fly ash [29,30], silica fume [31], flash-calcined sediments [32] and calcined clay [28,33]. This method has proven to be a promising alternative to obtain more durable concretes with adequate rheological properties [34]. Some authors have even proposed the use of geopolymers [35,36].
In addition, today, excavated soil generated by construction sites is by far the largest source of waste produced each year in Europe [37]. Moreover, in France, nearly 130 million tons of soil are excavated each year for infrastructure and development projects [38]. For example, the “Grand Paris Express” project is expected to generate almost 47 million tons of excavated material by 2030. In fact, since 2016, the project has been held responsible for 10–20% of the construction waste produced each year in the Paris region [39]. However, the “Société du Grand Paris” has taken measures to reduce the negative effects of its construction sites on the environment by anticipating and planning the management and recycling of the waste generated by its construction projects. Indeed, the reuse of excavated materials has economic, environmental and social potential compared to traditional disposal options [40], as it offers several advantages, such as reducing transportation distances, reducing costs associated with disposal, preserving landfill capacity, conserving exploited natural resources, and reducing environmental and ecological impacts [41]. Recently, earthen construction has begun to attract the interest of builders and architects because of its low environmental impact compared to concrete. Current uses for excavated soil include landscaping, backfilling and the construction of base courses. The literature also shows the possibility of producing unfired building components from excavated earth, such as bricks, tiles, clay panels and plasters. Excavated soil has also been used for the production of other types of building materials. For example, Capasso et al. [42] highlighted the use of different types of excavated soil in the production of geopolymers, while Priyadharshini et al. [43] investigated the use of excavated soil treated by a series of thermal treatments as a source of fine aggregates in the manufacture of cement mortar.
Moreover, during the past few years, several studies have begun to introduce cement-stabilized clay mortars into the 3D printing technique [44,45,46,47]. Khelifi et al. [44] made ternary mixtures of sand, cement and kaolin to design non-load-bearing extruded blocks for construction. They found that mixtures containing 8–10% cement by mass and cured in a climate-controlled room exhibited compressive strengths ranging from 2 to 18 MPa and that all of the tested mixes exhibited acceptable shrinkage. Another study by d’Haese et al. [48] examined the possibility of developing environmentally friendly insulating elements by 3D printing. They incorporated flax fibers and clayey quarry fines into the mix design along with a high-grade blast furnace slag cement to obtain the structural part of a wall. They found that with 30% cement in the dry materials it is possible to achieve a compressive strength greater than that required for a two-story house. In addition, some studies have attempted to print excavated soil using binders other than cement. For example, Perrot et al. [49] evaluated the possibility of printing a structure with a raw earth material 60% of which consisted of particles finer than 10 µm using alginate, a fast-setting binder. They found that the addition of alginate improved the strength of the printed material, which was comparable to those of conventional earth materials, such as cob, ranging from 1.2 to 1.7 MPa. In addition, recently, 3D printing of earth-based materials has also been used to build houses and structures. For example, the first 3D-printed house using earth-based materials was built by the World’s Advanced Saving Project (WASP) in 2015 [50]. They used natural local materials and their developed compound consisted of 25% excavated soil, 25% rice husks, 40% straw and 10% hydraulic lime. They carried out load tests on a printed wall segment and found a compressive strength of 2.32 MPa, which they considered comparable to the strength of rammed earth [51].
However, although some studies have been conducted on the use of excavated soil in 3D printing materials, to date, few have focused on the use of excavated soil to produce printable load-bearing building materials with strengths equivalent to that of structural concrete [48,52]. Therefore, this study aimed to develop 3D-printable load-bearing mortars with low environmental impact using excavated soil for the total replacement of sand. Three printable soil-based mixtures were designed. An experimental methodology that can be followed in future projects was developed. First, the most appropriate superplasticizer as well as the saturation amount for cement alone, soil alone and cement/soil mixtures were determined using two methods: flow time with the Marsh cone and spreading diameter with the mini cone. Then, the appropriate amount of superplasticizer for each of the three mixtures containing different amounts of excavated soil was selected after iterative laboratory testing to ensure compliance with printability requirements (i.e., extrudability and buildability). Next, the three soil-based mixtures were printed on a larger scale using a laboratory gantry printer and thus were characterized by various tests. The fresh-state tests included the evaluation of the flow diameter, setting time and yield stress evolution over time of the mixtures, while the hardened-state tests aimed at evaluating their compressive strength and total porosity.
2. Materials and Methods
2.1. Materials
2.1.1. Excavated Soil
The excavated soil used in this study came from the “Grand Paris Express” project (France). The soil was not subjected to any treatment but was used in its raw state. It was air-dried and then sieved to 2 mm to remove any coarse aggregates to avoid blockage problems in the printer nozzle during the printing process.
The soil particle size distribution (PSD) curve, shown in Figure 1, was obtained by sieve analysis according to the NF EN 933-1 standard [53]. The figure shows that the raw soil contained a negligible percentage of particles larger than 2 mm, 1 mm and 500 µm (<1% wt.). The curve also shows that the soil contained a portion of fines, with 31% and 32% of the total mass of the soil corresponding to particles smaller than 63 µm and 80 µm, respectively.
Furthermore, according to NF EN ISO 17892-12 [54], the soil showed a liquid limit (LL) equal to 18.68%, a plastic limit (PL) equal to 11.84% and a plastic index (PI) equal to 6.84%. The methylene blue value (VBS) of the soil, according to NF P 94-068 [55], was equal to 0.83/100 g, classifying the soil as sandy-silty. The density and specific surface area of the soil were equal to 2.73 g/cm3 and 4.79 m2/g, respectively. The chemical composition of the soil (analyzed by X-ray fluorescence (XRF)) is presented in Table 1.
2.1.2. Ordinary Portland Cement (OPC)
Ordinary Portland Cement (OPC), CEM I 52.5N, supplied by EQIOM (Paris, France), was used in this study as a hydraulic binder. The cement had a density of 3.15 g/cm3, a median particle diameter (D50) of 8.82 µm and a specific surface area of 0.98 m2/g. The PSD of the cement (measured with an LS 13-320 Laser Granulometer) and its chemical composition (analyzed by XRF) are shown in Figure 2 and Table 1, respectively.
2.1.3. Superplasticizers
Three different types of superplasticizers were investigated and compared in this study to determine which is the most suitable for printable mortars containing excavated soil. The characteristics of the superplasticizers are summarized in Table 2. These superplasticizers were chosen because of their different types and compositions, as well as their promising adaptability for printable cementitious and clay materials. For example, CHRYSO®Fluid Optima 100 (CHRYSO, Sermaises, France) was chosen because of its use in a previous study on printable mortars [56]. MasterSuna SBS 4131 (Master Builders Solutions, Sorgues, France) was chosen because it is expected to provide fluidity in concretes incorporating difficult and clayey sands/soils [57]. Finally, MasterGlenium ACE 456 (Master Builders Solutions, France) was chosen because several studies have shown that polycarboxylate-based superplasticizers are suitable for the 3D printing of cementitious and clayey materials [58,59,60,61].
2.2. Methods
2.2.1. Mix-Design Methodology for the Mortars
In this study, mixtures consisting of excavated soil, cement, water and superplasticizers were developed. The content of water and superplasticizers was calculated according to the total mass of fines in each mixture, which includes the cement and the fine part of the soil (<80 µm). In addition, the water/fines ratio was set at 0.4 for all mixtures, considering the superplasticizer amount as the only parameter to be determined to make the mixtures printable.
The three preliminary mixtures to be tested for printability are shown in Table 3, below. Their compositions in terms of cement, soil and water were determined. In fact, the mixtures contained the same amount of cement but different amounts of excavated soil, resulting in different soil/cement ratios. The water/fines ratio was kept constant. For the superplasticizers, their use in a printable mixture is essential to reduce the use of water while ensuring good material fluidity—an essential parameter in 3D printing. To this end, a study was carried out to identify the most appropriate superplasticizer to use as well as the saturation amount for the mixtures and the appropriate amount to add to each mixture to make it printable.
Several superplasticizer saturation tests were carried out in order to find the superplasticizers with the highest flowing effect on the soil-based mixtures. Only fine particles were tested for saturation, as these are the ones most affected and influenced by superplasticizers. Therefore, the saturation tests were carried out on cement alone, fine soil alone (<80 µm) and cement/fine soil mixtures corresponding to the mixtures presented in Table 3. The coarse part of the soil (>80 µm) was excluded from the saturation tests, as it is not affected by the presence of superplasticizers. However, all soil particles (fine and coarse, <2 mm) were used in the development of the printable mortars, as the aim was to use as much soil as possible, completely replacing sand.
Superplasticizer Saturation
The purpose of the saturation tests was to determine the superplasticizers with the strongest deflocculating and fluidizing effect on the materials and to define the percentage of saturation for the mixtures that must not be exceeded when developing printable mortars. Two methods were therefore used: the Marsh cone (Figure 3a) and the mini cone methods (Figure 3b). The first method aims to determine the flow time of grouts, while the second aims to determine the spreading diameter of pastes with several amounts of superplasticizers.
- The Marsh cone test
The Marsh cone test consists of measuring the flow time of the grout through a 12.5 mm diameter nozzle under its own weight. The slower the flow, the more viscous the grout. The faster the flow, the more fluid the grout. The objective of this test was to find the saturation amount of the cement with superplasticizers from the flow time of the grout. The test was carried out according to the P 18-358 standard [62]. It was conducted in a room with a temperature of 20 °C and a relative humidity of over 90%. Cement grouts with a volume of 1500 mL were prepared using a water/cement ratio of 0.4 and were then introduced into the Marsh cone to pass through the nozzle and fill a 1000 mL container. Four measurements were carried out at four different times (t0 + 5 min, t0 + 15 min, t0 + 30 min and t0 + 60 min) in order to follow the fluidity of the grout over time. The saturation amount for this test is defined when the fluidity of the grout reaches a maximum value and when the addition of more superplasticizers no longer has a fluidizing effect on the grout but, on the contrary, could lead to an opposite effect, making the grout less fluid and more viscous.
- b.
- The mini cone test
The saturation of the materials with the different superplasticizers was also performed using the mini cone test. This test consists of measuring the spreading diameter of pastes with the mini cone. The smaller the spread, the more viscous the paste. The larger the spread, the more fluid the paste. The mini cone used had an upper diameter of 19 mm, a lower diameter of 38 mm and a height of 57 mm [63]. The materials tested with this saturation method were cement, fine soil (<80 µm) and cement/fine soil mixtures. It was interesting to introduce this saturation method because it reduces the amount of material used and provides an accurate, efficient and comparative assessment of material saturation with superplasticizers. For this purpose, 100 g of material and a water/fines ratio of 0.4 were chosen for the preparation of the pastes, and the test was carried out following previously published studies [63,64,65]. Three spreading measurements were carried out at three different times (t0 + 5 min, t0 + 15 min and t0 + 30 min) in order to follow the fluidity of the paste over time. Similar to the Marsh cone test, the saturation amount for the mini cone test is identified when the paste reaches a maximum fluidity value and when the addition of superplasticizers no longer fluidizes the paste but makes it more viscous.
2.2.2. Methods of Characterization of Mortars
As there are currently no standards for the mix design or characterization of printable materials, in this study, simple methods were implemented at laboratory scale to simulate the 3D printing process and to establish experimental printability specifications that meet the needs and requirements of printing. Thus, the fresh mortars were first tested for printability (i.e., extrudability and buildability) and then further characterized in their fresh and hardened states.
Characterization of Mortars in the Fresh State
- Printability tests and requirements
For a mortar to be considered printable, it must meet the most important requirements of 3D printing, that is, it must be extrudable as well as buildable (Figure 4).
Firstly, the extrudability of the mortars was assessed using a manual gun device with a 2 cm diameter circular nozzle similar to that used by Khalil et al. [66] and Daher et al. [32]. A mixture is considered extrudable when it is neither too fluid nor too rigid. In other words, the material should not flow under its own weight through the nozzle, nor should it be too difficult to extrude by blocking the nozzle. However, the material should be fluid enough to easily flow out of the nozzle without causing filtration or segregation problems.
Secondly, the buildability of the mortars was assessed using the modified mini slump test similar to that used by Ilcan et al. [36] and Daher et al. [32]. The cone used in this test was the same as that specified in the NF EN 1015-3 standard [67], with a height of 5 cm, an upper diameter of 7 cm and a lower diameter of 10 cm. The test consists of filling the cone with fresh mortar, slowly lifting it and placing a static load of 600 g on the upper surface of the conical mortar (including the weight of a round glass plate), then measuring the final average height (hf) of the deformed mortar after 1 min of loading. The higher the final height measured after loading, the more buildable the material. The assembly and test steps are illustrated in Figure 5. A mixture is considered buildable if its final height, hf, is not less than 4.50 cm. This value is obtained using the same buildability test applied to a commercial printable material and was chosen as the minimum height threshold value for this buildability test in this study.
The developed mixtures were evaluated using the two methods described above—the manual gun for extrudability and the modified mini slump test for buildability—and were considered printable if they met the conditions imposed by these two methods.
Furthermore, the printability of the mixtures developed at laboratory scale was then confirmed on a larger scale using a 3-axis gantry laboratory printer with a 2 cm diameter circular nozzle.
- b.
- Flow Table test and setting time
The flow table test was used to determine the flowability and flow diameter of the mortars according to NF EN 1015-3 [67]. At the end of the mixing process, the mortar was introduced in two layers into the mold placed in the center of the table. Each layer was tapped at least 10 times in short bursts to ensure that the mold was filled. Excess mortar was then removed from the surface of the cone with a spatula. The mold was then lifted vertically and slowly, and the table was tapped 15 times. The spread diameter was measured in two perpendicular directions, and the average spread value of the mortar was calculated.
In addition, the initial and final setting times of the mortars were determined by the Vicat test according to NF EN 480-2 [68]. A needle with a diameter of Ø = 1.13 mm was automatically released through the mold containing the fresh mortar every 5 min, then the distance separating the base of the mold and the bottom of the needle was recorded.
- c.
- Fall cone test
The fall cone test was used to evaluate the evolution of the yield stress and the structural build-up of fresh mortars with time. It was performed in accordance with EN ISO 17892-6 [69] and a study by Baz et al. [56]. This test calculates, using a specific equation, the yield stress of fresh mortar corresponding to a series of penetrations caused by a cone load [70]. The cone used had an angle of 30° (θ) and a total mass of 230 g. The penetration of the cone into fresh mortar placed in a circular container was measured every 2.5 min (150 s) for a total duration of 22 min (1320 s). The yield stress (τ) in kPa was calculated according to Equation (1), where F is the force generated by the mass of the cone, h is the recorded penetration depth and θ is the angle of the cone. Each mixture was tested on a different batch three times, and the final result for each mixture was the average of the three tests.
τ = Fcosθ2/πh2tanθ
Characterization of Mortars in the Hardened State
Just as it is important to evaluate printable mortars in the fresh state, it is also essential to study the properties of printed mortars in the hardened state, such as their mechanical performance and porosity.
Four methods of sample preparation were adopted to investigate the influence of the printing process and technique on the mechanical properties of the mortars as well as to compare the mechanical performances of the printed samples with those of the non-printed samples. The types of samples prepared were compacted samples, non-compacted samples, samples printed with the gun and samples printed with the printer.
- The compacted samples were prepared according to EN NF 196-1 [71], where the mold of dimensions 4 × 4 × 16 cm was filled with two layers of mortar and each layer was struck 60 times.
- The non-compacted samples were prepared by pouring the fresh mortar directly into the 4 × 4 × 16 cm mold without applying compaction or vibration.
- The samples printed with the gun were prepared by printing directly inside the 4 × 4 × 16 cm mold using the same manual gun that was used for the extrudability test, which had a 3 × 1 cm rectangular nozzle in order to obtain 4 successive layers, each of which was 4 cm in width and 1 cm in thickness (Figure 6a).
- The samples printed with the laboratory printer were obtained by extracting 4 × 4 × 4 cm cubic specimens of extruded filaments from the large-scale printer (Figure 6b). The edges of the printed layers were removed so that the six surfaces of the samples were flat and free of irregularities. Each sample was finally composed of 4 layers, each of which was 1 cm in height.
Furthermore, all samples were cured at 20 °C and 100% relative humidity until the mechanical performance test dates.
- Compressive strength
The compressive strength of the specimens, regardless of type, was tested at 1, 7 and 28 days according to NF EN 196-1 [71]. Furthermore, regarding the direction of testing for the printed specimens, the loading force applied was either parallel (along the Y-axis) or perpendicular (along the Z-axis) to the printed layers, as shown in Figure 7a,b. Specimens printed with the manual gun were tested in the Y-direction only, while those extracted from the extruded layers by the printer were tested in both directions (Y and Z).
In addition, in order to avoid confusion when discussing the compressive strength results obtained for the different types of samples, Table 4 below shows the abbreviations used for each type of sample for the first mixture, M1, which were also applied to the second and third mixtures.
- b.
- Mercury intrusion porosity (MIP)
The interface and void formation between printed layers can strongly affect the mechanical properties and durability performance of a hardened printed material. Therefore, it is essential to investigate the porosity of 3D-printed mortars. In this study, the total porosity and the pore size distribution of the printed and non-printed mortars were measured using a Micromeritics AutoPore V 9600 mercury porosimeter in accordance with ISO 15901-1:2016 [72]. It is important to note that, for the printed samples, the specimens were carefully chosen to ensure the presence of an interface separating two layers within them.
3. Superplasticizer Saturation Tests
In this study, MasterSuna SBS 4131 (Master Builders Solutions, France), CHRYSO®Fluid Optima 100 (CHRYSO, France) and MasterGlenium ACE 456 (Master Builders Solutions, France) were tested in several amounts (0.5%, 1%, 1.5% and 2% in dry content) in order to determine the most adequate SP to use for the development of printable mixtures. The SP saturation amount of the cement/soil mixtures was therefore determined. However, it was essential to first test the saturation of the cement alone as well as the fine soil alone (<80 µm) with the different SPs.
3.1. Saturation of Cement with Superplasticizers Using the Marsh Cone
Figure 8a–c show the evolution of the cement grout flow time in seconds with different percentages of MasterSuna SBS 4131, CHRYSO®Fluid Optima 100 and MasterGlenium ACE 456, respectively.
First of all, regarding the MasterSuna SBS 4131 results (Figure 8a), it was not possible to perform the test at t0 + 5 min for 0.5%, nor at any time for 2% due to the very high viscosity of the grout. Moreover, for 0.5%, the grout became more and more fluid with time, whereas for 1% and 1.5%, the initially fluid grout became more viscous with time, indicating that the SP does not have the same fluidifying effect on the grout over time. Therefore, the saturation amount of the cement grout by MasterSuna SBS 4131 can be estimated to be 1.5%, since the fastest flow was recorded for this amount, even though the fluidity of the grout did not remain constant over time.
Second, regarding the results for CHRYSO®Fluid Optima 100 (Figure 8b), increasing the amount from 0.5 to 1.5% made the grout more fluid. However, at 2%, an opposite effect was noticed in the fluidity of the grout, where the flow time became slower and increased from 11 s at t0 + 5 min to 68 s at t0 + 60 min, showing that the saturation limit had been exceeded. Therefore, the saturation amount for the cement grout of CHRYSO®Fluid Optima 100 is 1.5%.
Finally, concerning the results for MasterGlenium ACE 456 (Figure 8c), two additional percentages (0.25 and 0.75%) were tested due to the high flowability of this SP compared to the first two SPs. The grout gained in fluidity with the increase in the SP amount from 0.25 to 1.5%. However, as observed with CHRYSO®Fluid Optima 100, at 2%, an opposite effect could be noticed, where the flow time increased, showing that the saturation limit was exceeded. Therefore, the saturation amount for the cement grout of MasterGlenium ACE 456 is also 1.5%. Furthermore, when comparing the three SPs, MasterGlenium ACE 456 had the greatest fluidizing effect and the greatest ability to maintain grout fluidity over time. For example, at an amount of 1.5%, at t0 + 15 min, MasterSuna SBS 4131 was recorded as having a flow time of 46 s, CHRYSO®Fluid Optima 100 a flow time of 18 s and MasterGlenium ACE 456 a flow time of 12 s.
Furthermore, in order to highlight the difference between the three superplasticizers with respect to cement grout fluidization at a given time related to the printability window, the grout flow time was measured for the different percentages of superplasticizers at 15 min, as shown in Figure 9. The saturation curves show that MasterGlenium ACE 456 is the SP with the greatest fluidizing effect, followed by CHRYSO®Fluid Optima 100, then MasterSuna SBS 4131. The same order can be noticed for the SP with respect to the capacity to maintain fluidity over time. Moreover, it can be seen that the cement grout reached saturation with an amount of 1.5% SP for all the superplasticizers.
3.2. Saturation of Cement and Soil with Superplasticizers Using the Mini Cone
Based on the Marsh cone results, MasterGlenium ACE 456 was the most effective SP in cement grout fluidization. However, the most effective SP regarding the soil still had to be found. Thus, it was decided to test soil saturation using the mini cone. Nevertheless, in order to validate the reliability of the mini cone saturation method, the cement saturation was tested again using the mini cone and compared to that obtained with the Marsh cone.
Therefore, the spreading diameter of the cement paste using the mini cone was measured with different percentages of SPs at t0 + 5 min, t0 + 15 min and t0 + 30 min. It was decided to limit the measurements to 30 min for this test, given the maximum effect of the SPs in the first 15 min and the stability of their effect beyond 30 min, as shown by the Marsh cone results. Accordingly, the cement paste spread diameters measured with different amounts of MasterSuna SBS 4131, CHRYSO®Fluid Optima 100 and MasterGlenium ACE 456 are shown in Figure 10a–c, respectively.
The cement paste saturation curves show that the spreading diameters obtained using the mini cone were larger for MasterGlenium ACE 456 (Figure 10c) than for the other two SPs (Figure 10a,b), demonstrating once again that MasterGlenium ACE 456 has a greater fluidizing effect on the cement paste than MasterSuna SBS 4131 and CHRYSO®Fluid Optima 100. It is also possible to observe that the largest spreading diameter recorded for each of the three SPs corresponded to an amount of 1.5%, thus allowing us to consider this amount as the saturation amount of the cement paste for the three SPs. These results are in agreement with those obtained using the Marsh cone. Therefore, the use of the mini cone saturation method could be equivalent and representative of the Marsh cone saturation method.
That being said, the saturation of the fine part of the soil (<80 µm) by the three SPs was tested only using the mini cone. The spreading diameters of the soil paste measured at t0 + 5 min, t0 + 15 min and t0 + 30 min with different amounts of MasterSuna SBS 4131, CHRYSO®Fluid Optima 100 and MasterGlenium ACE 456 are presented in Figure 11a–c, respectively.
The saturation curves for the soil paste show that no fluidity was gained by increasing the amounts of MasterSuna SBS 4131 and CHRYSO®Fluid Optima 100. However, this was not the case with MasterGlenium ACE 456, where increasing the amount of the latter led to an increase in the spreading diameter of the soil paste, making it the most suitable SP for soil fluidization among the other SPs. Nevertheless, when comparing Figure 10c and Figure 11c, the evolution of the spreading diameter of the soil paste with an increasing amount of MasterGlenium ACE 45 did not show the same trend as that of the cement paste. In fact, Figure 11c shows that the 0.25% and 0.5% amounts did not have much effect on the soil paste, unlike the other higher amounts, where the flow effect became more visible. Furthermore, for the 0.75, 1 and 1.5% amounts, the greatest effect of the SP on the soil paste took place at t0 + 5 min rather than at t0 + 15 min and t0 + 30 min. However, by comparing these results to those of the cement paste in Figure 10c, where no major loss of spreading diameter was observed over time, it can be concluded that MasterGlenium ACE 456 does not have the same ability to maintain fluidity over time for the soil as for the cement. This could be due to the high water absorption by the soil, which could result in a decrease in the available water needed to fluidize the paste after a certain time. However, this lack of fluidity preservation was no longer visible at 2%, where the spreading diameter was maintained over time, indicating soil saturation with water and the SP. The saturation amount of the soil with MasterGlenium ACE 456 could therefore be considered 2%.
MasterGlenium ACE 456 was found to be the most suitable SP for cement and fine soil (<80 µm). The next step was to verify if MasterGlenium ACE 456 would continue to have the same fluidizing effect on mixtures containing both cement and fine soil.
3.3. Saturation of Cement/Soil Mixtures with Superplasticizers Using the Mini Cone
Paste mixtures equivalent to the three preliminary mixtures (M1, M2 and M3) shown in Table 4 were tested for their saturation by MasterGlenium ACE 456 using the mini cone in the same way as it was previously used for cement alone and for soil alone. Figure 12 shows the saturation curves of the three mixtures with different SP amounts at t0 + 5 min, t0 + 15 min and t0 + 30 min.
On the one hand, the SP did not seem to have the same influence on the three mixtures with an amount of 0.25%, where the mixture containing the highest amount of soil M3 showed the lowest spreading diameter compared to M1 and M2, containing less soil. On the other hand, a stabilization of the spreading values from 0.5% onwards could be observed for the saturation curves of the three mixtures, which also showed identical spreading diameters. It also appears that the spreading diameters of mixtures M1 and M2 decreased beyond the 1% amount and that that of mixture M3 decreased and then increased, indicating that the saturation amount was reached for all three mixtures.
In conclusion, of the three SPs tested, MasterGlenium ACE 456 was found to be the most suitable SP for fluidizing cement alone, fine soil alone (<80 µm) as well as cement/fine soil mixtures and was therefore selected to ensure the printability of the soil-based mixtures.
4. Characterization of Mortars in the Fresh State
4.1. Printability Tests
4.1.1. Determination of the Percentages of SP for All Printable Mixtures
Now that the saturation amount had been determined for the three mixtures, the next step was to determine the necessary amount of SP to add to each of the mixtures to make them printable. Three-dimensional printing requires a material that is sufficiently fluid, but not too fluid, to guarantee both extrudability and buildability. Therefore, it was important that the amounts of SP added to the mixtures did not exceed the saturation amount determined in the previous section, which was equal to 1%. To this end, different compositions for all the mixtures were evaluated and tested, and the results are presented in Table 5. The methodology followed involved modifying the amount of SP in all mixtures to find the appropriate amount to make them printable. Each mixture was then tested for extrudability, using the manual gun, and for buildability, using the modified mini slump test, and was considered printable if it met the different requirements set by these two tests. Indeed, the procedure for identifying the printable mixtures was purely experimental, and the variation in SP amounts was carried out progressively and on the basis of the results for previously tested SP amounts for the same mixtures. Consequently, while it was necessary to test three different compositions to find the optimum printable formulation for M1 and M3, two compositions were sufficient to identify the optimum printable formulation for M2. The extrudability and buildability (hf) results for all mixtures are shown in Table 5.
As shown in Table 5, three SP percentages were tested for the first preliminary mixture, M1. The extrudability and buildability results for the three mixtures tested for M1 are shown in Figure 13 and Figure 14, respectively.
Figure 13 shows that, for M1, the 0.45% SP mix was difficult to extrude and showed some cracking, while the 0.48% SP mix was easily extrudable. The 0.51% SP mix was extrudable but also very fluid and showed layer sagging. Furthermore, Figure 14 shows that the 0.45% and 0.48% SP mixes were buildable (hf = 4.75 and 4.50 cm ≥ hf threshold = 4.50 cm, which corresponds to a commercial printable material), while the 0.51% SP mix was not buildable (hf = 2.70 cm < hf threshold). As the second mix was the only one that met the printability requirements, the 0.48% SP amount was selected for the development of the first printable mixture, M1, which is lower than the saturation amount determined for M1 using the mini cone (1%).
In the case of the second preliminary mixture, M2, two SP percentages were tested, as shown in Table 5, and the extrudability and buildability results are presented in Figure 15 and Figure 16, respectively. No third SP percentage was tested for this mixture, since two percentages were sufficient to identify which of the two corresponded to the printable mixture for M2.
Figure 15 shows that, for M2, the 0.72% SP mix was difficult to extrude and showed some cracks, while the 0.75% SP mix was easily extrudable. On the other hand, Figure 16 shows that both mixes were buildable (hf = 4.85 and 4.50 cm ≥ hf threshold). However, as the first mix did not meet the extrudability requirement while the second one did, the 0.75% SP amount was selected for the development of the second printable mixture, M2, which is lower than the saturation amount determined for M2 using the mini cone (1%).
As for the third preliminary formulation, M3, three SP percentages were tested, as shown in Table 5, and the results for extrudability and buildability are presented in Figure 17 and Figure 18, respectively.
Figure 17 shows that, for M3, the 0.87% and 0.90% SP mixes were extrudable without showing signs of cracking or sagging, while the 1.00% SP mix was extrudable but also very fluid and showed significant layer sagging. On the other hand, Figure 18 shows that the 0.87% and 0.90% SP mixes were buildable (hf = 4.55 and 4.50 cm ≥ hf threshold), while the 1.00% SP mix was not (hf = 2.55 cm < hf threshold). The first two mixes met the printability requirements; however, it was decided to select the 0.90% SP amount for the development of the third printable mixture, M3, to ensure better flowability and easier extrudability. Furthermore, the amount chosen to ensure the printability of M3 (0.90%) was lower than the saturation amount determined for M3 using the mini cone (1%).
4.1.2. Laboratory Printing Using the Three-Axis Printer
Once the SP amounts had been carefully identified to develop the three printable soil-based mixtures (M1, M2 and M3), their printability was also validated on a larger scale using the three-axis laboratory printer, as shown in Figure 19a–c, respectively.
4.2. Flow Table Test and Setting Time
The printable mixtures were further characterized in the fresh state for their fluidity and setting times. On the one hand, the results of the flow table test, presented in Figure 20, show that M1 had the highest flow diameter (16.97 cm), followed by M2 (15.64 cm) and then M3 (15.59 cm). On the other hand, the setting time results, presented in Figure 21, show that M3 reached its initial and final setting times first, followed by M2 and then M1. Therefore, the test results show that increasing the soil/cement ratio resulted in the decreased flowability and increased stiffness of the mixtures, despite the fact that all three mixtures were developed to achieve equal printability performance.
On another note, it can be seen that the setting times were long, which means that the soil-based mixtures have a fairly large open time, allowing flexibility in the printing time window. However, a long open time normally has a disadvantage in 3D printing, namely, the limitation of the print height, which can lead to the fast collapse of the printed layers. Nevertheless, the presence of the clay part of the soil created a thixotropic aspect in the printed materials, where the deposited layers did not show much deformation and were able to keep their shape even after the deposition of successive layers, demonstrating the advantage provided by the clay part of the soil, which acted like a viscosity-modifying agent. This behavior has already been demonstrated in several previous studies, such as those of Panda et al. [73] and Kaushik et al. [74], which proved that nanoclay affects the fresh and rheological behavior of 3D-printable cementitious materials by acting as a natural viscosity modifier. In fact, the stability developed by the deposited layers is not necessarily related to the actual setting time of the mixture but rather to the early developed green strength and physical properties provided by the phenomenon of thixotropy, where the material gains viscosity and strength at rest. Indeed, this strong correlation between the thixotropy of the material and the stability of the 3D-printed structure has been demonstrated by Chen et al. [75] and Zhang et al. [76].
4.3. Fall Cone Test
Figure 22 shows the evolution of the yield stress and structural build-up for the adopted mixtures over time. The results show that the yield stress increases gradually with time and can be predicted using a linear model, the stress evolution curves revealing a good correlation factor (R2) ranging from 0.94 to 0.99. On the other hand, M3 showed the highest stress values, followed by M2 and then M1, which shows that the increase in the soil/cement ratio led to an increase in the yield stress and stiffness of the mixtures. This coincides with the results obtained during the fresh-state characterization of the soil-based mixtures as well as the results of Kaushik et al. [74], who showed that the addition of nanoclay to a 3D-printable mixture led to an increase in the yield stress due to the high cohesion of the mixture provided by the nanoclay. Furthermore, the previously proven printability of the mixtures could also be verified here by the fall cone test, where the first recorded yield stress at 120 s ranged from 0.6 to 1 kPa and was between the optimal values for 3D printing found by Le et al. [21] and Rahul al. [77], which were 0.55 kPa and 2.5 kPa, respectively.
5. Characterization of Mortars in the Hardened State
5.1. Compressive Strength
The compressive strength results obtained for the different types of samples (C, NC, PG, PZ and PY) of the three mixtures, M1, M2 and M3, are shown in Figure 23a–c, respectively.
Firstly, when comparing the results for the three mixtures, regardless of sample type, M1 showed the highest compressive strengths, followed by M2 and then M3, for all testing ages. This was to be expected and was due to the increase in the soil/cement ratios of the mixtures, the cement amount decreasing from 532 kg/m3 in M1, to 369 kg/m3 in M2 and to 282 kg/m3 in M3.
Secondly, by comparing the results for the different types of samples obtained for each of the mixtures, several observations can be made. The NC samples presented a similar compressive strength to the C samples, showing that non-compaction did not negatively influence the mechanical performance of the mixtures. In addition, the PG samples exhibited lower compressive strength than the C samples, showing the inaccuracy and possible defects that can occur during manual printing. These two previous findings apply to all three mixtures. However, for the PZ and PY samples, the strength was lower than that of the C samples for M1 but similar to that of the C samples for M2 and M3. In fact, it could be noticed that the difference between the compressive strength values of the different types of samples for the same mixture decreased as the soil/cement ratio increased. For example, the difference in strength between the C samples and the PY samples was 22.45% for M1, 12.28% for M2 and 6.74% for M3. Nevertheless, and in all cases, the compressive strength of the PZ and PY samples was higher than that of the PG samples.
Furthermore, with respect to the test directions (Z and Y) for the printed samples with the printer, it could be seen that the compressive strength of the PZ samples was slightly higher than that of the PY samples for all three mixtures. However, the strengths in both directions were relatively close, and the difference between the results can be considered negligible. Thus, the direction in which the printed samples were tested did not have much influence on the strength of the mixtures. This finding coincides with that of Wolfs et al. [78], who found a minor influence of layer orientation with respect to the applied load, in contrast to other studies that reported a clear influence of load direction on the strength properties of printed specimens [79,80,81,82].
In conclusion, the manufacturing method for the different tested samples and the 3D printing process did not have a significant or radical effect on the compressive strength of the soil-based mixtures.
5.2. Mercury Intrusion Porosity (MIP)
The total porosity results for the three mixtures tested on the different types of samples (C, NC, PG and PZ/PY) after 28 days of hydration are presented in Figure 24.
The results show that the total porosity increases with the increase in the soil/cement ratio in the mixtures. These results are consistent with those for compressive strength, the lowest porosity being recorded for the mixture with the highest compressive strength (M1) and the highest porosity being recorded for the mixture with the lowest compressive strength (M3).
In addition, a similar trend in total porosity variation could be observed for all four specimen types for all three mixtures, with porosity percentages ranging from highest to lowest in the following order: PG > NC > C > PZ/PY.
In fact, both the PG and PZ/PY specimens were 3D-printed, yet they did not show similar results in terms of porosity. The PG specimens were printed manually and had irregularities and voids between the layers and on the sides, where the test load was applied. This could explain the decrease in strength and the increase in porosity observed in these samples. In contrast, the PZ/PY samples were homogeneous and had good interlayer adhesion and smooth surfaces, which reduced the risk of strength deterioration and void formation.
On the other hand, the NC samples showed higher porosity than the C samples. This could be due to the fact that the compaction process eliminated the voids present in the mortar during casting, whereas the NC mortars were poured directly into the mold and did not undergo any form of compaction or vibration, resulting in greater porosity formation. However, the PZ/PY samples had lower porosity than the C and NC samples, which could be due to the extrusion process exerting additional pressure on the material during extrusion, resulting in a denser and less porous material. Similarly, Koker [83] found that, in some cases, the additional pressure exerted on the material during printing can reduce voids in the layers and at the interfaces, creating a less porous and denser matrix.
5.3. Potential Application of Soil-Based Printable Mixtures at Construction Scale
In order to implement printable soil-based mixtures at full scale in construction, it is not enough for the mixtures to meet printability requirements. The strength of the mixtures must also be validated, given the large amount of soil and the small amount of cement present in the mixtures. It is therefore necessary to assign a strength class to the printable soil-based mixtures and see whether they have sufficient and satisfactory strength in order to consider the possibility of replacing conventional concrete in construction. Table 6 recalls the compressive strength ranges of the printed samples tested in the Y- and Z-directions for the three mixtures (M1, M2 and M3) at 28 days.
Referring to ACI 318 [84] and the Concrete Manual 2012 [85], it can be established that the strength of the three soil-based mixes exceeds the minimum strength required for structural concrete. Therefore, in theory, 3D printing of these mixes could be used as a concrete equivalent for several construction applications with load-bearing or non-load-bearing functions, such as single walls, double walls, partitions, basements, foundations, etc.
Furthermore, the compressive strength of the mixtures in this study far exceeds that of a printable soil-based mixture developed by Perrot et al. [49], ranging from 1.21 to 1.7 MPa. In another study by d’Haese et al. [52], five mixtures based on flax fibers, quarry clay fines less than 100 µm, a high-grade blast furnace cement and an admixture/superplasticizer were developed and tested to obtain a printable structural material. The authors found compressive strengths between 6.5 and 17.3 MPa. They selected the strongest mix with a proportion of 30% cement to dry material (cement + quarry fines) to print a structural wall and reported that the strength obtained exceeded that required for a two-story house. However, the mixtures examined in this study (M1, M2 and M3) had cement contents of 30, 20 and 15% of the dry mix materials (cement + soil) and showed compressive strengths of approximately 34, 26 and 17 MPa, respectively. Consequently, a strength equivalent to that of the 30% cement-based structural mix of d’Haese et al. [52] was recorded for M3, which contained half the cement amount (15%), demonstrating the possibility of considering the three soil-based mixtures of this study as suitable printable mixtures for the construction of load-bearing structural walls.
6. Conclusions
This paper has presented a mix-design methodology and a case study for developing resistant and ecological mixtures for 3D printing using excavated soil. The main challenge is to reduce the environmental and economic impact of 3D-printed concrete, which often contains large quantities of cement, the production of which generates significant CO2 emissions. A multi-stage mix-design methodology was presented. The first stage was to find the most appropriate superplasticizer and the saturation amount for the different materials and mixtures using two methods: the Marsh cone and the mini cone methods. The second stage was to find the appropriate amount of superplasticizer to make the soil-based mixtures printable (i.e., extrudable and buildable). Extrudability was assessed using a manual gun, and buildability was assessed using the modified mini slump test. The case study of excavated soil that came from the “Grand Paris Express” project (France) was then presented, where the printability of soil-based mixtures was assessed using a laboratory gantry printer. The mixtures were then characterized in their fresh and hardened states. The main results of this study are as follows:
- A mix-design methodology was implemented and proved to be efficient and accurate. It enabled the development of three resistant printable mortars using excavated soil with different soil/cement ratios.
- The flowability, spread diameter and setting time all decreased as the soil/cement ratio in the mixtures increased.
- The evolution of yield stress and structural build-up of the soil-based mixtures was linear over time, and increasing the soil/cement ratio led to the faster development of structural build-up.
- The compressive strength decreased as the soil/cement ratio increased. In addition, the compressive strength values of different types of samples tested for the same mixture decreased as the amount of soil increased.
- The printed mixtures showed compressive strengths higher than the minimum strength required for structural concrete. Therefore, in theory, 3D printing of soil-based mixtures could be used to build load-bearing structures with a strength equivalent to that of traditional concrete structures.
- The total porosity increased as the soil/cement ratio in the mixtures increased, and the porosity results were consistent with those for compressive strength.
In conclusion, this study highlights the possibility of developing ecological and resistant mixtures based on excavated soil that can be used in 3D-printing construction applications. Indeed, the low and reduced quantities of cement observed in the mixtures could reduce construction and materials costs, the negative impact on the environment and the amount of CO2 generated by the cement manufacturing process.
Furthermore, based on the findings of this study, it would be interesting to investigate the long-term durability of developed soil-based printable mortars, including the rate of shrinkage and drying, as, in some cases, this can lead to the creation of micro-cracks in the printed element. It would also be interesting to carry out an X-ray tomography study of the printed samples to better understand the effect of 3D printing on their mechanical properties. Finally, it would be advantageous to conduct 3D printing tests of the soil-based mixtures on an industrial scale in order to validate the reliability of the mix-design methodology followed in the laboratory.
Author Contributions
Funding acquisition, N.-E.A.; investigation, J.D.; methodology, G.A., J.K. and M.B.; project administration, N.-E.A.; resources, M.B., N.-E.A. and G.A.; supervision, G.A., J.K., M.B. and N.-E.A.; validation, G.A., M.B. and J.K.; visualization, J.D. and J.K.; writing—original draft, J.D.; writing—review and editing, G.A. and J.K. All authors have read and agreed to the published version of the manuscript.
Funding
This research was funded by Chaire Industrielle ECOSED, IMT Nord Europe.
Data Availability Statement
The data presented in this study are available on request from the corresponding author.
Conflicts of Interest
The authors declare no conflict of interest.
References
- Puzatova, A.; Shakor, P.; Laghi, V.; Dmitrieva, M. Large-Scale 3D Printing for Construction Application by Means of Robotic Arm and Gantry 3D Printer: A Review. Buildings 2022, 12, 2023. [Google Scholar] [CrossRef]
- ASTM International F2792-12a; Standard Terminology for Additive Manufacturing Technologies. ASTM International: West Conshohocken, PA, USA, 2013.
- Valente, M.; Sibai, A.; Sambucci, M. Extrusion-Based Additive Manufacturing of Concrete Products: Revolutionizing and Remodeling the Construction Industry. J. Compos. Sci. 2019, 3, 88. [Google Scholar] [CrossRef] [Green Version]
- Sakin, M.; Kiroglu, Y.C. 3D Printing of Buildings: Construction of the Sustainable Houses of the Future by BIM. Energy Procedia 2017, 134, 702–711. [Google Scholar] [CrossRef]
- Pelz, J.S.; Ku, N.; Meyers, M.A.; Vargas-Gonzalez, L.R. Additive manufacturing of structural ceramics: A historical perspective. J. Mater. Res. Technol. 2021, 15, 670–695. [Google Scholar] [CrossRef]
- Allen, S.M.; Sachs, E.M. Three-dimensional printing of metal parts for tooling and other applications. Met. Mater. Int. 2000, 6, 589–594. [Google Scholar] [CrossRef]
- Jafferson, J.M.; Chatterjee, D. A review on polymeric materials in additive manufacturing. Mater. Today Proc. 2021, 46, 1349–1365. [Google Scholar] [CrossRef]
- Robayo-Salazar, R.; Mejía de Gutiérrez, R.; Villaquirán-Caicedo, M.A.; Delvasto Arjona, S. 3D printing with cementitious materials: Challenges and opportunities for the construction sector. Autom. Constr. 2023, 146, 104693. [Google Scholar] [CrossRef]
- Bos, F.; Wolfs, R.; Ahmed, Z.; Salet, T. Additive manufacturing of concrete in construction: Potentials and challenges of 3D concrete printing. Virtual Phys. Prototyp. 2016, 11, 209–225. [Google Scholar] [CrossRef] [Green Version]
- Crowley, A.G.; Tran, T.Q.; Green, M.J. Using nanomaterials to enhance the additive manufacturing of polymeric resins. Nano Futur. 2022, 6, 042502. [Google Scholar] [CrossRef]
- Siripongpreda, T.; Hoven, V.P.; Narupai, B.; Rodthongku, N. Emerging 3D printing based on polymers and nanomaterial additives: Enhancement of properties and potential applications. Eur. Polym. J. 2023, 184, 111806. [Google Scholar] [CrossRef]
- Hambach, M.; Volkmer, D. Properties of 3D-printed fiber-reinforced Portland cement paste. Cem. Concr. Compos. 2017, 79, 62–70. [Google Scholar] [CrossRef]
- Arunothayan, A.R.; Nematollahi, B.; Ranade, R.; Bong, S.H.; Sanjayan, J.G.; Khayat, K.H. Fiber orientation effects on ultra-high performance concrete formed by 3D printing. Cem. Concr. Res. 2021, 143, 106384. [Google Scholar] [CrossRef]
- Gao, W.; Zhang, Y.; Ramanujan, D.; Ramani, K.; Chen, Y.; Williams, C.B.; Wang, C.C.L.; Shin, Y.C.; Zhang, S.; Zavattieri, P.D. The status, challenges, and future of additive manufacturing in engineering. Comput. Des. 2015, 69, 65–89. [Google Scholar] [CrossRef]
- Ahuja, B.; Karg, M.; Schmidt, M. Additive manufacturing in production: Challenges and opportunities. In Laser 3D Manufacturing II, Proceedings of the SPIE LASE, San Francisco, CA, USA, 7–12 February 2015; Helvajian, H., Pique, A., Wegener, M., Gu, B., Eds.; SPIE Digital Library: Bellingham, WA, USA, 2015; Volume 9353, pp. 11–20. [Google Scholar] [CrossRef]
- Asprone, D.; Menna, C.; Bos, F.P.; Salet, T.A.M.; Mata-Falcón, J.; Kaufmann, W. Rethinking reinforcement for digital fabrication with concrete. Cem. Concr. Res. 2018, 112, 111–121. [Google Scholar] [CrossRef]
- Nematollahi, B.; Xia, M.; Sanjayan, J. Current progress of 3D concrete printing technologies. In Proceedings of the 34th International Symposium on Automation and Robotics in Construction, ISRAC 2017, Taipei, Taiwan, 28 June–1 July 2017; pp. 260–267. [Google Scholar]
- Han, Y.; Yang, Z.; Ding, T.; Xiao, J. Environmental and economic assessment on 3D printed buildings with recycled concrete. J. Clean. Prod. 2021, 278, 123884. [Google Scholar] [CrossRef]
- De Schutter, G.; Lesage, K.; Mechtcherine, V.; Nerella, V.N.; Habert, G.; Agusti-Juan, I. Vision of 3D printing with concrete—Technical, economic and environmental potentials. Cem. Concr. Res. 2018, 112, 25–36. [Google Scholar] [CrossRef]
- Zhang, J.; Wang, J.; Dong, S.; Yu, X.; Han, B. A review of the current progress and application of 3D printed concrete. Compos. Part A Appl. Sci. Manuf. 2019, 125, 105533. [Google Scholar] [CrossRef]
- Le, T.T.; Austin, S.A.; Lim, S.; Buswell, R.A.; Gibb, A.G.F.; Thorpe, T. Mix design and fresh properties for high-performance printing concrete. Mater. Struct. Constr. 2012, 45, 1221–1232. [Google Scholar] [CrossRef] [Green Version]
- Perrot, A.; Rangeard, D.; Pierre, A. Structural built-up of cement-based materials used for 3D-printing extrusion techniques. Mater. Struct. Constr. 2016, 49, 1213–1220. [Google Scholar] [CrossRef]
- Kazemian, A.; Yuan, X.; Cochran, E.; Khoshnevis, B. Cementitious materials for construction-scale 3D printing: Laboratory testing of fresh printing mixture. Constr. Build. Mater. 2017, 145, 639–647. [Google Scholar] [CrossRef]
- Alhumayani, H.; Gomaa, M.; Soebarto, V.; Jabi, W. Environmental assessment of large-scale 3D printing in construction: A comparative study between cob and concrete. J. Clean. Prod. 2020, 270, 122463. [Google Scholar] [CrossRef]
- Batikha, M.; Jotangia, R.; Baaj, M.Y.; Mousleh, I. 3D concrete printing for sustainable and economical construction: A comparative study. Autom. Constr. 2022, 134, 104087. [Google Scholar] [CrossRef]
- Klyuev, S.; Klyuev, A.; Fediuk, R.; Ageeva, M.; Fomina, E.; Amran, M.; Murali, G. Fresh and mechanical properties of low-cement mortars for 3D printing. Constr. Build. Mater. 2022, 338, 127644. [Google Scholar] [CrossRef]
- Ma, G.; Li, Z.; Wang, L. Printable properties of cementitious material containing copper tailings for extrusion based 3D printing. Constr. Build. Mater. 2018, 162, 613–627. [Google Scholar] [CrossRef]
- Chen, Y.; Romero Rodriguez, C.; Li, Z.; Chen, B.; Çopuroğlu, O.; Schlangen, E. Effect of different grade levels of calcined clays on fresh and hardened properties of ternary-blended cementitious materials for 3D printing. Cem. Concr. Compos. 2020, 114, 103708. [Google Scholar] [CrossRef]
- Panda, B.; Lim, J.H.; Tan, M.J. Mechanical properties and deformation behaviour of early age concrete in the context of digital construction. Compos. Part B Eng. 2019, 165, 563–571. [Google Scholar] [CrossRef]
- Liu, Z.; Li, M.; Weng, Y.; Wong, T.N.; Tan, M.J. Mixture Design Approach to optimize the rheological properties of the material used in 3D cementitious material printing. Constr. Build. Mater. 2019, 198, 245–255. [Google Scholar] [CrossRef]
- Liu, C.; Wang, X.; Chen, Y.; Zhang, C.; Ma, L.; Deng, Z.; Chen, C.; Zhang, Y.; Pan, J.; Banthia, N. Influence of hydroxypropyl methylcellulose and silica fume on stability, rheological properties, and printability of 3D printing foam concrete. Cem. Concr. Compos. 2021, 122, 104158. [Google Scholar] [CrossRef]
- Daher, J.; Kleib, J.; Benzerzour, M.; Abriak, N.E.; Aouad, G. Recycling of Flash-Calcined Dredged Sediment for Concrete 3D Printing. Buildings 2022, 12, 1400. [Google Scholar] [CrossRef]
- Long, W.J.; Lin, C.; Tao, J.L.; Ye, T.H.; Fang, Y. Printability and particle packing of 3D-printable limestone calcined clay cement composites. Constr. Build. Mater. 2021, 282, 122647. [Google Scholar] [CrossRef]
- Khan, S.A.; Koç, M.; Al-Ghamdi, S.G. Sustainability assessment, potentials and challenges of 3D printed concrete structures: A systematic review for built environmental applications. J. Clean. Prod. 2021, 303, 127027. [Google Scholar] [CrossRef]
- Yao, Y.; Hu, M.; Di Maio, F.; Cucurachi, S. Life cycle assessment of 3D printing geo-polymer concrete: An ex-ante study. J. Ind. Ecol. 2020, 24, 116–127. [Google Scholar] [CrossRef] [Green Version]
- Ilcan, H.; Sahin, O.; Kul, A.; Yildirim, G.; Sahmaran, M. Rheological properties and compressive strength of construction and demolition waste-based geopolymer mortars for 3D-Printing. Constr. Build. Mater. 2022, 328, 127114. [Google Scholar] [CrossRef]
- Excavated Soils: The Biggest Source of Waste You’ve Never Heard of—EURACTIV.com. Available online: https://www.euractiv.com/section/circular-economy/news/excavated-soils-the-biggest-source-of-waste-youve-never-heard-of/ (accessed on 20 January 2023).
- Valorisation des Terres Excavées Issues de Sites et Sols Potentiellement Pollués. BRGM. Available online: https://www.brgm.fr/fr/solutions/valorisation-terres-excavees-issues-sites-sols-potentiellement-pollues (accessed on 19 January 2023).
- Traiter les 47 Millions de Tonnes de Déchets de Chantier du Grand. Available online: https://www.batirama.com/article/50563-traiter-les-47-millions-de-tonnes-de-dechets-de-chantier-du-grand-paris-express.html (accessed on 19 January 2023).
- Hale, S.E.; Roque, A.J.; Okkenhaug, G.; Sørmo, E.; Lenoir, T.; Carlsson, C.; Kupryianchyk, D.; Flyhammar, P.; Žlender, B. The reuse of excavated soils from construction and demolition projects: Limitations and possibilities. Sustainability 2021, 13, 6083. [Google Scholar] [CrossRef]
- Walsh, D.; McRae, I.; Zirngibl, R.; Chawla, S.; Zhang, H.; Alfieri, A.; Moore, H.; Bailey, C.; Brooks, A.; Ostock, T.; et al. Generation rate and fate of surplus soil extracted in New York City. Sci. Total Environ. 2019, 650, 3093–3100. [Google Scholar] [CrossRef] [PubMed]
- Capasso, I.; Liguori, B.; Ferone, C.; Caputo, D.; Cioffi, R. Strategies for the valorization of soil waste by geopolymer production: An overview. J. Clean. Prod. 2021, 288, 125646. [Google Scholar] [CrossRef]
- Priyadharshini, P.; Ramamurthy, K.; Robinson, R.G. Sustainable reuse of excavation soil in cementitious composites. J. Clean. Prod. 2018, 176, 999–1011. [Google Scholar] [CrossRef]
- Khelifi, H.; Perrot, A.; Lecompte, T.; Ausias, G. Design of clay/cement mixtures for extruded building products. Mater. Struct. Constr. 2013, 46, 999–1010. [Google Scholar] [CrossRef]
- Khelifi, H.; Lecompte, T.; Perrot, A.; Ausias, G. Mechanical enhancement of cement-stabilized soil by flax fibre reinforcement and extrusion processing. Mater. Struct. Constr. 2016, 49, 1143–1156. [Google Scholar] [CrossRef]
- Temimi, M.; Ben Amor, K.; Camps, J.P. Making building products by extrusion and cement stabilization: Limits of the process with montmorillonite clay. Appl. Clay Sci. 1998, 13, 245–253. [Google Scholar] [CrossRef]
- Molard, J.P.; Camps, J.P.; Laquerbe, M. Etude de l’extrusion et de la stabilisation par le ciment d’argiles monominérales. Mater. Struct. 1987, 20, 44–50. [Google Scholar] [CrossRef]
- D’Haese, R.; Carpentier, O.; Dubois, V.; Chafei, S.; Wirquin, E. 3D-Printable Materials Made with Industrial By-Products: Formulation, Fresh and Hardened Properties. Sustainability 2022, 14, 14236. [Google Scholar] [CrossRef]
- Perrot, A.; Rangeard, D.; Courteille, E. 3D printing of earth-based materials: Processing aspects. Constr. Build. Mater. 2018, 172, 670–676. [Google Scholar] [CrossRef]
- The First 3D Printed House with Earth Gaia 3D Printers WASP. Available online: https://www.3dwasp.com/en/3d-printed-house-gaia/ (accessed on 1 June 2023).
- Ferretti, E.; Moretti, M.; Chiusoli, A.; Naldoni, L.; De Fabritiis, F.; Visonà, M. Mechanical Properties of a 3D-Printed Wall Segment Made with an Earthen Mixture. Materials 2022, 15, 438. [Google Scholar] [CrossRef]
- Haese, R.D.; Dubois, V.; Carpentier, O.; Chartier, T.; Chafei, S.; Wirquin, E. Composite for additive manufacturing including flax byproducts and quarry fines. In Proceedings of the 2nd EuroMaghrébine Conference of BioComposites, Hammamet, Tunisia, 1–3 November 2018. [Google Scholar]
- AFNOR NF EN 933-1; Essais Pour Déterminer les Caractéristiques Géométriques des Granulats–Partie 1: Détermination de la Granularité–Analyse Granulométrique par Tamisage. AFNOR: Paris, France, 2012.
- AFNOR NF EN ISO 17892-12; Reconnaissance et Essais Géotechniques–Essais de Laboratoire sur les Sols–Partie 12: Détermination des Limites de Liquidité et de Plasticité. AFNOR: Paris, France, 2018.
- AFNOR NF P 94-068; Sols: Reconnaissance et Essais–Mesure de la Capacité d’Adsorption de Bleu de Méthylène d’un Sol ou d’un Matériau Rocheux–Détermination de la Valeur de Bleu de Méthylène d’un Sol ou d’un Matériau Rocheux par l’Essai à la Tache. AFNOR: Paris, France, 1998.
- Baz, B.; Remond, S.; Aouad, G. Influence of the mix composition on the thixotropy of 3D printable mortars. Mag. Concr. Res. 2022, 74, 271–283. [Google Scholar] [CrossRef]
- MasterSuna SBS 4131. Available online: https://www.master-builders-solutions.com/fr-fr/nos-solutions/mastersuna/mastersuna-sbs-4131 (accessed on 17 May 2023).
- Inozemtcev, A.; Korolev, E.; Qui, D.T. Study of mineral additives for cement materials for 3D-printing in construction. IOP Conf. Ser. Mater. Sci. Eng. 2018, 365, 032009. [Google Scholar] [CrossRef]
- Qian, Y. Effect of polycarboxylate ether (PCE) superplasticizer on thixotropic structural build-up of fresh cement pastes over time. Constr. Build. Mater. 2021, 291, 123241. [Google Scholar] [CrossRef]
- Chen, Y.; Li, Z.; Figueiredo, S.C.; Çopuroğlu, O.; Veer, F.; Schlangen, E. Limestone and Calcined Clay-Based Sustainable Cementitious Materials for 3D Concrete Printing: A Fundamental Study of Extrudability and Early-Age Strength Development. Appl. Sci. 2019, 9, 1809. [Google Scholar] [CrossRef] [Green Version]
- Qian, Y.; De Schutter, G. Enhancing thixotropy of fresh cement pastes with nanoclay in presence of polycarboxylate ether superplasticizer (PCE). Cem. Concr. Res. 2018, 111, 15–22. [Google Scholar] [CrossRef]
- AFNOR P 18-358; Adjuvants pour Bétons, Mortiers et Coulis–Coulis Courants d’Injection pour Précontrainte–Mesure de la Fluidité et de la Réduction d’Eau. AFNOR: Paris, France, 1985.
- Wedding, P.; Kantro, D. Influence of Water-Reducing Admixtures on Properties of Cement Paste—A Miniature Slump Test. Cem. Concr. Aggreg. 1980, 2, 95–102. [Google Scholar] [CrossRef]
- Mardani-Aghabaglou, A.; Öztürk, H.T.; Kankal, M.; Ramyar, K. Assessment and prediction of cement paste flow behavior; Marsh-funnel flow time and mini-slump values. Constr. Build. Mater. 2021, 301, 124072. [Google Scholar] [CrossRef]
- Tan, Z.; Bernal, S.A.; Provis, J.L. Reproducible mini-slump test procedure for measuring the yield stress of cementitious pastes. Mater. Struct. Constr. 2017, 50, 235. [Google Scholar] [CrossRef] [Green Version]
- Khalil, N.; Aouad, G.; El Cheikh, K.; Rémond, S. Use of calcium sulfoaluminate cements for setting control of 3D-printing mortars. Constr. Build. Mater. 2017, 157, 382–391. [Google Scholar] [CrossRef]
- AFNOR NF EN 1015-3; Méthodes d’Essai des Mortiers pour Maçonnerie–Partie 3: Détermination de la Consistance du Mortier Frais (avec une Table à Secousses). AFNOR: Paris, France, 1999.
- AFNOR NF EN 480-2; Adjuvants pour Béton, Mortier et Coulis–Méthodes d’Essai–Partie 2: Détermination du Temps de Prise. AFNOR: Paris, France, 2006.
- AFNOR EN ISO 17892-6; Reconnaissance et Essais Géotechniques–Essais de Laboratoire sur les Sols–Partie 6: Essai de Pénétration de Cone. International Organization for Standardization: London, UK, 2017.
- Estellé, P.; Michon, C.; Lanos, C.; Grossiord, J.L. Chapitre 7: De l’intérêt d’une caractérisation rhéologique empirique et relative. In La Mesure en Rhéologie; EDP Sciences: Les Ulis, France, 2021; pp. 205–248. [Google Scholar] [CrossRef]
- AFNOR EN NF 196-1; Méthodes d’Essais des Ciments–Partie 1: Détermination des Résistances. AFNOR: Paris, France, 2016.
- AFNOR ISO 15901-1:2016; Evaluation de la Distribution de Taille des Pores et la Porosité des Matériaux Solides par Porosimétrie à Mercure et L’adsorption des Gaz–Partie 1: Porosimétrie à Mercure. International Organization for Standardization: London, UK, 2016.
- Panda, B.; Ruan, S.; Unluer, C.; Tan, M.J. Improving the 3D printability of high-volume fly ash mixtures via the use of nano attapulgite clay. Compos. Part B Eng. 2019, 165, 75–83. [Google Scholar] [CrossRef]
- Kaushik, S.; Sonebi, M.; Amato, G.; Perrot, A.; Das, U.K. Influence of nanoclay on the fresh and rheological behaviour of 3D printing mortar. Mater. Today Proc. 2022, 58, 1063–1068. [Google Scholar] [CrossRef]
- Chen, M.; Yang, L.; Zheng, Y.; Huang, Y.; Li, L.; Zhao, P.; Wang, S.; Lu, L.; Cheng, X. Yield stress and thixotropy control of 3D-printed calcium sulfoaluminate cement composites with metakaolin related to structural build-up. Constr. Build. Mater. 2020, 252, 119090. [Google Scholar] [CrossRef]
- Zhang, Y.; Zhang, Y.; Liu, G.; Yang, Y.; Wu, M.; Pang, B. Fresh properties of a novel 3D printing concrete ink. Constr. Build. Mater. 2018, 174, 263–271. [Google Scholar] [CrossRef]
- Rahul, A.V.; Santhanam, M.; Meena, H.; Ghani, Z. 3D printable concrete: Mixture design and test methods. Cem. Concr. Compos. 2019, 97, 13–23. [Google Scholar] [CrossRef]
- Wolfs, R.J.M.; Bos, F.P.; Salet, T.A.M. Hardened properties of 3D printed concrete: The influence of process parameters on interlayer adhesion. Cem. Concr. Res. 2019, 119, 132–140. [Google Scholar] [CrossRef]
- Le, T.T.; Austin, S.A.; Lim, S.; Buswell, R.A.; Law, R.; Gibb, A.G.F.; Thorpe, T. Hardened properties of high-performance printing concrete. Cem. Concr. Res. 2012, 42, 558–566. [Google Scholar] [CrossRef] [Green Version]
- Panda, B.; Chandra Paul, S.; Jen Tan, M. Anisotropic mechanical performance of 3D printed fiber reinforced sustainable construction material. Mater. Lett. 2017, 209, 146–149. [Google Scholar] [CrossRef]
- Paul, S.C.; Tay, Y.W.D.; Panda, B.; Tan, M.J. Fresh and hardened properties of 3D printable cementitious materials for building and construction. Arch. Civ. Mech. Eng. 2018, 18, 311–319. [Google Scholar] [CrossRef]
- Feng, P.; Meng, X.; Chen, J.F.; Ye, L. Mechanical properties of structures 3D printed with cementitious powders. Constr. Build. Mater. 2015, 93, 486–497. [Google Scholar] [CrossRef] [Green Version]
- Koker, D. De Manufacturing Processes for Engineered Cement-Based Composite Material Products. Master’s Thesis, Stellenbosch University, Stellenbosch, South Africa, 2004. [Google Scholar]
- American Concrete Institute. Building Code Requirements for Structural Concrete (ACI 318-95) and Commentary (ACI 318R-95); American Concrete Institute: Farmington Hills, MI, USA, 1995. [Google Scholar]
- American Concrete Institute. Chapter 3: The Strength of Concrete. In 2012 Concrete Manual; American Concrete Institute: Farmington Hills, MI, USA, 2012. [Google Scholar]
Figure 1.
Particle size distribution of excavated soil.

Figure 2.
Particle size distribution of the cement.

Figure 3.
Determination of superplasticizer saturation using (a) the marsh cone test and (b) the mini cone test.
Figure 3.
Determination of superplasticizer saturation using (a) the marsh cone test and (b) the mini cone test.

Figure 4.
Printability requirements: extrudability and buildability.

Figure 5.
Set-up and steps of the modified mini slump test used to test the buildability of mortars.
Figure 5.
Set-up and steps of the modified mini slump test used to test the buildability of mortars.

Figure 6.
Samples printed with (a) the manual gun and (b) the laboratory printer.

Figure 7.
Direction of loading force applied (a) parallel (along the Y-axis) or (b) perpendicular (along the Z-axis) to the printed layers of the samples for the compressive strength test.
Figure 7.
Direction of loading force applied (a) parallel (along the Y-axis) or (b) perpendicular (along the Z-axis) to the printed layers of the samples for the compressive strength test.

Figure 8.
Cement grout flow time at 5, 15, 30 and 60 min with (a) MasterSuna SBS 4131, (b) CHRYSO®Fluid Optima 100 and (c) MasterGlenium ACE 456.
Figure 8.
Cement grout flow time at 5, 15, 30 and 60 min with (a) MasterSuna SBS 4131, (b) CHRYSO®Fluid Optima 100 and (c) MasterGlenium ACE 456.

Figure 9.
Cement grout flow time with MasterSuna SBS 4131, MasterGlenium ACE 456 and CHRYSO®Fluid Optima 100 at 15 min.
Figure 9.
Cement grout flow time with MasterSuna SBS 4131, MasterGlenium ACE 456 and CHRYSO®Fluid Optima 100 at 15 min.

Figure 10.
Spreading diameter of cement paste at 5, 15 and 30 min with (a) MasterSuna SBS 4131, (b) CHRYSO®Fluid Optima 100 and (c) MasterGlenium ACE 456.
Figure 10.
Spreading diameter of cement paste at 5, 15 and 30 min with (a) MasterSuna SBS 4131, (b) CHRYSO®Fluid Optima 100 and (c) MasterGlenium ACE 456.

Figure 11.
Spreading diameter of soil paste at 5, 15 and 30 min with (a) MasterSuna SBS 4131, (b) CHRYSO®Fluid Optima 100 and (c) MasterGlenium ACE 456.
Figure 11.
Spreading diameter of soil paste at 5, 15 and 30 min with (a) MasterSuna SBS 4131, (b) CHRYSO®Fluid Optima 100 and (c) MasterGlenium ACE 456.

Figure 12.
Spreading diameters of cement/soil pastes (M1, M2 and M3) with MasterGlenium ACE 456 at 5, 15 and 30 min.
Figure 12.
Spreading diameters of cement/soil pastes (M1, M2 and M3) with MasterGlenium ACE 456 at 5, 15 and 30 min.

Figure 13.
Extrudability of M1 mixtures with (a) 0.45%, (b) 0.48% and (c) 0.51% SP.

Figure 14.
Buildability of M1 mixtures with (a) 0.45%, (b) 0.48% and (c) 0.51% SP.

Figure 15.
Extrudability of M2 mixtures with (a) 0.72% and (b) 0.75% SP.

Figure 16.
Buildability of M2 mixtures with (a) 0.72% and (b) 0.75% SP.

Figure 17.
Extrudability of M3 mixtures with (a) 0.87%, (b) 0.9% and (c) 1% SP.

Figure 18.
Buildability of M3 mixtures with (a) 0.87%, (b) 0.9% and (c) 1% SP.

Figure 19.
The 3D printing of the (a) M1, (b) M2 and (c) M3 mixtures using the three-axis laboratory printer.
Figure 19.
The 3D printing of the (a) M1, (b) M2 and (c) M3 mixtures using the three-axis laboratory printer.

Figure 20.
Flow diameters of M1, M2 and M3.

Figure 21.
Initial and final setting times of M1, M2 and M3.

Figure 22.
Yield stress of M1, M2 and M3 as a function of time.

Figure 23.
Compressive strength at 1, 7 and 28 days of the different types of samples of the (a) M1, (b) M2 and (c) M3 mixtures.
Figure 23.
Compressive strength at 1, 7 and 28 days of the different types of samples of the (a) M1, (b) M2 and (c) M3 mixtures.


Figure 24.
Total porosity results for samples at 28 days (%).


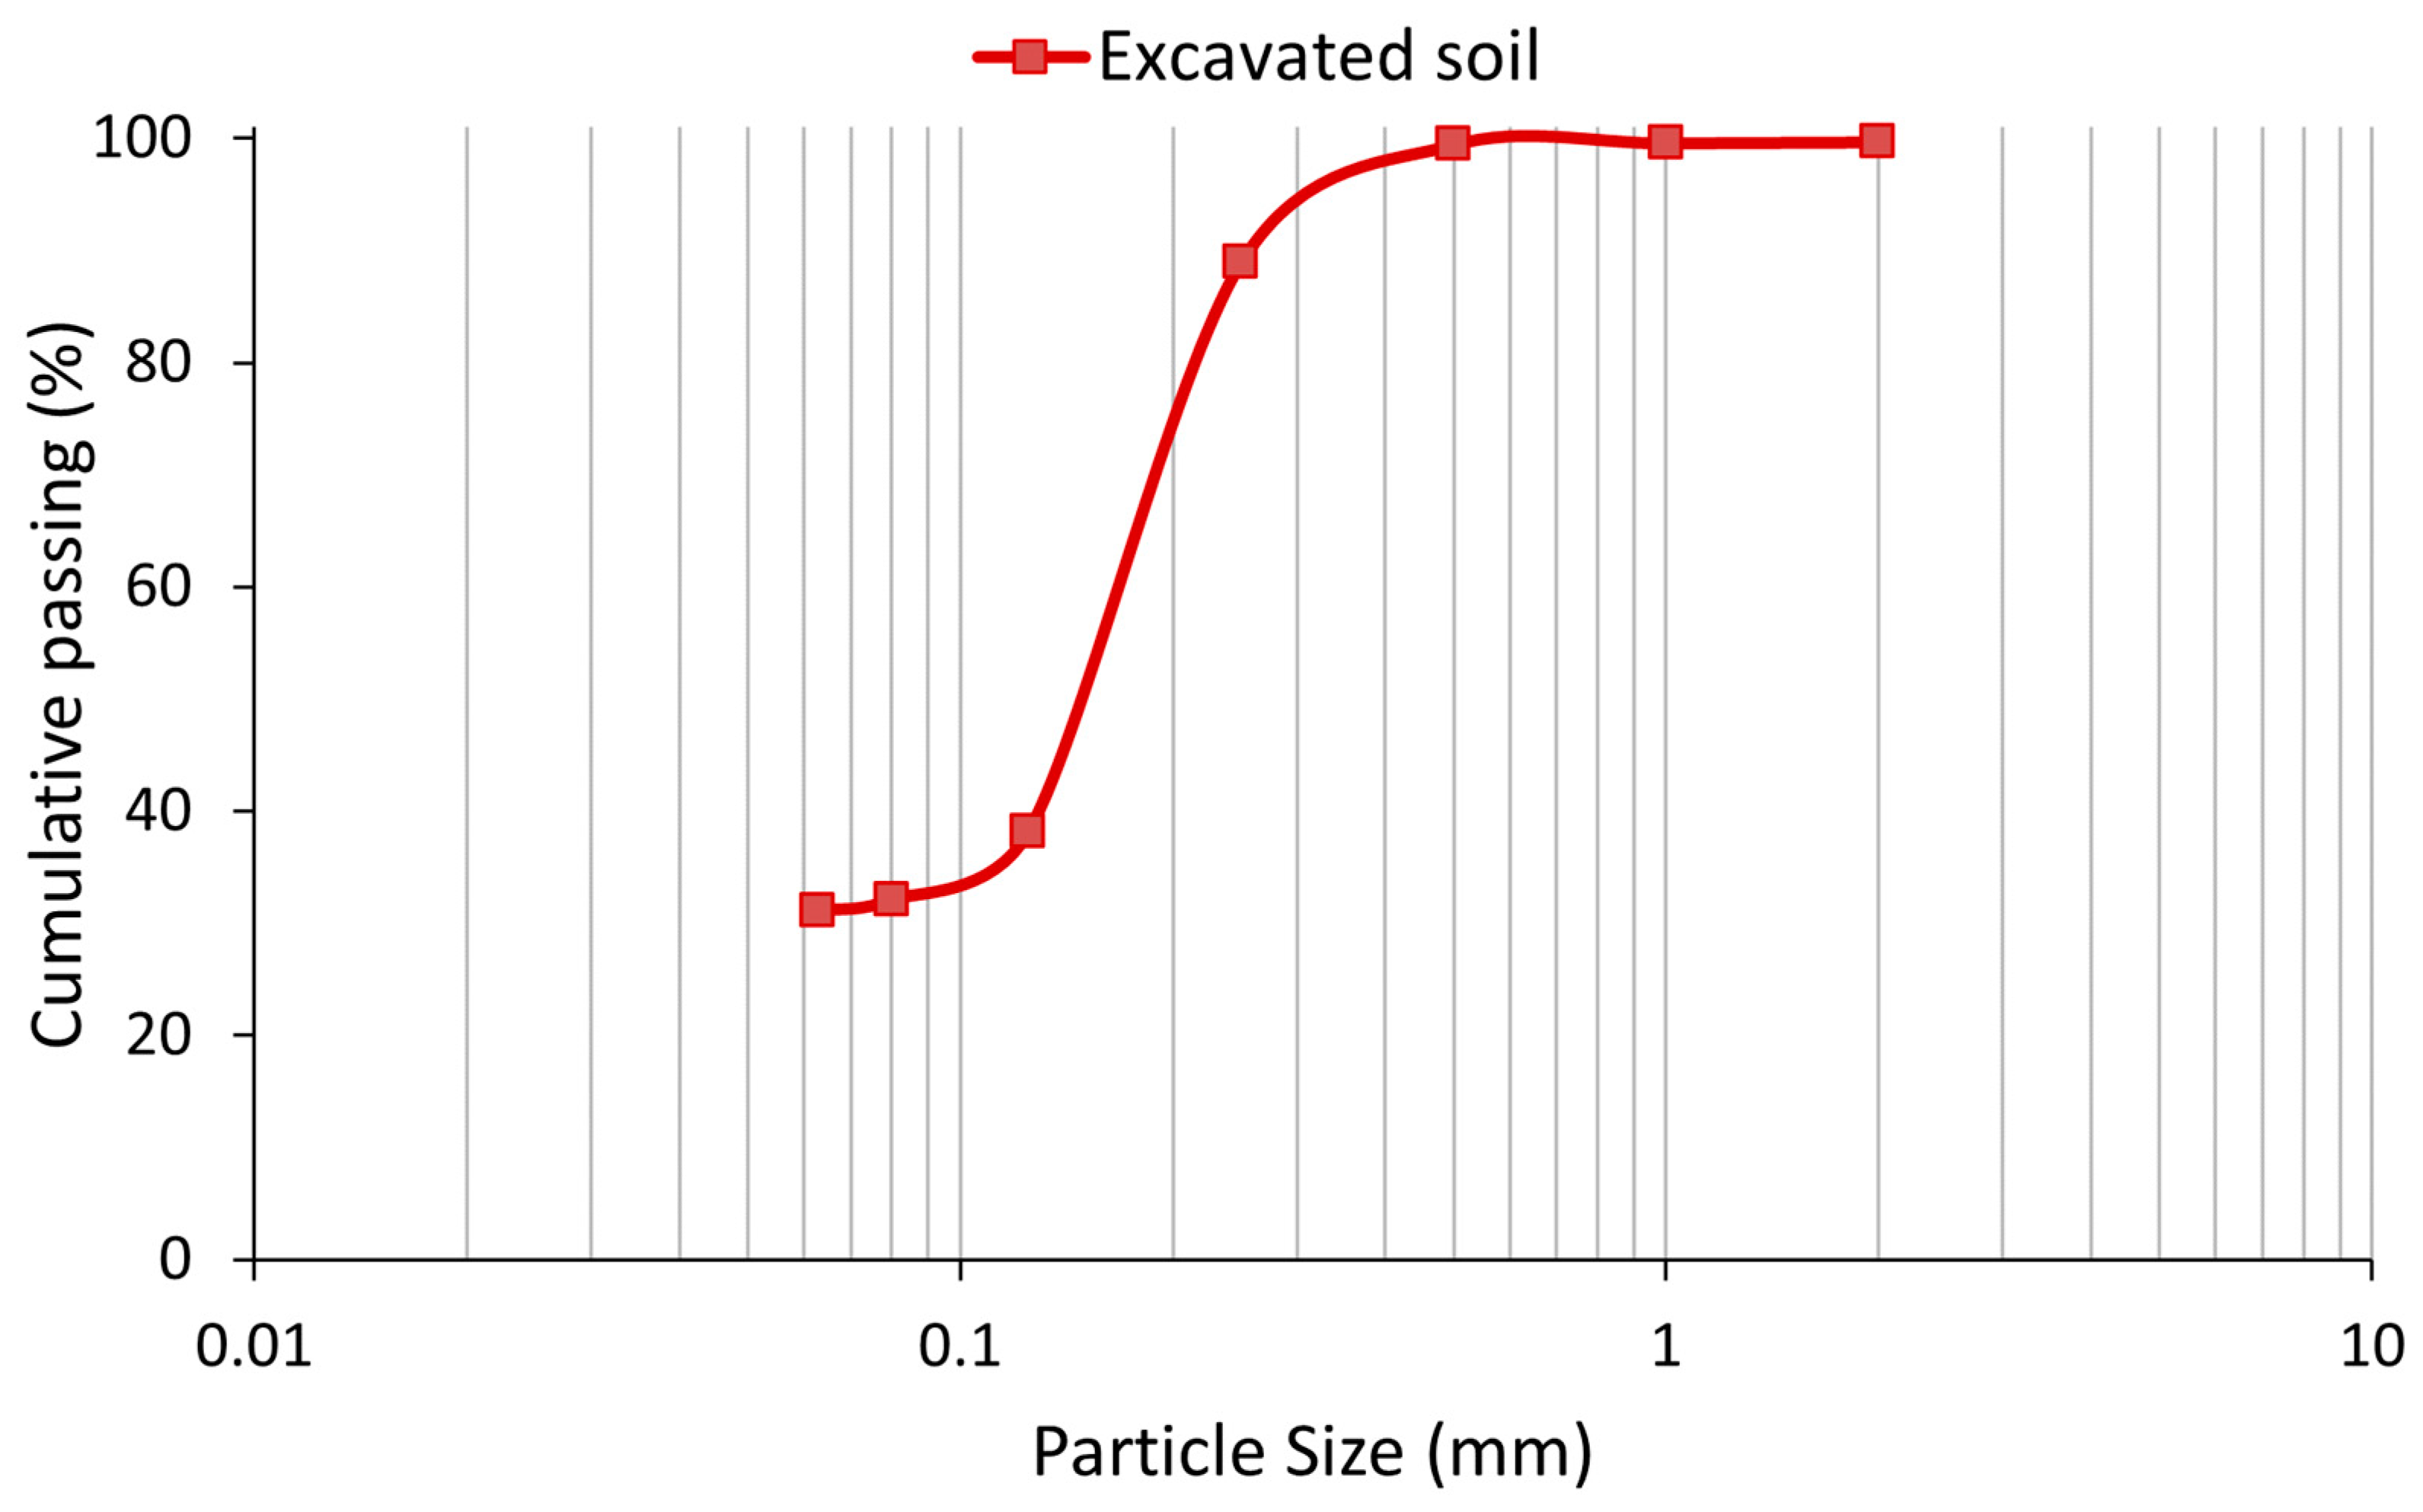
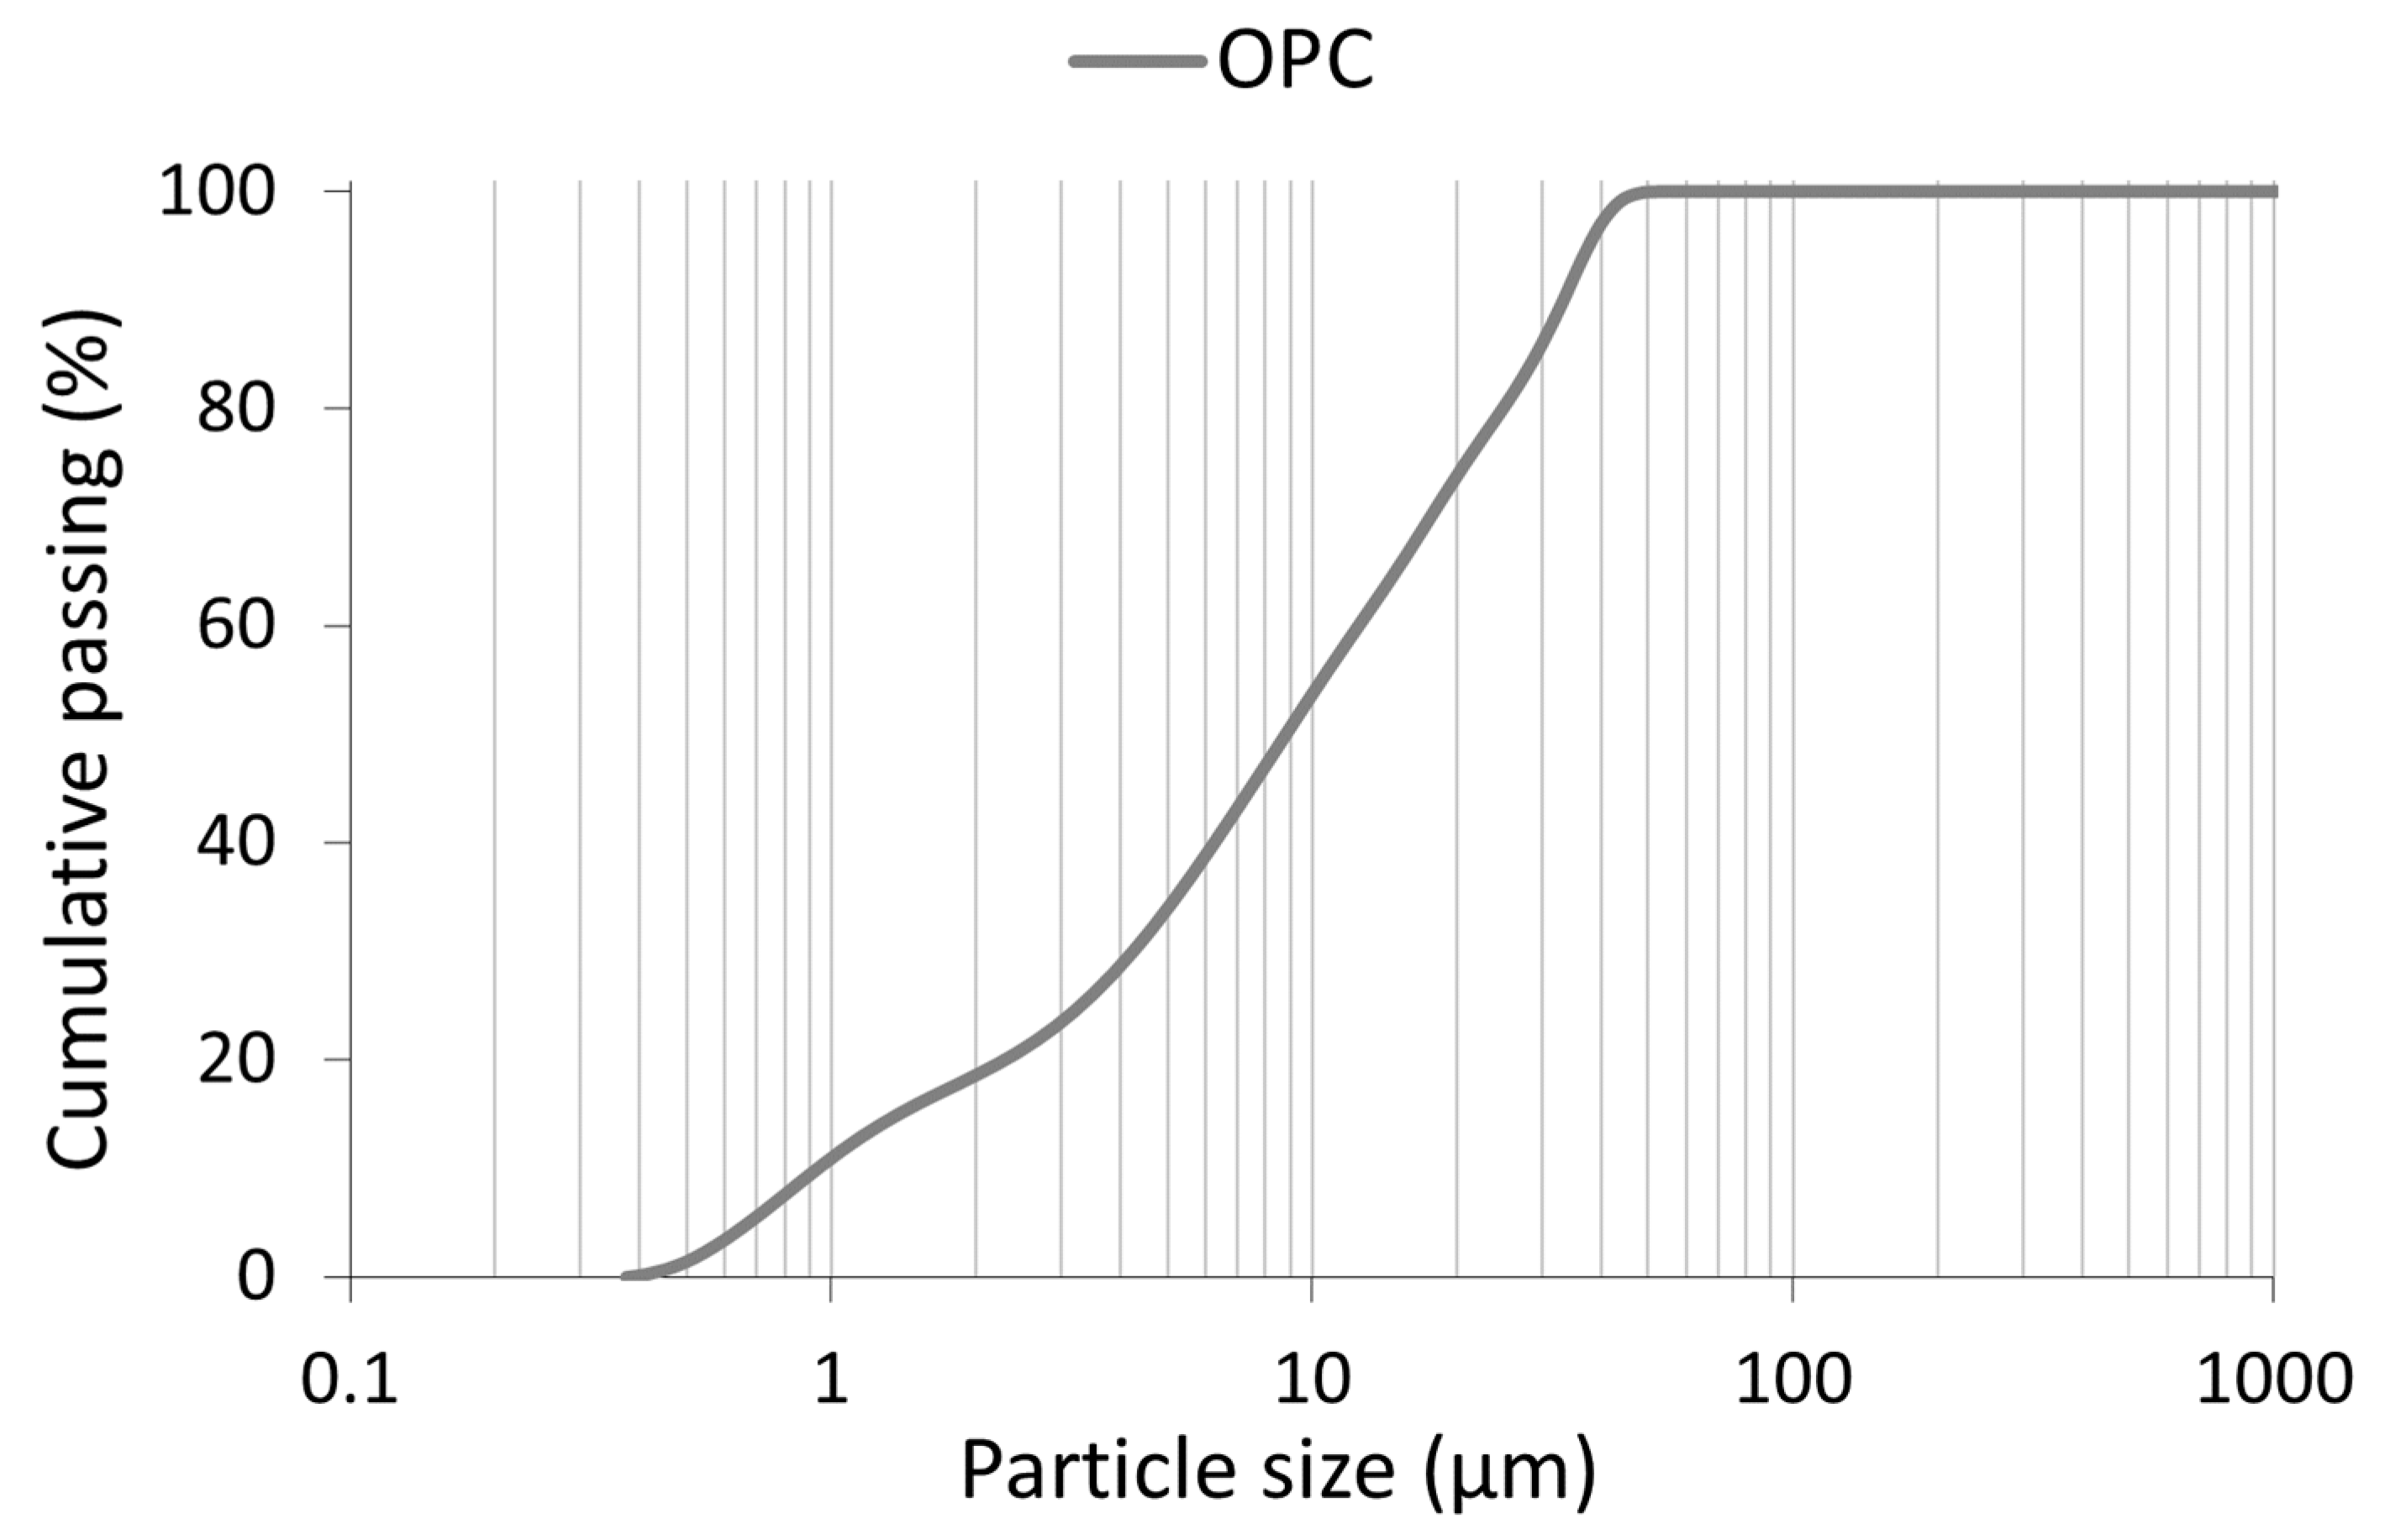
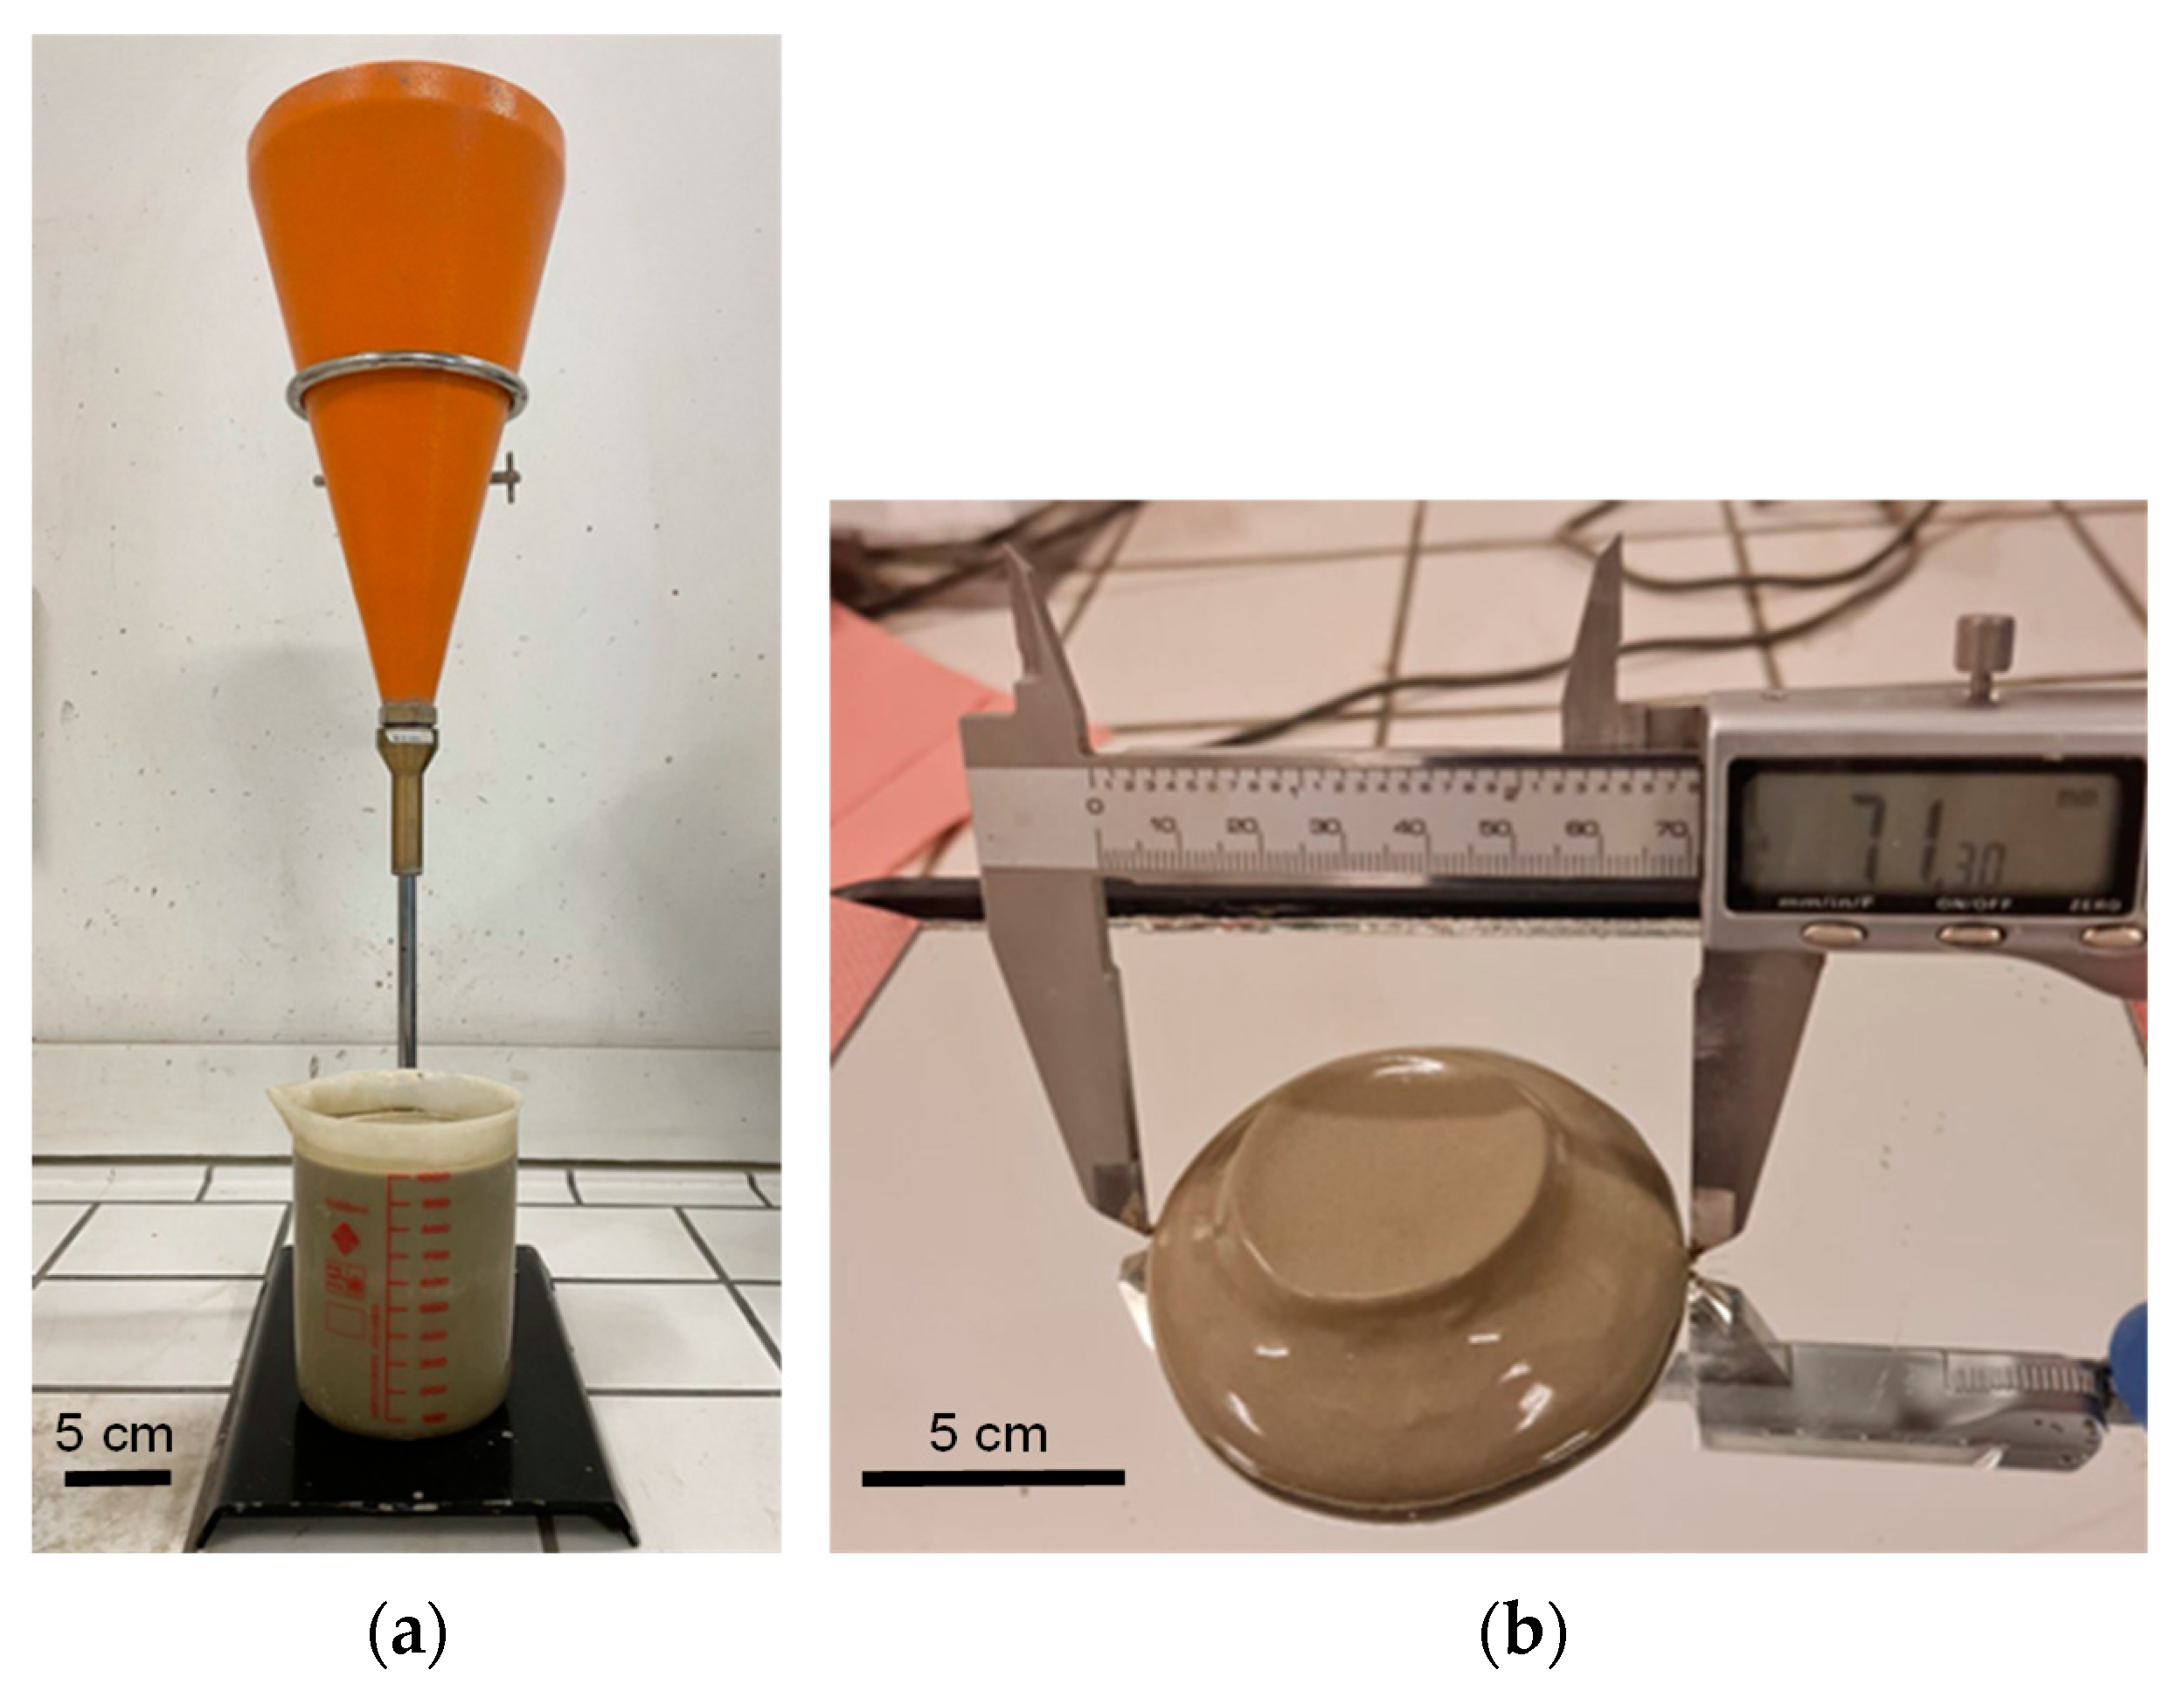
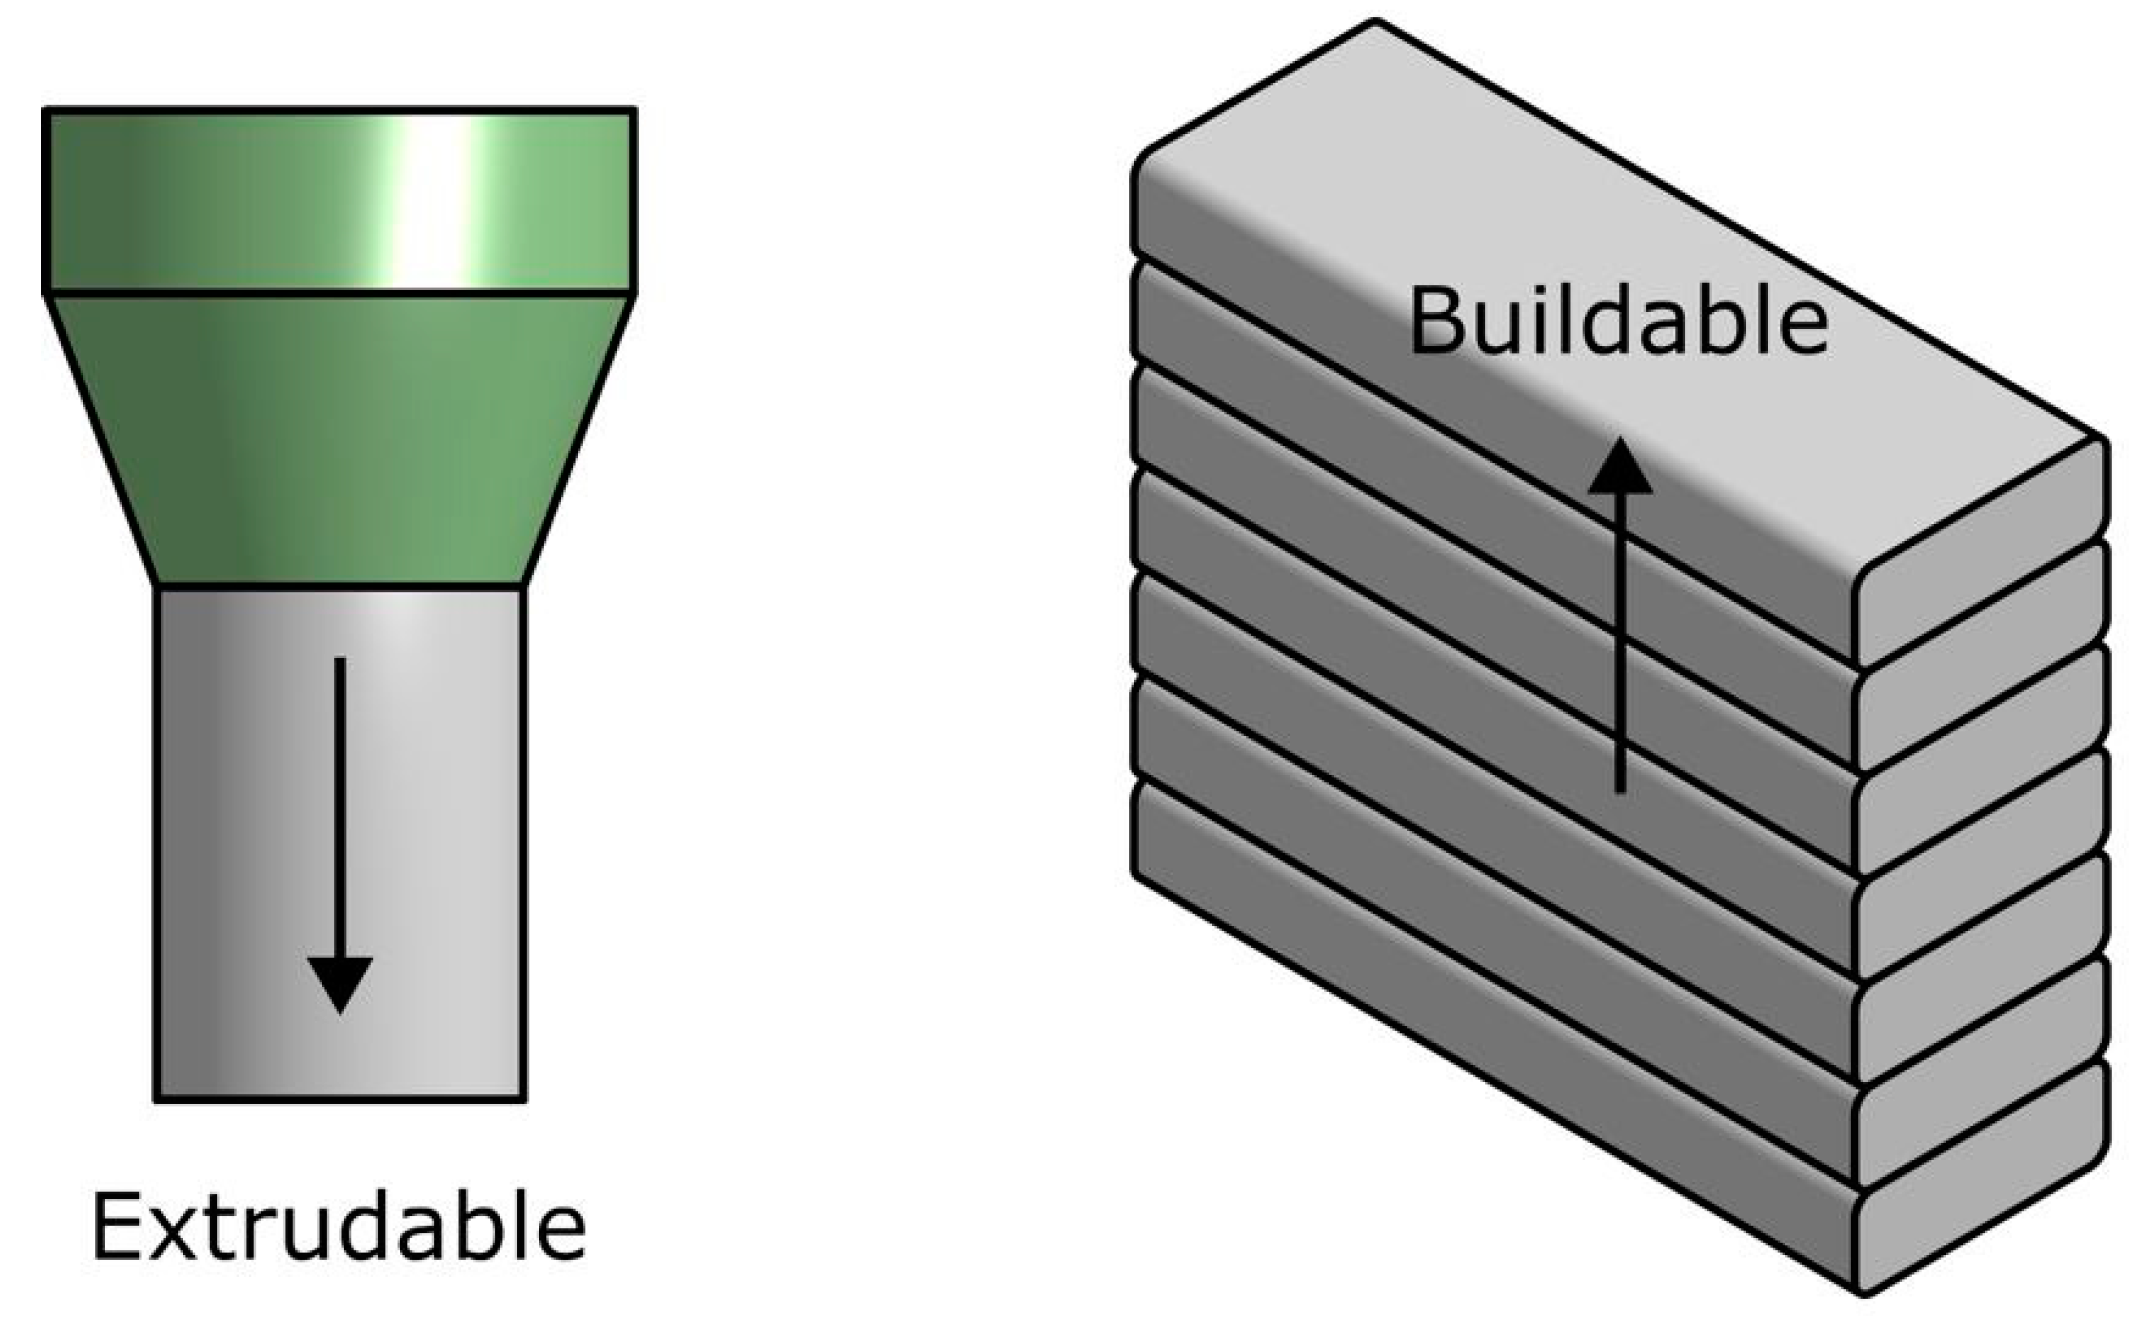
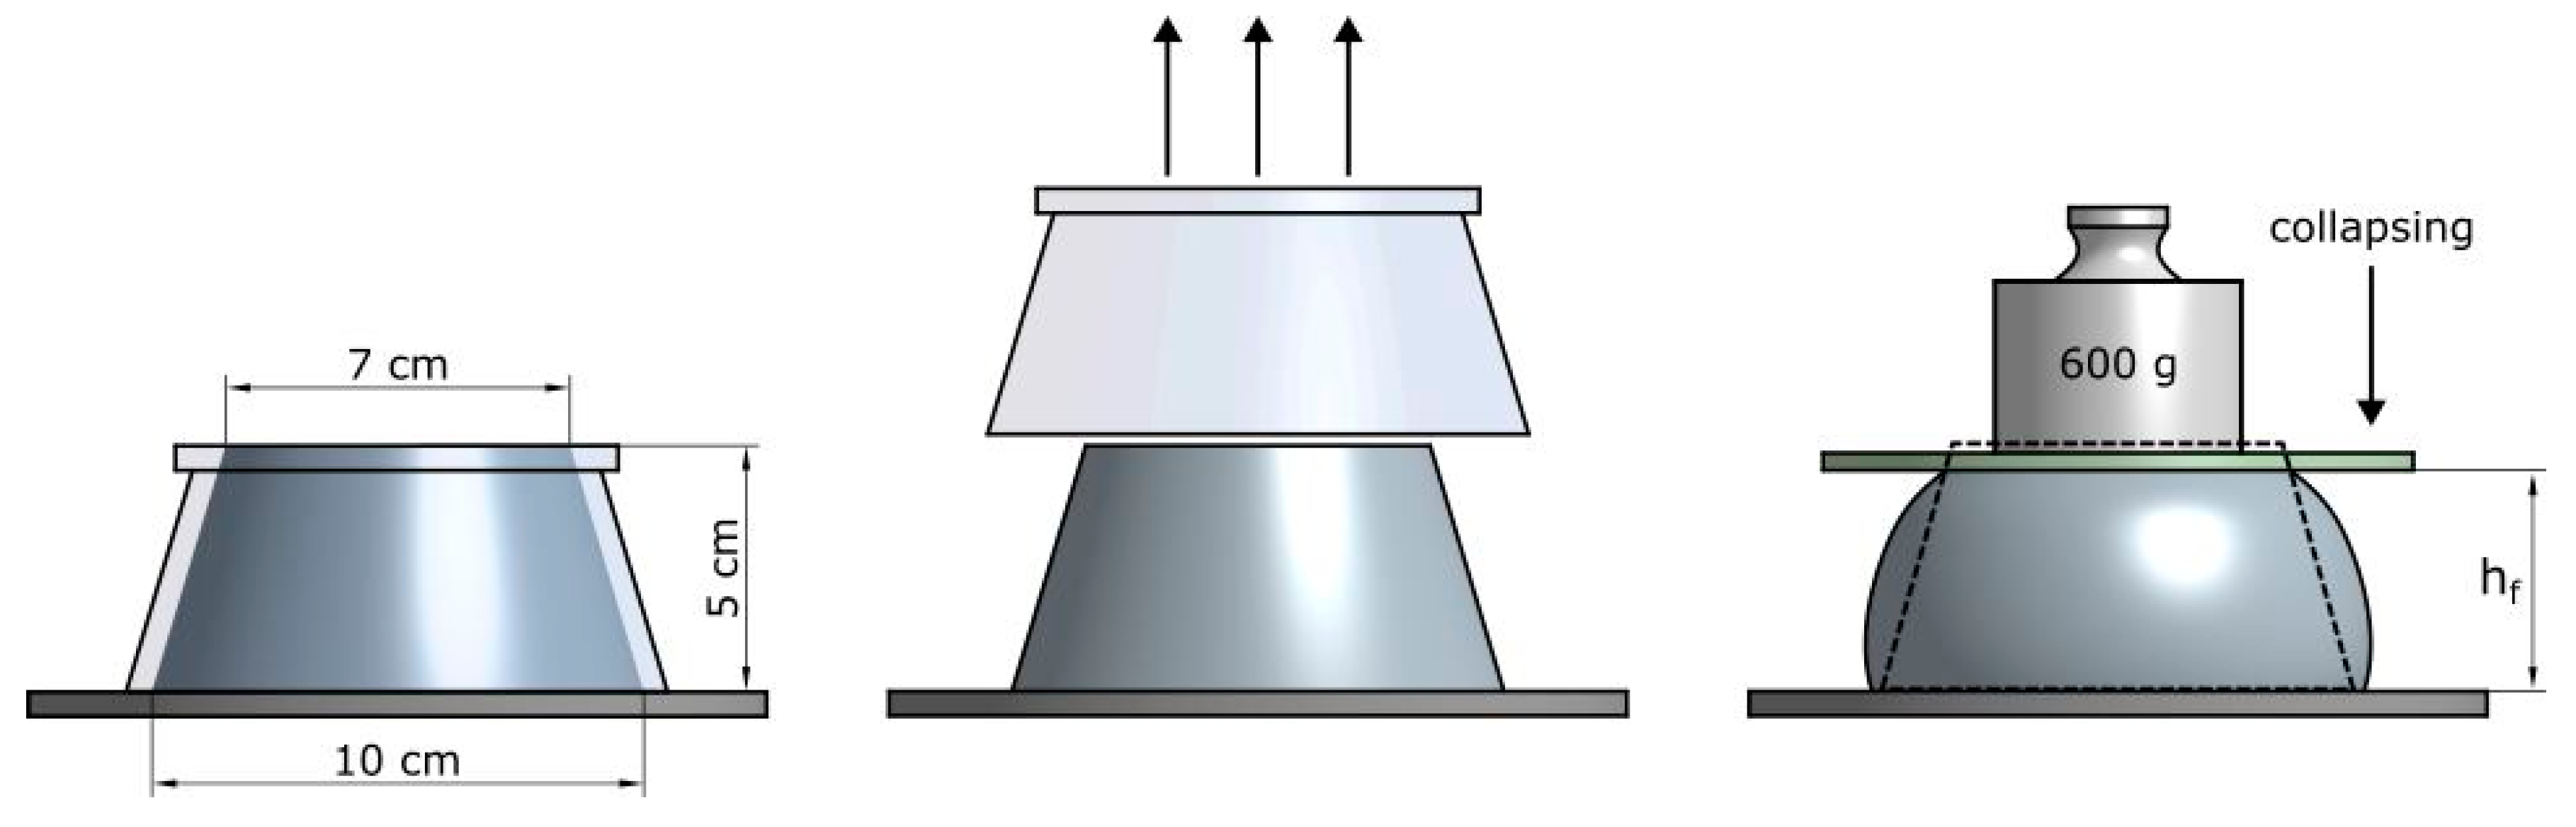
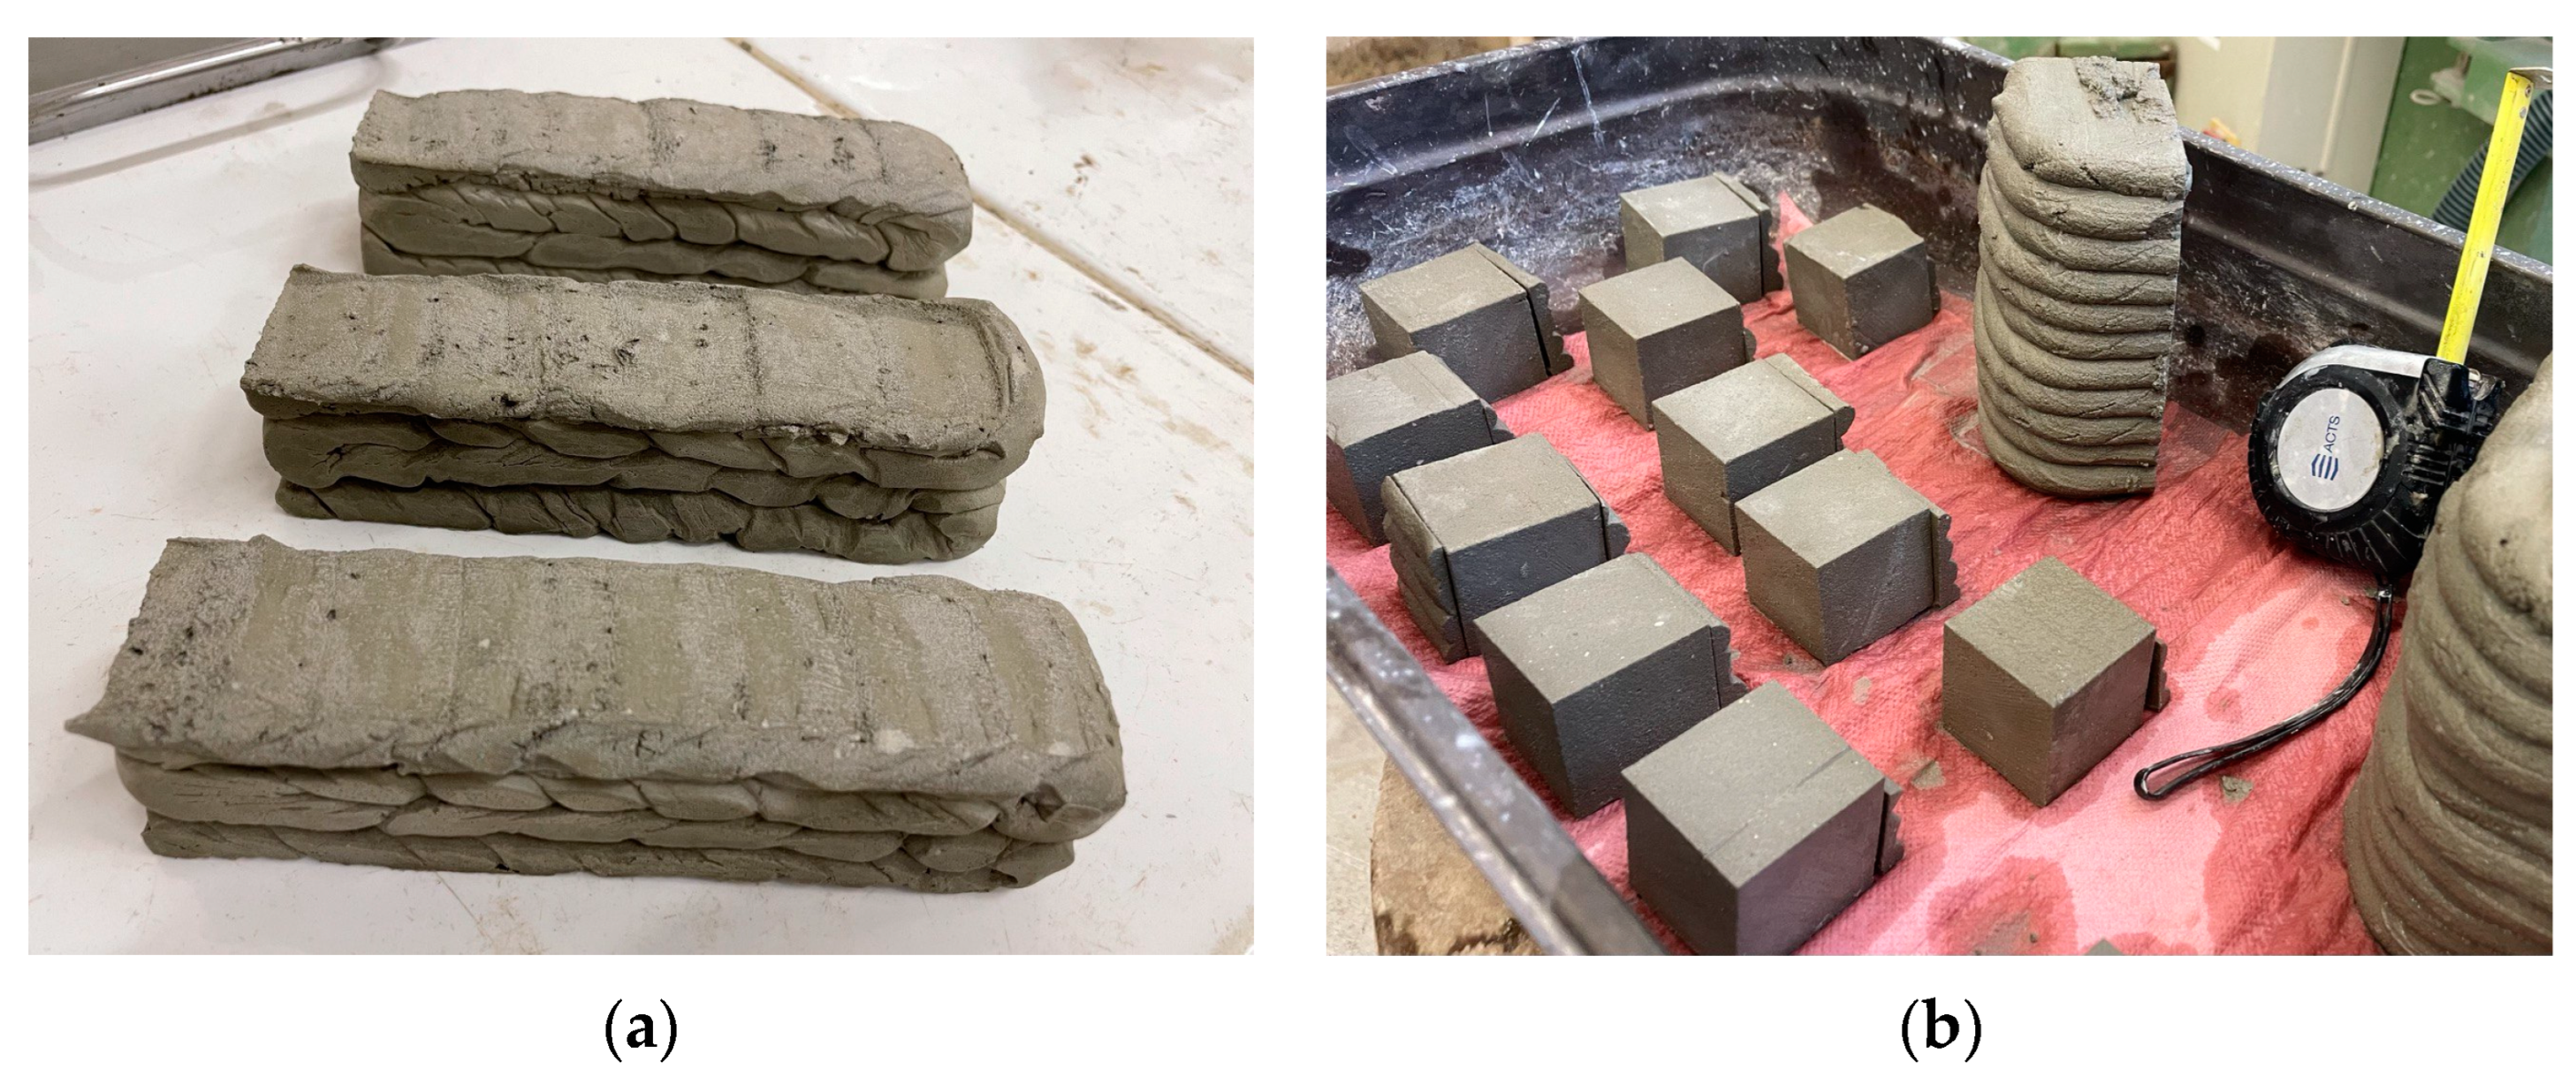
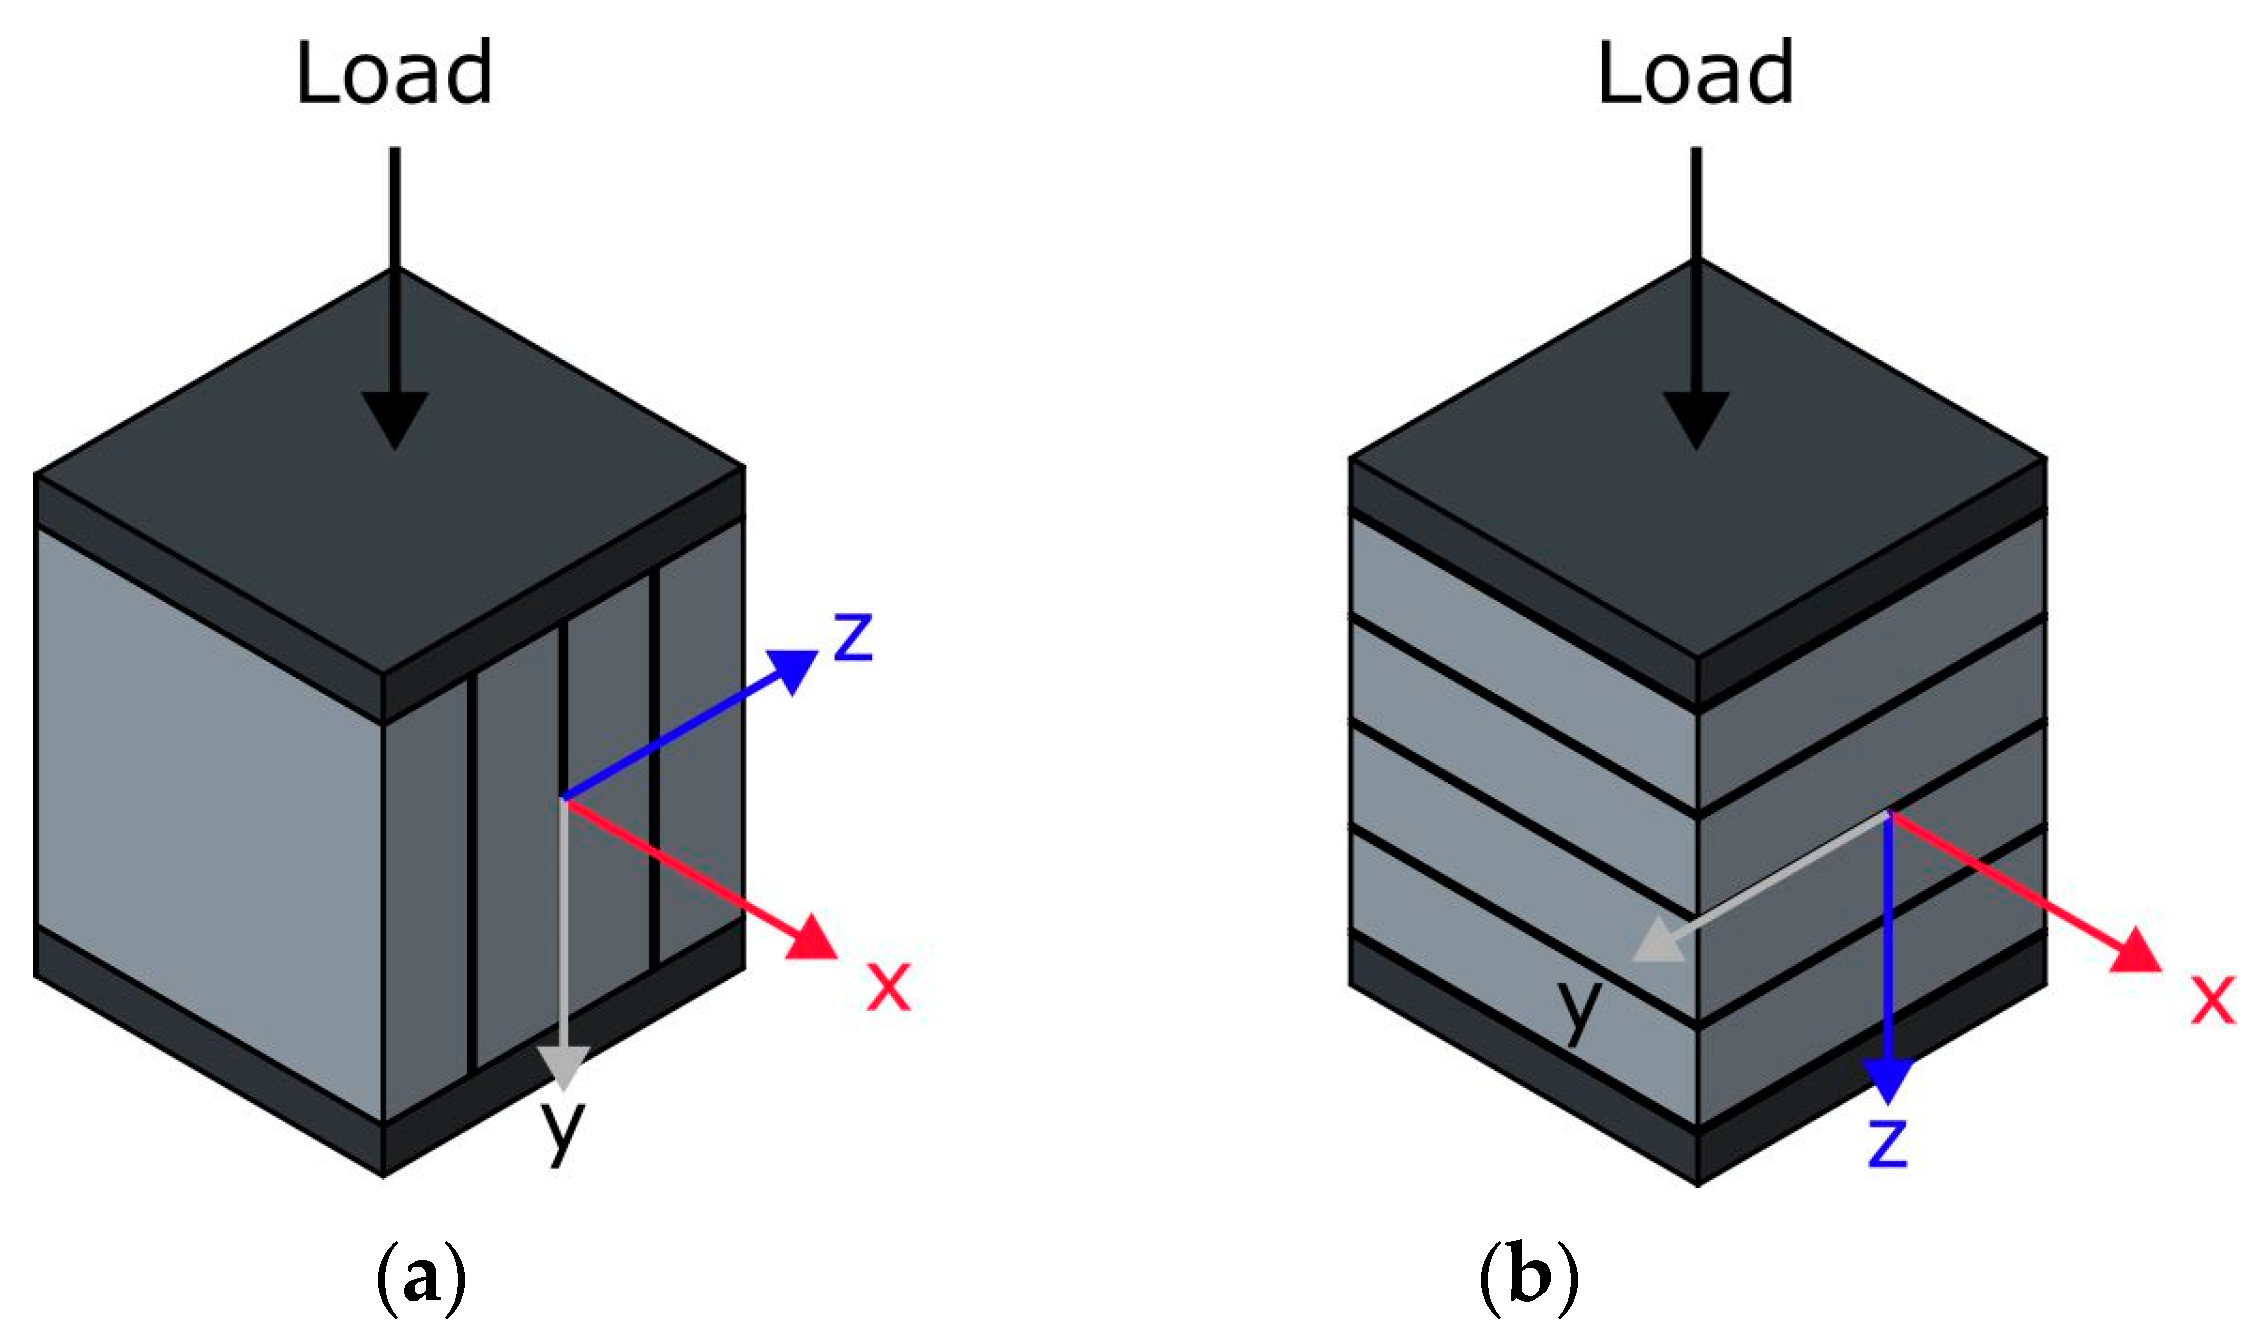
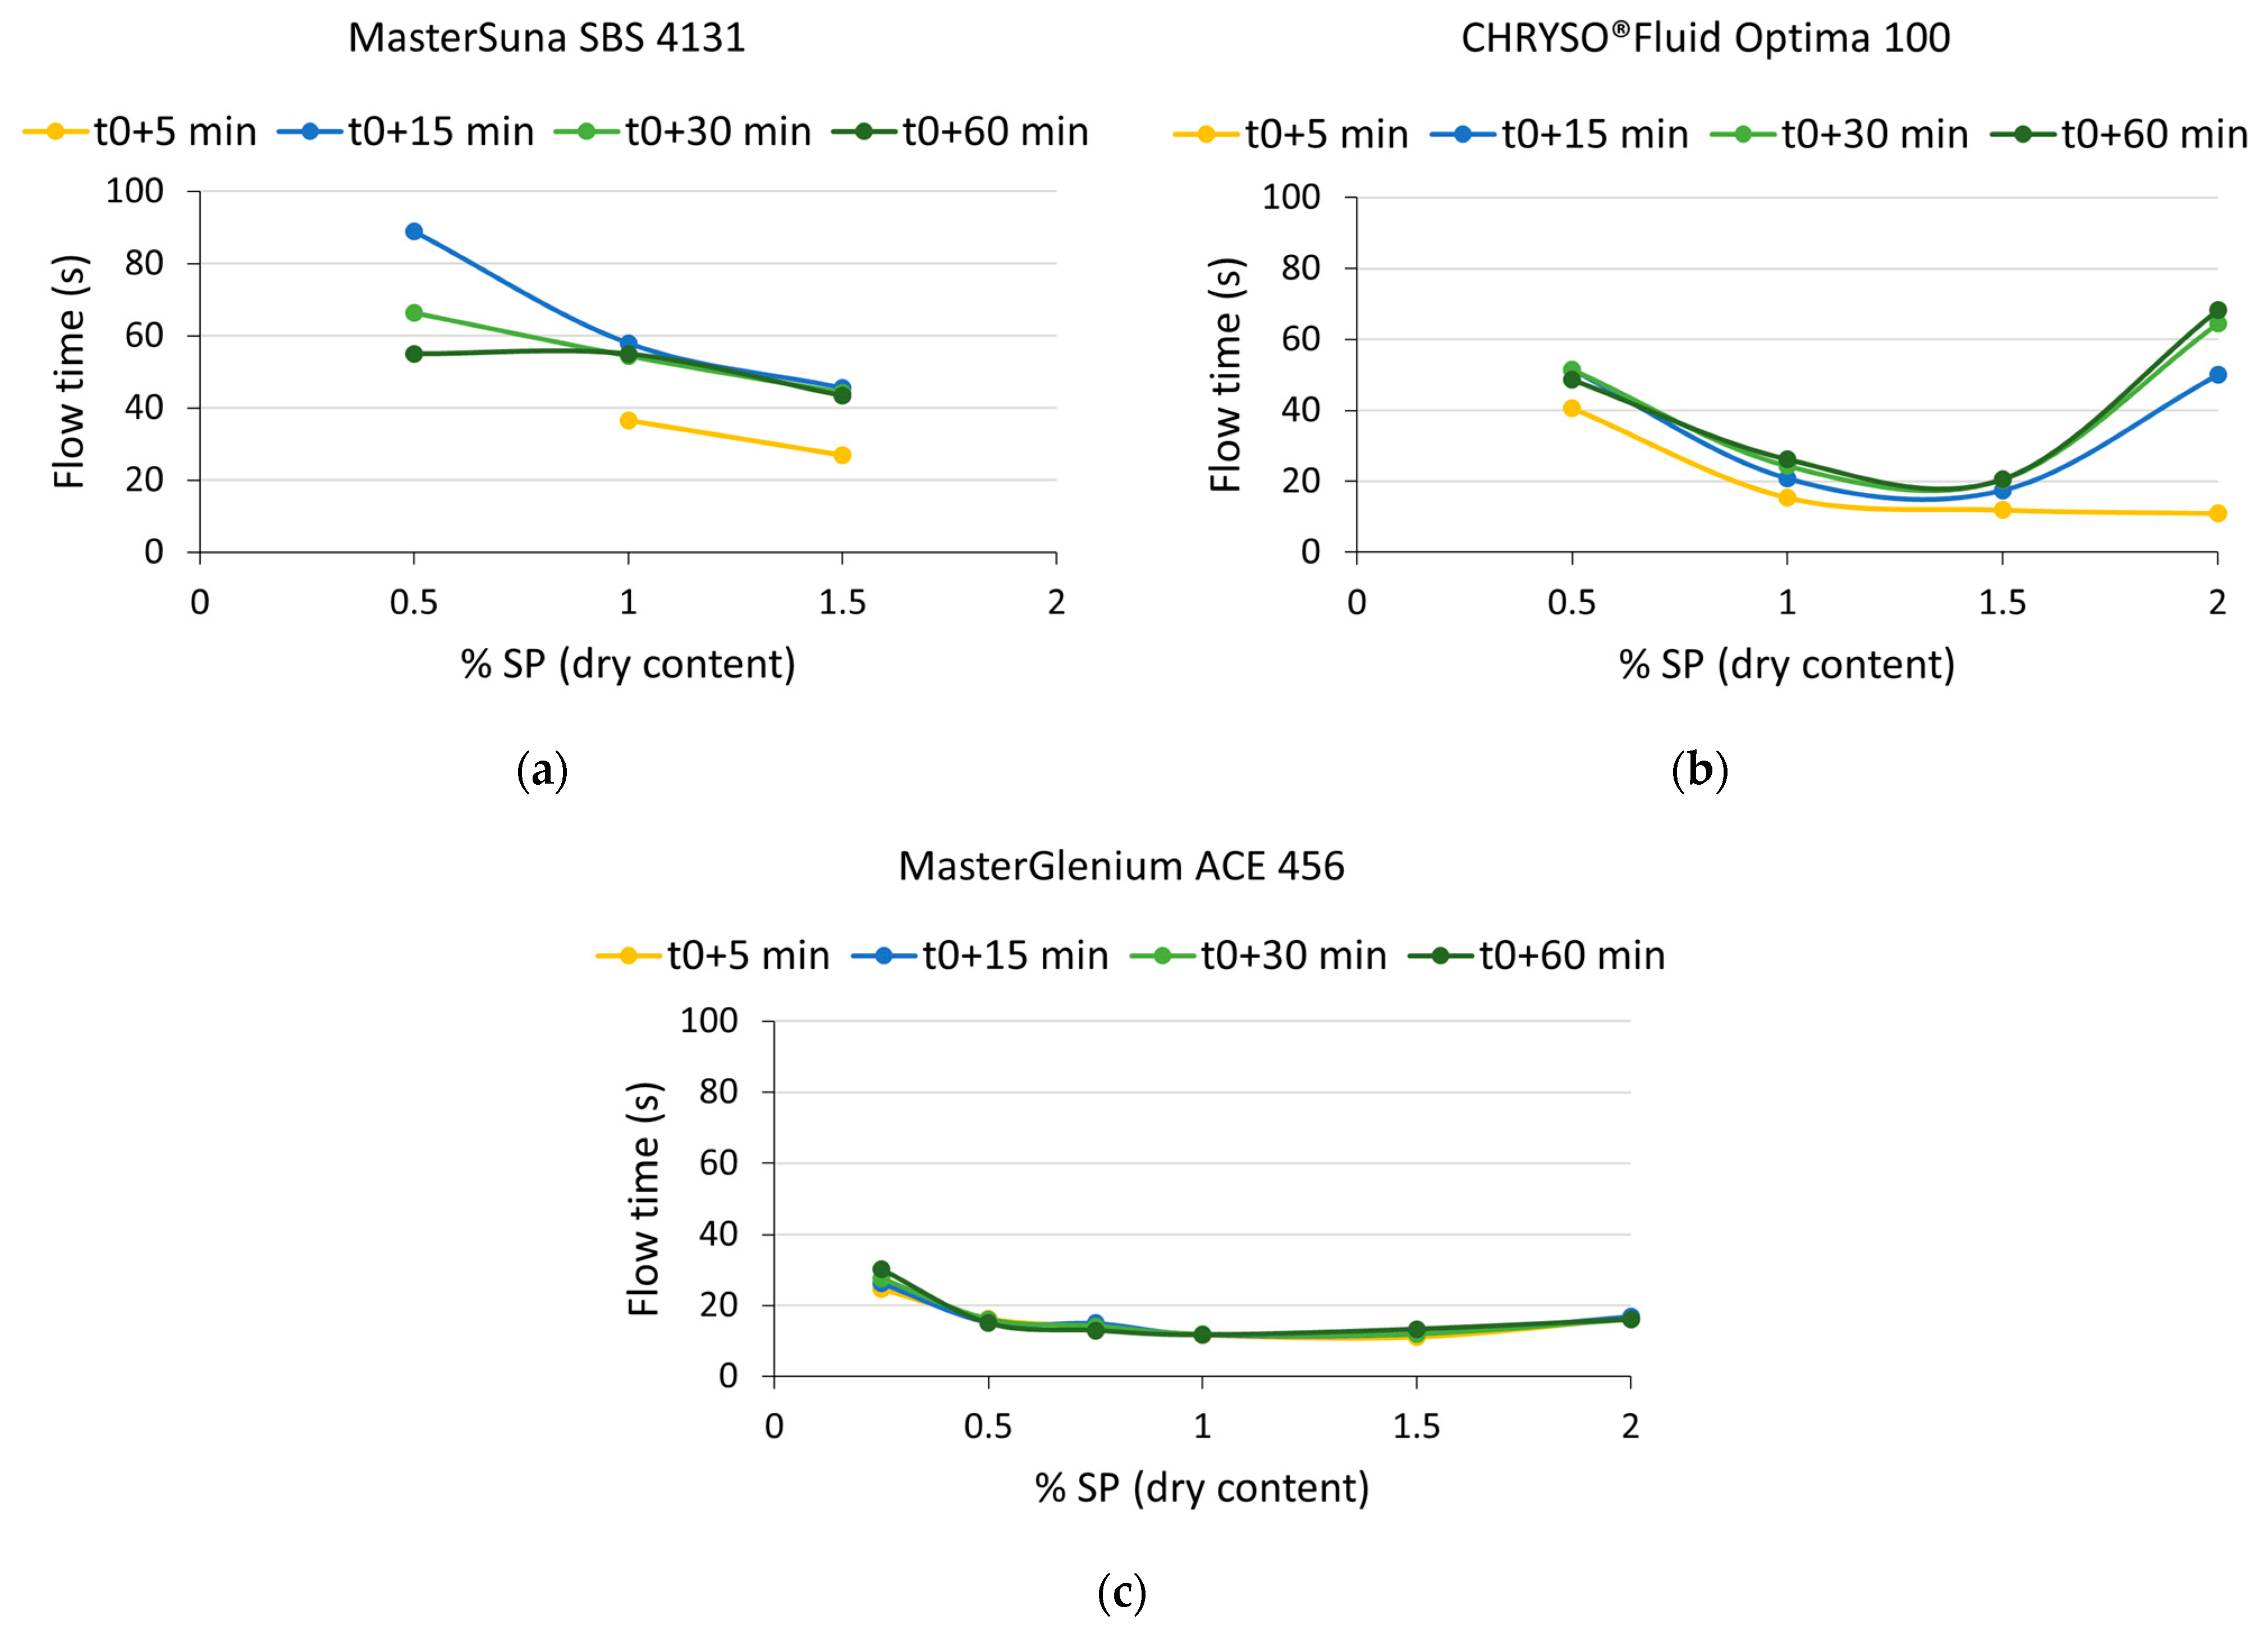
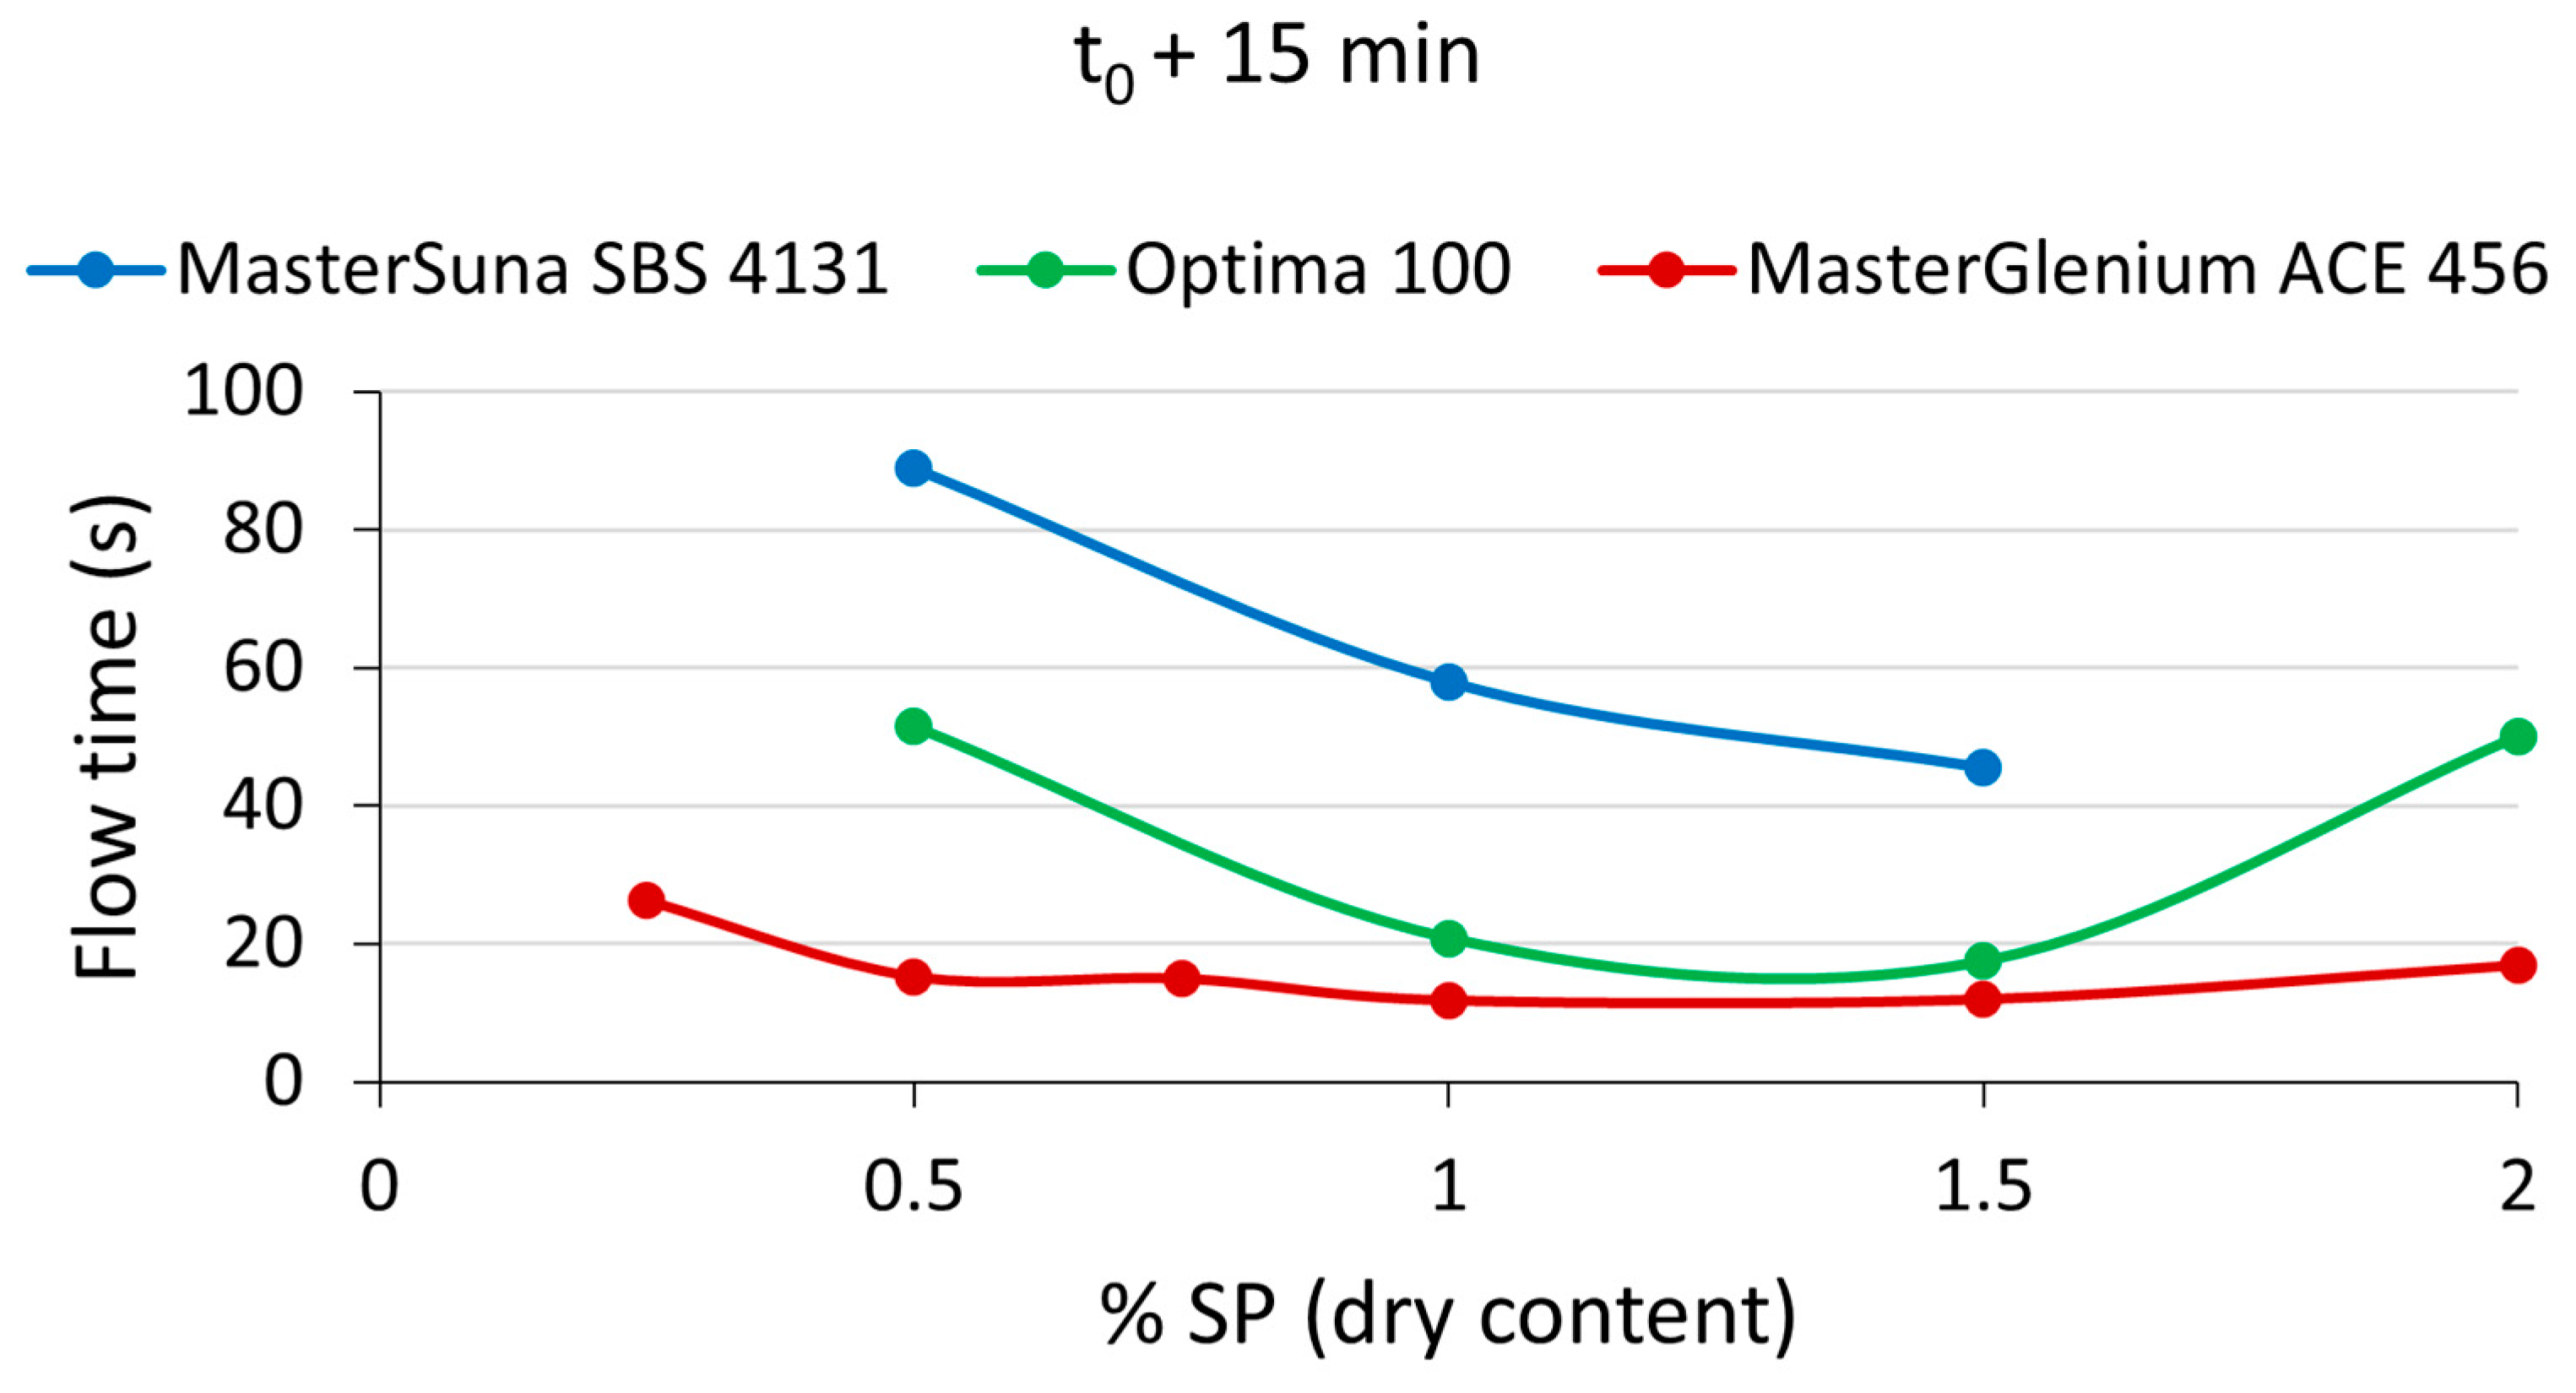
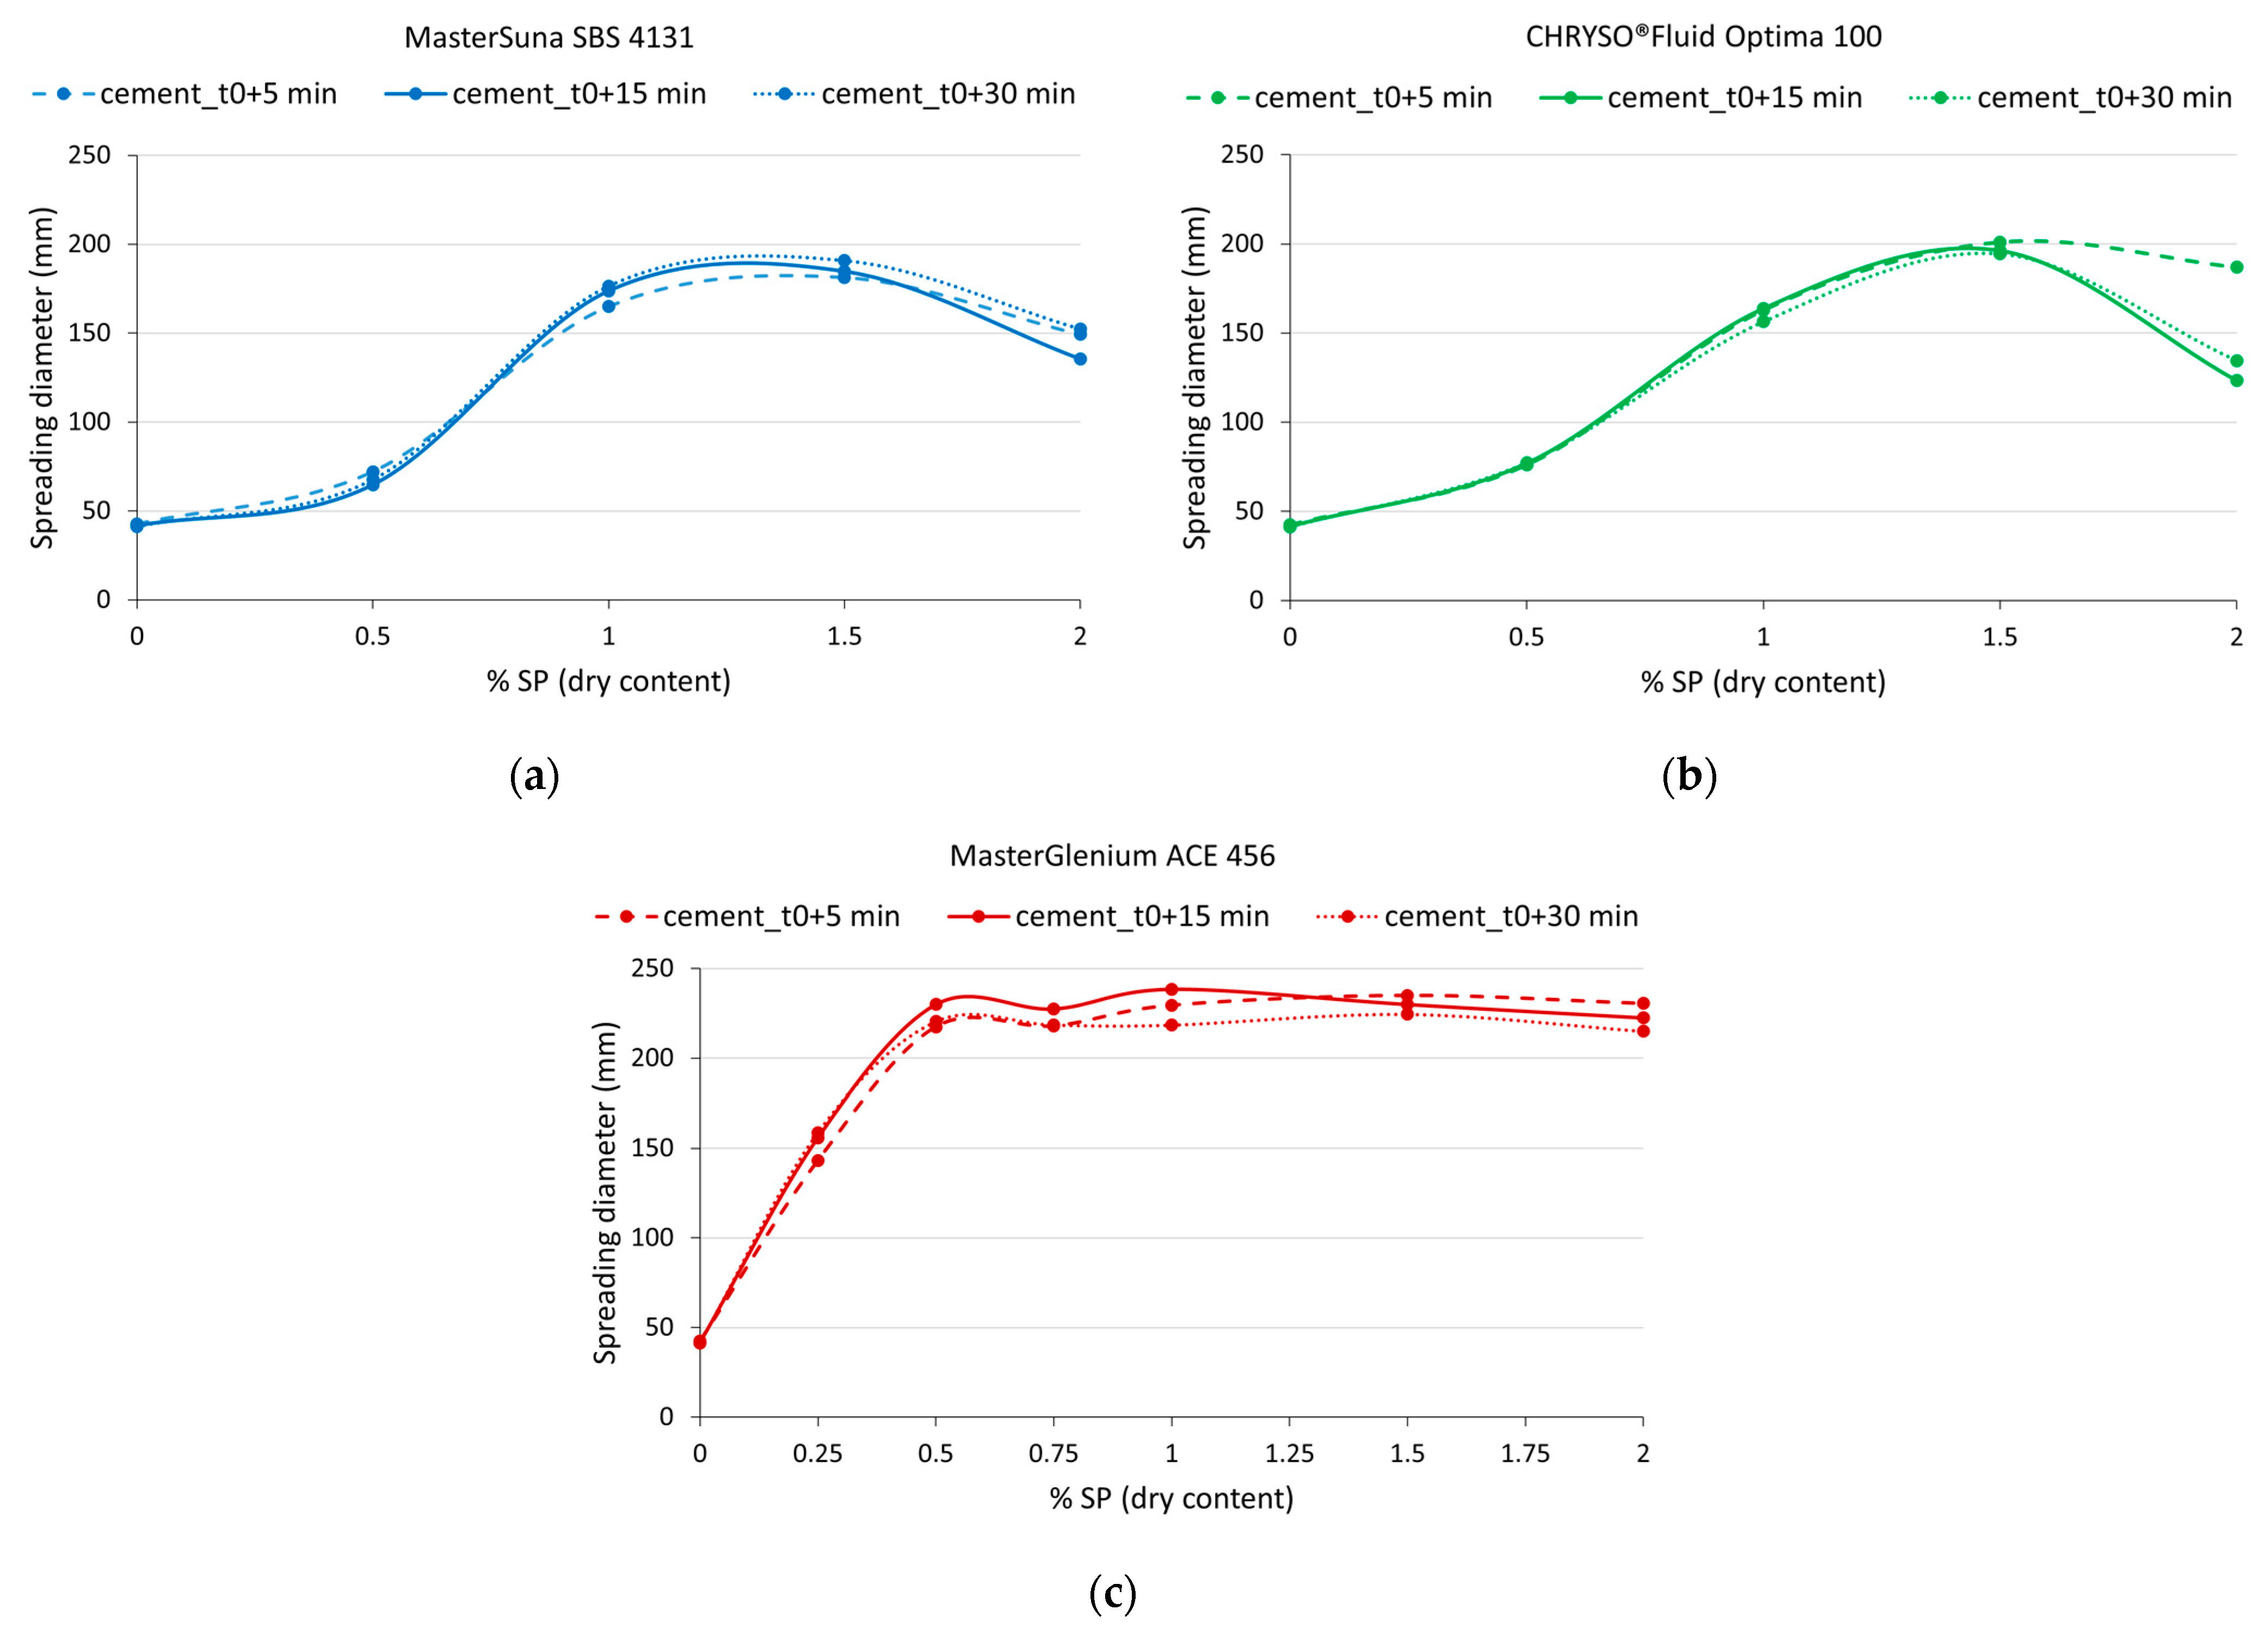
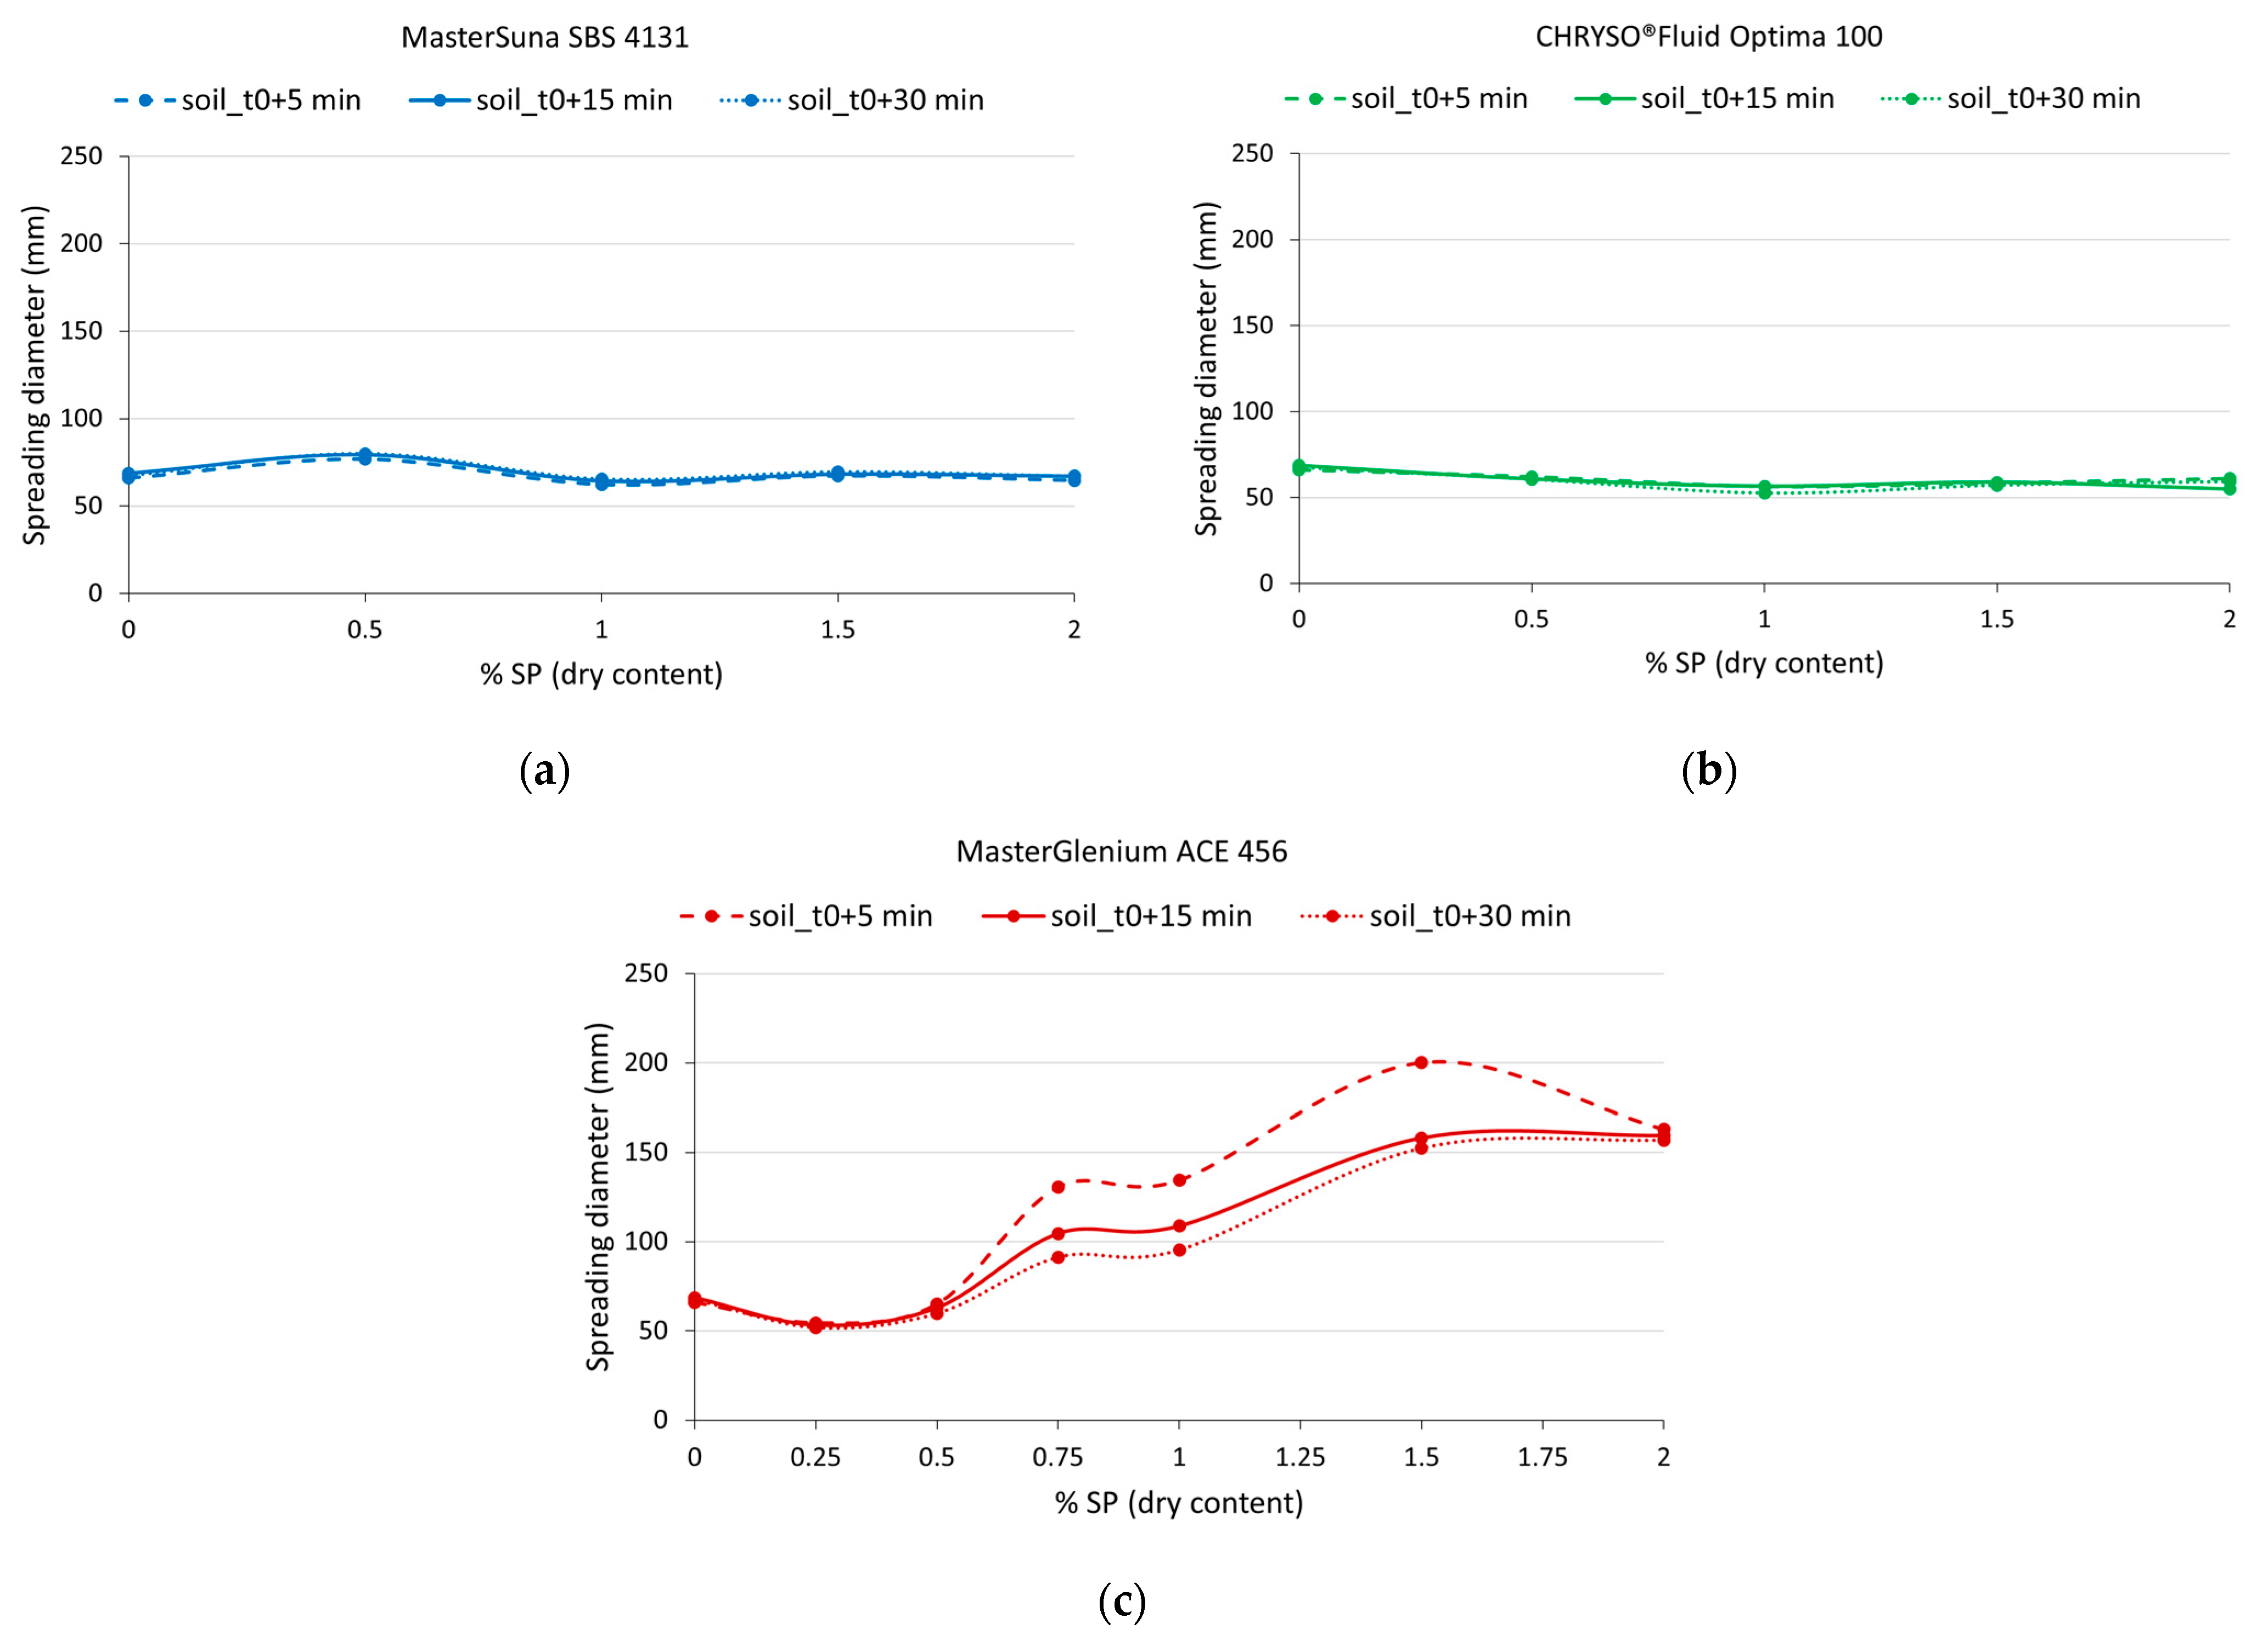
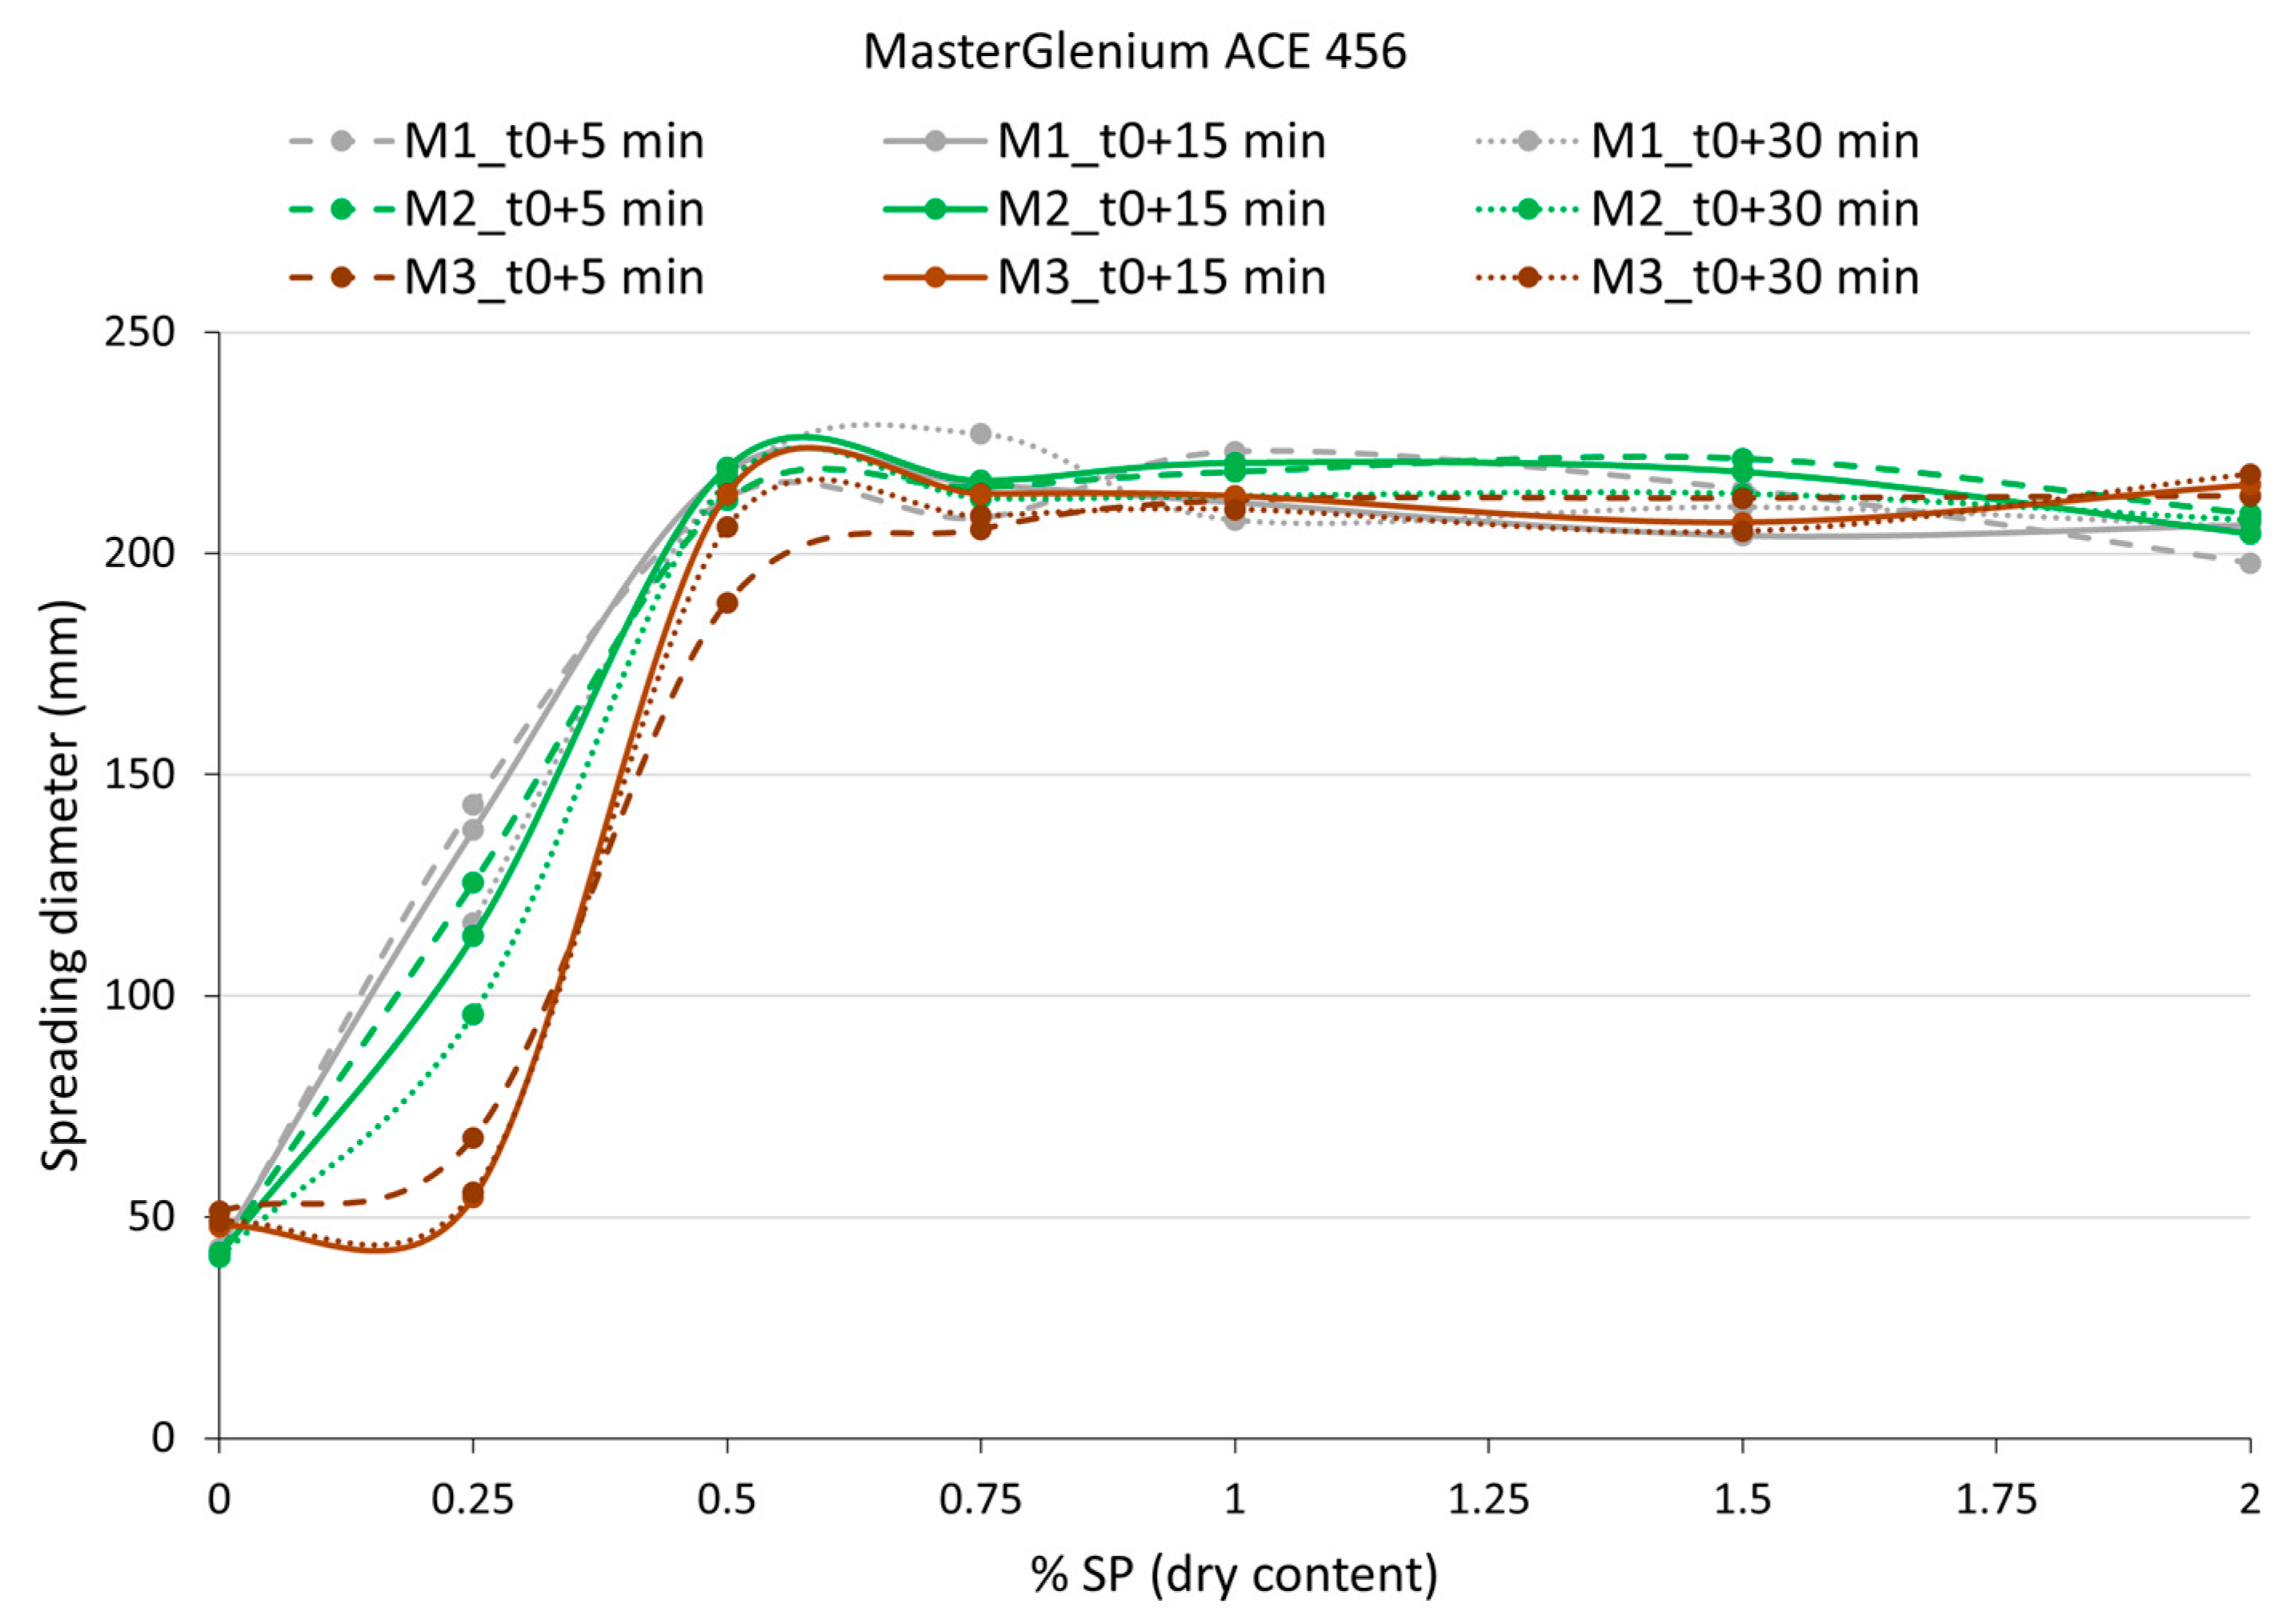
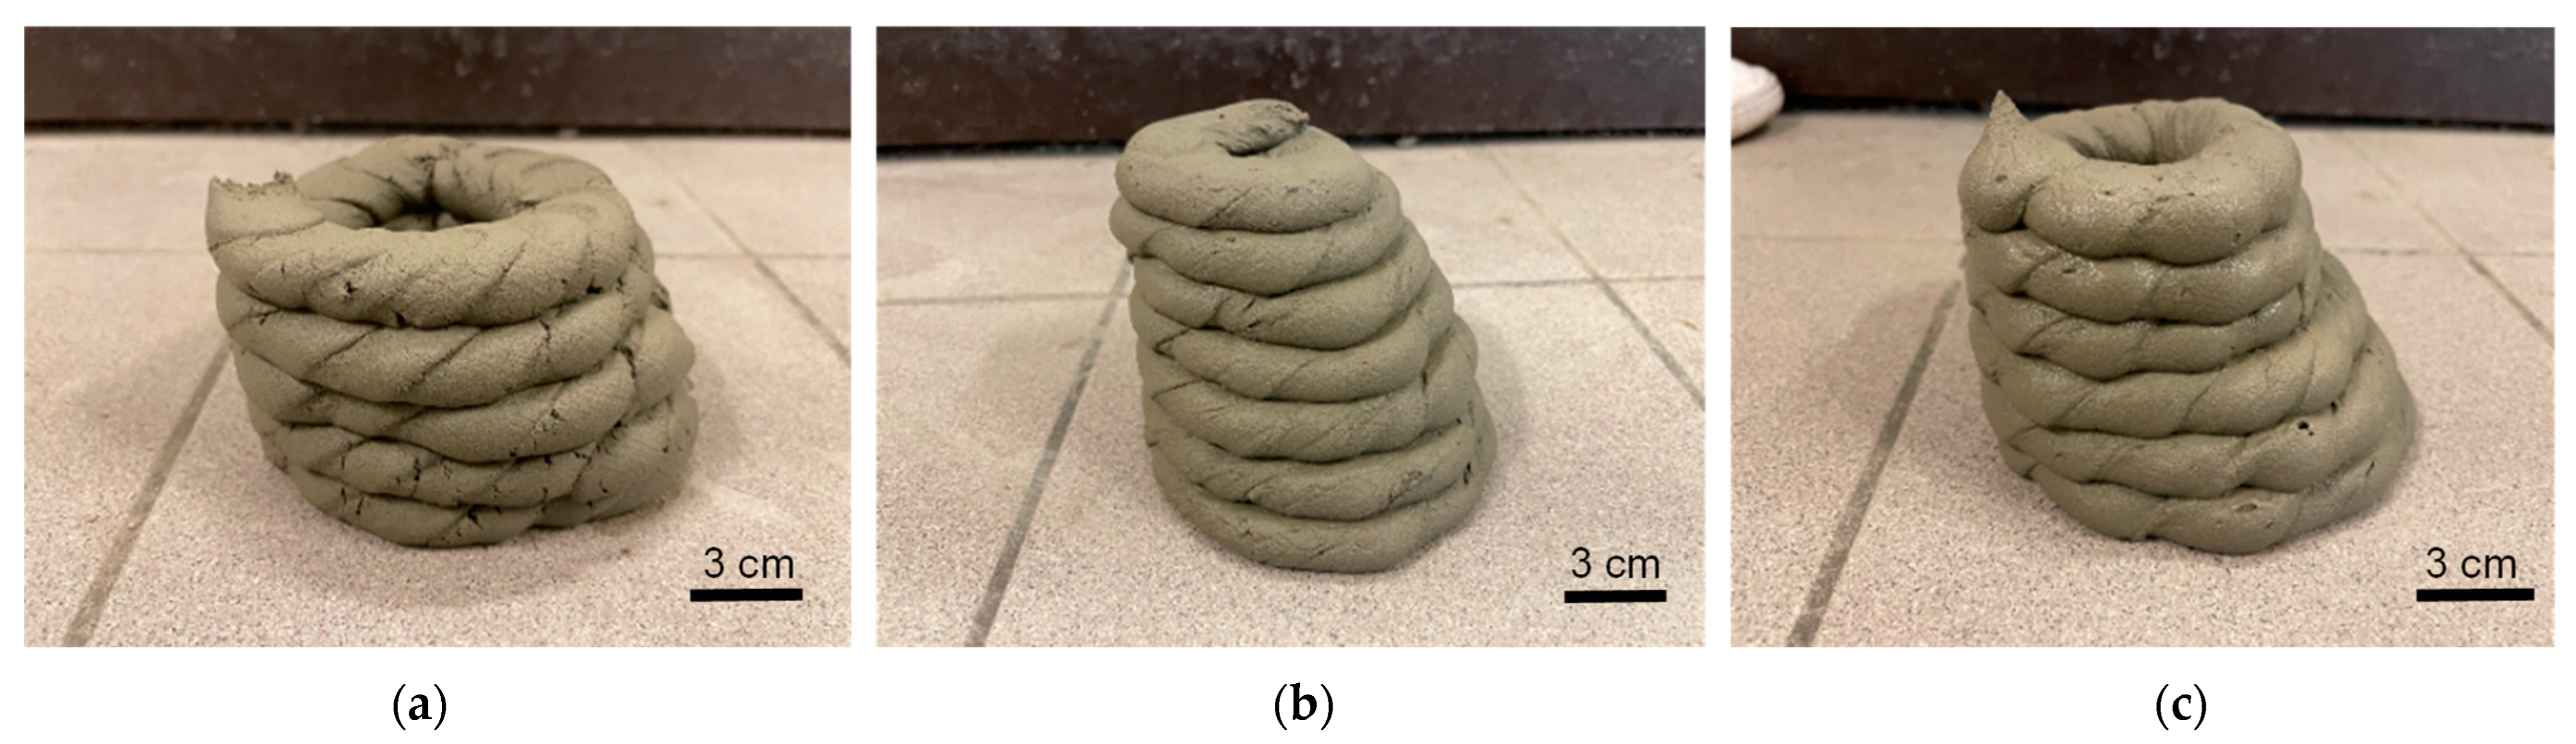
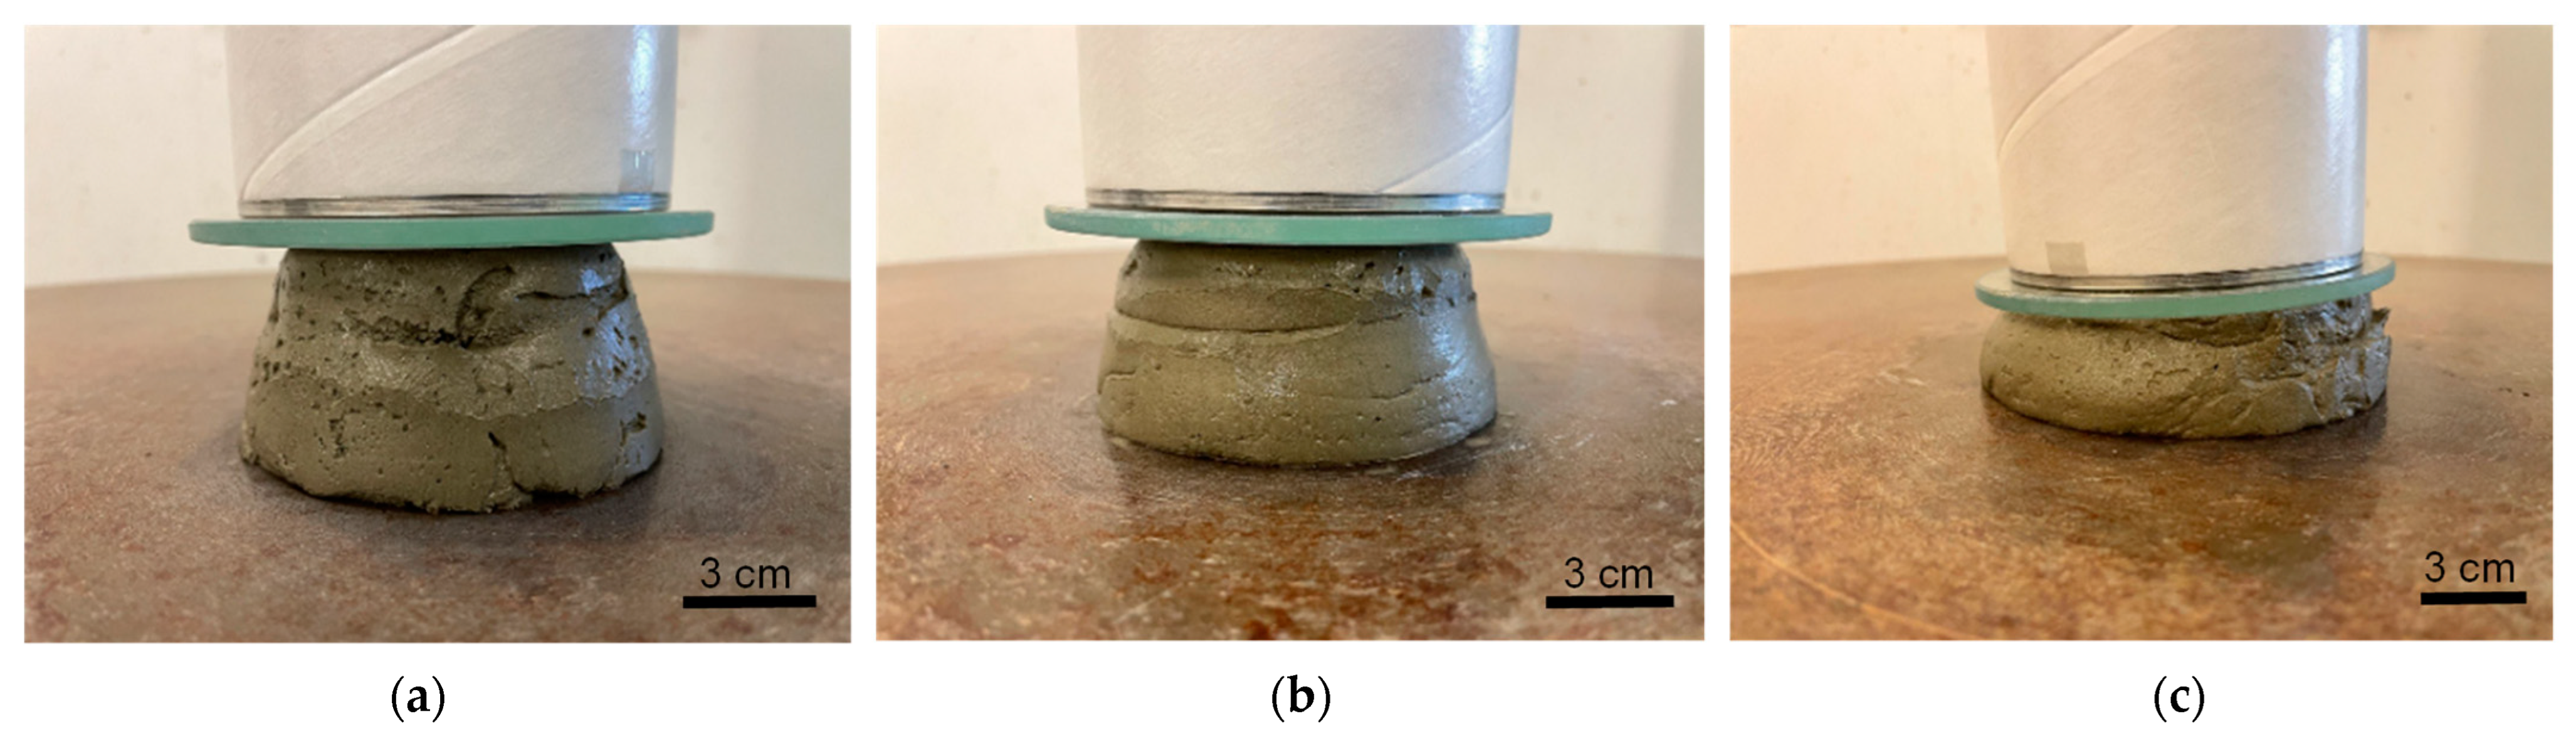
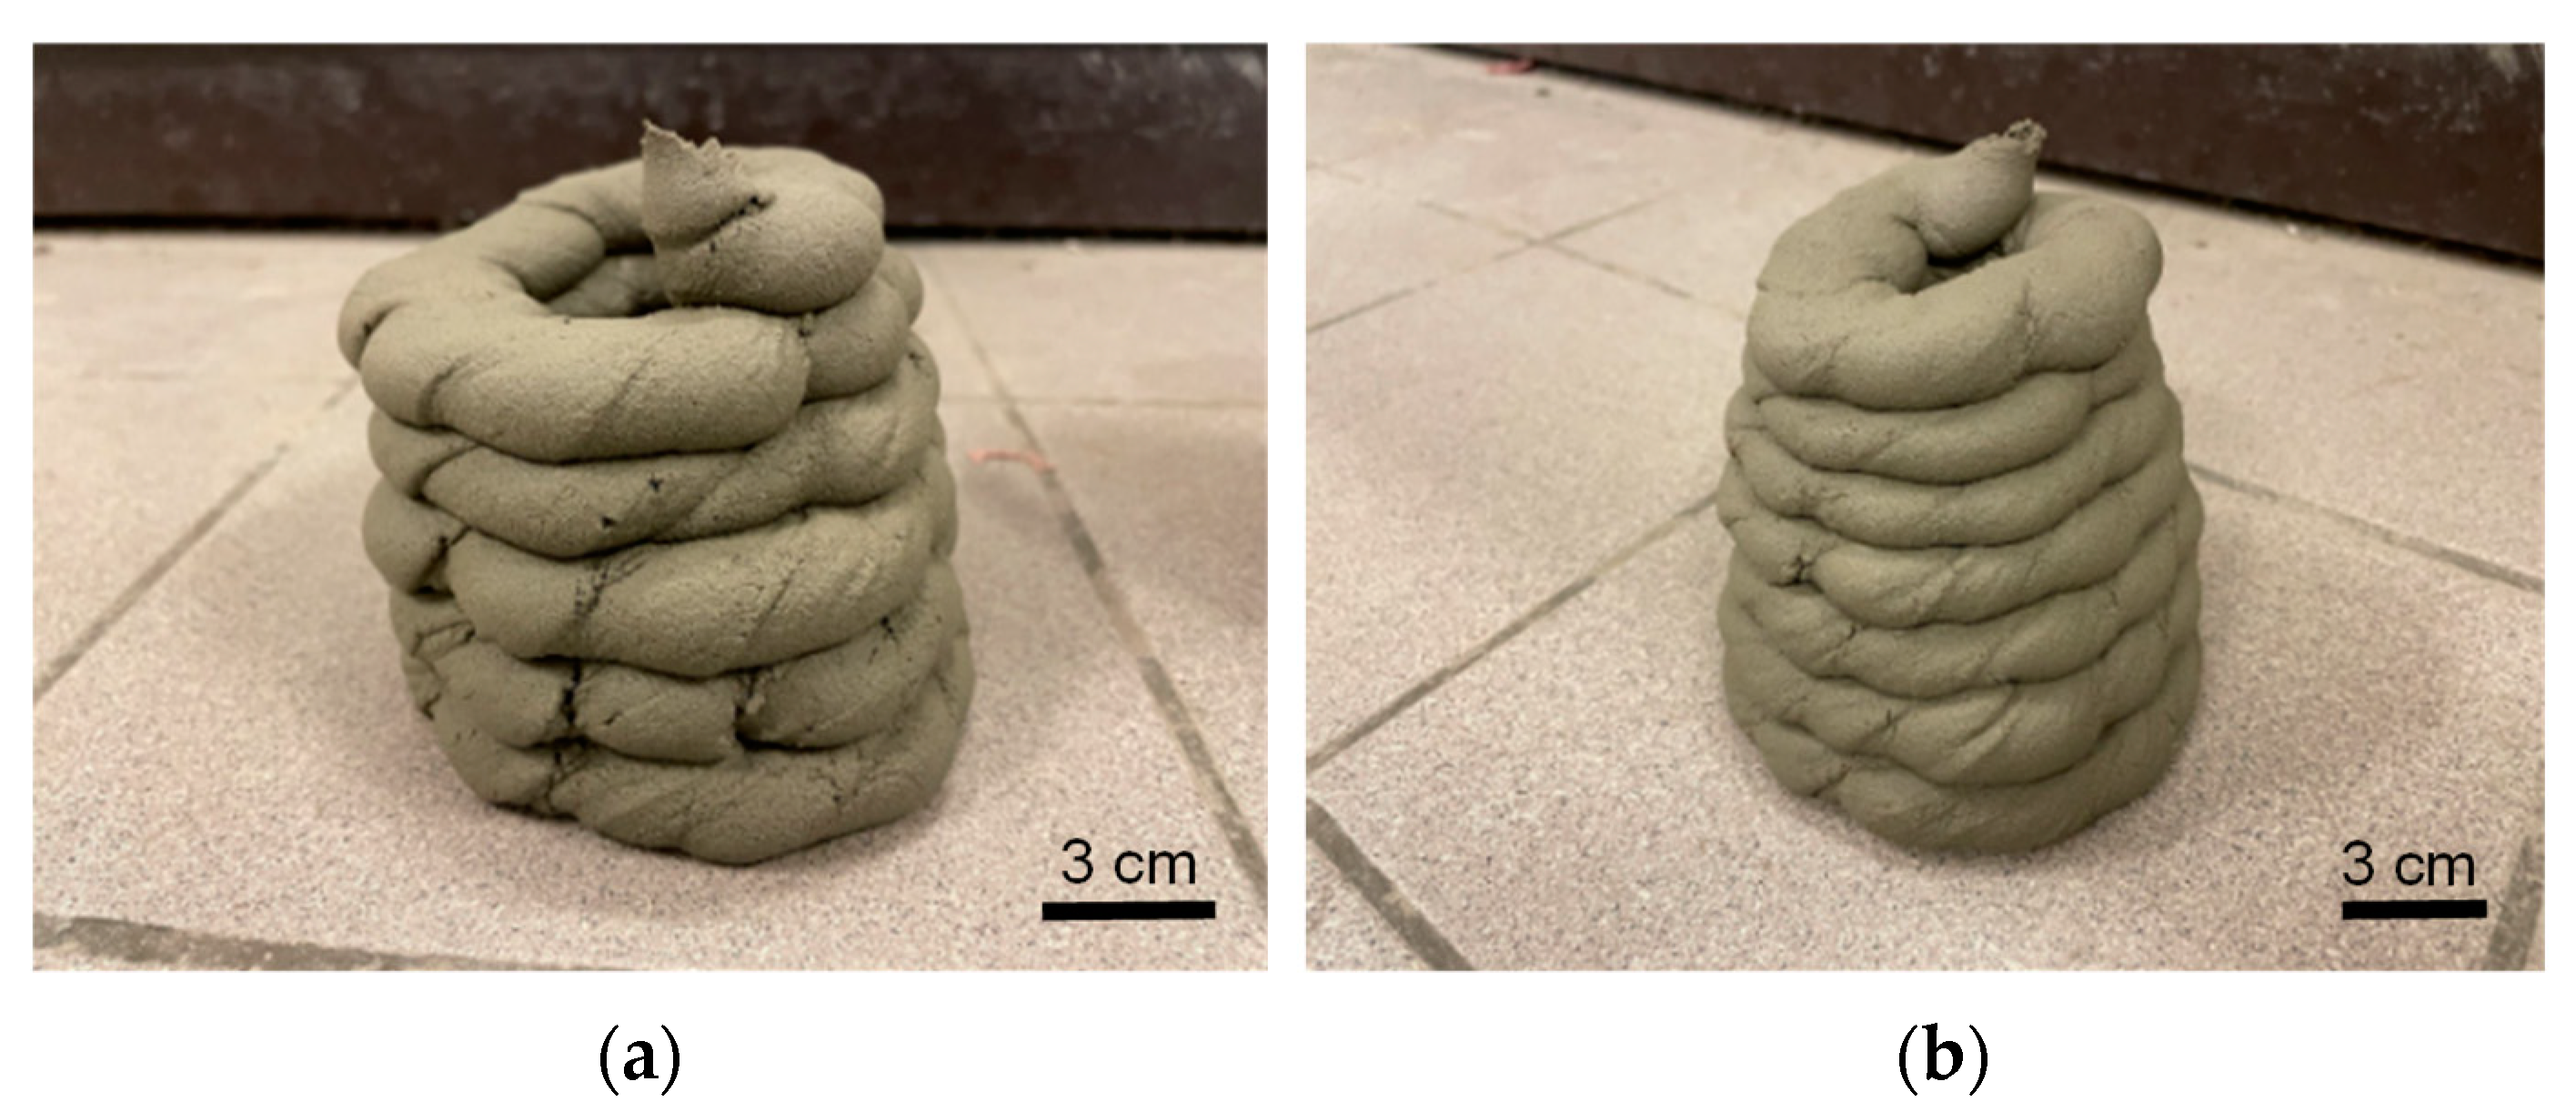
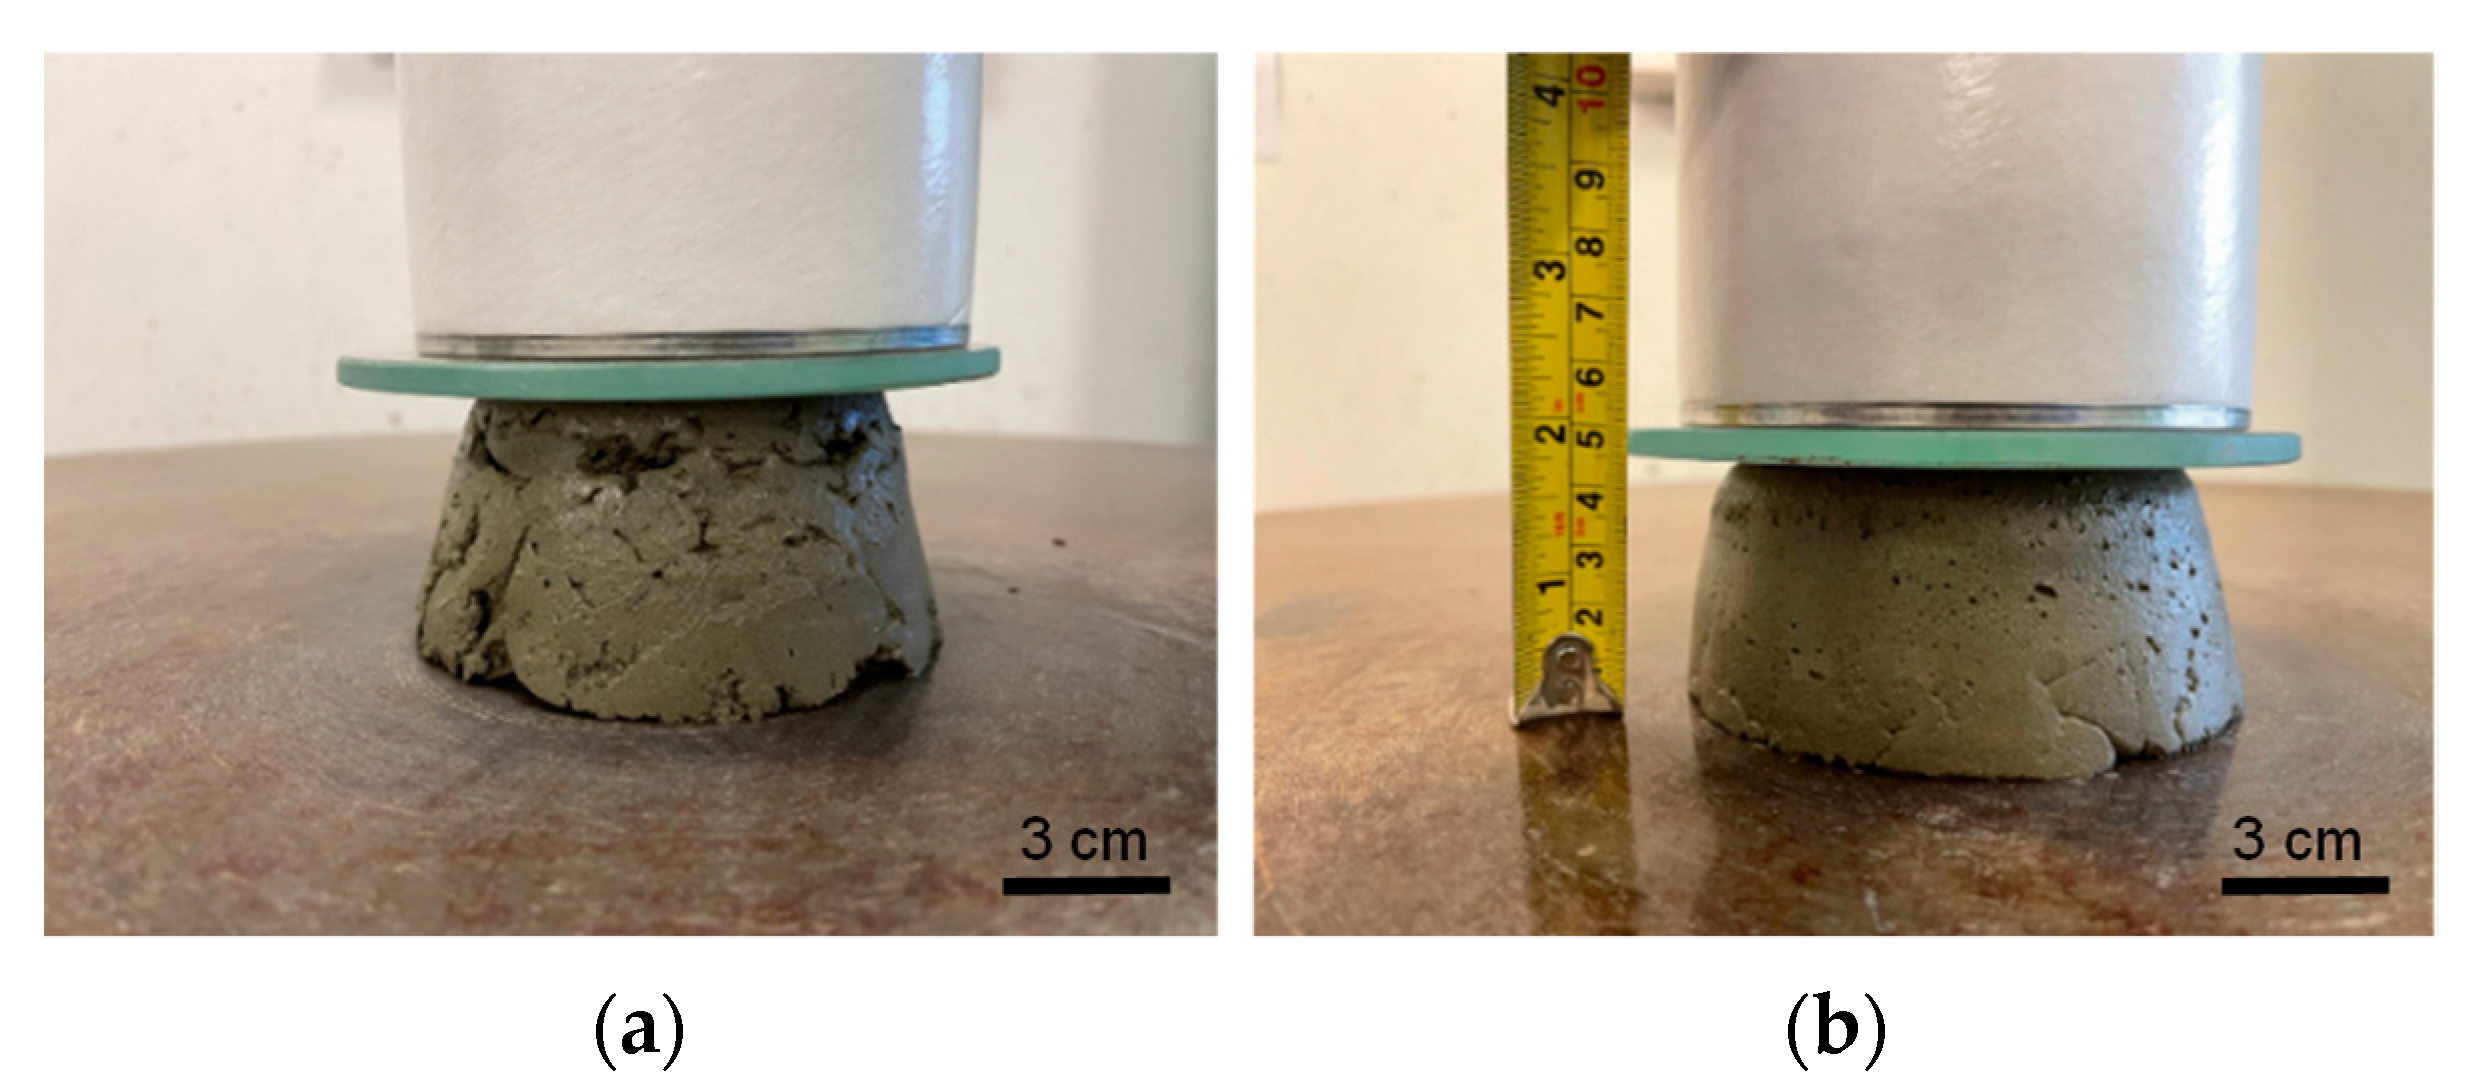
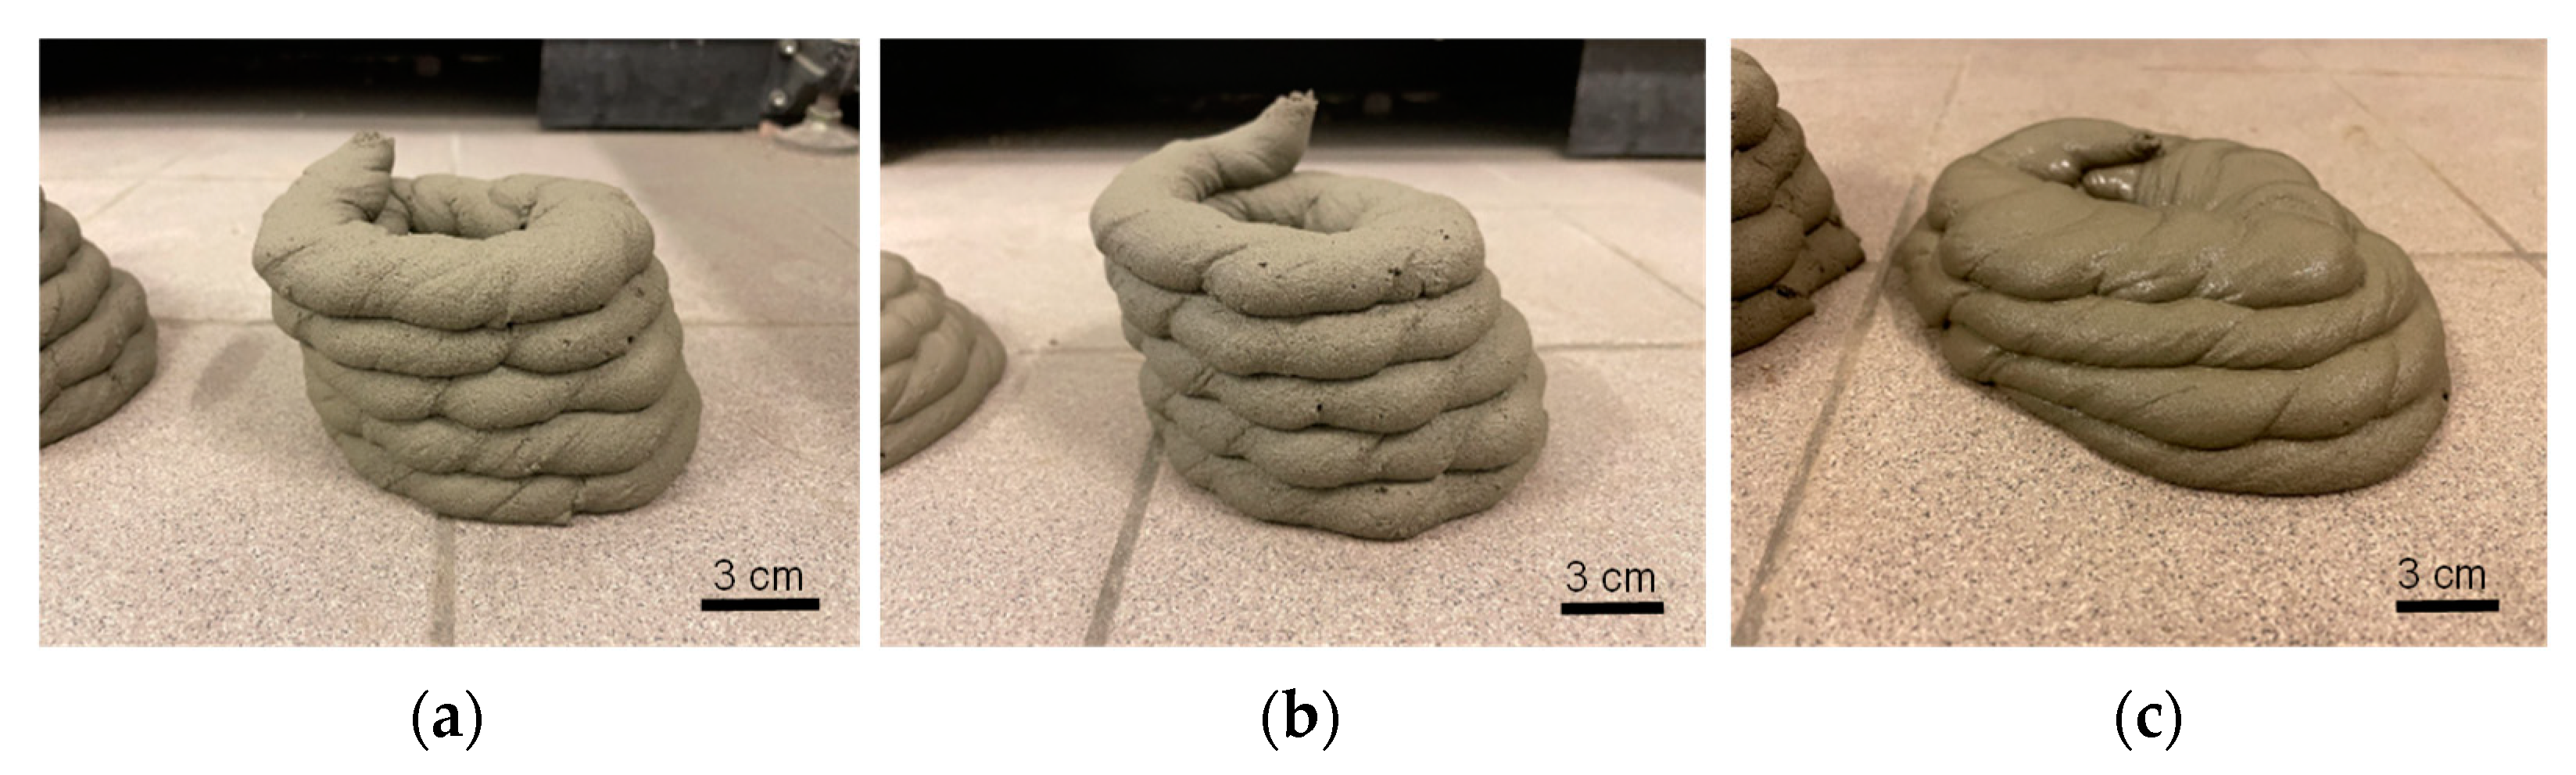
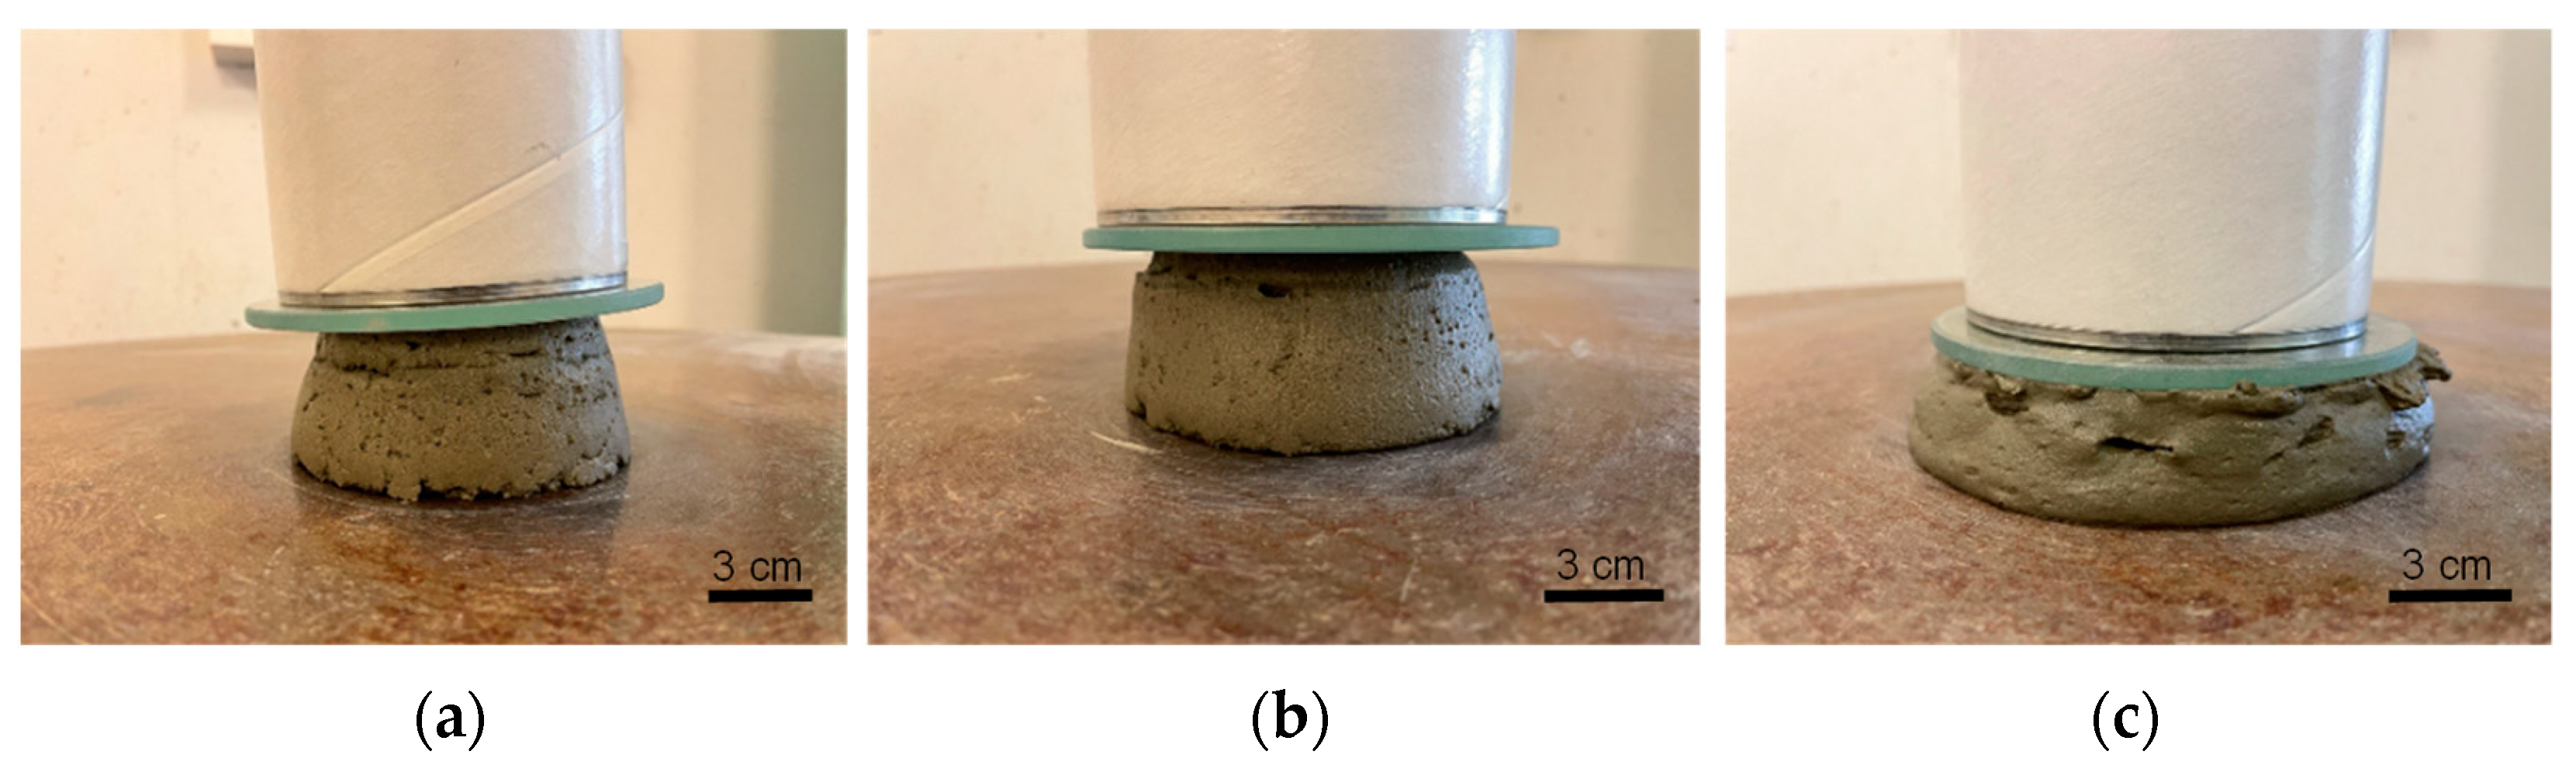
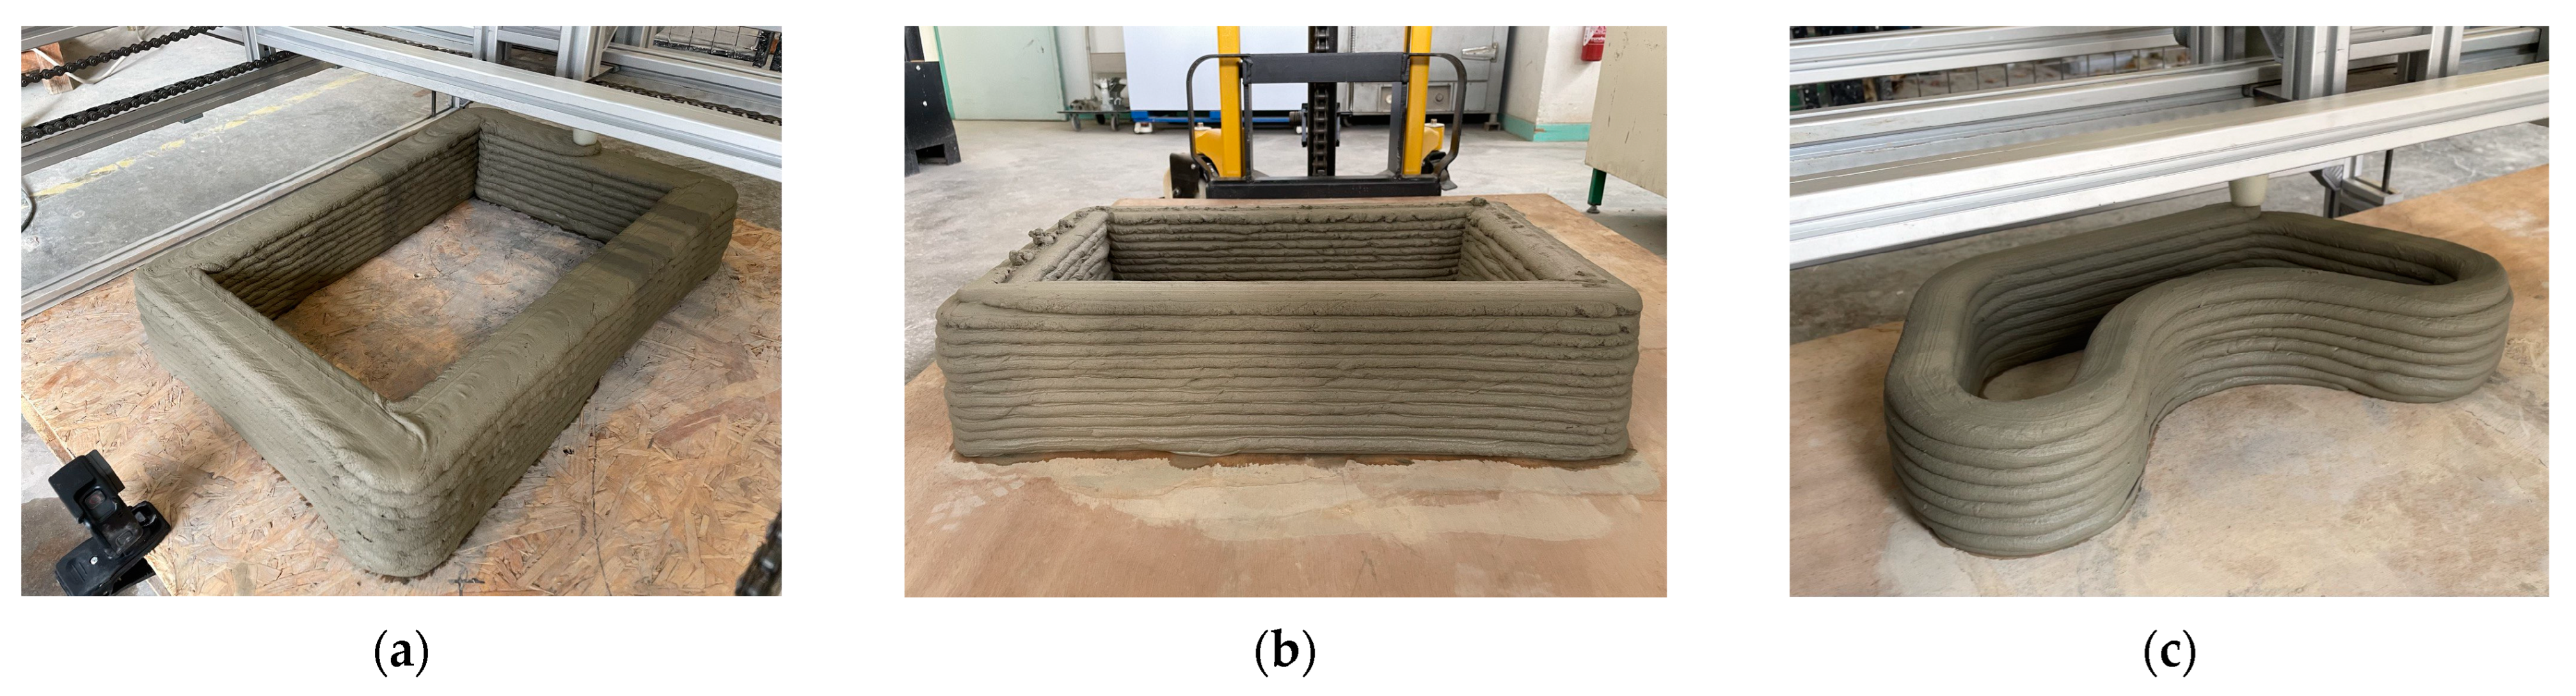
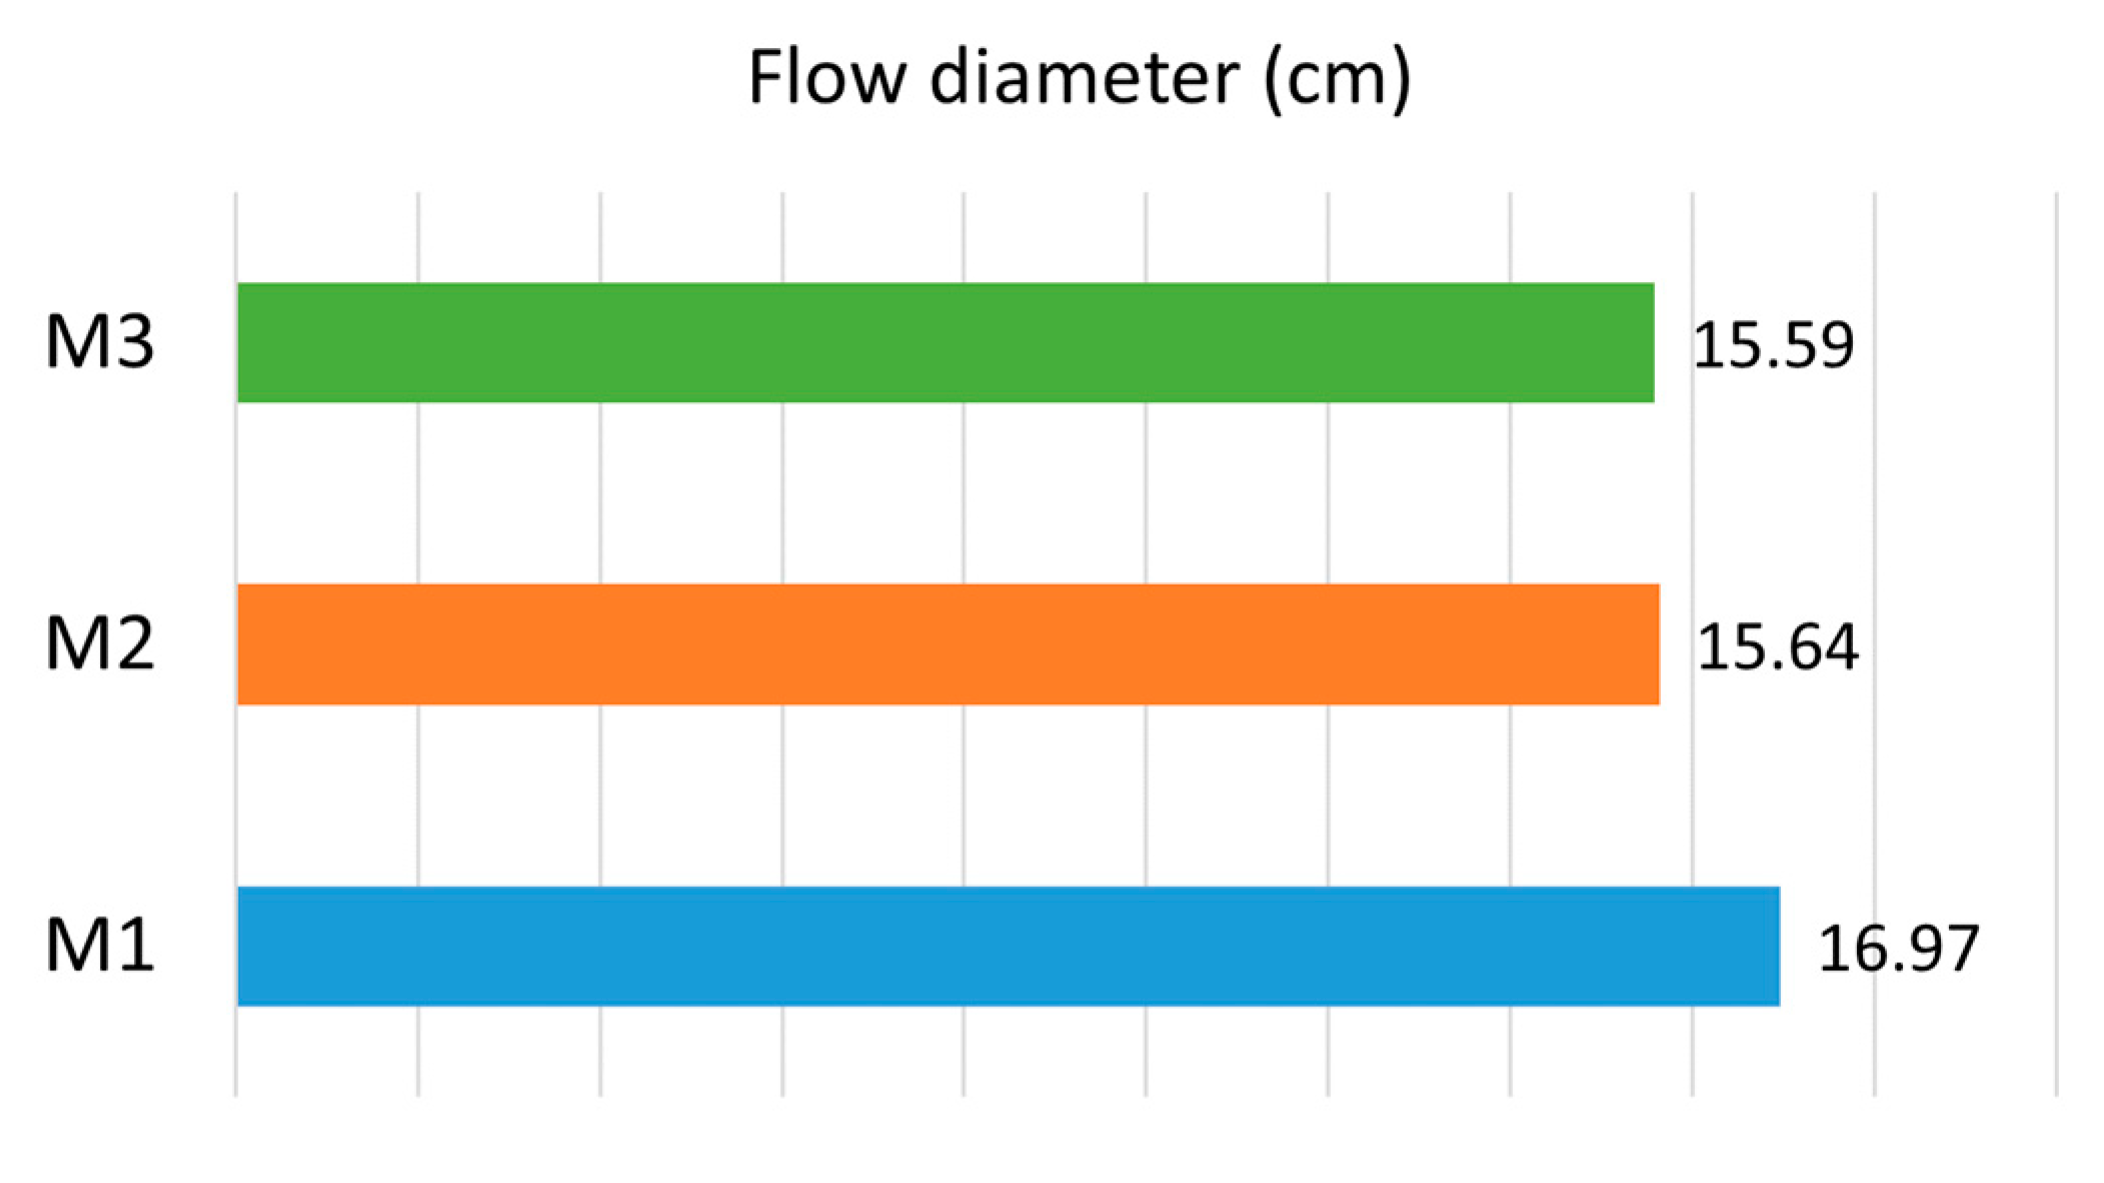
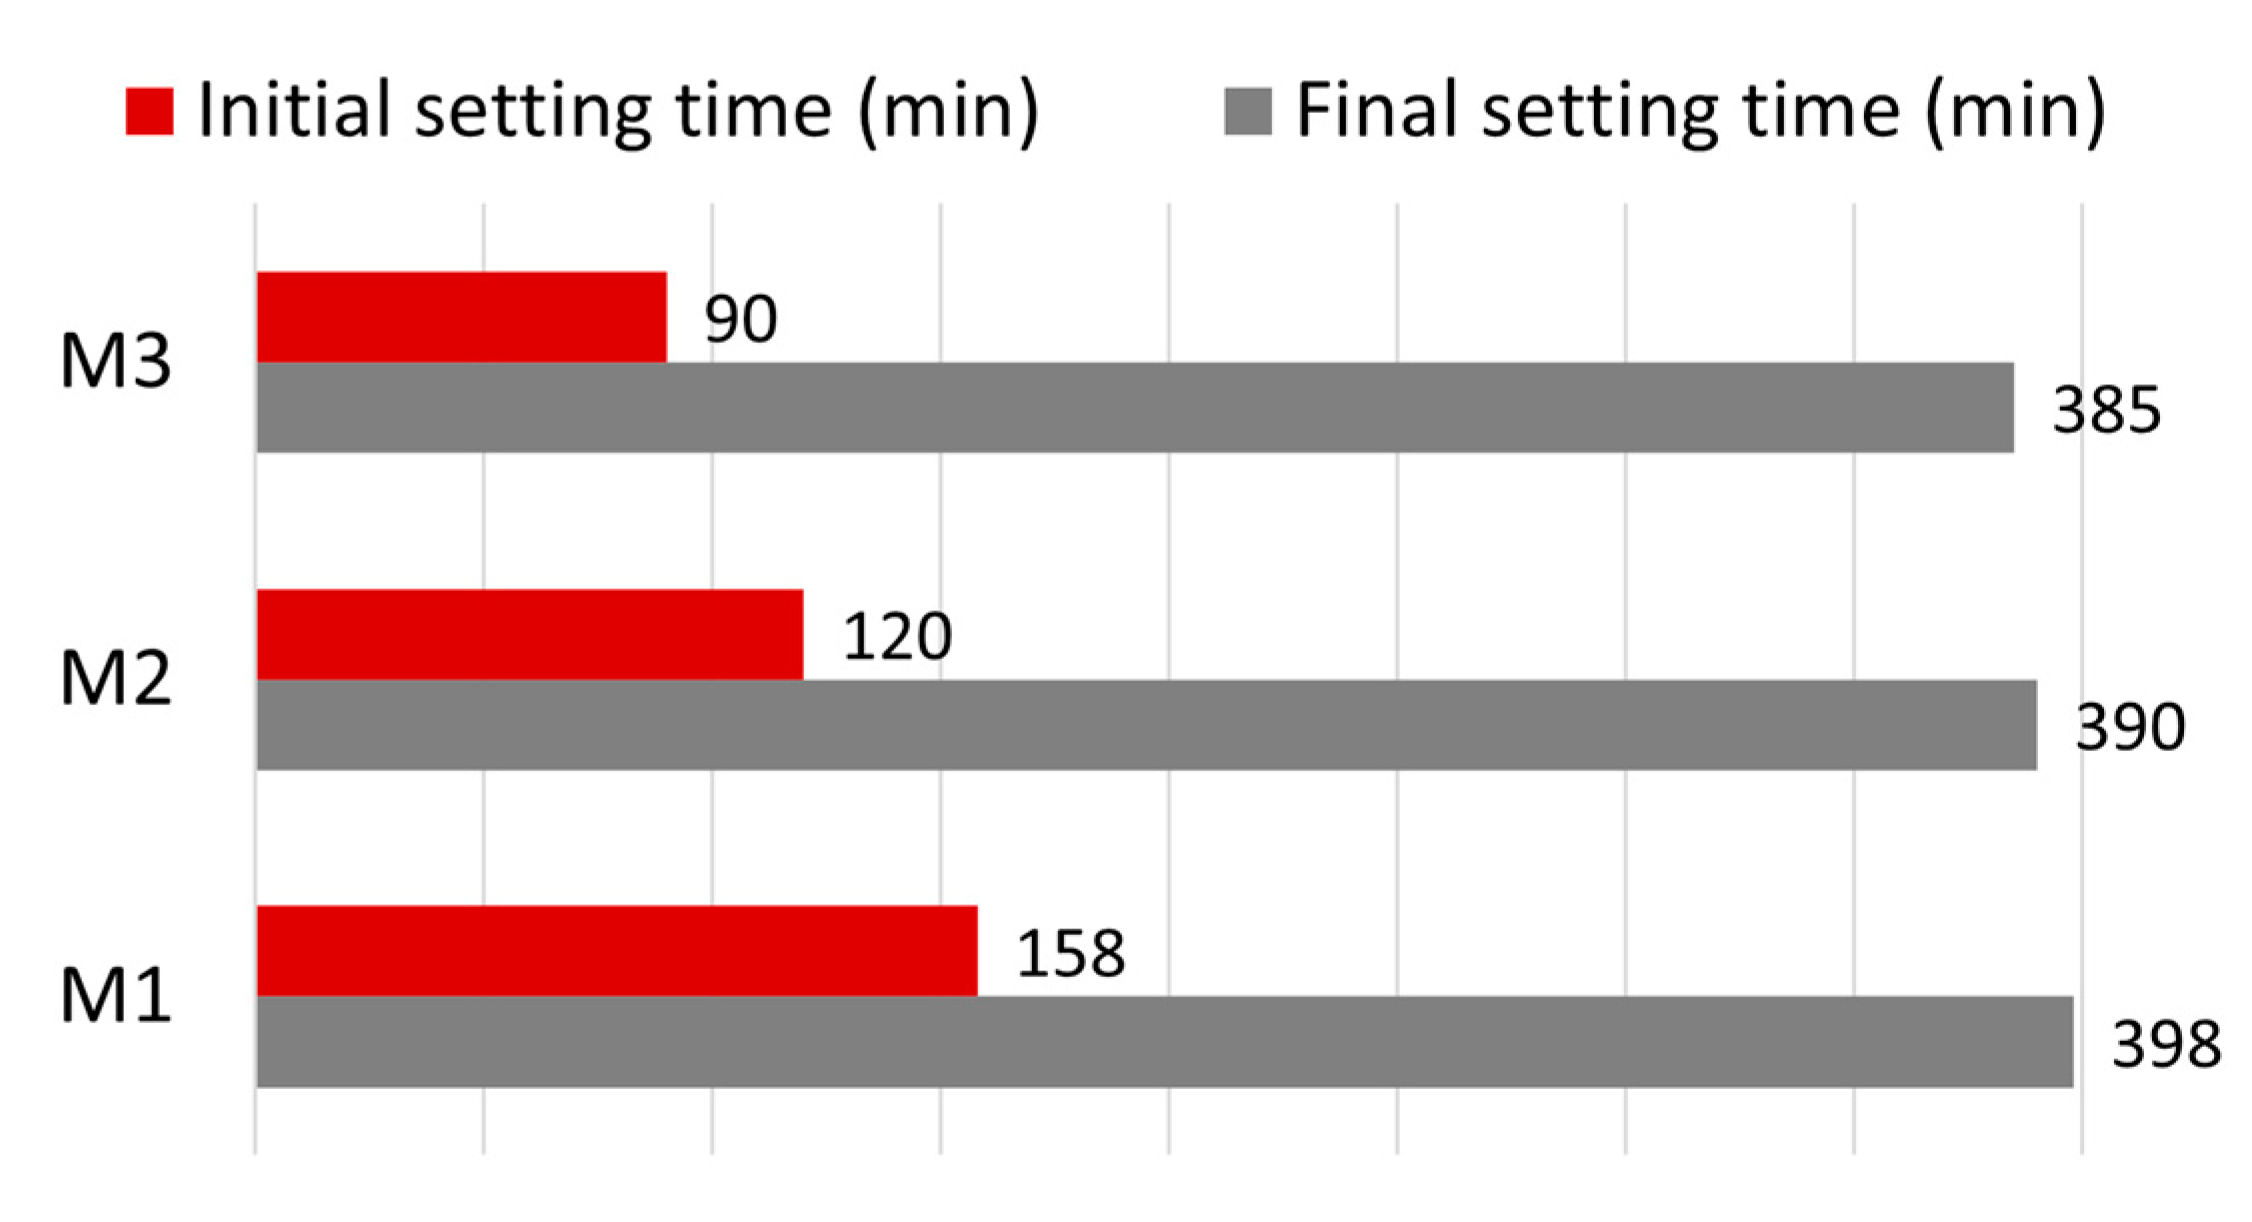
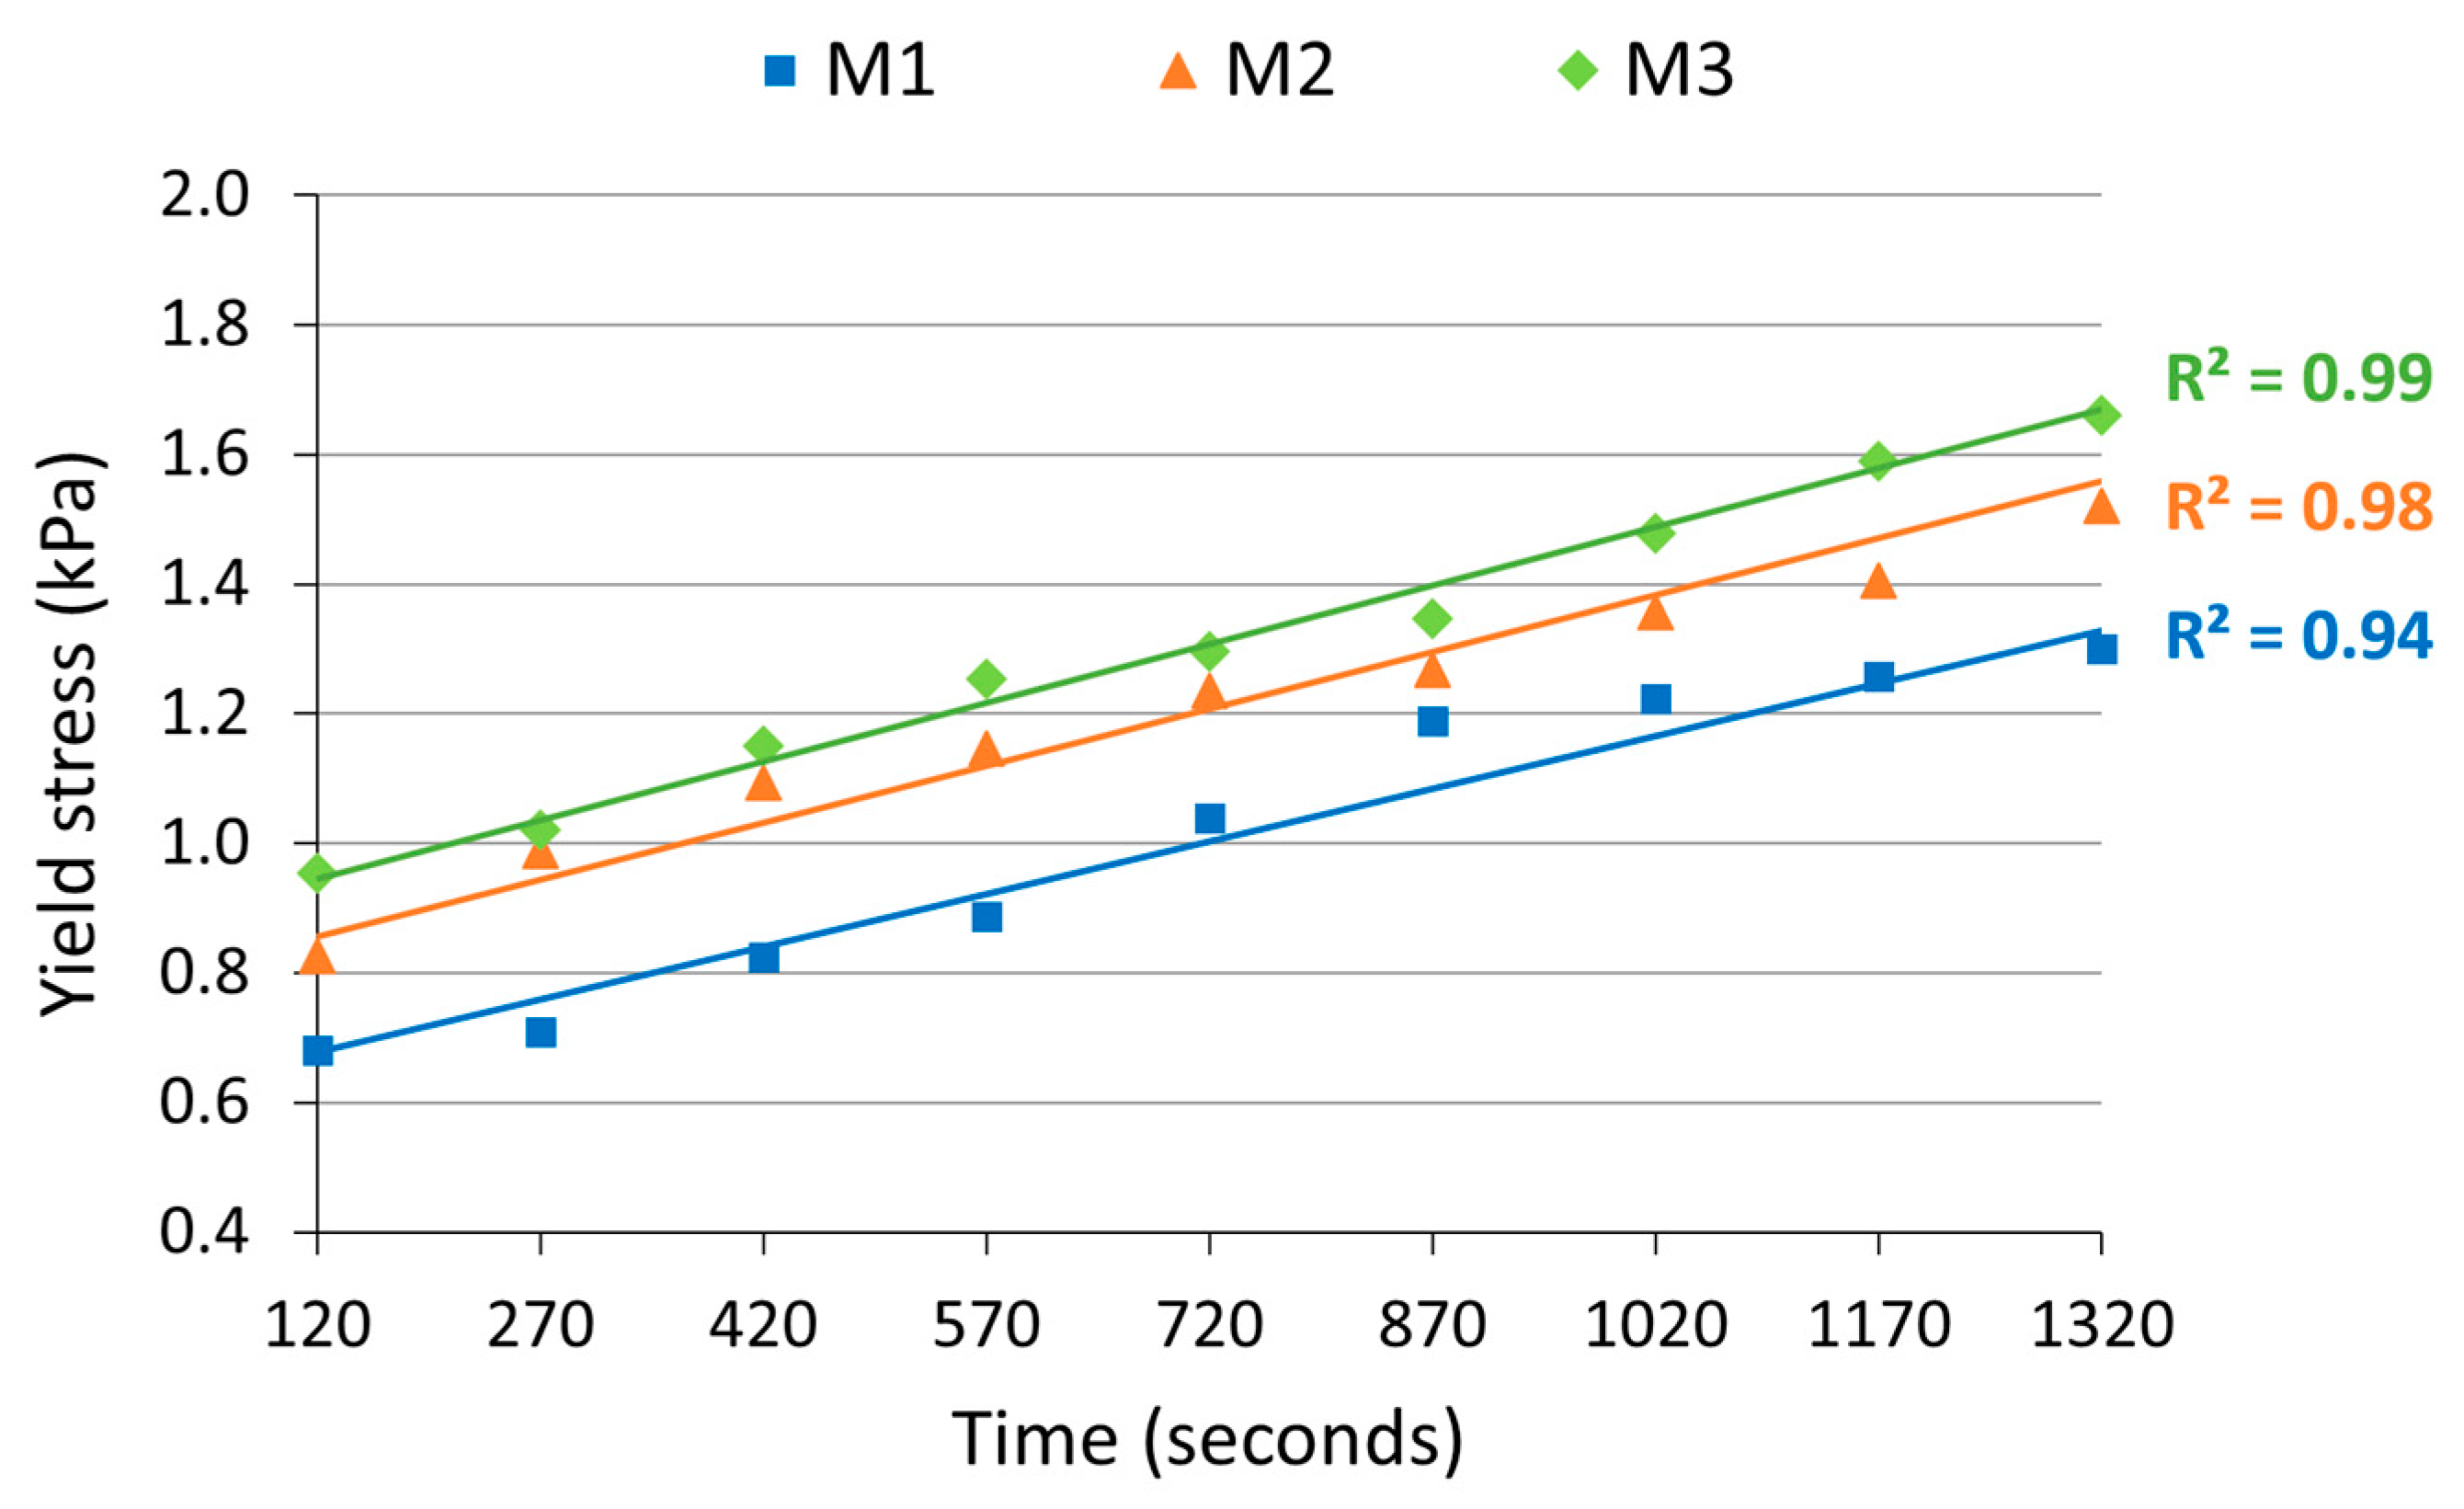
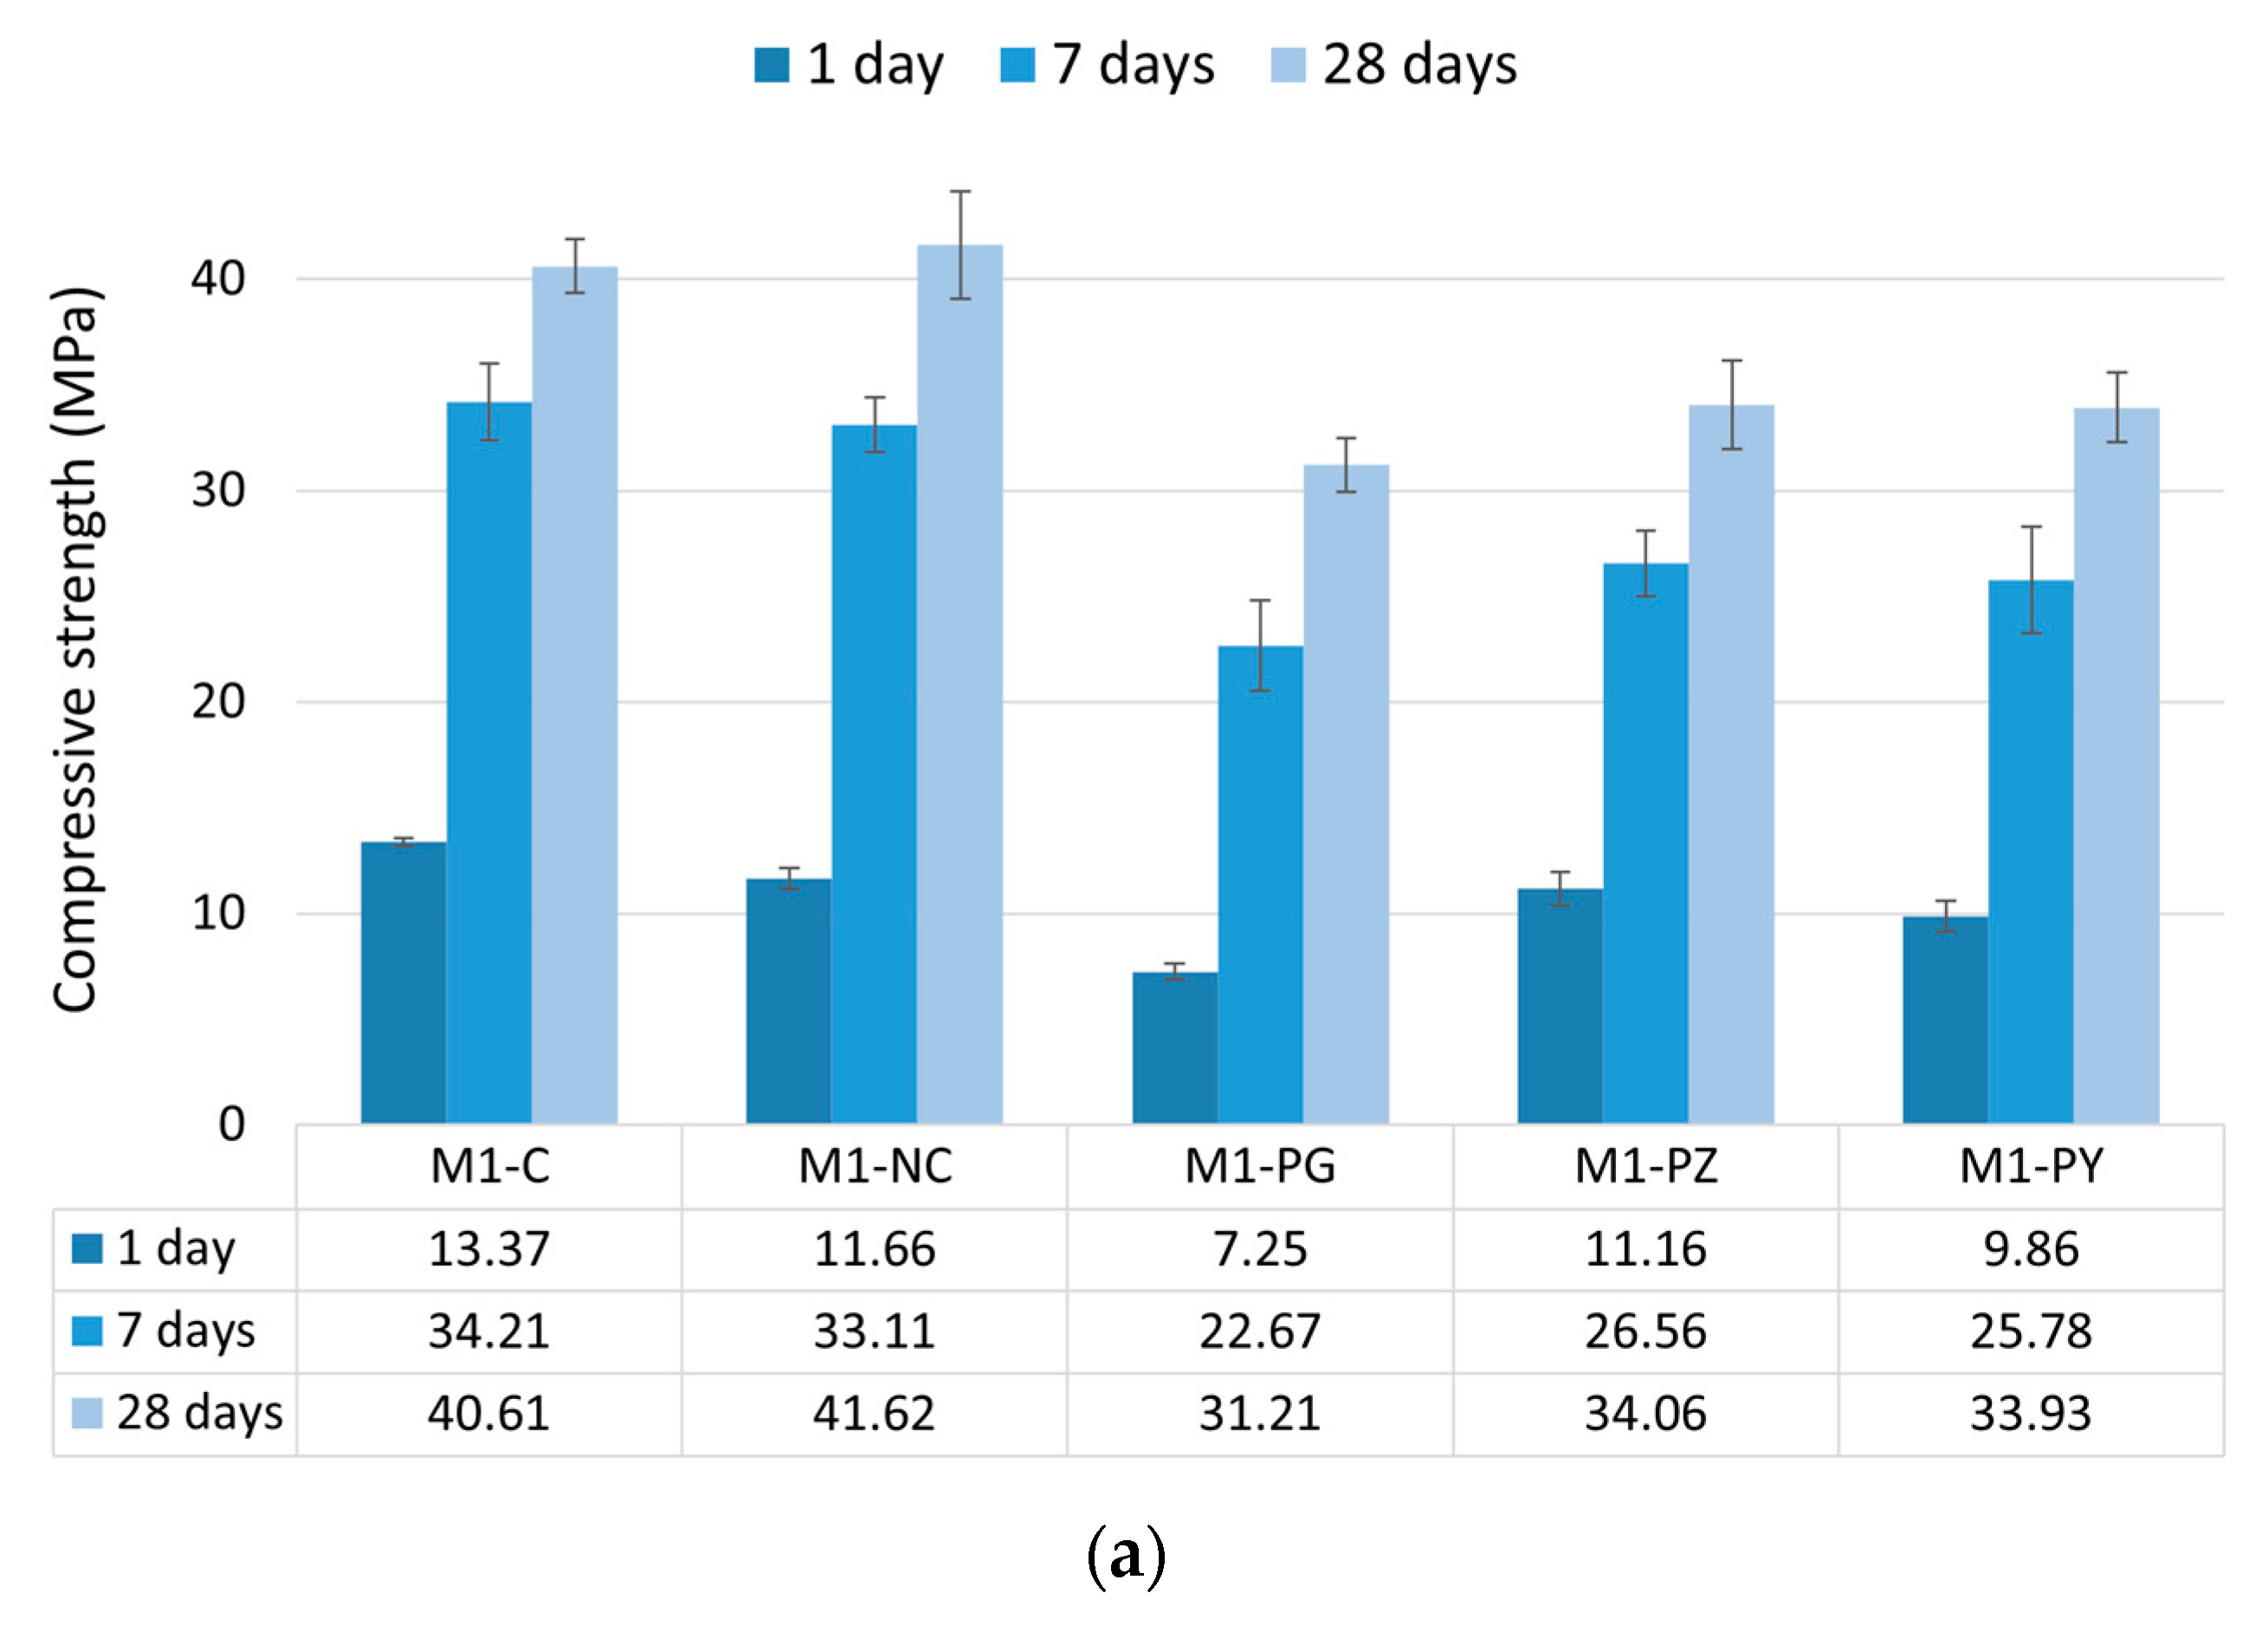
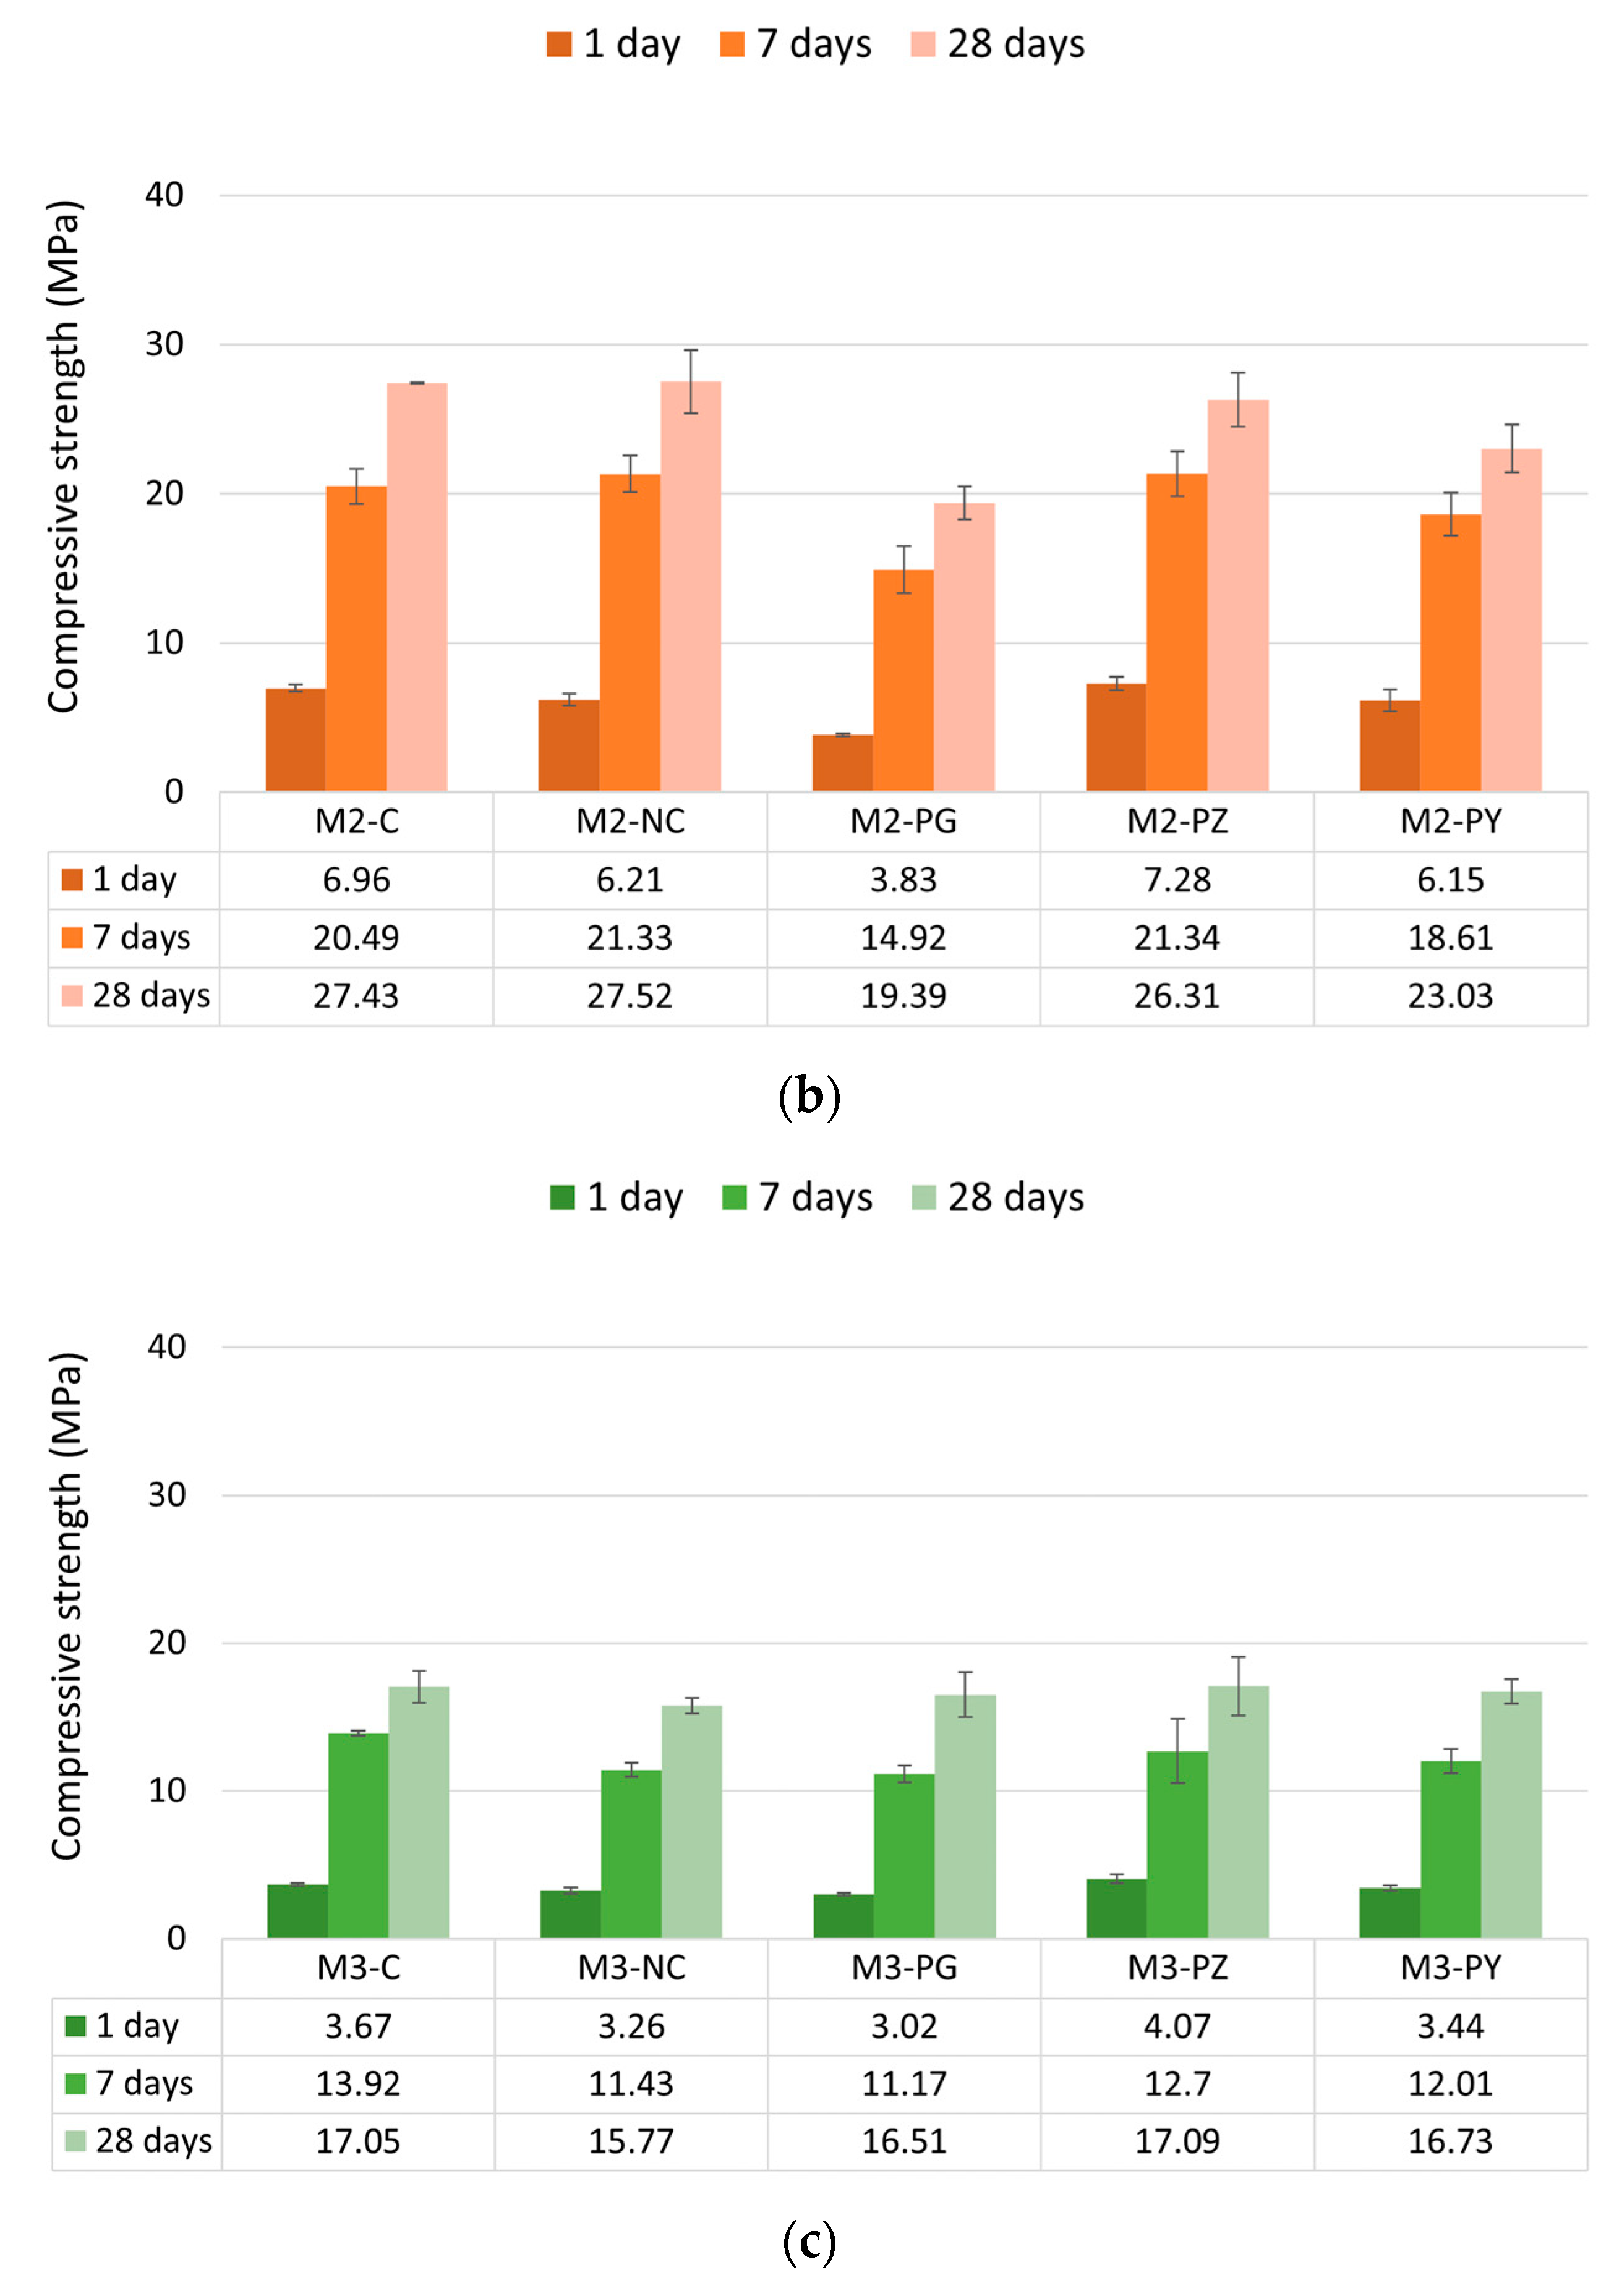
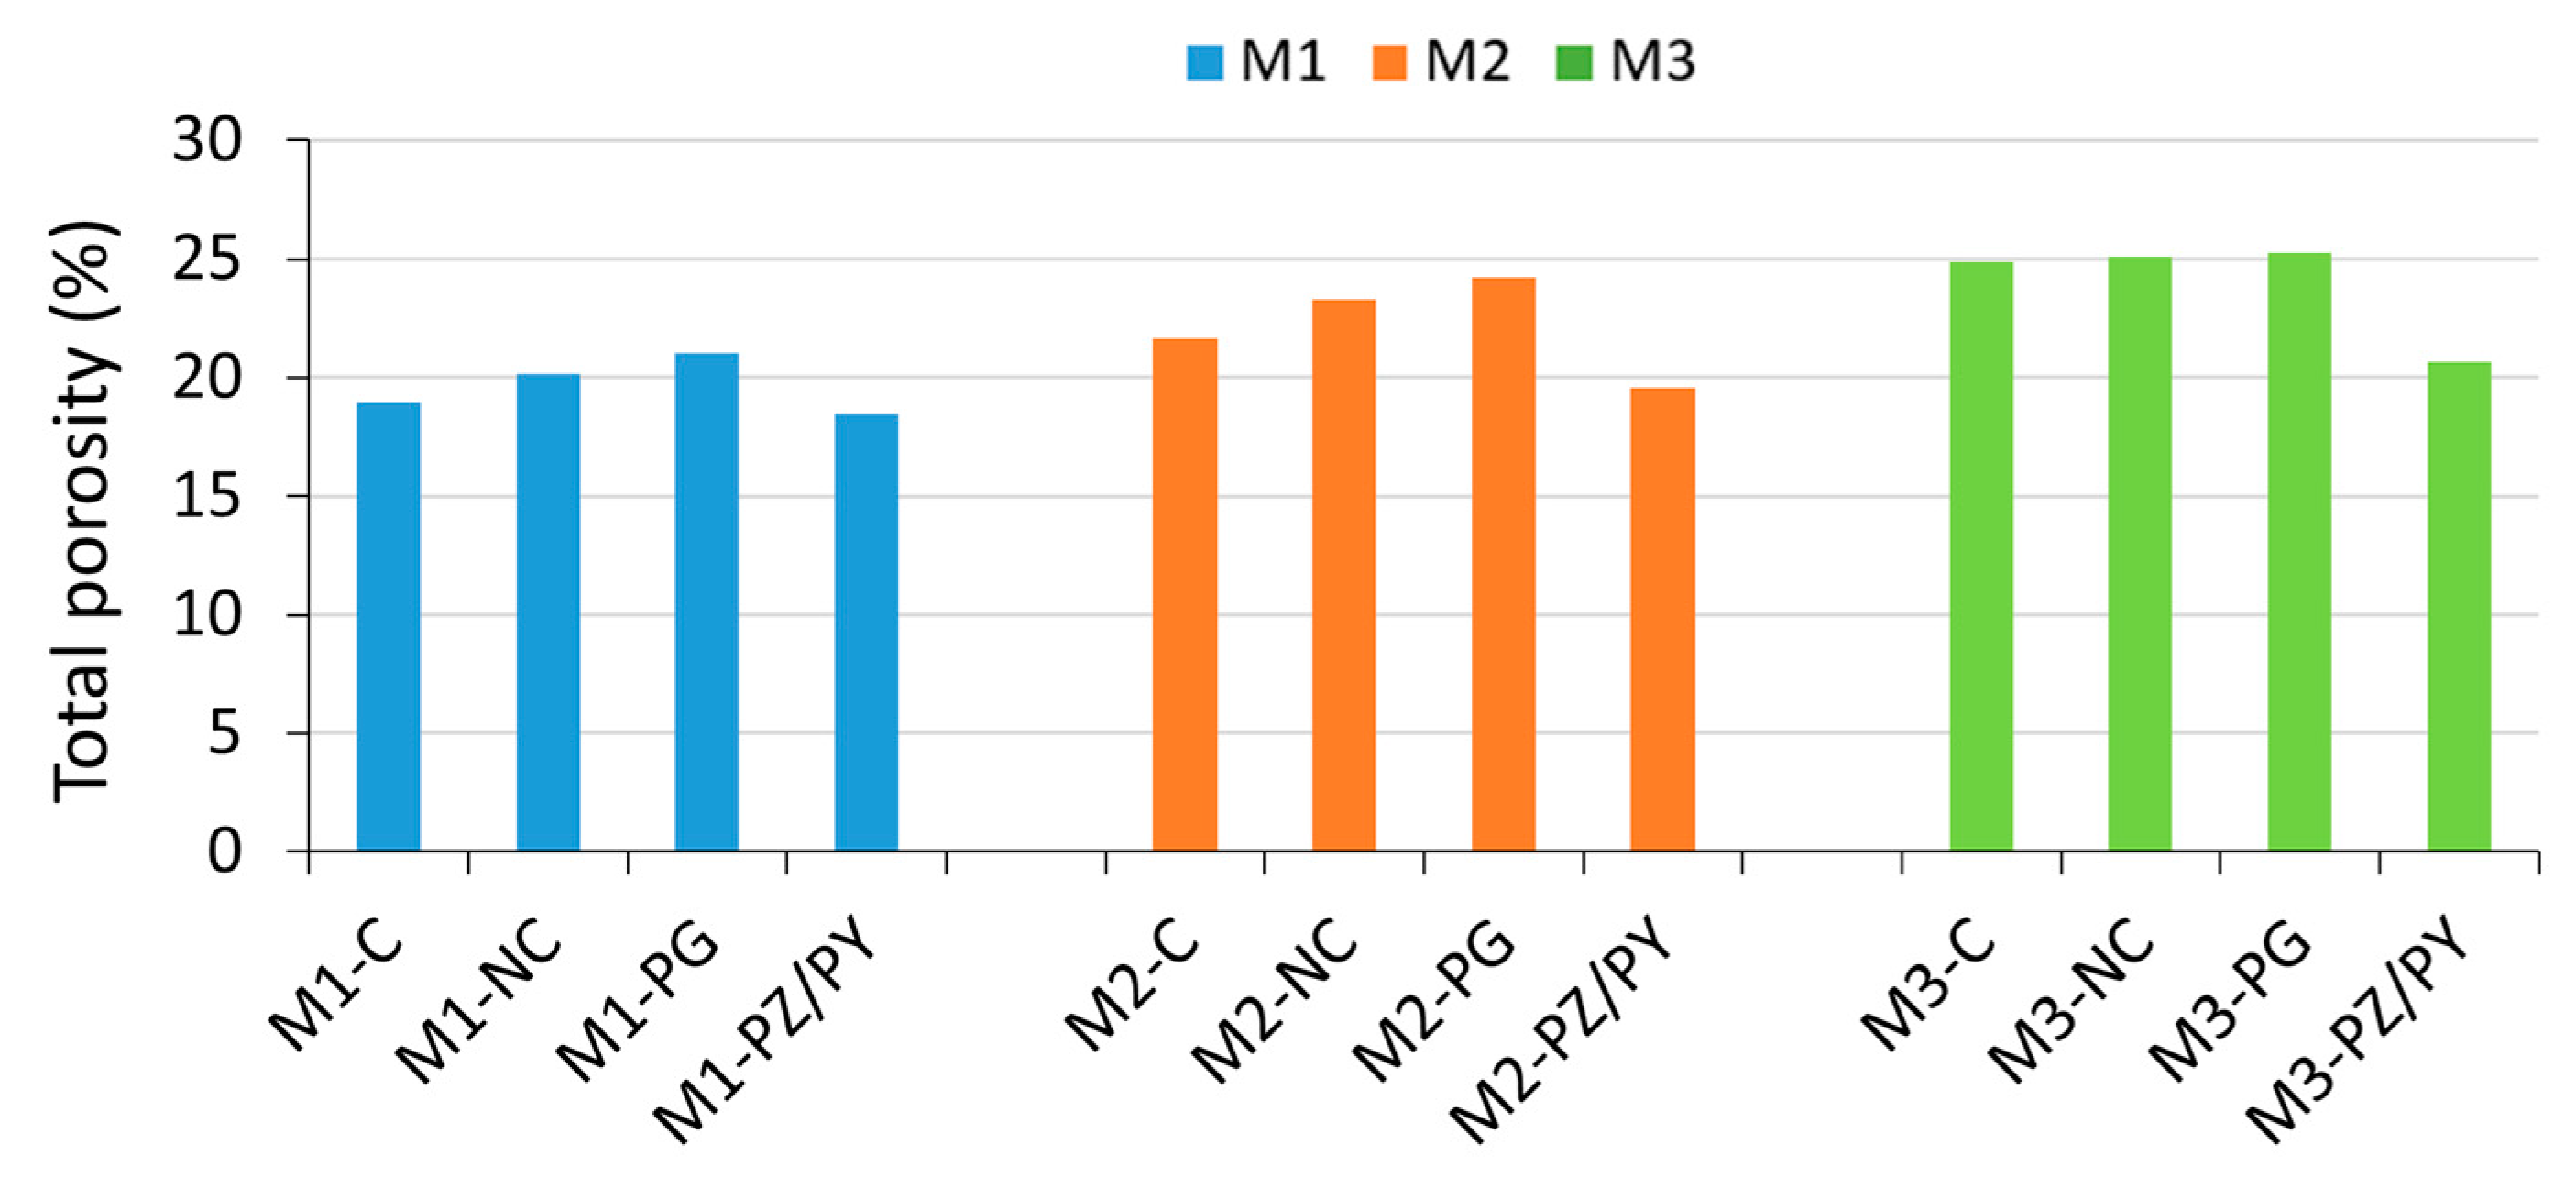
Table 1.
Chemical composition of the excavated soil and cement.
| Composition (%) | Al2O3 | CaO | FeO | Fe2O3 | K2O | MgO | Na2O | SO3 | SiO2 | TiO2 | Cl | P2O5 | ZnO |
|---|---|---|---|---|---|---|---|---|---|---|---|---|---|
| Excavated soil | 3.63 | 13.04 | 1.00 | 1.12 | 1.37 | 7.98 | 0.16 | 1.30 | 57.16 | 0.2 | – | – | – |
| Cement | 4.53 | 60.17 | 2.57 | 2.86 | 1.08 | 0.83 | 0.27 | 4.25 | 16.90 | 0.33 | 0.10 | 0.23 | 0.12 |
Table 2.
Characteristics of the superplasticizers.
| Superplasticizer (SP) | CHRYSO®Fluid Optima 100 | MasterSuna SBS 4131 | MasterGlenium ACE 456 |
|---|---|---|---|
| Type | Modified phosphonate | Polymer | Polycarboxylate |
| Dry content (%) | 31.00 | 28.50 | 30.00 |
Table 3.
Preliminary mixtures.
| Preliminary Mixtures | |||
|---|---|---|---|
| Mixture 1 (M1) | Mixture 2 (M2) | Mixture 3 (M3) | |
| Cement mass (g) | 300 | 300 | 300 |
| Total soil mass (g) | 700 | 1200 | 1700 |
| Soil/cement ratio (~) | 2 | 4 | 6 |
| Soil mass <80 µm (g) | 224 | 384 | 544 |
| Fines = cement + soil <80 µm | 524 | 684 | 844 |
| Water/fines ratio | 0.40 | 0.40 | 0.40 |
| % SP (wt.% fines) in dry content | To be determined | To be determined | To be determined |
Table 4.
Abbreviations used for each type of sample prepared for the first mixture, M1.
| Abbreviation Used | Type of Sample | Example |
|---|---|---|
| C | Compacted (NF EN 196-1) | M1-C |
| NC | Non-compacted | M1-NC |
| PG | Printed with the manual gun | M1-PG |
| PZ | Printed with the printer and tested along the Z-axis | M1-PZ |
| PY | Printed with the printer and tested along the Y-axis | M1-PY |
Table 5.
Composition, extrudability and buildability for all tested mixtures.
| Composition of M1 Mixtures | Composition of M2 Mixtures | Composition of M3 Mixtures | ||||||
|---|---|---|---|---|---|---|---|---|
| SP = 0.45% | SP = 0.48% | SP = 0.51% | SP = 0.72% | SP = 0.75% | SP = 0.87% | SP = 0.90% | SP = 1.00% | |
| Cement mass (g) | 300 | 300 | 300 | |||||
| Total soil mass (g) | 700 | 1200 | 1700 | |||||
| Soil/cement ratio (~) | 2 | 4 | 6 | |||||
| Soil mass <80 µm (g) | 224 | 384 | 544 | |||||
| Fines = cement + soil <80 µm | 524 | 684 | 844 | |||||
| Water/fines ratio | 0.40 | 0.40 | 0.40 | |||||
| % SP (wt.% fines) | 0.45 | 0.48 | 0.51 | 0.72 | 0.75 | 0.87 | 0.90 | 1.00 |
| Extrudability and buildability of mixtures | ||||||||
| Extrudability | ✗ | ✓ | ✓ | ✗ | ✓ | ✓ | ✓ | ✓ |
| hf (cm) | 4.75 | 4.50 | 2.70 | 4.85 | 4.50 | 4.55 | 4.50 | 2.55 |
| Buildability | ✓ | ✓ | ✗ | ✓ | ✓ | ✓ | ✓ | ✗ |
Table 6.
Compressive strength ranges of the printable soil-based mixtures at 28 days.
| M1 | M2 | M3 | |
|---|---|---|---|
| Compressive strength at 28 days (MPa) | 33–34 | 23–26 | 16–17 |
Disclaimer/Publisher’s Note: The statements, opinions and data contained in all publications are solely those of the individual author(s) and contributor(s) and not of MDPI and/or the editor(s). MDPI and/or the editor(s) disclaim responsibility for any injury to people or property resulting from any ideas, methods, instructions or products referred to in the content. |
© 2023 by the authors. Licensee MDPI, Basel, Switzerland. This article is an open access article distributed under the terms and conditions of the Creative Commons Attribution (CC BY) license (https://creativecommons.org/licenses/by/4.0/).
Share and Cite
MDPI and ACS Style
Daher, J.; Kleib, J.; Benzerzour, M.; Abriak, N.-E.; Aouad, G. The Development of Soil-Based 3D-Printable Mixtures: A Mix-Design Methodology and a Case Study. Buildings 2023, 13, 1618. https://doi.org/10.3390/buildings13071618
AMA Style
Daher J, Kleib J, Benzerzour M, Abriak N-E, Aouad G. The Development of Soil-Based 3D-Printable Mixtures: A Mix-Design Methodology and a Case Study. Buildings. 2023; 13(7):1618. https://doi.org/10.3390/buildings13071618
Chicago/Turabian StyleDaher, Jana, Joelle Kleib, Mahfoud Benzerzour, Nor-Edine Abriak, and Georges Aouad. 2023. "The Development of Soil-Based 3D-Printable Mixtures: A Mix-Design Methodology and a Case Study" Buildings 13, no. 7: 1618. https://doi.org/10.3390/buildings13071618
Note that from the first issue of 2016, this journal uses article numbers instead of page numbers. See further details here.