
Predicting Compressive Strength of Blast Furnace Slag and Fly Ash Based Sustainable Concrete Using Machine Learning Techniques: An Application of Advanced Decision-Making Approaches

 , ,
, ,  ,
,
Abstract
:1. Introduction
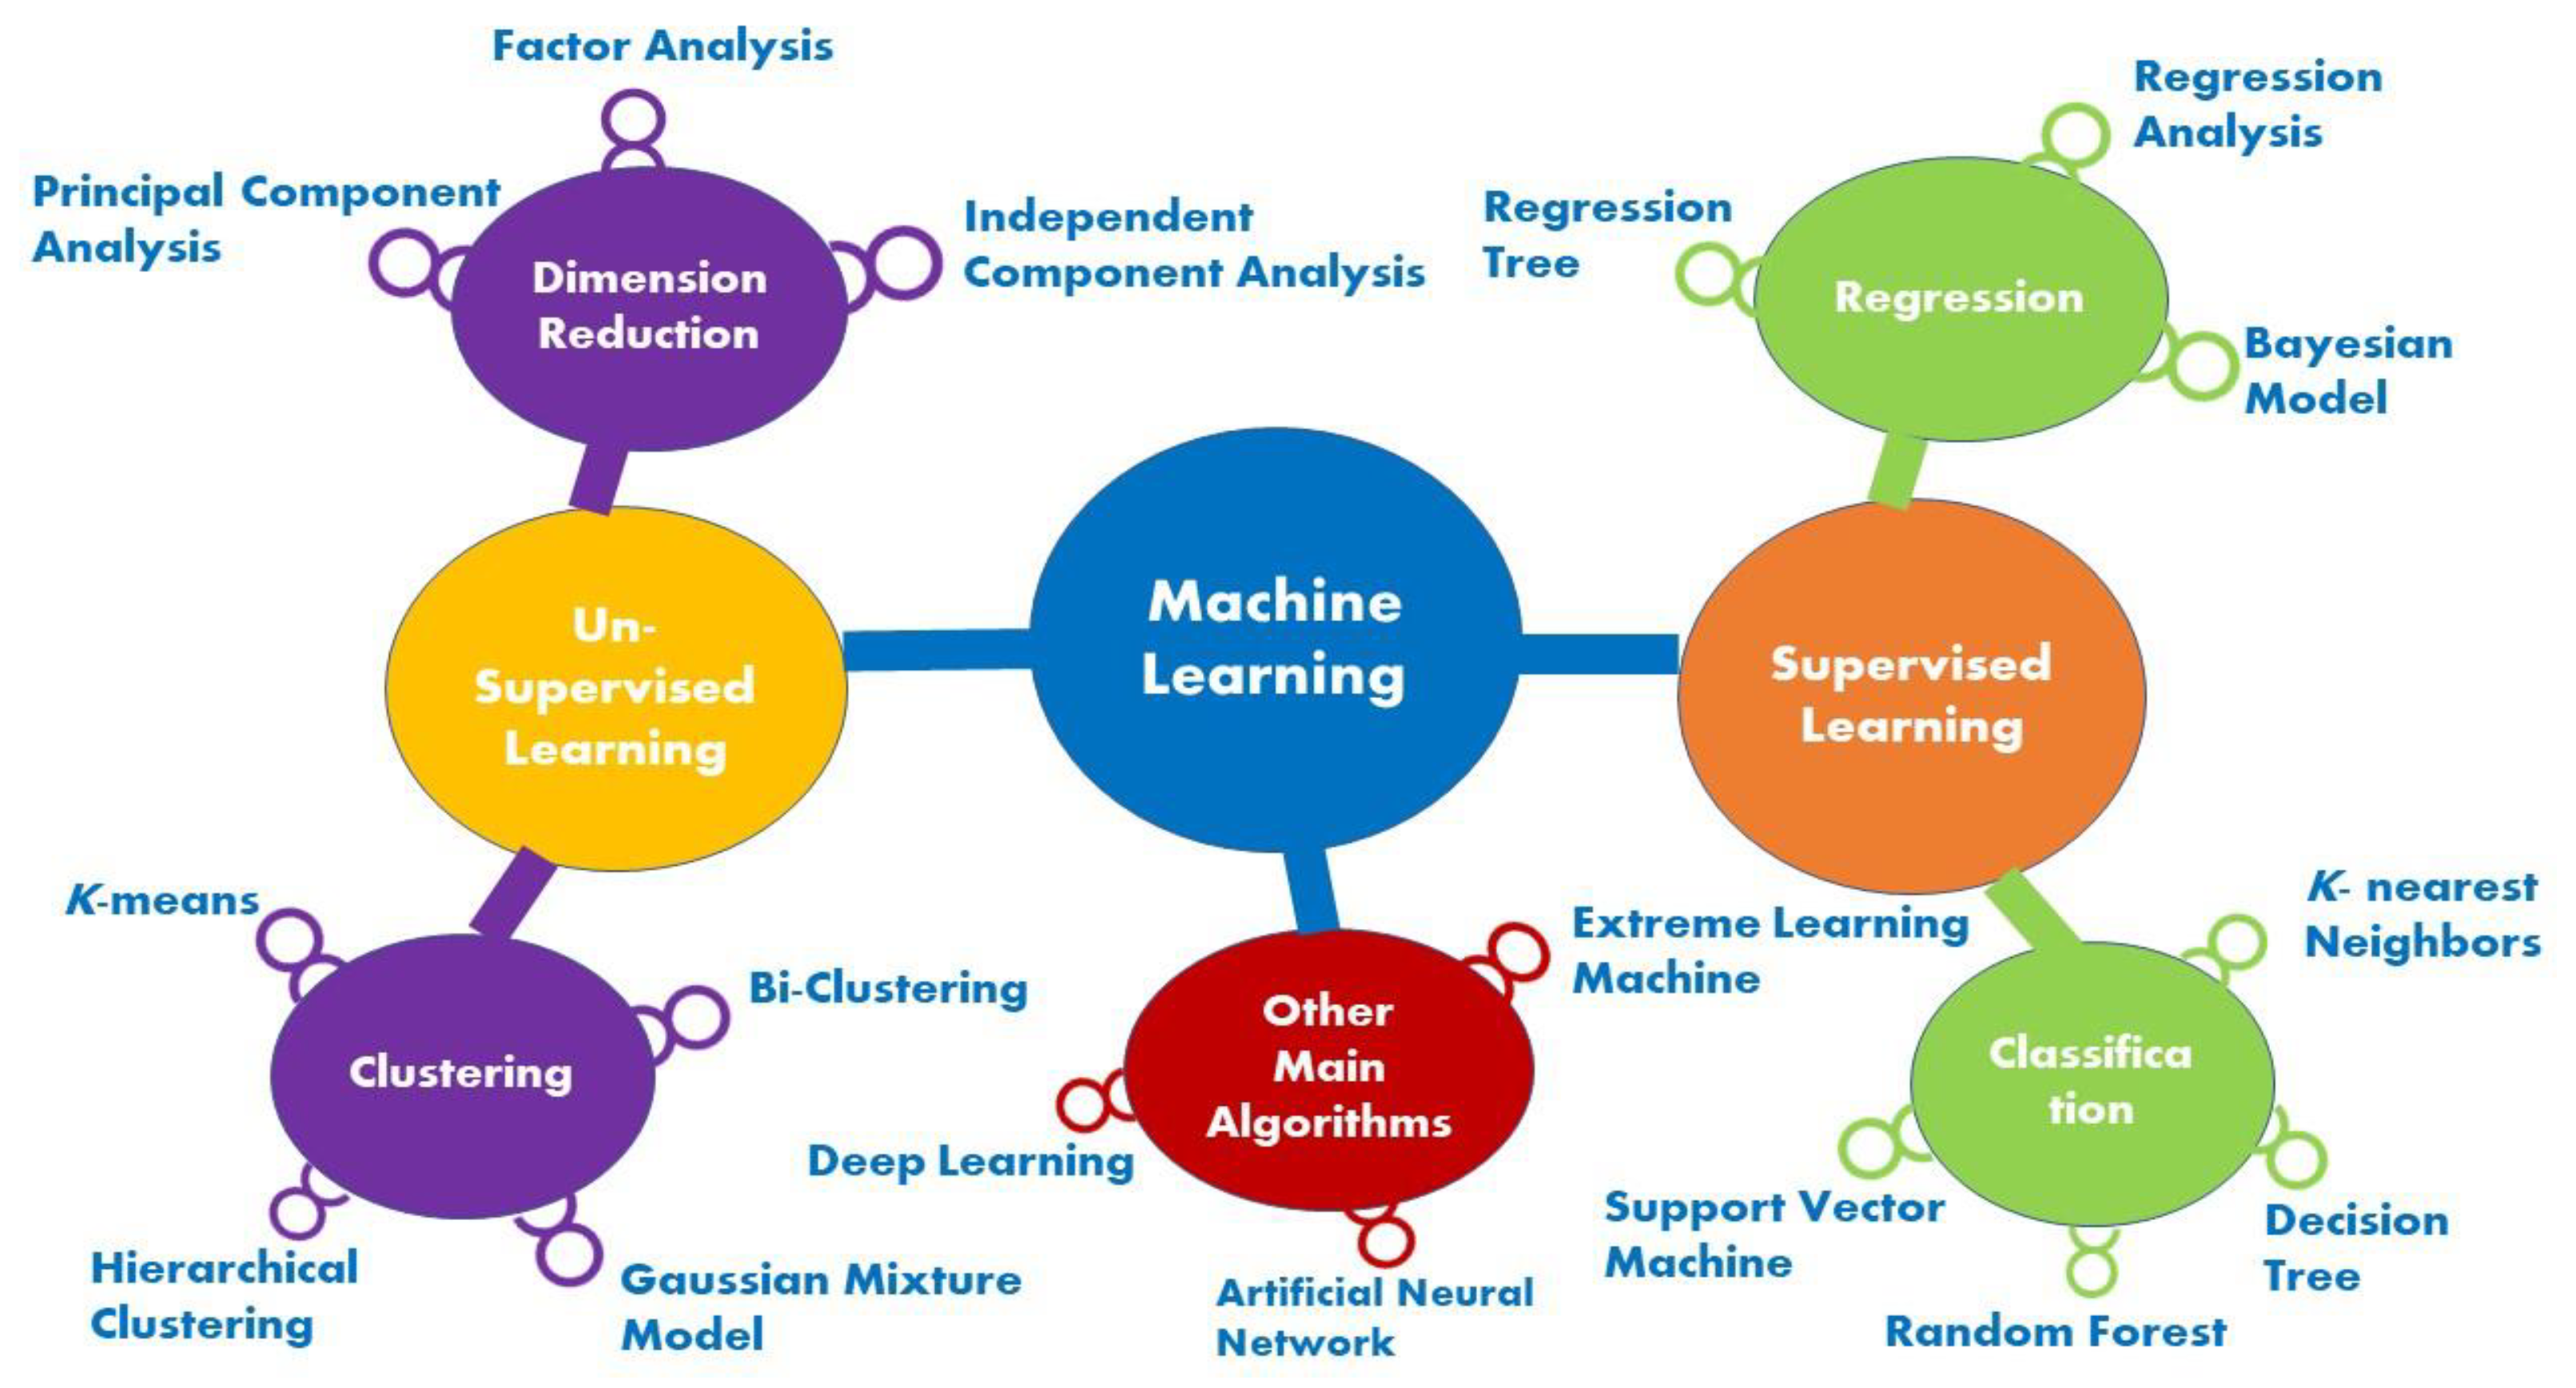
2. Background
2.1. Supervised ML Algorithms
2.2. Unsupervised ML Algorithms
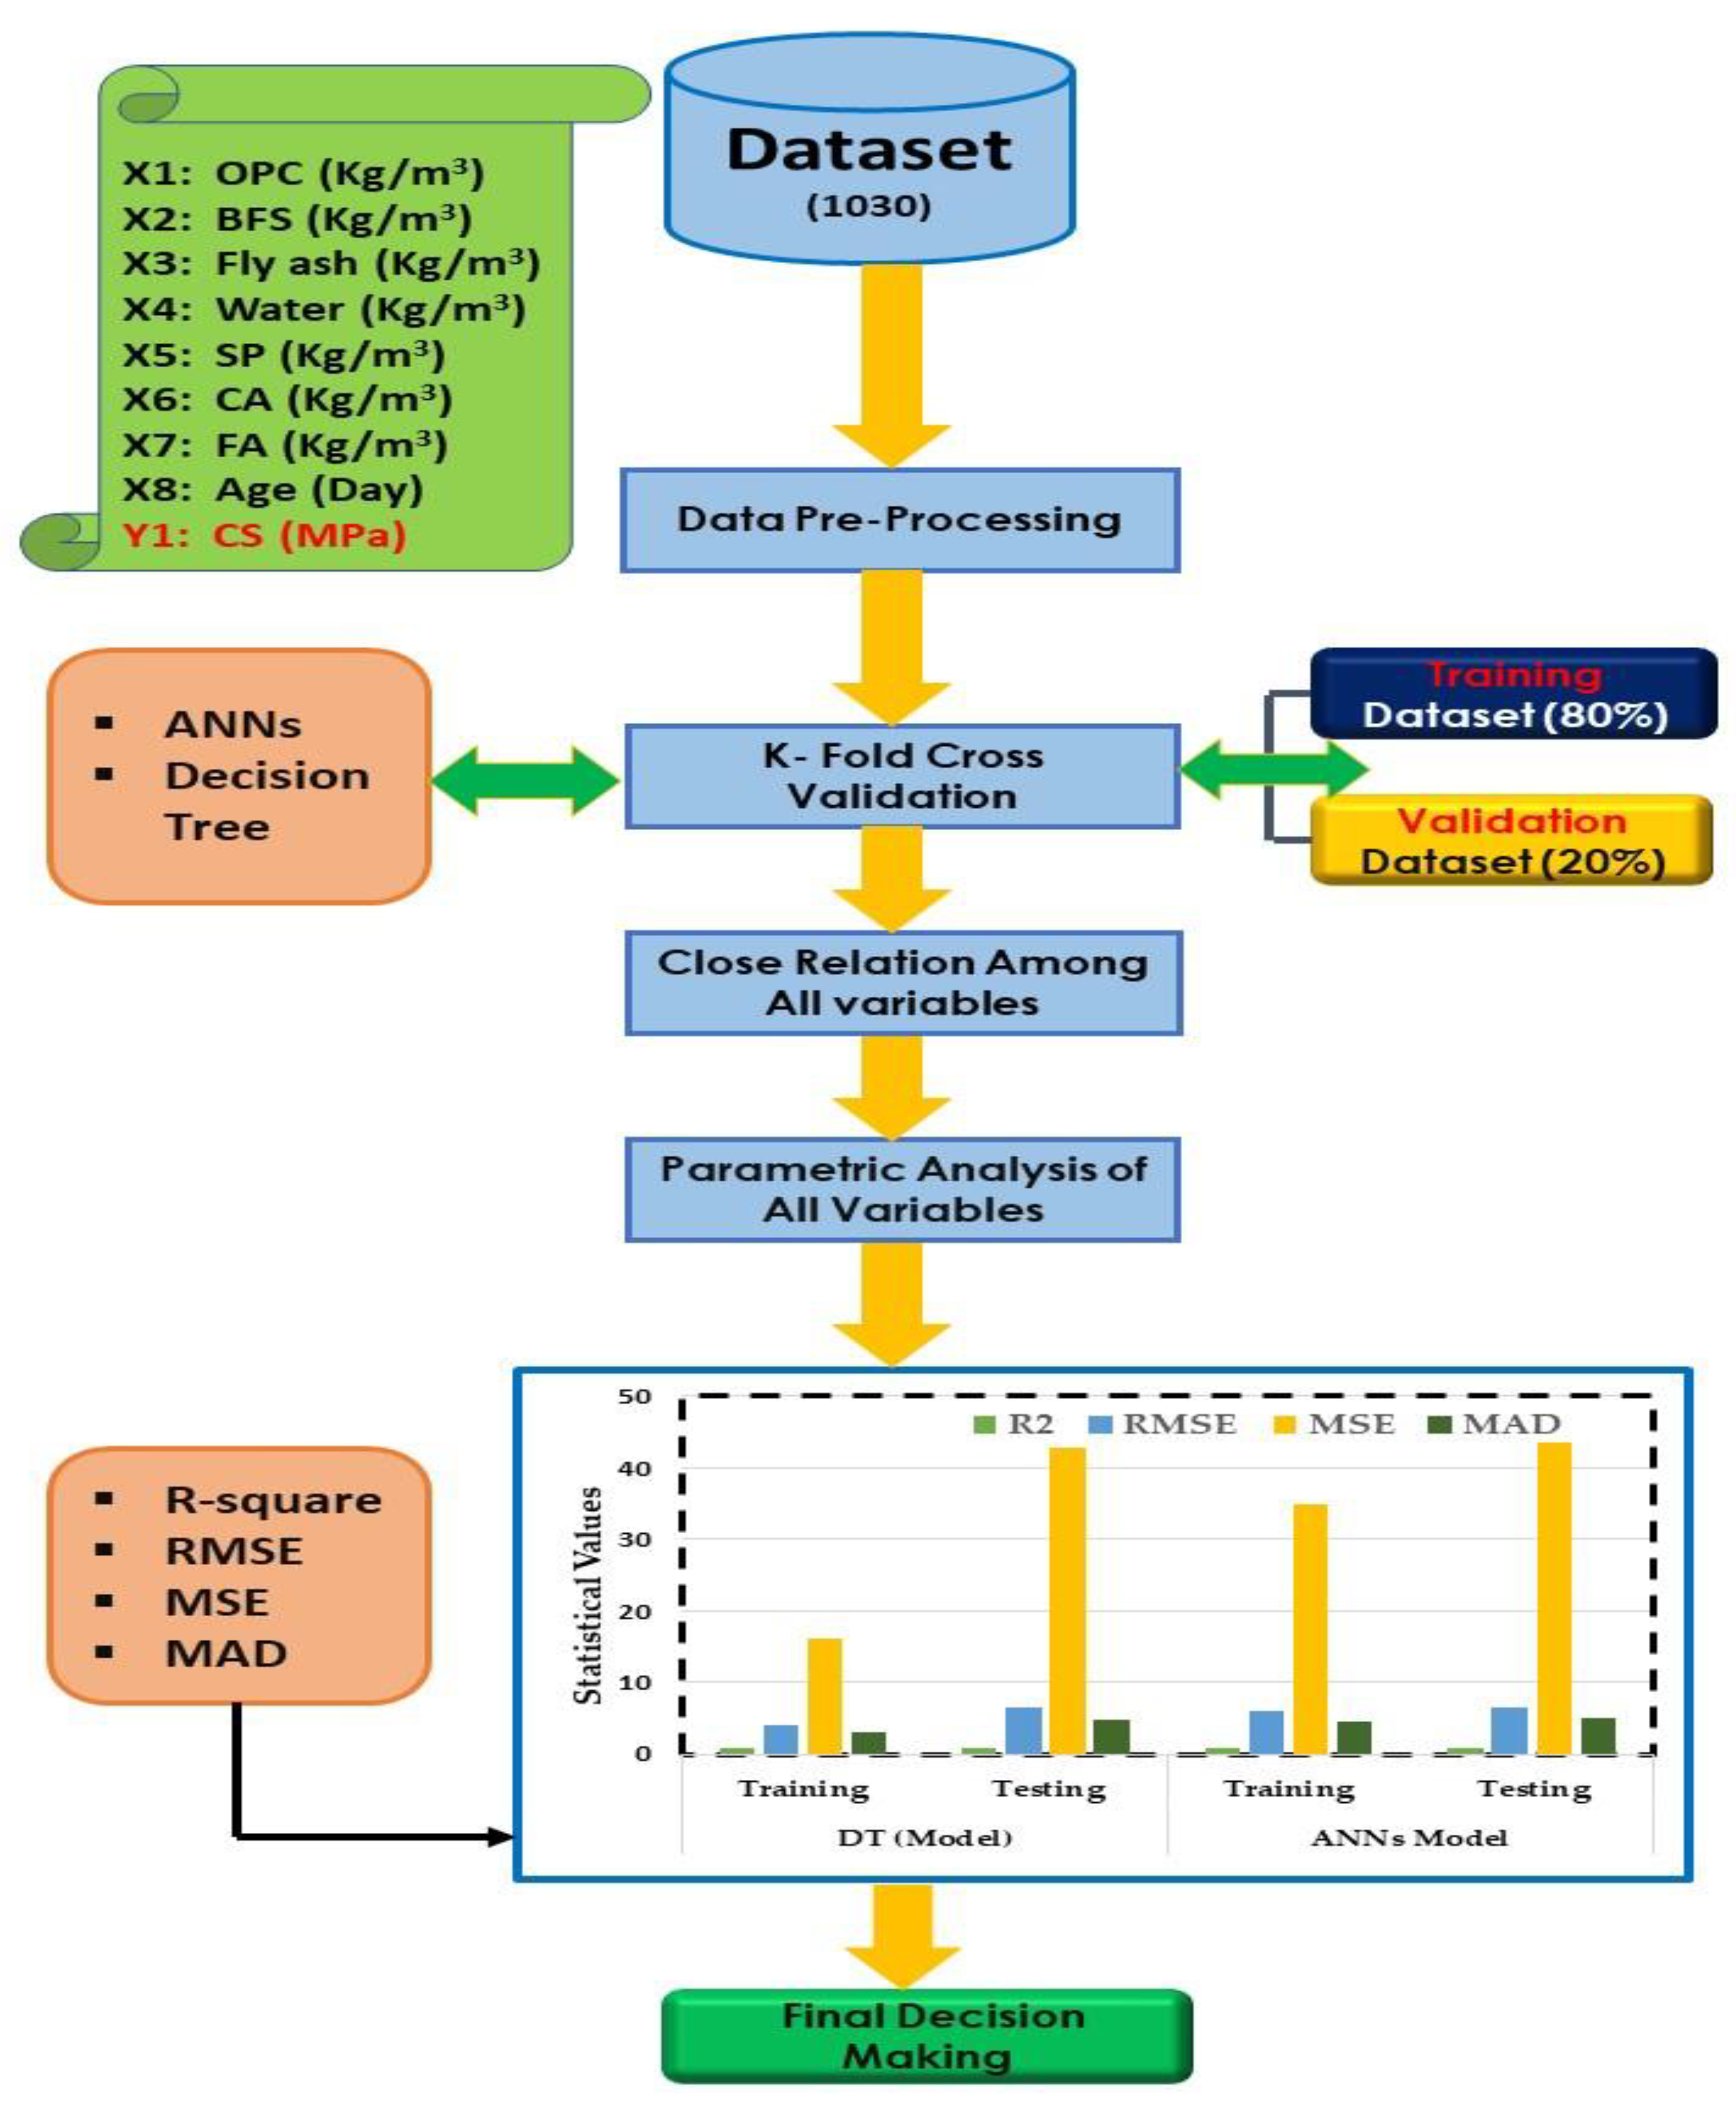
3. Materials and Methods
3.1. Decision Tree (DT) Model
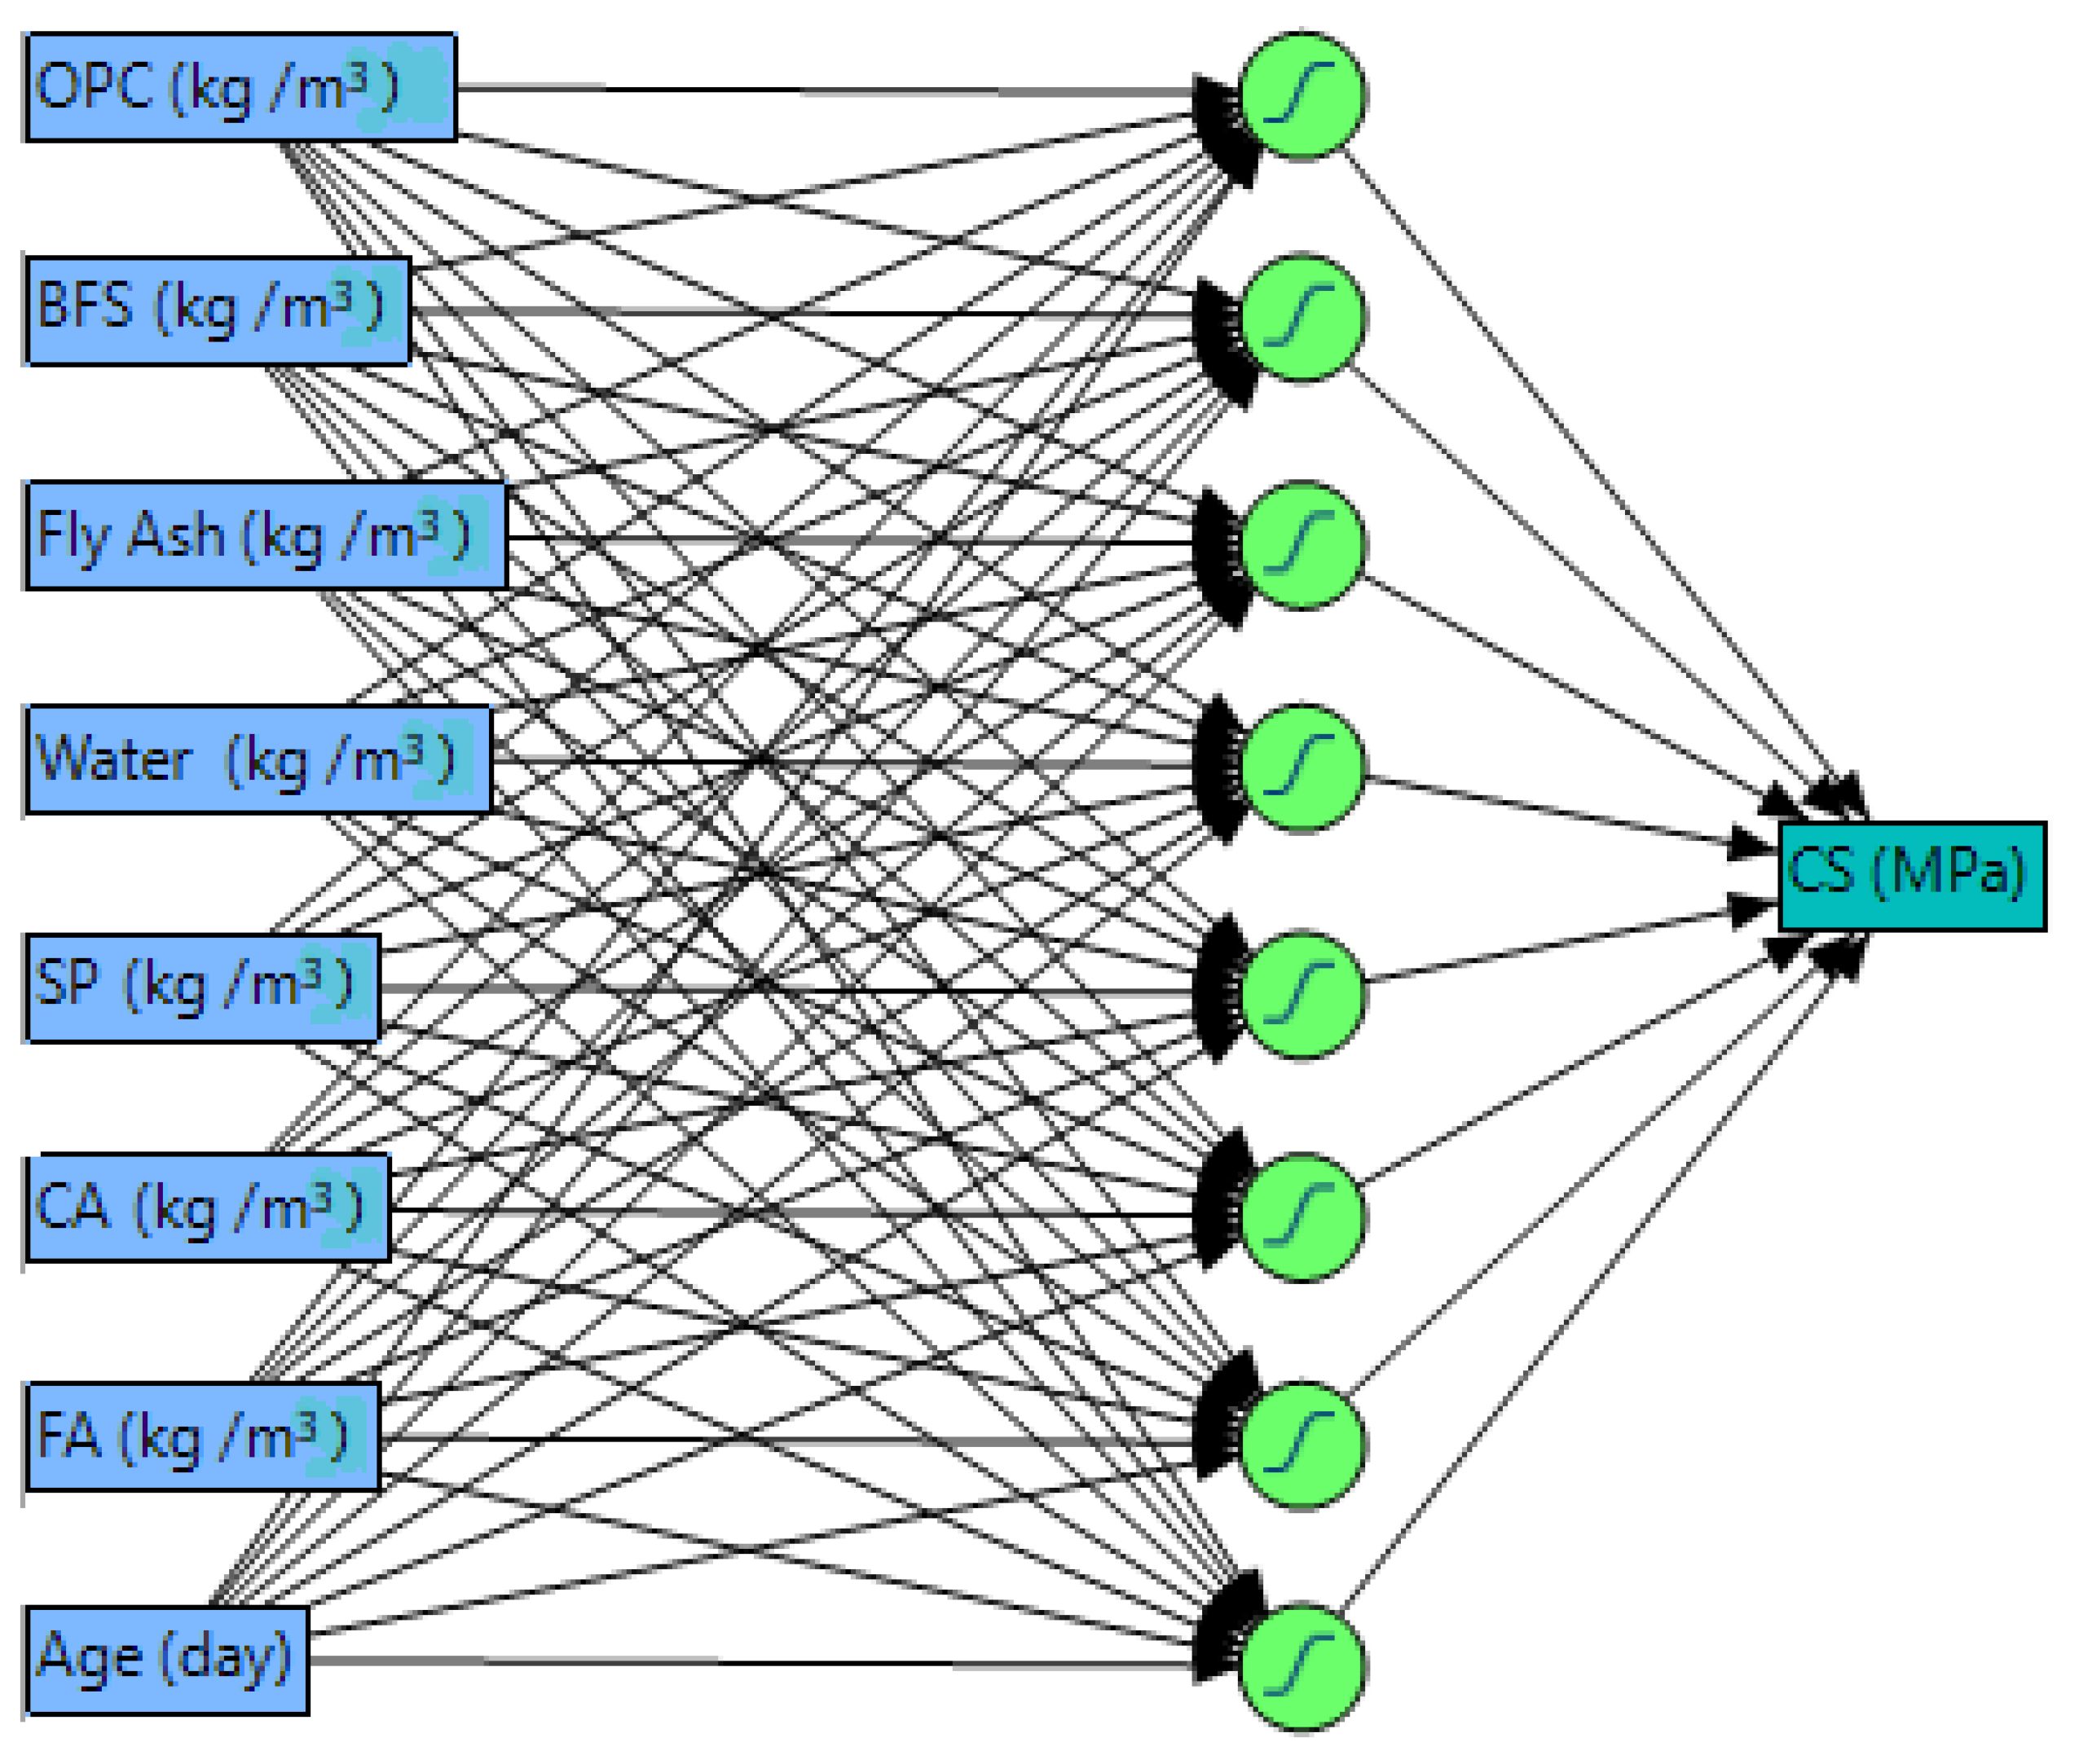
3.2. Artificial Neural Networks (ANNs) Model
3.3. Activation Function and Learning Algorithms
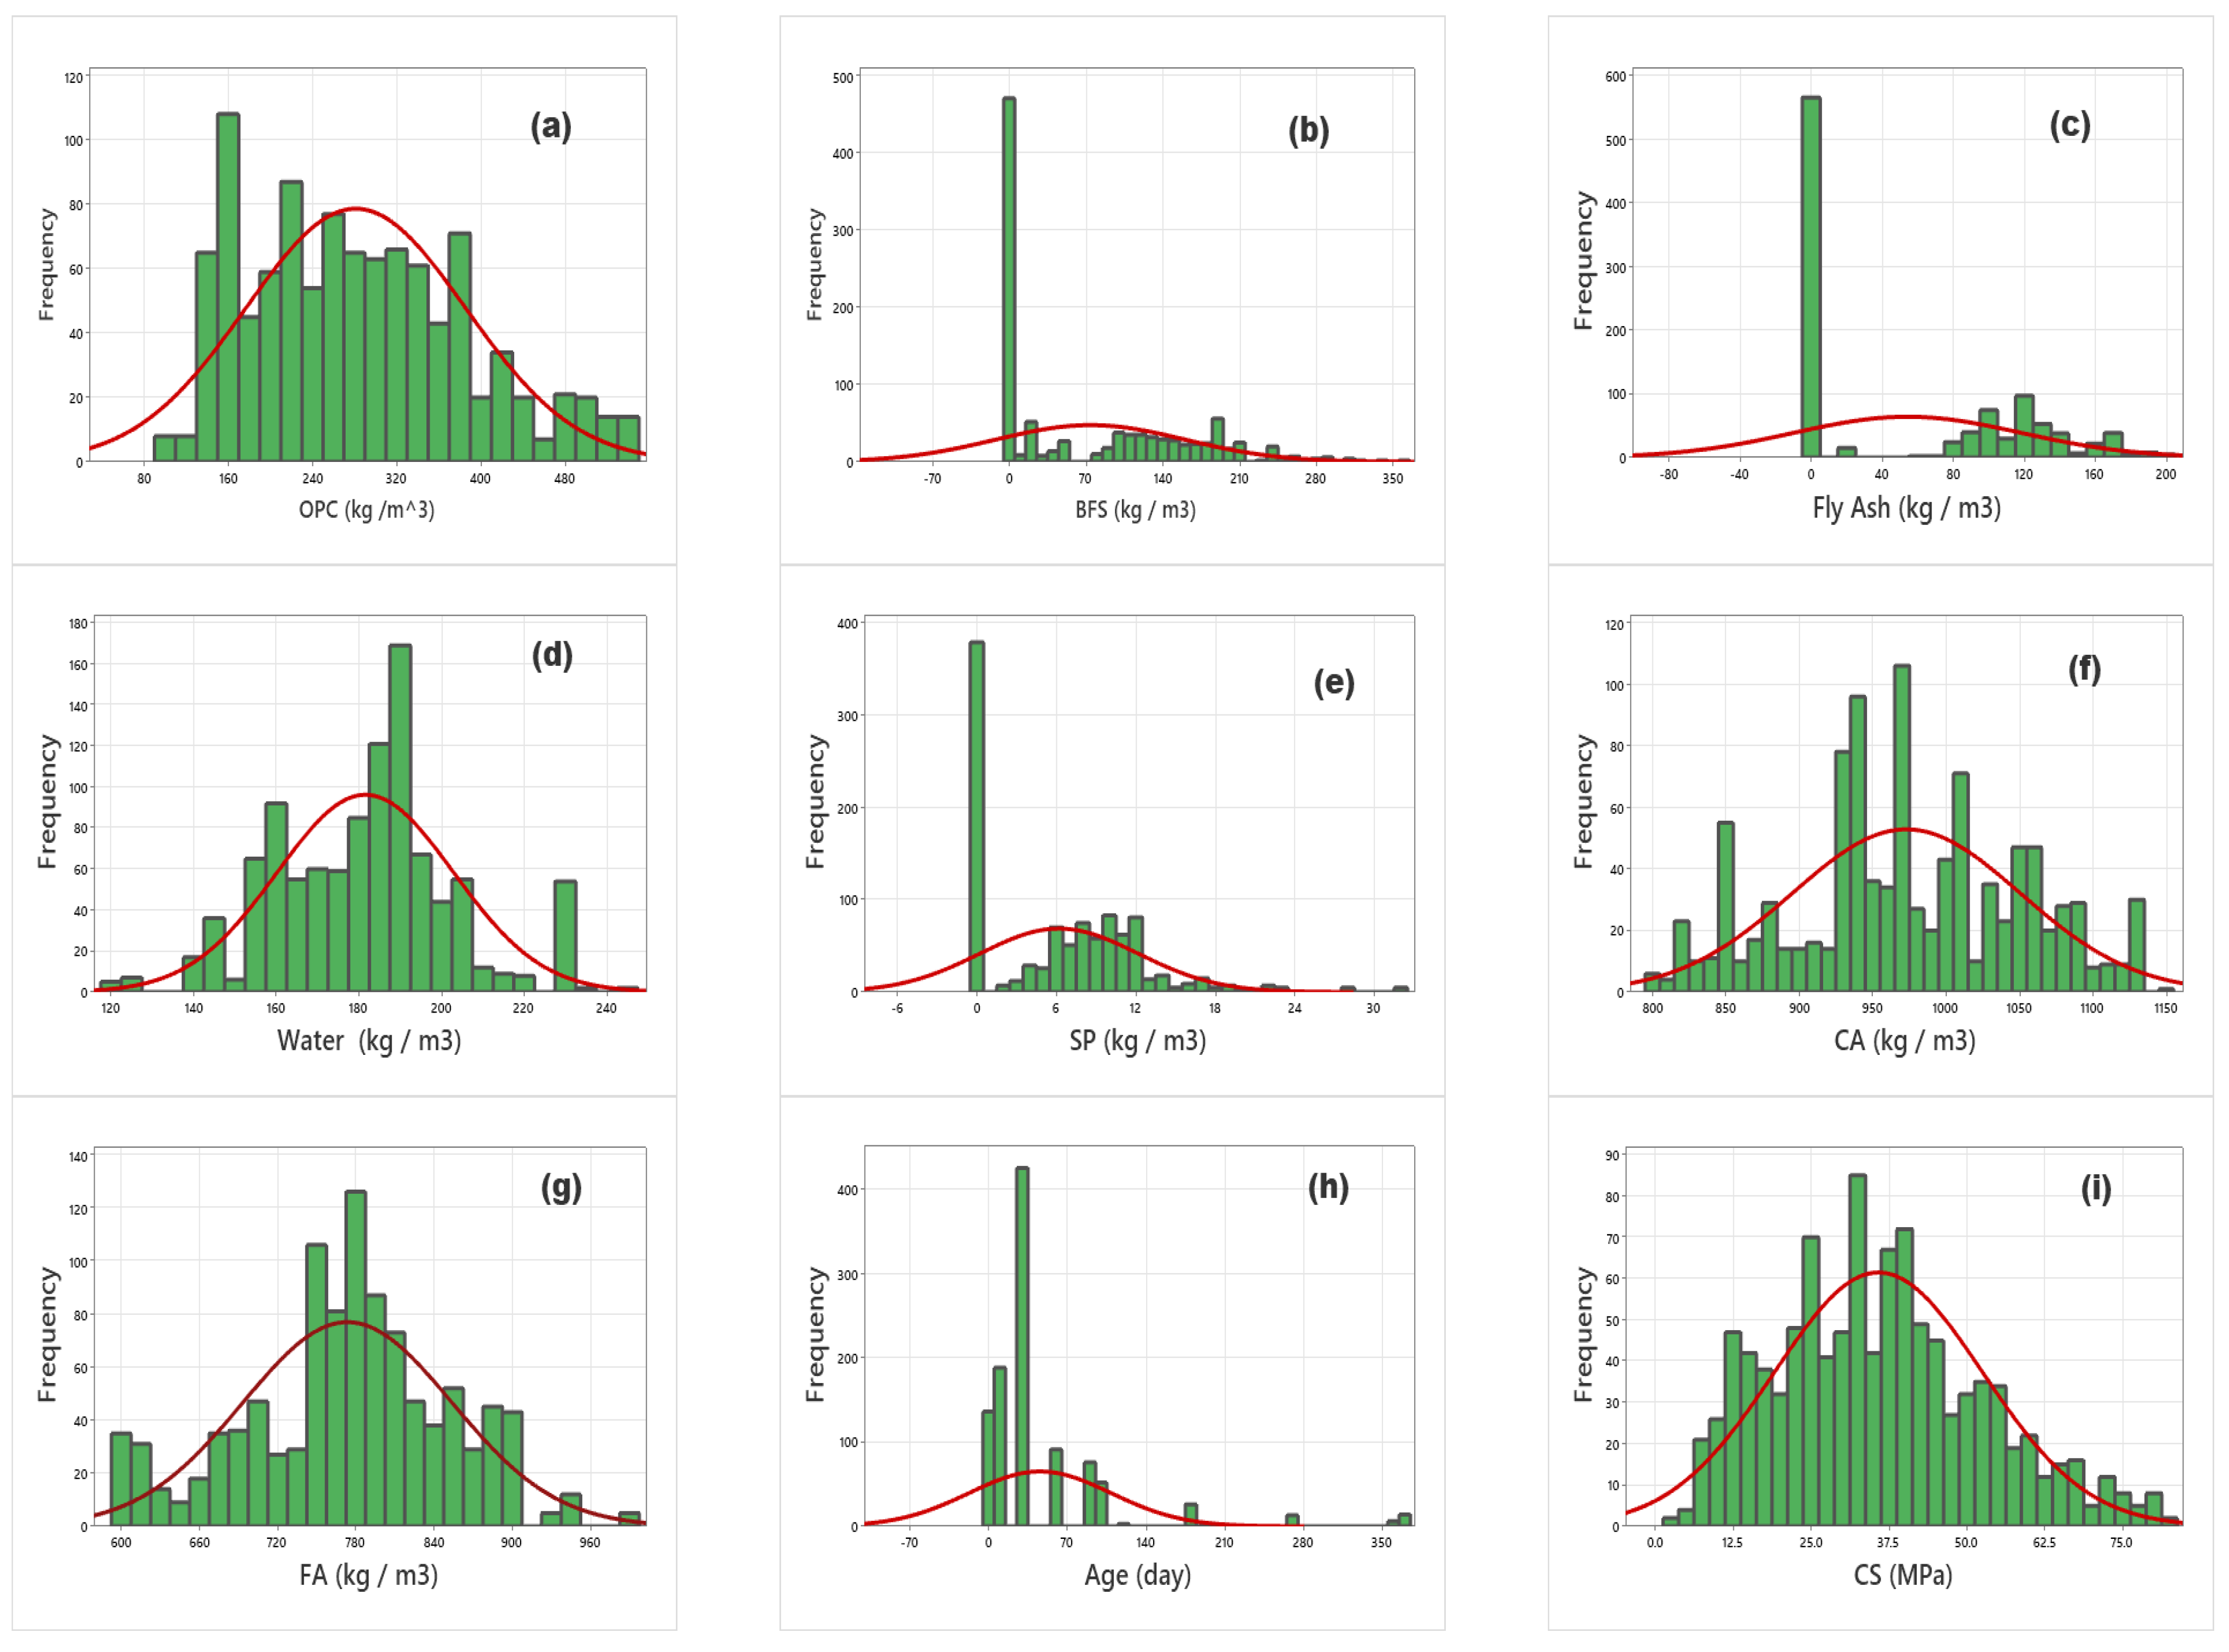
4. Material Properties and Description of Dataset
5. Evaluation of Models Using Statistical Metrics
6. Results and Discussions
6.1. Outcomes of DT Model
6.2. Outcomes of ANNs Model
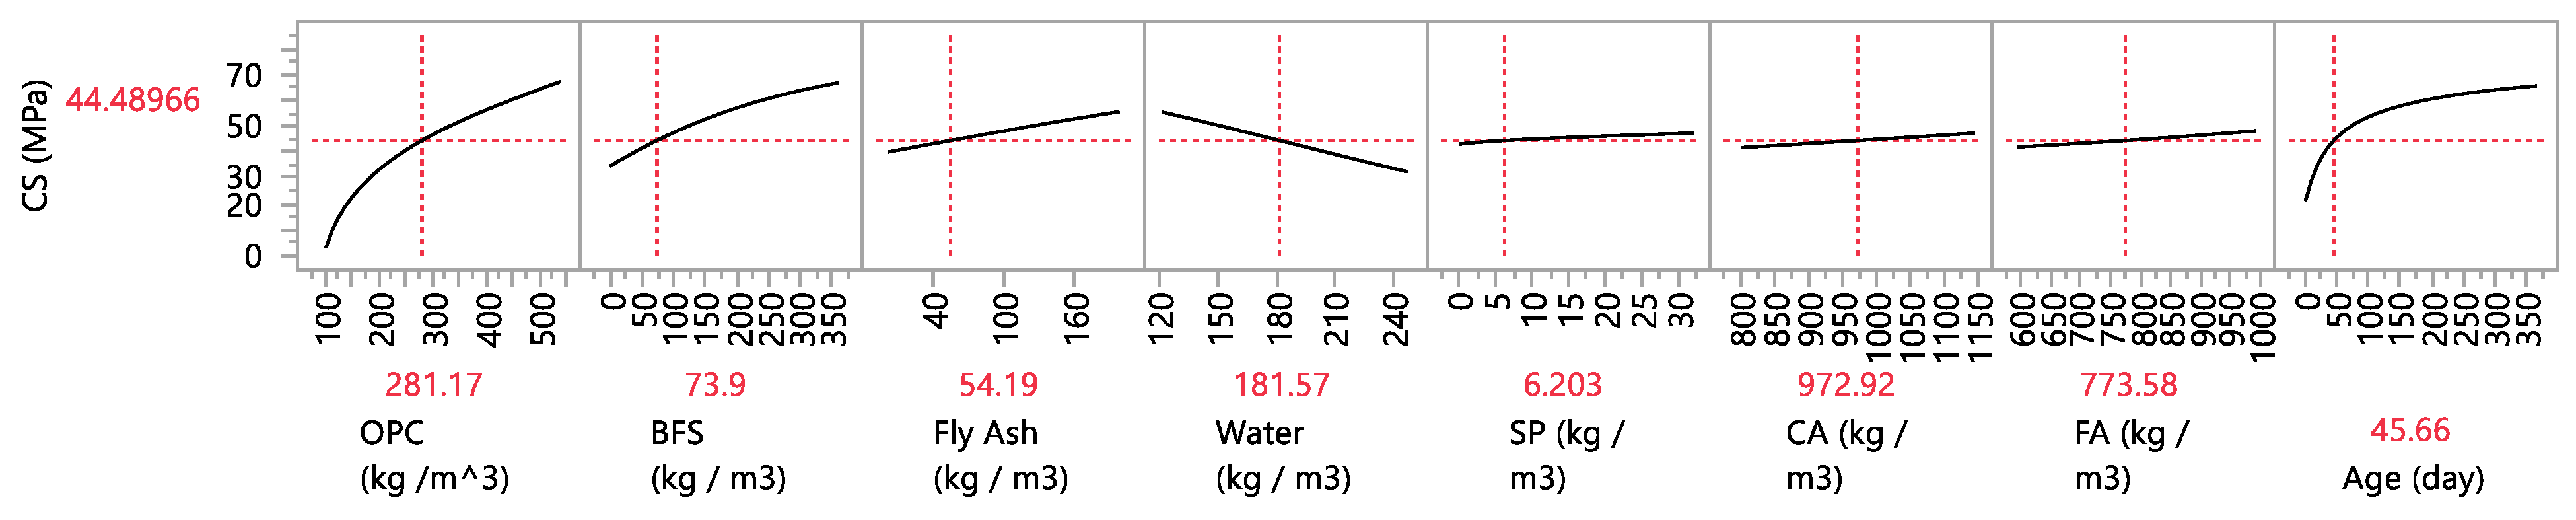
6.3. Prediction Profiler
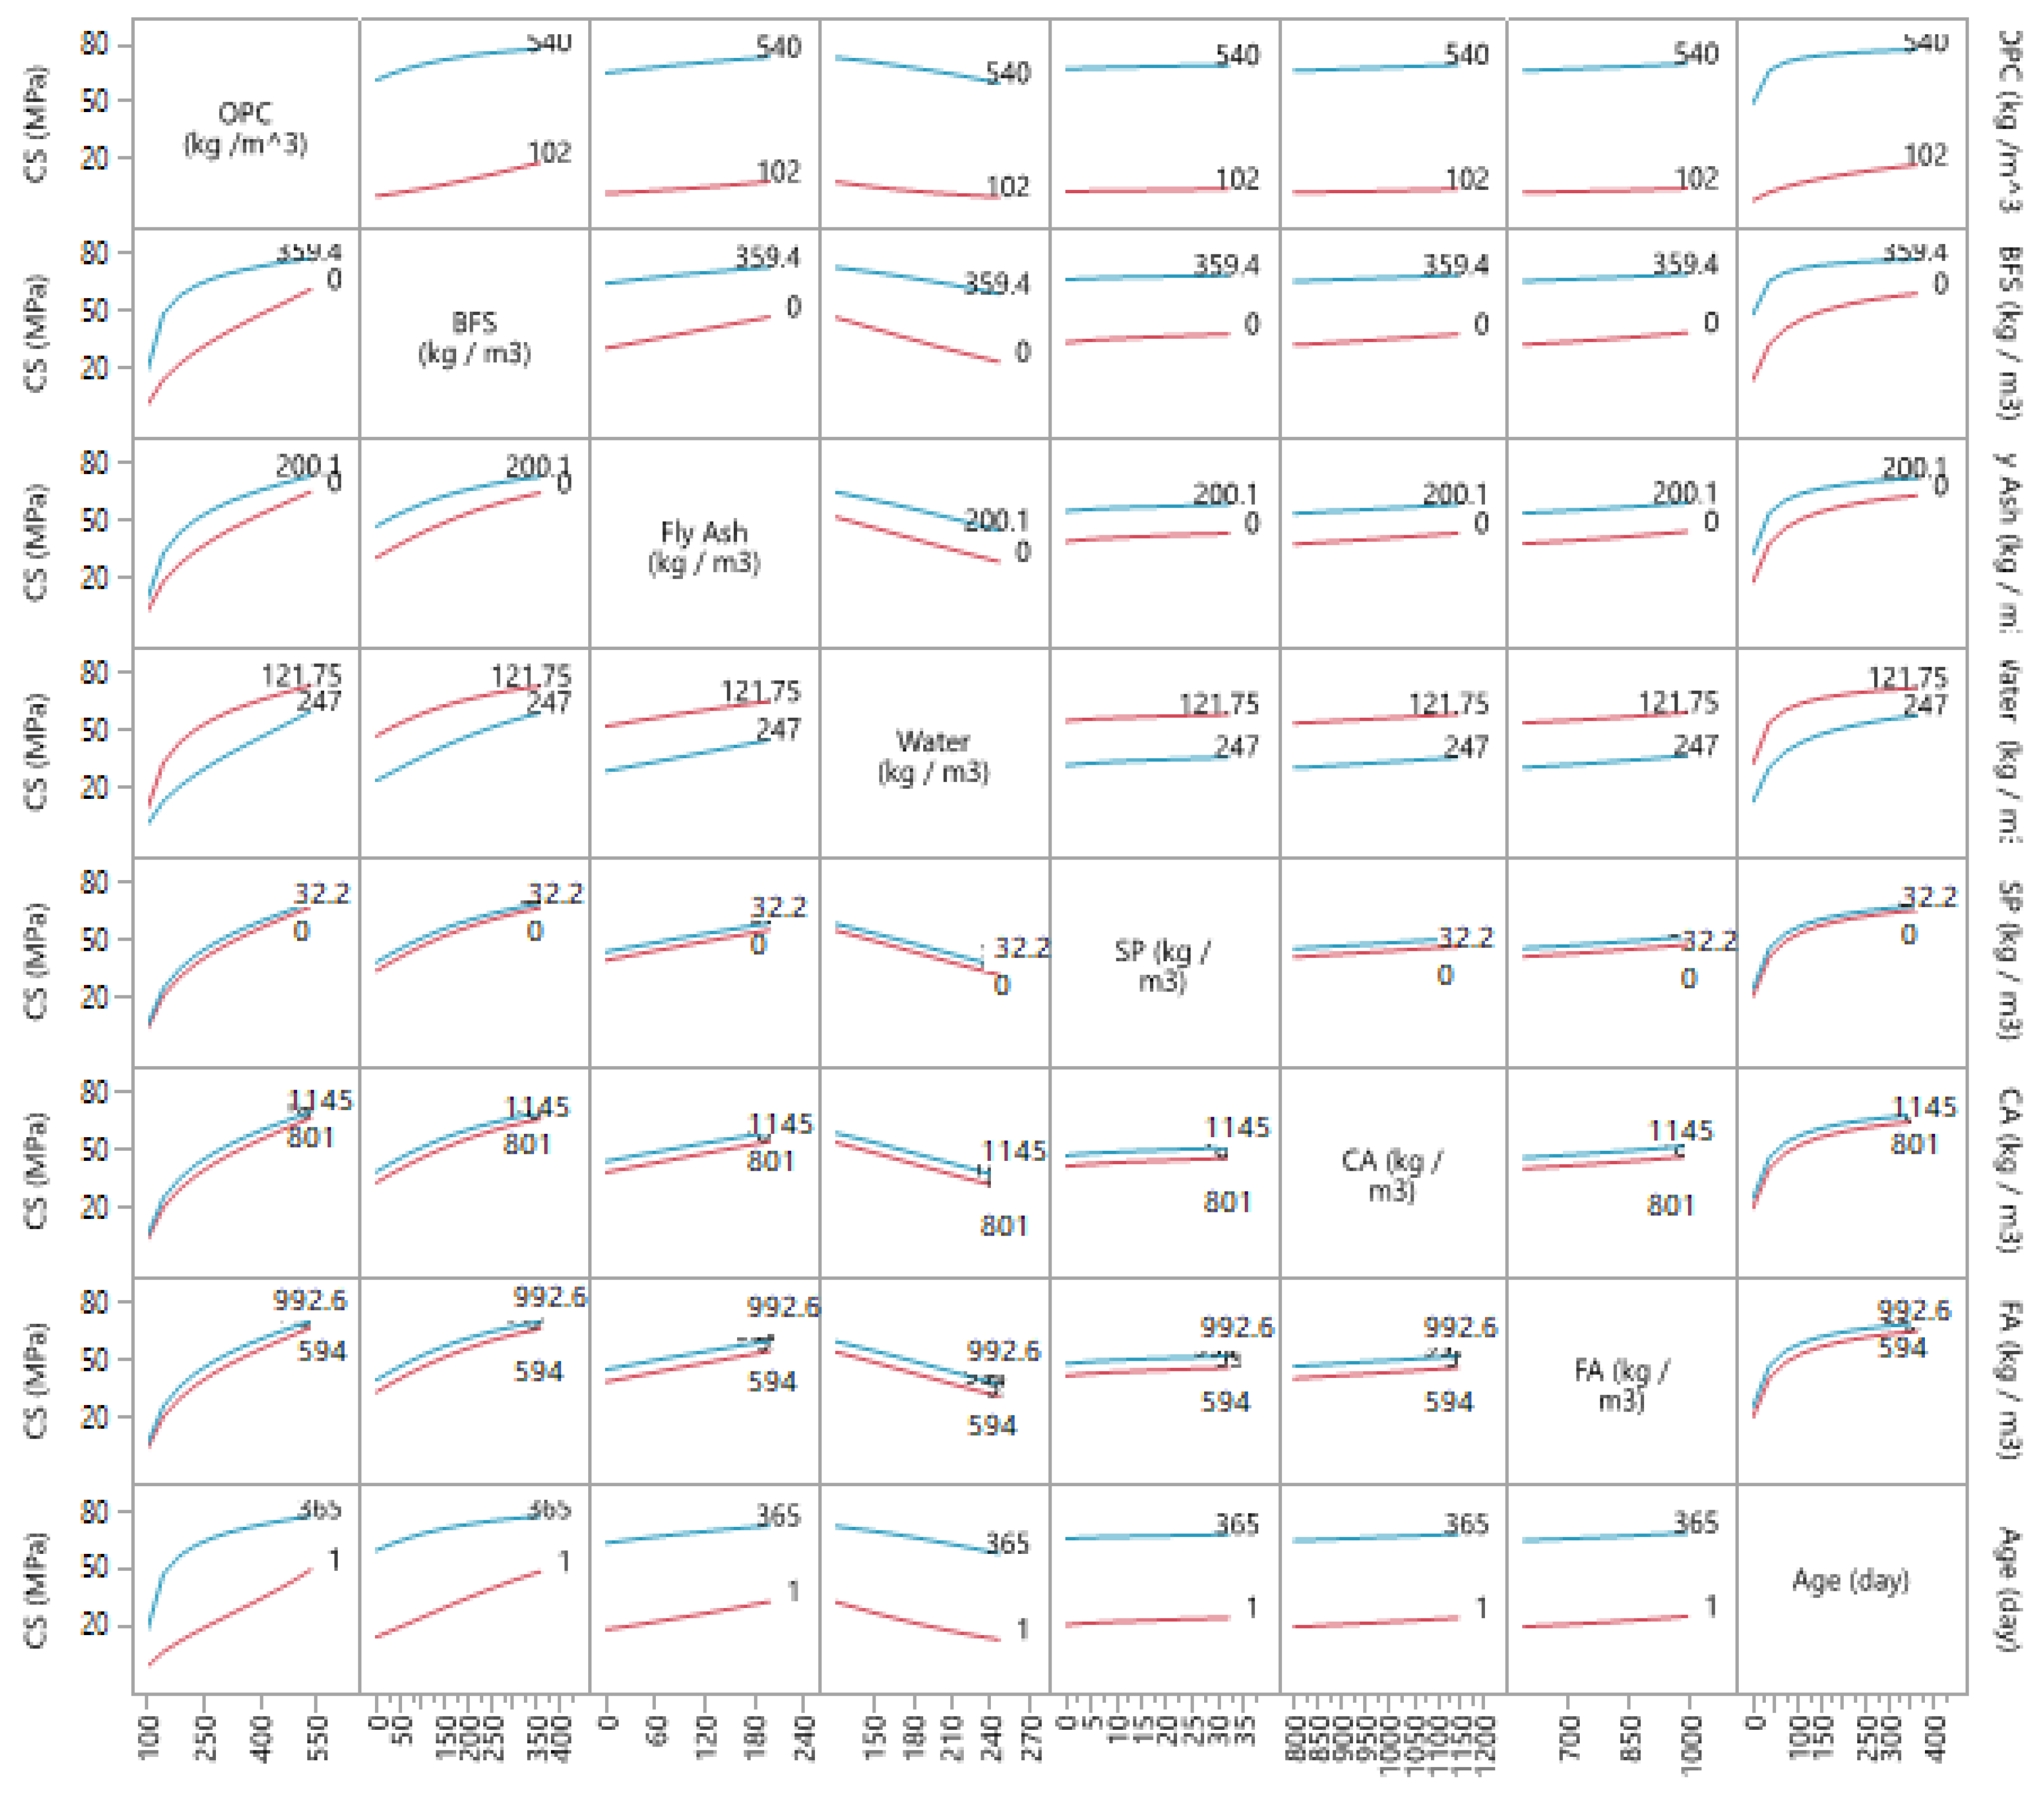
6.4. Interaction Profiler
6.5. Relative Variable Importance
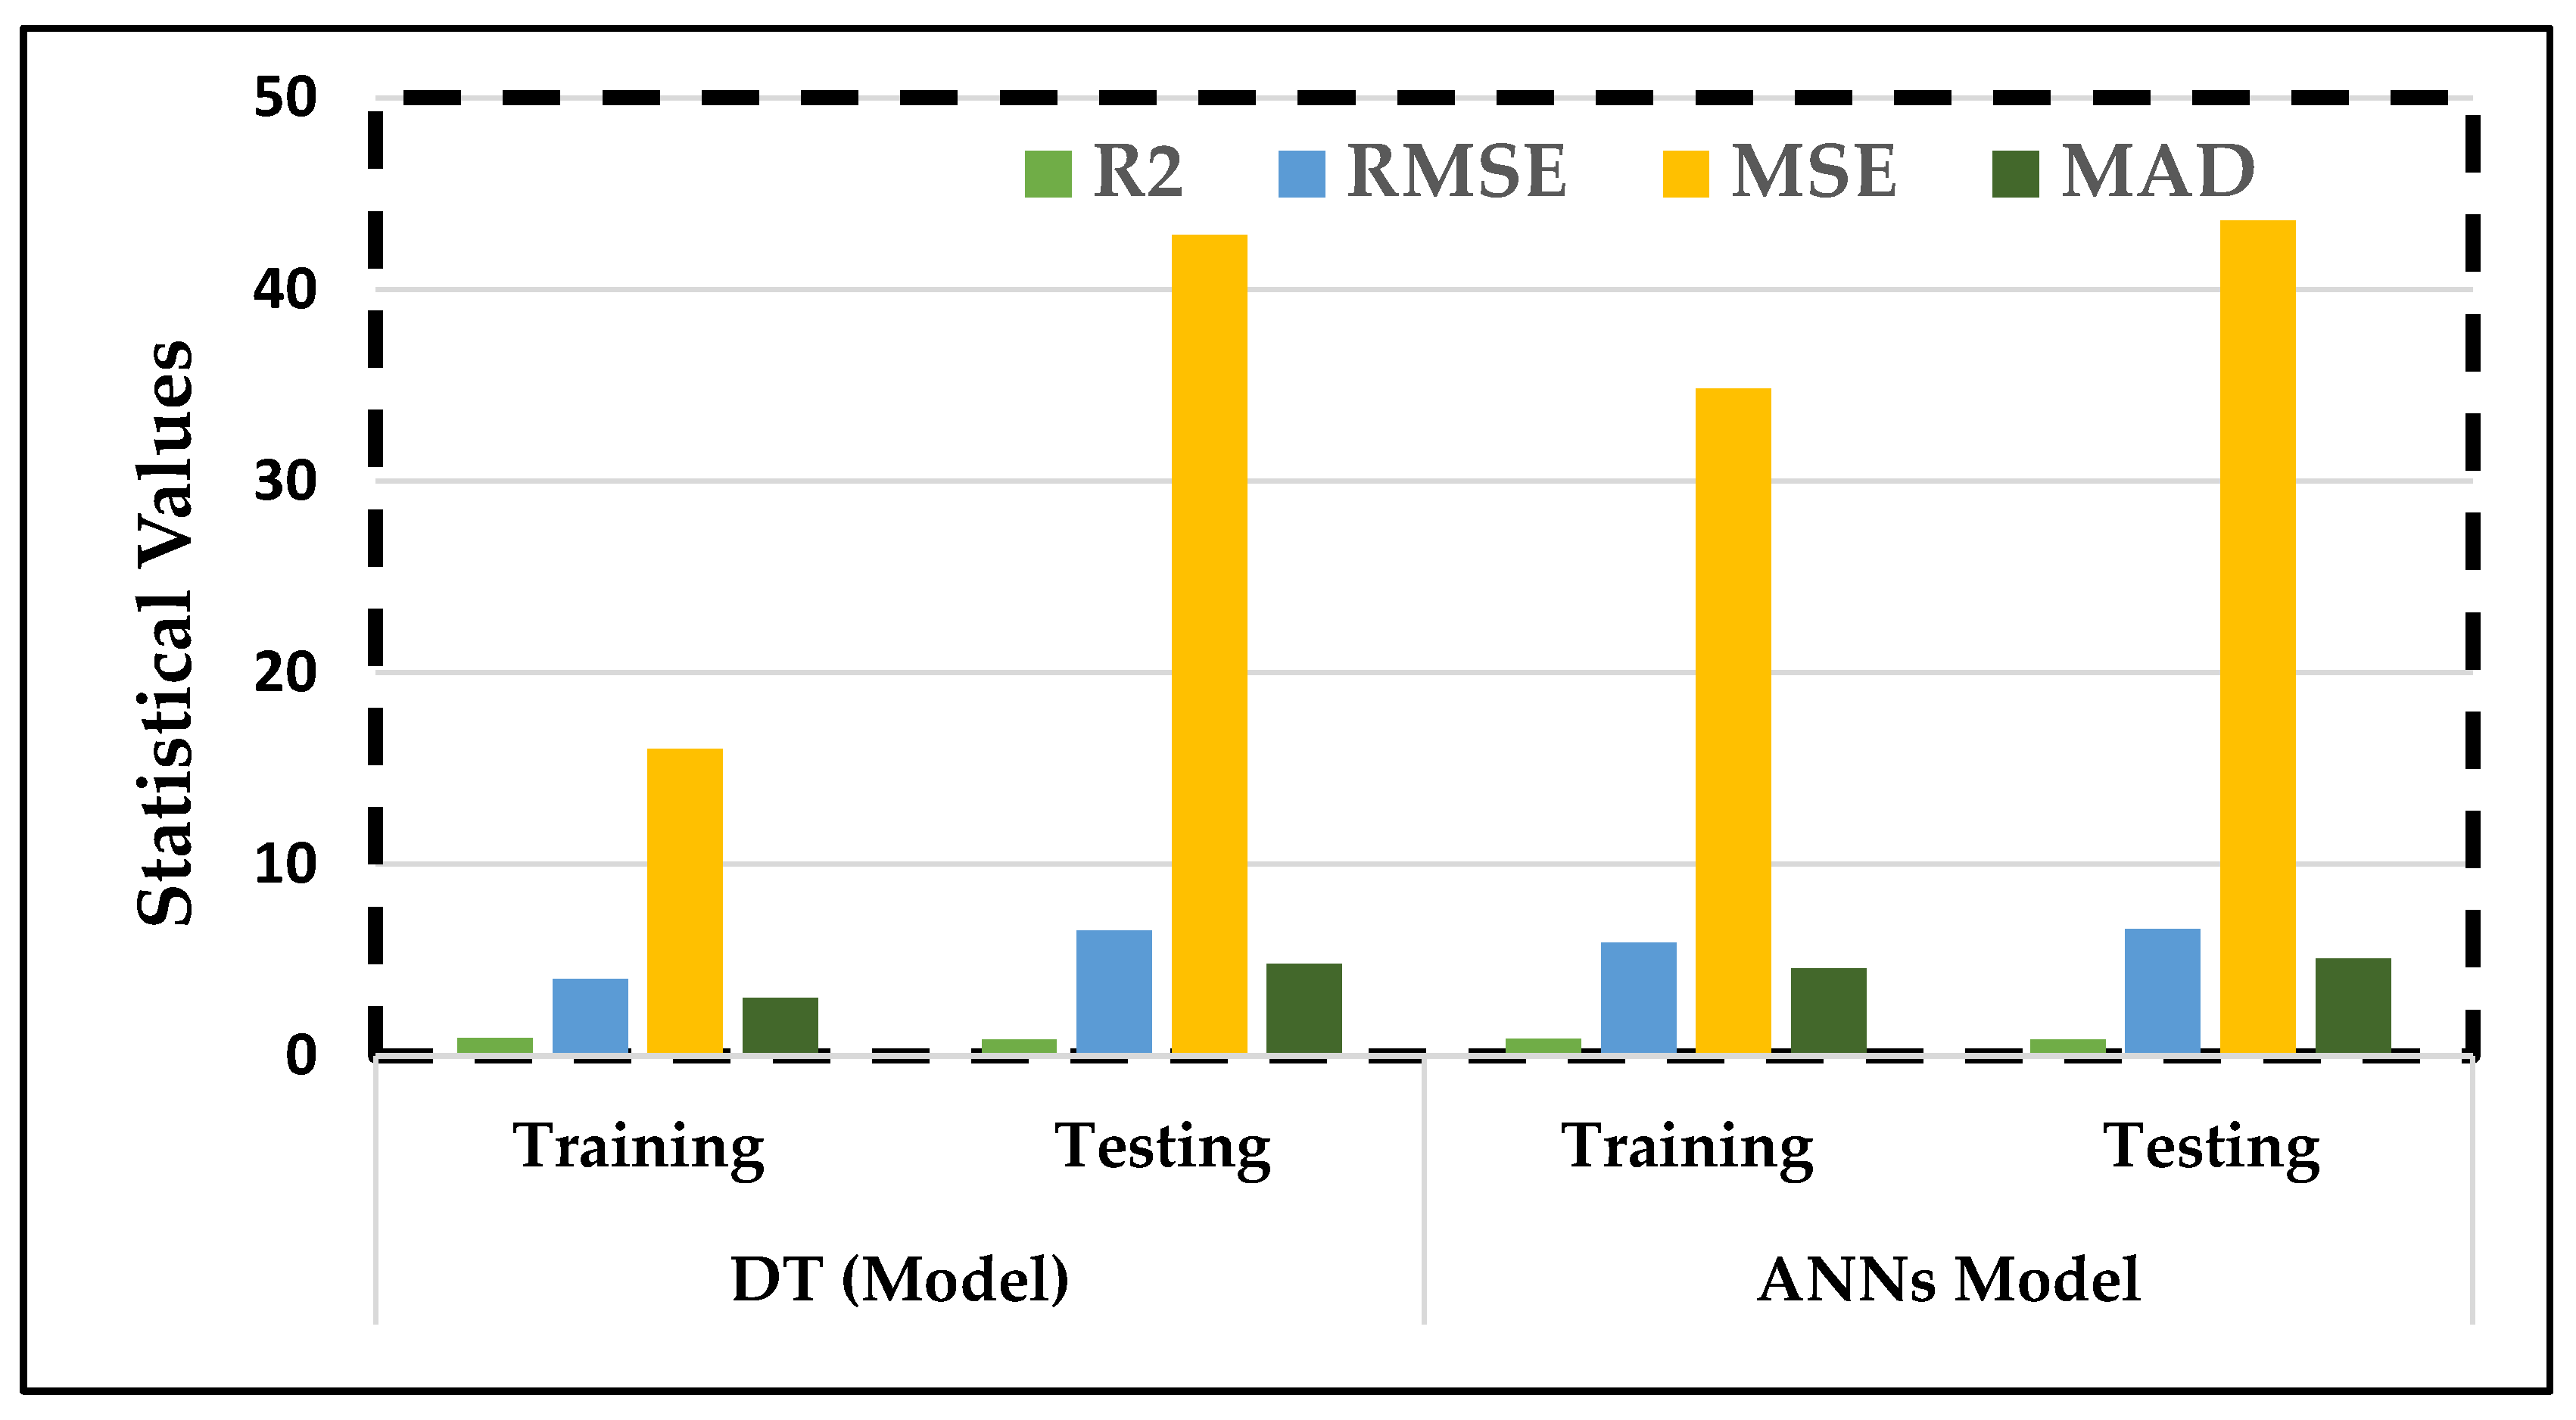
6.6. Comparative Analysis of Statistical Metrics and K-Fold
7. Limitations and Future Recommendations
8. Conclusions
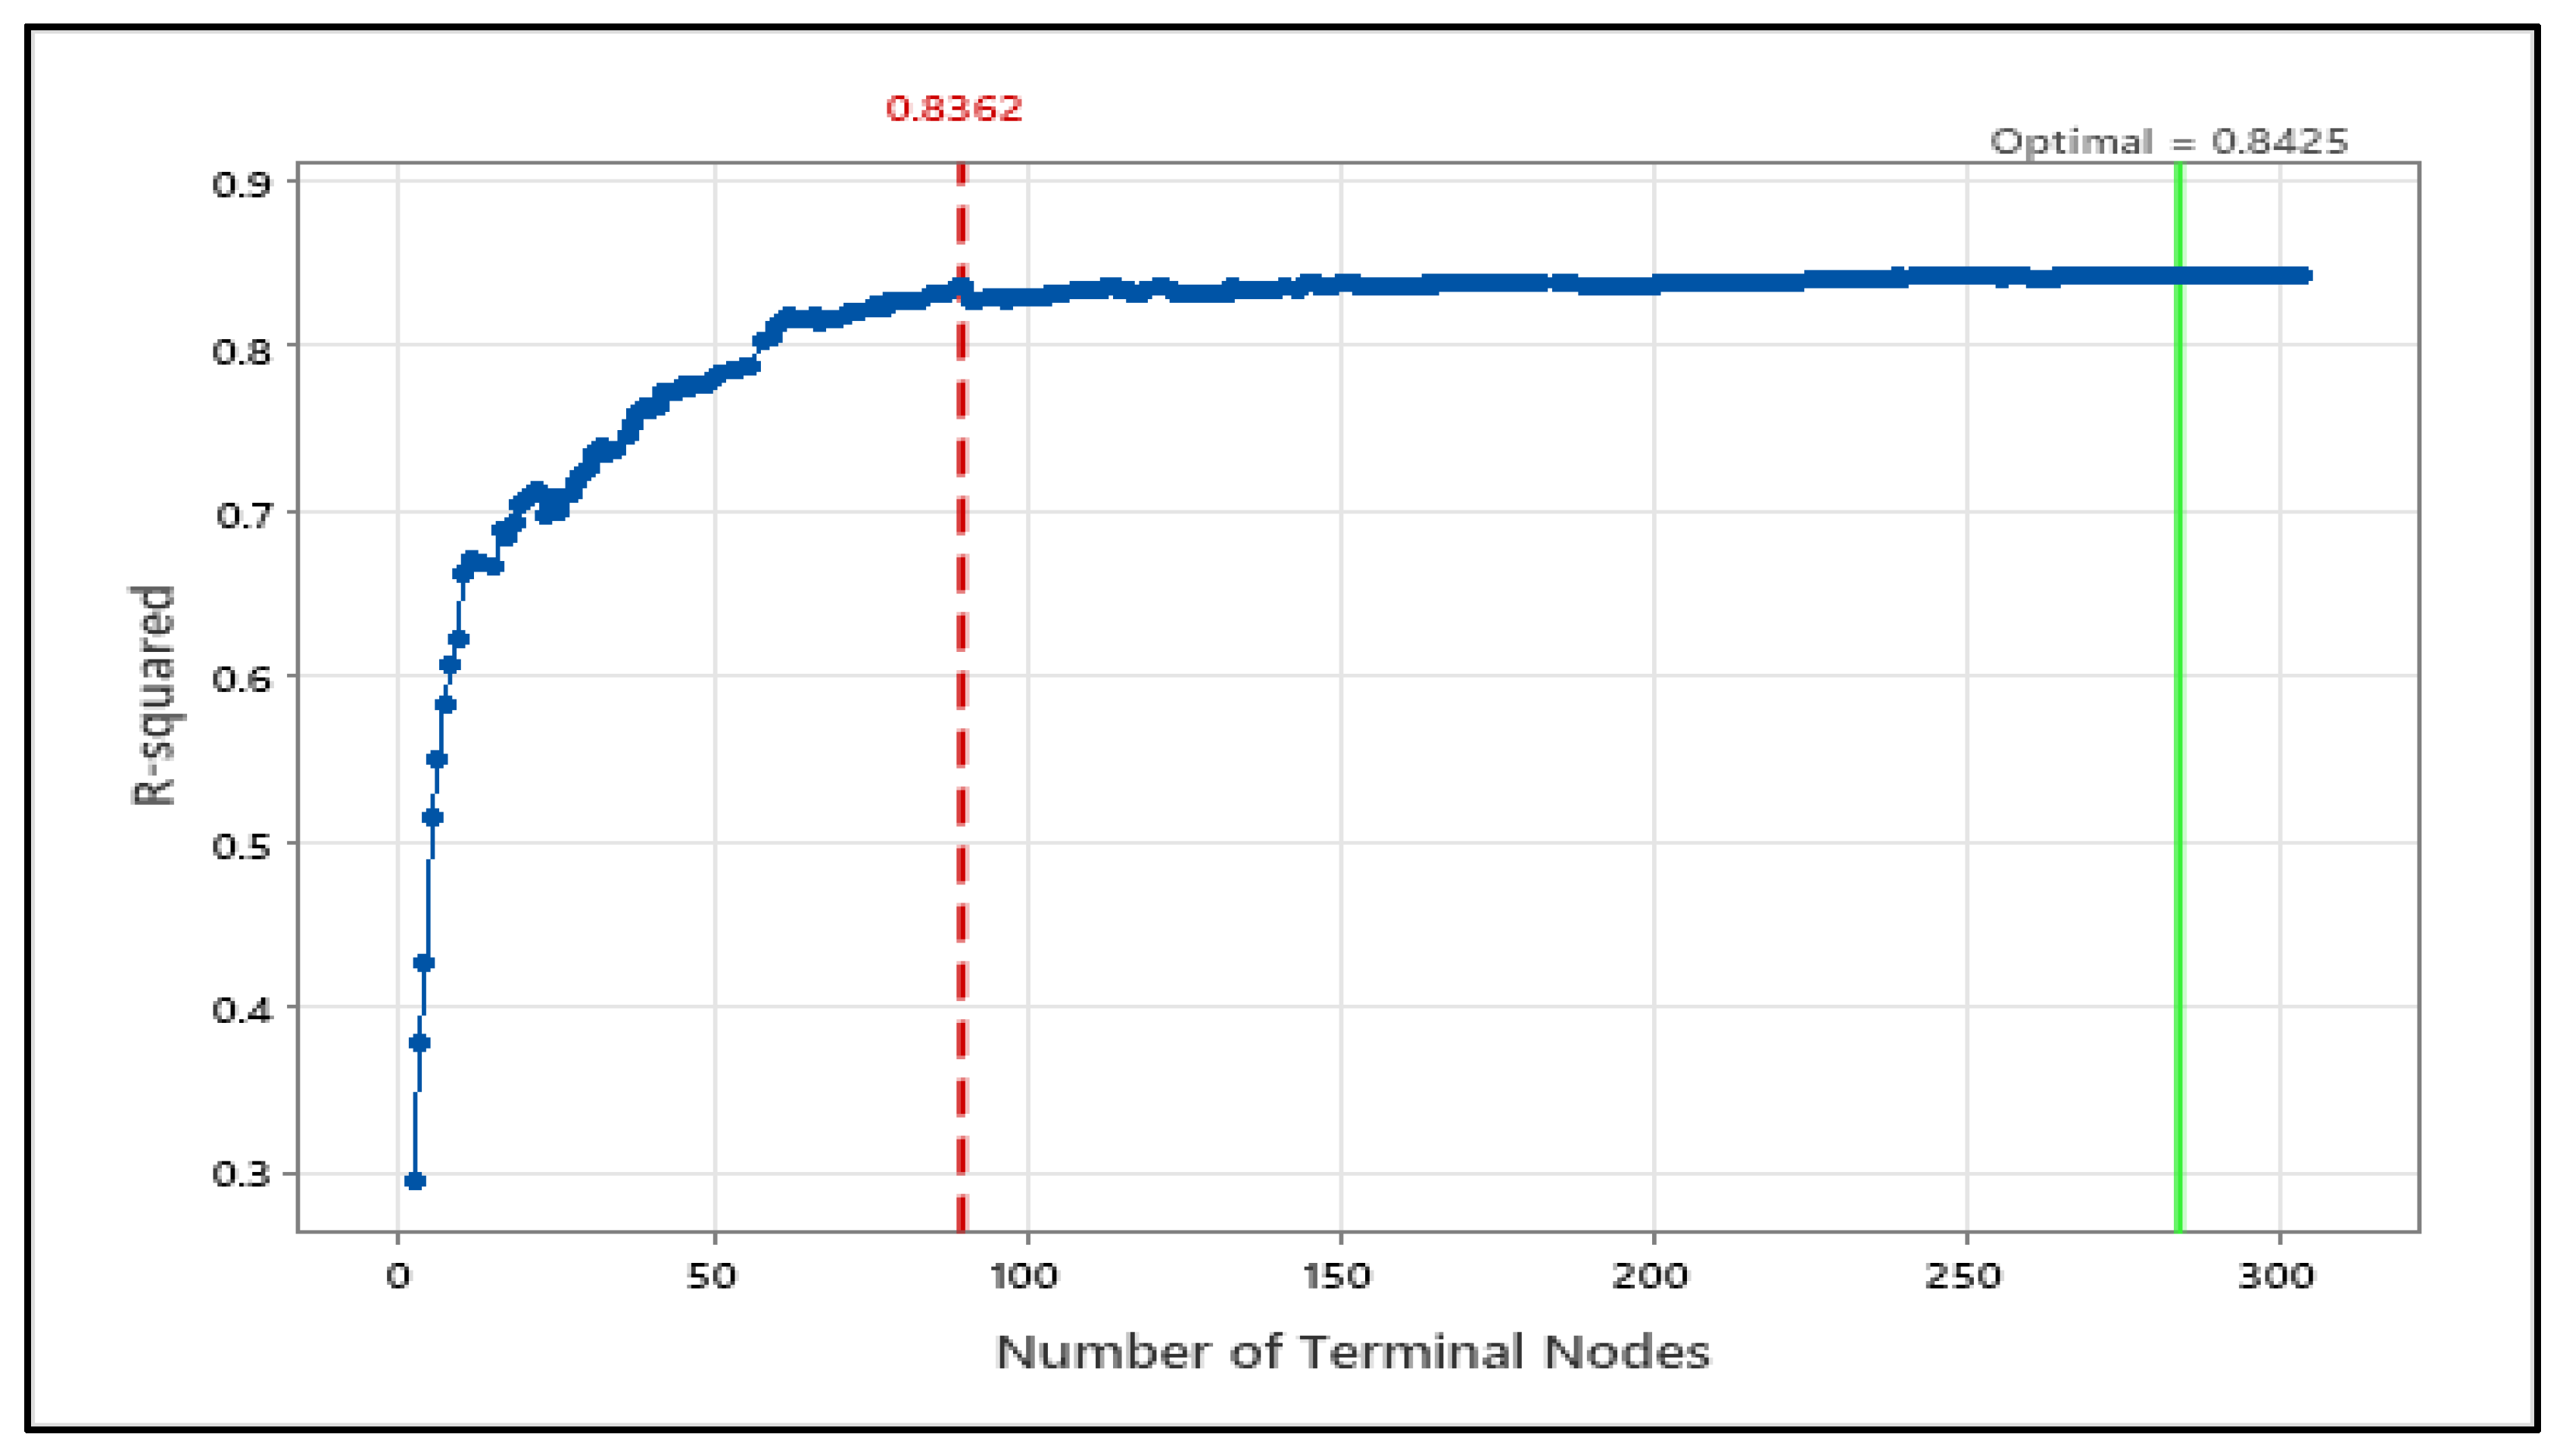
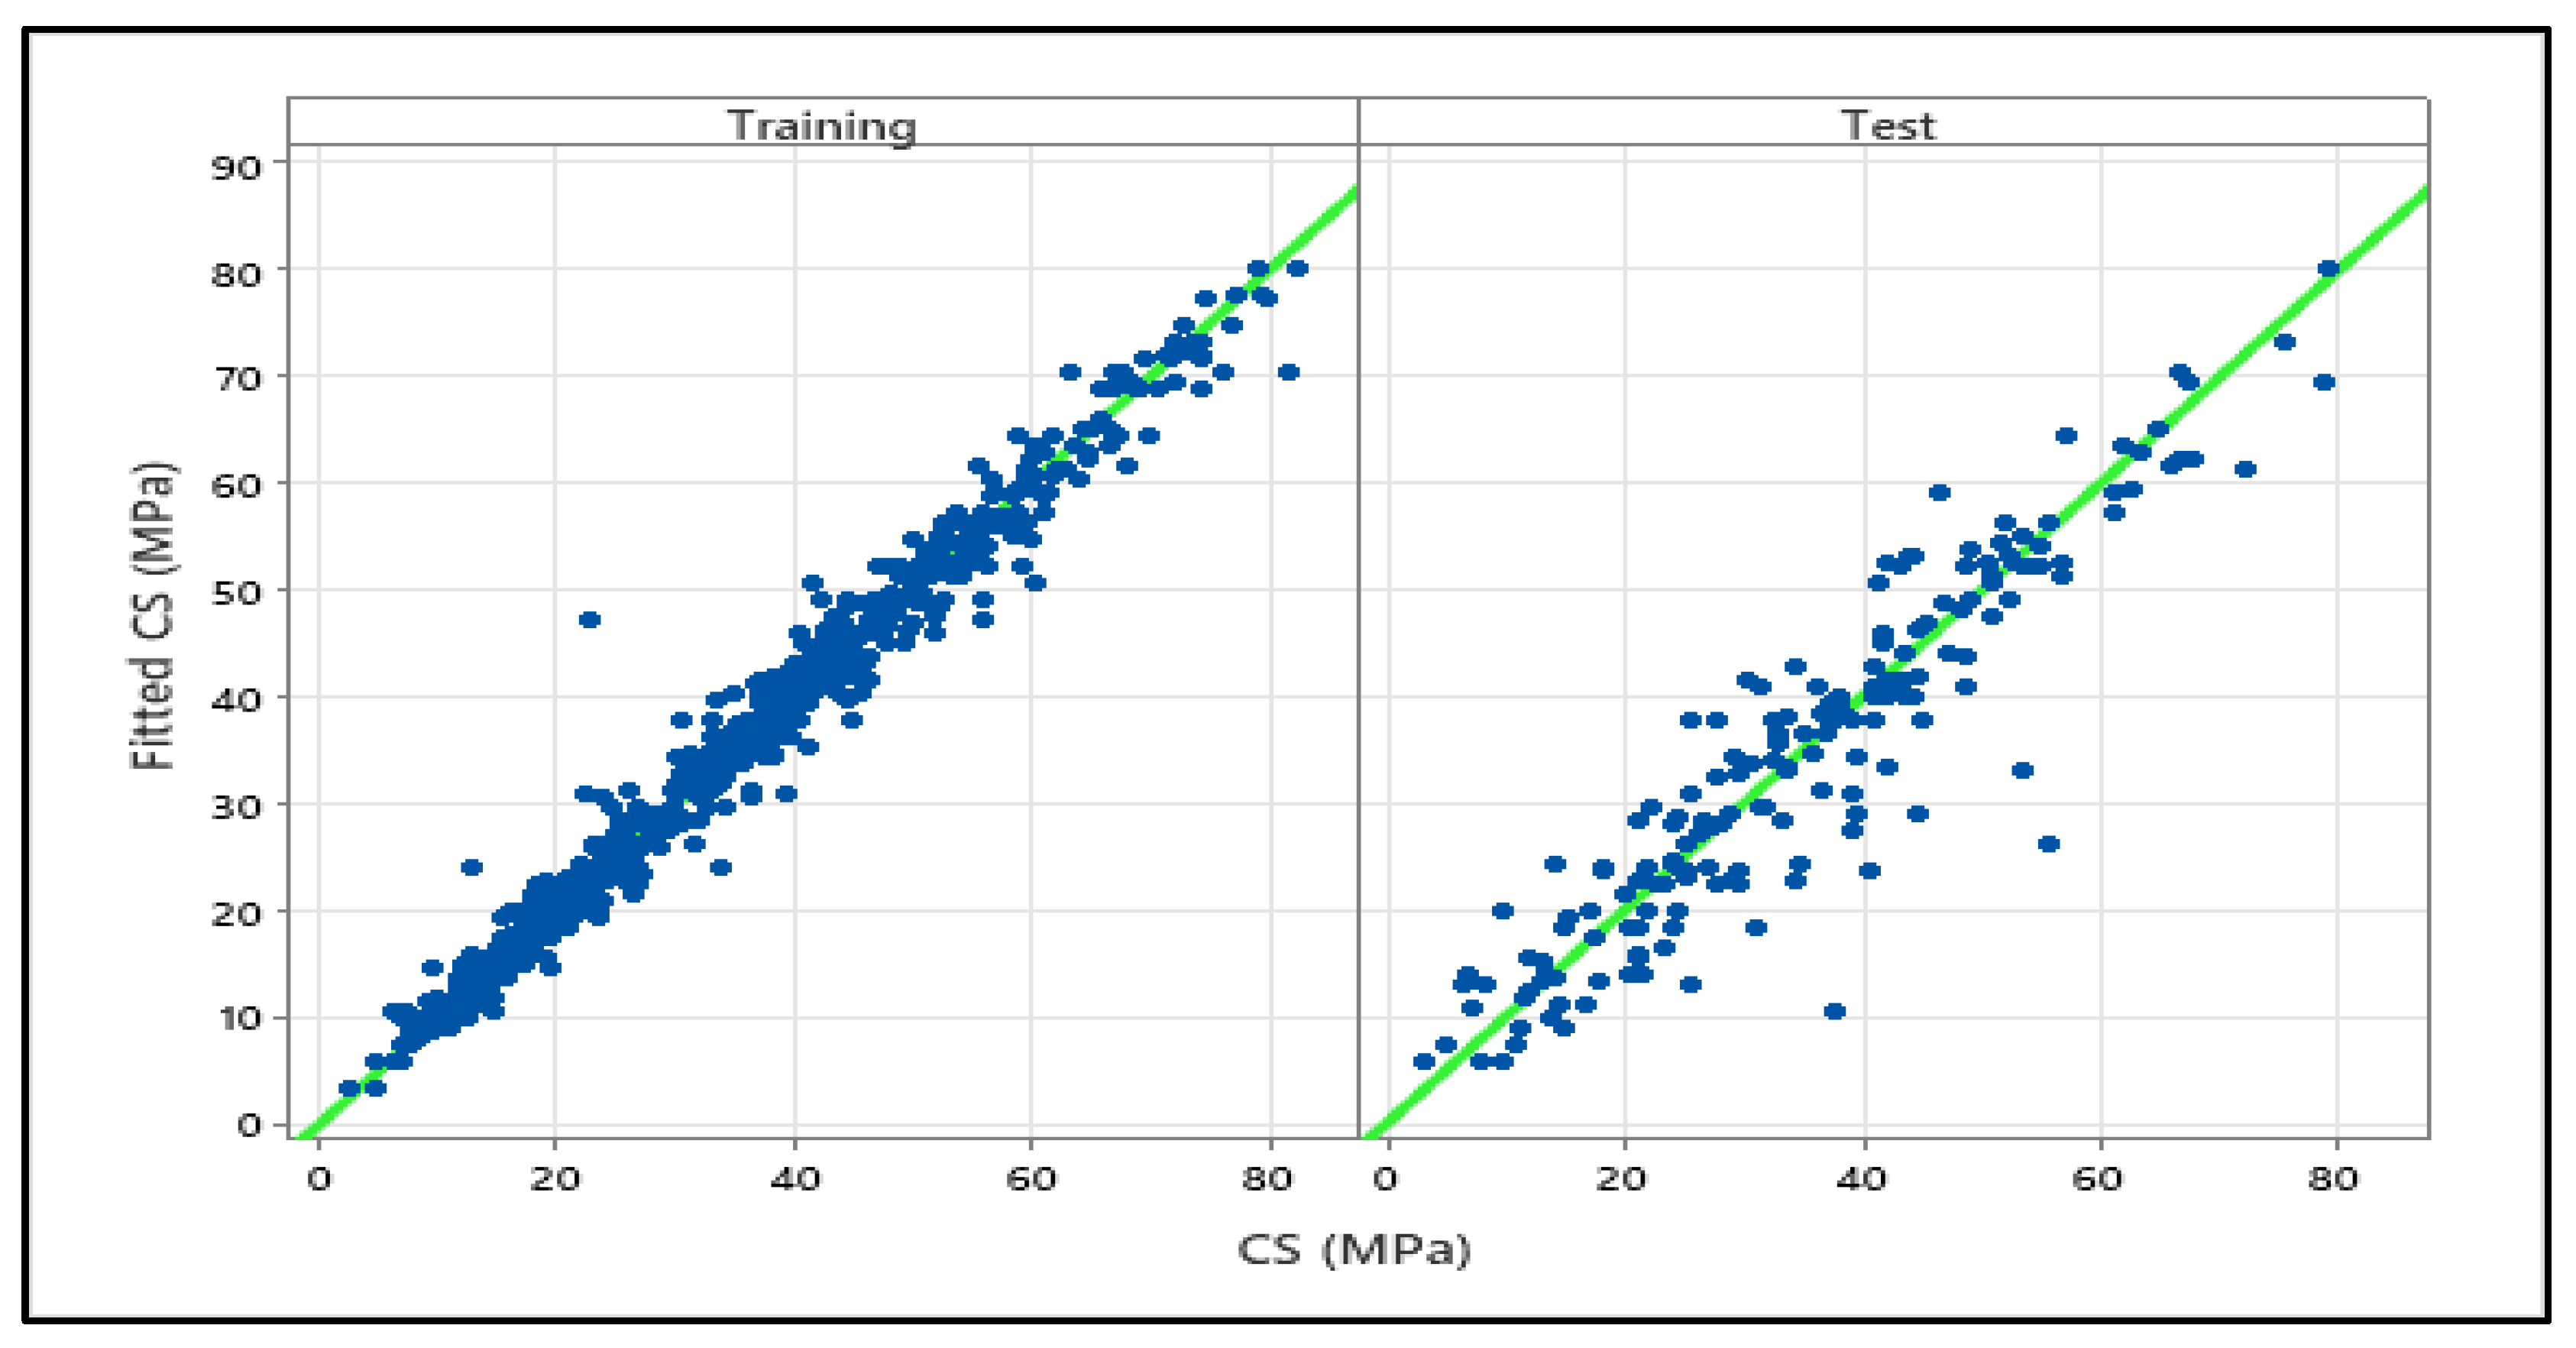
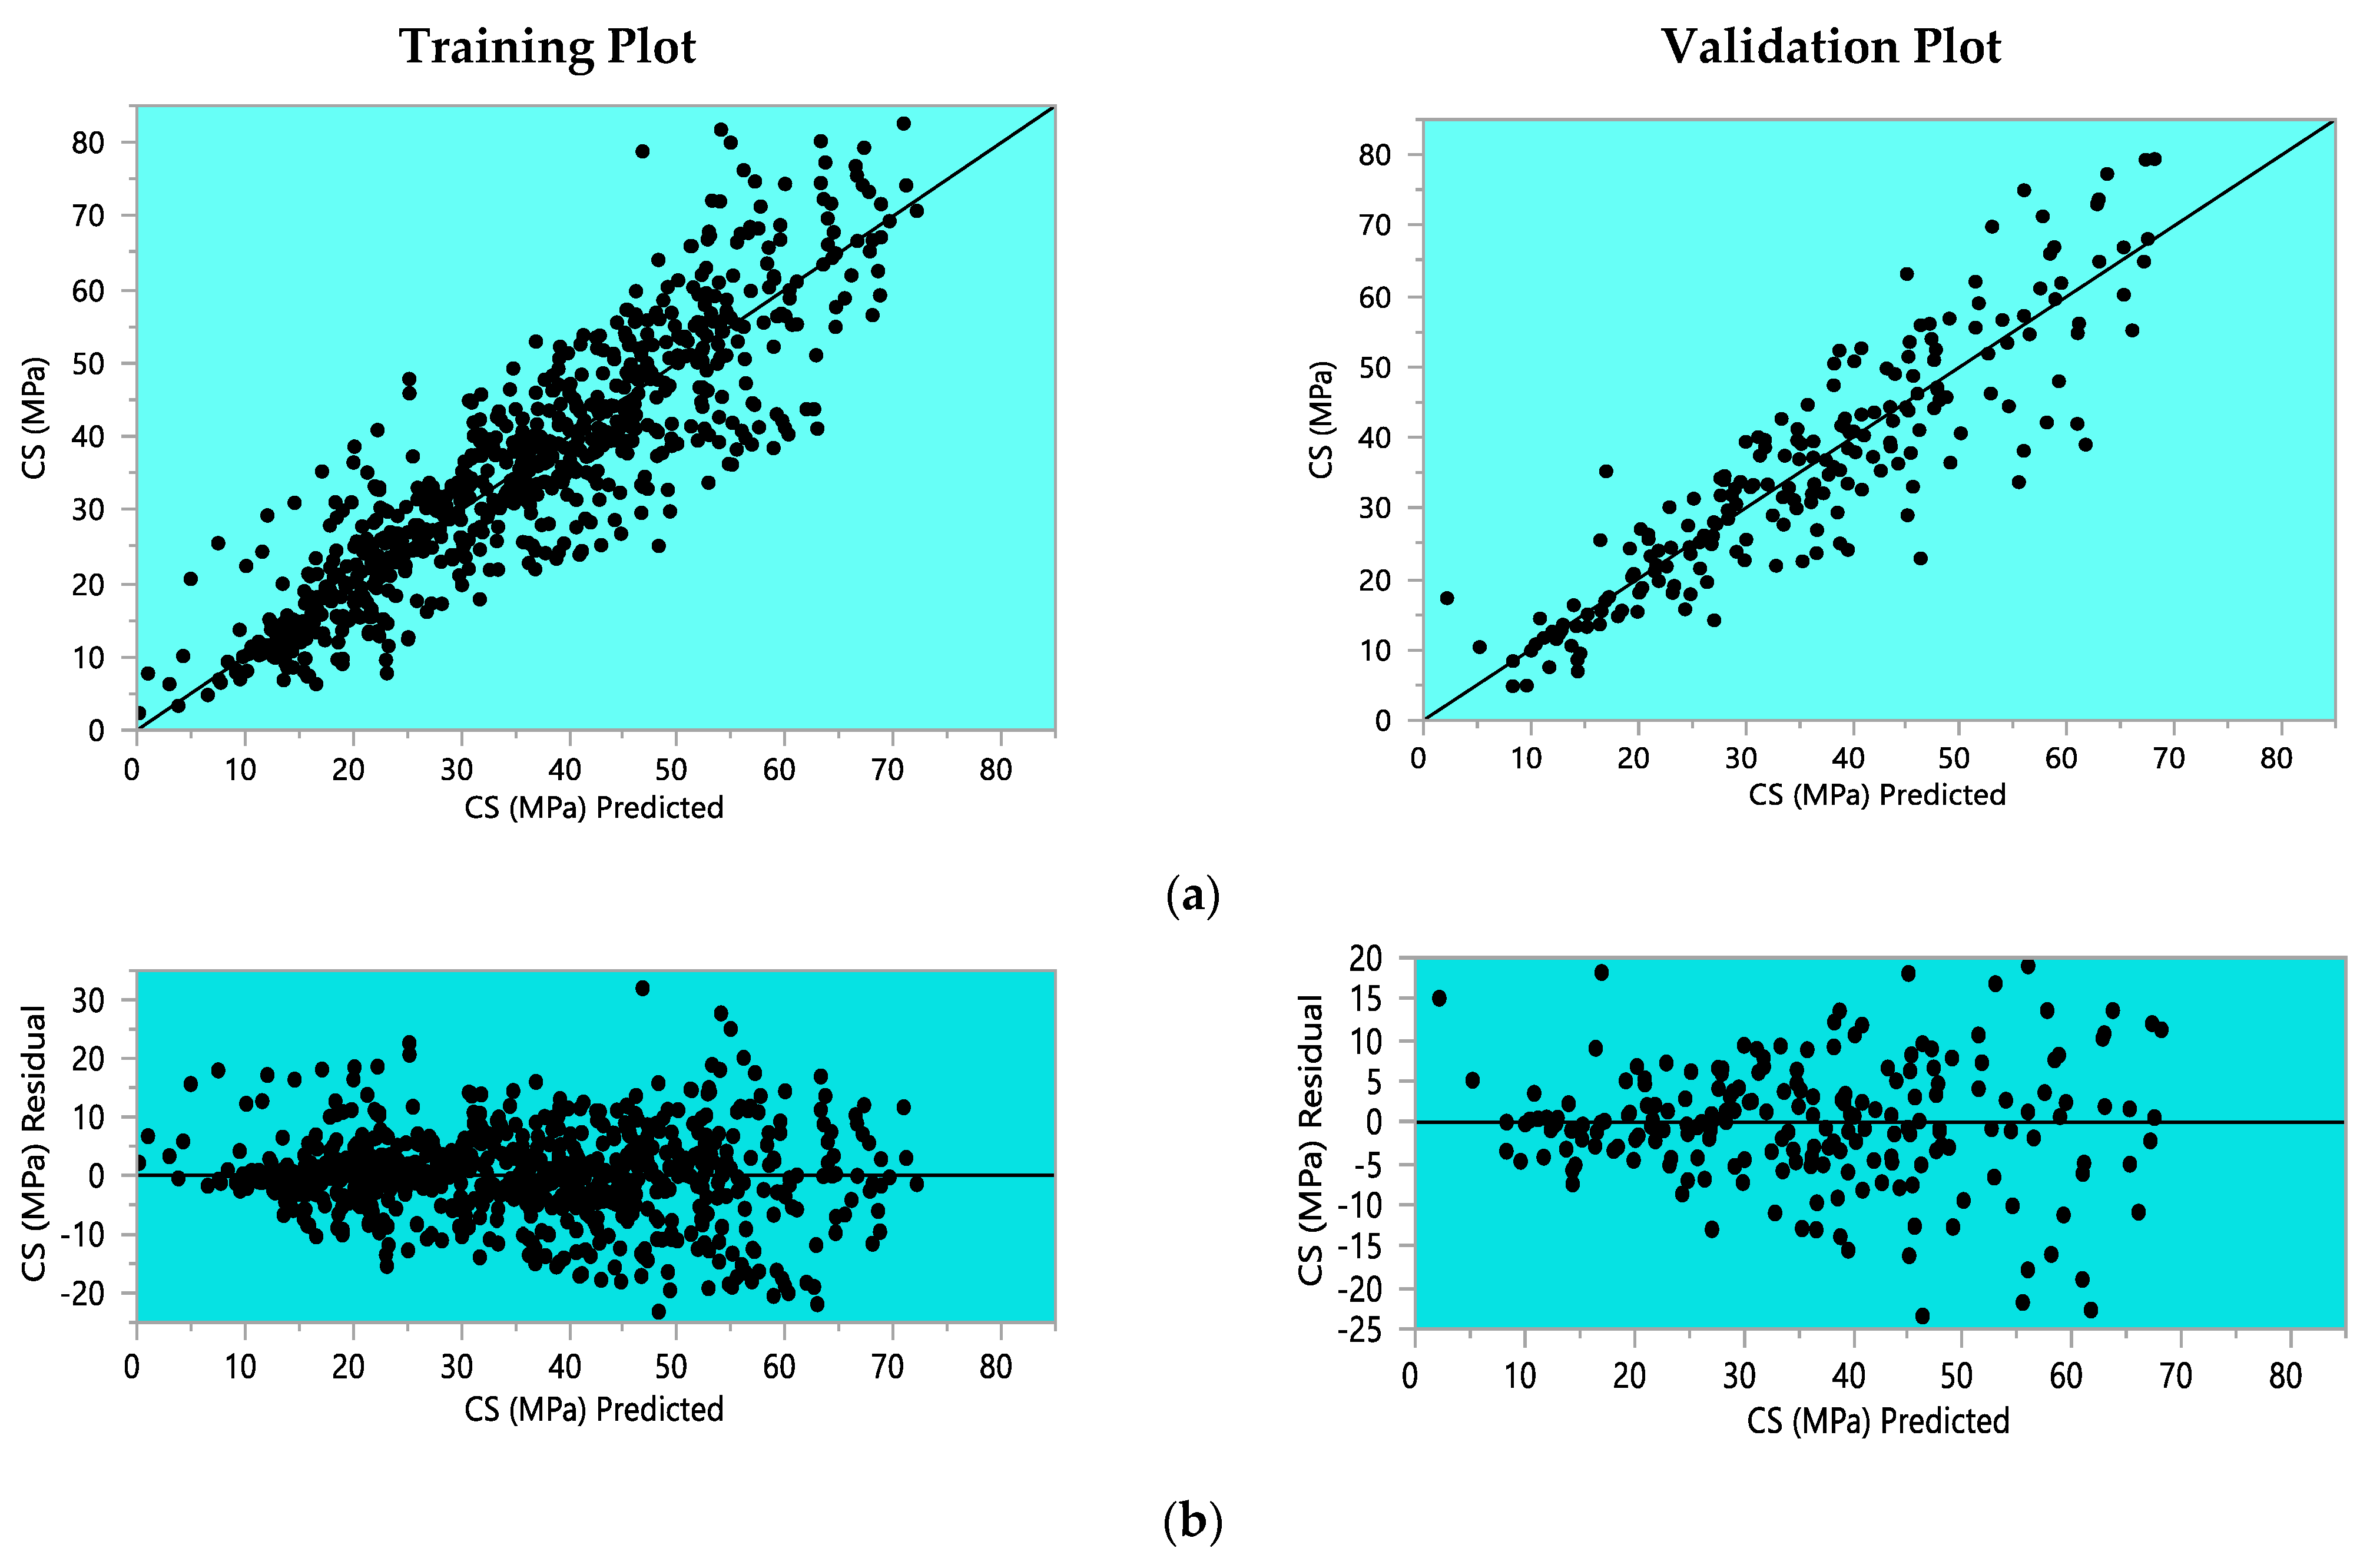
- The outcomes of individual ANNs and DT models showed a significant correlation between the predicted and actual values of CS with R2 values of 0.848 and 0.836, respectively, in testing of the model for the CS prediction. However, the R2 values of 0.873 and 0.943 were attained during the training phase of both models.
- The increased R2 values and reduced RMSE and MAD showed the higher precision and accuracy of both predictive models. These statistical measures showed satisfactory outcomes for both models, i.e., ANNs and decision tree.
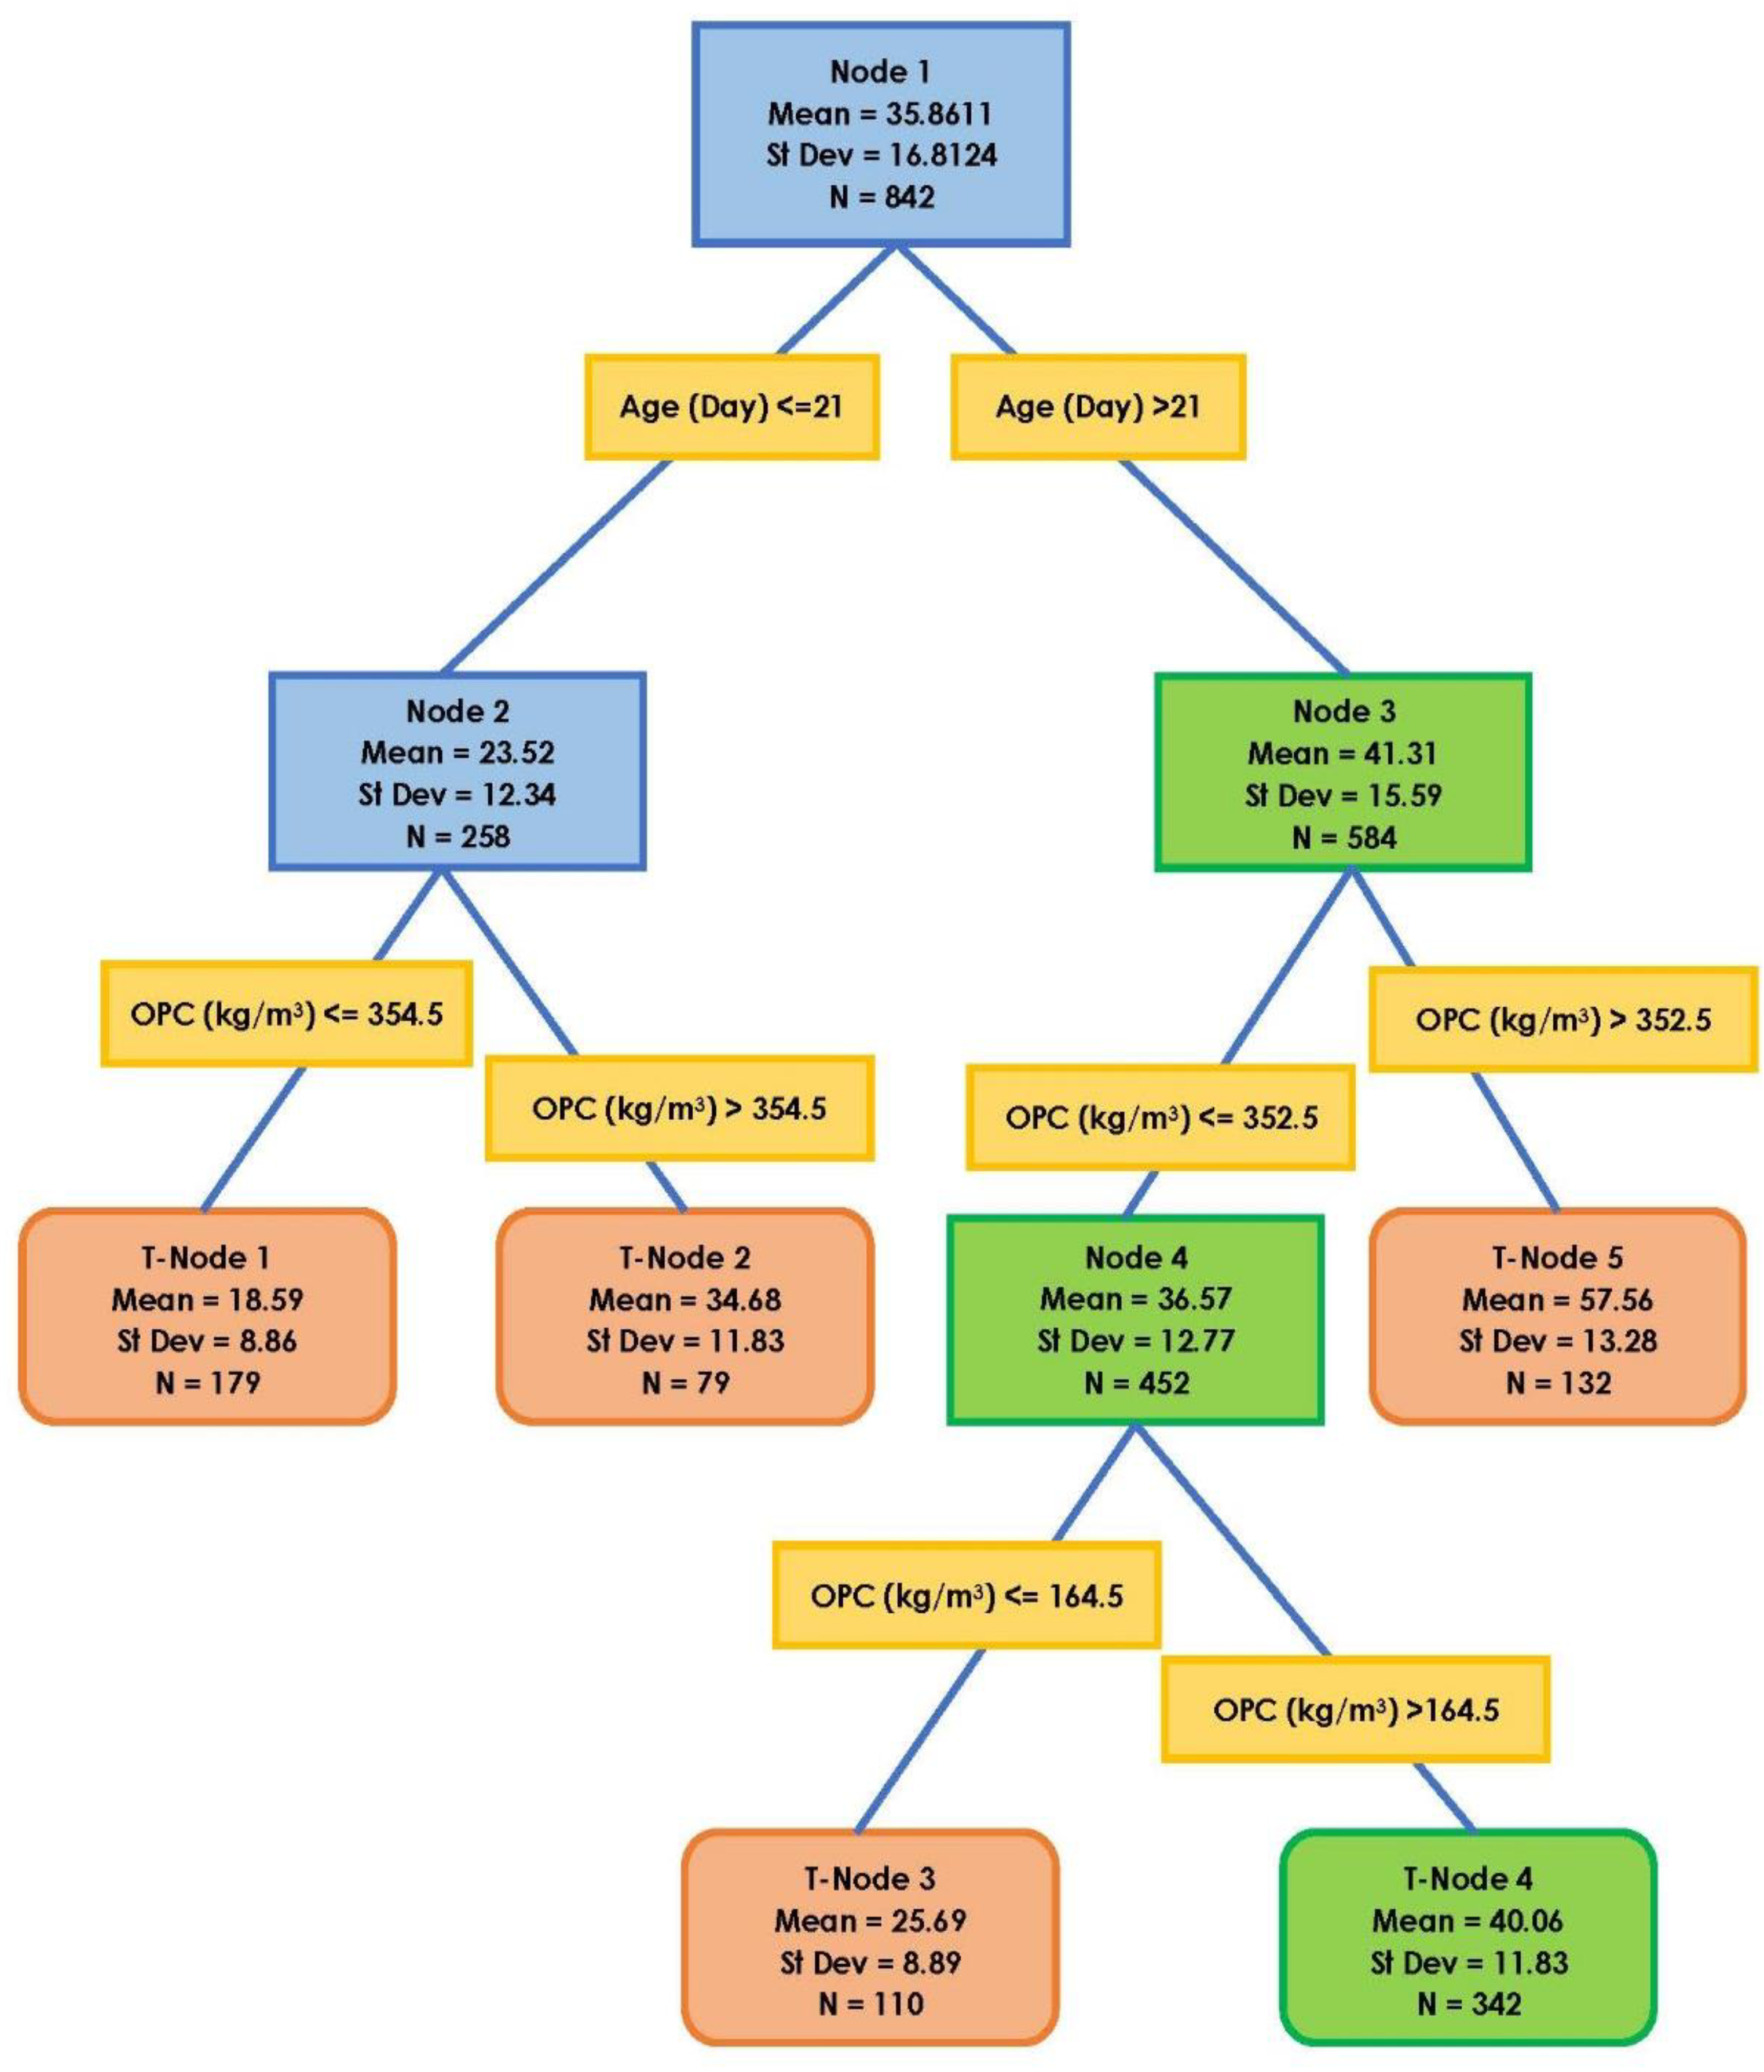
- Sensitivity analysis demonstrated that OPC (kg/m3), Age (curing) and water content are the key factors in the creation of a model for the CS of concrete. However, other factors such as Fly Ash and fine aggregates (FA) had the least effect on the CS in the created model.
- Decision tree and ANNs are types of supervised learning techniques which produced significant correlations between the predicted and observed values. The DT proved effective, according to the K-fold cross-validation technique, which was used to verify the prediction performance.
- The precise formulations and models will help to promote the utilization of waste materials such as SFG and Fly Ash instead of dumping as industrial waste for future construction works. This research provides a long-term sustainability by reducing energy use, disposal waste, and carbon emissions.
Author Contributions
Funding
Institutional Review Board Statement
Informed Consent Statement
Data Availability Statement
Acknowledgments
Conflicts of Interest
References
- Xiao, H.; Duan, Z.; Zhou, Y.; Zhang, N.; Shan, Y.; Lin, X.; Liu, G. CO2 emission patterns in shrinking and growing cities: A case study of Northeast China and the Yangtze River Delta. Appl. Energy 2019, 251, 113384. [Google Scholar] [CrossRef]
- Yan, H.; Shen, Q.; Fan, L.C.; Wang, Y.; Zhang, L. Greenhouse gas emissions in building construction: A case study of One Peking in Hong Kong. Build. Environ. 2010, 45, 949–955. [Google Scholar] [CrossRef] [Green Version]
- Benhelal, E.; Zahedi, G.; Shamsaei, E.; Bahadori, A. Global strategies and potentials to curb CO2 emissions in cement industry. J. Clean. Prod. 2013, 51, 142–161. [Google Scholar] [CrossRef]
- Behnood, A.; Golafshani, E.M. Predicting the compressive strength of silica fume concrete using hybrid artificial neural network with multi-objective grey wolves. J. Clean. Prod. 2018, 202, 54–64. [Google Scholar] [CrossRef]
- Cheng, A.; Huang, R.; Wu, J.-K.; Chen, C.-H. Influence of GGBS on durability and corrosion behavior of reinforced concrete. Mater. Chem. Phys. 2005, 93, 404–411. [Google Scholar] [CrossRef]
- Özbay, E.; Erdemir, M.; Durmuş, H.I. Utilization and efficiency of ground granulated blast furnace slag on concrete properties—A review. Constr. Build. Mater. 2016, 105, 423–434. [Google Scholar] [CrossRef]
- Song, H.-W.; Saraswathy, V. Studies on the corrosion resistance of reinforced steel in concrete with ground granulated blast-furnace slag—An overview. J. Hazard. Mater. 2006, 138, 226–233. [Google Scholar] [CrossRef] [PubMed]
- Mai, H.-V.T.; Nguyen, T.-A.; Ly, H.-B.; Tran, V.Q. Investigation of ANN Model Containing One Hidden Layer for Predicting Compressive Strength of Concrete with Blast-Furnace Slag and Fly Ash. Adv. Mater. Sci. Eng. 2021, 2021, 5540853. [Google Scholar] [CrossRef]
- Oner, A.; Akyuz, S. An experimental study on optimum usage of GGBS for the compressive strength of concrete. Cem. Concr. Compos. 2007, 29, 505–514. [Google Scholar] [CrossRef]
- Shariq, M.; Prasad, J.; Masood, A. Effect of GGBFS on time dependent compressive strength of concrete. Constr. Build. Mater. 2010, 24, 1469–1478. [Google Scholar] [CrossRef]
- Siddique, R.; Kaur, D. Properties of concrete containing ground granulated blast furnace slag (GGBFS) at elevated temperatures. J. Adv. Res. 2012, 3, 45–51. [Google Scholar] [CrossRef] [Green Version]
- Tüfekçi, M.M.; Çakır, Ö. An Investigation on Mechanical and Physical Properties of Recycled Coarse Aggregate (RCA) Concrete with GGBFS. Int. J. Civ. Eng. 2017, 15, 549–563. [Google Scholar] [CrossRef]
- Majhi, R.K.; Nayak, A.N.; Mukharjee, B.B. Development of sustainable concrete using recycled coarse aggregate and ground granulated blast furnace slag. Constr. Build. Mater. 2018, 159, 417–430. [Google Scholar] [CrossRef]
- Gehlot, T.; Sankhla, S.S.; Parihar, S. Modelling compressive strength, flexural strength and chloride ion permeability of high strength concrete incorporating metakaolin and fly ash. Mater. Today Proc. 2021, in press. [Google Scholar] [CrossRef]
- Li, Q.; Zhang, Q. Experimental study on the compressive strength and shrinkage of concrete containing fly ash and ground granulated blast-furnace slag. Struct. Concr. 2019, 20, 1551–1560. [Google Scholar] [CrossRef]
- Dao, D.V.; Ly, H.-B.; Vu, H.-L.T.; Le, T.-T.; Pham, B.T. Investigation and optimization of the C-ANN structure in predicting the compressive strength of foamed concrete. Materials 2020, 13, 1072. [Google Scholar] [CrossRef] [PubMed] [Green Version]
- Pham, B.T.; Nguyen, M.D.; Ly, H.-B.; Pham, T.A.; Hoang, V.; Van Le, H.; Le, T.-T.; Nguyen, H.Q.; Bui, G.L. Development of Artificial Neural Networks for Prediction of Compression Coefficient of Soft Soil. In CIGOS 2019, Innovation for Sustainable Infrastructure; Ha-Minh, C., Dao, D.V., Benboudjema, F., Derrible, S., Huynh, D.V.K., Tang, A.M., Eds.; Springer: Singapore, 2020; Volume 54, pp. 1167–1172. [Google Scholar]
- Pham, B.T.; Nguyen-Thoi, T.; Ly, H.-B.; Nguyen, M.D.; Al-Ansari, N.; Tran, V.-Q.; Le, T.-T. Extreme Learning Machine Based Prediction of Soil Shear Strength: A Sensitivity Analysis Using Monte Carlo Simulations and Feature Backward Elimination. Sustainability 2020, 12, 2339. [Google Scholar] [CrossRef] [Green Version]
- Ly, H.-B.; Pham, B.T.; Le, L.M.; Le, T.-T.; Le, V.M.; Asteris, P.G. Estimation of axial load-carrying capacity of concrete-filled steel tubes using surrogate models. Neural Comput. Appl. 2020, 33, 3437–3458. [Google Scholar] [CrossRef]
- Ly, H.-B.; Le, T.-T.; Vu, H.-L.T.; Tran, V.Q.; Le, L.M.; Pham, B.T. Computational Hybrid Machine Learning Based Prediction of Shear Capacity for Steel Fiber Reinforced Concrete Beams. Sustainability 2020, 12, 2709. [Google Scholar] [CrossRef] [Green Version]
- Asteris, P.G.; Armaghani, D.J.; Hatzigeorgiou, G.D.; Karayannis, C.G.; Pilakoutas, K. Predicting the shear strength of reinforced concrete beams using Artificial Neural Networks. Comput. Concr. Int. J. 2019, 24, 469–488. [Google Scholar]
- Naderpour, H.; Poursaeidi, O.; Ahmadi, M. Shear resistance prediction of concrete beams reinforced by FRP bars using artificial neural networks. Measurement 2018, 126, 299–308. [Google Scholar] [CrossRef]
- Jiang, G.; Keller, J.; Bond, P.L.; Yuan, Z. Predicting concrete corrosion of sewers using artificial neural network. Water Res. 2016, 92, 52–60. [Google Scholar] [CrossRef] [PubMed] [Green Version]
- Avila, C.; Shiraishi, Y.; Tsuji, Y. Crack width prediction of reinforced concrete structures by artificial neural networks. In Proceedings of the 7th Seminar on Neural Network Applications in Electrical Engineering, Belgrade, Serbia, 23–25 September 2004. [Google Scholar]
- Perera, R.; Barchín, M.; Arteaga, A.; De Diego, A. Prediction of the ultimate strength of reinforced concrete beams FRP-strengthened in shear using neural networks. Compos. Part B Eng. 2010, 41, 287–298. [Google Scholar] [CrossRef]
- Khademi, F.; Jamal, S.M.; Deshpande, N.; Londhe, S. Predicting strength of recycled aggregate concrete using Artificial Neural Network, Adaptive Neuro-Fuzzy Inference System and Multiple Linear Regression. Int. J. Sustain. Built Environ. 2016, 5, 355–369. [Google Scholar] [CrossRef] [Green Version]
- Özcan, F.; Atiş, C.D.; Karahan, O.; Uncuoğlu, E.; Tanyildizi, H. Comparison of artificial neural network and fuzzy logic models for prediction of long-term compressive strength of silica fume concrete. Adv. Eng. Softw. 2009, 40, 856–863. [Google Scholar] [CrossRef]
- Kandiri, A.; Golafshani, E.M.; Behnood, A. Estimation of the compressive strength of concretes containing ground granulated blast furnace slag using hybridized multi-objective ANN and salp swarm algorithm. Constr. Build. Mater. 2020, 248, 118676. [Google Scholar] [CrossRef]
- Han, I.-J.; Yuan, T.-F.; Lee, J.-Y.; Yoon, Y.-S.; Kim, J.-H. Learned Prediction of Compressive Strength of GGBFS Concrete Using Hybrid Artificial Neural Network Models. Materials 2019, 12, 3708. [Google Scholar] [CrossRef] [Green Version]
- Pitroda, D. Prediction of strength for fly ash cement concrete through soft computing approaches. Int. J. Adv. Res. Eng. Sci. Manag. 2014, 1, 1–11. [Google Scholar]
- Feng, D.-C.; Liu, Z.-T.; Wang, X.-D.; Chen, Y.; Chang, J.-Q.; Wei, D.-F.; Jiang, Z.-M. Machine learning-based compressive strength prediction for concrete: An adaptive boosting approach. Constr. Build. Mater. 2019, 230, 117000. [Google Scholar] [CrossRef]
- Dao, D.V.; Ly, H.B.; Trinh, S.H.; Le, T.-T.; Pham, B.T. Artificial intelligence approaches for prediction of compressive strength of geopolymer concrete. Materials 2019, 12, 983. [Google Scholar] [CrossRef] [PubMed] [Green Version]
- Ahmadi, M.; Naderpour, H.; Kheyroddin, A. Utilization of artificial neural networks to prediction of the capacity of CCFT short columns subject to short term axial load. Arch. Civ. Mech. Eng. 2014, 14, 510–517. [Google Scholar] [CrossRef]
- Cachim, P.B. Using artificial neural networks for calculation of temperatures in timber under fire loading. Constr. Build. Mater. 2011, 25, 4175–4180. [Google Scholar] [CrossRef]
- Bilim, C.; Atis, C.; Tanyildizi, H.; Karahan, O. Predicting the compressive strength of ground granulated blast furnace slag concrete using artificial neural network. Adv. Eng. Softw. 2008, 40, 334–340. [Google Scholar] [CrossRef]
- Chopra, P.; Sharma, R.K.; Kumar, M. Prediction of Compressive Strength of Concrete Using Artificial Neural Network and Genetic Programming. Adv. Mater. Sci. Eng. 2016, 2016, 7648467. [Google Scholar] [CrossRef] [Green Version]
- Yeh, I.-C. Modeling of strength of high-performance concrete using artificial neural networks. Cem. Concr. Res. 1998, 28, 1797–1808. [Google Scholar] [CrossRef]
- Foucquier, A.; Robert, S.; Suard, F.; Stéphan, L.; Jay, A. State of the art in building modelling and energy performances prediction: A review. Renew. Sustain. Energy Rev. 2013, 23, 272–288. [Google Scholar] [CrossRef] [Green Version]
- Lv, Y.; Liu, J.; Yang, T.; Zeng, D. A novel least squares support vector machine ensemble model for NOx emission prediction of a coal-fired boiler. Energy 2013, 55, 319–329. [Google Scholar] [CrossRef]
- Dou, J.; Yunus, A.P.; Bui, D.T.; Merghadi, A.; Sahana, M.; Zhu, Z.; Chen, C.-W.; Khosravi, K.; Yang, Y.; Pham, B.T. Assessment of advanced random forest and decision tree algorithms for modeling rainfall-induced landslide susceptibility in the Izu-Oshima Volcanic Island, Japan. Sci. Total Environ. 2019, 662, 332–346. [Google Scholar] [CrossRef]
- Amershi, S.; Begel, A.; Bird, C.; DeLine, R.; Gall, H.; Kamar, E.; Nagappan, N.; Nushi, B.; Zimmermann, T. Software engineering for machine learning: A case study. In Proceedings of the 2019 IEEE/ACM 41st International Conference on Software Engineering: Software Engineering in Practice (ICSE-SEIP), Montreal, QC, Canada, 25–31 May 2019. [Google Scholar]
- Chou, J.-S.; Pham, A.-D. Enhanced artificial intelligence for ensemble approach to predicting high performance concrete compressive strength. Constr. Build. Mater. 2013, 49, 554–563. [Google Scholar] [CrossRef]
- Galar, M.; Fernandez, A.; Barrenechea, E.; Bustince, H.; Herrera, F. A Review on Ensembles for the Class Imbalance Problem: Bagging-, Boosting-, and Hybrid-Based Approaches. IEEE Trans. Syst. Man Cybern. Part C Appl. Rev. 2011, 42, 463–484. [Google Scholar] [CrossRef]
- Gomes, H.M.; Barddal, J.P.; Enembreck, F.; Bifet, A. A Survey on Ensemble Learning for Data Stream Classification. ACM Comput. Surv. 2018, 50, 1–36. [Google Scholar] [CrossRef]
- Rahman, J.; Ahmed, K.S.; Khan, N.I.; Islam, K.; Mangalathu, S. Data-driven shear strength prediction of steel fiber reinforced concrete beams using machine learning approach. Eng. Struct. 2021, 233, 111743. [Google Scholar] [CrossRef]
- Güçlüer, K.; Özbeyaz, A.; Göymen, S.; Günaydın, O. A comparative investigation using machine learning methods for concrete compressive strength estimation. Mater. Today Commun. 2021, 27, 102278. [Google Scholar] [CrossRef]
- Getahun, M.A.; Shitote, S.M.; Gariy, Z.C.A. Artificial neural network based modelling approach for strength prediction of concrete incorporating agricultural and construction wastes. Constr. Build. Mater. 2018, 190, 517–525. [Google Scholar] [CrossRef]
- Ling, H.; Qian, C.X.; Kang, W.C.; Liang, C.Y.; Chen, H.C. Machine and K-Fold cross validation to predict compressive strength of concrete in marine environment. Constr. Build. Mater. 2019, 206, 355–363. [Google Scholar] [CrossRef]
- Yaseen, Z.M.; Deo, R.C.; Hilal, A.; Abd, A.M.; Bueno, L.C.; Salcedo-Sanz, S.; Nehdi, M.L. Predicting compressive strength of lightweight foamed concrete using extreme learning machine model. Adv. Eng. Softw. 2018, 115, 112–125. [Google Scholar] [CrossRef]
- Taffese, W.Z.; Sistonen, E. Machine learning for durability and service-life assessment of reinforced concrete structures: Recent advances and future directions. Autom. Constr. 2017, 77, 1–14. [Google Scholar] [CrossRef]
- Yokoyama, S.; Matsumoto, T. Development of an Automatic Detector of Cracks in Concrete Using Machine Learning. Procedia Eng. 2017, 171, 1250–1255. [Google Scholar] [CrossRef]
- Ben Chaabene, W.; Flah, M.; Nehdi, M.L. Machine learning prediction of mechanical properties of concrete: Critical review. Constr. Build. Mater. 2020, 260, 119889. [Google Scholar] [CrossRef]
- Su, M.; Zhong, Q.; Peng, H.; Li, S. Selected machine learning approaches for predicting the interfacial bond strength between FRPs and concrete. Constr. Build. Mater. 2020, 270, 121456. [Google Scholar] [CrossRef]
- Park, Y.-S.; Lek, S. Artificial Neural Networks: Multilayer Perceptron for Ecological Modeling. In Developments in Environmental Modelling; Elsevier: Amsterdam, The Netherlands, 2016; pp. 123–140. [Google Scholar]
- BKA, M.A.R.; Ngamkhanong, C.; Wu, Y.; Kaewunruen, S. Recycled aggregates concrete compressive strength prediction using artificial neural networks (ANNs). Infrastructures 2021, 6, 17. [Google Scholar]
- Xiao, F.; Amirkhanian, S.N. Artificial Neural Network Approach to Estimating Stiffness Behavior of Rubberized Asphalt Concrete Containing Reclaimed Asphalt Pavement. J. Transp. Eng. 2009, 135, 580–589. [Google Scholar] [CrossRef]
- Yeh, I.-C. Analysis of Strength of Concrete Using Design of Experiments and Neural Networks. J. Mater. Civ. Eng. 2006, 18, 597–604. [Google Scholar] [CrossRef]
- Yeh, I.-C. Modeling Concrete Strength with Augment-Neuron Networks. J. Mater. Civ. Eng. 1998, 10, 263–268. [Google Scholar] [CrossRef]
- Yeh, I.-C. Design of High-Performance Concrete Mixture Using Neural Networks and Nonlinear Programming. J. Comput. Civ. Eng. 1999, 13, 36–42. [Google Scholar] [CrossRef]
- Yeh, I.-C. Prediction of strength of fly ash and slag concrete by the use of artificial neural networks. J. Chin. Inst. Civil Hydraul. Eng. 2003, 15, 659–663. [Google Scholar]
- Yeh, I.-C. A mix proportioning methodology for fly ash and slag concrete using artificial neural networks. Chung Hua J. Sci. Eng. 2003, 1, 77–84. [Google Scholar]
- Metha, P.; Monteiro, P. Concrete: Structure, Properties and Materials; Pini: São Paulo, Brazil, 1994; p. 572. [Google Scholar]
- Siddique, R.; Aggarwal, P.; Aggarwal, Y. Prediction of compressive strength of self-compacting concrete containing bottom ash using artificial neural networks. Adv. Eng. Softw. 2011, 42, 780–786. [Google Scholar] [CrossRef]


| Variable | OPC | BFS | Fly Ash | Water | SP | CA | FA | Age | CS |
|---|---|---|---|---|---|---|---|---|---|
| Unit | Kg/m3 | Kg/m3 | Kg/m3 | Kg/m3 | Kg/m3 | Kg/m3 | Kg/m3 | Day | MPa |
| Mean | 281.17 | 73.9 | 54.19 | 181.57 | 6.203 | 972.92 | 773.58 | 45.66 | 35.818 |
| St. Dev. | 104.51 | 86.28 | 64 | 21.36 | 5.973 | 77.75 | 80.18 | 63.17 | 16.706 |
| Variance | 10,921.74 | 7444.08 | 4095.55 | 456.06 | 35.683 | 6045.66 | 6428.1 | 3990.44 | 279.08 |
| Q1 | 192 | 0 | 0 | 164.9 | 0 | 932 | 730.3 | 7 | 23.695 |
| Median | 272.9 | 22 | 0 | 185 | 6.35 | 968 | 779.51 | 28 | 34.443 |
| Q3 | 350 | 143 | 118.27 | 192 | 10.16 | 1029.4 | 824.25 | 56 | 46.209 |
| Min | 102 | 0 | 0 | 121.75 | 0 | 801 | 594 | 1 | 2.332 |
| Max | 540 | 359.4 | 200.1 | 247 | 32.2 | 1145 | 992.6 | 365 | 82.599 |
| Range | 438 | 359.4 | 200.1 | 125.25 | 32.2 | 344 | 398.6 | 364 | 80.267 |
| Data Set | N | % of N | Mean | StDev | Min | Q1 | Median | Q3 | Max |
| Training | 842 | 81.7 | 35.861 | 16.822 | 2.3318 | 23.695 | 34.084 | 46.229 | 82.599 |
| Testing | 188 | 18.3 | 35.624 | 16.215 | 3.3198 | 23.633 | 35.549 | 45.243 | 79.297 |
| R2 | RMSE | MSE | MAD | MAPE | |||||
| Training | 0.9433 | 4.0032 | 16.0254 | 3.0366 | 0.1143 | ||||
| Testing | 0.8362 | 6.5445 | 42.8299 | 4.8176 | 0.1804 | ||||
| Measures | Training | Validation |
|---|---|---|
| R-Square | 0.8730396 | 0.8487035 |
| RMSE | 5.9002536 | 6.6008002 |
| MSE | 34.8200 | 43.5700 |
| Mean Abs Dev | 4.5491846 | 5.0868193 |
| -Log Likelihood | 2191.0386 | 1137.3085 |
| SSE | 23,881.713 | 14,988.274 |
| Sum Freq | 824 | 206 |
| Parameter | H1_1 | H1_2 | H1_3 | H1_4 | H1_5 | H1_6 | H1_7 | H1_8 | |
|---|---|---|---|---|---|---|---|---|---|
| OPC (Kg/m3) | 0.01538 | 0.01484 | 0.0015 | 0.00453 | 0.00424 | −0.004 | 0.00649 | 0.01068 | |
| BFS (Kg/m3) | 0.01204 | −0.0075 | 0.0050 | 0.01288 | 0.00602 | −0.007 | 0.00073 | −0.0048 | |
| F. Ash (Kg/m3) | 0.01279 | 0.00379 | −0.008 | −0.009 | 0.0031 | −0.001 | −0.0067 | 0.02515 | |
| Water (Kg/m3) | −0.057 | −0.044 | −0.042 | 0.0653 | 0.0234 | −0.011 | 0.01277 | −0.1049 | |
| SP (Kg/m3) | 0.03559 | −0.009 | −0.181 | −0.199 | 0.0622 | 0.0189 | −0.0682 | 0.0359 | |
| CA (Kg/m3) | 0.00298 | −0.015 | −0.0003 | −0.008 | 0.0012 | −0.0003 | 0.00169 | −0.0188 | |
| FA (Kg/m3) | 0.01079 | −0.001 | 0.0031 | 0.01179 | −0.0068 | 0.0010 | 0.00171 | −0.0096 | |
| Age (Day) | 0.00309 | −0.032 | −0.0553 | 0.0104 | −0.0744 | −0.0004 | 0.08893 | −0.0151 | |
| Intercept | −7.684 | 20.4865 | 6.341 | −13.51 | −2.331 | 3.1527 | −7.1926 | 41.281 | |
| Int. | H1_1 | H1_2 | H1_3 | H1_4 | H1_5 | H1_6 | H1_7 | H1_8 | |
| CS (MPa) | 25.261 | 12.857 | 0.4490 | −7.4665 | −4.9352 | −8.9412 | −28.071 | 11.594 | 1.6980 |
Publisher’s Note: MDPI stays neutral with regard to jurisdictional claims in published maps and institutional affiliations. |
© 2022 by the authors. Licensee MDPI, Basel, Switzerland. This article is an open access article distributed under the terms and conditions of the Creative Commons Attribution (CC BY) license (https://creativecommons.org/licenses/by/4.0/).
Share and Cite
Shah, S.A.R.; Azab, M.; Seif ElDin, H.M.; Barakat, O.; Anwar, M.K.; Bashir, Y. Predicting Compressive Strength of Blast Furnace Slag and Fly Ash Based Sustainable Concrete Using Machine Learning Techniques: An Application of Advanced Decision-Making Approaches. Buildings 2022, 12, 914. https://doi.org/10.3390/buildings12070914
Shah SAR, Azab M, Seif ElDin HM, Barakat O, Anwar MK, Bashir Y. Predicting Compressive Strength of Blast Furnace Slag and Fly Ash Based Sustainable Concrete Using Machine Learning Techniques: An Application of Advanced Decision-Making Approaches. Buildings. 2022; 12(7):914. https://doi.org/10.3390/buildings12070914
Chicago/Turabian StyleShah, Syyed Adnan Raheel, Marc Azab, Hany M. Seif ElDin, Osama Barakat, Muhammad Kashif Anwar, and Yasir Bashir. 2022. "Predicting Compressive Strength of Blast Furnace Slag and Fly Ash Based Sustainable Concrete Using Machine Learning Techniques: An Application of Advanced Decision-Making Approaches" Buildings 12, no. 7: 914. https://doi.org/10.3390/buildings12070914