
Effects of Tongue Pressure on Cerebral Blood Volume Dynamics: A Functional Near-Infrared Spectroscopy Study


1
Department of Molecular Oral Medicine and Maxillofacial Surgery, Graduate School of Biomedical & Health Sciences, Hiroshima University, Kasumi 1-2-3, Minami-ku, Hiroshima 734-8553, Japan
2
Oral and Maxillofacial Surgery, Hiroshima University Hospital, Kasumi 1-2-3, Minami-ku, Hiroshima 734-8553, Japan
3
School of Medical Sciences, University of East Asia, 2-1 Ichinomiyagakuenchō, Shimonoseki 751-8503, Japan
*
Author to whom correspondence should be addressed.
Brain Sci. 2022, 12(2), 296; https://doi.org/10.3390/brainsci12020296
Submission received: 9 December 2021
/
Revised: 10 February 2022
/
Accepted: 17 February 2022
/
Published: 21 February 2022
(This article belongs to the Section Neuro-otology and Neuro-ophthalmology)
Abstract
:Tongue pressure measurement (TPM) is an indicator of oral function. However, the association between tongue pressure and cerebral activation remains unclear. We used near-infrared spectroscopy (NIRS) to examine the correlation between cerebral cortex activation and tongue pressure stimulation against the anterior palatal mucosa. We measured voluntary maximum tongue pressure (MTP) using a TPM device; a pressure value of approximately 60% of the MTP was used for the experimental tongue pressure (MTP60%). We examined the effect of oral functional tongue pressure stimulation against the anterior palatal mucosa on cerebral activation using NIRS in 13 adults. Tongue pressure stimulation caused significant changes in cerebral blood flow in some areas compared with controls (p < 0.05). We performed a correlation analysis (p < 0.05) between MTP60% and changes in oxygenated hemoglobin in all 47 NIRS channels. MTP60% triggered activation of the right somatosensory motor area and right dorsolateral prefrontal cortex and deactivation of the anterior prefrontal cortex (APFC). TPM balloon-probe insertion in the oral cavity activated the bilateral somatosensory motor area and deactivated the wide area of the APFC. Moreover, MTP60% via the TPM balloon probe activated the bilateral somatosensory and motor cortex areas. Tongue pressure stimulation changes cerebral blood flow, and NIRS is useful in investigating the relationship between oral stimulation and brain function.
1. Introduction
In ageing societies, cognitive decline and physical deterioration pose serious health-related challenges and are symptomatic of various diseases. Among physical challenges, oral functional deterioration is a cause of mortality owing to its relationship with both dysphagia [1] and respiratory disorders. Oral functional deterioration assessments have been developed, such as tongue pressure measurement (TPM), which is used as a simple, objective indicator in Japan. Previous studies have utilized TPM for detecting swallowing disorders caused by low tongue pressure [2] and for oral functional training (OFT) in dysphagic patients [1]. Furthermore, TPM can predict pneumonia in acute stroke patients [3] and is effective in oral functional assessment and OFT. Conversely, it was suggested that mastication increases regional cerebral blood flow (CBF) [4]. In addition, sensory stimulation of the oral mucosa increases regional CBF [5]. Therefore, OFT may improve cognitive function [6,7]. However, the mechanisms by which oral functional stimulation affects regional cerebral function remain unknown [8,9].
Noninvasive functional neuroimaging techniques have been developed to assess human brain function. Cerebral functional activity is detected using surrogate biomarkers such as neural electromagnetic activities, CBF, and oxygenation. In particular, CBF- and oxygenation-based neuroimaging techniques have been developed to elucidate cerebral function based on neurovascular coupling [10].
Fox et al. [11] first reported the use of the positron emission tomography (PET) technique for this purpose. Furthermore, researchers [12] devised the blood oxygenation level dependent (BOLD) contrast method, which entails changing the signals in functional magnetic resonance imaging (fMRI) without the use of contrast agents. fMRI provides a clear, three-dimensional depiction of cerebral activity with sufficient spatial resolution. Hence, fMRI has been used for the noninvasive identification of cerebral function of the sensory [13] and motor areas [14]. Several neurofunctional studies have been conducted to date; however, fMRI studies need a strong magnetic field, the restriction of head movement, and supine positioning of the participant. Therefore, it is difficult to measure cerebral function under daily physiological conditions [15].
In contrast, near-infrared spectroscopy (NIRS) is based on the biopermeability of near-infrared light. NIRS can detect the hemodynamics of the cerebral cortex caused by neurovascular coupling. In 1977, Jöbsis [16] first noninvasively measured CBF and tissue oxygenation in beagles and humans. After its development in 1993, NIRS has been used to measure cerebral functional hemodynamics [17], and it is currently used in neurosurgery and for assessing both domain-specific, language-related abilities [18] and depression [19]. Moreover, Japanese health insurance includes a provision for the use of NIRS for the differential diagnosis of depression [20]. NIRS can predict and evaluate drug efficacy in children with attention-deficit hyperactivity disorder [21]. Taken together, NIRS has become a new neuroimaging modality for the noninvasive detection of the hemodynamics of the cerebral cortex under routine physiological conditions.
The purpose of this study was to examine regional CBF induced by tongue pressure against the anterior palatal mucosa and OFT with TPM stimulation. We used NIRS due to its greater flexibility in task assignments compared to other functional neuroimaging techniques and evaluated the potential of NIRS as an on-site, objective indicator of the rehabilitation effect of tongue pressure OFT.
2. Materials and Methods
2.1. Participants
Thirteen healthy adult volunteers (men, 10; women, 3; age (mean ± SD), 29.3 ± 3.6 years) were recruited. The participants had no unstable illness, were not taking any medication, had not consumed alcohol, and provided written informed consent after they were given information about this study. All procedures were approved by the appropriate Ethics Committee of Hiroshima University Hospital, Hiroshima, Japan, on 10 January 2017 (authorization number: E-173).
2.2. Maximum Tongue Pressure Measurement
The experimental stimulus, i.e., maximum tongue pressure (MTP), was evaluated using a balloon-type TPM device (TPM-02; JMS Co. Ltd., Hiroshima, Japan). The participants were seated on a chair with a backrest and instructed to hold the plastic pipe of the TPM device at the midpoint of their central incisors with their lips closed. Participants were asked to lift their tongue against the anterior palatal mucosa around the palatal rugae. The mean MTP was calculated from three measurements. The experimental tongue-pressure stimulus was determined at approximately 60% of the mean MTP (MTP60%), considering the effects of overshooting, artifact, fatigue, and struggling to perform the task (Table 1).
2.3. Practice for MTP60%
The experiment was conducted after each participant practiced reproducing the sensation of pressing the mucosa of the anterior palate by elevating the tongue with the same level of pressure felt on the palate as when the probe was pressurized with 60% MTP.
2.4. NIRS Measurement Items
We employed a multichannel NIRS system (ETG-7100; Hitachi Medical Corporation, Tokyo, Japan) to measure changes in cerebral hemodynamics using two wavelengths of near-infrared light (695 and 830 nm) and the accompanying 47 channels (Chs). The measurement probe had an array of 3 × 11 optical fibers, and the distance between the light-emitting unit and detector unit was 30 mm. We used an NIRS head-holder, with the emitter and detector arranged along the 3 * 5 line, and set the lower line of the NIRS head-holder along the T4-Fpz-T3 line according to the International 10–20 method of electroencephalography (EEG) electrode placement. All measurements were conducted in a silent room at the Hiroshima Innovation Center of Biomedical Engineering and Advanced Medicine (Hiroshima University, Kasumi Campus, Hiroshima, Japan).
Continuous-wave NIRS is the most used type [22], in which light absorption is detected by density changes based on the modified Beer–Lambert Law. Based on this principle, NIRS can detect hemoglobin fluctuations in the cerebral cortex 2 cm below the scalp.
We determined the arrangement between the probe and cerebral prefrontal surface using the virtual registration method [23,24]. The detector signal consisted of oxygenated hemoglobin (Oxy-Hb) and deoxygenated hemoglobin (Deoxy-Hb) data that were continuously measured. The total Hb concentration was obtained by adding the Oxy-Hb and Deoxy-Hb data.
2.5. Task Paradigm
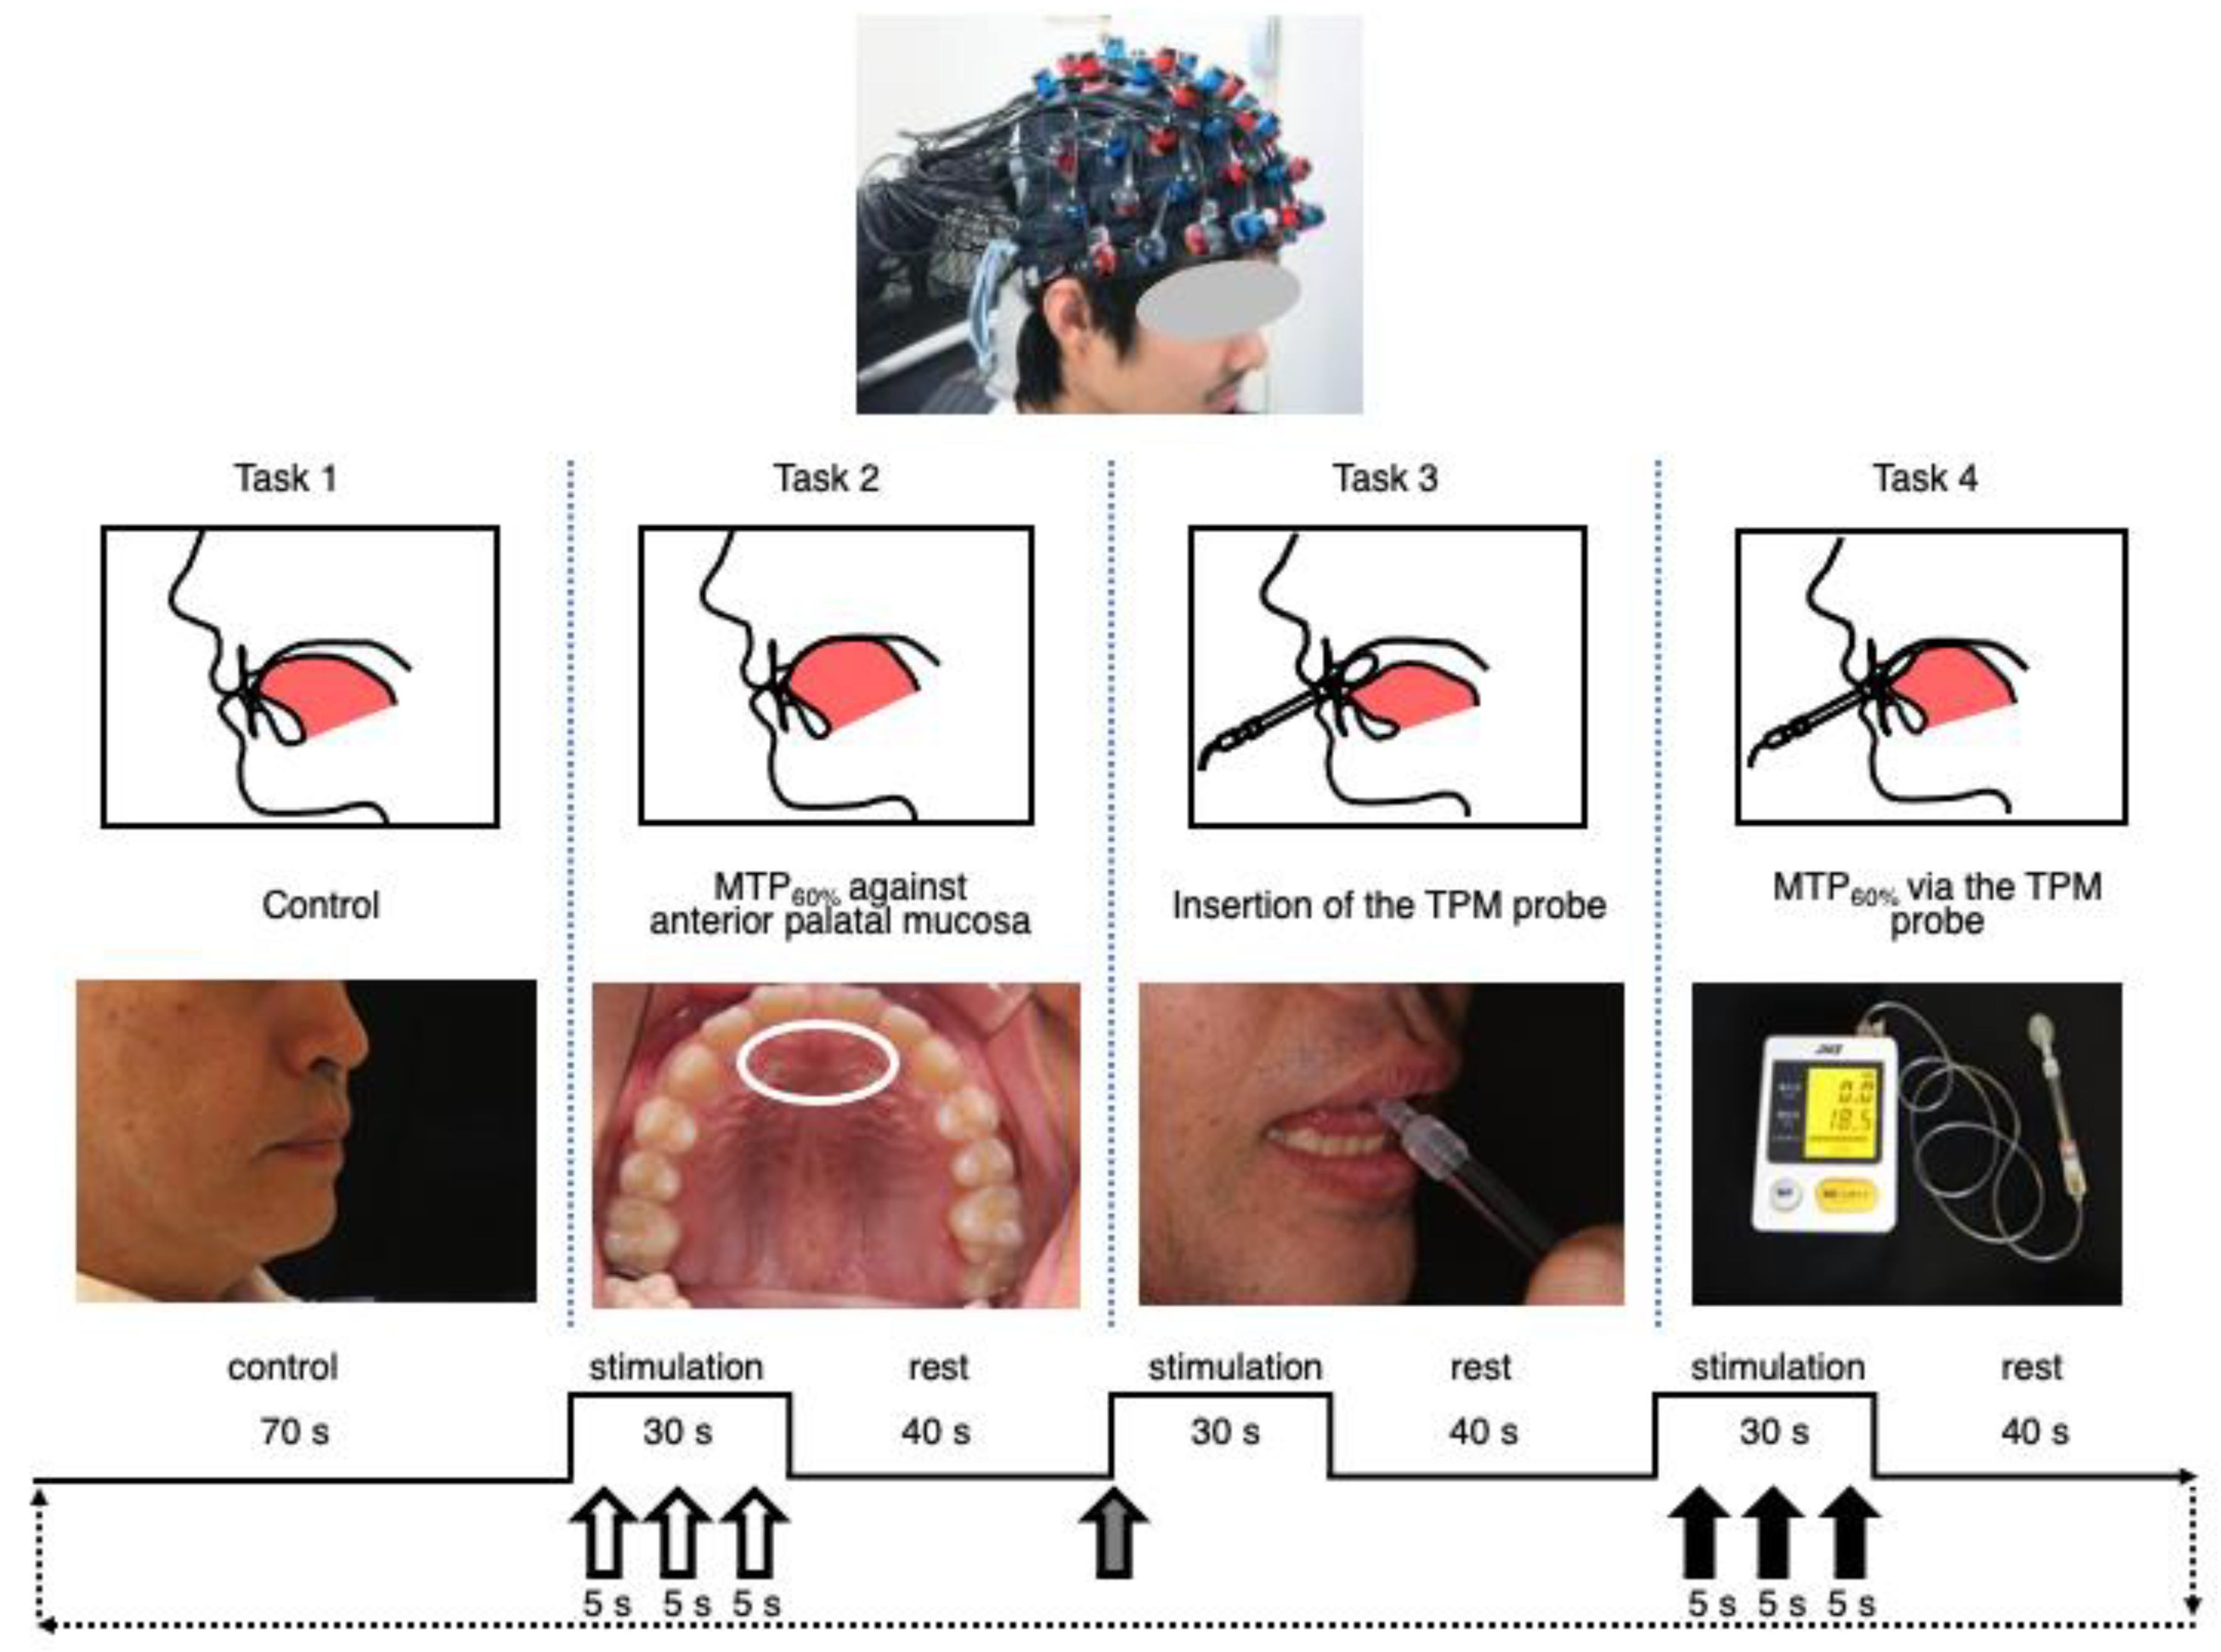
The task paradigm consisted of a block design. Each block consisted of a 30 s stimulation period and a 40 s recovery period. The experimental stimulus was applied with the tongue three times for 5 s against the anterior palatal area during the 30 s stimulation period via a TPM balloon-type probe (Figure 1). The task block was repeated for four cycles. The average hemodynamic response was obtained by averaging the blocks performed four times per participant. The measurement procedure lasted for a total of 19 min.
- (1)
- Task 1: resting tongue position for control.
- (2)
- Task 2: MTP60% against the anterior palatal mucosa (5 s, three times).
- (3)
- Task 3: insertion of the TPM probe.
- (4)
- Task 4: MTP60% via the TPM probe (5 s, three times).
2.6. Analysis of the NIRS Data
2.6.1. Wave Analysis
Continuous NIRS measurement was integrated with the baseline determined using the mentioned parameters (pre-time, 10 s; recovery time, 35 s; post-time, 5 s).
2.6.2. Activation Analysis
We calculated the Oxy-Hb values for all 47 Chs within the stimulation period during the task blocks (10–40 s). The mean value of the change in the Oxy-Hb concentration (from baseline) was determined using the area under the curve. The baseline for each task was the line connecting the average of the 10 s pre-time and the 5 s post-time. After Benjamini and Hochberg’s false-discovery-rate processing of the subcurve values for each of the 47 channels, multiple comparison analysis with Dunnett’s post hoc comparison was used to examine the tasks and identify the channels that significantly changed blood flow. Statistical analyses were performed using SPSS version 21 (IBM Corp., Armonk, NY, USA).
2.6.3. Comparison of Sex Correlations between Hemodynamic Parameters
In order to examine whether there was a difference in the variation in CBF owing to sex, a statistical test using a paired t-test was performed on the subcurve values of each of the 47 channels in the men’s and women’s groups.
2.6.4. Correlation Analysis
The relationship between MTP60% and changes in Oxy-Hb (ΔOxy-Hb) levels in each Ch was analyzed using correlation analysis. Statistically significant Chs are depicted on the cortical surface map in Figure 2.
3. Results
3.1. Maximum Tongue Pressure
The intensity of the tongue pressure caused by MTP was evaluated using three measurements with a JMS TPM device. The results showed a mean MTP value of 41.2 kPa, which is indicative of mild oral functional stimulation. Therefore, the approximate MTP60% was used in our analysis. There was no significant difference in the mean MTP between the men’s and women’s groups (Table 1).
3.2. Waveforms Elicited by the Tasks
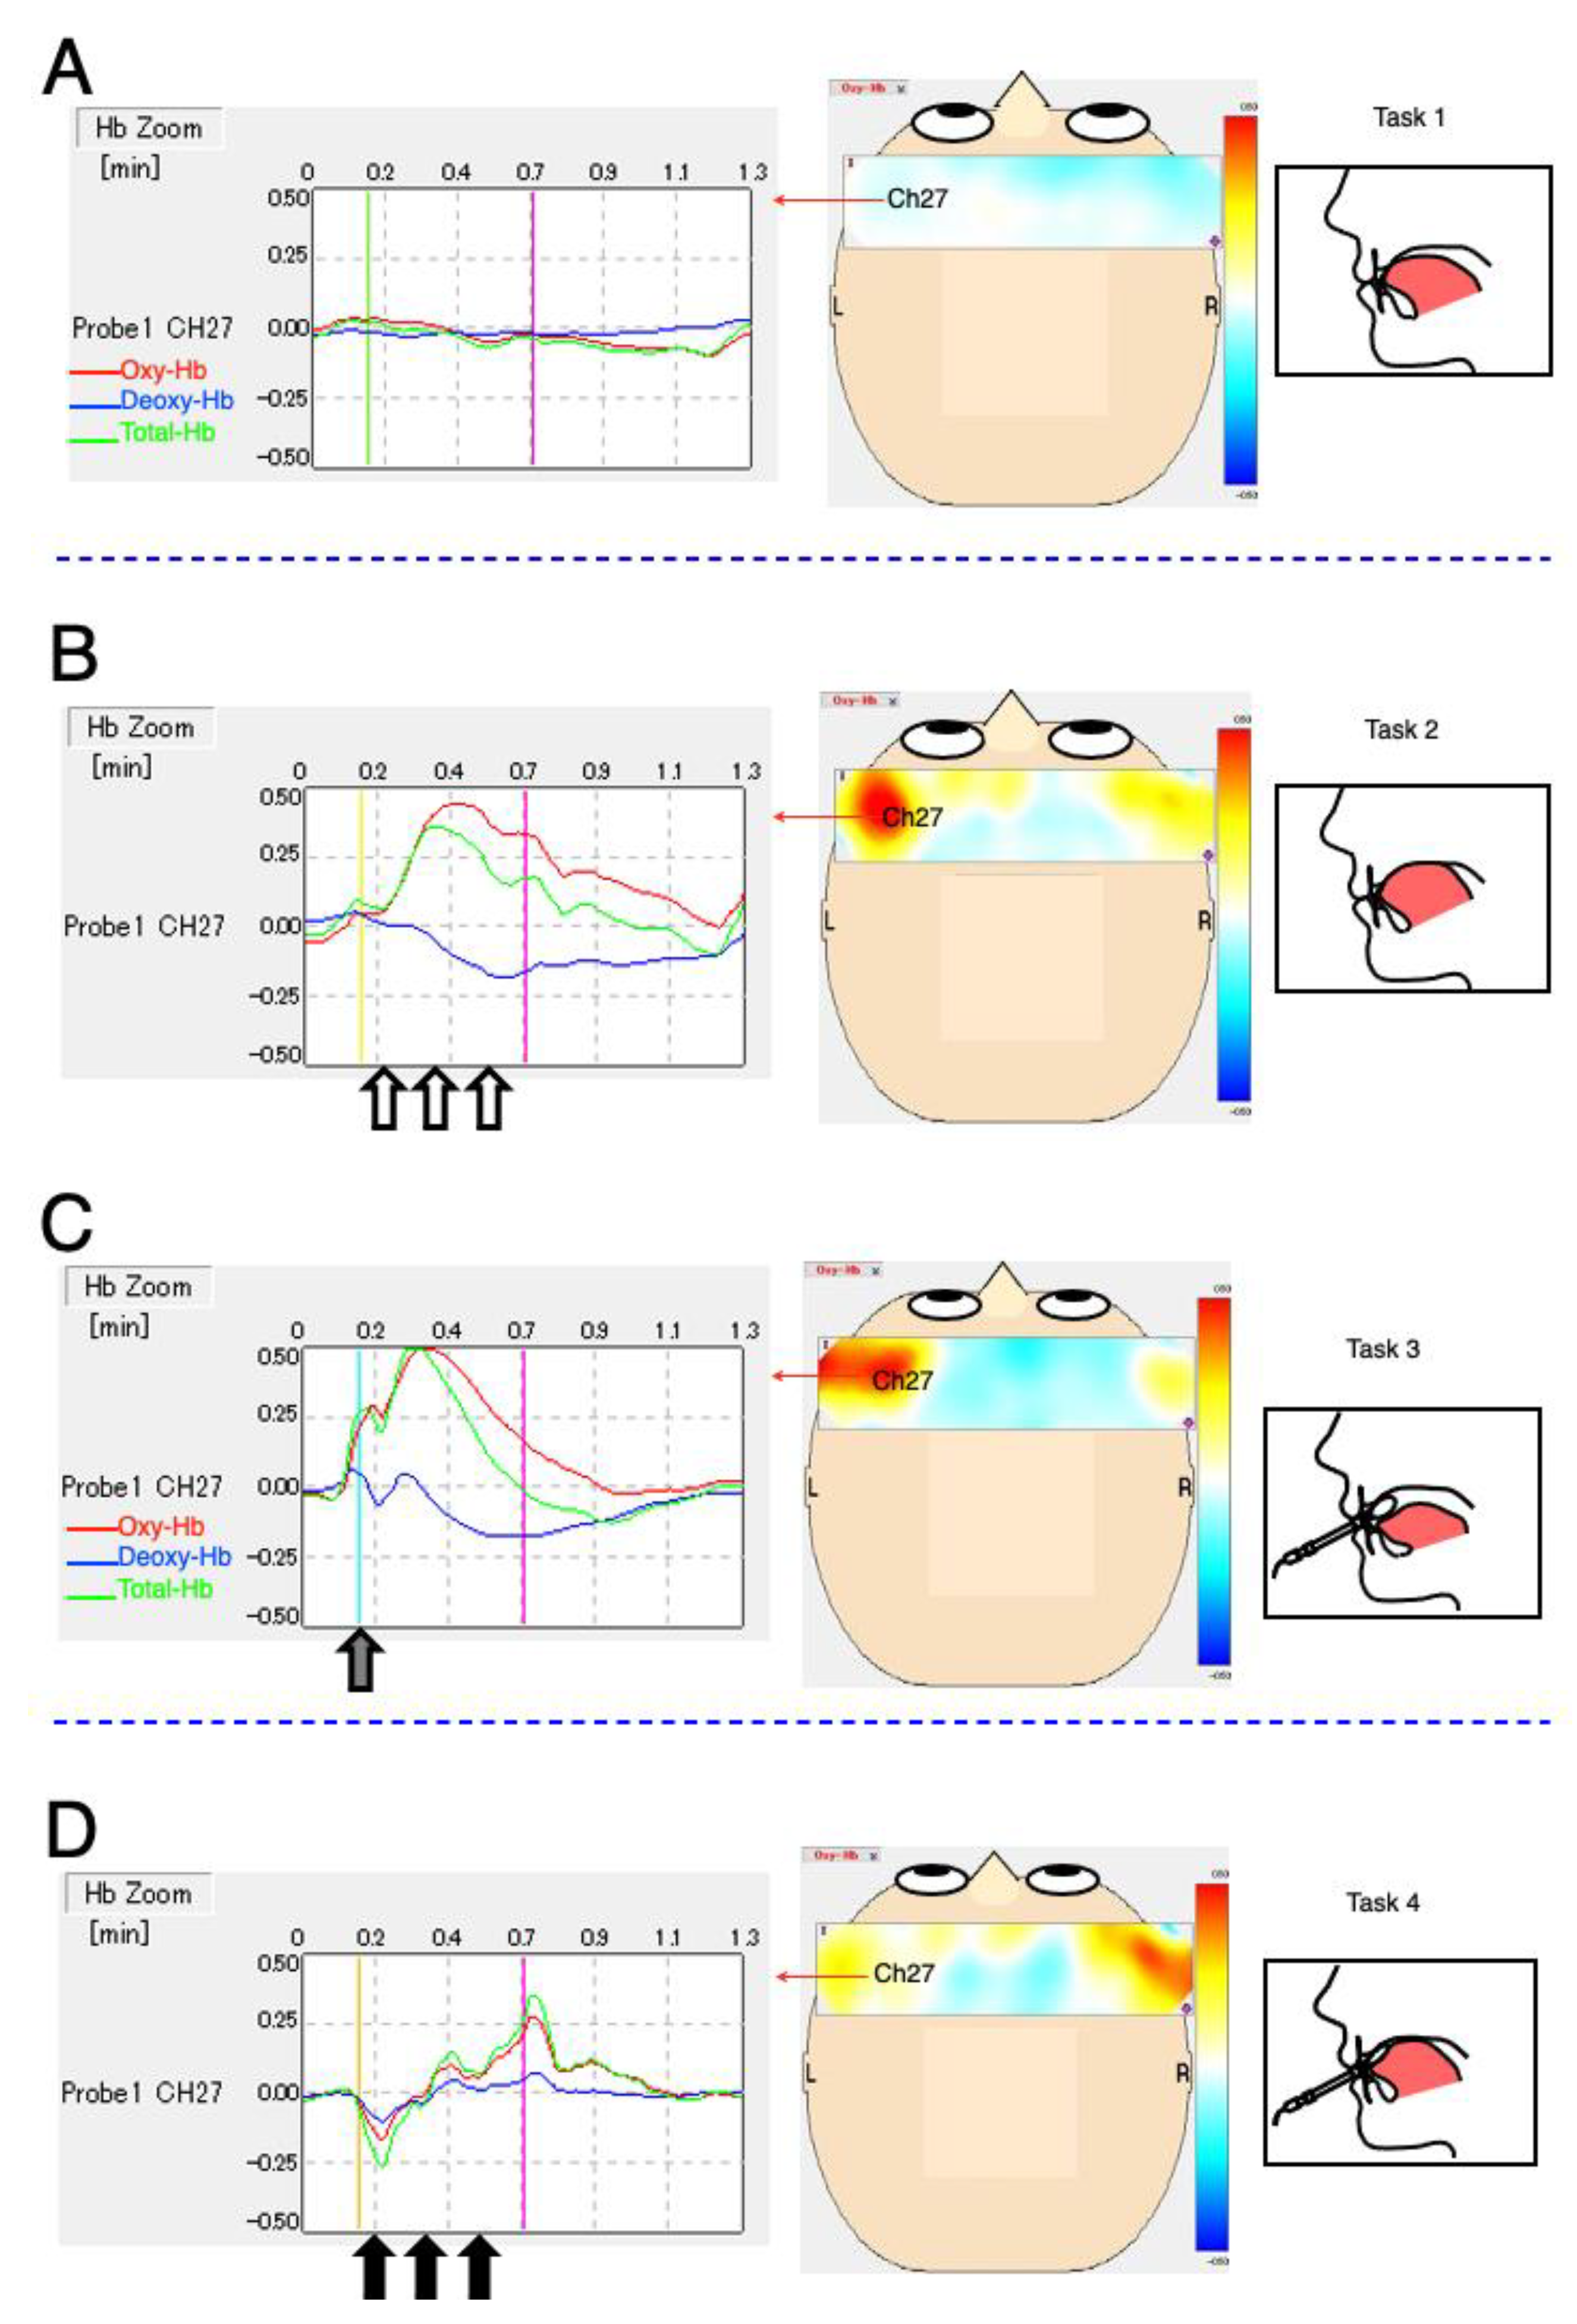
Activation tendency is represented in the topography and waveforms of Ch 27 in Figure 3. Oxy-Hb was used to determine cerebral cortex activation. The classical waveform of the four experimental tasks of the participants is depicted in Figure 3. The topography shows a panoramic distribution of Oxy-Hb in the cerebral cortex.
Task 1 resulted in an unchanging Oxy-Hb condition during the control state on the topographical map (Figure 3A). Task 2 resulted in a task-related Oxy-Hb increase among the block stimulation periods (10–40 s) in the left Ch 27 (Figure 3B). The Oxy-Hb signals also increased during the insertion of the balloon-type TPM in Task 3 (Figure 3C). MTP60% via the balloon-type TPM probe resulted in weaker Oxy-Hb activation than that in Task 2 in the left Ch 27 (Figure 3D).
3.3. Activation Analysis between Tasks
Dunnett’s post hoc test for the comparison of the stimulation and control tasks revealed significant activation in the channels concerned with oral functional stimulation. Each of the 47 Chs represented approximately one cerebral cortical region (Figure 4). Figure 4A shows significant changes in Oxy-Hb concentration that were confirmed between the tongue-press and control tasks. Significant alterations were observed in the right superior marginal gyrus (SMG), right primary sensory cortex (PSC), right primary motor cortex (PMC), and bilateral superior temporal gyri (STG). A significant increase was also observed in the right dorsolateral prefrontal cortex (DLPFC), while a significant decrease was observed in the right anterior prefrontal cortex (APFC).
As shown in Figure 4B, significant changes in Oxy-Hb were observed during the balloon-type probe-insertion and control tasks. There were significant elevations in the bilateral SMG, PSC, PMC, and STG. Wide-area deactivation of the DLPFC and APFC was also observed.
MTP60% stimulation via the balloon-type-probe task resulted in bilateral Ch activations that differed significantly from those observed during the control task. Significant elevations were also observed in the left PSC, bilateral SMG, PMC, and right DLPFC (Figure 4C).
3.4. Comparison of Sex Correlations between Hemodynamic Parameters
We used a corresponding t-test to analyze sex and MTP but found no significant difference. We also examined cerebral blood flow in the men’s and women’s groups using a corresponding t-test, and Ch 24 (p = 0.008) in Task 3 and Ch 42 (p = 0.043) in Task 4 showed a significant difference.
3.5. Correlation Analysis
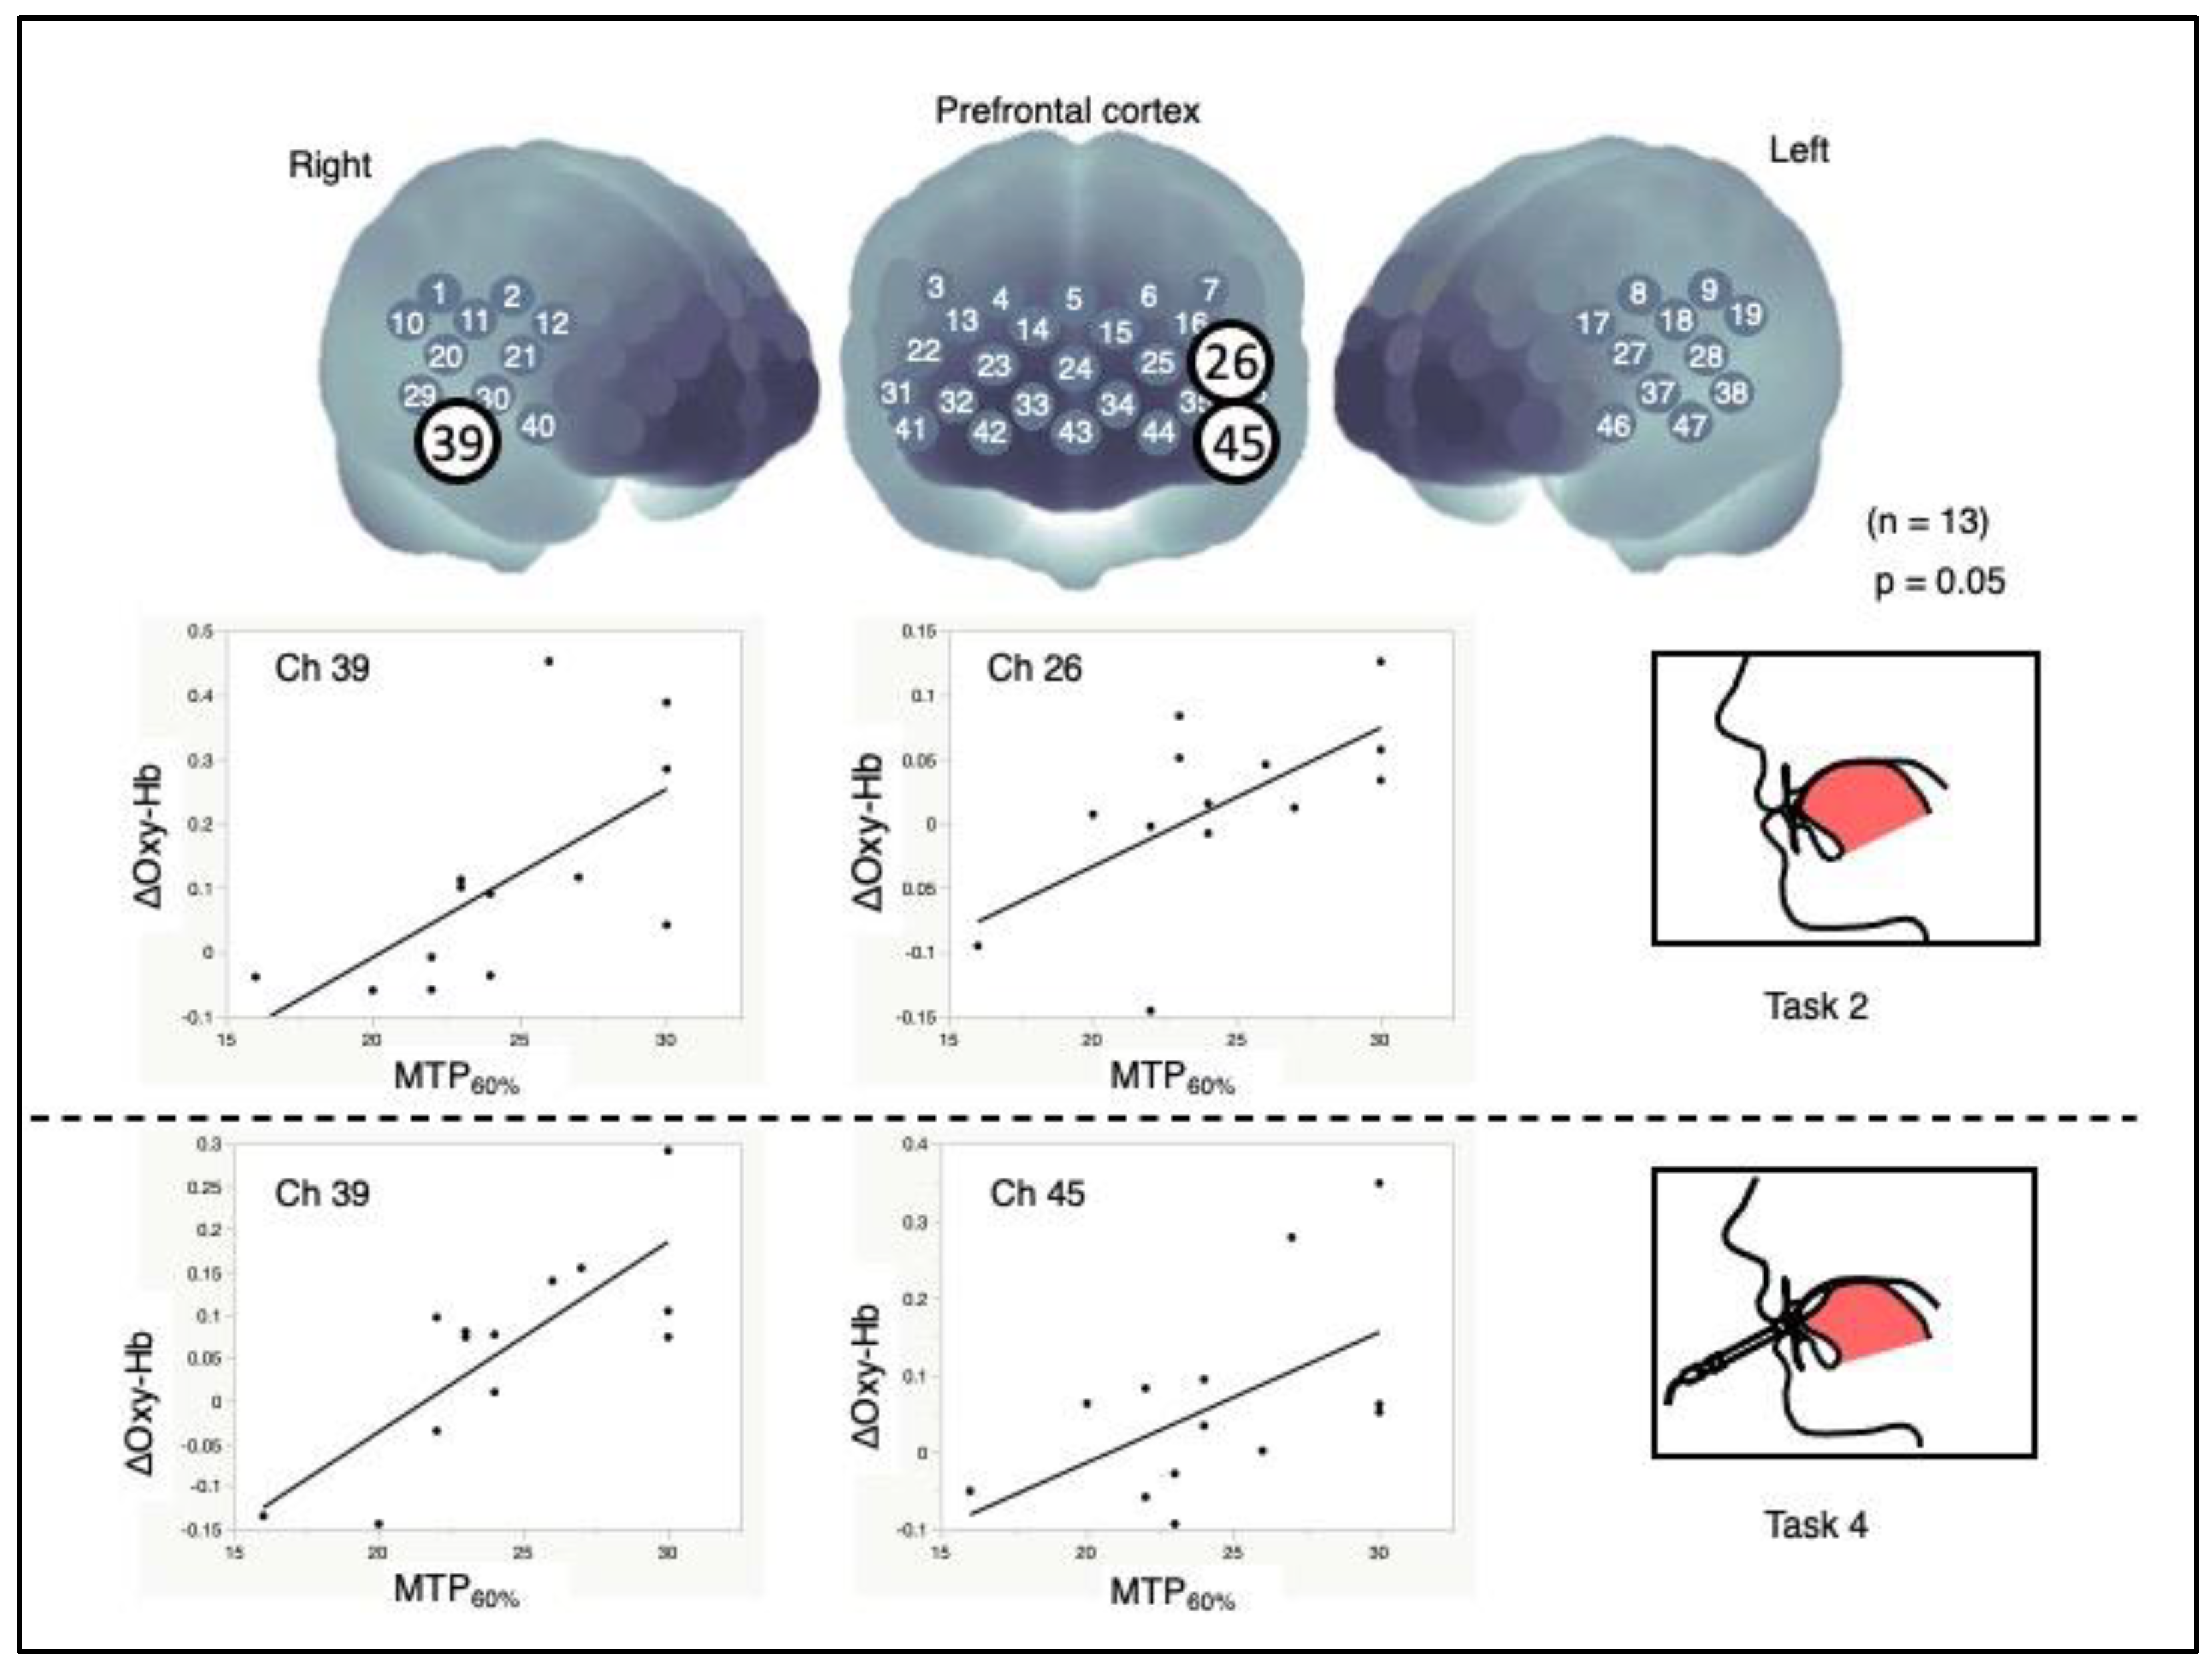
The correlation analysis between MTP60% and ΔOxy-Hb revealed significant channels: Ch 26 (r = 0.636, p = 0.049) and Ch 39 (r = 0.645, p = 0.001). The correlation analysis between MTP60% via the balloon-type probe of TPM and ΔOxy-Hb revealed significant channels: Ch 45 (r = 0.555, p = 0.049) and Ch 39 (r = 0.791, p = 0.017) (Figure 5).
4. Discussion
This study showed that tongue pressure against the anterior palatal mucosa and TPM have various effects on regional CBF. MTP60% against the anterior palatal mucosa was predominantly localized to the right temporal cortex. In a previous study, oral stimulation of the first transverse palatine ridge resulted in bilateral activation of the primary somatosensory cortex [25]. However, our study suggests that bilateral activations of the somatosensory and motor cortices are attenuated by the adaptation of physiological conditions. In addition, hearing the researcher’s cues and performing voluntary isometric lingual exercises may simulate verbal–lingual coordination [26,27,28].
The participants were examined for blood flow fluctuations in the cerebral cortex when tongue pressure was applied, and these data may serve as a basis for excluding the effects of unconscious tongue pressure in an fNIRS study.
The TPM balloon-type probe activated the bilateral temporal lobes and deactivated the wide area of the PFC, which is in line with previous findings [5]. MTP60% via the TPM balloon-type probe activated the bilateral primary sensory and motor cortices, which is consistent with oral ball-rolling tasks [29]. This study suggests that each oral function affects CBF.
A correlation analysis revealed a significant, positive relationship between the MTP60% and ΔOxy-Hg values at the channels over the left DLPFC and right MTG. The DLPFC plays an important role in emotional and motivational tendencies (i.e., vitality [30]), and this specific region may be a biomarker for tongue function.
Since CBF responses may be altered by ageing, we examined changes in CBF in the cerebral cortex in young, healthy individuals. Based on our findings, there is a need to study the effects of both ageing and brain diseases. Furthermore, since NIRS signals are affected by many physiological systemic functions, such as heart rate, respiratory rate, blood pressure, skin blood flow, motion artifacts [31,32], and bandpass filtering [33], correlation-based signal improvement [34] should be applied to separate components that are closely related to neural activity from NIRS data and should be measured extensively. In addition, since some tasks are affected by sex differences [35], it is necessary to study sex differences regarding the responsiveness of cerebral blood flow to oral stimulation in the future.
NIRS may detect emotional conditions in conjunction with other physiological biomarkers [36,37,38]. Furthermore, simultaneous measurement with NIRS and other neuroimaging techniques, such as fMRI [39,40] or EEG, may clarify whole-brain interactions. NIRS advancements in clinical settings have enabled the subjective assessment of not only discomfort and dysesthesia [41] but also comfort. Thus, the fit of dental prostheses, such as full-metal crowns and dentures, can be detected using the hemodynamics of the cerebral cortex as an indicator [42]. This study revealed that brain activity is closely related to oral stimulation, and that qualitative differences in oral stimuli result in different hemodynamic patterns in the cerebral cortex. Accordingly, NIRS-based recording of brain activity may serve as an objective method to evaluate oral function and contribute to the development of effective oral functioning training programs. New research and development initiatives in the field of dental medicine based on brain–oral function connections are anticipated.
5. Conclusions
This study demonstrated that tongue pressure against the anterior palatal mucosa elevates Oxy-Hb levels in the right somatosensory motor area and showed the deactivation of the PFC with passive, nontaste oral tactile stimulation. TPM probe insertion in the oral cavity activated the bilateral somatosensory motor area and deactivated the wide area of the APFC. Moreover, MTP60% via the TPM balloon probe activated the bilateral somatosensory and motor cortex areas. These findings expand our understanding of brain hemodynamics during oral function. The development of a clinically feasible NIRS protocol during oral rehabilitation could facilitate the visualization and digitization of oral function from a cerebral perspective.
Author Contributions
Conception and design of the study, H.M., R.T. and T.O.; acquisition of data, H.M., R.T. and T.O.; analysis and interpretation of data, H.M., S.T., R.T. and T.O.; drafting the article or revising it critically for important intellectual content, R.T. and T.O. All authors have read and agreed to the published version of the manuscript.
Funding
This research was partially supported by the Grant-in-Aid for Scientific Research (C) from the Ministry of Education, Science, Sports, and Culture of Japan (grant number 24593032) to R.T.
Institutional Review Board Statement
All procedures performed in studies involving human participants were in accordance with the ethical standards of either the institutional or national research committee and with the 1964 Helsinki Declaration and its later amendments or comparable ethical standards. The study was approved by the Ethics Committee of Hiroshima University Hospital (authorization number: E-173).
Informed Consent Statement
Informed consent was obtained from all participants involved in the study.
Data Availability Statement
Not applicable.
Acknowledgments
We would like to express our gratitude to participants and the staff at the Hiroshima Biomedical Innovation Center for Biomedical Engineering, and we would like to thank Hisako Sasahara for statistical analysis contributions.
Conflicts of Interest
The authors declare no conflict of interest.
References
- Kim, H.D.; Choi, J.B.; Yoo, S.J.; Chang, M.Y.; Lee, S.W.; Park, J.S. Tongue-to-palate resistance training improves tongue strength and oropharyngeal swallowing function in subacute stroke survivors with dysphagia. J. Oral Rehabil. 2017, 44, 59–64. [Google Scholar] [CrossRef] [PubMed]
- Tsuga, K.; Yoshikawa, M.; Oue, H.; Okazaki, Y.; Tsuchioka, H.; Maruyama, M.; Yoshida, M.; Akagawa, Y. Maximal voluntary tongue pressure is decreased in Japanese frail elderly persons. Gerodontology 2012, 29, e1078–e1085. [Google Scholar] [CrossRef] [PubMed]
- Nakamori, M.; Hosomi, N.; Ishikawa, K.; Imamura, E.; Shishido, T.; Ohshita, T.; Yoshikawa, M.; Tsuga, K.; Wakabayashi, S.; Maruyama, H.; et al. Prediction of pneumonia in acute stroke patients using tongue pressure measurements. PLoS ONE 2016, 11, e0165837. [Google Scholar] [CrossRef] [PubMed] [Green Version]
- Momose, T.; Nishikawa, J.; Watanabe, T.; Sasaki, Y.; Senda, M.; Kubota, K.; Sato, Y.; Funakoshi, M.; Minakuchi, S. Effect of mastication on regional cerebral blood flow in humans examined by positron-emission tomography with 15O-labelled water and magnetic resonance imaging. Arch. Oral Biol. 1997, 42, 57–61. [Google Scholar] [CrossRef]
- Sakuma, S.; Inamoto, K.; Higuchi, N.; Ariji, Y.; Nakayama, M.; Izumi, M. Experimental pain in the gingiva and its impact on prefrontal cortical hemodynamics: A functional near-infrared spectroscopy study. Neurosci. Lett. 2014, 575, 74–79. [Google Scholar] [CrossRef]
- Miyamoto, I.; Yoshida, K.; Tsuboi, Y.; Iizuka, T. Rehabilitation with dental prosthesis can increase cerebral regional blood volume. Clin. Oral Implant. Res. 2005, 16, 723–727. [Google Scholar] [CrossRef]
- Hirano, Y.; Obata, T.; Kashikura, K.; Nonaka, H.; Tachibana, A.; Ikehira, H.; Onozuka, M. Effects of chewing in working memory processing. Neurosci. Lett. 2008, 436, 189–192. [Google Scholar] [CrossRef]
- Higaki, N.; Goto, T.; Ichikawa, T. Periodontal tactile input activates the prefrontal cortex. Sci. Rep. 2016, 6, 36893. [Google Scholar] [CrossRef]
- Kishimoto, T.; Goto, T.; Ichikawa, T. Prefrontal cortex activity induced by periodontal afferent inputs downregulates occlusal force. Exp. Brain Res. 2019, 237, 2767–2774. [Google Scholar] [CrossRef]
- Chaigneau, E.; Tiret, P.; Lecoq, J.; Ducros, M.; Knöpfel, T.; Charpak, S. The relationship between blood flow and neuronal activity in the rodent olfactory bulb. J. Neurosci. 2007, 27, 6452–6460. [Google Scholar] [CrossRef]
- Fox, P.T.; Mintun, M.A.; Raichle, M.E.; Herscovitch, P. A noninvasive approach to quantitative functional brain mapping with H215O and positron emission tomography. J. Cereb. Blood Flow Metab. 1984, 4, 329–333. [Google Scholar] [CrossRef] [Green Version]
- Ogawa, S.; Lee, T.M. Magnetic resonance imaging of blood vessels at high fields: In vivo and in vitro measurements and image simulation. Magn. Reson. Med. 1990, 16, 9–18. [Google Scholar] [CrossRef]
- Kwong, K.K.; Belliveau, J.W.; Chesler, D.A.; Goldberg, I.E.; Weisskoff, R.M.; Poncelet, B.P.; Kennedy, D.N.; Hoppel, B.E.; Cohen, M.S.; Turner, R. Dynamic magnetic resonance imaging of human brain activity during primary sensory stimulation. Proc. Natl. Acad. Sci. USA 1992, 89, 5675–5679. [Google Scholar] [CrossRef] [Green Version]
- Bandettini, P.A.; Wong, E.C.; Hinks, R.S.; Tikofsky, R.S.; Hyde, J.S. Time course EPI of human brain function during task activation. Magn. Reson. Med. 1992, 25, 390–397. [Google Scholar] [CrossRef]
- Sörös, P.; Lalone, E.; Smith, R.; Stevens, T.; Theurer, J.; Menon, R.S.; Martin, R.E. Functional MRI of oropharyngeal air-pulse stimulation. Neuroscience 2008, 153, 1300–1308. [Google Scholar] [CrossRef]
- Jobsis, F.F. Noninvasive, infrared monitoring of cerebral and myocardial oxygen sufficiency and circulatory parameters. Science 1977, 198, 1264–1267. [Google Scholar] [CrossRef]
- Chance, B.; Zhuang, Z.; UnAh, C.; Alter, C.; Lipton, L. Cognition-activated low-frequency modulation of light absorption in human brain. Proc. Natl. Acad. Sci. USA 1993, 90, 3770–3774. [Google Scholar] [CrossRef] [PubMed] [Green Version]
- Watanabe, E.; Maki, A.; Kawaguchi, F.; Takashiro, K.; Yamashita, Y.; Koizumi, H.; Mayanagi, Y. Non-invasive assessment of language dominance with near-infrared spectroscopic mapping. Neurosci. Lett. 1998, 256, 49–52. [Google Scholar] [CrossRef]
- Akashi, H.; Tsujii, N.; Mikawa, W.; Adachi, T.; Kirime, E.; Shirakawa, O. Prefrontal cortex activation is associated with a discrepancy between self- and observer-rated depression severities of major depressive disorder: A multichannel near-infrared spectroscopy study. J. Affect. Disord. 2015, 174, 165–172. [Google Scholar] [CrossRef]
- Takizawa, R.; Fukuda, M.; Kawasaki, S.; Kasai, K.; Mimura, M.; Pu, S.; Noda, T.; Niwa, S.I.; Okazaki, Y.; Joint Project for Psychiatric Application of Near-Infrared Spectroscopy (JPSY-NIRS) Group. Neuroimaging-aided differential diagnosis of the depressive state. Neuroimage 2014, 85, 498–507. [Google Scholar] [CrossRef]
- Ishii-Takahashi, A.; Takizawa, R.; Nishimura, Y.; Kawakubo, Y.; Hamada, K.; Okuhata, S.; Kawasaki, S.; Kuwabara, H.; Shimada, T.; Todokoro, A.; et al. Neuroimaging-aided prediction of the effect of methylphenidate in children with attention-deficit hyperactivity disorder: A randomized controlled trial. Neuropsychopharmacology 2015, 40, 2676–2685. [Google Scholar] [CrossRef] [PubMed] [Green Version]
- Delpy, D.T.; Cope, M.; van der Zee, P.; Arridge, S.; Wray, S.; Wyatt, J.S. Estimation of optical pathlength through tissue from direct time of flight measurement. Phys. Med. Biol. 1988, 33, 1433. [Google Scholar] [CrossRef] [PubMed] [Green Version]
- Tsuzuki, D.; Jurcak, V.; Singh, A.K.; Okamoto, M.; Watanabe, E.; Dan, I. Virtual spatial registration of stand-alone fNIRS data to MNI space. Neuroimage 2007, 34, 1506–1518. [Google Scholar] [CrossRef] [PubMed]
- Masuda, K.; Nakanishi, M.; Okamoto, K.; Kawashima, C.; Oshita, H.; Inoue, A.; Takita, F.; Izumi, T.; Ishitobi, Y.; Higuma, H.; et al. Different functioning of prefrontal cortex predicts treatment response after a selective serotonin reuptake inhibitor treatment in patients with major depression. J. Affect. Disord. 2017, 214, 44–52. [Google Scholar] [CrossRef]
- Bessho, H.; Shibukawa, Y.; Shintani, M.; Yajima, Y.; Suzuki, T.; Shibahara, T. Localization of palatal area in human somatosensory cortex. J. Dent. Res. 2007, 86, 265–270. [Google Scholar] [CrossRef] [Green Version]
- Parker, G.J.; Luzzi, S.; Alexander, D.C.; Wheeler-Kingshott, C.A.; Ciccarelli, O.; Ralph, M.A. Lateralization of ventral and dorsal auditory-language pathways in the human brain. Neuroimage 2005, 24, 656–666. [Google Scholar] [CrossRef]
- Hull, R.; Bortfeld, H.; Koons, S. Near-infrared spectroscopy and cortical responses to speech production. Open Neuroimaging J. 2009, 3, 26. [Google Scholar] [CrossRef] [Green Version]
- Kawakubo, Y.; Yanagi, M.; Tsujii, N.; Shirakawa, O. Repetition of verbal fluency task attenuates the hemodynamic activation in the left prefrontal cortex: Enhancing the clinical usefulness of near-infrared spectroscopy. PLoS ONE 2018, 13, e0193994. [Google Scholar] [CrossRef]
- Ogura, E.; Matsuyama, M.; Goto, T.K.; Nakamura, Y.; Koyano, K. Brain activation during oral exercises used for dysphagia rehabilitation in healthy human subjects: A functional magnetic resonance imaging study. Dysphagia 2012, 27, 353–360. [Google Scholar] [CrossRef]
- Suwabe, K.; Hyodo, K.; Fukuie, T.; Ochi, G.; Inagaki, K.; Sakairi, Y.; Soya, H. Positive mood while exercising influences beneficial effects of exercise with music on prefrontal executive function: A functional NIRS study. Neuroscience 2021, 454, 61–71. [Google Scholar] [CrossRef]
- Tachtsidis, I.; Leung, T.S.; Devoto, L.; Delpy, D.T.; Elwell, C.E. Measurement of frontal lobe functional activation and related systemic effects: A near-infrared spectroscopy investigation. In Advances in Experimental Medicine and Biology; Springer: Boston, MA, USA, 2008; Volume 614, pp. 397–403. [Google Scholar] [CrossRef]
- Cooper, R.; Selb, J.; Gagnon, L.; Phillip, D.; Schytz, H.W.; Iversen, H.K.; Ashina, M.; Boas, D.A. A systematic comparison of motion artifact correction techniques for functional near-infrared spectroscopy. Front. Neurosci. 2012, 6, 147. [Google Scholar] [CrossRef] [Green Version]
- Tian, F.; Sharma, V.; Kozel, F.A.; Liu, H. Functional near-infrared spectroscopy to investigate hemodynamic responses to deception in the prefrontal cortex. Brain Res. 2009, 1303, 120–130. [Google Scholar] [CrossRef]
- Cui, X.; Bray, S.; Reiss, A.L. Functional near infrared spectroscopy (NIRS) signal improvement based on negative correlation between oxygenated and deoxygenated hemoglobin dynamics. Neuroimage 2010, 49, 3039–3046. [Google Scholar] [CrossRef] [Green Version]
- Gaillard, A.; Fehring, D.J.; Rossell, S.L. Sex differences in executive control: A systematic review of functional neuroimaging studies. Eur. J. Neurosci. 2021, 53, 2592–2611. [Google Scholar] [CrossRef]
- Lee, C.H.; Sugiyama, T.; Kataoka, A.; Kudo, A.; Fujino, F.; Chen, Y.W.; Mitsuyama, Y.; Nomura, S.; Yoshioka, T. Analysis for distinctive activation patterns of pain and itchy in the human brain cortex measured using near infrared spectroscopy (NIRS). PLoS ONE 2013, 8, e75360. [Google Scholar] [CrossRef]
- Hiraba, H.; Inoue, M.; Gora, K.; Sato, T.; Nishimura, S.; Yamaoka, M.; Kumakura, A.; Ono, S.; Wakasa, H.; Nakayama, E.; et al. Facial vibrotactile stimulation activates the parasympathetic nervous system: Study of salivary secretion, heart rate, pupillary reflex, and functional near-infrared spectroscopy activity. BioMed Res. Int. 2014, 2014, 910812. [Google Scholar] [CrossRef]
- Ihme, K.; Unni, A.; Zhang, M.; Rieger, J.W.; Jipp, M. Recognizing frustration of drivers from face video recordings and brain activation measurements with functional near-infrared spectroscopy. Front. Hum. Neurosci. 2018, 12, 327. [Google Scholar] [CrossRef] [Green Version]
- Seiyama, A.; Seki, J.; Tanabe, H.C.; Sase, I.; Takatsuki, A.; Miyauchi, S.; Eda, H.; Hayashi, S.; Imaruoka, T.; Iwakura, T.; et al. Circulatory basis of fMRI signals: Relationship between changes in the hemodynamic parameters and BOLD signal intensity. NeuroImage 2004, 21, 1204–1214. [Google Scholar] [CrossRef]
- Takeuchi, M.; Hori, E.; Takamoto, K.; Tran, A.H.; Satoru, K.; Ishikawa, A.; Ono, T.; Endo, S.; Nishijo, H. Brain cortical mapping by simultaneous recording of functional near infrared spectroscopy and electroencephalograms from the whole brain during right median nerve stimulation. Brain Topogr. 2009, 22, 197–214. [Google Scholar] [CrossRef] [Green Version]
- Ono, Y.; Kobayashi, G.; Hayama, R.; Ikuta, R.; Onozouka, M.; Wake, H.; Shimada, A.; Shibuya, T.; Tamaki, K. Prefrontal hemodynamic changes associated with subjective sense of occlusal discomfort. BioMed Res. Int. 2015, 2015, 395705. [Google Scholar] [CrossRef]
- Narita, N.; Kamiya, K.; Makiyama, Y.; Iwaki, S.; Komiyama, O.; Ishii, T.; Wake, H. Prefrontal modulation during chewing performance in occlusal dysesthesia patients: A functional near-infrared spectroscopy study. Clin. Oral Investig. 2019, 23, 1181–1196. [Google Scholar] [CrossRef] [PubMed] [Green Version]
Figure 1.
Task paradigm. The experimental design consisted of four 70 s task blocks. NIRS holder on the head during the four task measurements (top). Schematic depiction of the tongue posture during each task (second line). Images of the control stature, anterior palatal mucosa (white circle), TPM balloon-type probe, and TPM device (third line). The black line indicates sequential 30 s stimulation periods and 40 s rest periods (bottom). Task 1: resting tongue position for control. Task 2: MTP60% against anterior palatal mucosa; 5 s, three times (open arrow). Task 3: insertion of the TPM probe (gray arrow). Task 4: MTP60% via the TPM probe; 5 s, three times (solid arrow). NIRS, near-infrared spectroscopy; TPM, tongue pressure measurement, MTP, maximum tongue pressure; MTP60%, approximately 60% of the MTP for the experimental tongue pressure.

Figure 2.
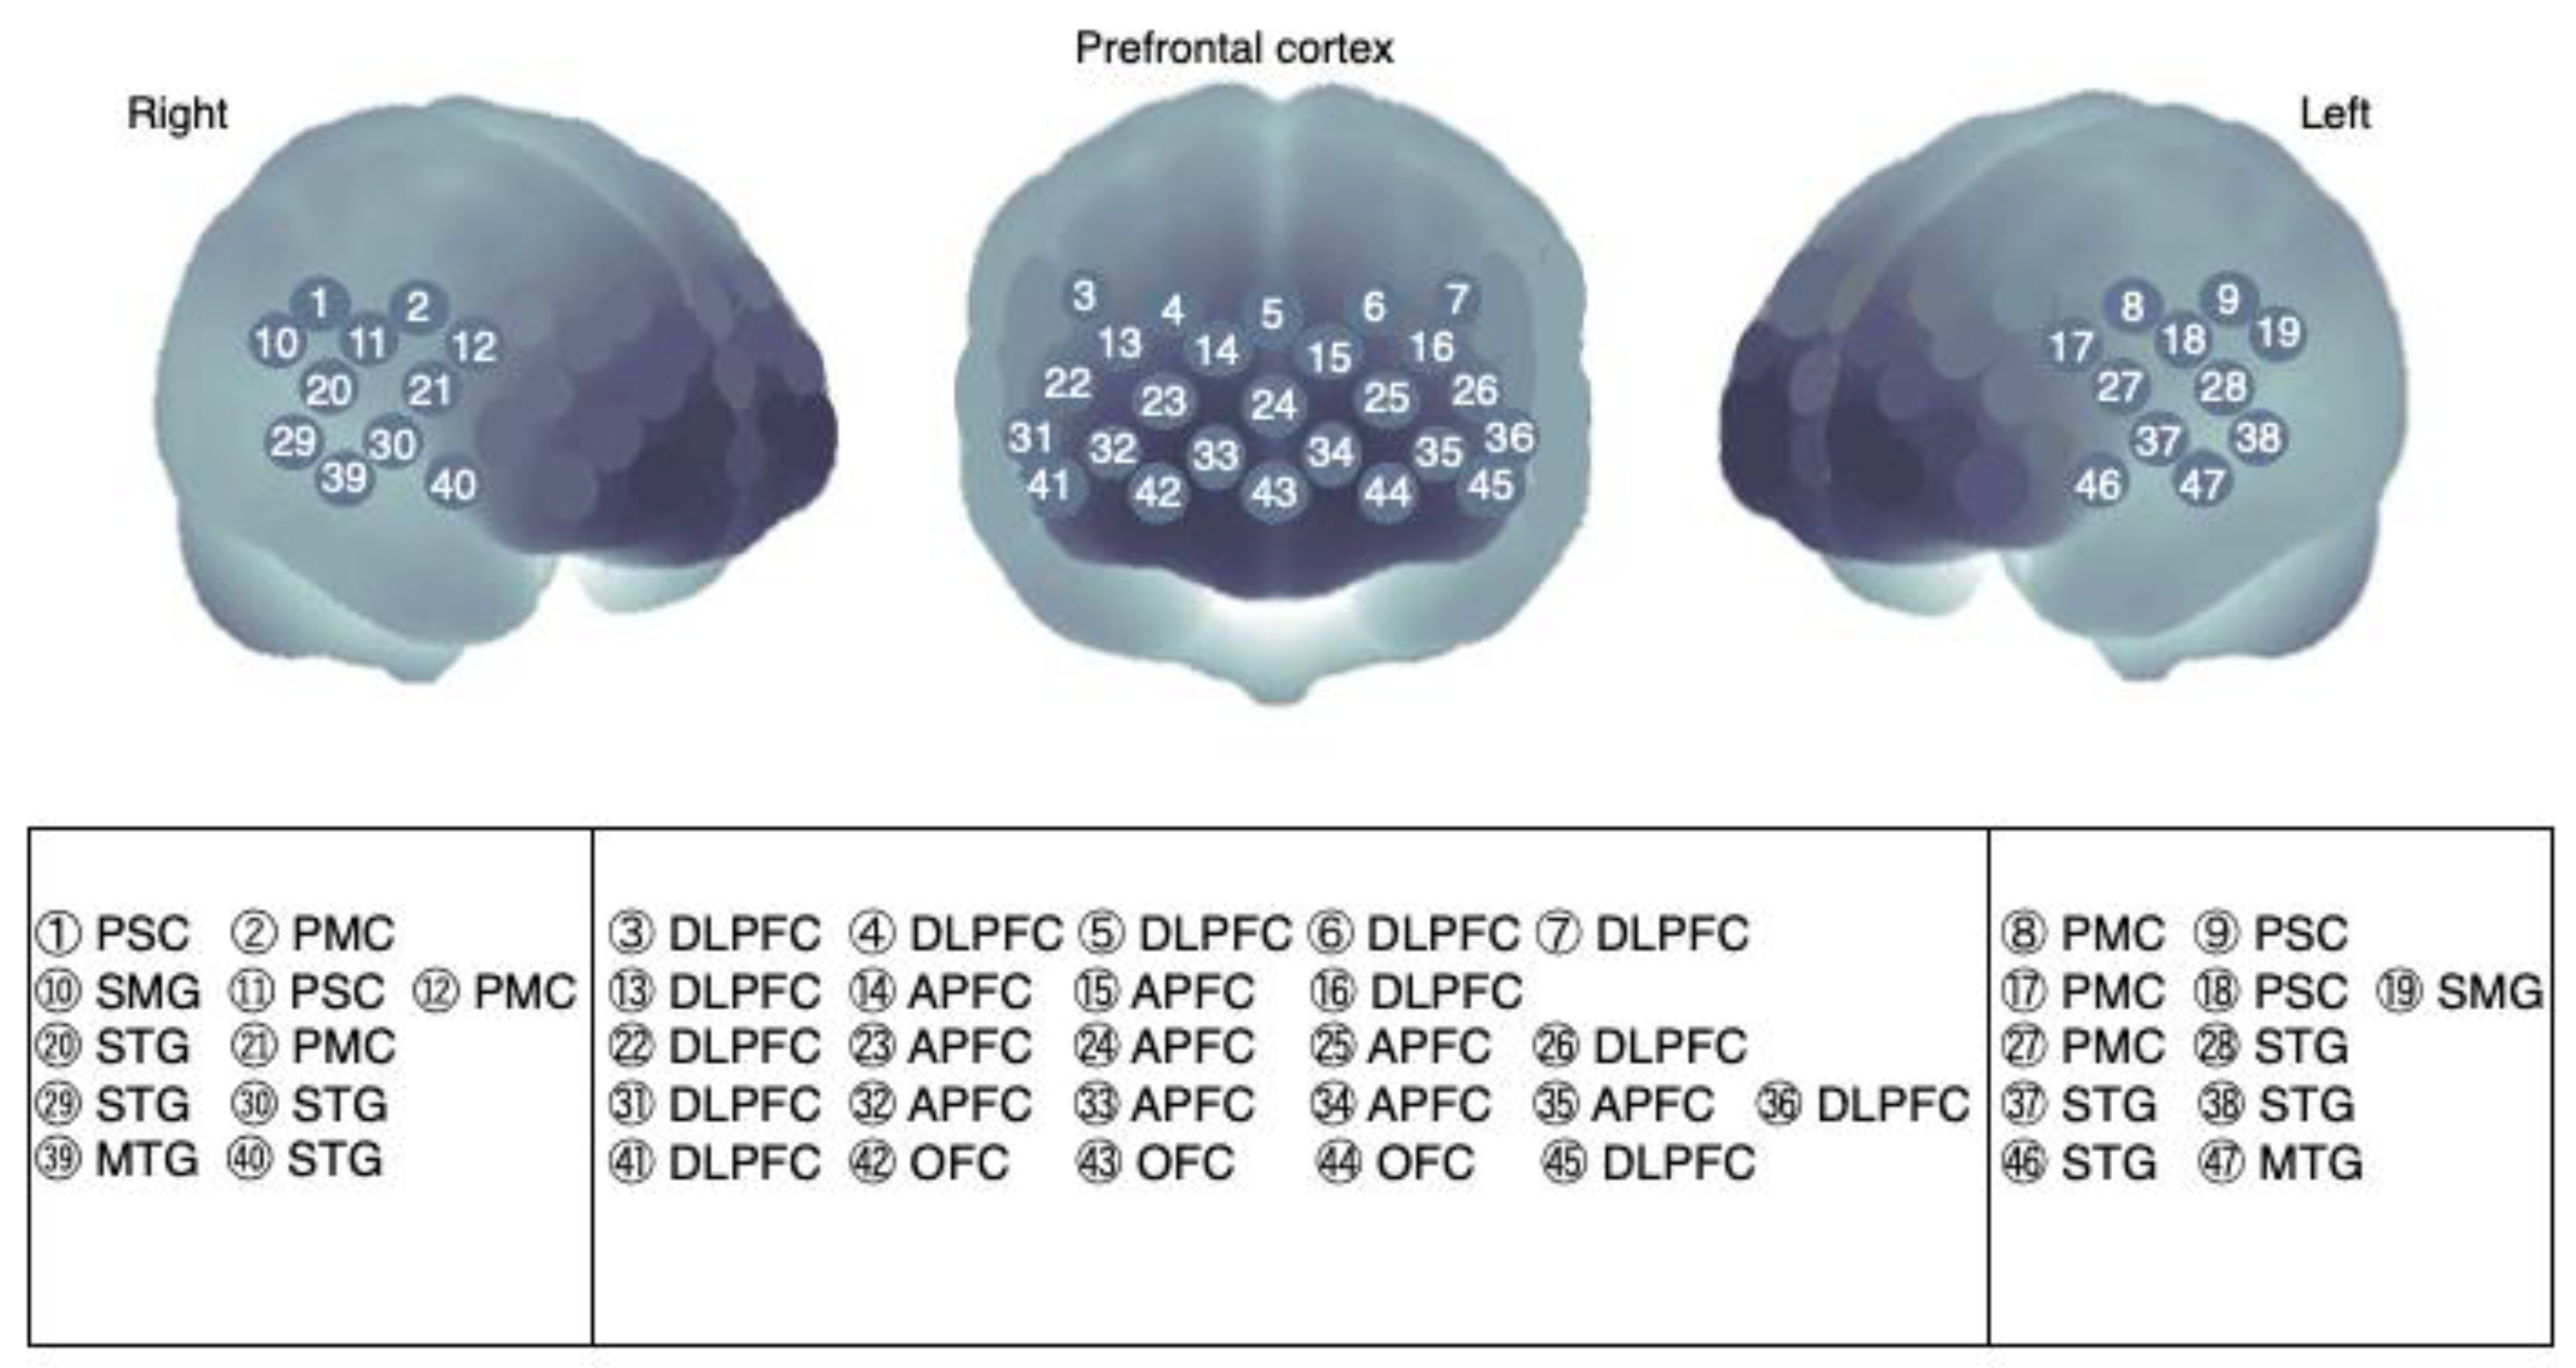
Channel allocation on the cerebral cortex. The encircled number represents near-infrared spectroscopy (NIRS: ETG-7100) 47 channels around the right temporal, frontal, and left temporal regions. PSC, primary sensory cortex; PMC, primary motor cortex; SMG, supramarginal gyrus; STG, superior temporal gyrus; MTG, middle temporal gyrus; DLPFC, dorsolateral prefrontal cortex; APFC, anterior prefrontal cortex; OFC, orbitofrontal cortex. Brain cortex schema was designed based on the report by Tsuzuki, et al. [23].
Figure 2.
Channel allocation on the cerebral cortex. The encircled number represents near-infrared spectroscopy (NIRS: ETG-7100) 47 channels around the right temporal, frontal, and left temporal regions. PSC, primary sensory cortex; PMC, primary motor cortex; SMG, supramarginal gyrus; STG, superior temporal gyrus; MTG, middle temporal gyrus; DLPFC, dorsolateral prefrontal cortex; APFC, anterior prefrontal cortex; OFC, orbitofrontal cortex. Brain cortex schema was designed based on the report by Tsuzuki, et al. [23].

Figure 3.
Typical waveform and topography. The left figures show near-infrared spectroscopy signal-integration waveforms at channel 27 around the left primary motor cortex; oxygenated hemoglobin (Oxy-Hb, red); deoxygenated hemoglobin (Deoxy-Hb, blue); and total hemoglobin (Total-Hb, green). Horizontal axis: time (min). The start of the tasks is indicated by four colors (light green, light yellow, turquoise-blue, and ocher, respectively), while the end of the tasks is indicated by pink. Vertical axis: Oxy-Hb values using arbitrary units (mM–mm). The center topography depict Oxy-Hb activation at the end of the tasks (pink) from overhead view and the range bar (±0.50 mm, mol–mm). (A) Resting tongue position for control. (B) MTP60% against the anterior palatal mucosa, 5 s, three times (open arrow). (C) Insertion of the TPM probe (gray arrow). (D) MTP60% via the TPM probe, 5 s, three times (solid arrow). MTP, maximum tongue pressure; MTP60%, approximately 60% of the MTP for the experimental tongue pressure; TPM, tongue pressure measurement.

Figure 4.
Activation analysis. Significant maps were represented by Dunnett’s post hoc test of oxygenated hemoglobin (Oxy-Hb) comparing Tasks 2, 3, and 4 with Task 1 (control task) (n = 13; Dunnett’s test after analysis of variance corrected false discovery rate, p < 0.05). Red-colored circles indicate significant increases compared with Task 1; blue-colored circles indicate significant decreases compared with Task 1. (A) Task 2 vs. Task 1; (B) Task 3 vs. Task 1; (C) Task 4 vs. Task 1.

Figure 5.
Correlation analysis. Functional connectivity between MTP60% values and changes in oxygenated hemoglobin (ΔOxy-Hb). White-encircled numbers represent significant, positively correlated channels (n = 13; p < 0.05). Scatter plots of MTP60% and ΔOxy-Hg deviation (bottom). MTP60%, approximately 60% of the MTP for the experimental tongue pressure.


Table 1.
Tongue pressure measurements.
| Participants n = 13 | Sex (kPa) | MTP1 (kPa) | MTP2 (kPa) | MTP3 (kPa) | Test Pressure (kPa) |
|---|---|---|---|---|---|
| a | M | 43.4 | 48.7 | 56.5 | 30.0 |
| b | M | 50.4 | 49.6 | 51.0 | 30.0 |
| c | M | 41.5 | 41.5 | 41.6 | 24.0 |
| d | M | 40.8 | 37.3 | 41.9 | 24.0 |
| e | M | 20.5 | 16.7 | 27.8 | 16.0 |
| f | M | 32.4 | 39.1 | 37.0 | 20.0 |
| g | F | 40.2 | 43.4 | 40.3 | 22.0 |
| h | F | 35.4 | 41.7 | 41.0 | 23.0 |
| i | M | 52.2 | 53.7 | 50.8 | 30.0 |
| j | M | 41.4 | 43.7 | 43.8 | 26.0 |
| k | M | 35.4 | 35.2 | 36.7 | 22.0 |
| l | M | 36.1 | 36.5 | 38.9 | 23.0 |
| m | F | 47.7 | 48.1 | 45.6 | 27.0 |
| Male | Female | p-Value | |||
| MTP (Mean ± SD, kPa) | 40.7 ± 9.0 | 42.6 ± 4.1 | p = 0.74 | ||
Participants performed the maximum tongue pressure (MTP) task three times. Experimental tongue pressures (MTP60%) were adjusted to approximately 60% of the mean MTP. kPa, kilopascals.
Publisher’s Note: MDPI stays neutral with regard to jurisdictional claims in published maps and institutional affiliations. |
© 2022 by the authors. Licensee MDPI, Basel, Switzerland. This article is an open access article distributed under the terms and conditions of the Creative Commons Attribution (CC BY) license (https://creativecommons.org/licenses/by/4.0/).
Share and Cite
MDPI and ACS Style
Miyata, H.; Tani, R.; Toratani, S.; Okamoto, T. Effects of Tongue Pressure on Cerebral Blood Volume Dynamics: A Functional Near-Infrared Spectroscopy Study. Brain Sci. 2022, 12, 296. https://doi.org/10.3390/brainsci12020296
AMA Style
Miyata H, Tani R, Toratani S, Okamoto T. Effects of Tongue Pressure on Cerebral Blood Volume Dynamics: A Functional Near-Infrared Spectroscopy Study. Brain Sciences. 2022; 12(2):296. https://doi.org/10.3390/brainsci12020296
Chicago/Turabian StyleMiyata, Hidemasa, Ryouji Tani, Shigeaki Toratani, and Tetsuji Okamoto. 2022. "Effects of Tongue Pressure on Cerebral Blood Volume Dynamics: A Functional Near-Infrared Spectroscopy Study" Brain Sciences 12, no. 2: 296. https://doi.org/10.3390/brainsci12020296
Note that from the first issue of 2016, this journal uses article numbers instead of page numbers. See further details here.