
Altered Structural Covariance of Insula, Cerebellum and Prefrontal Cortex Is Associated with Somatic Symptom Levels in Irritable Bowel Syndrome (IBS)

 , ,
, ,
Abstract
:1. Introduction
2. Materials and Methods
2.1. Subjects
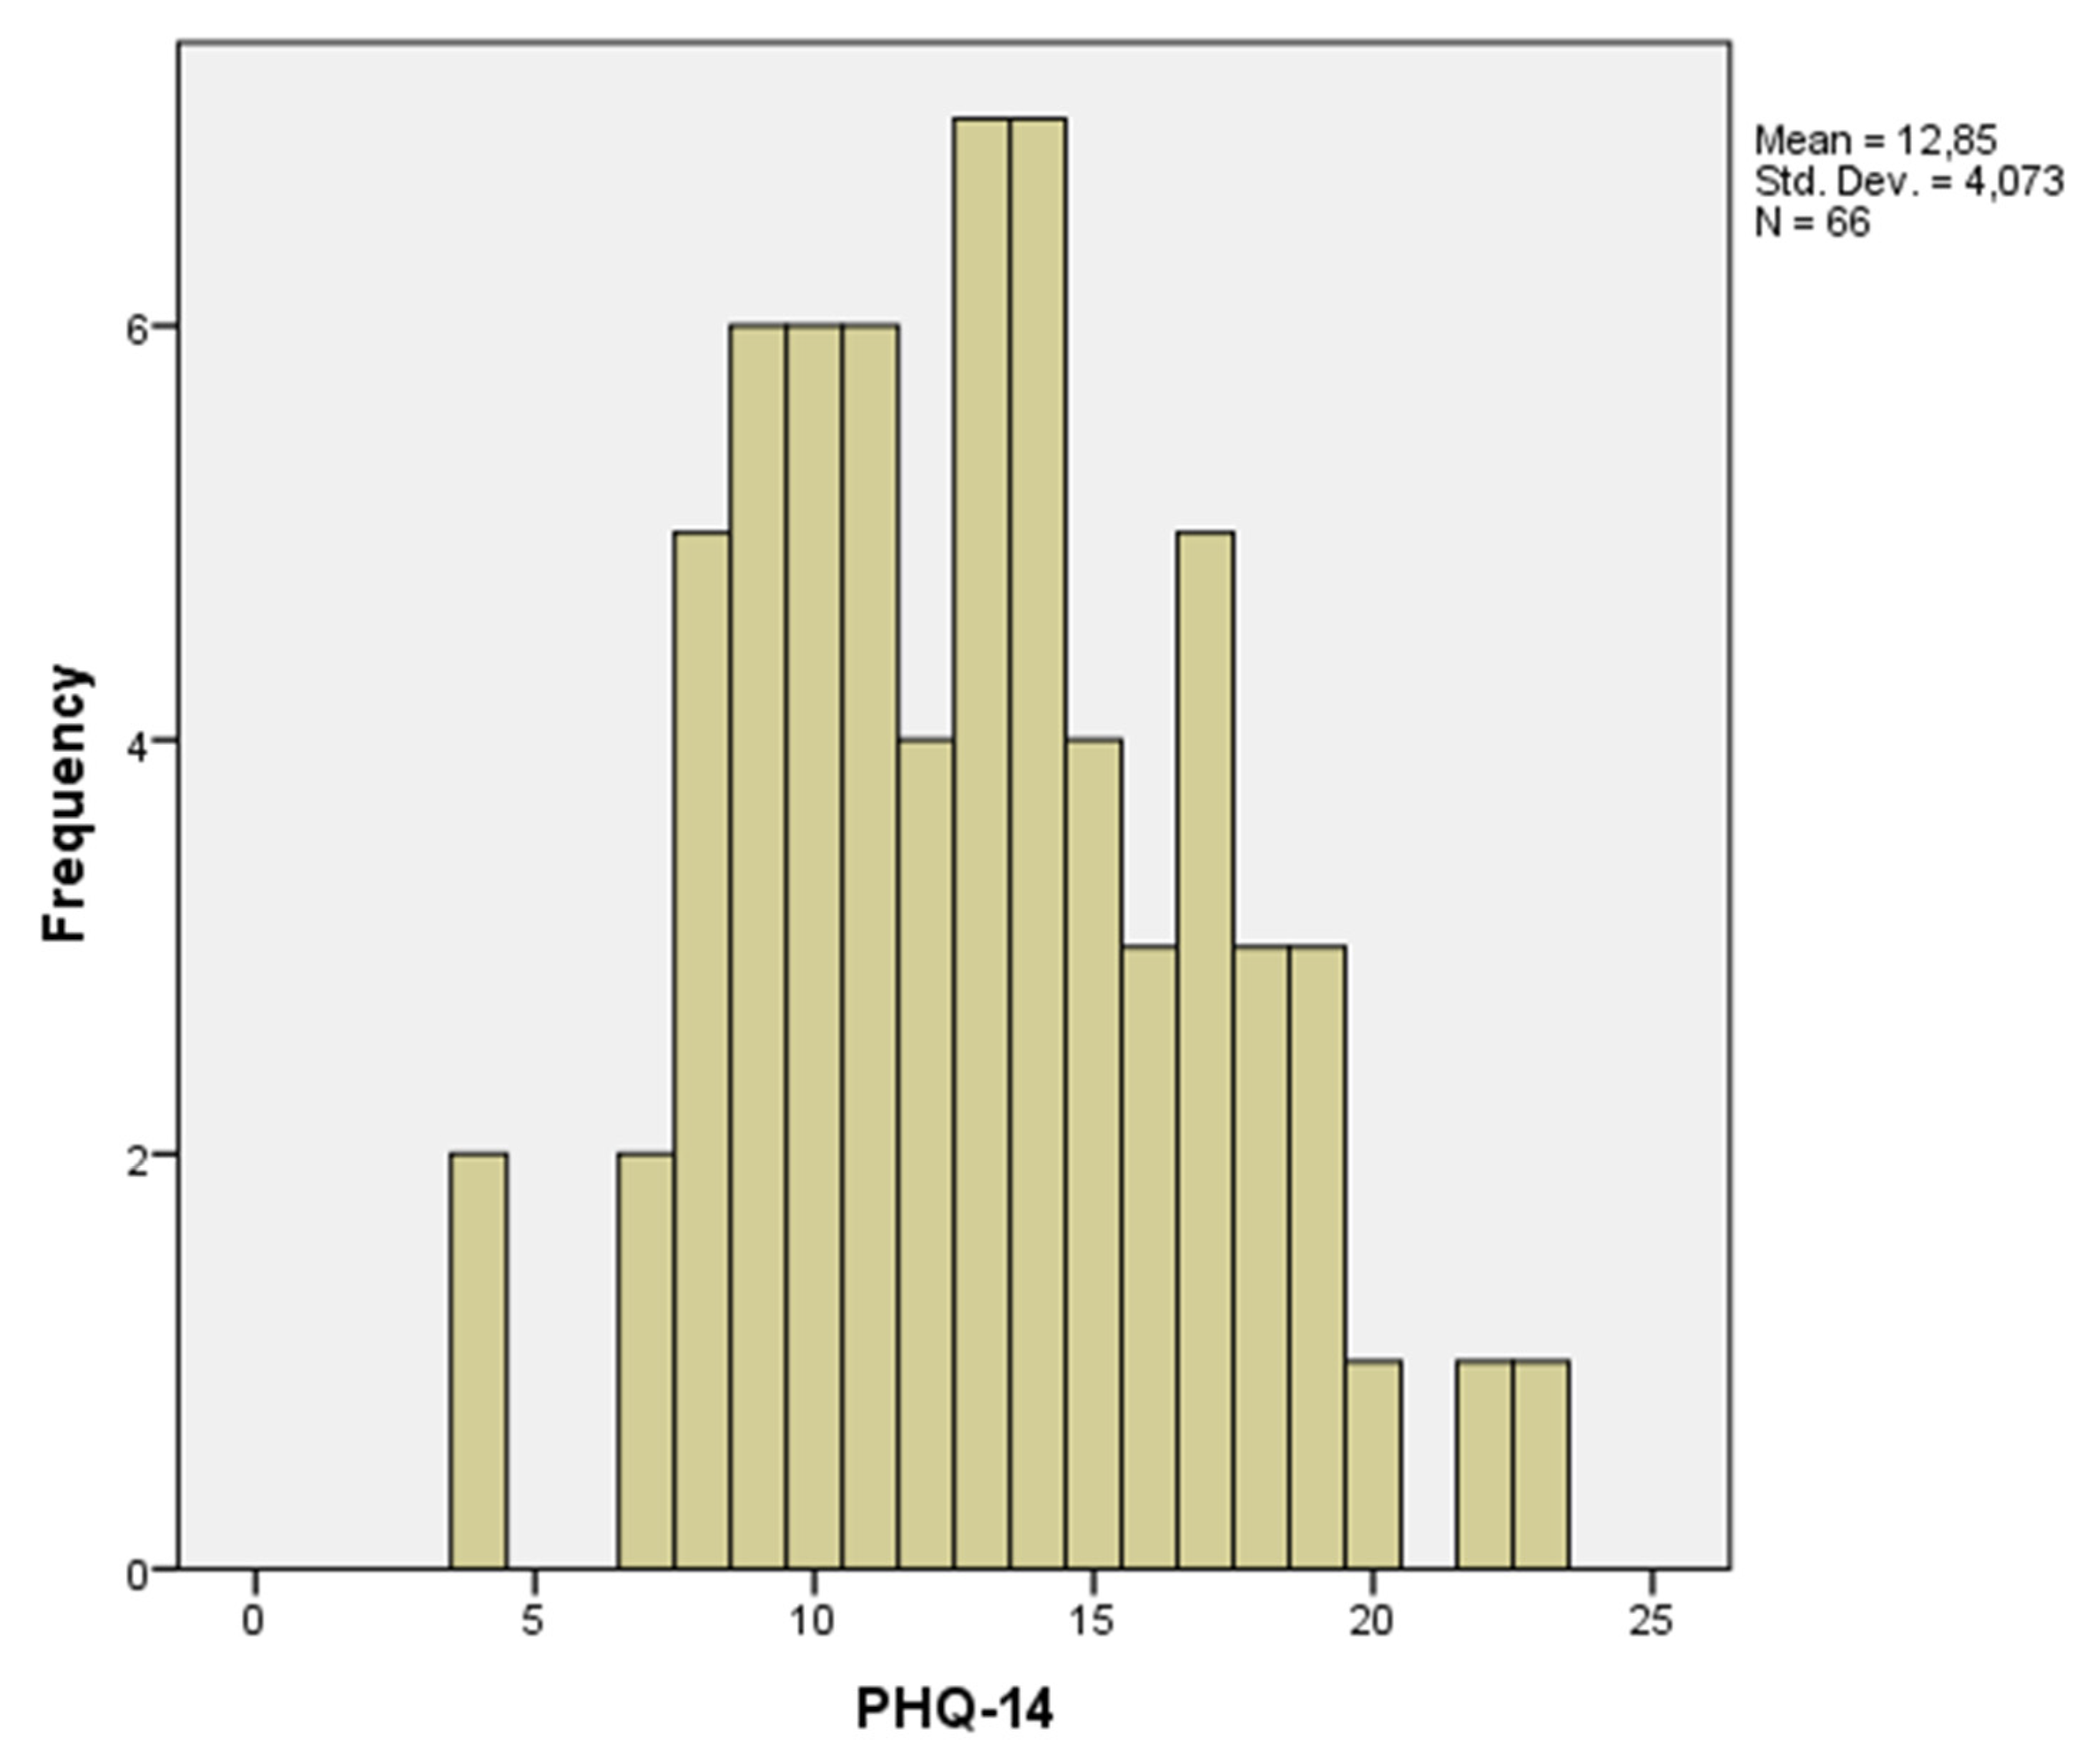
2.2. Questionnaires
2.3. Brain Imaging Acquisition
2.4. Structural MRI Analysis
2.5. Regions of Interest (ROIs)
2.6. Data Analysis
2.6.1. Node Definition
2.6.2. Groups
2.6.3. Networks of Structural Covariance
2.6.4. Graph Analysis
- showing the highest strength,
- showing the lowest path length,
- showing the lowest local cluster coefficient,
- showing the highest betweenness centrality.
2.6.5. Statistical Analysis
3. Results
3.1. Population
3.2. Structural Covariance Network
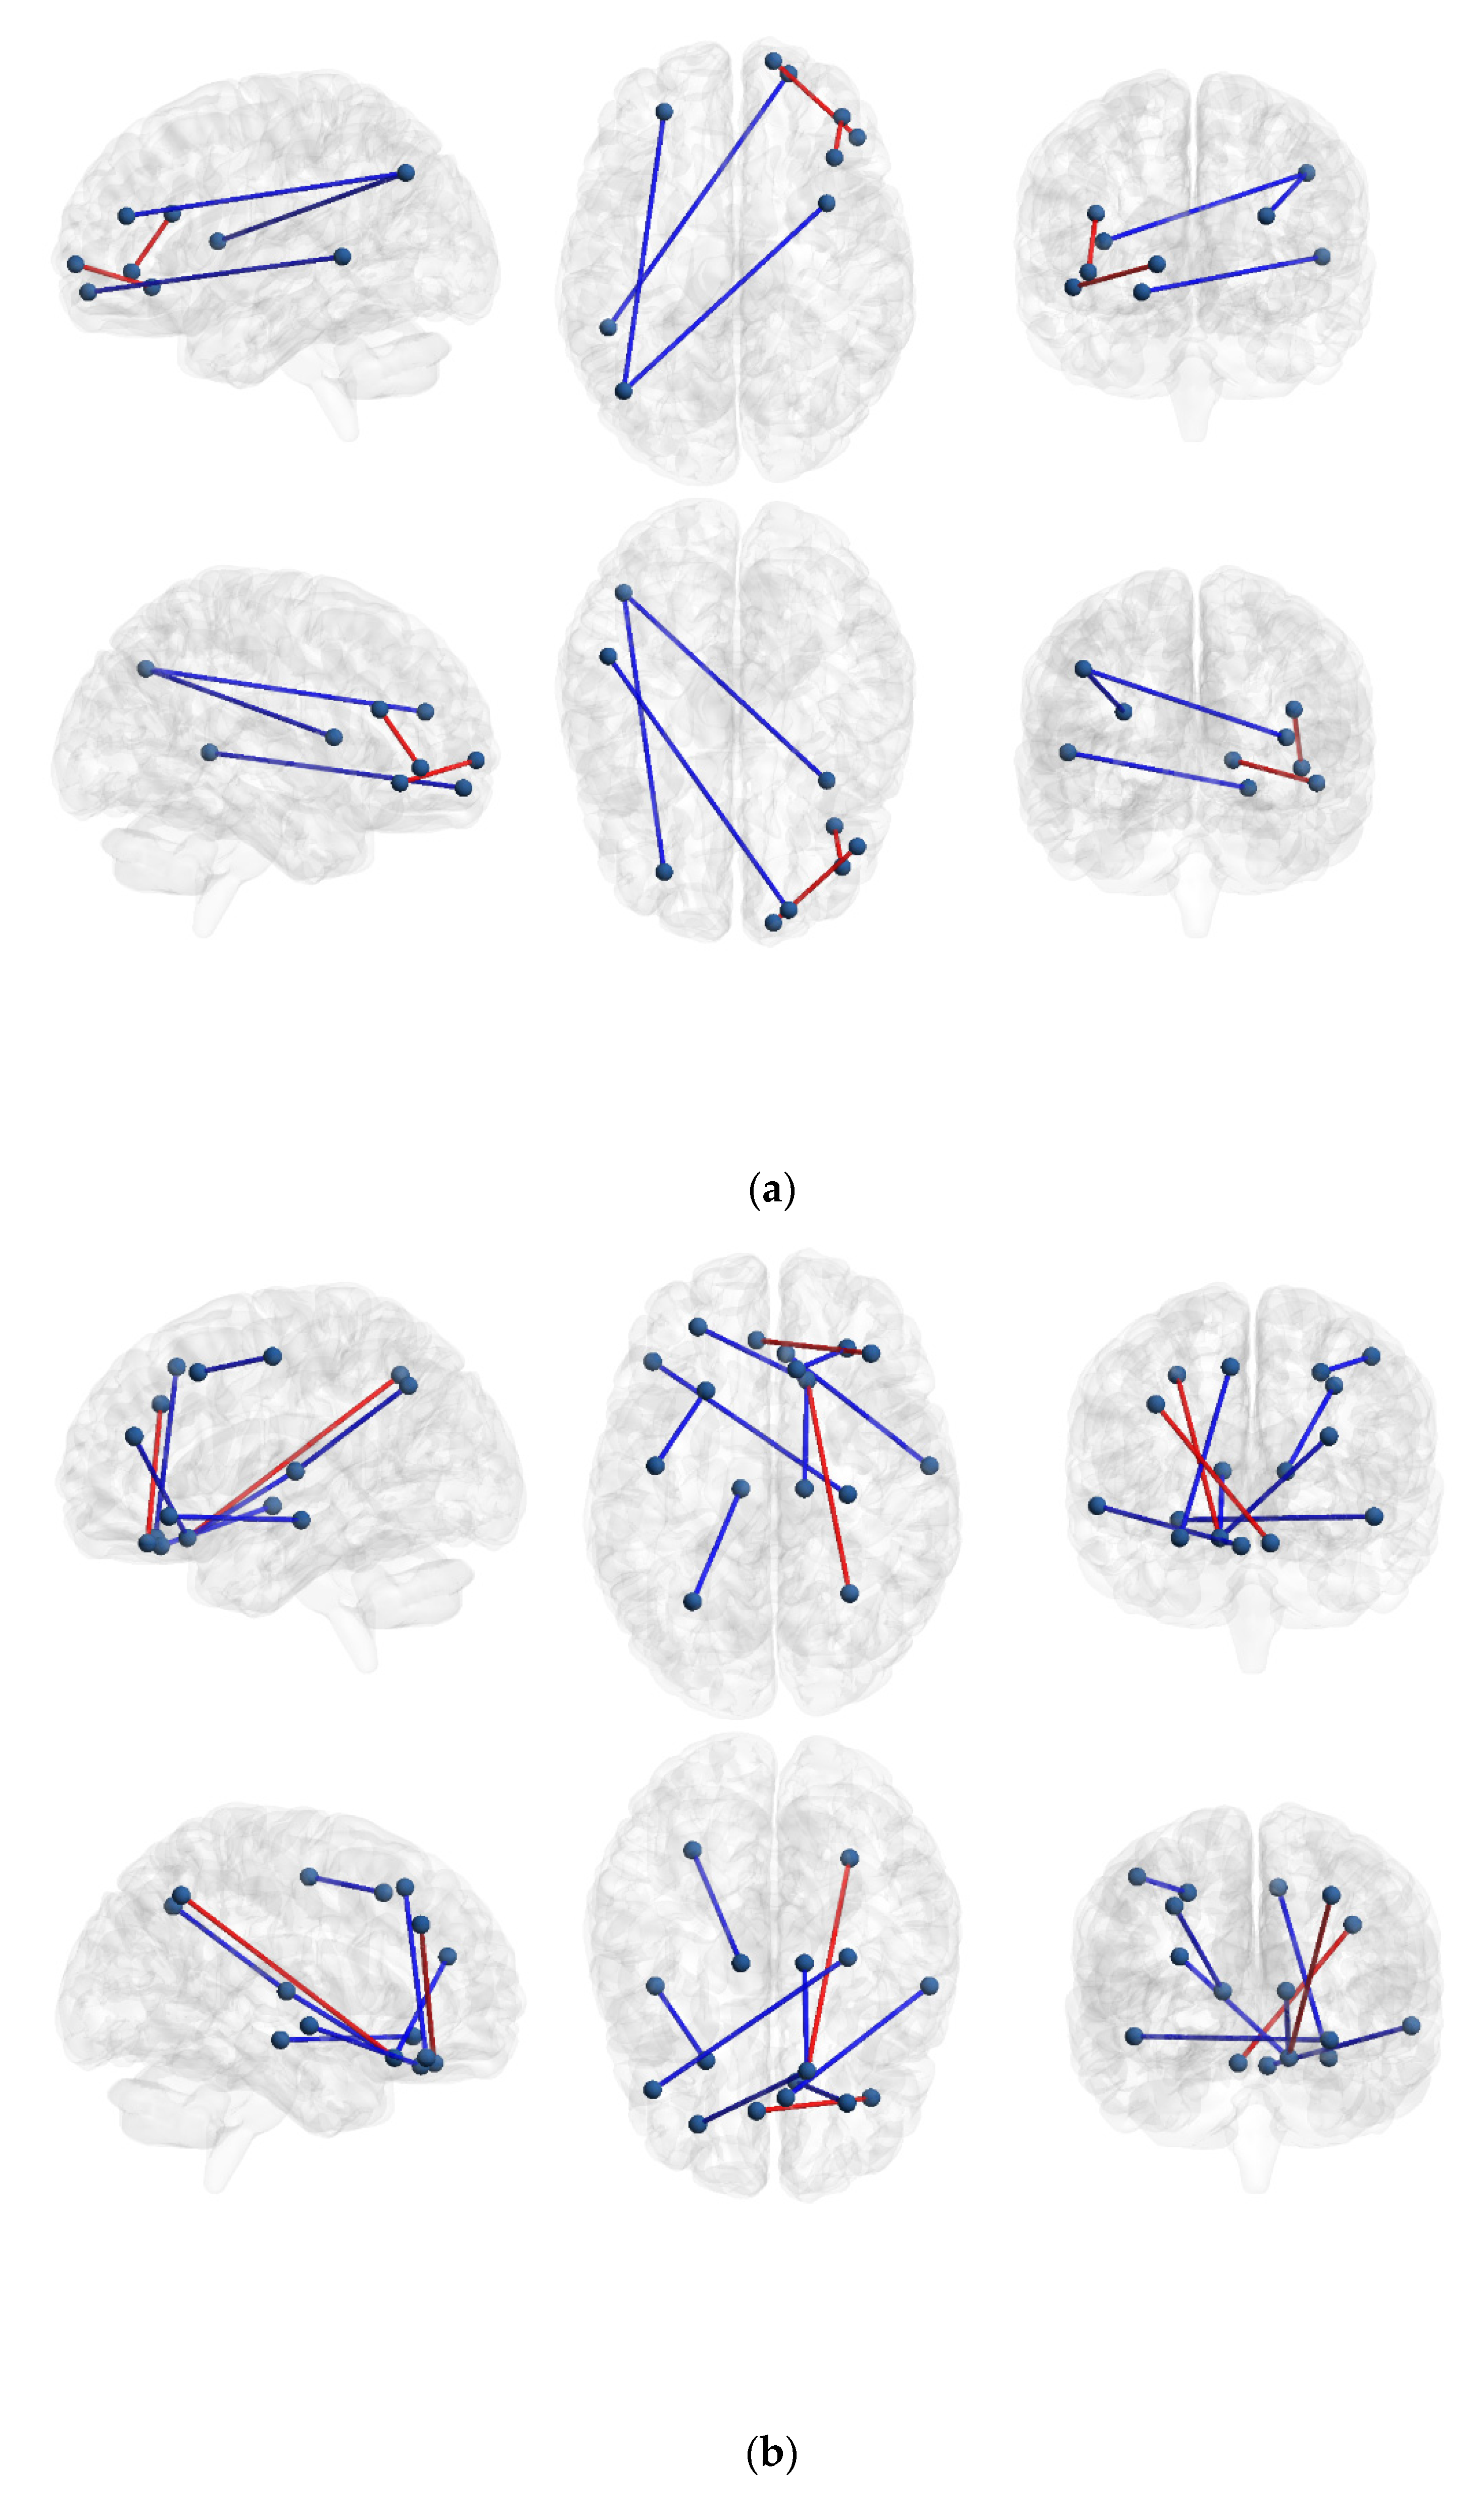
3.2.1. IBS High Somatization vs. IBS Low Somatization
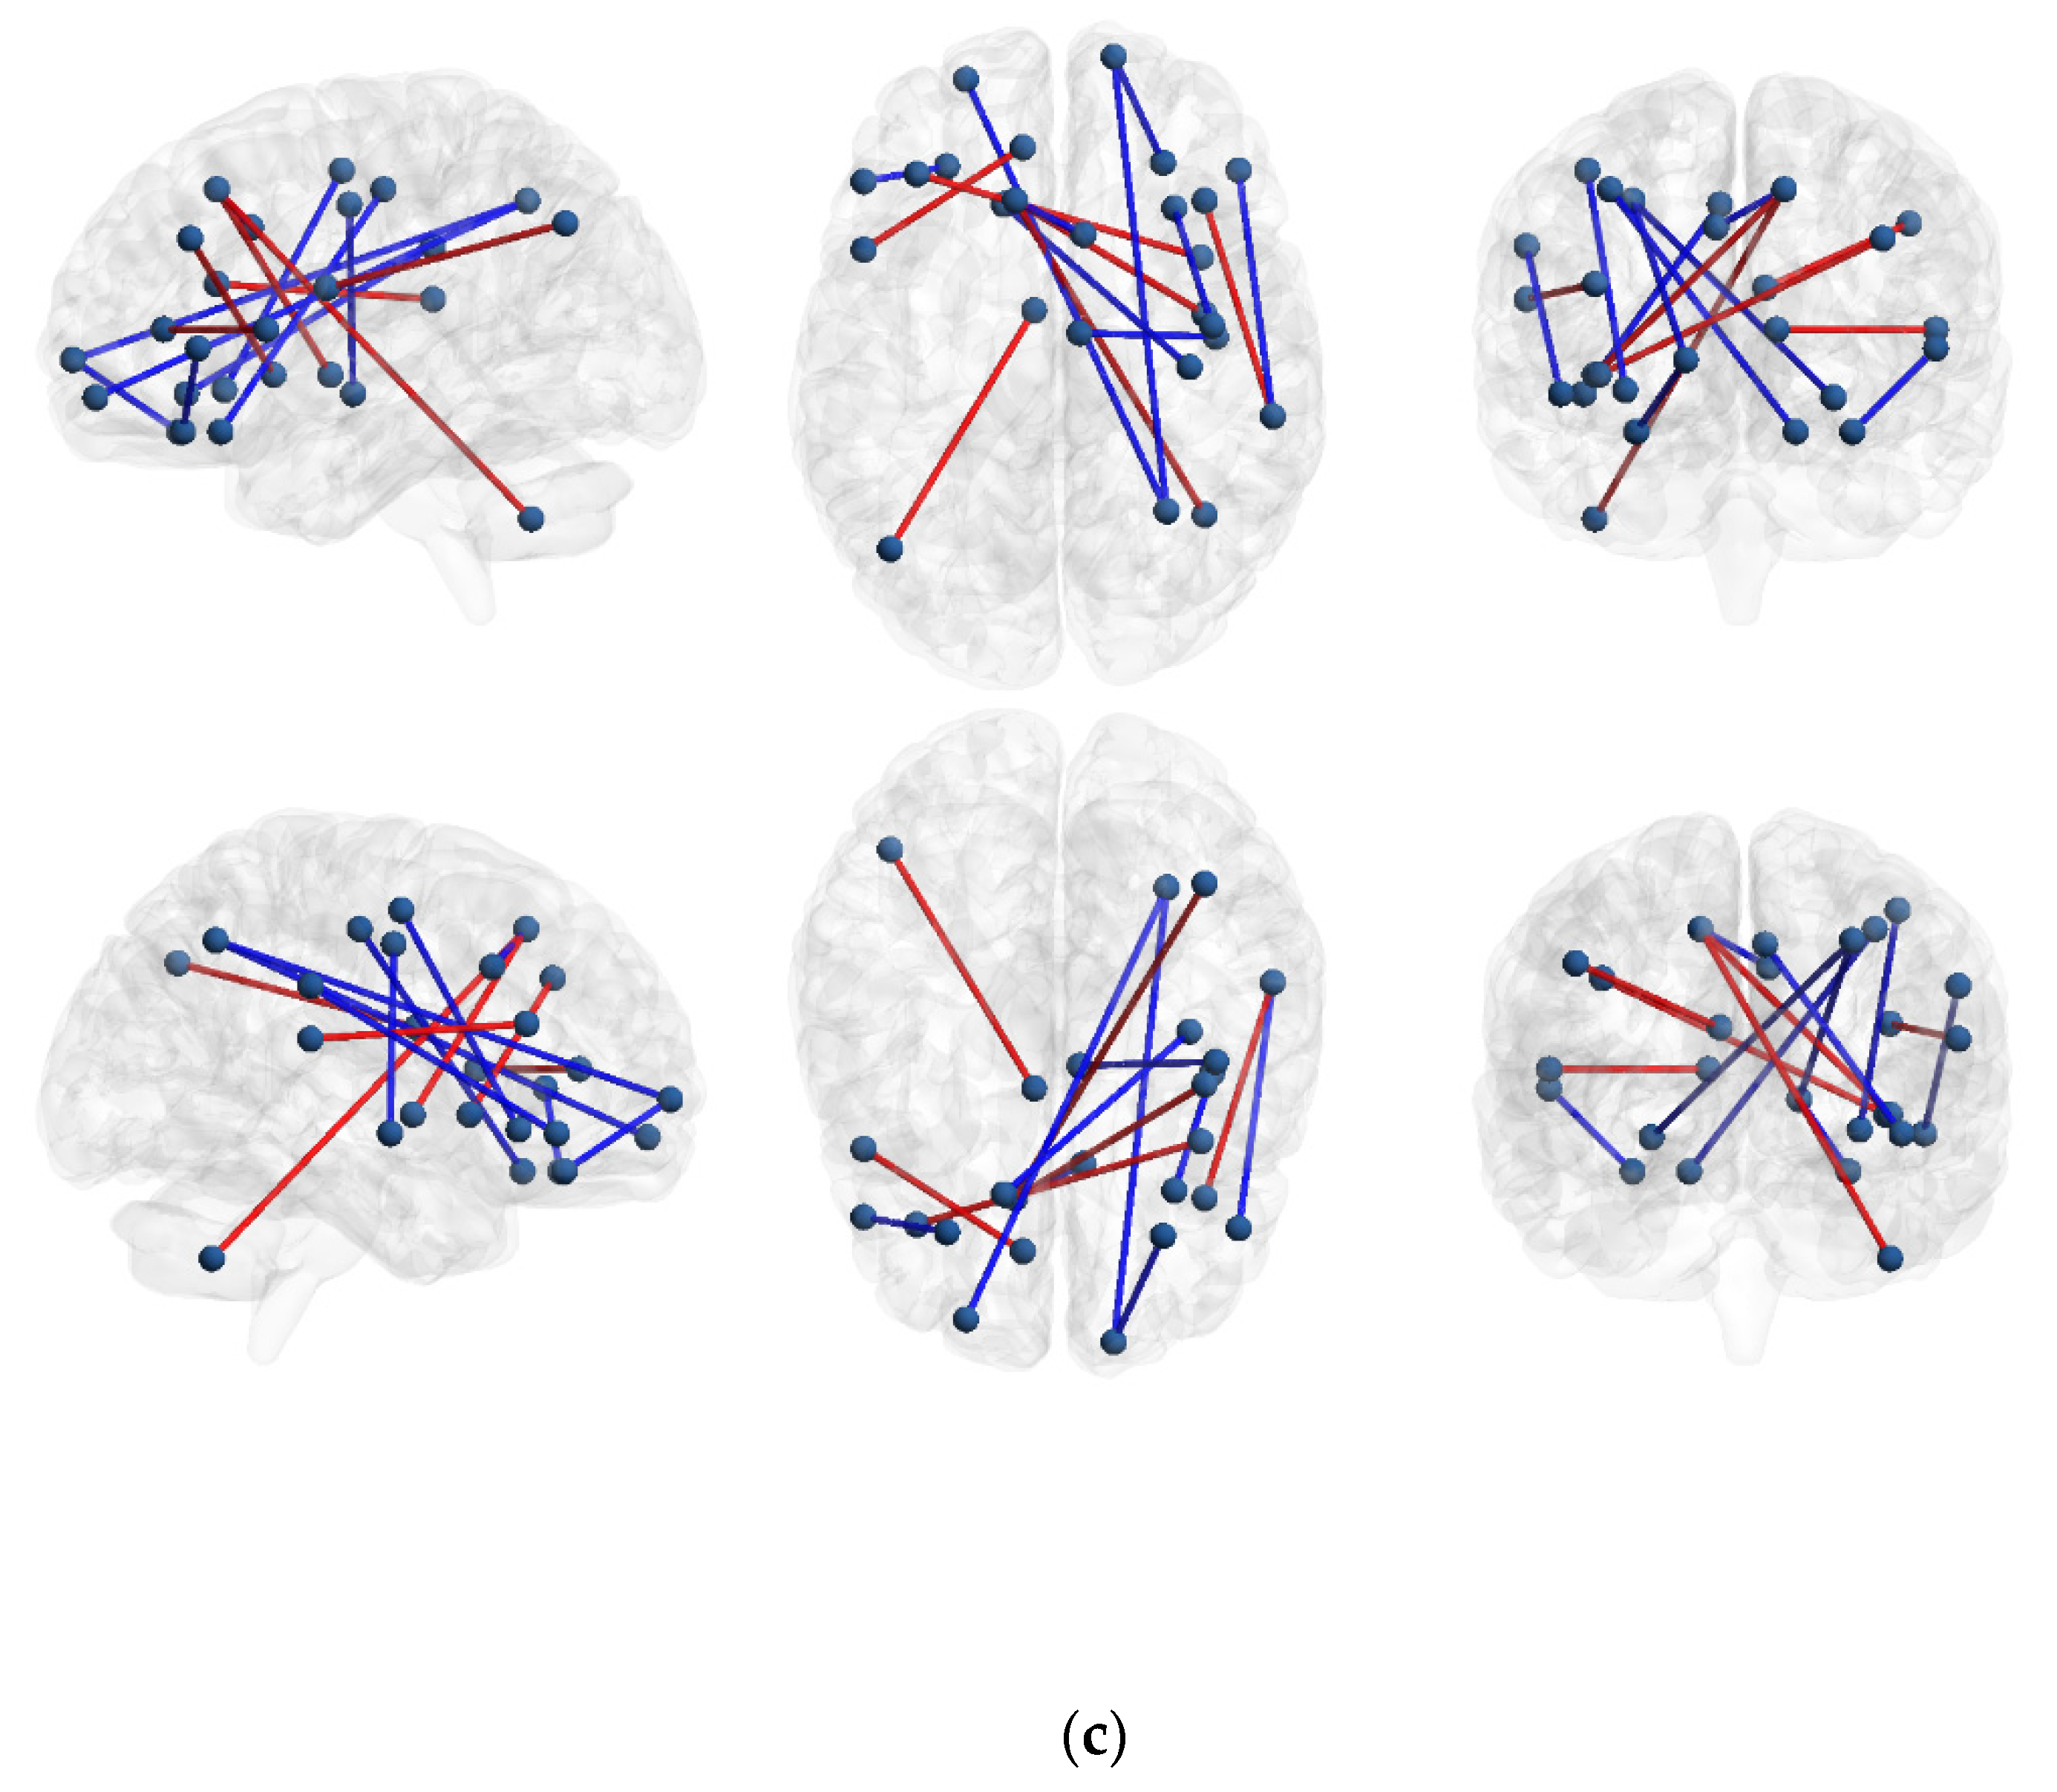
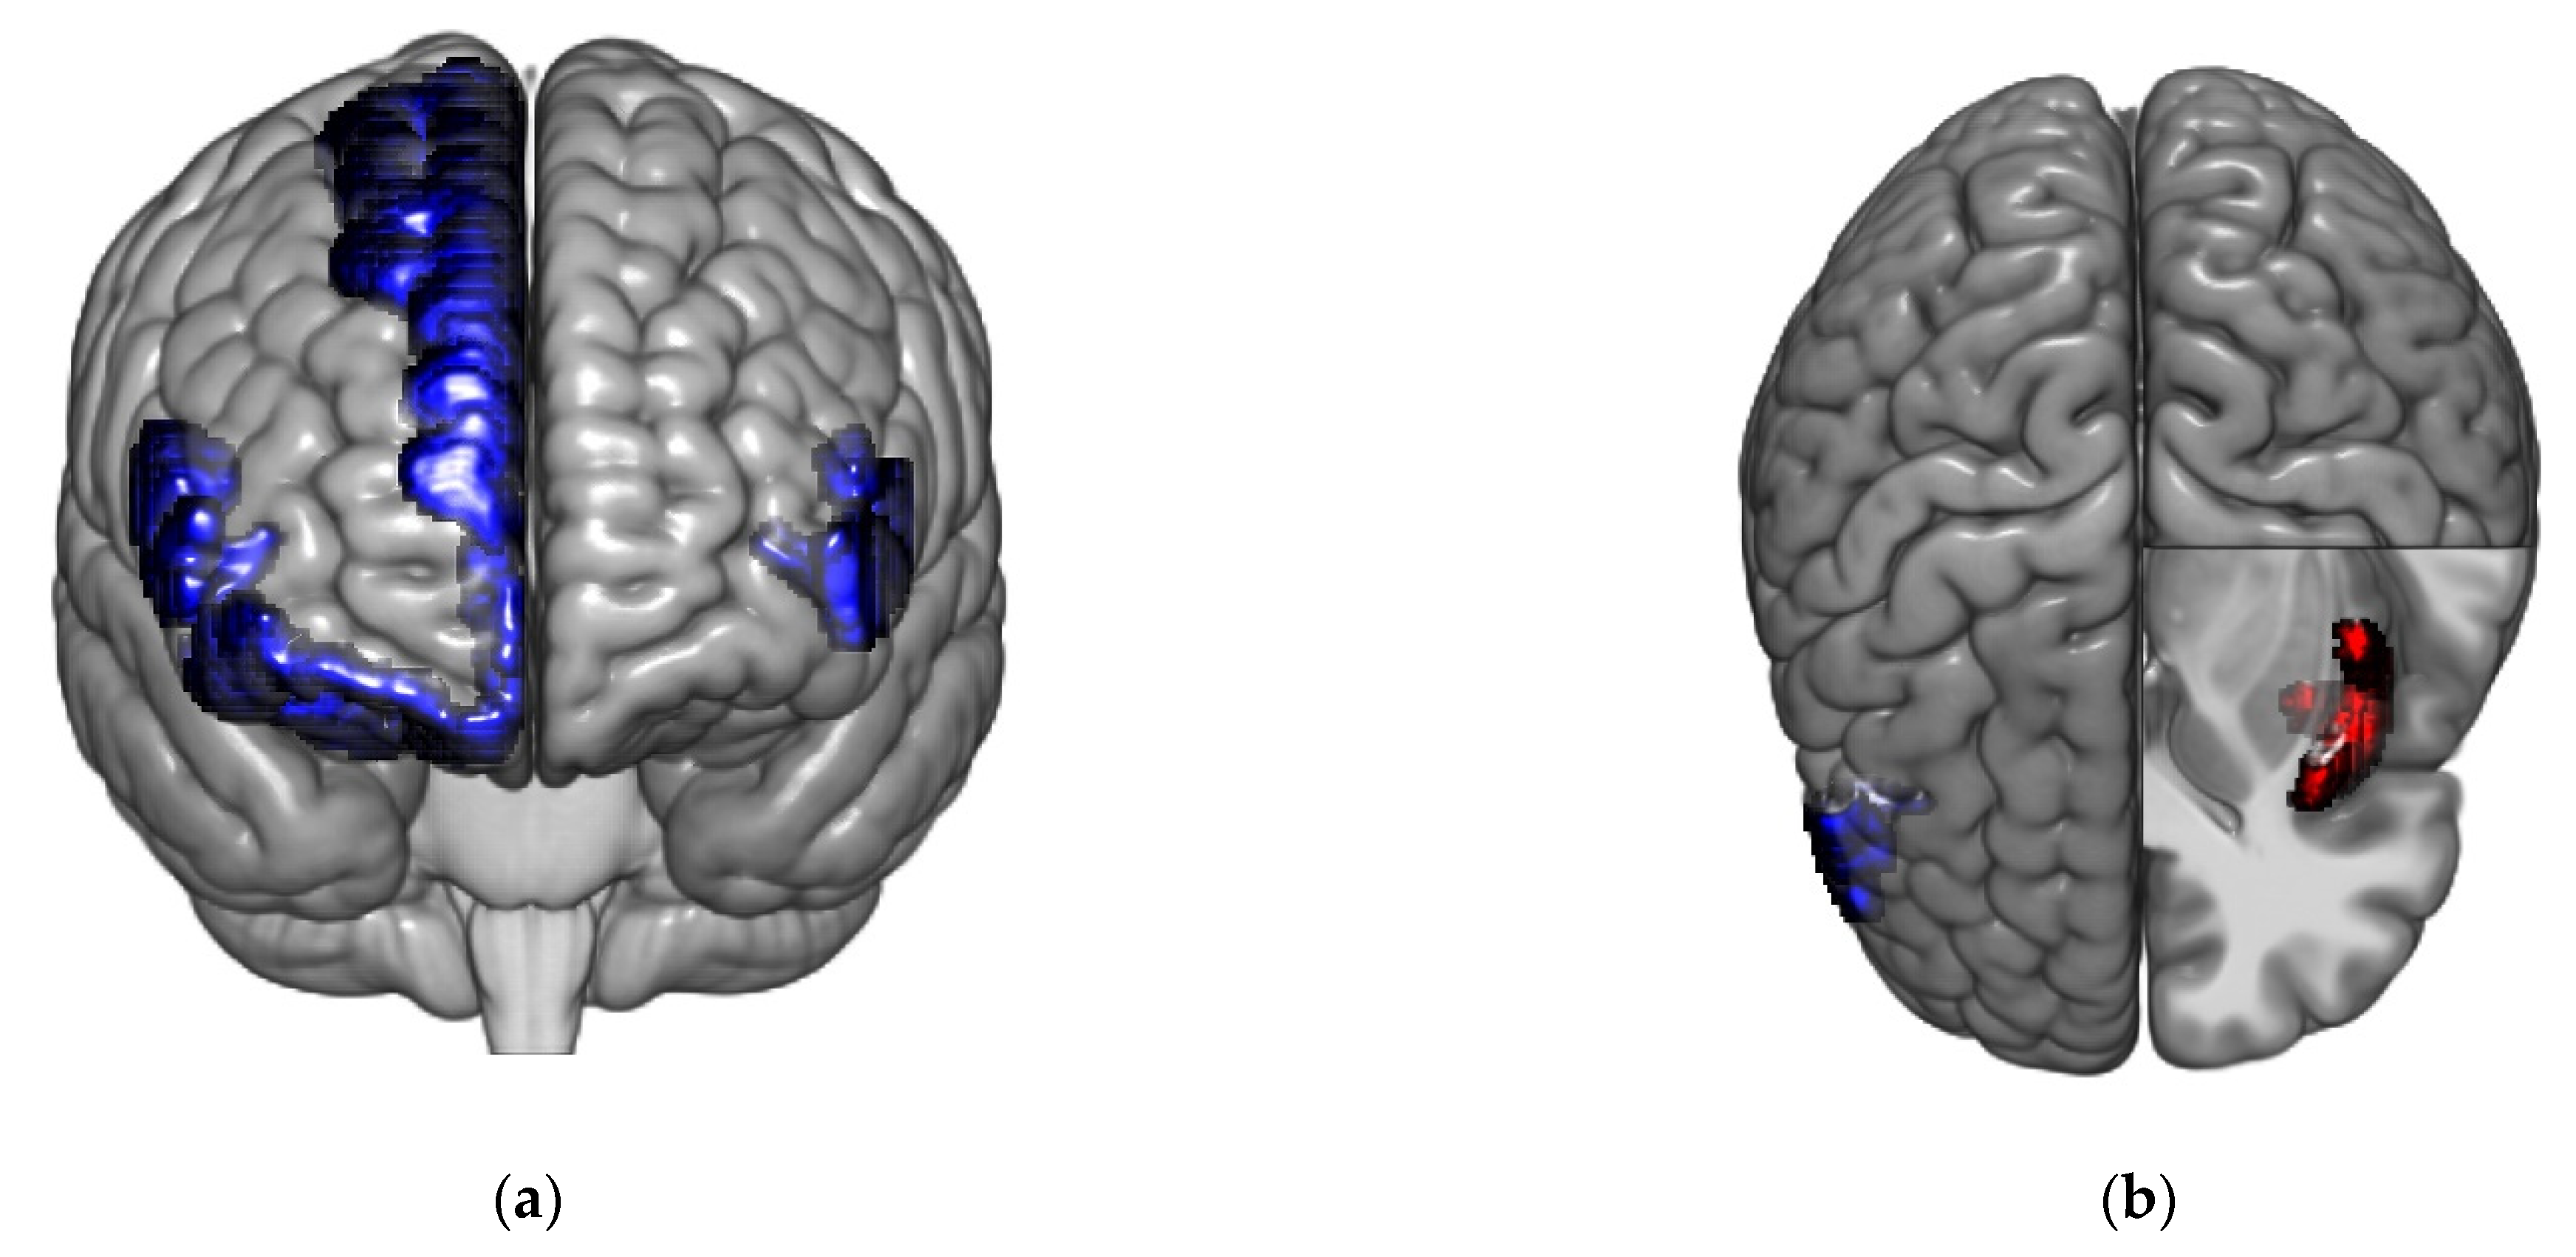
3.2.2. IBS High and Low Somatization vs. Healthy Controls
3.2.3. Graph Analysis
3.2.4. Local Graph Measures IBS High Somatization vs. IBS Low Somatization
3.2.5. Hubs and Hub Scores IBS High Somatization vs. IBS Low Somatization
3.2.6. Local Graph Measures IBS High and Low Somatization vs. Healthy Controls
3.2.7. Hubs and Hub Scores in Healthy Controls vs. IBS High Somatization and IBS Low Somatization
3.3. Modular Structure
4. Discussion
4.1. The Novelty of Using Graph Analysis Comparing IBS Subgroups Based on Somatization Level
4.2. Involvement of the Prefrontal Cortex and Insula
4.3. The Importance of the Cerebellum in IBS Low Somatization
4.4. Study Results in Relation to Previous Studies
4.5. Clinical Relevance and Implications
4.6. Limitations
5. Conclusions
Supplementary Materials
Author Contributions
Funding
Institutional Review Board Statement
Informed Consent Statement
Data Availability Statement
Conflicts of Interest
References
- Drossman, D.A. Functional Gastrointestinal Disorders: History, Pathophysiology, Clinical Features, and Rome IV. Gastroenterology 2016, 150, 1262–1279.e2. [Google Scholar] [CrossRef] [PubMed] [Green Version]
- Lacy, B.E.; Mearin, F.; Chang, L.; Chey, W.D.; Lembo, A.J.; Simren, M.; Spiller, R. Bowel Disorders. Gastroenterology 2016, 150, 1393–1407.e5. [Google Scholar] [CrossRef] [PubMed] [Green Version]
- Enck, P.; Aziz, Q.; Barbara, G.; Farmer, A.D.; Fukudo, S.; Mayer, E.A.; Niesler, B.; Quigley, E.M.M.; Rajilic-Stojanovic, M.; Schemann, M.; et al. Irritable bowel syndrome. Nat. Rev. Dis. Prim. 2016, 2, 1–24. [Google Scholar] [CrossRef] [PubMed] [Green Version]
- De Gucht, V.; Maes, S. Explaining medically unexplained symptoms: Toward a multidimensional, theory-based approach to somatization. J. Psychosom. Res. 2006, 60, 349–352. [Google Scholar] [CrossRef] [PubMed]
- De Gucht, V.; Fischler, B. Somatization: A Critical Review of Conceptual and Methodological Issues. J. Psychosom. Res. 2002, 43, 1–9. [Google Scholar] [CrossRef] [PubMed]
- Patel, P.; Bercik, P.; Morgan, D.G.; Bolino, C.; Pintos-Sanchez, M.I.; Moayyedi, P.; Ford, A.C. Irritable bowel syndrome is significantly associated with somatisation in 840 patients, which may drive bloating. Aliment. Pharmacol. Ther. 2015, 41, 449–458. [Google Scholar] [CrossRef] [Green Version]
- Vu, J.; Kushnir, V.; Cassell, B.; Gyawali, C.P.; Sayuk, G.S. The impact of psychiatric and extraintestinal comorbidity on quality of life and bowel symptom burden in functional GI disorders. Neurogastroenterol. Motil. 2014, 26, 1323–1332. [Google Scholar] [CrossRef] [PubMed]
- Grinsvall, C.; Törnblom, H.; Tack, J.; Van Oudenhove, L.; Simrén, M. Relationships between psychological state, abuse, somatization and visceral pain sensitivity in irritable bowel syndrome. United Eur. Gastroenterol. J. 2018, 6, 300–309. [Google Scholar] [CrossRef]
- Van Oudenhove, L.; Törnblom, H.; Störsrud, S.; Tack, J.; Simrén, M. Depression and Somatization Are Associated With Increased Postprandial Symptoms in Patients With Irritable Bowel Syndrome. Gastroenterology 2016, 150, 866–874. [Google Scholar] [CrossRef] [PubMed] [Green Version]
- Lackner, J.; Jaccard, J.; Baum, C.; Smith, A.; Krasner, S.; Katz, L.; Firth, R.; Raby, T.; Powell, C. Patient-Reported Outcomes for Irritable Bowel Syndrome Are Associated With Patients’ Severity Ratings of Gastrointestinal Symptoms and Psychological Factors. Clin. Gastroenterol. Hepatol. 2011, 9, 957–964.e1. [Google Scholar] [CrossRef] [PubMed] [Green Version]
- May, A. Experience-dependent structural plasticity in the adult human brain. Trends Cogn. Sci. 2011, 15, 475–482. [Google Scholar] [CrossRef] [PubMed]
- Kuner, R.; Flor, H. Erratum: Structural plasticity and reorganisation in chronic pain. Nat. Rev. Neurosci. 2017, 18, 113. [Google Scholar] [CrossRef] [PubMed] [Green Version]
- Tatu, K.; Costa, T.; Nani, A.; Diano, M.; Quarta, D.G.; Duca, S.; Apkarian, A.V.; Fox, P.T.; Cauda, F. How do morphological alterations caused by chronic pain distribute across the brain? A meta-analytic co-alteration study. NeuroImage Clin. 2017, 18, 15–30. [Google Scholar] [CrossRef]
- Chua, C.S.; Bai, C.-H.; Shiao, C.-Y.; Hsu, C.-Y.; Cheng, C.-W.; Yang, K.-C.; Chiu, H.-W.; Hsu, J.-L. Negative correlation of cortical thickness with the severity and duration of abdominal pain in Asian women with irritable bowel syndrome. PLoS ONE 2017, 12, e0183960. [Google Scholar] [CrossRef] [Green Version]
- Labus, J.S.; Van Horn, J.; Gupta, A.; Alaverdyan, M.; Torgerson, C.; Ashe-McNalley, C.; Irimia, A.; Hong, J.-Y.; Naliboff, B.; Tillisch, K.; et al. Multivariate morphological brain signatures predict patients with chronic abdominal pain from healthy control subjects. Pain 2015, 156, 1545–1554. [Google Scholar] [CrossRef] [PubMed]
- Hong, J.-Y.; Labus, J.S.; Jiang, Z.; Ashe-McNalley, C.; Dinov, I.; Gupta, A.; Shi, Y.; Stains, J.; Heendeniya, N.; Smith, S.R.; et al. Regional Neuroplastic Brain Changes in Patients with Chronic Inflammatory and Non-Inflammatory Visceral Pain. PLoS ONE 2014, 9, e84564. [Google Scholar] [CrossRef] [PubMed] [Green Version]
- Labus, J.S.; Dinov, I.D.; Jiang, Z.; Ashe-McNalley, C.; Zamanyan, A.; Shi, Y.; Hong, J.-Y.; Gupta, A.; Tillisch, K.; Ebrat, B.; et al. Irritable bowel syndrome in female patients is associated with alterations in structural brain networks. Pain 2014, 155, 137–149. [Google Scholar] [CrossRef] [Green Version]
- Piché, M.; Chen, J.-I.; Roy, M.; Poitras, P.; Bouin, M.; Rainville, P. Thicker Posterior Insula Is Associated With Disease Duration in Women With Irritable Bowel Syndrome (IBS) Whereas Thicker Orbitofrontal Cortex Predicts Reduced Pain Inhibition in Both IBS Patients and Controls. J. Pain 2013, 14, 1217–1226. [Google Scholar] [CrossRef]
- Weaver, K.R.; Sherwin, L.B.; Walitt, B.; Melkus, G.D.; Henderson, W.A. Neuroimaging the brain-gut axis in patients with irritable bowel syndrome. World J. Gastrointest. Pharmacol. Ther. 2016, 7, 320–333. [Google Scholar] [CrossRef]
- Neblett, R.; Cohen, H.; Choi, Y.; Hartzell, M.M.; Williams, M.; Mayer, T.G.; Gatchel, R.J. The Central Sensitization Inventory (CSI): Establishing Clinically Significant Values for Identifying Central Sensitivity Syndromes in an Outpatient Chronic Pain Sample. J. Pain 2013, 14, 438–445. [Google Scholar] [CrossRef] [Green Version]
- Yunus, M.B. Central Sensitivity Syndromes: A New Paradigm and Group Nosology for Fibromyalgia and Overlapping Conditions, and the Related Issue of Disease versus Illness. Semin. Arthritis Rheum. 2008, 37, 339–352. [Google Scholar] [CrossRef] [PubMed]
- Bassett, D.S.; Bullmore, E. Human brain networks in health and disease. Curr. Opin. Neurol. 2009, 22, 340–347. [Google Scholar] [CrossRef] [Green Version]
- Rubinov, M.; Sporns, O. Complex network measures of brain connectivity: Uses and interpretations. NeuroImage 2010, 52, 1059–1069. [Google Scholar] [CrossRef] [PubMed]
- Alexander-Bloch, A.; Giedd, J.; Bullmore, E. Imaging structural co-variance between human brain regions. Nat. Rev. Neurosci. 2013, 14, 322–336. [Google Scholar] [CrossRef] [Green Version]
- Liu, P.; Zeng, F.; Yang, F.; Wang, J.; Liu, X.; Wang, Q.; Zhou, G.; Zhang, D.; Zhu, M.; Zhao, R.; et al. Altered structural covariance of the striatum in functional dyspepsia patients. Neurogastroenterol. Motil. 2014, 26, 1144–1154. [Google Scholar] [CrossRef] [PubMed]
- Turkiewicz, J.; Bhatt, R.R.; Wang, H.; Vora, P.; Krause, B.; Sauk, J.S.; Jacobs, J.P.; Bernstein, C.N.; Kornelsen, J.; Labus, J.S.; et al. Altered brain structural connectivity in patients with longstanding gut inflammation is correlated with psychological symptoms and disease duration. NeuroImage Clin. 2021, 30, 102613. [Google Scholar] [CrossRef] [PubMed]
- Kutch, J.J.; Ichesco, E.; Hampson, J.P.; Labus, J.S.; Farmer, M.A.; Martucci, K.; Ness, T.; Deutsch, G.; Apkarian, A.V.; Mackey, S.; et al. Brain signature and functional impact of centralized pain: A multidisciplinary approach to the study of chronic pelvic pain (MAPP) network study. Pain 2017, 158, 1979–1991. [Google Scholar] [CrossRef]
- Tillisch, K.; Mayer, E.A.; Labus, J.S. Quantitative Meta-analysis Identifies Brain Regions Activated During Rectal Distension in Irritable Bowel Syndrome. Gastroenterology 2011, 140, 91–100. [Google Scholar] [CrossRef] [PubMed] [Green Version]
- Longstreth, G.F.; Thompson, W.G.; Chey, W.D.; Houghton, L.A.; Mearin, F.; Spiller, R.C. Functional Bowel Disorders. Gastroenterology 2006, 130, 1480–1491. [Google Scholar] [CrossRef]
- Kano, M.; Grinsvall, C.; Ran, Q.; Dupont, P.; Morishita, J.; Muratsubaki, T.; Mugikura, S.; Ly, H.G.; Törnblom, H.; Ljungberg, M.; et al. Resting state functional connectivity of the pain matrix and default mode network in irritable bowel syndrome: A graph theoretical analysis. Sci. Rep. 2020, 10, 11015. [Google Scholar] [CrossRef] [PubMed]
- Grinsvall, C.; Ryu, H.J.; Van Oudenhove, L.; Labus, J.S.; Gupta, A.; Ljungberg, M.; Törnblom, H.; Mayer, E.A.; Simrén, M. Association between pain sensitivity and gray matter properties in the sensorimotor network in women with irritable bowel syndrome. Neurogastroenterol. Motil. 2020, 33, e14027. [Google Scholar] [CrossRef]
- Kroenke, K.; Spitzer, R.L.; Williams, J.B.W. The PHQ-15: Validity of a New Measure for Evaluating the Severity of Somatic Symptoms. Psychosom. Med. 2002, 64, 258–266. [Google Scholar] [CrossRef] [PubMed] [Green Version]
- Lisspers, J.; Nygren, A.; Soderman, E. Hospital Anxiety and Depression Scale (HAD): Some psychometric data for a Swe-dish sample. Acta Psychiatr. Scand. 1997, 96, 281–286. [Google Scholar] [CrossRef] [PubMed]
- Cosco, T.D.; Doyle, F.; Ward, M.; McGee, H. Latent structure of the Hospital Anxiety and Depression Scale: A 10-year systematic review. J. Psychosom. Res. 2012, 72, 180–184. [Google Scholar] [CrossRef] [PubMed]
- Francis, C.Y.; Morris, J.; Whorwell, P. The irritable bowel severity scoring system: A simple method of monitoring irritable bowel syndrome and its progress. Aliment. Pharmacol. Ther. 1997, 11, 395–402. [Google Scholar] [CrossRef] [Green Version]
- Dale, A.M.; Fischla, B.; Sereno, M.I. Cortical Surface-Based Analysis: I. Segmentation and Surface Reconstruction. NeuroImage 1999, 9, 179–194. [Google Scholar] [CrossRef] [PubMed]
- Fischl, B.; Sereno, M.I.; Dale, A. Cortical Surface-Based Analysis: II: Inflation, Flattening, and a Surface-Based Coordinate System. NeuroImage 1999, 9, 195–207. [Google Scholar] [CrossRef] [Green Version]
- Destrieux, C.; Fischl, B.; Dale, A.; Halgren, E. Automatic parcellation of human cortical gyri and sulci using standard anatomical nomenclature. NeuroImage 2010, 53, 1–15. [Google Scholar] [CrossRef] [PubMed] [Green Version]
- Labus, J.S.; Hollister, E.B.; Jacobs, J.; Kirbach, K.; Oezguen, N.; Gupta, A.; Acosta, J.; Luna, R.A.; Aagaard, K.; Versalovic, J.; et al. Differences in gut microbial composition correlate with regional brain volumes in irritable bowel syndrome. Microbiome 2017, 5, 49. [Google Scholar] [CrossRef]
- Fischl, B.; Salat, D.H.; Busa, E.; Albert, M.; Dieterich, M.; Haselgrove, C.; van der Kouwe, A.; Killiany, R.; Kennedy, D.; Klaveness, S.; et al. Whole Brain Segmentation: Automated Labeling of Neuroanatomical Structures in the Human Brain. Neuron 2002, 33, 341–355. [Google Scholar] [CrossRef] [Green Version]
- Wang, Y.; Ghumare, E.; Vandenberghe, R.; Dupont, P. Comparison of Different Generalizations of Clustering Coefficient and Local Efficiency for Weighted Undirected Graphs. Neural Comput. 2017, 29, 313–331. [Google Scholar] [CrossRef] [PubMed]
- Heuvel, M.V.D.; Mandl, R.C.W.; Stam, C.J.; Kahn, R.S.; Pol, H.H. Aberrant Frontal and Temporal Complex Network Structure in Schizophrenia: A Graph Theoretical Analysis. J. Neurosci. 2010, 30, 15915–15926. [Google Scholar] [CrossRef]
- Heitger, M.; Ronsse, R.; Dhollander, T.; Dupont, P.; Caeyenberghs, K.; Swinnen, S. Motor learning-induced changes in functional brain connectivity as revealed by means of graph-theoretical network analysis. NeuroImage 2012, 61, 633–650. [Google Scholar] [CrossRef]
- Vandenberghe, R.; Wang, Y.; Nelissen, N.; Vandenbulcke, M.; Dhollander, T.; Sunaert, S.; Dupont, P. The associative-semantic network for words and pictures: Effective connectivity and graph analysis. Brain Lang. 2013, 127, 264–272. [Google Scholar] [CrossRef]
- Wang, Y.; Nelissen, N.; Adamczuk, K.; De Weer, A.-S.; Vandenbulcke, M.; Sunaert, S.; Vandenberghe, R.; Dupont, P. Reproducibility and Robustness of Graph Measures of the Associative-Semantic Network. PLoS ONE 2014, 9, e115215. [Google Scholar] [CrossRef] [PubMed] [Green Version]
- Newman, M.E.J. Finding community structure in networks using the eigenvectors of matrices. Phys. Rev. E 2006, 74, 036104. [Google Scholar] [CrossRef] [Green Version]
- Newman, M.E.J. Modularity and community structure in networks. Proc. Natl. Acad. Sci. USA 2006, 103, 8577–8582. [Google Scholar] [CrossRef] [Green Version]
- Xia, M.; Wang, J.; He, Y. BrainNet Viewer: A Network Visualization Tool for Human Brain Connectomics. PLoS ONE 2013, 8, e68910. [Google Scholar] [CrossRef] [PubMed] [Green Version]
- Dalege, J.; Borsboom, D.; van Harreveld, F.; van der Maas, H.L.J. Network Analysis on Attitudes: A Brief Tutorial. Soc. Psychol. Personal. Sci. 2017, 8, 528–537. [Google Scholar] [CrossRef]
- Kaiser, M. A tutorial in connectome analysis: Topological and spatial features of brain networks. Neuroimage 2011, 57, 892–907. [Google Scholar] [CrossRef] [PubMed] [Green Version]
- Ho, T.C.; Dennis, E.L.; Thompson, P.M.; Gotlib, I.H. Network-based approaches to examining stress in the adolescent brain. Neurobiol. Stress 2018, 8, 147–157. [Google Scholar] [CrossRef] [PubMed]
- Stam, C.J. Available online: http://home.kpn.nl/stam7883/graph_introduction.html (accessed on 13 November 2021).
- Ek, B.; VerSchneider, C.; Cahill, N.D.; Narayan, D.A. A comprehensive comparison of graph theory metrics for social networks. Soc. Netw. Anal. Min. 2015, 5, 37. [Google Scholar] [CrossRef]
- Latora, V.; Marchiori, M. Efficient behavior of small-world networks. Phys. Rev. Lett. 2001, 87, 198701. [Google Scholar] [CrossRef] [PubMed] [Green Version]
- Ginestet, C.E.; Simmons, A. Statistical parametric network analysis of functional connectivity dynamics during a working memory task. Neuroimage 2011, 55, 688–704. [Google Scholar] [CrossRef]
- Latora, V.; Marchiori, M. Economic small-world behavior in weighted networks. Eur. Phys. J. B Condens. Matter Complex Syst. 2003, 32, 249–263. [Google Scholar] [CrossRef] [Green Version]
- Van den Heuvel, M.P.; Sporns, O. Network hubs in the human brain. Trends Cogn. Sci. 2013, 17, 683–696. [Google Scholar] [CrossRef]
- Storey, J.D.; Taylor, J.E.; Siegmund, D. Strong control, conservative point estimation and simultaneous conservative consistency of false discovery rates: A unified approach. J. R. Stat. Soc. Ser. B (Stat. Methodol.) 2004, 66, 187–205. [Google Scholar] [CrossRef]
- Evans, A.C. Networks of anatomical covariance. NeuroImage 2013, 80, 489–504. [Google Scholar] [CrossRef]
- Oldham, S.; Fornito, A. The development of brain network hubs. Dev. Cogn. Neurosci. 2018, 36, 100607. [Google Scholar] [CrossRef] [PubMed]
- Yoo, K.; Lee, P.; Chung, M.; Sohn, W.S.; Chung, S.J.; Na, D.L.; Ju, D.; Jeong, Y. Degree-based statistic and center persistency for brain connectivity analysis. Hum. Brain Mapp. 2016, 38, 165–181. [Google Scholar] [CrossRef] [PubMed]
- Funahashi, S.; Andreau, J.M. Prefrontal cortex and neural mechanisms of executive function. J. Physiol. 2013, 107, 471–482. [Google Scholar] [CrossRef] [Green Version]
- Fuster, J.M.; Bressler, S.L. Past Makes Future: Role of pFC in Prediction. J. Cogn. Neurosci. 2015, 27, 639–654. [Google Scholar] [CrossRef]
- Haber, S.N. Corticostriatal circuitry. Dialog. Clin. Neurosci. 2016, 18, 7–21. [Google Scholar]
- A Mayer, E.; Aziz, Q.; Coen, S.; Kern, M.; Labus, J.; Lane, R.; Kuo, B.; Naliboff, B.; Tracey, I. Brain imaging approaches to the study of functional GI disorders: A Rome Working Team Report. Neurogastroenterol. Motil. 2009, 21, 579–596. [Google Scholar] [CrossRef] [Green Version]
- Namkung, H.; Kim, S.-H.; Sawa, A. The Insula: An Underestimated Brain Area in Clinical Neuroscience, Psychiatry, and Neurology. Trends Neurosci. 2017, 40, 200–207. [Google Scholar] [CrossRef] [PubMed] [Green Version]
- Koziol, L.F.; Budding, D.; Andreasen, N.; D’Arrigo, S.; Bulgheroni, S.; Imamizu, H.; Ito, M.; Manto, M.; Marvel, C.; Parker, K.; et al. Consensus paper: The cerebellum’s role in movement and cognition. Cerebellum 2014, 13, 151–177. [Google Scholar] [CrossRef]
- Adamaszek, M.; D’Agata, F.; Ferrucci, R.; Habas, C.; Keulen, S.; Kirkby, K.C.; Leggio, M.; Mariën, P.; Molinari, M.; Moulton, E.; et al. Consensus Paper: Cerebellum and Emotion. Cerebellum 2016, 16, 552–576. [Google Scholar] [CrossRef] [PubMed]
- Schmahmann, J.D.; Weilburg, J.B.; Sherman, J.C. The neuropsychiatry of the cerebellum—Insights from the clinic. Cerebellum 2007, 6, 254–267. [Google Scholar] [CrossRef] [PubMed]
- Liu, H.-Y.; Lee, P.-L.; Chou, K.-H.; Lai, K.-L.; Wang, Y.-F.; Chen, S.-P.; Chen, W.-T.; Wang, S.-J. The cerebellum is associated with 2-year prognosis in patients with high-frequency migraine. J. Headache Pain 2020, 21, 29. [Google Scholar] [CrossRef] [PubMed] [Green Version]
- Kim, H.; Kim, J.; Loggia, M.L.; Cahalan, C.; Garcia, R.G.; Vangel, M.G.; Wasan, A.D.; Edwards, R.R.; Napadow, V. Fibromyalgia is characterized by altered frontal and cerebellar structural covariance brain networks. NeuroImage Clin. 2015, 7, 667–677. [Google Scholar] [CrossRef] [PubMed] [Green Version]
- Yunus, M.B. Editorial Review (Thematic Issue: An Update on Central Sensitivity Syndromes and the Issues of Nosology and Psychobiology). Curr. Rheumatol. Rev. 2015, 11, 70–85. [Google Scholar] [CrossRef] [PubMed]
- Levy, R.L.; Von Korff, M.; Whitehead, W.E.; Stang, P.; Saunders, K.; Jhingran, P.; Barghout, V.; Feld, A.D. Costs of care for irritable bowel syndrome patients in a health maintenance organization. Am. J. Gastroenterol. 2001, 96, 3122–3129. [Google Scholar] [CrossRef]
- Polster, A.; Van Oudenhove, L.; Jones, M.; Öhman, L.; Törnblom, H.; Simrén, M. Mixture model analysis identifies irritable bowel syndrome subgroups characterised by specific profiles of gastrointestinal, extraintestinal somatic and psychological symptoms. Aliment. Pharmacol. Ther. 2017, 46, 529–539. [Google Scholar] [CrossRef] [Green Version]
- Polster, A.V.; Palsson, O.S.; Törnblom, H.; Öhman, L.; Sperber, A.D.; Whitehead, W.E.; Simrén, M. Subgroups of IBS patients are characterized by specific, reproducible profiles of GI and non-GI symptoms and report differences in healthcare utilization: A population-based study. Neurogastroenterol. Motil. 2018, 31, e13483. [Google Scholar] [CrossRef] [PubMed]
- Almquist, E.; Törnblom, H.; Simrén, M. Practical management of irritable bowel syndrome: A clinical review. Minerva Gastroenterol. Dietol. 2015, 62, 30–48. [Google Scholar]
- Carmon, J.; Heege, J.; Necus, J.H.; Owen, T.W.; Pipa, G.; Kaiser, M.; Taylor, P.N.; Wang, Y. Reliability and comparability of human brain structural covariance networks. NeuroImage 2020, 220, 117104. [Google Scholar] [CrossRef]
- Arsiè, E.; Coletta, M.; Cesana, B.M.; Basilisco, G. Symptom-association probability between meal ingestion and abdominal pain in patients with irritable bowel syndrome. Does somatization play a role? Neurogastroenterol. Motil. 2015, 27, 416–422. [Google Scholar] [CrossRef]


| Healthy Controls | IBS Low Somatization | IBS High Somatization | p-Value Omnibus Test | |
|---|---|---|---|---|
| Number of participants | 31 | 31 | 35 | |
| Age (years) | 31.5 ± 9.4 | 34.1 ± 11.6 | 31.9 ± 8.1 | 0.52 |
| Sex (M/F; %F) | 11/20, 65% | 13/18, 58% § | 5/30, 86% § | 0.036 |
| PHQ-14 | 2.8 ± 2.0 | 9.4 ± 2.0 *# | 15.9 ± 2.7 *# | <0.00001 |
| Total gray matter volume (mm3) | 653,853 ± 64,706 | 672,120 ± 64,783 | 638,851 ± 63,168 | 0.12 |
| IBS-SSS | 22.7 ± 26 | 245 ± 98 *# | 320 ± 89 *# | <0.00001 |
| HADS total score | 4.61 ± 3.2 | 13.5 ± 8.0 * | 15.9 ± 7.3 * | <0.00001 |
| IBS High Somatization > IBS Low Somatization | ||||||
|---|---|---|---|---|---|---|
| Node Name 1 | ROI | Node Name 2 | ROI | Z-Score IBS Low | Z-Score IBS High | p-Value |
| R_TrFPoG_S | PFC (frontal pole) | R_InfFGOrp | PFC (vlPFC) | −0.42 | 0.39 | 0.0002 |
| R_InfFS | PFC | R_LORs | PFC (OFC) | −0.42 | 0.44 | 0.0006 |
| IBS High Somatization < IBS Low Somatization | ||||||
| Node Name 1 | ROI | Node Name 2 | ROI | Z-Score IBS Low | Z-Score IBS High | p-Value |
| L_AngG | Inferior parietal | L_MFS | PFC | 0.47 | −0.35 | 0.0004 |
| L_AngG | Inferior parietal | R_SupCirInS | mINS | 0.41 | −0.37 | 0.0002 |
| L_SupTS | Superior temporal | R_FMarG_S | PFC (frontal pole) | 0.002 | −0.75 | 0.0006 |
| Graph Measure | Node No. | Node Name | Region | IBS Low | IBS High | p-Value |
|---|---|---|---|---|---|---|
| Clustering coefficient | ||||||
| Clustering coefficient; | 32 | L_ALSHorp | PFC | 0.22 | 0.39 | 0.0008 |
| Hub score | ||||||
| Hub score | 1 | L_CeB | Cerebellum | 2 | 1 | 0.0002 * |
| Hub score | 22 | L_ShoInG | aINS | 4 | 0 | 0.0002 * |
| Graph Measure | Node No. | Node Name | Region | HCs | IBS High | IBS Low | p-Value |
|---|---|---|---|---|---|---|---|
| Path length + normalized | |||||||
| Path length (normalized) | 88 | R_SbOrS | PFC (OFC) | 1.05 | 3.12 | 0.0006 | |
| Clustering coefficient normalized | |||||||
| Clustering coefficient (normalized) | 16 | L_InfFGOpp | PFC | 1.47 | 2.99 | 0.0002 * | |
| Local efficiency | |||||||
| Local efficiency | 27 | L_PRCG | Precentral gyrus (M1) | 6 × 10⁻⁶ | 1.1 × 10⁻⁴ | 0.0004 * | |
| Betweenness centrality normalized | |||||||
| Betweenness centrality (normalized) | 1 | L_CeB | Cerebellum | 0.000 | 3.59 | 0.0002 * | |
| Hub score | |||||||
| Hub score | 18 | L_InfFGTrip | PFC | 0 | 4 | 0.0002 * | |
| Hub score | 22 | L_ShoInG | aINS | 4 | 0 | 0.0002 * | |
| Hub score | 63 | R_OrG | PFC (lOFC) | 0 | 4 | 0.0002 * | |
| Hub score | 1 | L_CeB | Cerebellum | 1 | 2 | 0.0002 * | |
| Hub score | 38 | L_SupCirInS | mINS | 4 | 0 | 0.0002 * | |
| Hub score | 62 | R_ShoInG | aINS | 4 | 0 | 0.0002 * | |
Publisher’s Note: MDPI stays neutral with regard to jurisdictional claims in published maps and institutional affiliations. |
© 2021 by the authors. Licensee MDPI, Basel, Switzerland. This article is an open access article distributed under the terms and conditions of the Creative Commons Attribution (CC BY) license (https://creativecommons.org/licenses/by/4.0/).
Share and Cite
Grinsvall, C.; Van Oudenhove, L.; Dupont, P.; Ryu, H.J.; Ljungberg, M.; Labus, J.S.; Törnblom, H.; Mayer, E.A.; Simrén, M. Altered Structural Covariance of Insula, Cerebellum and Prefrontal Cortex Is Associated with Somatic Symptom Levels in Irritable Bowel Syndrome (IBS). Brain Sci. 2021, 11, 1580. https://doi.org/10.3390/brainsci11121580
Grinsvall C, Van Oudenhove L, Dupont P, Ryu HJ, Ljungberg M, Labus JS, Törnblom H, Mayer EA, Simrén M. Altered Structural Covariance of Insula, Cerebellum and Prefrontal Cortex Is Associated with Somatic Symptom Levels in Irritable Bowel Syndrome (IBS). Brain Sciences. 2021; 11(12):1580. https://doi.org/10.3390/brainsci11121580
Chicago/Turabian StyleGrinsvall, Cecilia, Lukas Van Oudenhove, Patrick Dupont, Hyo Jin Ryu, Maria Ljungberg, Jennifer S. Labus, Hans Törnblom, Emeran A. Mayer, and Magnus Simrén. 2021. "Altered Structural Covariance of Insula, Cerebellum and Prefrontal Cortex Is Associated with Somatic Symptom Levels in Irritable Bowel Syndrome (IBS)" Brain Sciences 11, no. 12: 1580. https://doi.org/10.3390/brainsci11121580