Systematic Review

The Neurobiological Basis of Cognitive Side Effects of Electroconvulsive Therapy: A Systematic Review

1
Mental Health Department, Unitat de Neurociència Traslacional, Parc Tauli University Hospital, Institut d’Investigació i Innovació Sanitària Parc Taulí (I3PT), 08208 Sabadell, Spain
2
Department of Psychiatry and Forensic Medicine, Universitat Autònoma de Barcelona, 08193 Bellaterra, Spain
3
CIBERSAM, Carlos III Health Institute, 28029 Madrid, Spain
4
Department of Psychobiology and Methodology of Health Sciences, Universitat Autònoma de Barcelona, 08193 Bellaterra, Spain
*
Authors to whom correspondence should be addressed.
Brain Sci. 2021, 11(10), 1273; https://doi.org/10.3390/brainsci11101273
Submission received: 7 August 2021 / Revised: 20 September 2021 / Accepted: 22 September 2021 / Published: 26 September 2021
(This article belongs to the Special Issue From Bench to Bedside: Electroconvulsive Therapy on Depression)

Abstract

:
Decades of research have consistently demonstrated the efficacy of electroconvulsive therapy (ECT) for the treatment of major depressive disorder (MDD), but its clinical use remains somewhat restricted because of its cognitive side effects. The aim of this systematic review is to comprehensively summarize current evidence assessing potential biomarkers of ECT-related cognitive side effects. Based on our systematic search of human studies indexed in PubMed, Scopus, and Web of Knowledge, a total of 29 studies evaluating patients with MDD undergoing ECT were reviewed. Molecular biomarkers studies did not consistently identify concentration changes in plasma S-100 protein, neuron-specific enolase (NSE), or Aβ peptides significantly associated with cognitive performance after ECT. Importantly, these findings suggest that ECT-related cognitive side effects cannot be explained by mechanisms of neural cell damage. Notwithstanding, S-100b protein and Aβ40 peptide concentrations, as well as brain-derived neurotrophic factor (BDNF) polymorphisms, have been suggested as potential predictive biomarkers of cognitive dysfunction after ECT. In addition, recent advances in brain imaging have allowed us to identify ECT-induced volumetric and functional changes in several brain structures closely related to memory performance such as the hippocampus. We provide a preliminary framework to further evaluate neurobiological cognitive vulnerability profiles of patients with MDD treated with ECT.

1. Introduction

Electroconvulsive therapy (ECT) is the most effective treatment for major depressive disorder (MDD) [1]. However, concerns about ECT-related cognitive side effects (i.e., disorientation, anterograde amnesia, and retrograde amnesia) are still limiting its prescription to a reduced subgroup of patients with several therapeutic failures [2]. Although different treatment optimization strategies (such as unilateral electrode placement, shorter pulse width, or longer periods between sessions) have been implemented as an attempt to reduce these ECT-related cognitive side effects, the large interindividual neurobiological variability among patients treated with ECT is still leading to inconsistent findings [3,4]. In this context, understanding the neurobiological underpinnings of ECT-related cognitive side effects is a relevant critical step towards the identification of potential predictive biomarkers capable of characterizing those patients who are more susceptible to experiencing these cognitive side effects.
Recent research advocated that the mechanism of action of ECT may be explained by neuroplastic changes such as neurogenesis, synaptogenesis, dendritic sprouting, and glial cell proliferation [5]. In this sense, previous preclinical studies using high-performance liquid chromatography (HPLC) have revealed that repetitive electroconvulsive seizures (ECS) induce restorative changes in hippocampal glutamate/gamma-aminobutyric acid (Glu/GABA) imbalance and N-methyl-D-aspartate (NMDA) receptors [6,7], as well as an up-regulation of the brain-derived neurotrophic factor precursor (proBDNF) and the mature BDNF ratio [8]. Nevertheless, these neuroplastic mechanisms have consistently shown a positive effect on memory and executive functions [9], while ECT has been typically associated with the above-mentioned cognitive side effects. Therefore, a second mechanism of action appears to be simultaneously manifesting during the implementation of ECT. Indeed, other preclinical reports have postulated that ECS results in short-term cognitive alterations through a variety of neurobiological mechanisms such as transient disruption of the blood–brain barrier [10], fluid cell switching, and altered cerebral blood flow [5].
In recent decades, significant advances have been made in the field of acquisition and analysis of structural and functional data of the human brain. Nowadays, there are different sources able to provide data concerning how the human brain works (for extended information, see [11]). In brief, from the registration of the brain electrical activity using electroencephalography (EEG) to the measure of structural and functional brain data by magnetic resonance imaging (MRI) techniques based on the magnetization properties of atomic nuclei, these advances have made it possible to identify not only the key brain structures and circuits altered in mental disorders but also the restorative changes that occur due to the application of different therapeutic strategies such as ECT.
Notwithstanding, since a direct extrapolation of these preclinical findings to real clinical settings is far from being established, a comprehensive review of the neurobiological correlates of ECT-related cognitive side effects in humans is needed to be able to include this knowledge in everyday clinical practice. Therefore, our main objective is to systematically review the current literature exploring potential biomarkers associated with cognitive dysfunction of patients suffering from a depressive episode treated with ECT.

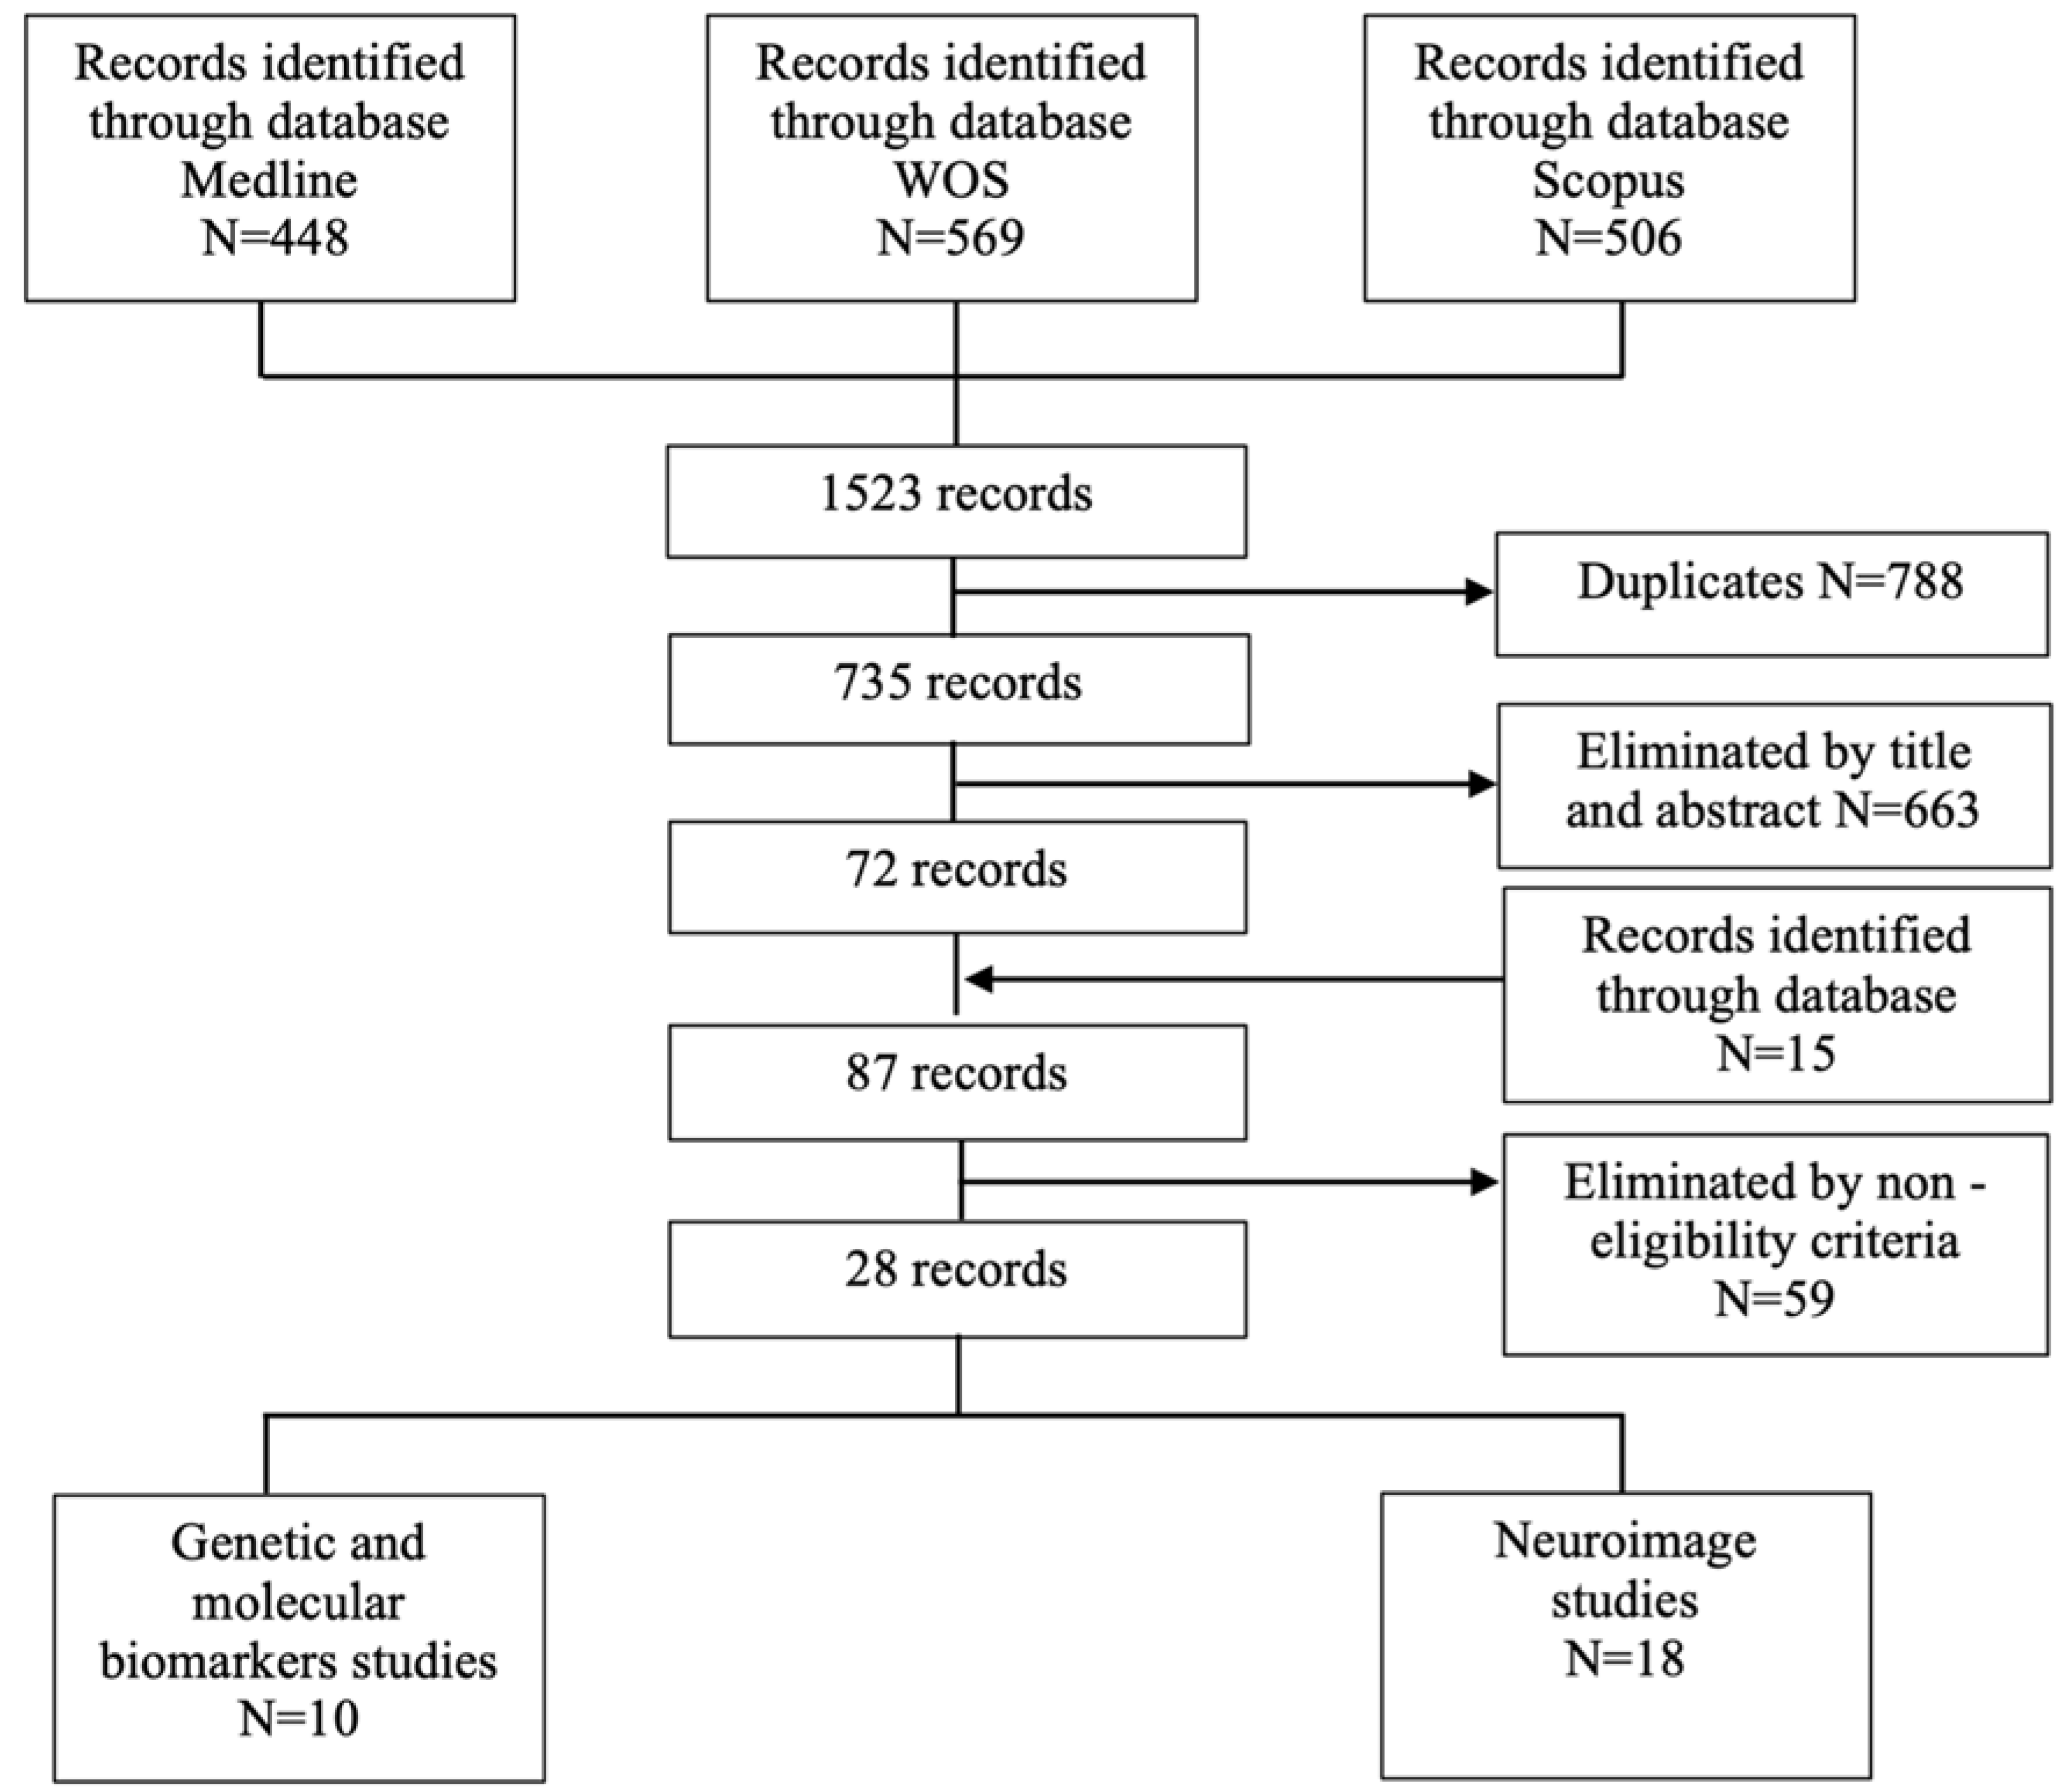
2. Materials and Methods

A systematic search of human studies was conducted on PubMed Online (Ovid Technologies, New York, NY, USA), Scopus (Elsevier, Amsterdam, The Netherlands), and Web of Knowledge (Thomson Scientific Technical Support, New York, NY, USA) using the following terms: “ECT cogniti*” plus “impairment” or “disturbances” or “deficits”. Data were collected in accordance with the Preferred Reporting Initiative for Systematic Reviews and Meta-Analyses (PRISMA) [12]. Specifically, the search was performed by two of the authors (A.B. and T.S.), and after reviewing titles, abstracts, and full articles, they resolved disagreements via discussion to reach a consensus. The review protocol was registered in the Prospective International Registry of Systematic Reviews (PROSPERO, CRD4202).
Eligibility criteria.
Articles written in a language other than English, research based on non-human samples (i.e., methodological and laboratory-based studies using cell lines or other organisms), and case reports and studies evaluating patients with a diagnosis other than uni- or bipolar depression or that were irrelevant to the research question (i.e., did not evaluate the neurobiological underpinnings of ECT-related cognitive side effects) were excluded. In addition, we only included studies in which the association between neurobiological markers and cognitive dysfunction was specifically assessed using standardized scales. No exclusion criteria based on sex, age, or date were set.
As displayed in Figure 1, a total of 28 articles were included in our systematic review. Importantly, an initial literature evaluation allowed us to identify two main biomarkers categories: (1) genetic and molecular biomarkers and (2) neuroimaging-based biomarkers.
In addition, we used a modified quality index for each article reviewed created for a previous review conducted by research team members [13] that it is based on an adaptation of the Scottish Intercollegiate Guidelines Network [14] as well as multiple imaging-specific assessment criteria used in previous meta-analytic research [15]. For more detailed information please see Table S1 at Supplementary Materials.

3. Results

3.1. Genetic and Molecular Biomarkers

These results are comprehensively shown in Table 1.

3.1.1. Protein S-100 and Neuron-Specific Enolase (NSE)

Agelink et al. [16] extracted blood samples to evaluate NSE and S-100 concentrations changes in depressed and schizoaffective depressive patients who received ECT. They did not find a significant average increase in either NSE or S-100 concentrations at any time during the course of an ECT series. However, the authors described that those patients with higher post-ECT S-100 values exhibited better cognitive performance. In agreement with these results, Palmio et al. [17] did not observe significant changes in NSE levels after ECT. However, they found a trend towards a significant increase in S-100 beta (S-100b) levels at 2 h after ECT. Notwithstanding, the S-100b concentration increase did not correlate with the Mini-Mental State Examination (MMSE) scores. Likewise, Kranaster et al. [18] also assessed cognitive impairment by means of MMSE evaluations in a sample of patients suffering from MDD. Although they did not find a significant change in NSE levels after ECT, the NSE concentration at baseline was negatively correlated with the MMSE score at baseline. In contrast, Arts et al. [19] reported a significant increase in S100-beta (S100-b) levels 1 h after ECT, with a similar but reduced effect size at 3 h after ECT. In addition, they found that a higher S100-b concentration at baseline was associated with poorer memory function and less subjective cognitive impairment at 5 and 30 days of follow-up. Nevertheless, they failed to demonstrate the relationship between changes in S100-b values during ECT and cognitive performance after ECT.

3.1.2. Aβ Peptides

Piccini et al. [20] found that the plasma Aβ40 and Aβ42 levels, as well as the Aβ40/Aβ42 ratio, were similar at baseline and one week after the last session of ECT. However, correlation analyses showed that the plasma Aβ40 levels were negatively associated with the MMSE total scores at both time points and that the Aβ40/Aβ42 ratio was negatively correlated with the MMSE total score after ECT. In contrast, Kranaster et al. [21] reported an increase in Aβ42 levels in cerebrospinal fluid (CSF) after ECT in those patients who responded to ECT. Nevertheless, the authors did not observe a significant correlation between the Aβ42 concentrations and MMSE scores. In addition, Yamazaki et al. [22] compared two groups of patients with Late-Life Depression (LLD), one treated with pharmacotherapy and the other with pharmacotherapy plus ECT. Although they did not find significant between-group differences in the levels of plasma Aβ40 and Aβ42 at baseline, they detected a marginally significant lower plasma Aβ40 concentration in the pharmacotherapy plus ECT group compared with the pharmacotherapy alone group after ECT. Moreover, their findings also revealed that the plasma Aβ40 levels measured before discharge negatively correlated with the verbal phonetic fluency test (VFT) scores. Interestingly, the authors also performed analyses splitting the sample into three groups: patients with preserved or normal cognition, patients with mild cognitive impairment (MCI) who returned to normal status after treatment (MCI-reverters), and patients with MCI who remained cognitively impaired even after treatment (MCI-non-reverters). They found significantly higher plasma Aβ40 levels at admission in MCI-non-reverters compared with patients cognitively preserved or MCI-reverters. However, no significant between-group differences were observed for plasma Aβ42 levels or Aβ40/A β42 ratio.

3.1.3. Genetics

In the field of genetics, we identified only two articles evaluating potential genetic biomarkers for ECT-related cognitive side effects. Bousman et al. [23] explored COMT Val158Met, DRD2 C957T, BDNF Val66Met, and APOE polymorphisms. They reported a significant effect between DRD2 and BDNF polymorphisms on anterograde memory. In addition, post hoc analyses showed that, among carriers of the BDNF Val/Val genotype, those with the DRD2 TT genotype had significantly less decline in anterograde memory performance than those carrying the TC or CC genotype. Moreover, Ryan et al. [24] hypothesized that shorter telomere length (TL) would predict cognitive side effects after ECT. However, they did not find significant correlations between cognitive performance measures (i.e., global cognition, re-orientation time, and autobiographical memory) and TL.

3.1.4. Cortisol

Neylan et al. [25] hypothesized that higher cortisol levels would predict increased cognitive impairment in depressed patients after receiving ECT. Interestingly, they found that elevated cortisol levels predicted a greater degree of ECT-induced cognitive impairment.

3.2. Neuroimaging-Based Biomarkers

3.2.1. Structural Magnetic Resonance Imaging

The results are comprehensively shown in Table 2.
Figiel et al. [26] acquired magnetic resonance imaging (MRI) and computed tomography scans on six patients who developed delirium after ECT. They reported that the whole sample showed white matter hyperintensities (WMH) within the basal ganglia. Notwithstanding, the cross-sectional imaging design of the study did not allow discarding the possibility that these alterations were already shown at baseline. In contrast, Oudega et al. [27] did not detect significant correlations between cognitive functioning and medial temporal lobe atrophy (MTLA). However, a positive trend towards significance was found between cognitive performance and global cortical atrophy (GCA). In this line of work, Wagenmakers et al. [28] evaluated overall brain morphology of patients with LLD before a course of ECT using visual rating scales. They reported that those patients with white matter alterations showed worse MMSE performance at baseline compared to the patients without structural brain abnormalities. Nevertheless, they observed a similar cognitive outcome after ECT regardless of the presence of structural brain alterations before ECT. They also did not find significant correlations between MMSE scores and MTLA or GCA at baseline. Other authors explored, based on previous preclinical studies, the hypothesis that ECT-related cognitive impairment may be related to edema secondary to changes in the blood–brain barrier permeability. Diehl et al. [10] detected a trend towards, a significant correlation between post-ECT medial temporal lobe (MTL) T2 relaxation time increases, and worsened nonverbal anterograde memory scores. Moreover, a post hoc analysis also revealed a significant relationship between left thalamus T2 relaxation time increases and post-ECT verbal and anterograde memory impairment. However, Kunigiri et al. [29] did not find any significant change in T2 relaxation times after ECT.
Cortical thickness was also assessed in two different groups. Gbyl et al. [30] reported cortical thickness increases in 26 brain regions (frontal, temporal and limbic), as well as hippocampal volume increases, six days after ECT. Interestingly, they also observed that these increases returned to baseline measures at six months of follow-up. However, these thickness and volume changes did not correlate with variations in cognitive measures changes. In addition, Xu et al. [31] investigated cortical thickness, surface area, and local gyrification index in a sample of depressed patients before and after ECT. They found that cortical thickness increases in the left inferior parietal gyrus were positively correlated with changes in cognitive scores. Moreover, four additional studies focused their research on the hippocampal volume. Lekwauwa et al. [32] evaluated the relationship between hippocampal volume and cognitive outcome after ECT in a sample of unipolar depressed patients. They found a significant correlation between hippocampal volume decrease and MMSE changes in those patients with moderate/severe cognitive outcomes. In addition, they observed that the left hippocampal volume decreases were above the mean value in participants with moderate or severe memory dysfunction. In contrast, Nordanskog et al. [33] reported a significant increase in hippocampal volume one week after ECT, with values returning to baseline after 6 to 12 months after ECT. Interestingly, the left hippocampal volume increase one week after ECT was positively correlated to Trail Making Test Part A (TMT-A) score, yet this result disappeared after adjusting for the number of ECT sessions. However, Van Oostrom et al. [34] found a significant correlation between the decline of cognitive performance and the hippocampal volume increase. Likewise, Gbyl 2020 et al. [35] analyses showed a significant correlation between an increase in the right dentate gyrus (DG) volume and a decrease in delayed and immediate verbal memory performance, and a significant correlation between an increase in the left DG volume and a decrease in delayed verbal memory performance during ECT. After a 6-month follow-up screening, they found that the decrease in the right DG volume was significantly correlated with the improvement in the delayed memory performance, but they did not detect correlations between cognitive function and the left DG volume. Moreover, they also observed that a decrease in delayed verbal memory performance significantly correlated with the increase in volume in 14 out of 20 hippocampal subregions during ECT and after follow-up and that a decrease in 16 out 20 hippocampal subregions volumes significantly correlated with the improvement in cognitive performance.

3.2.2. Functional Magnetic Resonance Imaging

The results are comprehensively shown in Table 3.
Abbot et al. [36] examined changes in hippocampal resting-state functional connectivity among a sample of unipolar depressed patients before and after treatment with ECT. Specifically, the authors found an increased right hippocampal functional connectivity among ECT responders, which was not statistically significant when compared with healthy controls. They also confirmed, like many others before them, the presence of an aberrant bilateral hippocampal connectivity in depressed patients before the ECT series, including the left MTL and the anterior cingulate cortex (ACC). This abnormal connectivity was no longer evident in comparison with healthy controls after ECT treatment, thus providing confirmatory evidence of normalization. However, the relationship between changes in connectivity and cognition, as measured by differences in percent retention, was not significant. In addition, Bai et al. [37] showed a significant decrease in verbal fluency, which showed a positive association with a decreased functional connectivity between the hippocampus and the bilateral angular gyrus after ECT.
Wang et al. [38] observed a significant decrease in delayed Auditory Verbal Learning Test (AVLT) score in MDD patients after ECT. Interestingly, the impaired memory was closely associated with changes in functional and effective connectivity within the salience network. Similarly, Wang et al. [39] showed a significant reduction in delayed recall Rey AVLT (RAVLT) scores following ECT. Specifically, functional connectivity within the Frontoparietal Network (FPN), the Default Mode Network (DMN), and subcortical structures involving the hippocampus were significantly able to predict these RAVLT changes. In addition, Sinha et al. [40] found a positive trend towards a significant correlation between a decline in phonemic fluency and the right pallidum and the left inferior frontal operculum connectivity after ECT. Likewise, Wei et al. [41] also evaluated cognitive function using the verbal fluency test (VFT), finding no significant difference between pre-ECT VFT scores and healthy controls scores. However, verbal fluency was significantly lower in post-ECT scores in comparison with healthy controls. However, patients with MDD showed significant correlations between the strength of the left pulvinar-bilateral precuneus connectivity and VFT scores. Moreover, Wei et al. [42] reported a significantly lower VFT score in patients with MDD after ECT compared to pre-ECT and healthy controls. Correlation analysis identified a significant positive correlation between the increased left subgenual ACC—left cerebellar lobule VI functional connectivity and the change in VFT scores in MDD following ECT.

4. Discussion

Given the amount of evidence supporting that the neurobiological changes following ECT may underpin its superior antidepressant efficacy as well as its associated cognitive impoverishment, we systematically reviewed all human research assessing plausible processes underlying said cognitive outcomes. It must be highlighted that although these adverse cognitive effects have been typically related to neuronal damage (such as vascular lesions or white matter hyperintensities) in worldwide clinical settings, relevant neuroimaging and biochemical studies have not found any evidence of macrostructural brain damage associated with electrically controlled induced seizures. Instead, changes at a cellular, structural, and functional level may simultaneously play a role in both the mechanism of action and adverse effects subsidiary to ECT.
The hypothesis suggesting that ECT may induce subtle neuronal or glial damage at a molecular level is supported by findings proving that the S-100 and the NSE proteins have been proved to be extremely useful to identify diffuse and small microstructural brain changes. On the one hand, the S-100 is an acidic calcium-binding protein that is present in the cytosol of astroglial cells and stimulates glial cell proliferation [43]. On the other hand, the NSE is a dimeric glycolytic enzyme that is found in the cytosol of various neuronal cells in the central nervous system (CNS) and certain neuroendocrine carcinomas [44]. Both proteins appear to be more detectable after acute CNS damage (such as ischemia, head trauma, and hemorrhagic brain injury) [43,44] and have been postulated as potential biomarkers of cognitive impairment in patients undergoing ECT. However, current research has not consistently identified S-100 protein or NSE concentrations changes significantly associated with cognitive performance after ECT. Importantly, these findings suggest that ECT-related cognitive side effects cannot be explained by an alteration of cellular structures.
Notwithstanding, other neurotoxic molecular pathways such as the Aβ amino acid peptides (involving both Aβ40 and Aβ42 subtypes) have been also proposed as potential biomarkers of ECT-induced cognitive side effects. Specifically, the Aβ42 peptide is the main component of the senile plaques in Alzheimer’s Disease (AD), and the Aβ40 peptide constitutes one of the components of the amyloid-associated brain angiopathy [45]. In this sense, reduced plasma Aβ42, increased Aβ40, and Aβ40/Aβ42 ratio changes have been reported in patients suffering from AD and MCI [46]. In addition, several preclinical studies have shown that a single injection of Aβ peptides may reduce BDNF expression in the prefrontal cortex [47]. Altogether, these findings suggest that the putative neurotoxic effects associated with plasma Aβ peptides alterations could be interfering with the BDNF-mediated neurorestorative action induced by ECT [20]. However, current literature also failed to demonstrate a robust relationship between ECT-induced plasma Aβ concentration changes and cognitive decline after ECT. Interestingly though, two studies were able to identify higher plasma S100b and Aβ40 levels at baseline as predictive biomarkers of impaired cognitive performance after ECT. Moreover, a third genetic study showed that certain BDFN polymorphisms may predict a lower risk of ECT-related anterograde memory impairment. Therefore, future research should further evaluate this preliminary predictive capability of plasma S100b protein, Aβ40 peptide, and BDFN polymorphisms to identify cognitive vulnerability profiles in patients with MDD treated with ECT. Importantly, these findings would be still in agreement with the idea that modern ECT (with seizure control, muscle relaxation, hyperoxygenation, and ventilation whenever appropriate) does not result in any detectable damage to brain tissue.
Furthermore, neuroimaging research has emerged as one of the most promising areas to identify interindividual neurobiological differences among several neuropsychiatric populations. Indeed, our current understanding of the neurobiological basis of ECT has been mainly based on advances in brain imaging studies. In this sense, previous structural neuroimaging studies have specifically highlighted the relevant involvement of hippocampal volume changes in the mechanism of action of ECT [33,48,49,50]. Interestingly, the hippocampus appears to be crucial for the antidepressant response attributable to different therapeutic modalities [51], but it is also intrinsically linked to cognitive processes such as memory and executive functions [52]. Indeed, current research has reported that hippocampal volume increases in the initial phases of ECT treatment may lead to significant cognitive impairment, while hippocampal volume decreases after 6–12 months of follow-up were associated with cognitive recovery. Although these structural neuroimaging studies do not allow for a deeply molecular understanding of the nature of these hippocampal volume increases, Cano et al. 2017 [48] suggested that both neuroplastic and neuroinflammatory changes may account for the ECT-induced clinical improvement and cognitive side effects. Likewise, several functional brain imaging studies support that ECT-induced neural functional connectivity changes between a variety of brain networks are directly related to its high efficacy in alleviating depressive symptoms [13] but may simultaneously induce a significant impoverishment of cognitive performance [2]. Importantly, functional connectivity measures within/between the salience, the frontoparietal, and the default mode networks as well as between core subcortical structures such as the hippocampus could be used as a starting point to identify connections potentially able to monitor verbal memory performance after a course of ECT.
Summarizing, despite the growing knowledge regarding the potential mechanisms underpinning the cognitive drawbacks of ECT, there are still plenty of areas that remain uncertain. Knowing that the historical use of induced seizures for the management of psychiatric disorders was initially based on the observation of a higher number of glial cells in epileptic patients gives strength to the role of seizure in preserving glial density [53]. Considering the fact that inducing generalized seizures similar to the ones occurring in epileptic patients is essential to obtain a clinical response following ECT, recent studies propose other considerations that could also play a role in the effectiveness of said controlled convulsions, such as different stimulus intensity or electrode placement, thus implying potentially improved clinical responses. Although the cognitive impairments underlying spontaneous seizures in epileptic patients have widely been explored, an interesting field to be explored could be the neurobiological similarities observed in both conditions, as well as an improvement and optimization of variables regarding the implementation of the ECT.
Finally, we would also like to highlight a promising field that is raising interest, namely the potential link between inflammatory parameters and its impact on clinical response [54]. Nevertheless, a plausible hypothesis could relate those inflammation states to the ECT-derived cognitive side effects and could also shed a light on new interesting fields of research.

5. Conclusions

Since ECT is a well-known effective treatment option for patients with MDD, cognition disparities subsequent to the technique still mean a significant disadvantage. Even though intrinsic characteristics of ECT implementation or different medication status could clearly play a role in the neurobiology of ECT-related cognitive disturbances, our systematic review collected all the evidence needed to develop an initial neurobiological framework for future research in the field of ECT as an effective treatment for patients with MDD, especially among those patients in whom conventional strategies have failed to succeed. We not only emphasized that ECT does not induce neuronal damage but also pointed out biochemical, genetic, and neuroimaging measures as potential predictive biomarkers of ECT-induced cognitive impact.
In the era of personalized medicine and international consortia, such as The Global ECT-MRI Research Collaboration (GEMRIC) [55], the Genetics of Electroconvulsive Therapy International Consortium (Gen-ECT-ic) [56], and the Clinical Alliance and Research in ECT Network (CARE) [57], we have an exceptional opportunity to further evaluate the neurobiological underpinnings of ECT-related cognitive side effects.

Supplementary Materials

The following are available online at https://www.mdpi.com/article/10.3390/brainsci11101273/s1.

Author Contributions

Conceptualization, A.B. and N.C.; methodology, N.C.; validation, N.C., M.C. and D.P.-C.; formal analysis, A.B. and T.S.; investigation, A.B. and P.S.; writing—original draft preparation, A.B. and T.S.; writing—review and editing, A.B., N.C. and M.C.; visualization, T.S.; supervision, N.C., E.M.-A. and D.J.P. All authors have read and agreed to the published version of the manuscript.

Funding

This researcher N.C. was funded by a grant from the Instituto de Salud Carlos III [grant number: PI18/00036]. D.P-C. was supported by a PFIS predoctoral fellowship from the Instituto de Salud Carlos III [grant number: FI19/00251], M.C. Is founded by the Sara Borrell postdoctoral contract [CD20/00189].

Conflicts of Interest

The authors declare no conflict of interest.

References

  1. Lisanby, S.H.; McClintock, S.M.; Alexopoulos, G.; Bailine, S.H.; Bernhardt, E.; Briggs, M.C.; Cullum, C.M.; De Deng, Z.; Dooley, M.; Geduldig, E.T.; et al. Neurocognitive Effects of Combined Electroconvulsive Therapy (ECT) and Venlafaxine in Geriatric Depression: Phase 1 of the PRIDE Study. Am. J. Geriatr. Psychiatry 2020, 28, 304–316. [Google Scholar] [CrossRef] [PubMed]
  2. McClintock, S.M.; Choi, J.; Deng, Z.-D.; Appelbaum, L.G.; Krystal, A.D.; Lisanby, S.H. Multifactorial Determinants of the Neurocognitive Effects of Electroconvulsive Therapy. J. ECT 2014, 30, 165–176. [Google Scholar] [CrossRef] [PubMed]
  3. Sobin, C.; Sackeim, H.A.; Prudic, J.; Devanand, D.P.; Moody, B.J.; McElhiney, M.C. Predictors of retrograde amnesia following ECT. Am. J. Psychiatry 1995, 152, 995–1001. [Google Scholar] [CrossRef] [PubMed]
  4. Loo, C.K.; Schweitzer, I.; Pratt, C. Recent advances in optimizing electroconvulsive therapy. Aust. N. Z. J. Psychiatry 2006, 40, 632–638. [Google Scholar] [CrossRef]
  5. Sackeim, H.A. The impact of electroconvulsive therapy on brain grey matter volume: What does it mean? Brain Stimul. 2020, 13, 1226–1231. [Google Scholar] [CrossRef] [PubMed]
  6. Luo, J.; Min, S.; Wei, K.; Li, P.; Dong, J.; Liu, Y.-F.Y.-F.Y. Propofol protects against impairment of learning-memory and imbalance of hippocampal Glu/GABA induced by electroconvulsive shock in depressed rats. J. Anesth. 2011, 25, 657–665. [Google Scholar] [CrossRef] [PubMed]
  7. Reid, I.C.; Stewart, C.A. Seizures, memory and synaptic plasticity. Seizure 1997, 6, 351–359. [Google Scholar] [CrossRef]
  8. Zhang, F.; Luo, J.; Min, S.; Ren, L.; Qin, P. Propofol alleviates electroconvulsive shock-induced memory impairment by modulating proBDNF/mBDNF ratio in depressive rats. Brain Res. 2016, 1642, 43–50. [Google Scholar] [CrossRef]
  9. Wang, J.; Gallagher, D.; Devito, L.M.; Cancino, G.I.; Tsui, D.; He, L.; Keller, G.M.; Frankland, P.W.; Kaplan, D.R.; Miller, F.D. Metformin activates an atypical PKC-CBP pathway to promote neurogenesis and enhance spatial memory formation. Cell Stem Cell 2012, 11, 23–35. [Google Scholar] [CrossRef]
  10. Diehl, D.J.; Keshavan, M.S.; Kanal, E.; Nebes, R.D.; Nichols, T.E.; Gillen, J.S. Post-ECT increases in MRI regional T2 relaxation times and their relationship to cognitive side effects: A pilot study. Psychiatry Res. 1994, 54, 177–184. [Google Scholar] [CrossRef]
  11. Paszkiel, S. Data Acquisition Methods for Human Brain Activity, ANALYSIS and Classification of Eeg Signals for Brain-Computer Interfaces; Book Series: Studies in Computational Intelligence; Springer: Cham, Switzerland, 2020; Volume 852, pp. 3–9. [Google Scholar] [CrossRef]
  12. Moher, D.; Liberati, A.; Tetzlaff, J.; Altman, D.G.; Altman, D.; Antes, G.; Atkins, D.; Barbour, V.; Barrowman, N.; Berlin, J.A.; et al. Preferred reporting items for systematic reviews and meta-analyses: The PRISMA statement. PLoS Med. 2009, 6, e1000097-6. [Google Scholar] [CrossRef]
  13. Porta-Casteràs, D.; Cano, M.; Camprodon, J.A.; Loo, C.; Palao, D.; Soriano-Mas, C.; Cardoner, N. A multimetric systematic review of fMRI findings in patients with MDD receiving ECT. Prog. Neuro-Psychopharmacol. Biol. Psychiatry 2021, 108. [Google Scholar] [CrossRef]
  14. Scottish Intercollegiate Guidelines Network. Methodology Checklist 2: Controlled Trials. 2012, pp. 3–5. Available online: https://www.sign.ac.uk/what-we-do/methodology/checklists/ (accessed on 22 September 2021).
  15. Li, W.; Chen, Z.; Wu, M.; Zhu, H.; Gu, L.; Zhao, Y.; Kuang, W.; Bi, F.; Kemp, G.J.; Gong, Q. Characterization of brain blood flow and the amplitude of low-frequency fluctuations in major depressive disorder: A multimodal meta-analysis. J. Affect. Disord. 2017, 210, 303–311. [Google Scholar] [CrossRef]
  16. Agelink, M.W.; Andrich, J.; Postert, T.; Würzinger, U.; Zeit, T.; Klotz, P.; Przuntek, H. Relation between electroconvulsive therapy, cognitive side effects, neuron specific enolase, and protein S-100. J. Neurol. Neurosurg. Psychiatry 2001, 71, 394–396. [Google Scholar] [CrossRef]
  17. Palmio, J.; Huuhka, M.; Laine, S.; Huhtala, H.; Peltola, J.; Leinonen, E.; Suhonen, J.; Keränen, T. Electroconvulsive therapy and biomarkers of neuronal injury and plasticity: Serum levels of neuron-specific enolase and S-100b protein. Psychiatry Res. 2010, 177, 97–100. [Google Scholar] [CrossRef]
  18. Kranaster, L.; Janke, C.; Mindt, S.; Neumaier, M.; Sartorius, A. Protein S-100 and neuron-specific enolase serum levels remain unaffected by electroconvulsive therapy in patients with depression. J. Neural. Transm. 2014, 121, 1411–1415. [Google Scholar] [CrossRef] [PubMed]
  19. Arts, B.; Peters, M.; Ponds, R.; Honig, A.; Menheere, P.; van Os, J. S100 and impact of ECT on depression and cognition. J. ECT 2006, 22, 206–212. [Google Scholar] [CrossRef]
  20. Piccinni, A.; Veltri, A.; Vizzaccaro, C.; Catena Dell’Osso, M.; Medda, P.; Domenici, L.; Vanelli, F.; Cecchini, M.; Franceschini, C.; Conversano, C.; et al. Plasma amyloid-β levels in drug-resistant bipolar depressed patients receiving electroconvulsive therapy. Neuropsychobiology 2013, 67, 185–191. [Google Scholar] [CrossRef] [PubMed]
  21. Kranaster, L.; Aksay, S.S.; Bumb, J.M.; Janke, C.; Alonso, A.; Hoyer, C.; Zerr, I.; Schmitz, M.; Hausner, L.; Frölich, L.; et al. Electroconvulsive therapy selectively enhances amyloid β 1–42 in the cerebrospinal fluid of patients with major depression: A prospective pilot study. Eur. Neuropsychopharmacol. 2016, 26, 1877–1884. [Google Scholar] [CrossRef] [PubMed]
  22. Yamazaki, C.; Tamaoki, T.; Nunomura, A.; Tamai, K.; Yasuda, K.; Motohashi, N. Plasma Amyloid-beta and Alzheimer’s Disease-Related Changes in Late-Life Depression. J. Alzheimers. Dis. 2017, 58, 349–354. [Google Scholar] [CrossRef]
  23. Bousman, C.A.; Katalinic, N.; Martin, D.M.; Smith, D.J.; Ingram, A.; Dowling, N.; Ng, C.; Loo, C.K. Effects of COMT, DRD2, BDNF, and APOE genotypic variation on treatment efficacy and cognitive side effects of electroconvulsive therapy. J. ECT 2015, 31, 129–135. [Google Scholar] [CrossRef] [PubMed]
  24. Karen, R.; McLoughlin, D.M. Telomere length in depression and association with therapeutic response to electroconvulsive therapy and cognitive side-effects. Psychol. Med. 2020, 50, 2096–2106. [Google Scholar] [CrossRef]
  25. Neylan, T.C.; Canick, J.D.; Hall, S.E.; Reus, V.I.; Sapolsky, R.M.; Wolkowitz, O.M. Cortisol levels predict cognitive impairment induced by electroconvulsive therapy. Biol. Psychiatry 2001, 50, 331–336. [Google Scholar] [CrossRef]
  26. Figiel, G.S.; Ranga, K.; Krishnan, R.; Doraiswamy, P.M. Subcortical Structural Changes in ECT-Induced Delirium. J. Geriatr. Psychiatry Neurol. 1990, 3, 172–176. [Google Scholar] [CrossRef] [PubMed]
  27. Oudega, M.L.; Dols, A.; Adelerhof, I.; Rozing, M.; Wattjes, M.P.; Comijs, H.C.; Barkhof, F.; Eikelenboom, P.; Stek, M.L.; Van Exel, E. Contribution of white matter hyperintensities, medial temporal lobe atrophy and cortical atrophy on outcome, seven to twelve years after ECT in severely depressed geriatric patients (INTERROGANT). J. Affect. Disord. 2015, 185, 144–148. [Google Scholar] [CrossRef]
  28. Wagenmakers, M.J.; Vansteelandt, K.; van Exel, E.; Postma, R.; Schouws, S.N.T.M.; Obbels, J.; Rhebergen, D.; Bouckaert, F.; Stek, M.L.; Barkhof, F.; et al. Transient Cognitive Impairment and White Matter Hyperintensities in Severely Depressed Older Patients Treated With Electroconvulsive Therapy. Am. J. Geriatr. Psychiatry 2021. [Google Scholar] [CrossRef]
  29. Kunigiri, G.; Jayakumar, P.N.; Janakiramaiah, N.; Gangadhar, B.N. MRI T(2) relaxometry of brain regions and cognitive dysfunction following electroconvulsive therapy. Indian J. Psychiatry 2007, 49, 195–199. [Google Scholar] [CrossRef]
  30. Gbyl, K.; Rostrup, E.; Raghava, J.M.; Carlsen, J.F.; Schmidt, L.S.; Lindberg, U.; Ashraf, A.; Jørgensen, M.B.; Larsson, H.B.W.; Rosenberg, R.; et al. Cortical thickness following electroconvulsive therapy in patients with depression: A longitudinal MRI study. Acta Psychiatr. Scand. 2019, 140, 205–216. [Google Scholar] [CrossRef]
  31. Xu, J.; Wang, J.; Bai, T.; Zhang, X.; Li, T.; Hu, Q.; Li, H.; Zhang, L.; Wei, Q.; Tian, Y.; et al. Electroconvulsive Therapy Induces Cortical Morphological Alterations in Major Depressive Disorder Revealed with Surface-Based Morphometry Analysis. Int. J. Neural. Syst. 2019, 29, 1950005. [Google Scholar] [CrossRef]
  32. Lekwauwa, R.; McQuoid, D.; Steffens, D.C. Hippocampal volume is associated with physician-reported acute cognitive deficits after electroconvulsive therapy. J. Geriatr. Psychiatry Neurol. 2006, 19, 21–25. [Google Scholar] [CrossRef]
  33. Nordanskog, P.; Larsson, M.R.; Larsson, E.M.; Johanson, A. Hippocampal volume in relation to clinical and cognitive outcome after electroconvulsive therapy in depression. Acta Psychiatr. Scand. 2014, 129, 303–311. [Google Scholar] [CrossRef]
  34. Van Oostrom, I.; Van Eijndhoven, P.; Butterbrod, E.; Van Beek, M.H.; Janzing, J.; Donders, R.; Schene, A.; Tendolkar, I. Decreased Cognitive Functioning after Electroconvulsive Therapy Is Related to Increased Hippocampal Volume: Exploring the Role of Brain Plasticity. J. ECT 2018, 34, 117–123. [Google Scholar] [CrossRef]
  35. Gbyl, K.; Støttrup, M.M.; Mitta Raghava, J.; Xue Jie, S.; Videbech, P. Hippocampal volume and memory impairment after electroconvulsive therapy in patients with depression. Acta Psychiatr. Scand. 2020. [Google Scholar] [CrossRef]
  36. Abbott, C.C.; Jones, T.; Lemke, N.T.; Gallegos, P.; McClintock, S.M.; Mayer, A.R.; Bustillo, J.; Calhoun, V.D. Hippocampal structural and functional changes associated with electroconvulsive therapy response. Transl. Psychiatry 2014, 4, S562–S563. [Google Scholar] [CrossRef] [PubMed]
  37. Bai, T.; Wei, Q.; Xie, W.; Wang, A.; Wang, J.; Ji, G.J.; Wang, K.; Tian, Y. Hippocampal-subregion functional alterations associated with antidepressant effects and cognitive impairments of electroconvulsive therapy. Psychol. Med. 2019, 49, 1357–1364. [Google Scholar] [CrossRef] [PubMed]
  38. Wang, L.; Wei, Q.; Wang, C.; Xu, J.; Wang, K.; Tian, Y.; Wang, J. Altered functional connectivity patterns of insular subregions in major depressive disorder after electroconvulsive therapy. Brain Imaging Behav. 2019, 14, 753–761. [Google Scholar] [CrossRef]
  39. Wang, D.; Tian, Y.; Li, M.; Dahmani, L.; Wei, Q.; Bai, T.; Galiè, F.; Ren, J.; Farooq, R.K.; Wang, K.; et al. Functional connectivity underpinnings of electroconvulsive therapy-induced memory impairments in patients with depression. Neuropsychopharmacol. Off. Publ. Am. Coll. Neuropsychopharmacol. 2020, 45, 1579–1587. [Google Scholar] [CrossRef] [PubMed]
  40. Sinha, P.; Reddy, R.V.; Srivastava, P.; Mehta, U.M.; Bharath, R.D. Network neurobiology of electroconvulsive therapy in patients with depression. Psychiatry Res.-Neuroimaging 2019, 287, 31–40. [Google Scholar] [CrossRef] [PubMed]
  41. Wei, Q.; Bai, T.; Brown, E.C.; Xie, W.; Chen, Y.; Ji, G.; Ramasubbu, R.; Tian, Y.; Wang, K. Thalamocortical connectivity in electroconvulsive therapy for major depressive disorder. J. Affect. Disord. 2020, 264, 163–171. [Google Scholar] [CrossRef]
  42. Wei, Q.; Ji, Y.; Bai, T.; Zu, M.; Guo, Y.; Mo, Y.; Ji, G.; Wang, K.; Tian, Y. Enhanced cerebro-cerebellar functional connectivity reverses cognitive impairment following electroconvulsive therapy in major depressive disorder. Brain Imaging Behav. 2020. [Google Scholar] [CrossRef]
  43. Donato, R.; Cannon, B.; Sorci, G.; Riuzzi, F.; Hsu, K.; Weber, D.; Geczy, C. Functions of S100 Proteins. Curr. Mol. Med. 2012, 13, 24–57. [Google Scholar] [CrossRef]
  44. Haque, A.; Polcyn, R.; Matzelle, D.; Banik, N.L. New insights into the role of neuron-specific enolase in neuro-inflammation, neurodegeneration, and neuroprotection. Brain Sci. 2018, 8, 33. [Google Scholar] [CrossRef]
  45. Gatti, L.; Tinelli, F.; Scelzo, E.; Arioli, F.; Di Fede, G.; Obici, L.; Pantoni, L.; Giaccone, G.; Caroppo, P.; Parati, E.A.; et al. Understanding the pathophysiology of cerebral amyloid angiopathy. Int. J. Mol. Sci. 2020, 21, 3435. [Google Scholar] [CrossRef]
  46. Janelidze, S.; Zetterberg, H.; Mattsson, N.; Palmqvist, S.; Vanderstichele, H.; Lindberg, O.; van Westen, D.; Stomrud, E.; Minthon, L.; Blennow, K.; et al. CSF Aβ42/Aβ40 and Aβ42/Aβ38 ratios: Better diagnostic markers of Alzheimer disease. Ann. Clin. Transl. Neurol. 2016, 3, 154–165. [Google Scholar] [CrossRef] [PubMed]
  47. Colaianna, M.; Tucci, P.; Zotti, M.; Morgese, M.; Schiavone, S.; Govoni, S.; Cuomo, V.; Trabace, L. Soluble βamyloid 1-42: A critical player in producing behavioural and biochemical changes evoking depressive-related state? Br. J. Pharmacol. 2010, 159, 1704–1715. [Google Scholar] [CrossRef] [PubMed]
  48. Cano, M.; Martínez-Zalacaín, I.; Bernabéu-Sanz, A.; Contreras-Rodríguez, O.; Hernández-Ribas, R.; Via, E.; De Arriba-Arnau, A.; Gálvez, V.; Urretavizcaya, M.; Pujol, J.; et al. Brain volumetric and metabolic correlates of electroconvulsive therapy for treatment-resistant depression: A longitudinal neuroimaging study. Transl. Psychiatry 2017, 7, e1023–e1028. [Google Scholar] [CrossRef]
  49. Dukart, J.; Regen, F.; Kherif, F.; Colla, M.; Bajbouj, M.; Heuser, I.; Frackowiak, R.S.; Draganski, B. Electroconvulsive therapy-induced brain plasticity determines therapeutic outcome in mood disorders. Proc. Natl. Acad. Sci. USA 2014, 111, 1156–1161. [Google Scholar] [CrossRef]
  50. Joshi, S.H.; Espinoza, R.T.; Pirnia, T.; Shi, J.; Wang, Y.; Ayers, B.; Leaver, A.; Woods, R.P.; Narr, K.L. Structural plasticity of the hippocampus and amygdala induced by electroconvulsive therapy in major depression. Biol. Psychiatry 2016, 79, 282–292. [Google Scholar] [CrossRef] [PubMed]
  51. Seung-Gul, K.; Seo-Eun, C. Neuroimaging Biomarkers for Predicting Treatment Response and Recurrence of Major Depressive Disorder. Mol. Sci. 2020, 21, 2148. [Google Scholar] [CrossRef]
  52. Dickerson, B.C.; Eichenbaum, H. The episodic memory system: Neurocircuitry and disorders. Neuropsychopharmacology 2010, 35, 86–104. [Google Scholar] [CrossRef] [PubMed]
  53. Li, Q.; Liu, S.; Guo, M.; Yang, C.X.; Xu, Y. The principles of electroconvulsive therapy based on correlations of schizophrenia and epilepsy: A view from brain networks. Front. Neurol. 2019, 10, 688. [Google Scholar] [CrossRef] [PubMed]
  54. Singh, A.; Kar, S.K. How electroconvulsive therapy works?: Understanding the neurobiological mechanisms. Clin. Psychopharmacol. Neurosci. 2017, 15, 210–221. [Google Scholar] [CrossRef] [PubMed]
  55. Oltedal, L.; Bartsch, H.; Sørhaug, O.J.E.; Kessler, U.; Abbott, C.; Dols, A.; Stek, M.L.; Ersland, L.; Emsell, L.; van Eijndhoven, P.; et al. The Global ECT-MRI Research Collaboration (GEMRIC): Establishing a multi-site investigation of the neural mechanisms underlying response to electroconvulsive therapy. NeuroImage Clin. 2017, 14, 422–432. [Google Scholar] [CrossRef]
  56. Soda, T.; McLoughlin, D.M.; Clark, S.R.; Oltedal, L.; Kessler, U.; Haavik, J.; Bousman, C.; Smith, D.J.; Bioque, M.; Clements, C.C.; et al. International Consortium on the Genetics of Electroconvulsive Therapy and Severe Depressive Disorders (Gen-ECT-ic). Eur. Arch. Psychiatry Clin. Neurosci. 2020, 270, 921–932. [Google Scholar] [CrossRef] [PubMed]
  57. Martin, D.M.; Gálvez, V.; Lauf, S.; Dong, V.; Baily, S.A.; Cardoner, N.; Chan, H.N.; Davidson, D.; Fam, J.; De Felice, N.; et al. The Clinical Alliance and Research in Electroconvulsive Therapy Network: An Australian Initiative for Improving Service Delivery of Electroconvulsive Therapy. J. ECT 2018, 34, 7–13. [Google Scholar] [CrossRef] [PubMed]
Figure 1. PRISMA block diagram depicting study search and selection process. WOS, Web of Knowledge.
Brainsci 11 01273 g001
Table 1. Genetic and molecular biomarkers studies.
StudyMeasureNDiagnosis
Gender/Age (Mean, Years)
Medication Status
ECT ParametersTime-PointsCognitive ScalesSignificant ResultsQuality Index
Agelink et al. 2001NSE, S-10014MDD, Schizoaffective depression
5W, 9M/54 Y
NM (only lorazepam)
Not described1 day before ECT, 6 h, 24 h, and 48 h after the 1st to 3rd ECT and 24 h after the 4th, 5th, 6th, and last ECTIMC, a subtest of Blessed dementia scales (orientation, memory, and concentration), digit span test, and A-E SKTPatients with higher post-ECT S-100 values showed better cognitive performance4
Palmio et al. 2009NSE, S-100b10Unipolar depression (with psychotic symptoms)
7W, 3M/56 Y
SM
BFT, brief
3.8 sessions
Pre-ECT and 1 h, 2 h, 6 h, 24 h, and 48 h afterMMSE-5
Kranaster et al. 2014NSE, S-10019Unipolar and bipolar depression
11W, 8M/66 Y
9.4 sessionsPre-ECT, 30 and 60 min after the 3rd ECT and post-ECTMMSEPre-ECT NSE concentration was negatively correlated with MMSE scores at baseline5.5
Arts et al. 2006S100-beta12Unipolar and bipolar depression

8W, 2M/54 Y
SM
BFT, brief
6 sessions
2/week
Before ECT, 1 h and 3 h after ECTMMSE, 15-Word Learning Task, Memory Comparisons Task, Concept Shifting Test, Letter-Digit Modalities Test, Stroop Color-Word Test, Fluency Task, CFQ, and SCL-90S100-b levels increased 1 h and 3 h after ECT; higher S-100b concentration at baseline was associated with poorer memory function at 5 and 30 days of follow-up 6
Piccinni et al. 2013Aβ40, Aβ4225Bipolar depression
12M, 13W/44 Y
SM, STOP ST
BFT, brief
8.3 sessions
2/week
Pre-TEC, 1 week after last ECTMMSEAβ40 levels negatively correlated with pre- and post-ECT MMSE scores; Aβ40/Aβ42 negatively correlated with post-ECT MMSE score6
Kranaster et al. 2016Aβ4212Unipolar and bipolar depression
7W, 5M/59 Y
SM
RUL
10.6 sessions
2–3/week
Pre-ECT and 1–7 days post-ECTMMSE-6
Yamazaki et al. 2017Aβ40, Aβ4242 (13 ECT)Unipolar and bipolar depression
31W, 11M (9W, 4M ECT)/69 Y
SM
BFT, brief
3/week
Pre-ECT, 2–4 weeks after ECTMMSE, CDR, Logical Memory I and II subscales of WMS-R, Wisconsin Card Sorting Test and VFTAβ40 levels before discharge were negatively correlated with VFT scores; Aβ40 levels on admission were significantly higher in MCI-non-reversors compared with cognitively preserved patients or MCI-reversors7
Bousman et al. 2015COMT, DRD2, BDNF, APOE117Unipolar and bipolar depression
42% M/48 Y
BFT, BF, RUL, PW 0.3–1 ms
9 sessions
3/week
1–3 days after ECTMCG, HVLT-R, VFT, Cross Out task, SDMT, AMI-SF, and WTARInteraction between DRD2 C957T and BDNF Val66Met polymorphisms on anterograde memory5.5
Ryan et al. 2019TL180 (100 P)Unipolar and bipolar depression
P (62W, 38M), C (54W, 26M)/54 Y
SM
BFT, RUL
8 sessions
Pre- and post-ECTTime to recovery orientation, MMSE and CAMI-SF-7
Neylan et al. 2001Cortisol16Unipolar and bipolar depression
11W, 5M/49 Y
SM
RUL, brief pulse
6 sessions
3/week
1 day before ECT (saliva—8 A.M., 4 P.M., and 10 P.M.) and cognitive post-ECT assessment 1 day after ECTMattis Dementia Rating Scale, TMT, Stroop Color and Word Test, SDMT WMS subtest of Visual Recall, Employee Aptitude Survey and CVLTHigher cortisol levels predicted ECT-induced cognitive dysfunction5
AMI-SF, Autobiographical Memory Interview—Short Form; BFT, bilateral fronto-temporal; CAMI-SF, Columbia Autobiographical Memory Interview—Short Form; CDR, Clinical Dementia Rating; CFQ, Cognitive Failure Questionnaire; CVLT, California Verbal Learning Tes; HVLT-R, Hopkins Verbal Learning Test—Revised; IMC, Information memory concentration test; M, man; MCG, Medical College of Georgia Complex Figure Test; MMSE, Mini-Mental State Examination; NM, no-medication; NSE, Neuron-specific enolase; RUL, right unilateral; SCL-90, Symptoms Checklist 90; SKT, Syndrom Kurztest; SM, Same medication; SDMT, Symbol Digit Modalities Test; MDD, Major depressive disorder; ST, Mood-Stabilizers; VFT, Verbal Fluency Test; TMT; Trail Making Test; W, woman; WMS-R, Wechsler Memory Scale-Revised; WTAR, Wechsler Test of Adult Reading; Y, Years.
Table 2. Structural magnetic resonance imaging studies.
StudyMeasureNDiagnosis
Gender/Age (Mean, Years)
Medication Status
ECT ParametersTime-PointsCognitive ScalesSignificant ResultsQuality Index
Figiel et al. 1990WMH36MDD (ECT-induced delirium)BFT, brief
3/week
Post-ECTMental Status Examination by Strub and BlackWMH within the basal ganglia after ECT4.5
Oudega et al. 2015WMH, MTLA, GCA39MDD
26% W/73 Y
NM
RUL (18 switch BFT)
2/week
Pre-ECTIQ CODE-4.5
Wagenmakers et al. 2021WMH, MTLA, GCA80LLD
54% W/73 Y
NM
RUL, BFT
11 sessions
2/week
Pre-ECTMMSEWorse cognitive functioning before ECT in patients with severe WMH5
Diehl et al. 1993MTL and thalamic T2 relaxation time6MDD
1W, 5M/21–55 Y
Without APS
RUL, brief
3/week
1–2 days before ECT, 1 day before 2nd ECT, and 2–2.5 h post 2nd ECTTMT, Temporal Orientation Test, Benton Visual Retention Test, HVLT, In-house verbal retrograde memory testPost hoc correlational analyses revealed a significant relationship between left thalamus T2 relaxation time increases and ECT-induced verbal anterograde memory impairment5
Kunigiri et al. 2007Thalamus, hippocampal, MTL, and DLPFC T2 relaxation time15Melancholic depression
8W, 7M/32 Y
NM
BFT, RUL
3/week
48 h after 1st ECT and 2 h after 2nd ECTOBT, TMT-A, WMS, VLT and BVRT-5.5
Gbyl et al. 2019Cortical thickness and hippocampal volume18Unipolar and bipolar depression
10W, 8M/47 Y
SM
BFT, brief
11.9 sessions
3/week
2 days pre-ECT, 2 days, 6 days, and 6 months post-ECTSCIP-D-6
Xu et al. 2019Cortical thickness, surface area, and local gyrification index23MDD
12W, 11M/39 Y
BFT, brief
7.3 sessions
3/week
12–24 h pre-ECT and 24–72 h after ECTAVLTCortical thickness increases in the left inferior parietal gyrus were positively correlated with AVLT score after ECT6
Lekwauwa et al. 2006Hippocampal volume15Unipolar depression
12W, 3M/74 Y
BFT, RUL
11.4 sessions
47 days after ECTMMSEThe hippocampal volume mean of those patients with moderate or severe memory problems after ECT was significantly smaller compared to those patients without or mild memory problems5.5
Nordanskog et al. 2014Hippocampal volume20Unipolar and bipolar depression
10W, 2M/40 Y
SM
RUL, BFT, brief
10.2 sessions
3/week
1-week pre-ECT, 1 week, 6 months, and 1-year post-ECTRAVLT, RCFT, TMT-A, B, Stroop Test, VFT, Digit Symbol, Digit Span, and Block Design TestHippocampal volume increases one week after ECT and decreases 6 months after ECT; left hippocampal volume increase was positively correlated to TMT-A score improvement after ECT (disappeared after controlling for the number of ECT sessions)6
Van Oostrom et al. 2018Hippocampal volume37 (19 P)Unipolar depression
P (37% M/50 Y), C (39% M/52 Y)
NM
BFT, brief
17.7 sessions
2/week
1 week before ECT and 1 week afterTMT-A, B, VFT, RAVLT, WMS II, Visual Reproduction I-I, I and National Adult Reading TestHippocampal volume increases were correlated with ECT-induced decrease cognitive functioning7
Gbyl et al. 2020Hippocampal subfields volume22Unipolar and bipolar depression
11W, 11M/45 Y
SM
BFT, brief
12.5 sessions
3/week
Pre-ECT, 1 week and 6 months after ECTSCIPHippocampal subfields volume increases were associated with decline in cognitive performance during ECT while hippocampal subfields volume decreases correlated with cognitive recovery at 6 months follow-up6
PCC, Posterior cingulate; PeriCAL, Pericalcarine cortex; pOPER, Pars opercularis; pORB, Pars orbitalis; PostCG, Postcentral gyrus; PreCG, Precentral gyrus; PreCUN, Precuneus; pTRI, Pars triangularis; RAC, Rostral anterior cingulate; rMFG, Rostral middle frontal gyrus; RAVLT, Rey Auditory Verbal Learning Test; RCFT, Rey Complex Figure Test; ROI, Region of interest; RUL, Right unilateral; SCIP, Screen for Cognitive impairment in Psychiatry; SFG, Superior frontal gyrus; SM, Same medication; SMG, Supramarginal gyrus; SPG, Superior parietal gyrus; STG, Superior temporal gyrus; TMT, Trail making test; TP, Temporal pole; VFT, Verbal fluency test; VLT, Verbal learning test; W, Woman; WMH, White Matter Hiperyintesities; WMS, Wechsler Memory Scale; Y, Years. AVLT, Auditory Verbal Learning test; BFT, bifronto.temporal; BSTS, Banks of the Superior Temporal Sulcus; BVRT, Benton Visual Retention Test; C, controls; CA, Cornu Amonis; CAR, caudal anterior cingulate; cMFG, caudal middle frontal gyrus; CODE, Cognitive Decline in the Elderly; CUN, Cuneus; DLPFC, Dorsolateral prefrontal cortex; EC, Entorhinal Cortex; FG, Fusiform Gyrus; FP, Frontal pole; GCA, global cortical atrophy; HATA, Hippocampus–amygdala-transition-area; HVLT, Hopkins Verbal Learning Test; IC, Isthmus cingulate; IPG, Inferior parietal gyrus; ITG, Inferior temporal gyrus; LFGo, Lateral orbitofrontal gyrus; LG, Lingual gyrus; LLD, Late-life depression; LOG, Lateral occipital gyrus; M, Man; MFGor, MDD, Major depressive disorder; Medial orbitofrontal gyrus; MTLA, medial temporal lobe atrophy; MTG, Middle temporal gyrus; MTL, Medial Temporal Lobe; NM; no.medication; P, Patients; ParaCG, Paracentral gyrus; ParaHIPP, Parahippocampal gyrus; PCC, Posterior cingulate; PeriCAL, Pericalcarine cortex; pOPER, Pars opercularis; pORB, Pars orbitalis; PostCG, Postcentral gyrus; PreCG, Precentral gyrus; PreCUN, Precuneus; pTRI, Pars triangularis; RAC, Rostral anterior cingulate; rMFG, Rostral middle frontal gyrus; RAVLT, Rey Auditory Verbal Learning Test; RCFT, Rey Complex Figure Test; ROI, Region of interest; RUL, Right unilateral; SCIP, Screen for Cognitive impairment in Psychiatry; SFG, Superdior frontal gyrus; SM, Same medication; SMG, Supramarginal gyrus; SPG, Superior parietal gyrus; STG, Superior temporal gyrus; TMT, Trail making test; TP, Temporal pole; VFT, Verbal fluency test; VLT, Verbal leraning test; WMH, White Matter Hiperyintesities; WMS, Wechsler Memory Scale.
Table 3. Functional magnetic resonance imaging.
StudyROINDiagnosis
Gender/Age (Mean, Years)
Medication Status
ECT ParametersTime-PointsCognitive SCALESSignificant ResultsQuality Index
Abbot et al. 2014Hippocampus19MDD
13W, 6M/65 Y
19 AD and 11 APS
RUL, BFT
11 sessions
3/week
Post-ECTRBANSHippocampal FC normalization after ECT5.5
Bai et al. 2018Hippocampus45MDD
28W, 17M/38 Y
BFT
6–12 sessions
3/week
Pre-ECT and post-ECTCVFTDecreased hippocampal-angular FC was associated with cognitive impairment after ECT6
Wang et al. 2019Salience network23MDD
11W, 11M/37 Y
BFT, brief
3/week
Pre-ECT and
post-ECT
AVLTFunctional and effective connectivity changes within the salience network correlated with delayed memory dysfunction6
Wang et al. 2020Whole-brain24MDD
11 W, 13M/37 Y
STOP ST, BZD
BFT, brief
6.9 sessions
3/week
Pre-ECT,
1–7 days post-ECT and
1-month post-ECT
RAVLTFunctional connectivity within the FPN, the DMN, and subcortical structures were able to predict RAVLT changes after ECT6
Sinha et al. 2019Frontal and limbic lobes17MDD
10W, 7M/45 Y
SM
BFT, brief
7.2 sessions
Pre-ECT and
after 6th ECT
WMS-6
Wei et al. 2019Whole-brain28 P
20 HC
MDD
16 W, 12M/37 Y
SM
BFT, brief
7.64 sessions
3/week
Pre-ECT and
post-ECT
VFTLeft pulvinar-bilateral precuneus FC was associated with poor cognitive functioning after ECT7
Wei et al. 2020DMN28 P
20 HC
MDD
16W, 12M/37 Y
SM
BFT, brief
7.64 sessions
3/week
Pre-ECT and
post-ECT
VFTIncreased left sgACC—left cerebellar lobule VI FC correlated with VFT scores after ECT7
AD, Antidepressants; AG, Angular gyrus; APS, antipsychotics; AVLT, Auditory Verbal Learning test; BFT, bifronto-temporal; BZD, Benzodiazepines; CVFT, Category Verbal Fluency Test; DL, dorsolateral; DLPFC, Dorsolateral prefrontal cortex; DMN, Default mode network; FC, functional connectivity; FPN, Frontoparietal Network; HAMD, Hamilton Depression Rating Scale; HC, Healthy controls; HIPc, hippocampal cognitive subregion; HRSD, Hamilton Rating Scale for Depression; M, Man; MDD, Major depressive disorder; RBANS, Repeatable Assessment for Neuropsychological Status; RUL, right unilateral; RVALT, Rey Auditory Verbal Learning Test, sgACC, Subgenual anterior cingulate cortex; ST, Mood-Stabilizers; VFT, Verbal fluency test; W, Woman; WMS, Wechsler Memory Scale; Y, Years.
Publisher’s Note: MDPI stays neutral with regard to jurisdictional claims in published maps and institutional affiliations.

