
Antiangiogenic Properties of Axitinib versus Sorafenib Following Sunitinib Resistance in Human Endothelial Cells—A View towards Second Line Renal Cell Carcinoma Treatment


Abstract
:1. Introduction
2. Materials and Methods
2.1. Human Umbilical Vein Endothelial Cells
2.2. Dose-Response Analysis
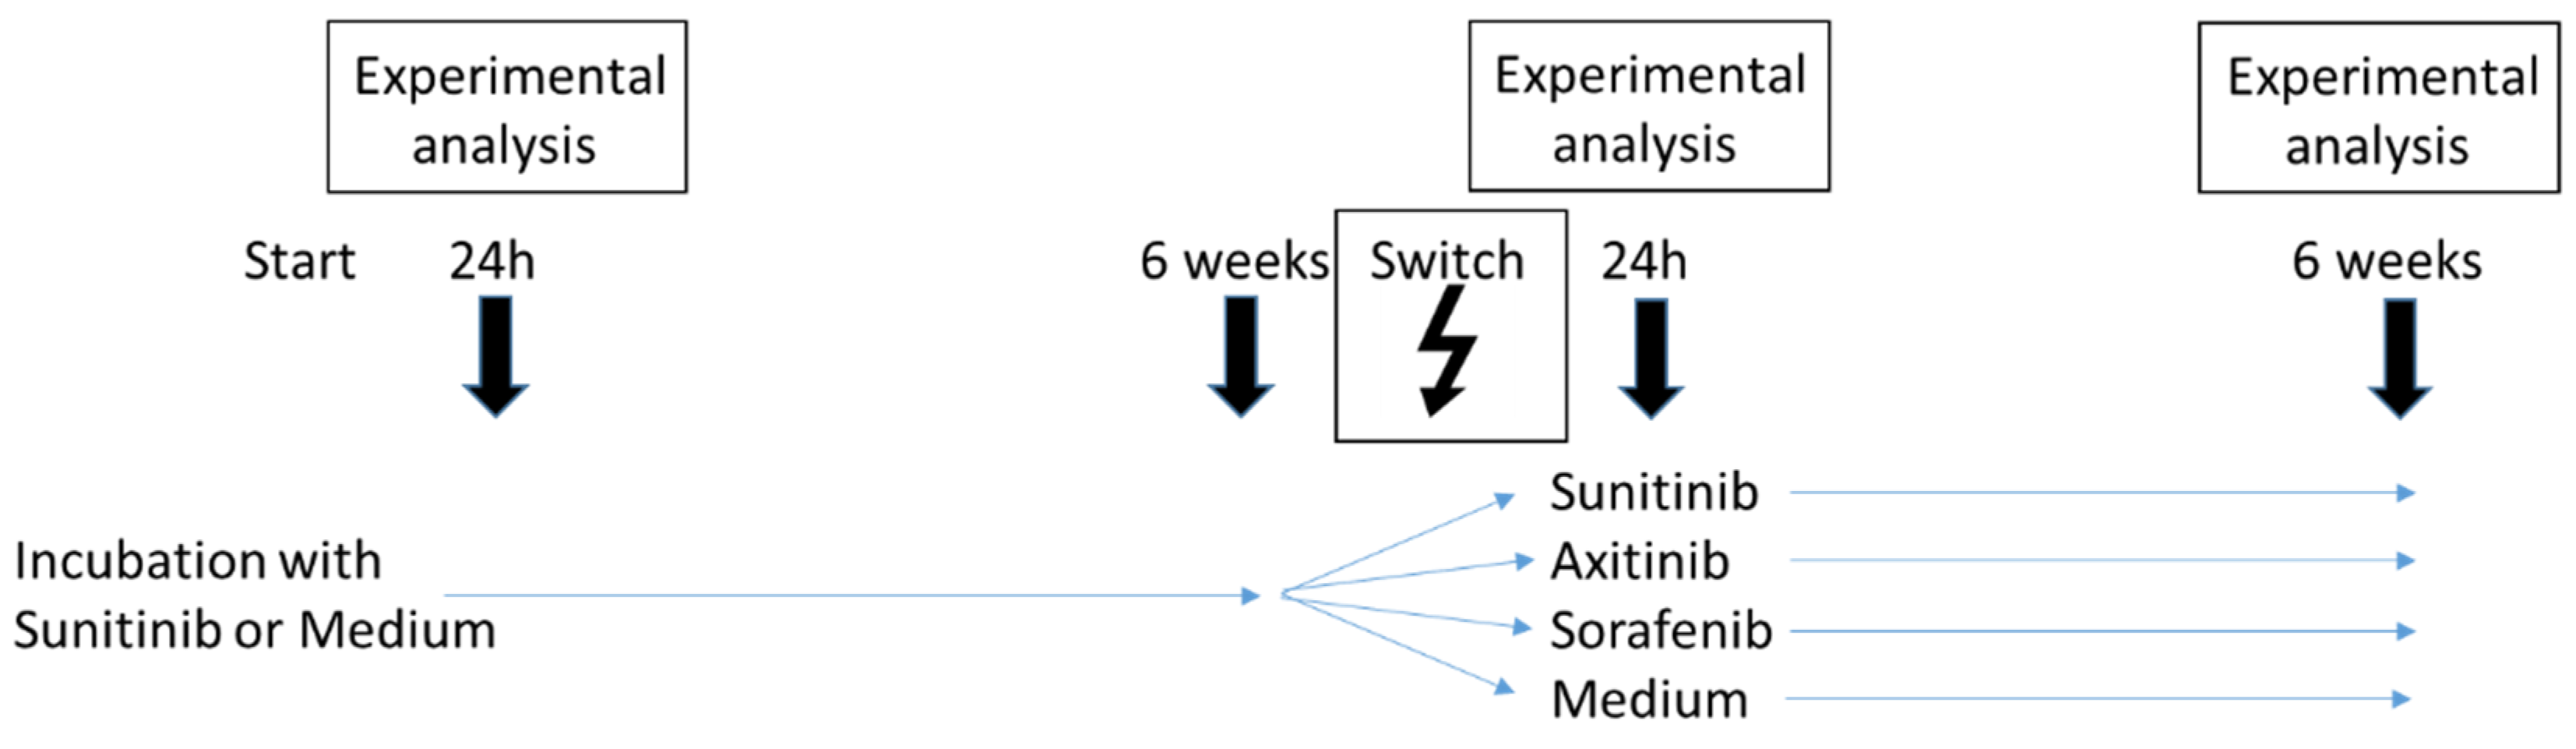
2.3. Sequence Therapy
2.4. Analysis of Cell Cycling
2.5. Analysis of Cell Cycle Regulating Proteins
2.6. Tube Formation Assay
2.7. Scratch Wound Assay
2.8. Statistics
3. Results
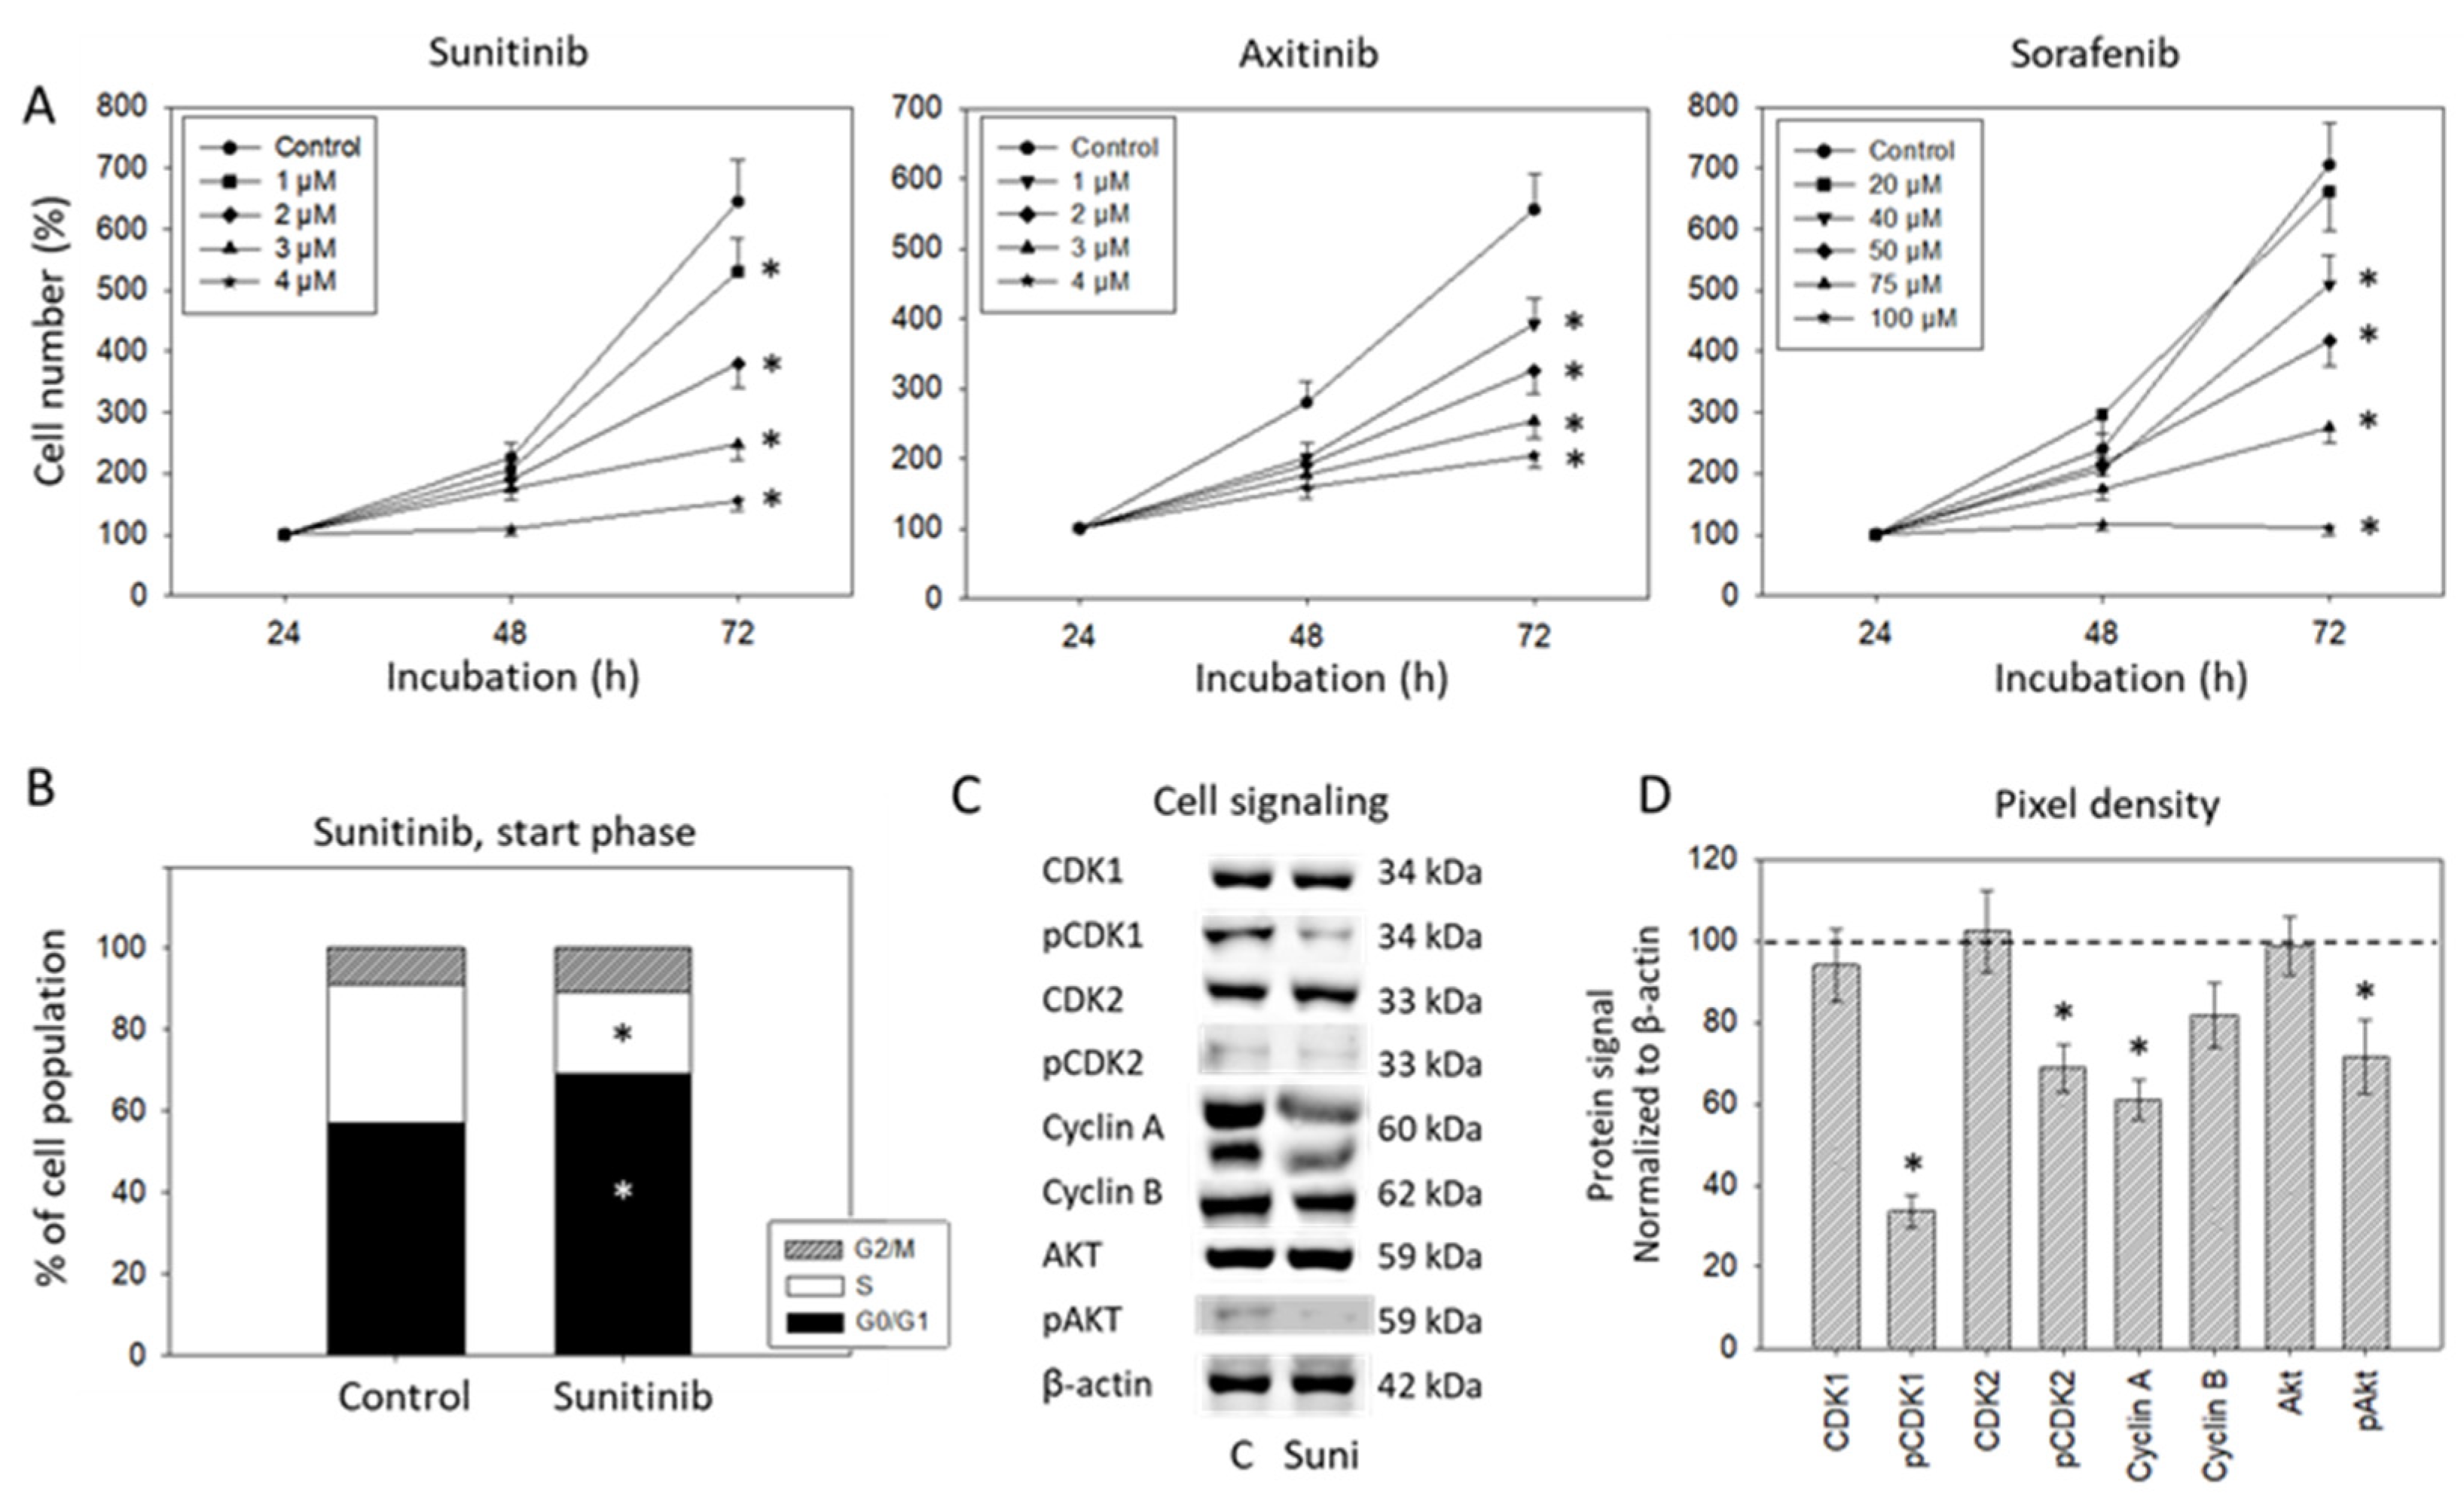
3.1. Dose-Response Analysis
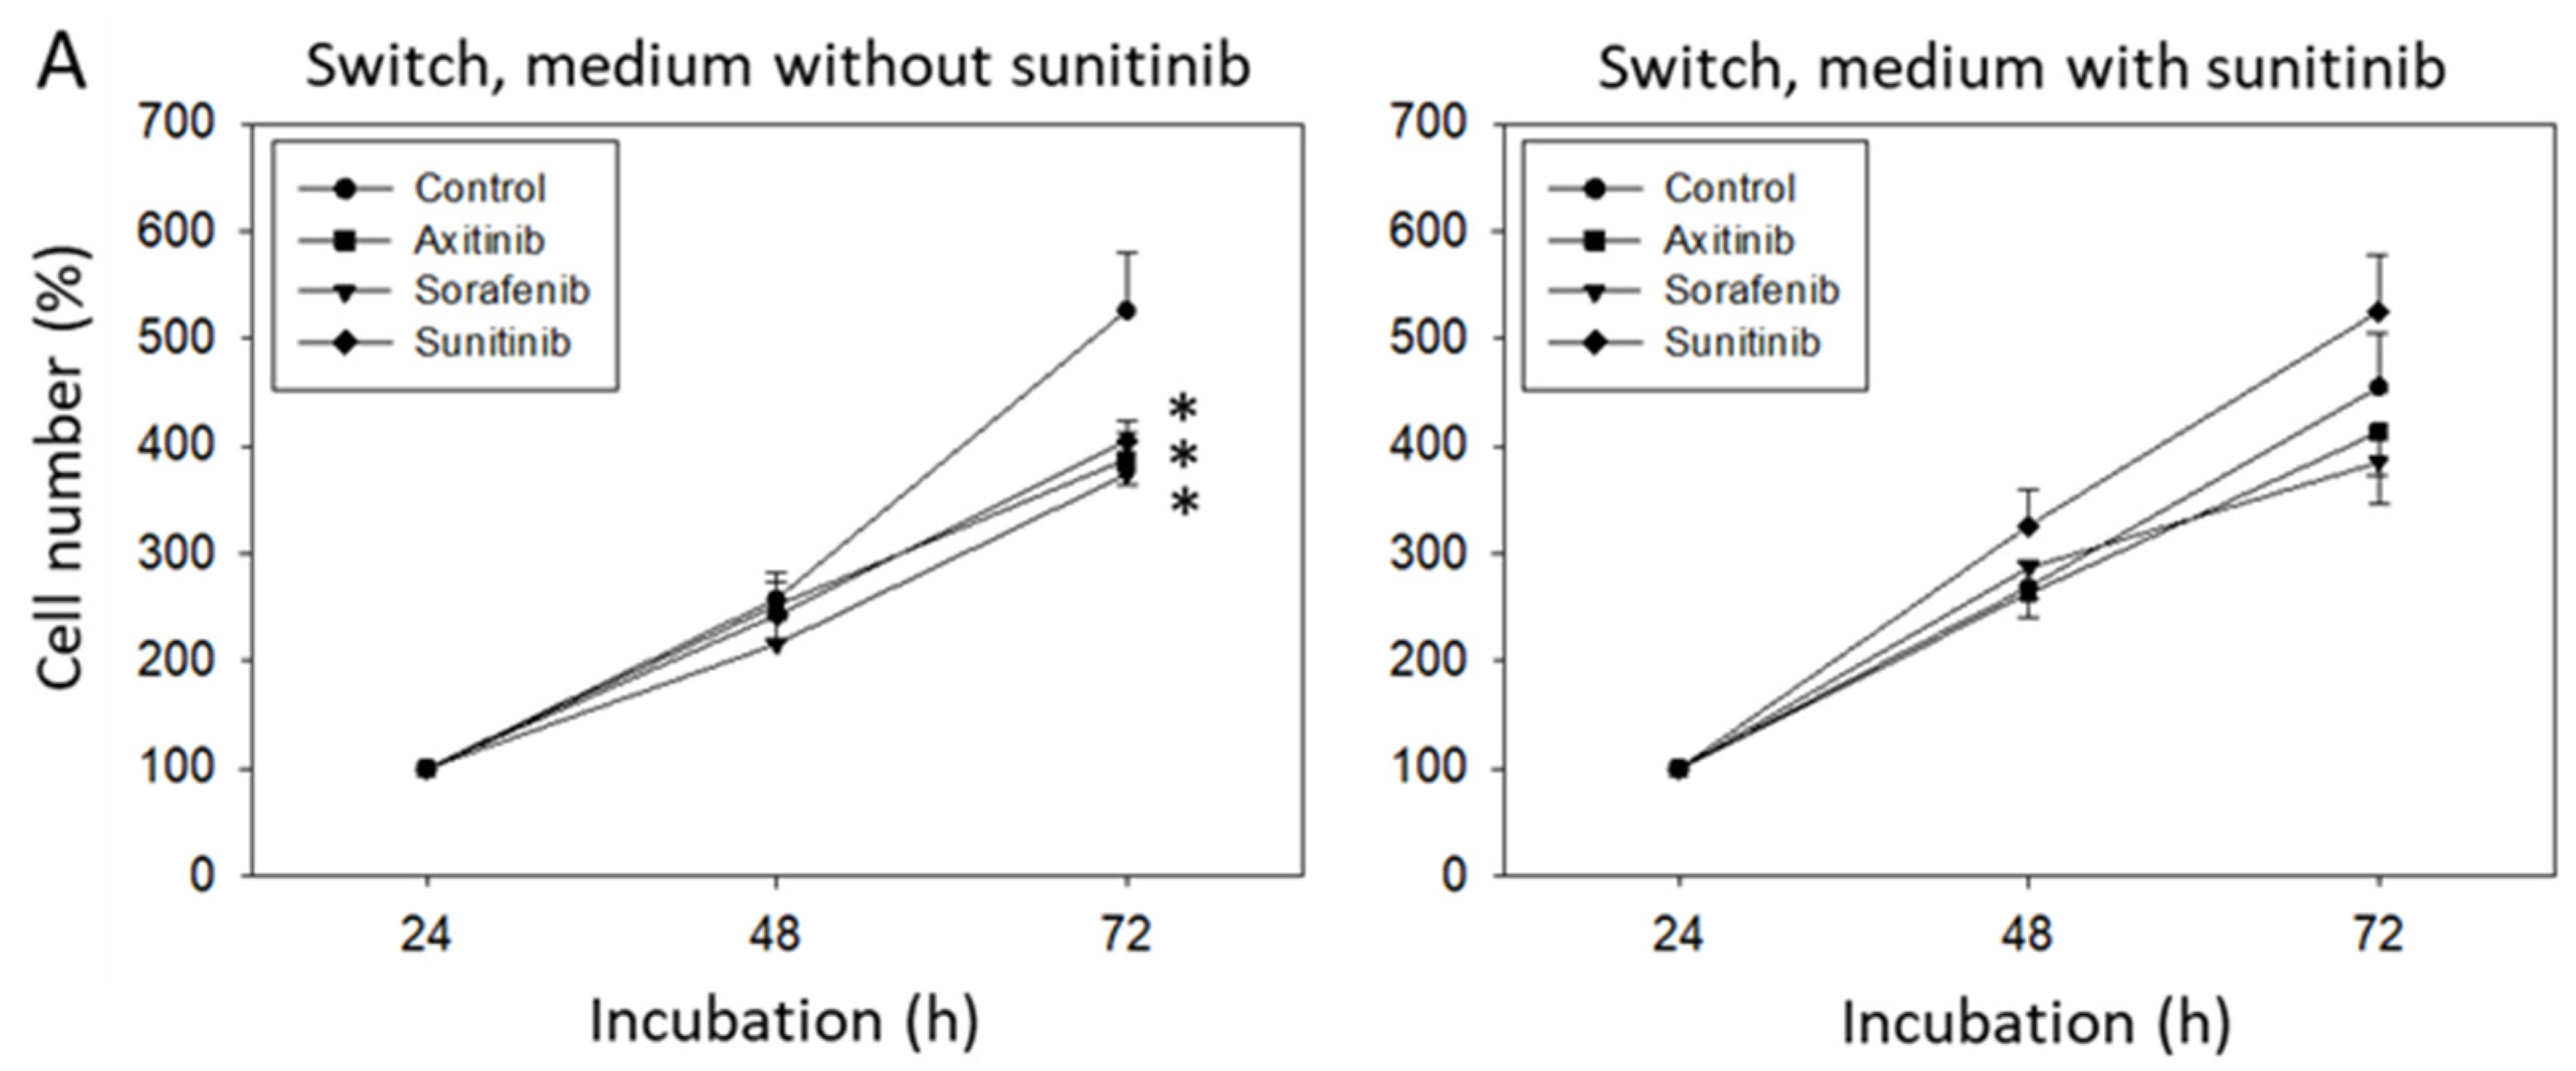
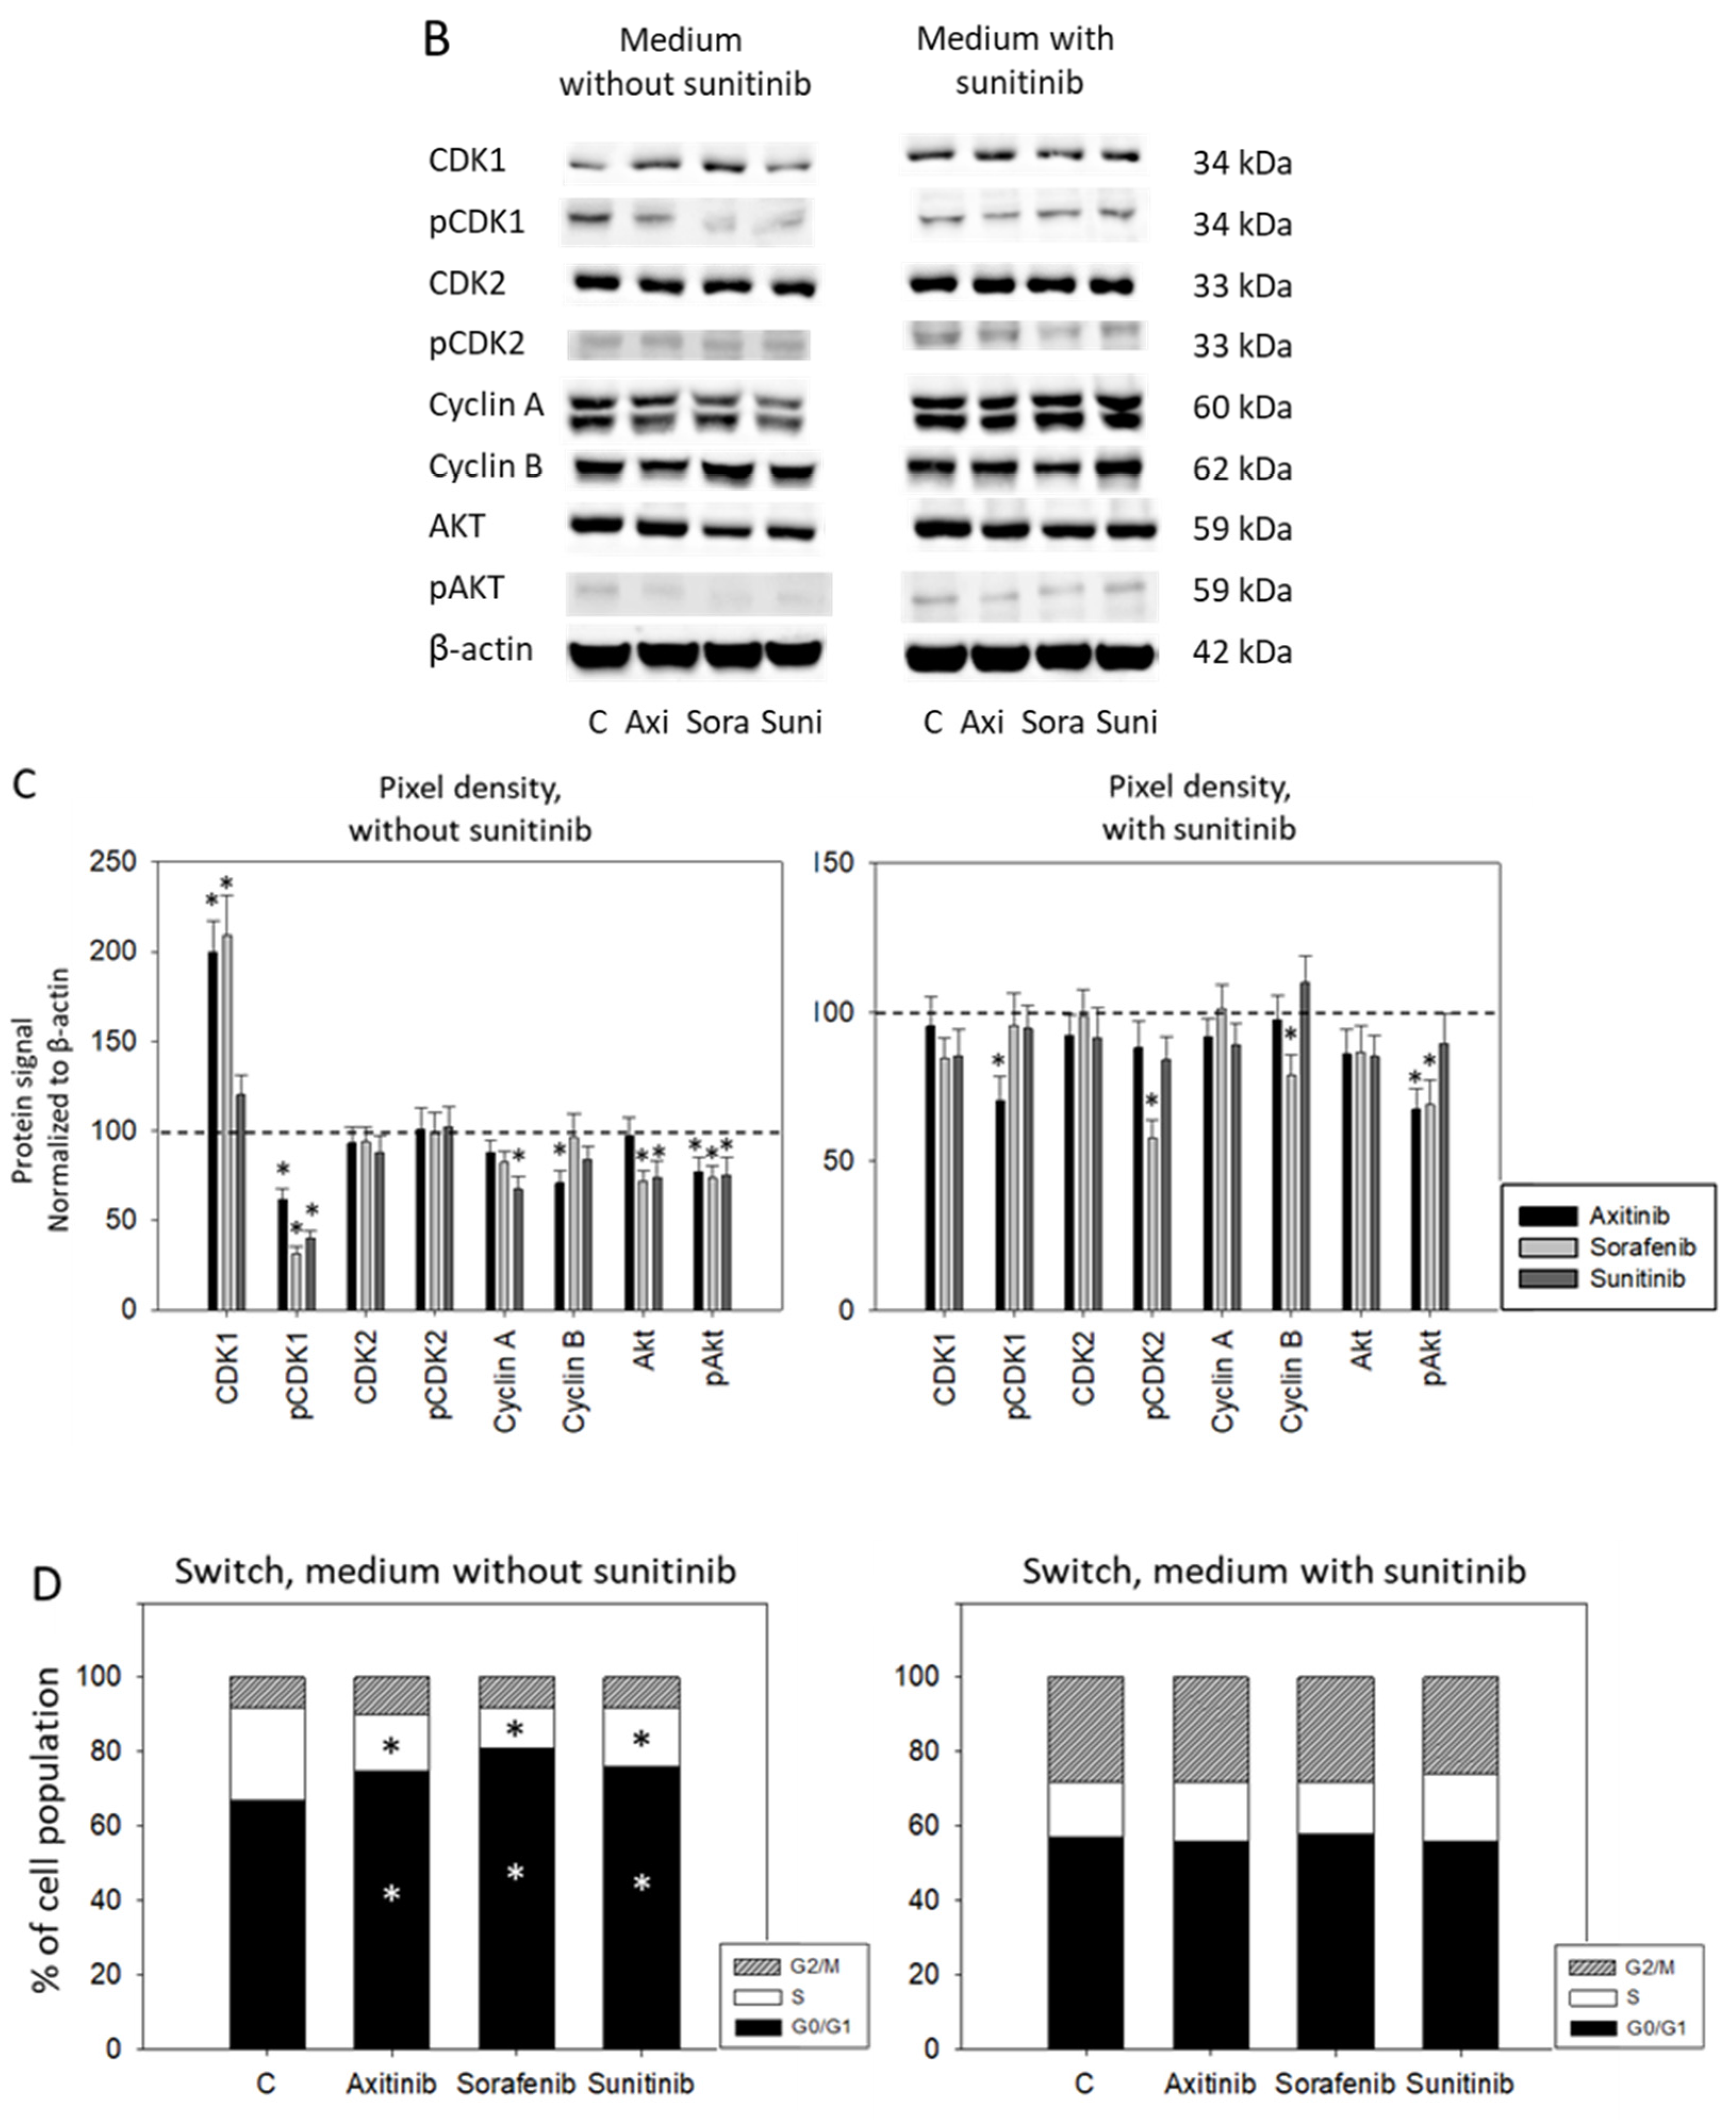
3.2. Sequence Therapy, Switch
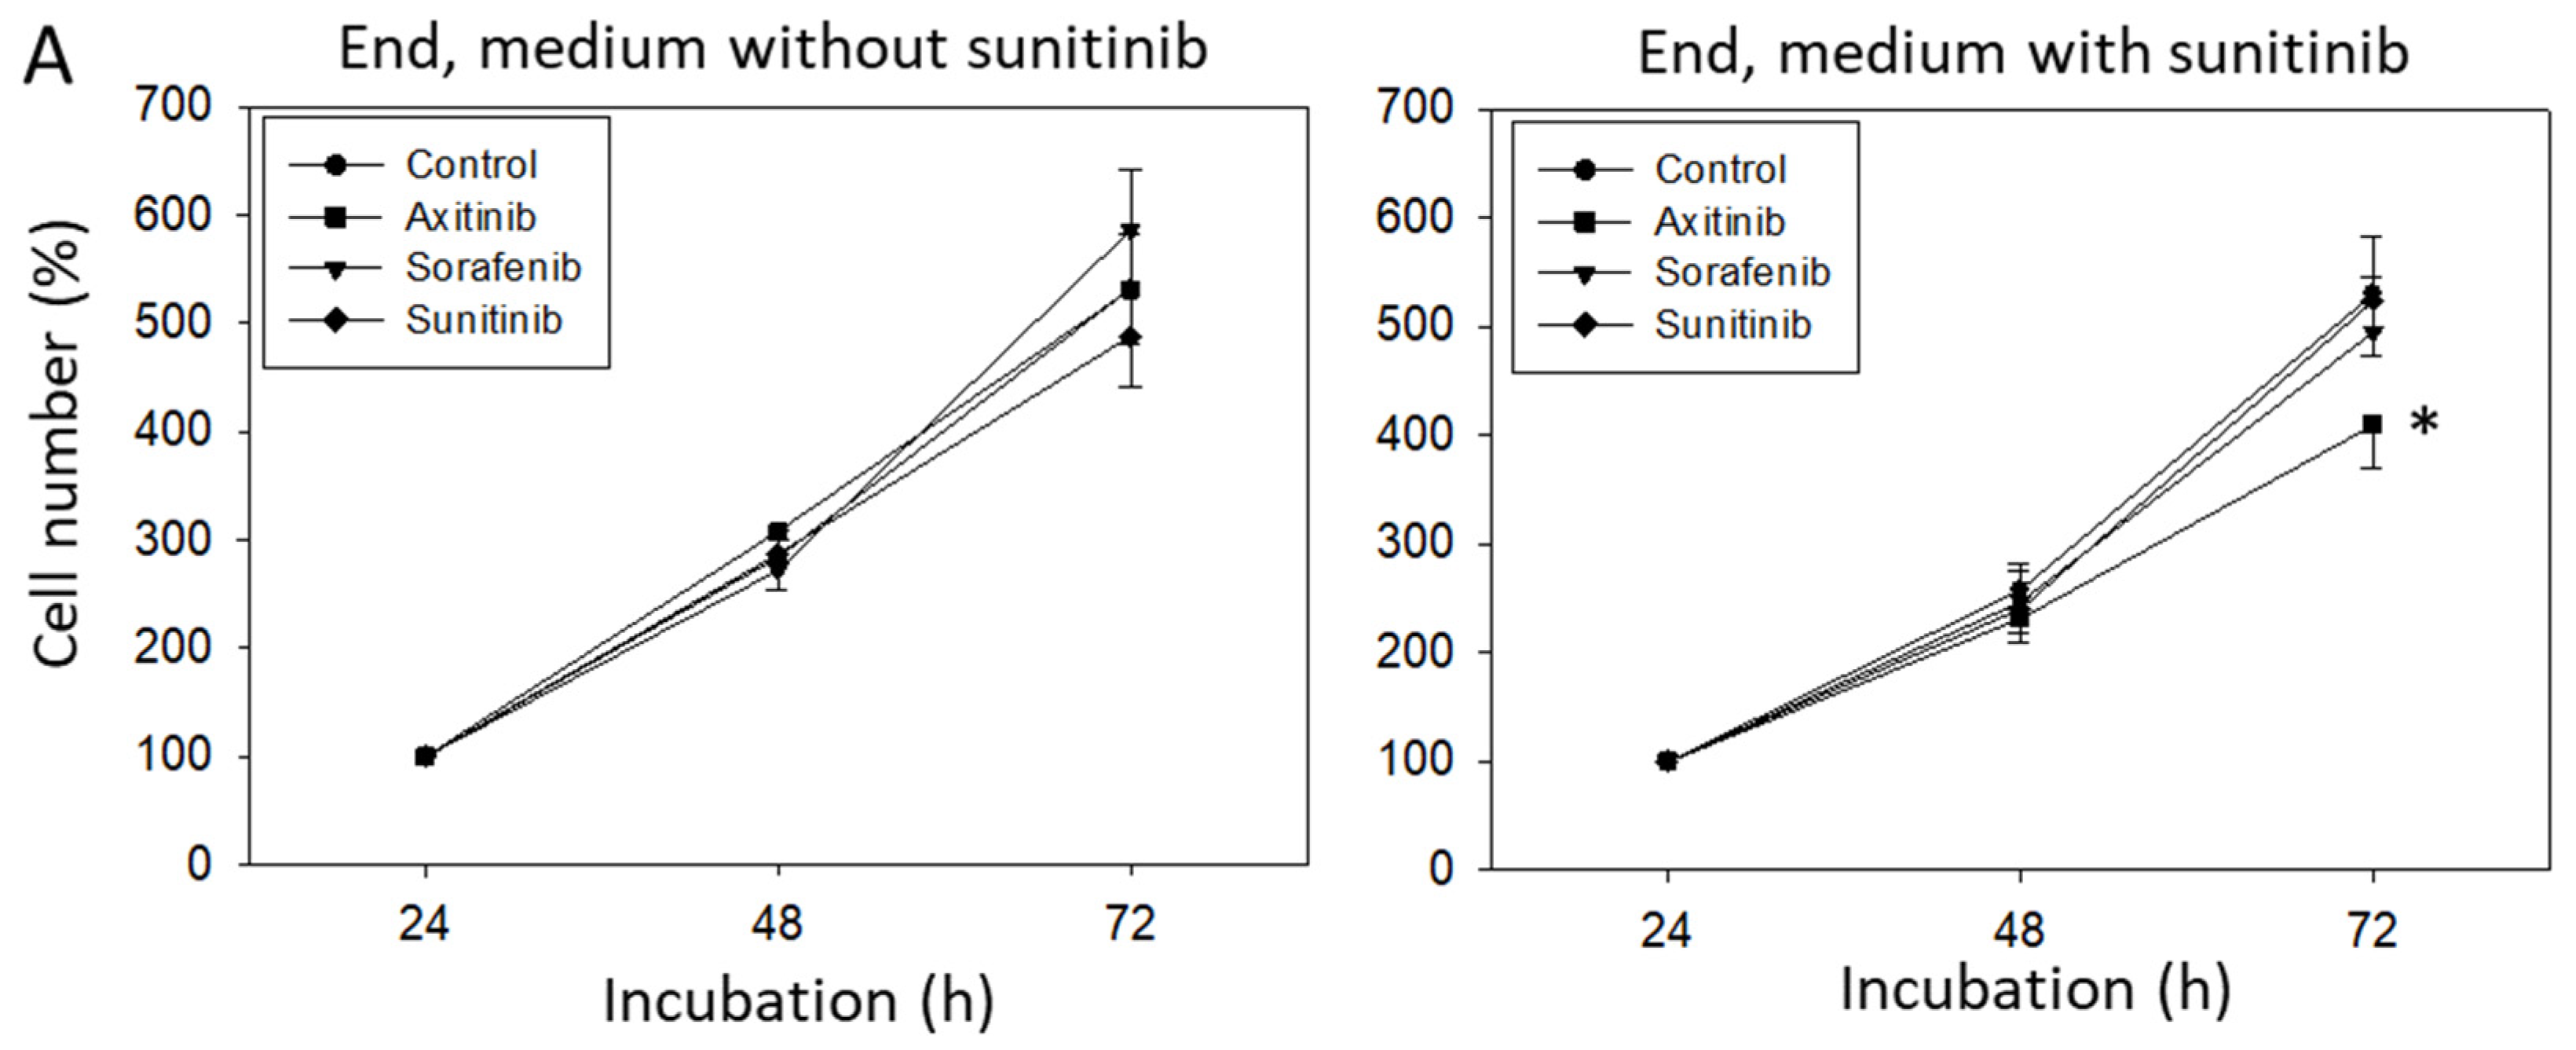
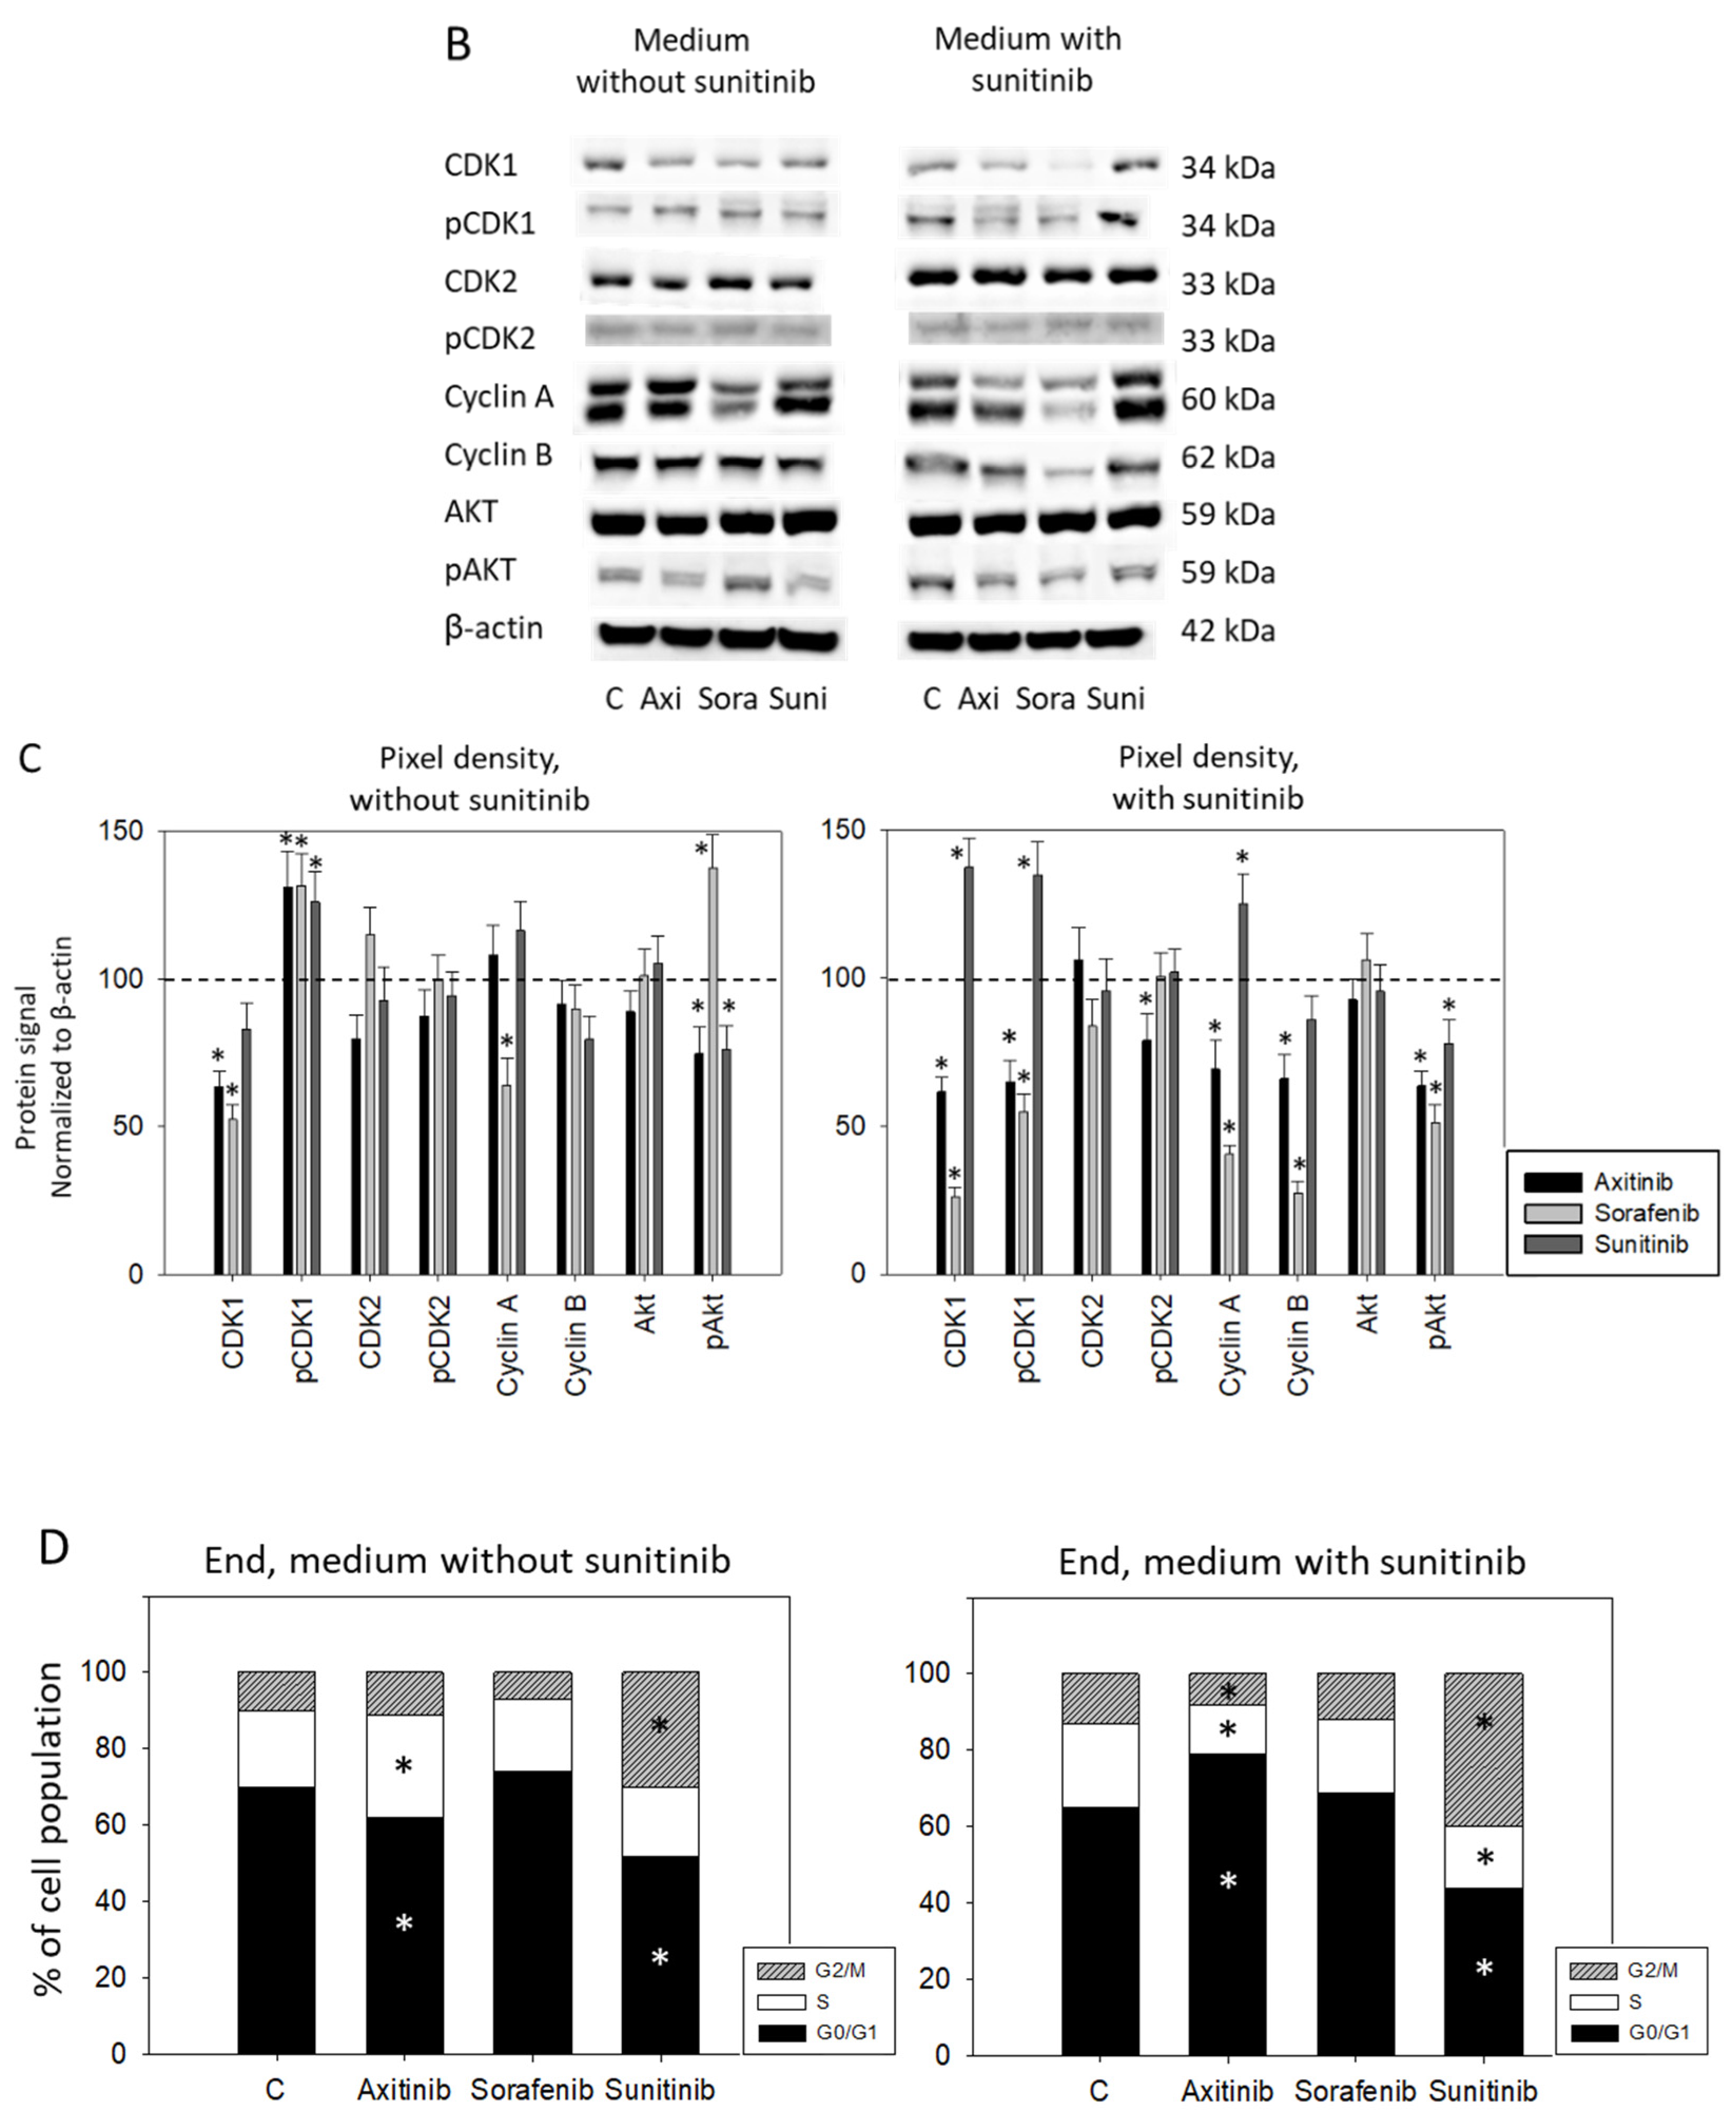
3.3. Sequence Therapy, End
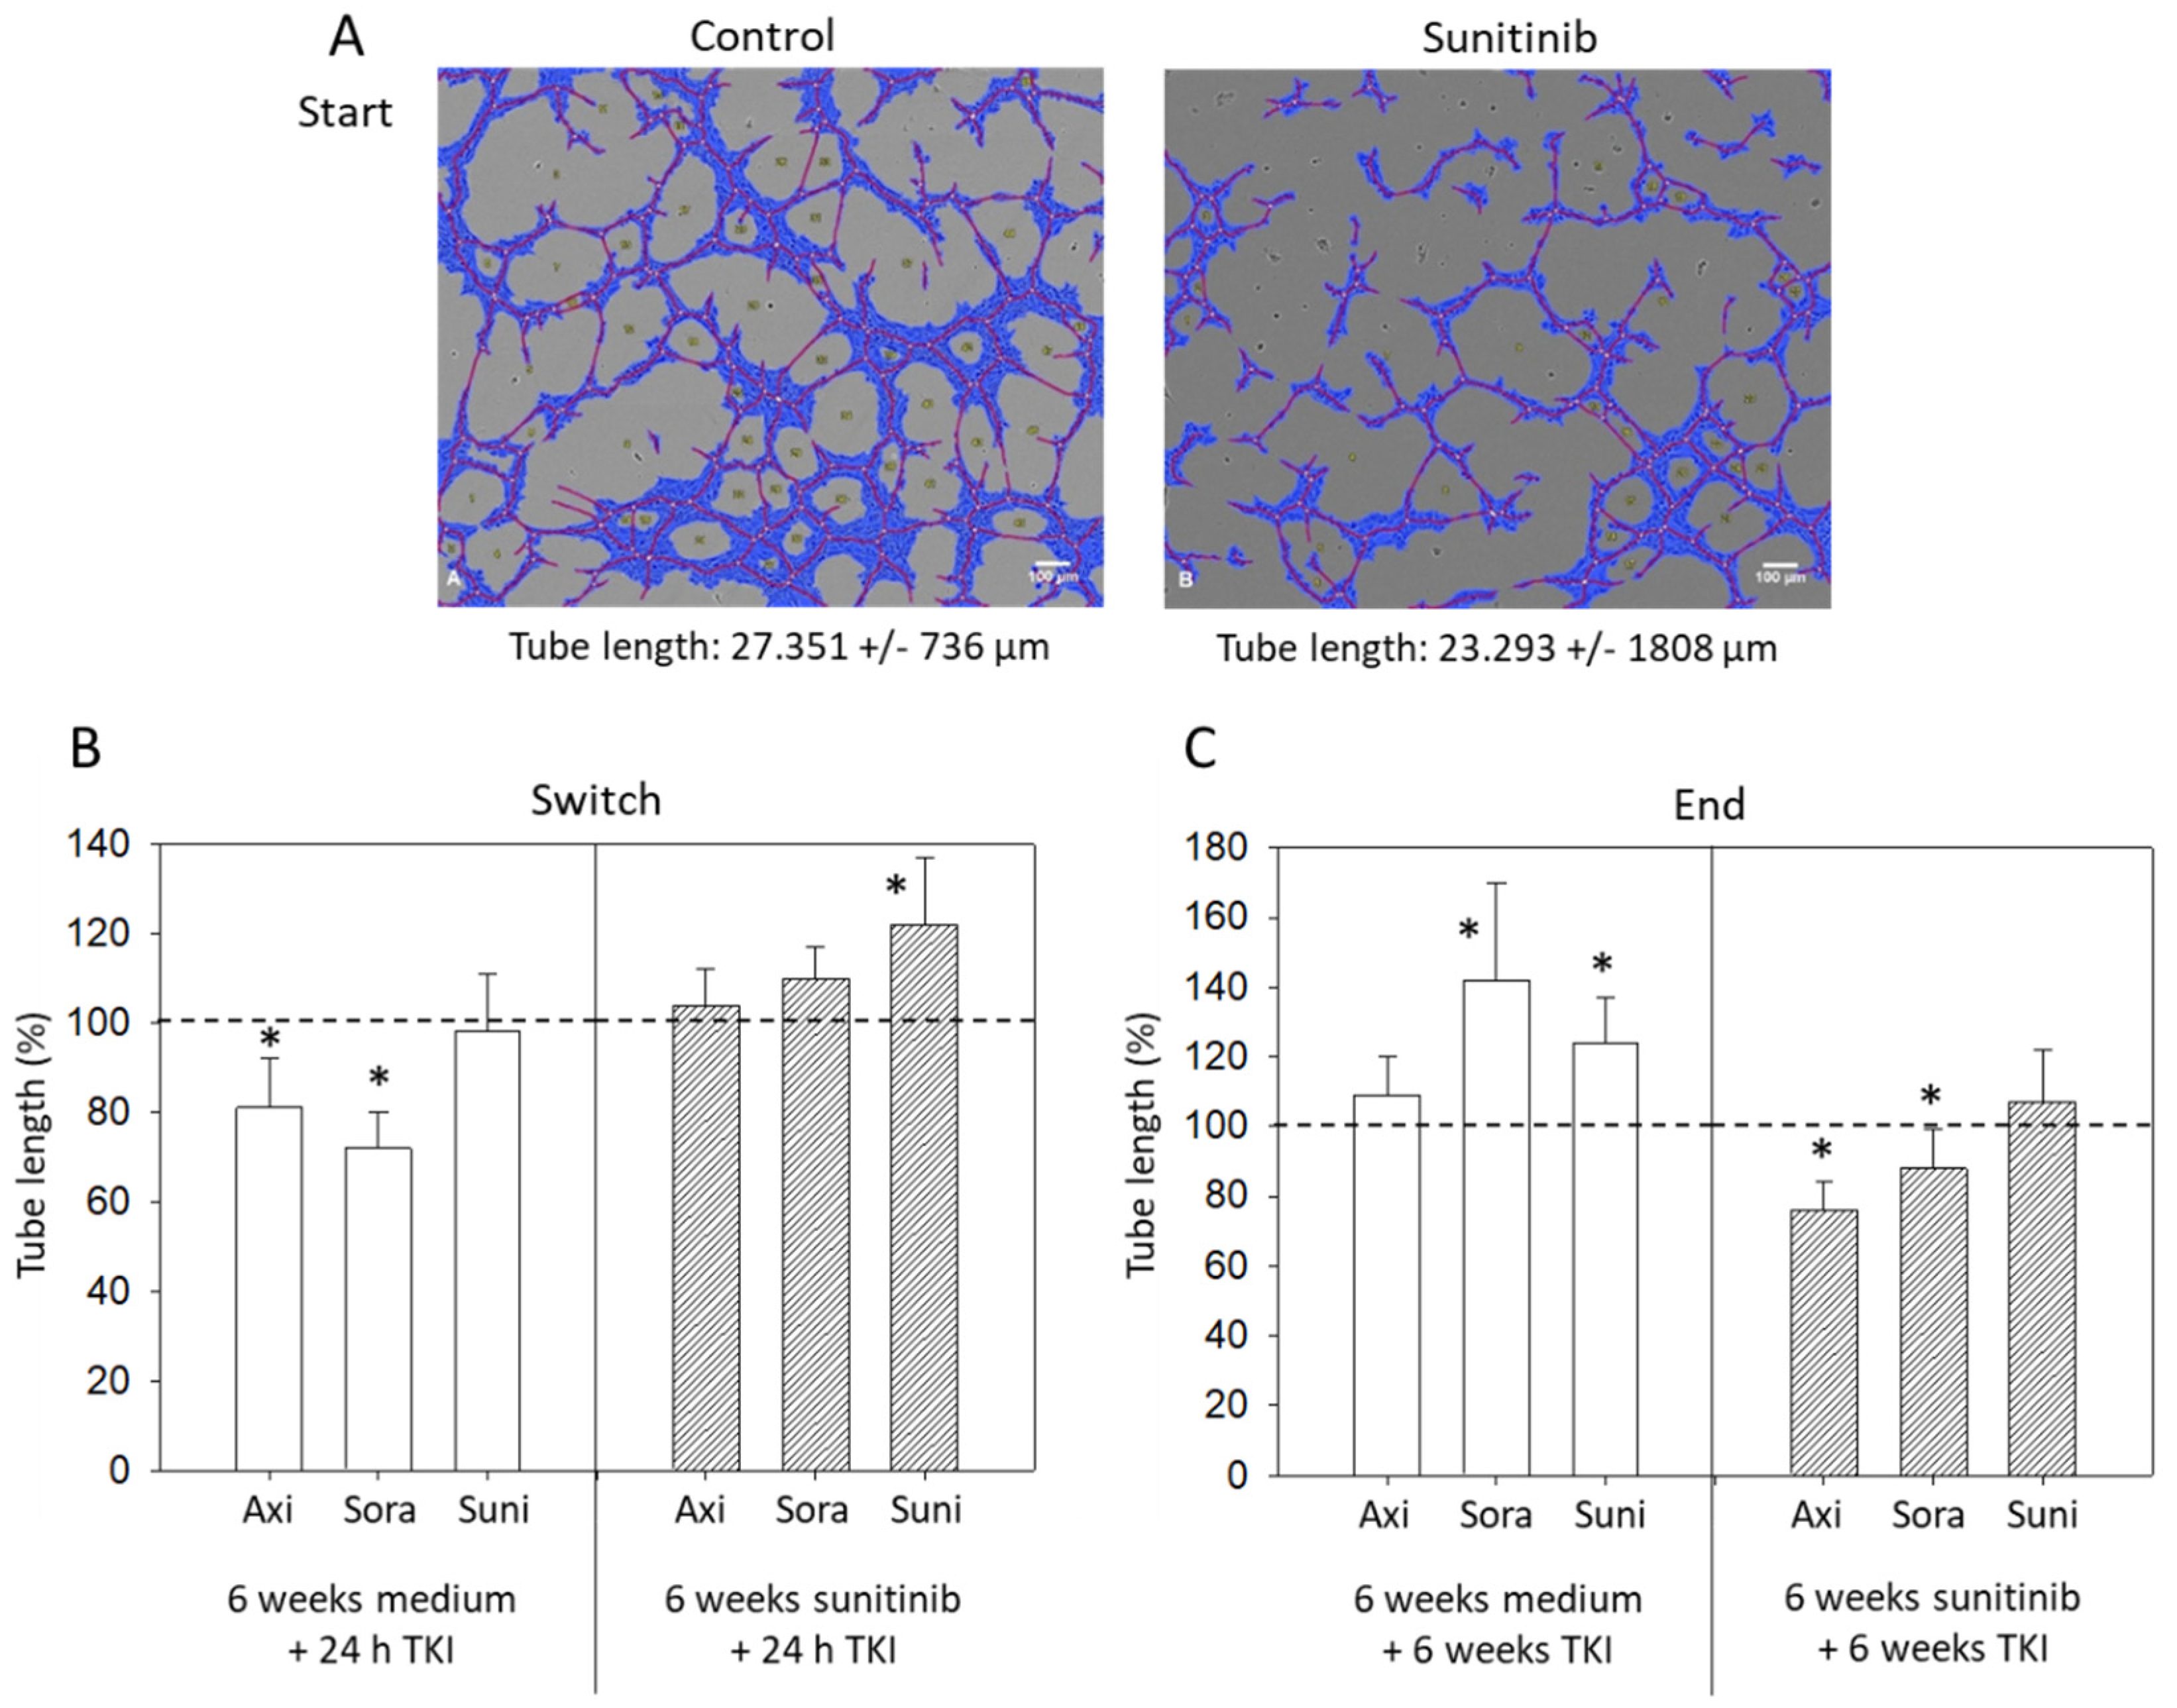
3.4. Tube Formation
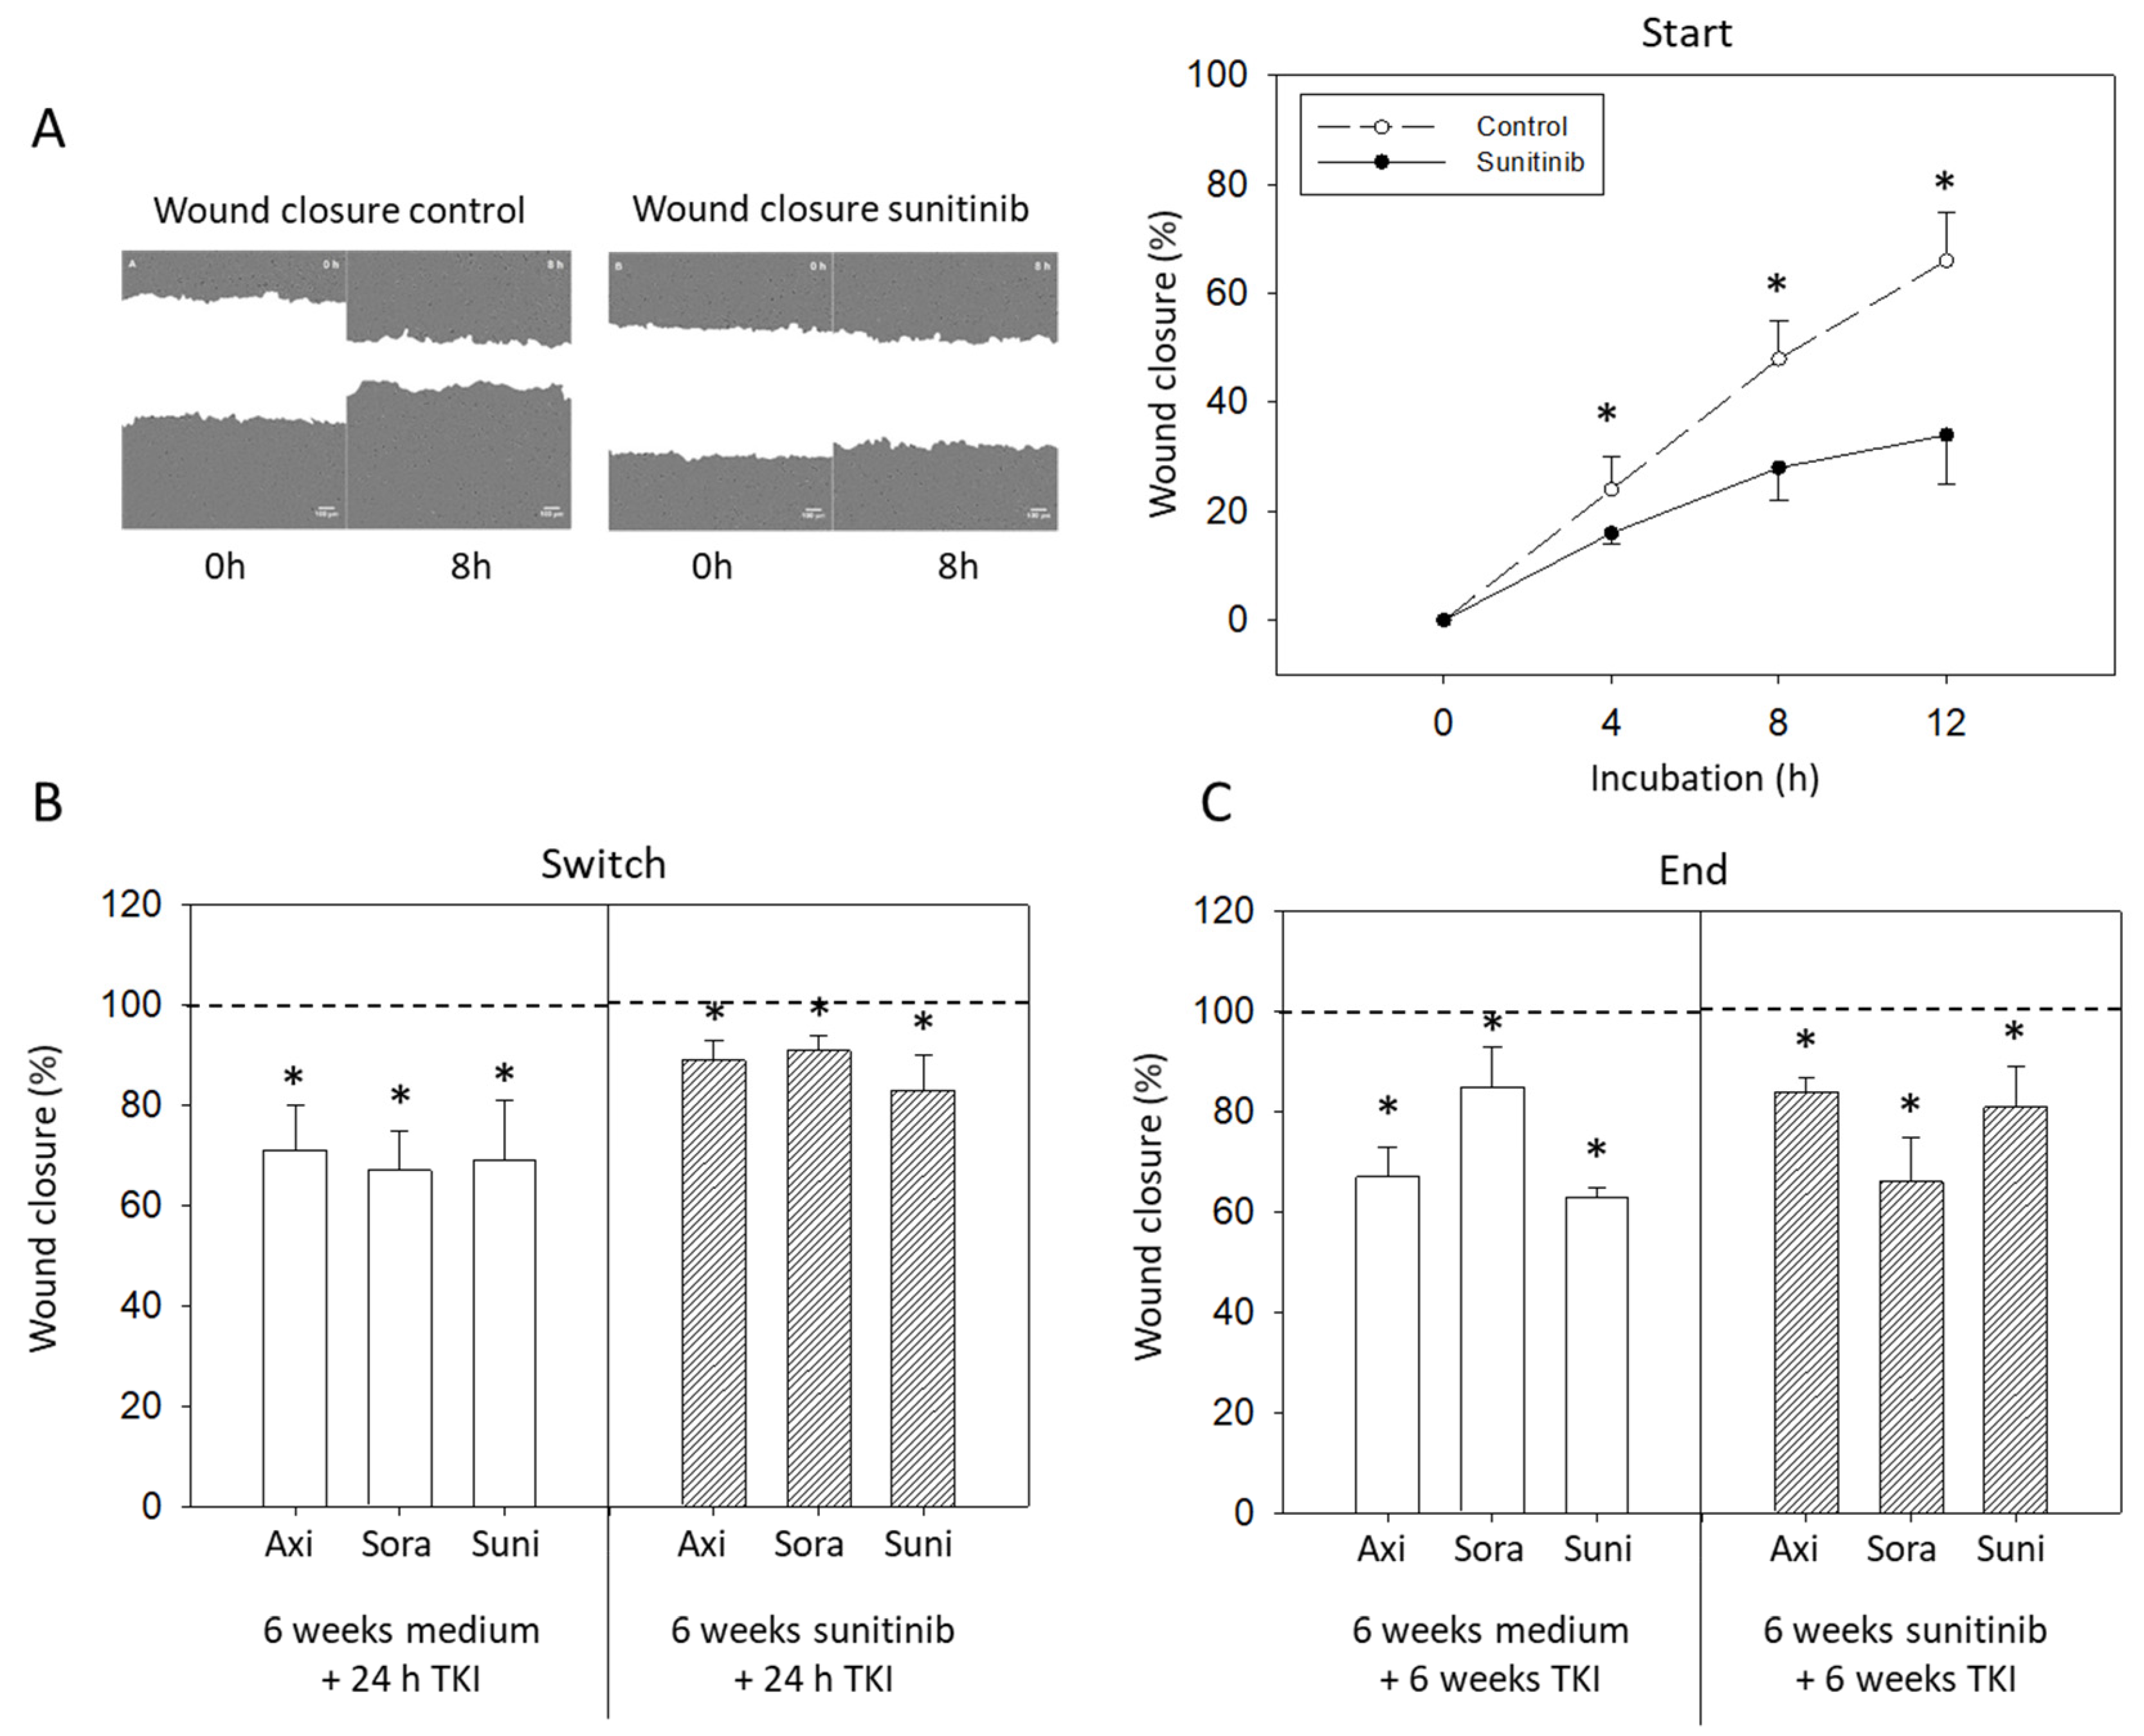
3.5. Wound Closure
4. Discussion
5. Conclusions
Author Contributions
Funding
Institutional Review Board Statement
Informed Consent Statement
Acknowledgments
Conflicts of Interest
References
- Siegel, R.L.; Miller, K.D.; Jemal, A. Cancer statistics, 2020. CA Cancer J. Clin. 2020, 70, 7–30. [Google Scholar] [CrossRef]
- Kroeger, N.; Choueiri, T.K.; Lee, J.L.; Bjarnason, G.A.; Knox, J.J.; MacKenzie, M.J.; Wood, L.; Srinivas, S.; Vaishamayan, U.N.; Rha, S.Y.; et al. Survival outcome and treatment response of patients with late relapse from renal cell carcinoma in the era of targeted therapy. Eur. Urol. 2014, 65, 1086–1092. [Google Scholar] [CrossRef]
- Aeppli, S.; Schmaus, M.; Eisen, T.; Escudier, B.; Grünwald, V.; Larkin, J.; McDermott, D.; Oldenburg, J.; Porta, C.; Rini, B.I.; et al. First-line treatment of metastatic clear cell renal cell carcinoma: A decision-making analysis among experts. ESMO Open 2021, 6, 100030. [Google Scholar] [CrossRef]
- Li, W.; Feng, C.; Di, W.; Hong, S.; Chen, H.; Ejaz, M.; Yang, Y.; Xu, T.R. Clinical use of vascular endothelial growth factor receptor inhibitors for the treatment of renal cell carcinoma. Eur. J. Med. Chem. 2020, 200, 112482. [Google Scholar] [CrossRef] [PubMed]
- George, D.J.; Lee, C.H.; Heng, D. New approaches to first-line treatment of advanced renal cell carcinoma. Ther. Adv. Med. Oncol. 2021, 13, 17588359211034708. [Google Scholar] [CrossRef] [PubMed]
- Powles, T.; Plimack, E.R.; Soulières, D.; Waddell, T.; Stus, V.; Gafanov, R.; Nosov, D.; Pouliot, F.; Melichar, B.; Vynnychenko, I.; et al. Pembrolizumab plus axitinib versus sunitinib monotherapy as first-line treatment of advanced renal cell carcinoma (KEYNOTE-426): Extended follow-up from a randomised, open-label, phase 3 trial. Lancet Oncol. 2020, 21, 1563–1573. [Google Scholar] [CrossRef]
- Perego, G.; Barzaghi, P.; Vavassori, I.; Petrelli, F. Treating metastatic clear-cell renal cell carcinoma: Beyond immunotherapy. Med. Oncol. 2020, 37, 81. [Google Scholar] [CrossRef]
- Heo, J.H.; Park, C.; Ghosh, S.; Park, S.K.; Zivkovic, M.; Rascati, K.L. A network meta-analysis of efficacy and safety of first-line and second-line therapies for the management of metastatic renal cell carcinoma. J. Clin. Pharm. Ther. 2021, 46, 35–49. [Google Scholar] [CrossRef]
- Mori, K.; Abufaraj, M.; Mostafaei, H.; Quhal, F.; Fajkovic, H.; Remzi, M.; Karakiewicz, P.I.; Egawa, S.; Schmidinger, M.; Shariat, S.F.; et al. The Predictive Value of Programmed Death Ligand 1 in Patients with Metastatic Renal Cell Carcinoma Treated with Immune-checkpoint Inhibitors: A Systematic Review and Meta-analysis. Eur. Urol. 2021, 79, 783–792. [Google Scholar] [CrossRef] [PubMed]
- Goebell, P.J.; Ivanyi, P.; Bedke, J.; Bergmann, L.; Berthold, D.; Boegemann, M.; Busch, J.; Doehn, C.; Krege, S.; Retz, M.; et al. Consensus paper: Current state of first- and second-line therapy in advanced clear-cell renal cell carcinoma. Future Oncol. 2020, 16, 2307–2328. [Google Scholar] [CrossRef]
- Rini, B.I.; Pal, S.K.; Escudier, B.J.; Atkins, M.B.; Hutson, T.E.; Porta, C.; Verzoni, E.; Needle, M.N.; McDermott, D.F. Tivozanib versus sorafenib in patients with advanced renal cell carcinoma (TIVO-3): A phase 3, multicentre, randomised, controlled, open-label study. Lancet Oncol. 2020, 21, 95–104. [Google Scholar] [CrossRef]
- Deuker, M.; Chun, F.K.H.; Karakiewicz, P.I. Second-line tyrosine kinase inhibitor-therapy after immunotherapy-failure. Curr. Opin. Support. Palliat. Care 2020, 14, 276–285. [Google Scholar] [CrossRef]
- Bracarda, S.; Bamias, A.; Casper, J.; Negrier, S.; Sella, A.; Staehler, M.; Tarazi, J.; Felici, A.; Rosbrook, B.; Jardinaud-Lopez, M.; et al. Is Axitinib Still a Valid Option for mRCC in the Second-Line Setting? Prognostic Factor Analyses from the AXIS Trial. Clin. Genitourin. Cancer 2019, 17, e689–e703. [Google Scholar] [CrossRef] [PubMed] [Green Version]
- Ged, Y.; Gupta, R.; Duzgol, C.; Knezevic, A.; Shapnik, N.; Kotecha, R.; Voss, M.H.; Feldman, D.R.; Akin, O.; Patil, S.; et al. Systemic therapy for advanced clear cell renal cell carcinoma after discontinuation of immune-oncology and VEGF targeted therapy combinations. BMC Urol. 2020, 20, 84. [Google Scholar] [CrossRef]
- Auvray, M.; Auclin, E.; Barthelemy, P.; Bono, P.; Kellokumpu-Lehtinen, P.; Gross-Goupil, M.; De Velasco, G.; Powles, T.; Mouillet, G.; Vano, Y.A.; et al. Second-line targeted therapies after nivolumab-ipilimumab failure in metastatic renal cell carcinoma. Eur. J. Cancer 2019, 108, 33–40. [Google Scholar] [CrossRef]
- Schmidinger, M.; Porta, C.; Oudard, S.; Denechere, G.; Brault, Y.; Serfass, L.; Costa, N.; Larkin, J. Real-world Experience With Sunitinib Treatment in Patients With Metastatic Renal Cell Carcinoma: Clinical Outcome According to Risk Score. Clin. Genitourin. Cancer 2020, 18, e588–e597. [Google Scholar] [CrossRef] [Green Version]
- Géczi, L.; Bodoky, G.; Rokszin, G.; Fábián, I.; Torday, L. Survival Benefits of Second-line Axitinib Versus Everolimus After First Line Sunitinib Treatment in Metastatic Renal Cell Carcinoma. Pathol. Oncol. Res. 2020, 26, 2201–2207. [Google Scholar] [CrossRef] [PubMed] [Green Version]
- Martín-Aguilar, A.E.; Núñez-López, H.; Ramirez-Sandoval, J.C. Sorafenib as a second-line treatment in metastatic renal cell carcinoma in Mexico: A prospective cohort study. BMC Cancer 2021, 21, 16. [Google Scholar] [CrossRef]
- Rai, Y.; Pathak, R.; Kumari, N.; Sah, D.K.; Pandey, S.; Kalra, N.; Soni, R.; Dwarakanath, B.S.; Bhatt, A.N. Mitochondrial biogenesis and metabolic hyperactivation limits the application of MTT assay in the estimation of radiation induced growth inhibition. Sci. Rep. 2018, 8, 1531. [Google Scholar] [CrossRef] [PubMed] [Green Version]
- Merolle, M.; Mongiardi, M.P.; Piras, M.; Levi, A.; Falchetti, M.L. Glioblastoma Cells Do Not Affect Axitinib-Dependent Senescence of HUVECs in a Transwell Coculture Model. Int. J. Mol. Sci. 2020, 21, 1490. [Google Scholar] [CrossRef] [Green Version]
- Schmidt, D.; Rodat, T.; Heintze, L.; Weber, J.; Horbert, R.; Girreser, U.; Raeker, T.; Bußmann, L.; Kriegs, M.; Hartke, B.; et al. Axitinib: A Photoswitchable Approved Tyrosine Kinase Inhibitor. Chem. Med. Chem. 2018, 13, 2415–2426. [Google Scholar] [CrossRef] [PubMed]
- Morelli, M.B.; Amantini, C.; Nabissi, M.; Cardinali, C.; Santoni, M.; Bernardini, G.; Santoni, A.; Santoni, G. Axitinib induces senescence-associated cell death and necrosis in glioma cell lines: The proteasome inhibitor, bortezomib, potentiates axitinib-induced cytotoxicity in a p21(Waf/Cip1) dependent manner. Oncotarget 2017, 8, 3380–3395. [Google Scholar] [CrossRef] [PubMed] [Green Version]
- Zeng, Z.M.; Du, H.Y.; Xiong, L.; Zeng, X.L.; Zhang, P.; Cai, J.; Huang, L.; Liu, A.W. BRCA1 protects cardiac microvascular endothelial cells against irradiation by regulating p21-mediated cell cycle arrest. Life Sci. 2020, 244, 117342. [Google Scholar] [CrossRef]
- Huo, Y.N.; Yeh, S.D.; Lee, W.S. Androgen receptor activation reduces the endothelial cell proliferation through activating the cSrc/AKT/p38/ERK/NFκB-mediated pathway. J. Steroid Biochem. Mol. Biol. 2019, 194, 105459. [Google Scholar] [CrossRef] [PubMed]
- Qin, Y.; Lu, Y.; Wang, R.; Li, W.; Qu, X. SL1122-37, a novel derivative of sorafenib, has greater effects than sorafenib on the inhibition of human hepatocellular carcinoma (HCC) growth and prevention of angiogenesis. Biosci. Trends. 2013, 7, 237–244. [Google Scholar] [CrossRef] [Green Version]
- Shih, C.Y.; Chang, T.T.; Chen, C.L.; Li, W.S. Antiangiogenic Effect of Isomalyngamide A Riboside CY01 in Breast Cancer Cells via Inhibition of Migration, Tube Formation and pVEGFR2/pAKT Signals. Anticancer Agents Med. Chem. 2020, 20, 386–399. [Google Scholar] [CrossRef] [PubMed]
- Wang, H.; Zhang, C.; Chi, H.; Meng, Z. Synergistic anti-hepatoma effect of bufalin combined with sorafenib via mediating the tumor vascular microenvironment by targeting mTOR/VEGF signaling. Int. J. Oncol. 2018, 52, 2051–2060. [Google Scholar] [CrossRef] [PubMed] [Green Version]
- Huang, Z.; Zhao, B.; Qin, Z.; Li, Y.; Wang, T.; Zhou, W.; Zheng, J.; Yang, S.; Shi, Y.; Fan, Y.; et al. Novel dual inhibitors targeting CDK4 and VEGFR2 synergistically suppressed cancer progression and angiogenesis. Eur. J. Med. Chem. 2019, 181, 111541. [Google Scholar] [CrossRef]
- Zhang, S.; Ulrich, M.; Gromnicka, A.; Havlíček, L.; Kryštof, V.; Jorda, R.; Strnad, M.; Vollmar, A.M.; Zahler, S. Anti-angiogenic effects of novel cyclin-dependent kinase inhibitors with a pyrazolo[4,3-d]pyrimidine scaffold. Br. J. Pharmacol. 2016, 173, 2645–2656. [Google Scholar] [CrossRef] [Green Version]
- Rao, S.S.; Thompson, C.; Cheng, J.; Haimovitz-Friedman, A.; Powell, S.N.; Fuks, Z.; Kolesnick, R.N. Axitinib sensitization of high Single Dose Radiotherapy. Radiother. Oncol. 2014, 111, 88–93. [Google Scholar] [CrossRef] [Green Version]
- Awasthi, N.; Zhang, C.; Hinz, S.; Schwarz, M.A.; Schwarz, R.E. Enhancing sorafenib-mediated sensitization to gemcitabine in experimental pancreatic cancer through EMAP II. J. Exp. Clin. Cancer Res. 2013, 32, 12. [Google Scholar] [CrossRef] [PubMed] [Green Version]
- Ou, D.L.; Shen, Y.C.; Liang, J.D.; Liou, J.Y.; Yu, S.L.; Fan, H.H.; Wang, D.S.; Lu, Y.S.; Hsu, C.; Cheng, A.L. Induction of Bim expression contributes to the antitumor synergy between sorafenib and mitogen-activated protein kinase/extracellular signal-regulated kinase kinase inhibitor CI-1040 in hepatocellular carcinoma. Clin. Cancer Res. 2009, 15, 5820–5828. [Google Scholar] [CrossRef] [Green Version]
- Bæk Møller, N.; Budolfsen, C.; Grimm, D.; Krüger, M.; Infanger, M.; Wehland, M.; Magnusson, N.E. Drug-Induced Hypertension Caused by Multikinase Inhibitors (Sorafenib, Sunitinib, Lenvatinib and Axitinib) in Renal Cell Carcinoma Treatment. Int. J. Mol. Sci. 2019, 20, 4712. [Google Scholar] [CrossRef] [PubMed] [Green Version]
- Angulo, J.C.; Shapiro, O. The Changing Therapeutic Landscape of Metastatic Renal Cancer. Cancers 2019, 11, 1227. [Google Scholar] [CrossRef] [Green Version]
- Amzal, B.; Fu, S.; Meng, J.; Lister, J.; Karcher, H. Cabozantinib versus everolimus, nivolumab, axitinib, sorafenib and best supportive care: A network meta-analysis of progression-free survival and overall survival in second line treatment of advanced renal cell carcinoma. PLoS ONE 2017, 12, e0184423. [Google Scholar] [CrossRef]
- Pezzella, F.; Ribatti, D. Vascular co-option and vasculogenic mimicry mediate resistance to antiangiogenic strategies. Cancer Rep. 2020, e1318. [Google Scholar] [CrossRef]
- Stehle, F.; Schulz, K.; Fahldieck, C.; Kalich, J.; Lichtenfels, R.; Riemann, D.; Seliger, B. Reduced immunosuppressive properties of axitinib in comparison with other tyrosine kinase inhibitors. J. Biol. Chem. 2013, 288, 16334–16347. [Google Scholar] [CrossRef] [PubMed] [Green Version]


Publisher’s Note: MDPI stays neutral with regard to jurisdictional claims in published maps and institutional affiliations. |
© 2021 by the authors. Licensee MDPI, Basel, Switzerland. This article is an open access article distributed under the terms and conditions of the Creative Commons Attribution (CC BY) license (https://creativecommons.org/licenses/by/4.0/).
Share and Cite
Juengel, E.; Schnalke, P.; Rutz, J.; Maxeiner, S.; Chun, F.K.-H.; Blaheta, R.A. Antiangiogenic Properties of Axitinib versus Sorafenib Following Sunitinib Resistance in Human Endothelial Cells—A View towards Second Line Renal Cell Carcinoma Treatment. Biomedicines 2021, 9, 1630. https://doi.org/10.3390/biomedicines9111630
Juengel E, Schnalke P, Rutz J, Maxeiner S, Chun FK-H, Blaheta RA. Antiangiogenic Properties of Axitinib versus Sorafenib Following Sunitinib Resistance in Human Endothelial Cells—A View towards Second Line Renal Cell Carcinoma Treatment. Biomedicines. 2021; 9(11):1630. https://doi.org/10.3390/biomedicines9111630
Chicago/Turabian StyleJuengel, Eva, Pascal Schnalke, Jochen Rutz, Sebastian Maxeiner, Felix K.-H. Chun, and Roman A. Blaheta. 2021. "Antiangiogenic Properties of Axitinib versus Sorafenib Following Sunitinib Resistance in Human Endothelial Cells—A View towards Second Line Renal Cell Carcinoma Treatment" Biomedicines 9, no. 11: 1630. https://doi.org/10.3390/biomedicines9111630