Article

Regulation of Oncogenic Targets by the Tumor-Suppressive miR-139 Duplex (miR-139-5p and miR-139-3p) in Renal Cell Carcinoma

1
Department of Functional Genomics, Chiba University Graduate School of Medicine, Chiba 260-8670, Japan
2
Department of Urology, Chiba University Graduate School of Medicine, Chiba 260-8670, Japan
3
Department of Biochemistry and Genetics, Chiba University Graduate School of Medicine, Chiba 260-8670, Japan
*
Author to whom correspondence should be addressed.
Biomedicines 2020, 8(12), 599; https://doi.org/10.3390/biomedicines8120599
Submission received: 20 November 2020 / Revised: 6 December 2020 / Accepted: 10 December 2020 / Published: 12 December 2020
(This article belongs to the Special Issue MicroRNA in Solid Tumor and Hematological Diseases)

Abstract

:
We previously found that both the guide and passenger strands of the miR-139 duplex (miR-139-5p and miR-139-3p, respectively) were downregulated in cancer tissues. Analysis of TCGA datasets revealed that low expression of miR-139-5p (p < 0.0001) and miR-139-3p (p < 0.0001) was closely associated with 5-year survival rates of patients with renal cell carcinoma (RCC). Ectopic expression assays showed that miR-139-5p and miR-139-3p acted as tumor-suppressive miRNAs in RCC cells. Here, 19 and 22 genes were identified as putative targets of miR-139-5p and miR-139-3p in RCC cells, respectively. Among these genes, high expression of PLXDC1, TET3, PXN, ARHGEF19, ELK1, DCBLD1, IKBKB, and CSF1 significantly predicted shorter survival in RCC patients according to TCGA analyses (p < 0.05). Importantly, the expression levels of four of these genes, PXN, ARHGEF19, ELK1, and IKBKB, were independent prognostic factors for patient survival (p < 0.05). We focused on PXN (paxillin) and investigated its potential oncogenic role in RCC cells. PXN knockdown significantly inhibited cancer cell migration and invasion, possibly by regulating epithelial–mesenchymal transition. Involvement of the miR-139-3p passenger strand in RCC molecular pathogenesis is a new concept. Analyses of tumor-suppressive-miRNA-mediated molecular networks provide important insights into the molecular pathogenesis of RCC.

1. Introduction

Renal cell carcinoma (RCC) accounts for approximately 3% of adult malignancies, with more than 330,000 cases newly diagnosed in 2018 and more than 100,000 deaths annually [1]. Clear cell RCC is the most common histological subtype of RCC, accounting for approximately 75% of all cases [2]. Approximately 20–30% of RCC patients have metastatic lesions at diagnosis, and thus the 5-year survival rate of these patients is less than 20% [2,3]. In addition, more than 20% of patients develop metastases during the postoperative follow-up period [4]. Elucidation of the molecular mechanisms involved in distant metastasis of RCC will contribute to the development of new diagnostic and therapeutic strategies.
MicroRNAs (miRNAs) are classified as noncoding RNAs approximately 18–25 bases long that are found in a wide range of organisms, from plants to humans [5]. miRNAs bind to the 3′-UTR of their target genes (protein coding and noncoding) in a sequence-dependent manner to regulate their expression. miRNAs are involved in various intracellular processes [6,7]. A unique property of these molecules is that a single miRNA can control a vast number of genes in normal and diseased cells [6,7]. Therefore, aberrant expression of miRNAs disrupts intracellular transcriptional networks, which in turn causes human diseases. In cancer cells, aberrant expression of miRNAs is closely associated with cancer cell progression, metastasis, and drug resistance [8,9].
According to the original theory regarding miRNA biogenesis, the passenger strand of the miRNA duplex is degraded and therefore considered to have no function [6,7]. Our RNA-sequencing-based signatures refute this concept, and our recent studies showed downregulation of both the guide and passenger strands of miRNA duplexes (e.g., miR-30c, miR-99a, miR-101, miR-143, miR-145, and miR-150) in cancer tissues [10,11,12]. Furthermore, ectopic expression assays revealed that the passenger strand of some miRNAs, similar to the guide strand, functions as tumor-suppressive miRNAs, regulating many oncogenes intracellularly [13,14,15,16]. Involvement of miRNA passenger strands in the molecular pathogenesis of human cancers is a new concept, and additional research on passenger strands is needed. A recent study confirmed that both strands of miRNAs are functional and, despite having different seed sequences, cooperate to control molecular pathways across cancer types [17].
In this study, we focused on miR-139-5p (the guide strand) and miR-139-3p (the passenger strand) and investigated their functional significance. We searched for oncogenes that are controlled by miR-139-3p in RCC cells in public databases and identified 22 genes as putative targets of miR-139-3p regulation. Among these genes, high expression of PXN, ELK1, ARHGEF19, DCBLD1, IKBKB, and CSF1 significantly predicted shorter survival in RCC patients according to The Cancer Genome Atlas (TCGA) analyses (p < 0.05). We discuss the oncogenic role of PXN in RCC cells.

2. Materials and Methods

2.1. Human RCC Cell Lines

The A498 and 786-O human RCC cell lines were used in this study and were obtained from the Japanese Collection of Research Bioresources Cell Bank. Cell maintenance was performed as we described previously [15].

2.2. RNA Extraction and Quantitative Reverse Transcription-Polymerase Chain Reaction

RNA was extracted from cell lines using TRIzol reagent (Invitrogen, Carlsbad, CA, USA) according to the manufacturer’s protocol. For gene expression assays, reverse transcription of the RNA was performed using the High-Capacity cDNA Reverse Transcription Kit (Applied Biosystems, Waltham, MA, USA) and TaqMan Gene Expression Assays (Applied Biosystems), according to our previous studies [13,14,15,16]. The expression of GAPDH was evaluated as the internal control. We used the CFX Connect Real-Time PCR Detection System (Bio-Rad, Hercules, CA, USA). The TaqMan primers and probes used in this study are listed in Table S1.

2.3. Transfection of miRNAs, siRNAs, and Plasmid Vectors into RCC cells

Transfection of miRNAs and siRNAs into RCC cells was performed using Lipofectamine RNAiMAX reagent (Invitrogen) according to our previous studies [13,14,15,16]. miRNAs or siRNAs were added to a final concentration of 10 nM. Plasmid vectors were transfected into the cells using Lipofectamine 2000 (Invitrogen). The final concentration was 50 ng/well.

2.4. Functional Assays (Cell Proliferation, Migration, and Invasion Assays) in RCC cells

XTT assay for cell proliferation, wound healing assay for migration, and Matrigel chamber assay for invasion were performed using RCC cells as described previously [13,14,15,16]. The reagents used are listed in Table S1.

2.5. Identification of miR-139-5p and miR-139-3p Gene Targets in RCC Cells

The search strategy used to identify miRNA targets is summarized in Figure S1. The expression profiles of miR-139-5p/miR-139-3p-transfected A498 and 786-O cells from the Gene Expression Omnibus (GEO) GSE129043 dataset were used. GSE36895 datasets were also utilized (details below). The TargetScanHuman database (http://www.targetscan.org/vert_72/) was used to predict miRNA-binding sites.

2.6. In silico Analysis of RCC Public Databases

For comparison of gene expression levels between normal and cancer tissues, we utilized the GSE36895 datasets obtained from GEO. GSE36895 contains mRNA microarray data from clear cell RCC tumors, normal kidney tissues, and mouse tumor graft samples obtained using Affymetrix U133 Plus 2.0 whole-genome chips (Affymetrix, Santa Clara, CA, USA). Expression is shown as signal intensities, and for each gene with multiple probes, the mean intensity value was used. In addition, RNA sequencing data from TCGA—Kidney renal clear cell carcinoma (TCGA-KIRC) RNA sequencing datasets were utilized to re-evaluate gene expression levels in normal versus tumor samples.

2.7. Clinicopathological Analysis of RCC

For Kaplan–Meier analyses of overall survival, we downloaded TCGA clinical data (Firehose Legacy) from cBioportal (https://www.cbioportal.org). The patients were divided into two groups by median expression for each gene, according to the data collected from OncoLnc (http://www.oncolnc.org). R version 4.0.2 (R Foundation for Statistical Computing, Vienna, Austria) was used for the analyses.
Multivariate Cox regression analyses were also performed using TCGA-KIRC clinical data and survival data according to the expression level of each gene from OncoLnc to identify factors associated with RCC patient survival. In addition to gene expression, the tumor stage, pathological grade, and age group were evaluated as potential independent prognostic factors. The multivariate analyses were performed using JMP Pro 15.0.0 (SAS Institute Inc., Cary, NC, USA).
We performed gene set enrichment analysis (http://software.broadinstitute.org/gsea/index.jsp) to obtain lists of differentially expressed genes between high and low PXN expression groups in the TCGA-KIRC cohort.

2.8. Plasmid Construction and Dual-Luciferase Reporter Assays

psiCHECK-2 plasmid vectors (Promega, Madison, WI, USA) harboring the wild-type or a deletion sequence of the miR-139-3p-binding site within the 3′-UTR of PXN were prepared. The predicted binding site sequence was obtained from the TargetScanHuman database (release 7.2). Cells were co-transfected with miR-139-3p and the plasmid vectors for 36 h, after which firefly and Renilla luciferase activities in cell lysates were measured consecutively using the Dual-Luciferase Reporter Assay System (Promega). Renilla luciferase activities are expressed as normalized values to firefly luciferase activities. The dual-luciferase reporter assay procedure was described in our previous studies [13,14,15,16].

2.9. Western Blotting

Cell lysates were prepared 48 h after transfection with RIPA buffer (Nacalai Tesque, Chukyo-ku, Kyoto, Japan). Then, 20 μg of protein lysates were separated on 4–15% Mini-PROTEAN TGX Precast Gels (Bio-Rad), and transferred to Immun-Blot PVDF membranes (Bio-Rad). Blocking was performed with Blocking One (Nacalai Tesque) for 30 min. The antibodies used in this study are shown in Table S1.

2.10. Statistical Analyses

For comparisons among multiple groups, Dunnett’s test was applied. The statistical analyses were performed using JMP Pro 15. Significance levels were set to p < 0.05 if not otherwise mentioned.

3. Results

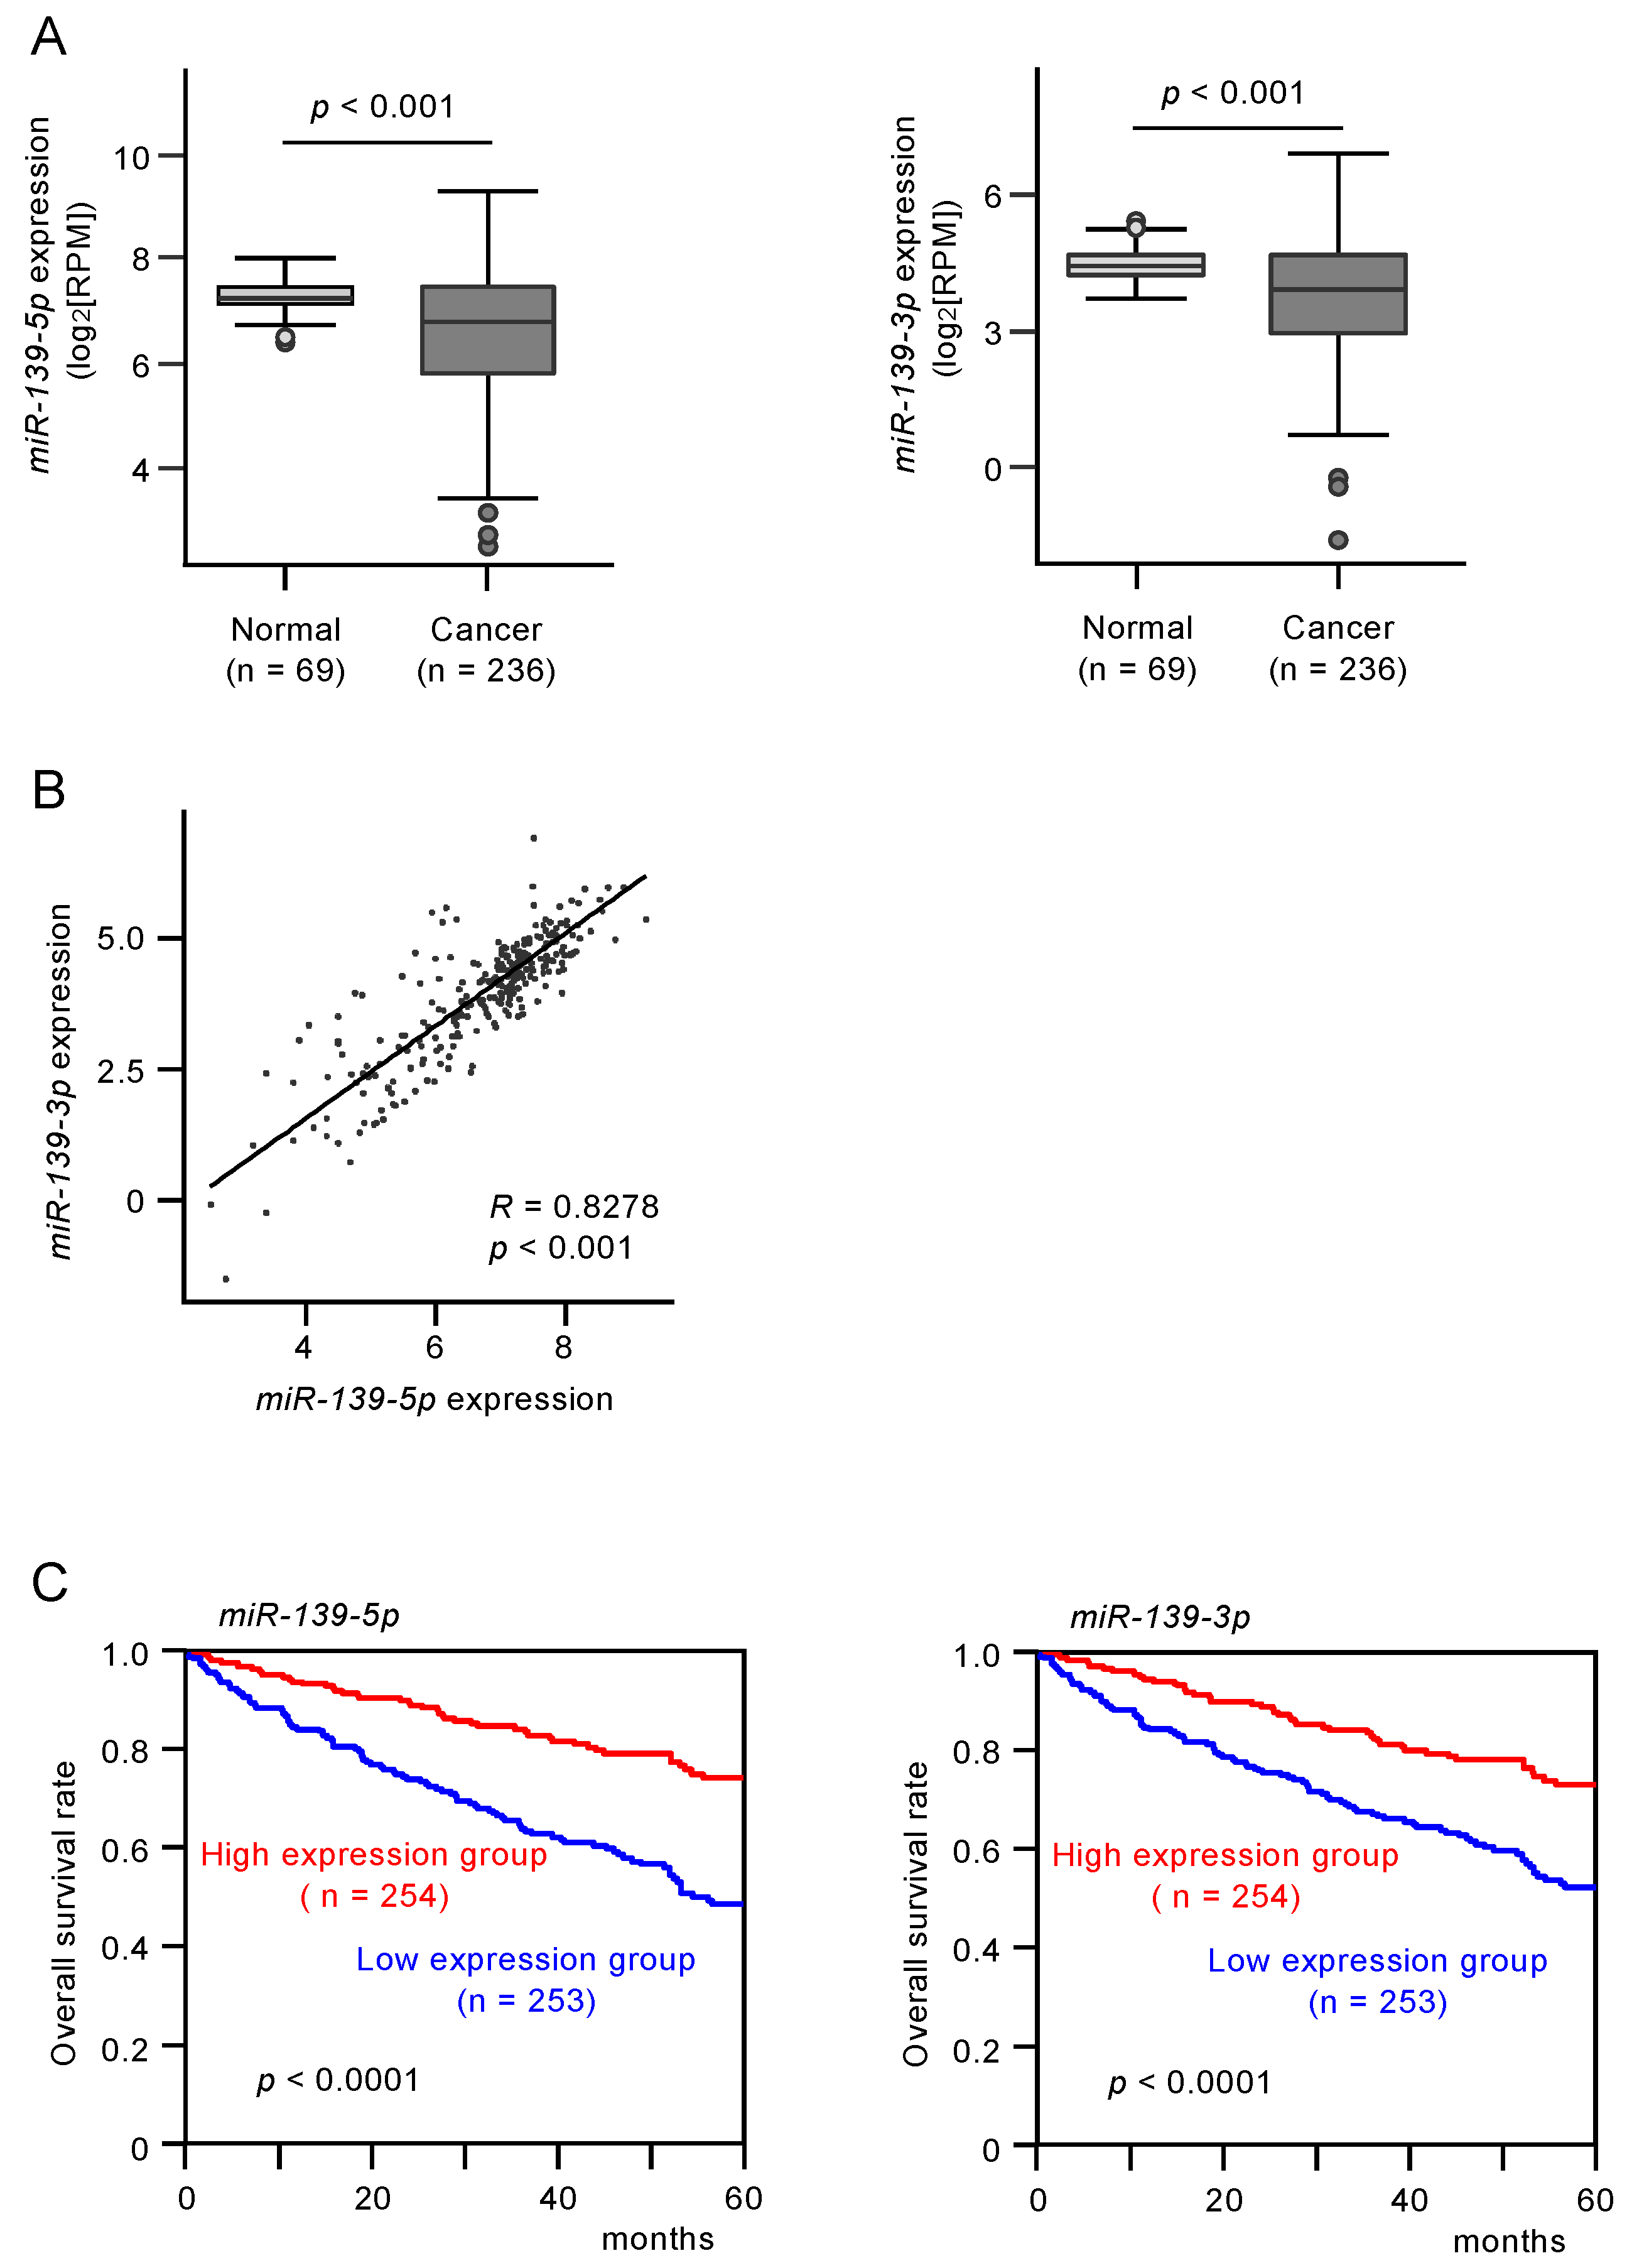
3.1. Analysis of miR-139-5p and miR-139-3p Expression Levels in Clinical RCC Tissues and Their Clinical Significance

The expression levels of miR-139-5p and miR-139-3p were evaluated in RNA sequencing data from RCC tissue samples obtained from TCGA. miR-139-5p and miR-139-3p were significantly downregulated in RCC tissues compared with normal tissues (p < 0.0001 and p < 0.0001, respectively; Figure 1A). Cohort analyses using the TCGA-KIRC datasets revealed that low expression of miR-139-5p and miR-139-3p was associated with poorer survival in patients with RCC (p < 0.0001 and p < 0.0001, respectively; Figure 1B).

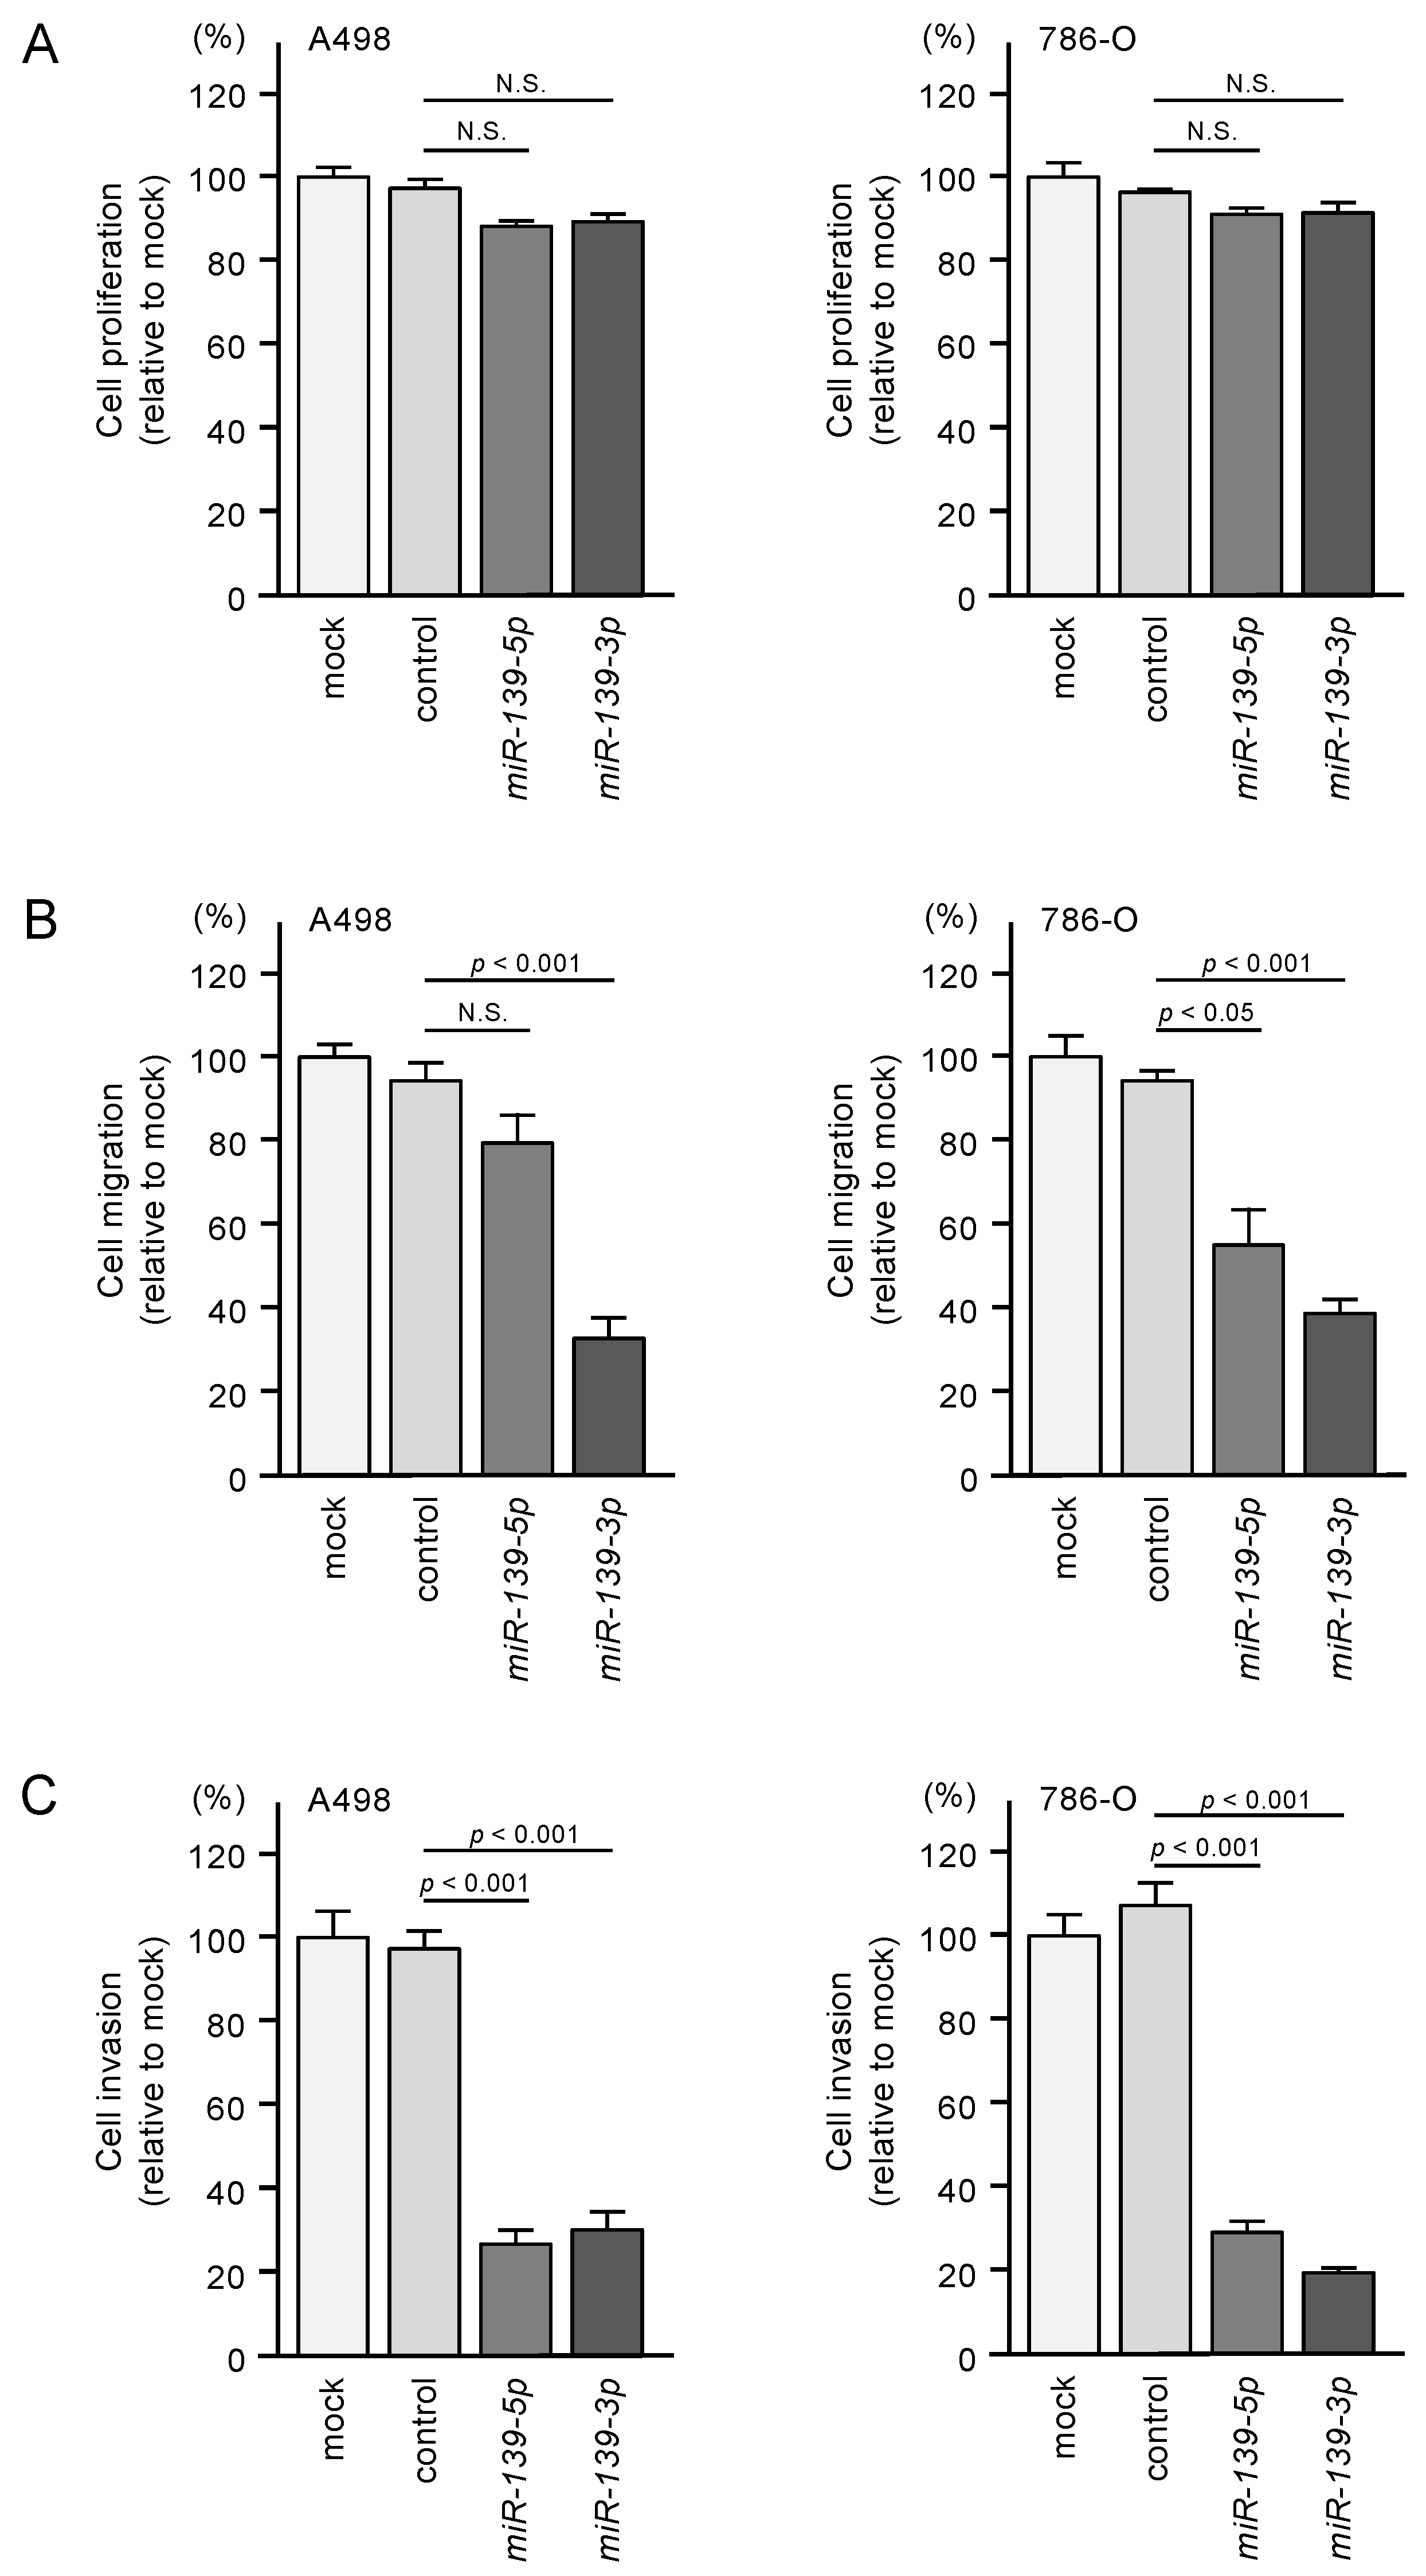
3.2. Tumor-Suppressive Functions of miR-139-5p and miR-139-3p in RCC Cells

To investigate the tumor-suppressive functions of miR-139-5p and miR-139-3p in RCC cells, we assessed cell proliferation, migration, and invasion after ectopic transfection of miR-139-5p and miR-139-3p into A498 and 786-O cells. Ectopic expression of the two miRNAs did not significantly affect the proliferation of RCC cells (Figure 2A). In contrast, the expression of these miRNAs significantly inhibited the migration and invasive abilities of RCC cells (Figure 2B,C).

3.3. Identification of Putative Oncogenic Targets Regulated by miR-139-3p and miR-139-3p in RCC Cells

To identify the genes regulated by miR-139-5p and miR-139-3p in RCC cells, we integrated three datasets. First, we obtained RNA microarray data from miR-139-5p- or miR-139-3p-transfected A498 or 786-O cells (GSE129043). Second, we used data from the TargetScanHuman database (release 7.2) to obtain annotated putative targets regulated by each miRNA strand. Third, we extracted genes highly expressed in clinical specimens of RCC from GSE36895.
A schematic of the strategy used to narrow down the gene list is shown in Figure S1. A total of 19 genes regulated by miR-139-5p and 22 by miR-139-3p were finally selected (Table 1A,B).

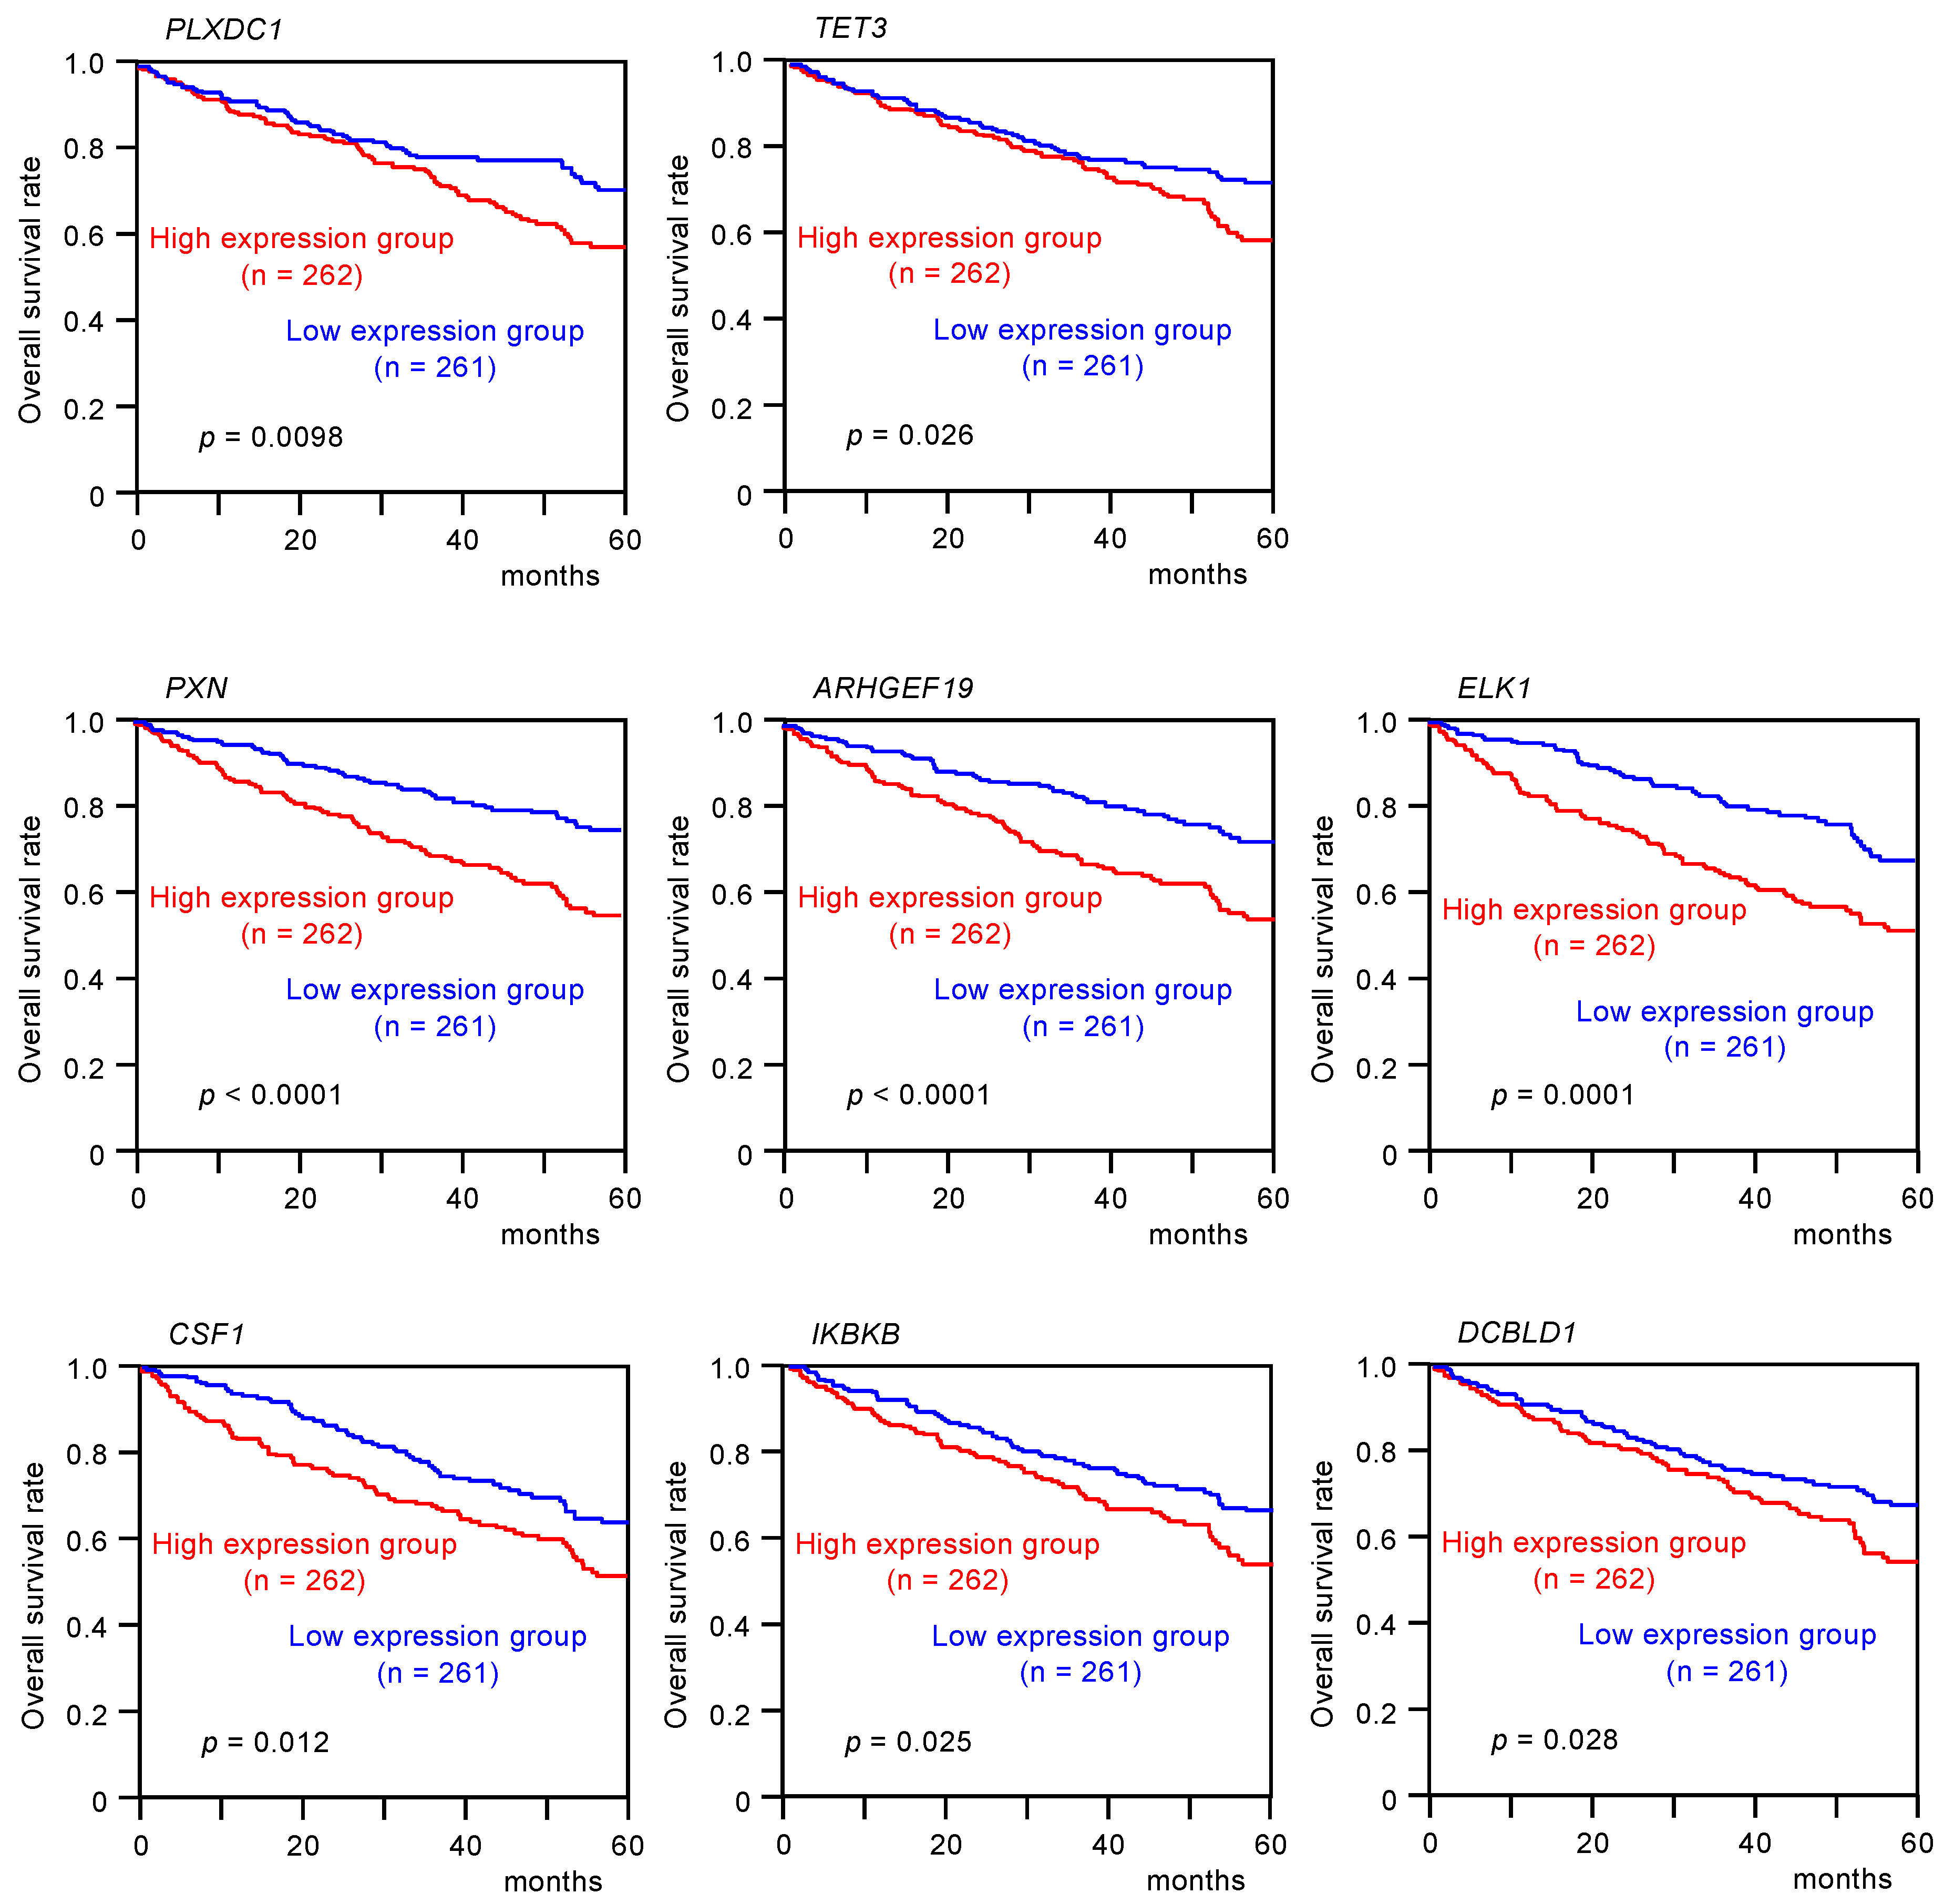
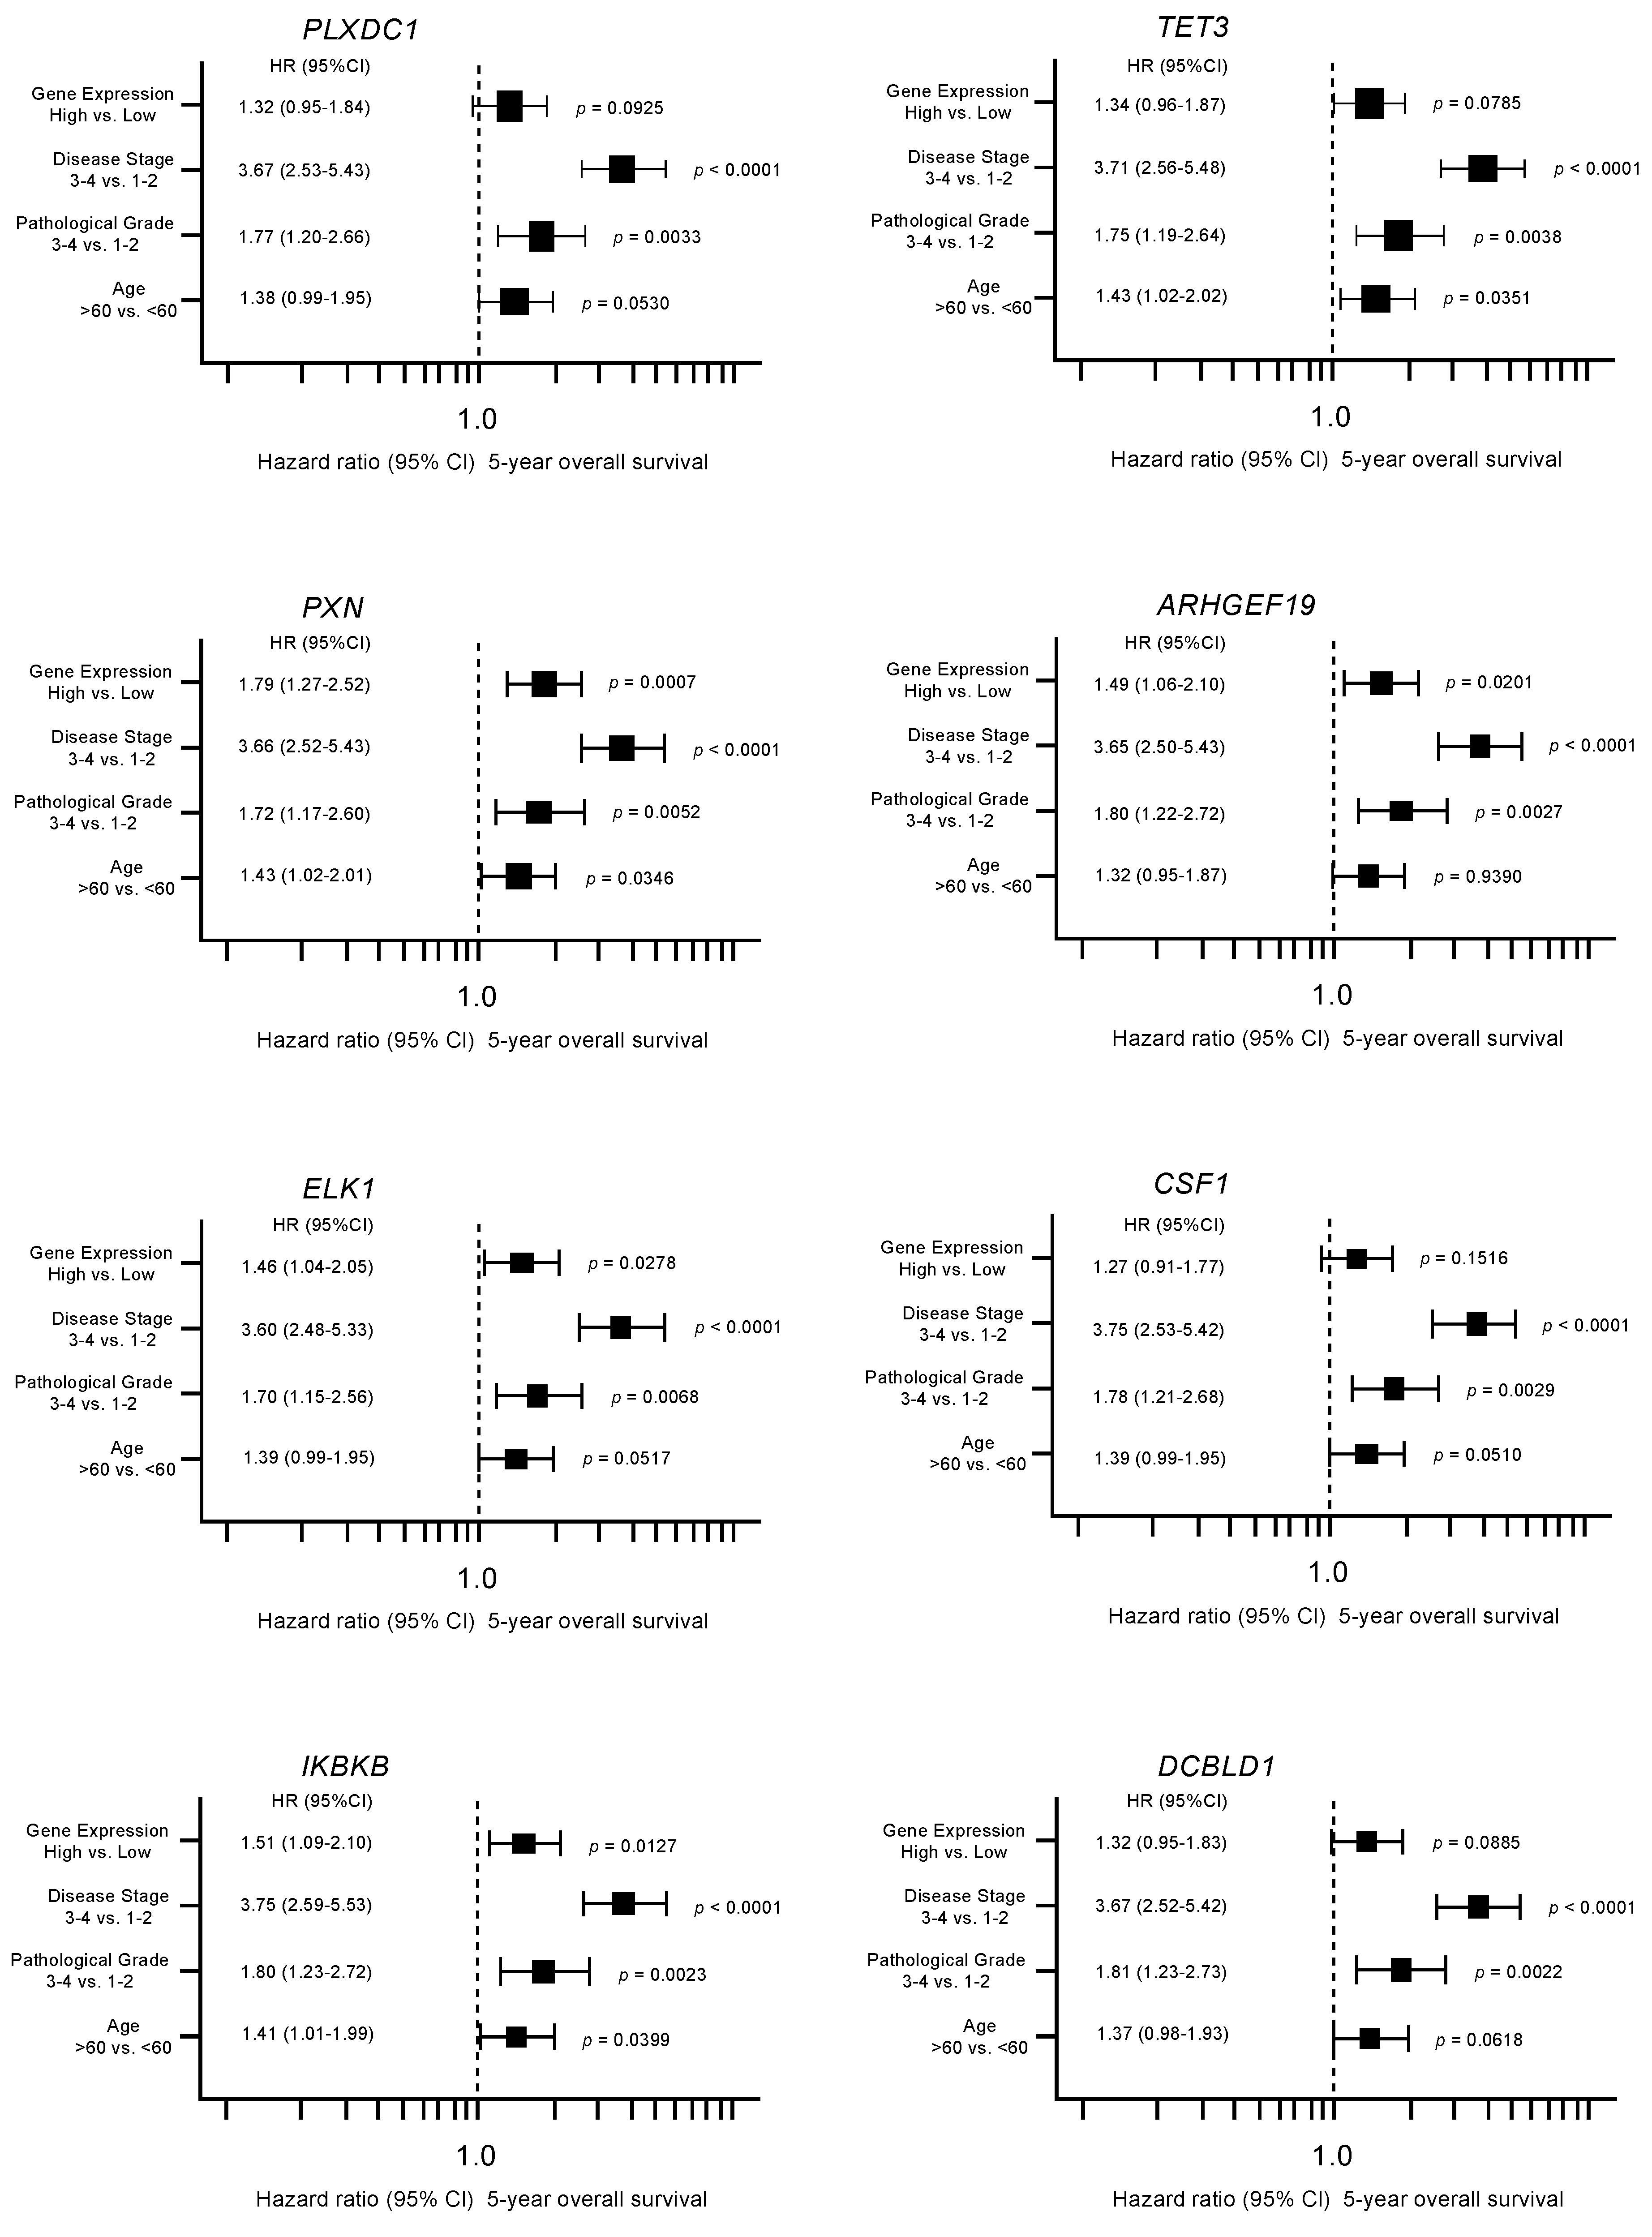
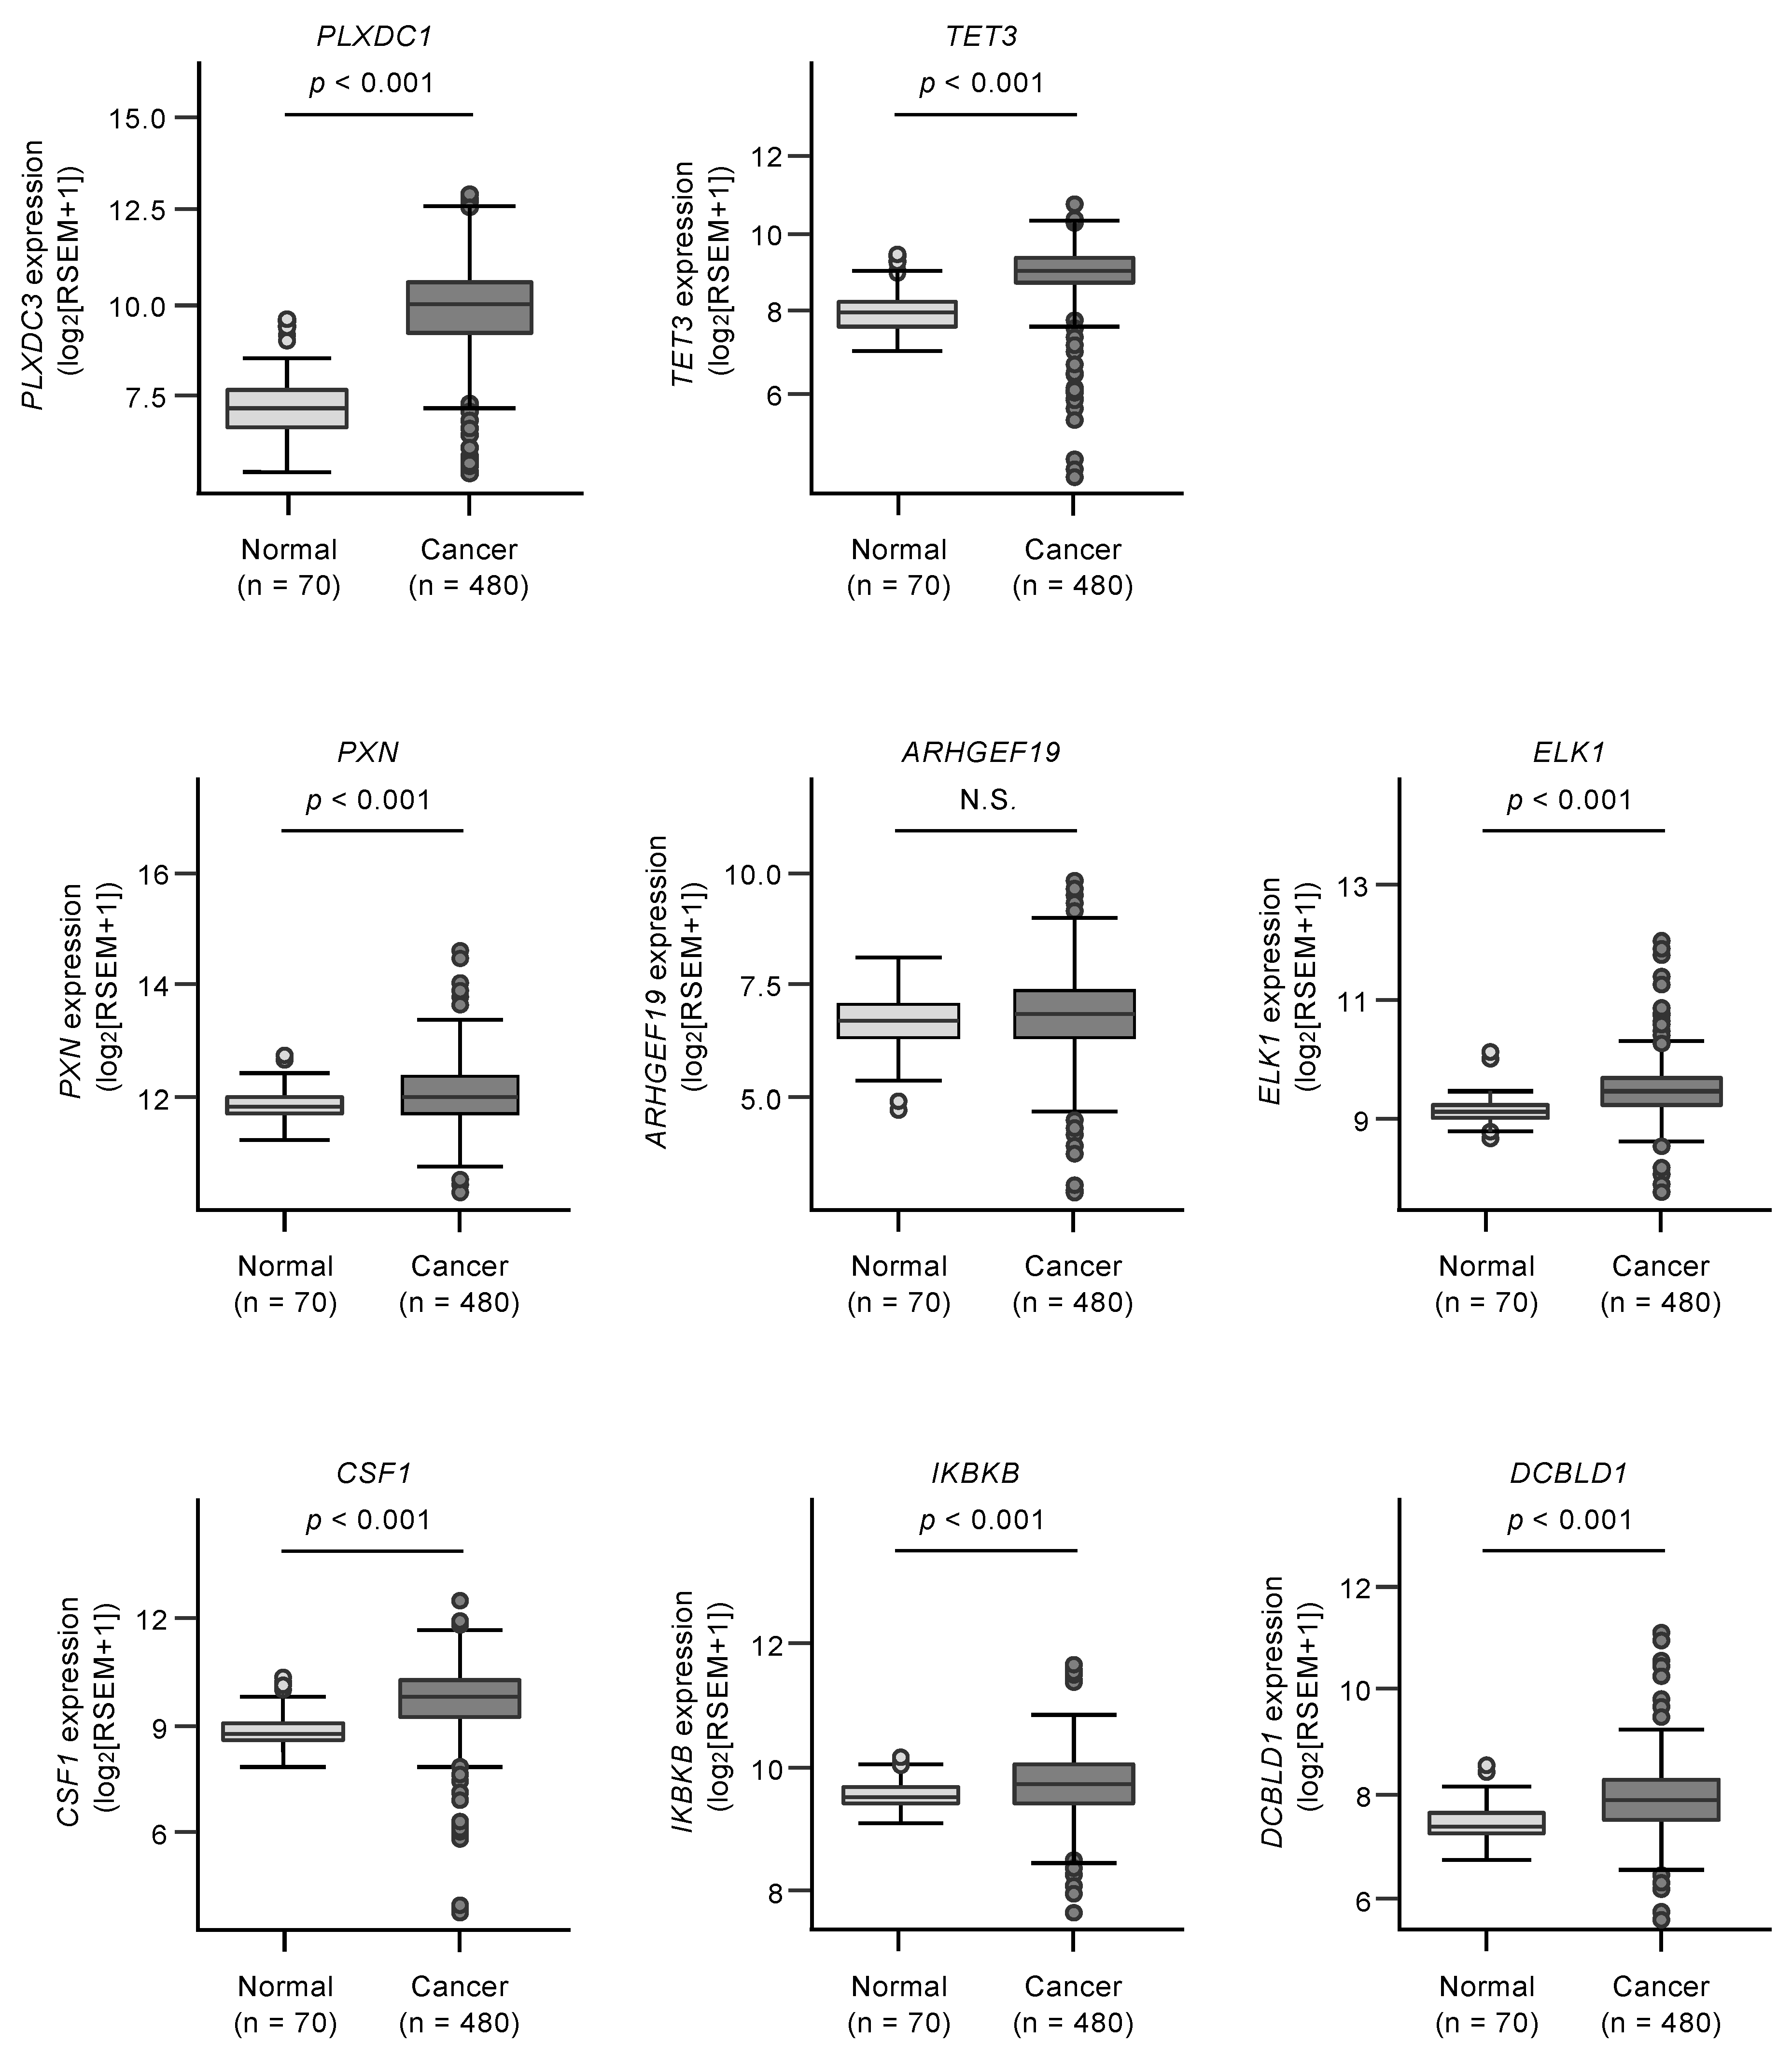
3.4. Clinical Significance of miR-139 Target Genes in RCC Pathogenesis

Kaplan–Meier analyses of 5-year overall survival were performed according to high versus low expression of miR-139 target genes. The high expression of two miR-139-5p (PLXDC1 and TET3) and six miR-139-3p target genes (PXN, ARHGEF19, ELK1, CSF1, IKBKB, and DCBLD1) was found to be related to better 5-year overall survival rates of the patients (p < 0.05, Table 1A,B, and Figure 3).
Furthermore, multivariate analyses identified four genes (PXN, ARHGEF19, ELK1, and IKBKB) as independent prognostic factors for patient survival (p < 0.05; Figure 4). We validated the expression levels of these target genes using TCGA-KIRC RNA sequencing dataset. All target genes except ARHGEF19 were upregulated in cancer tissues in this cohort (Figure 5).
For subsequent analyses, we focused on miR-139-3p (the passenger strand) target genes, according to our previous studies emphasizing the novel roles of miRNA passenger strands. Among these target genes, we focused on PXN, which showed the most significant association with RCC patient survival in the multivariate analysis and has been reported previously as an oncogene in other types of cancers [18,19].

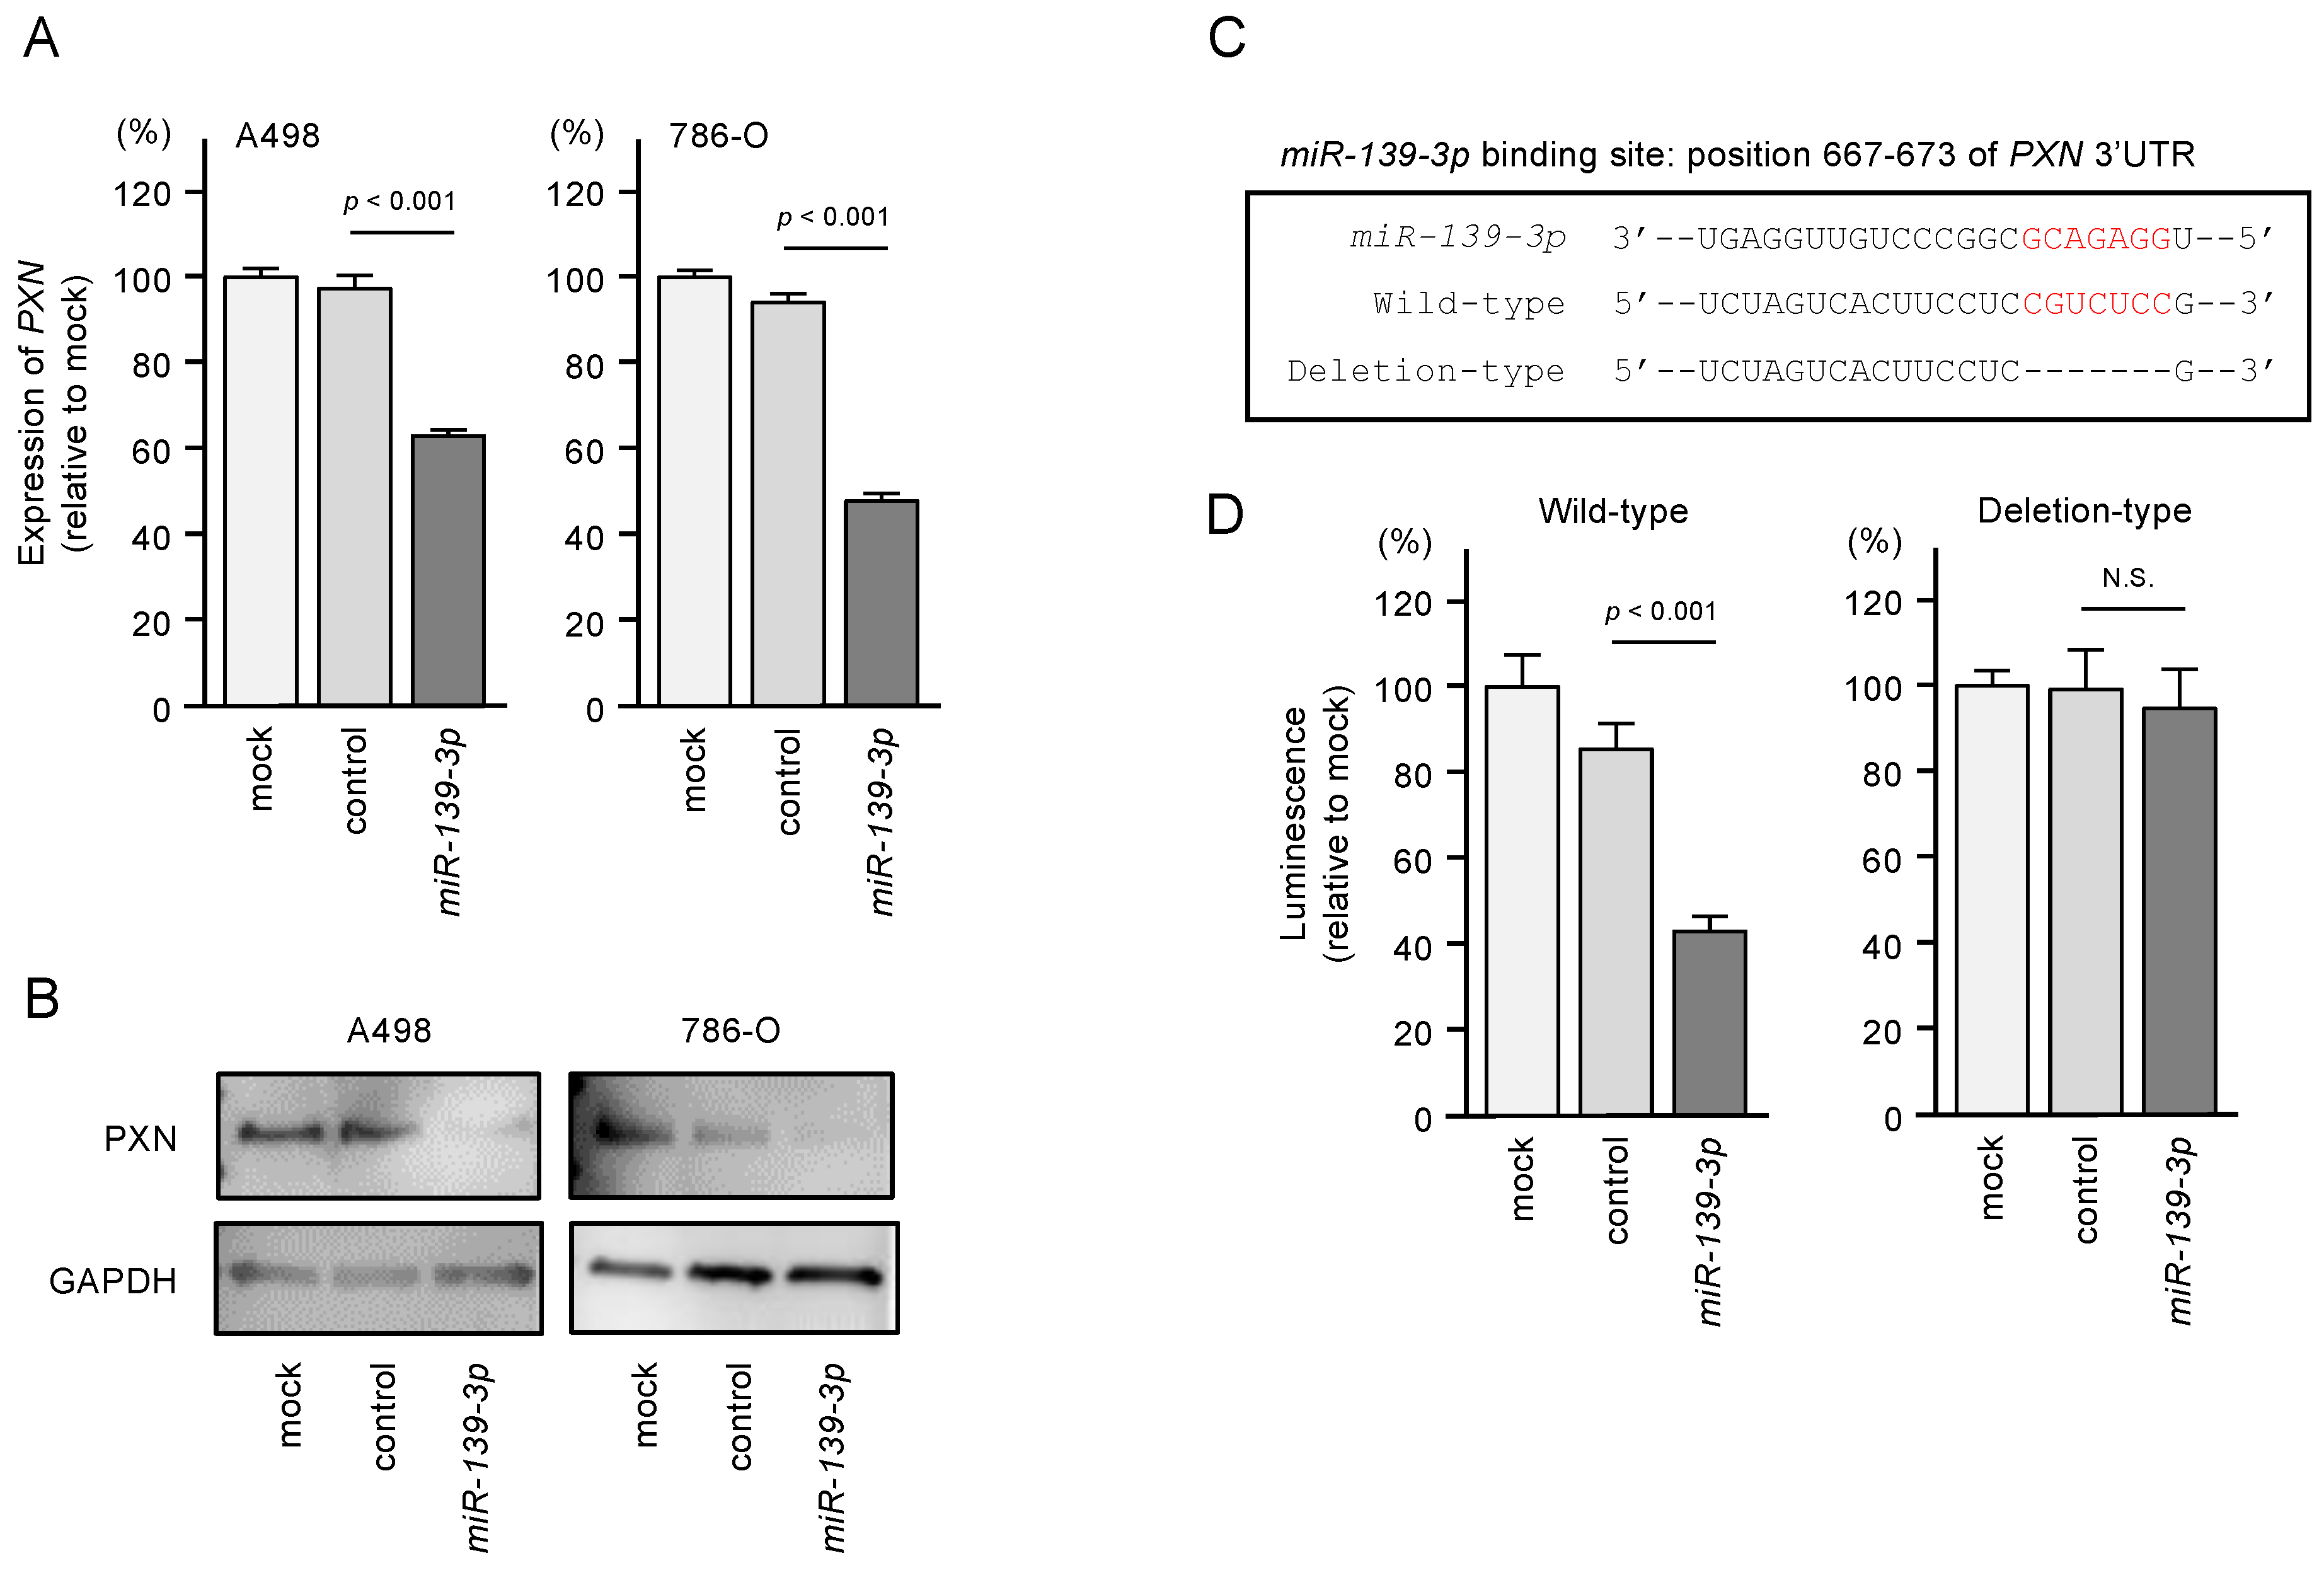
3.5. Direct Regulation of PXN by miR-139-3p in RCC Cells

In RCC cells transfected with miR-139-3p, both PXN mRNA and protein levels were significantly downregulated (Figure 6A,B). Western blot images are shown in Figure S2. To validate that miR-139-3p binds directly to PXN to downregulate its expression, we performed dual-luciferase reporter assays. A498 and 786-O cells were co-transfected with plasmid vectors and miR-139-3p. We used two different plasmid vectors: one containing the partial wild-type sequence of the miR-139-3p-binding site predicted by TargetScanHuman database (“wild-type sequence” in Figure 6C) and the other containing this sequence lacking the binding site (“deletion-type sequence” in Figure 6C). Luciferase activity was significantly reduced in cells transfected with the wild-type sequence but not in cells transfected with the deletion sequence (Figure 6D). These results suggest that miR-139-3p directly binds to the 3’-UTR of PXN.

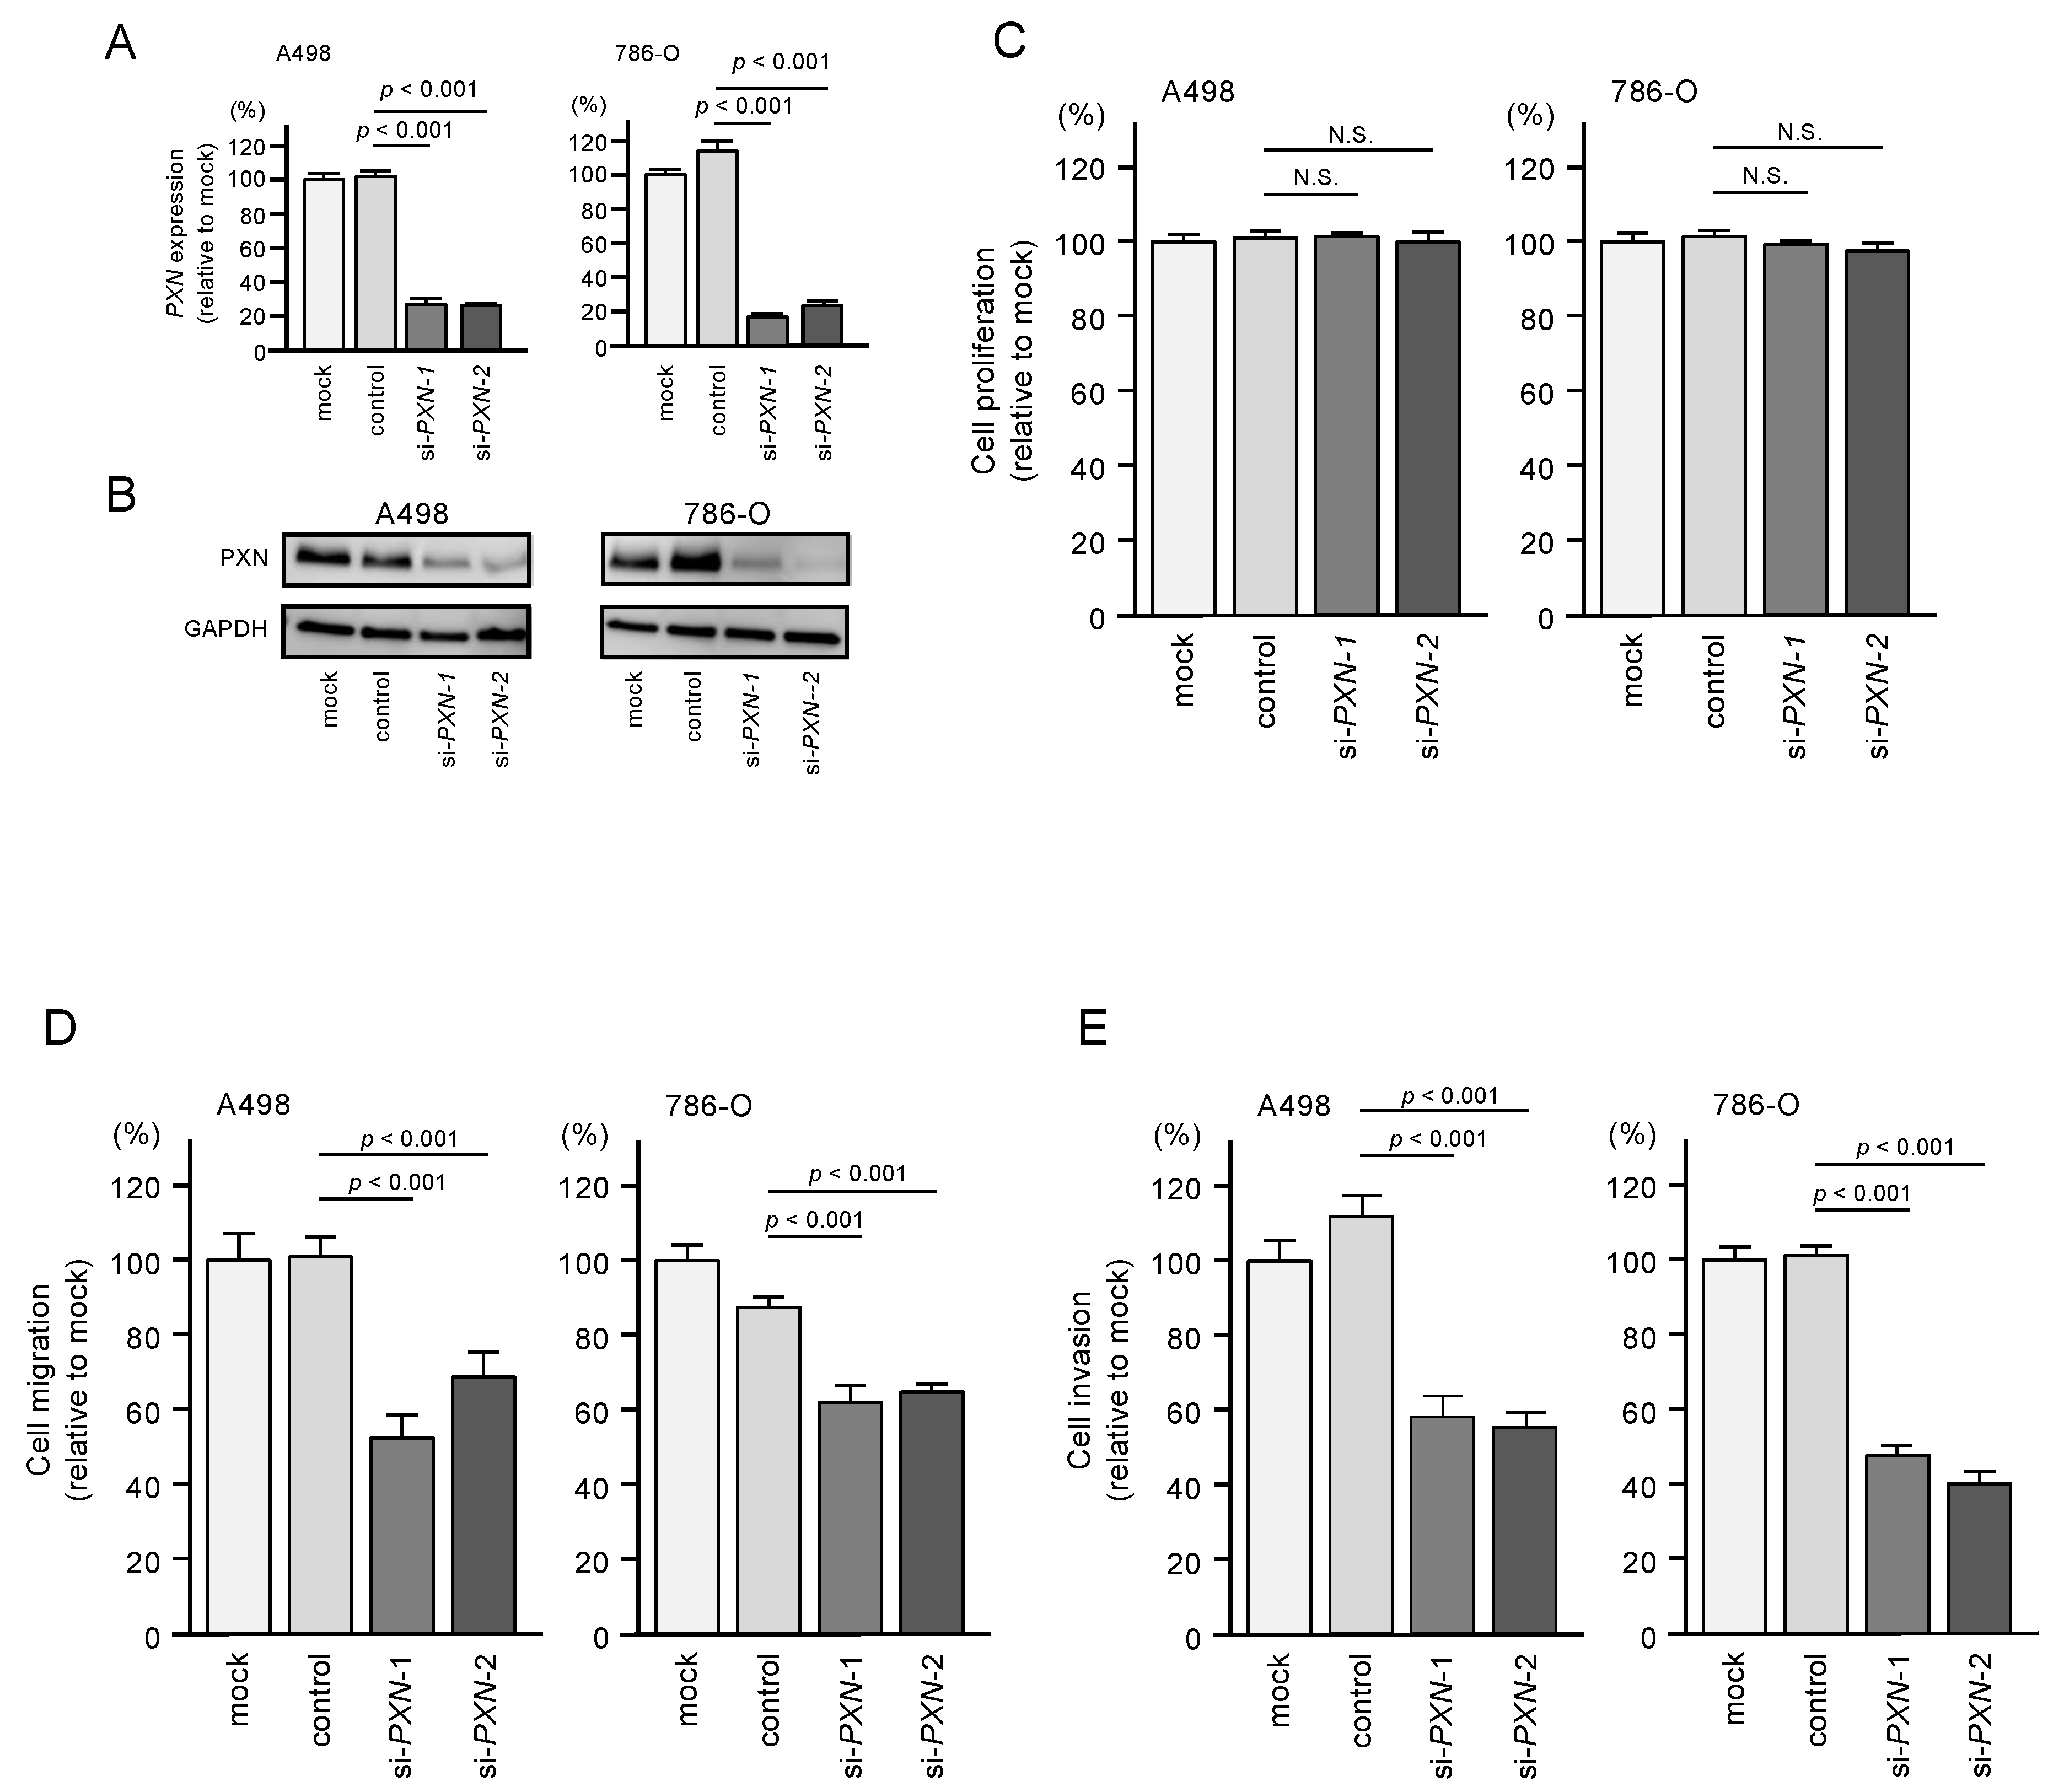
3.6. PXN Knockdown Assays in RCC Cells

We assessed the oncogenic functions of PXN in RCC cells by performing knockdown using two small interfering RNAs (siRNAs) targeting PXN. The mRNA and protein levels of PXN were successfully downregulated by either siRNAs in A498 and 786-O cells (Figure 7A,B). Western blot images are shown in Figure S2.
Next, functional assays were performed in RCC cells transfected with these siRNAs. Similar to miR-139-3p transfection, transfection of the siRNAs did not suppress cell proliferation (Figure 7C). However, cell migration and invasion were significantly suppressed by siRNA transfection in both cell lines (Figure 7D,E).

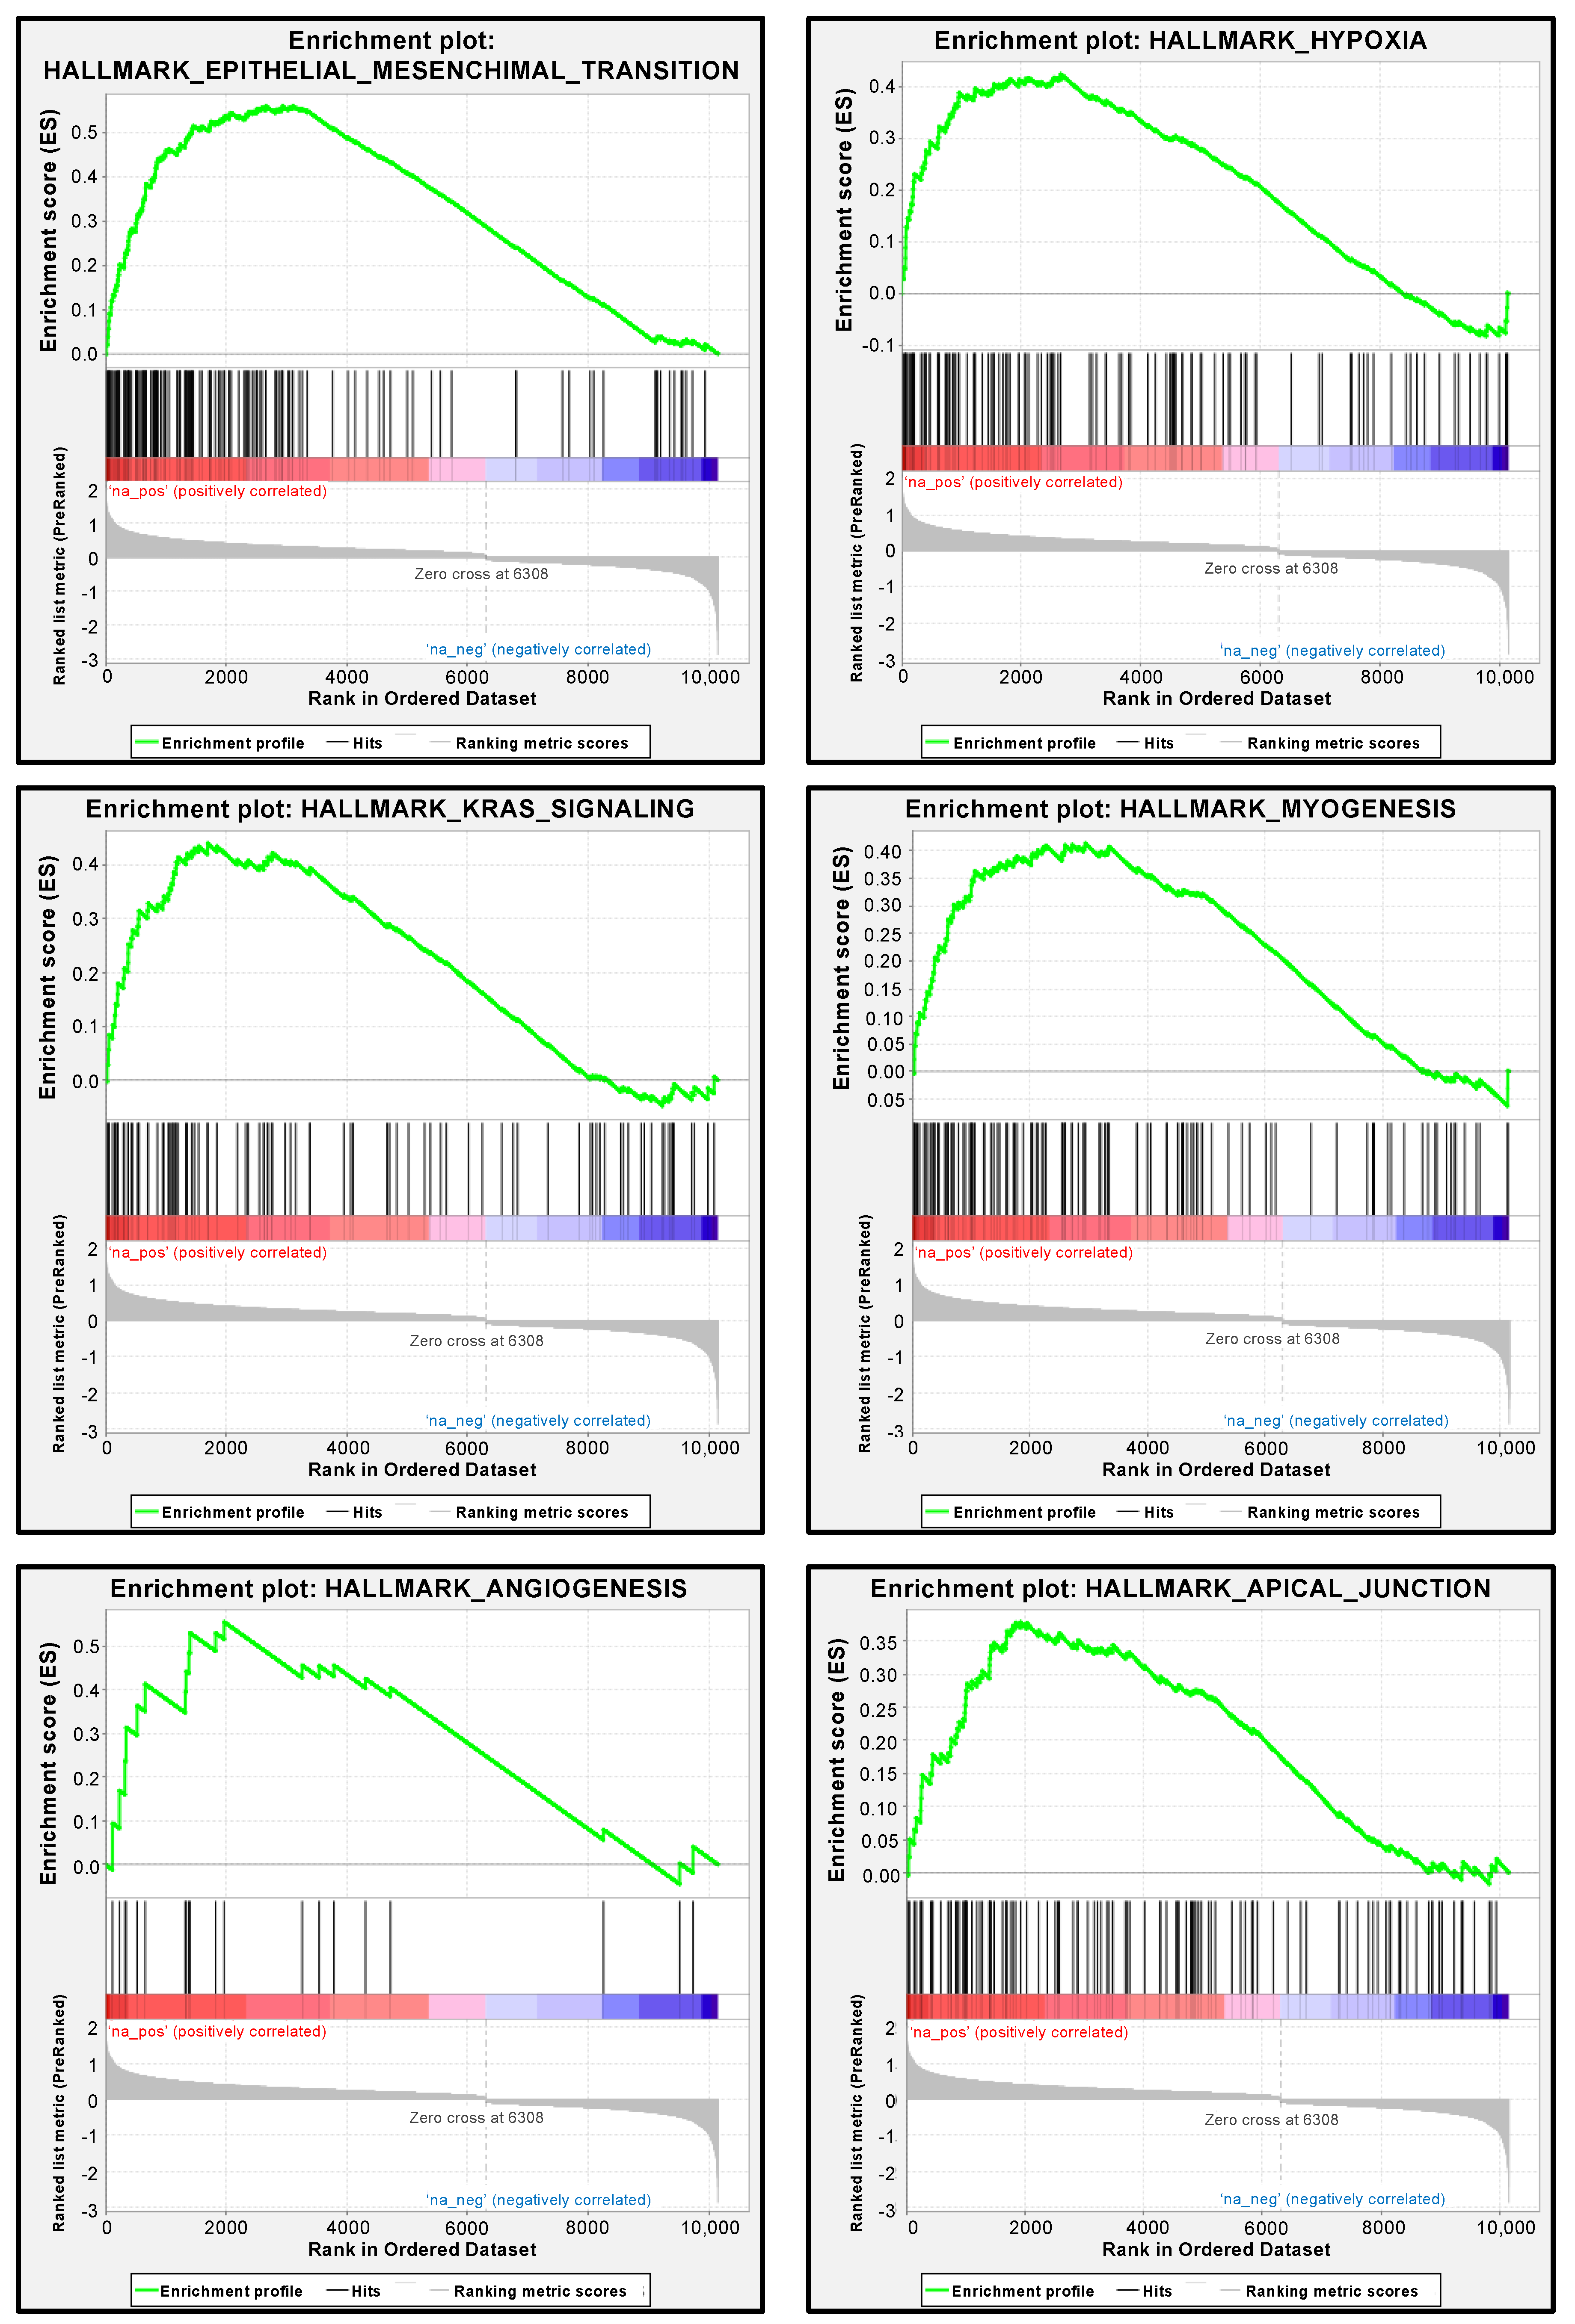
3.7. PXN-Mediated Pathways in RCC Cells

We performed gene set enrichment analysis to determine differentially expressed genes between the high and low PXN expression groups of the TCGA-KIRC cohort. In support of the functional assays using siRNAs, the most enriched signaling pathway in the high PXN expression group was “epithelial–mesenchymal transition” (Figure 8 and Table S3). Other significantly enriched pathways (FDR q-value < 0.05) were “hypoxia”, “KRAS signaling”, “myogenesis”, “angiogenesis”, and “apical junction”, supporting the hypothesis that PXN is related to the metastatic ability of cancer cells (Figure 7 and Table S2).

4. Discussion

Recent RNA sequencing techniques have accelerated the establishment of miRNA expression signatures. Our recent studies revealed that some passenger strands of miRNAs (e.g., miR-30c-2-3p, miR-99a-3p, miR-101-5p, miR-143-5p, miR-145-3p, and miR-150-3p) act as tumor-suppressive miRNAs by targeting several oncogenes in a wide range of cancers [10,11,12,13,14,15,16]. Involvement of the passenger strands of miRNAs in cancer pathogenesis is a new development in cancer research.
A recent in silico study (analysis of molecular profiles in more than 5200 patient samples from 14 different cancers) revealed that both strands of miRNAs are functional across different cancer types. For example, downregulation of both strands of miR-30a and miR-145 was frequently observed in multiple cancers, and their downregulation enhanced aberrant expression of cell cycle-related genes. These malignant events were found to affect the prognosis of cancer patients [17]. Simultaneous analysis of both strands of miRNA duplexes will lead to elucidation of a new molecular mechanism in cancer cells.
In this study, we showed that both strands of the miR-139 duplex acted as tumor-suppressive miRNAs in RCC cells. Accumulating evidence has shown a tumor-suppressive role of miR-139-5p in multiple types of cancers, including RCC [20,21,22]. Notably, miR-139-5p target genes are involved in cancer activation pathways, e.g., the PI3K/AKT/mTORC1, Wnt/β-catenin, and RTK/RAS/MAPK pathways [23,24,25,26,27]. Therefore, miR-139-5p plays a central role in controlling the malignant transformation of human cancers.
In contrast to miR-139-5p, few studies have evaluated the importance of miR-139-3p in cancer because it is a passenger strand. Recently, it was reported that miR-139-3p directly regulates KDM5B (lysine demethylase 5B), a key regulator of histone 3 lysine 4 demethylation in laryngeal squamous cell carcinoma [28]. Ectopic expression of miR-139-3p suppressed cancer cell malignant behavior by inhibiting the Wnt/β-catenin pathway [28]. In the HeLa cervical cancer cell line, miR-139-3p was reduced upon increasing expression of circular RNA hsa_circ_0031288 [29]. In turn, the decreased expression of miR-139-3p resulted in increased expression of B-cell CLL/lymphoma 6, as a target molecule. These regulatory effects promoted malignant transformation of HeLa cells. In bladder cells, both strands of the miR-139 duplex were downregulated in cancer tissues and exhibited tumor-suppressive effects [30]. Interestingly, matrix metalloprotease 11 (MMP11) was directly regulated by both miR-139 strands, and knockdown of MMP11 attenuated the aggressive phenotype of bladder cancer cells [30]. Our study is the first to show that miR-139-3p (the passenger strand) is involved in RCC pathogenesis, and both strands of the miR-139 duplex are pivotal players in RCC oncogenesis.
We are also interested in the presence of oncogenes controlled by tumor-suppressive miR-139-5p and miR-139-3p in RCC cells. A total of 19 and 22 genes were identified as putative targets of miR-139-5p and miR-139-3p regulation in RCC cells, respectively. Taking advantage of survival data from TCGA datasets, we performed multivariate analysis and found that, among the miR-139 duplex target genes, PXN, ELK1, ARHGEF19, and IKBKB were independent prognostic factors for RCC patient survival. Further genomic analyses of these genes will contribute to elucidating the molecular pathogenesis of RCC.
ELK1 is a well-established transcription factor that is phosphorylated by MAPKs and induces transcription of the c-fos proto-oncogene [31,32]. ARHGEF19 is a RhoGEF that reportedly activates the MAPK pathway and interacts with BRAF in lung cancer [33]. The role of ARHGEF19 in RCC is not well characterized, but the interaction of ARHGEF19 with ELK1 via the MAPK pathway may play a role in RCC development. IKBKB encodes IKK-beta, which phosphorylates the inhibitor of NF-kB, resulting in activation of the NF-kB pathway [34,35]. NF-kB and its downstream inflammatory signaling pathway are closely related to RCC carcinogenesis and aggressiveness [36].
In this study, we focused on PXN (paxillin) because its expression was found to be directly controlled by miR-139-3p in RCC cells and strongly related to RCC molecular pathogenesis. PXN is a focal adhesion scaffold/adaptor protein that contains five LD domains (leucine-aspartate motifs) located at the N-terminus and four cysteine–histidine-rich LIM domains at the C-terminus [37,38]. The LD domains act as a docking site for focal adhesion-related proteins, e.g., Src (tyrosine-protein kinase), FAK (focal adhesion kinase), PAK (p21-activated kinase), and ILK (integrin-linked kinase) [37,38]. The LIM domains act as binding sites for protein–protein interactions [37,38]. The pathways activated by PXN enhance cancer cell malignant progression and metastasis in a wide range of cancers [39]. Moreover, two key proteins in focal adhesion complexes, PXN and integrin B4, directly bind to each other, and this complex enhanced cisplatin resistance in lung cancer cells [40]. Another study showed that PXN phosphorylation may contribute to cisplatin resistance via the ERK-mediated activation of Bcl-2 transcription in lung cancer [41]. PXN-mediated pathways may be therapeutic targets for attenuating drug-resistance in cancer cells.
In our GSEA analysis, PXN-high-expressed RCC specimen was enriched with epithelial-mesenchymal transition (EMT) signaling pathways. A previous report has shown the suppressive effect of PXN on EMT pathway in cell lines [42]. These findings suggest the speculation that inhibitions of cancer cell migration and invasion by PXN knockdown in our study are due to the regulation of epithelial-mesenchymal transition.
It has been reported that several miRNAs (e.g., miR-132, miR-137, miR-145, miR-212, and miR-218) directly control PXN expression in cancer cells [43,44,45,46,47]. Among these miRNAs, we previously reported the downregulation of miR-145 and miR-218 in RCC cells [48,49]. More recently, DLX6-AS1 (a long noncoding RNA that adsorbs miRNA-199b) promoted epithelial–mesenchymal transition and cisplatin resistance via the miR-199b-5p/PXN axis in breast cancer cells [50]. This is the first report that PXN is directly regulated by tumor-suppressive miR-139-3p in RCC cells. Non-coding RNA-mediated epigenetic regulation of PXN expression will be assessed in the future.

5. Conclusions

Both strands of the miR-139 duplex are closely involved in RCC oncogenesis. This is the first report to reveal that miR-139-3p (the passenger strand) acts as a tumor-suppressive miRNA in RCC. Several genes are controlled by miR-139 and contribute to RCC molecular pathogenesis. Notably, the expression of PXN was directly regulated by miR-139-3p, and its overexpression enhanced RCC malignant transformation. Analyses of tumor-suppressive miRNAs (including the passenger strands) will contribute to the elucidation of new molecular networks in RCC.

Supplementary Materials

The following are available online at https://www.mdpi.com/2227-9059/8/12/599/s1, Figure S1: Schematic of the strategy used to narrow down the miR-139-5p/miR-139-3p target genes, Figure S2: Western blot images, Table S1: Reagents used in this study, Table S2: The number of cases per group for multivariate analysis, Table S3: Gene set enrichment analysis of genes enriched among the differentially expressed genes in the TCGA-KIRC high PXN expression group.

Author Contributions

Conceptualization, N.S.; methodology, N.S.; validation, R.O., S.M., and S.A.; formal analysis, R.O., Y.G., and Y.Y.; investigation, R.O. and Y.Y.; resources, Y.G., Y.Y., M.K., and T.I.; data curation, R.O., Y.G., Y.Y., and S.A.; writing—original draft preparation, R.O., Y.G., and N.S.; writing—review and editing, R.O., Y.G., and S.M.; visualization, R.O., Y.Y., and N.S.; supervision, N.S.; project administration, N.S.; funding acquisition, Y.G., M.K., and N.S. All authors have read and agreed to the published version of the manuscript.

Funding

This research was funded by JSPS KAKENHI, grant numbers; 20K22970, 18K16724, 18K09338.

Conflicts of Interest

The authors declare no conflict of interest.

References

  1. Bray, F.; Ferlay, J.; Soerjomataram, I.; Siegel, R.L.; Torre, L.A.; Jemal, A. Global cancer statistics 2018: GLOBOCAN estimates of incidence and mortality worldwide for 36 cancers in 185 countries. CA Cancer J. Clin. 2018, 68, 394–424. [Google Scholar] [CrossRef] [PubMed] [Green Version]
  2. Pierorazio, P.M.; Johnson, M.H.; Patel, H.D.; Sozio, S.M.; Sharma, R.; Iyoha, E.; Bass, E.B.; Allaf, M.E. Management of renal masses and localized renal cancer: Systematic review and meta-analysis. J. Urol. 2016, 196, 989–999. [Google Scholar] [CrossRef] [PubMed] [Green Version]
  3. Cairns, P. Renal cell carcinoma. Cancer Biomark 2010, 9, 461–473. [Google Scholar] [CrossRef]
  4. Cohen, H.T.; McGovern, F.J. Renal-cell carcinoma. N. Engl. J. Med. 2005, 353, 2477–2490. [Google Scholar] [CrossRef] [PubMed] [Green Version]
  5. Anfossi, S.; Babayan, A.; Pantel, K.; Calin, G.A. Clinical utility of circulating non-coding RNAs-an update. Nat. Rev. Clin. Oncol. 2018, 15, 541–563. [Google Scholar] [CrossRef] [PubMed]
  6. Ha, M.; Kim, V.N. Regulation of microRNA biogenesis. Nat. Rev. Mol. Cell Biol. 2014, 15, 509–524. [Google Scholar] [CrossRef]
  7. Gebert, L.F.R.; MacRae, I.J. Regulation of microRNA function in animals. Nat. Rev. Mol. Cell Biol. 2019, 20, 21–37. [Google Scholar] [CrossRef]
  8. Lin, S.; Gregory, R.I. MicroRNA biogenesis pathways in cancer. Nat. Rev. Cancer 2015, 15, 321–333. [Google Scholar] [CrossRef]
  9. Rupaimoole, R.; Slack, F.J. MicroRNA therapeutics: Towards a new era for the management of cancer and other diseases. Nat. Rev. Drug Discov. 2017, 16, 203–222. [Google Scholar] [CrossRef]
  10. Goto, Y.; Kurozumi, A.; Arai, T.; Nohata, N.; Kojima, S.; Okato, A.; Kato, M.; Yamazaki, K.; Ishida, Y.; Naya, Y.; et al. Impact of novel miR-145-3p regulatory networks on survival in patients with castration-resistant prostate cancer. Br. J. Cancer 2017, 117, 409–420. [Google Scholar] [CrossRef]
  11. Toda, H.; Seki, N.; Kurozumi, S.; Shinden, Y.; Yamada, Y.; Nohata, N.; Moriya, S.; Idichi, T.; Maemura, K.; Fujii, T.; et al. RNA-sequence-based microRNA expression signature in breast cancer: Tumor-suppressive miR-101-5p regulates molecular pathogenesis. Mol. Oncol. 2020, 14, 426–446. [Google Scholar] [CrossRef] [PubMed] [Green Version]
  12. Wada, M.; Goto, Y.; Tanaka, T.; Okada, R.; Moriya, S.; Idichi, T.; Noda, M.; Sasaki, K.; Kita, Y.; Kurahara, H.; et al. RNA sequencing-based microRNA expression signature in esophageal squamous cell carcinoma: Oncogenic targets by antitumor miR-143-5p and miR-143-3p regulation. J. Hum. Genet. 2020, 65, 1019–1034. [Google Scholar] [CrossRef] [PubMed]
  13. Tanaka, T.; Okada, R.; Hozaka, Y.; Wada, M.; Moriya, S.; Satake, S.; Idichi, T.; Kurahara, H.; Ohtsuka, T.; Seki, N. Molecular pathogenesis of pancreatic ductal adenocarcinoma: Impact of miR-30c-5p and miR-30c-2-3p regulation on oncogenic genes. Cancers (Basel) 2020, 12, 2731. [Google Scholar] [CrossRef] [PubMed]
  14. Mizuno, K.; Tanigawa, K.; Nohata, N.; Misono, S.; Okada, R.; Asai, S.; Moriya, S.; Suetsugu, T.; Inoue, H.; Seki, N. FAM64A: A novel oncogenic target of lung adenocarcinoma regulated by both strands of miR-99a (miR-99a-5p and miR-99a-3p). Cells 2020, 9, 2083. [Google Scholar] [CrossRef] [PubMed]
  15. Yamada, Y.; Nohata, N.; Uchida, A.; Kato, M.; Arai, T.; Moriya, S.; Mizuno, K.; Kojima, S.; Yamazaki, K.; Naya, Y.; et al. Replisome genes regulation by antitumor miR-101-5p in clear cell renal cell carcinoma. Cancer Sci. 2020, 111, 1392–1406. [Google Scholar] [CrossRef] [PubMed] [Green Version]
  16. Misono, S.; Seki, N.; Mizuno, K.; Yamada, Y.; Uchida, A.; Sanada, H.; Moriya, S.; Kikkawa, N.; Kumamoto, T.; Suetsugu, T.; et al. Molecular pathogenesis of gene regulation by the miR-150 duplex: miR-150-3p regulates TNS4 in lung adenocarcinoma. Cancers (Basel) 2019, 11, 601. [Google Scholar] [CrossRef] [PubMed] [Green Version]
  17. Mitra, R.; Adams, C.M.; Jiang, W.; Greenawalt, E.; Eischen, C.M. Pan-cancer analysis reveals cooperativity of both strands of microRNA that regulate tumorigenesis and patient survival. Nat. Commun. 2020, 11, 968. [Google Scholar] [CrossRef] [Green Version]
  18. Alpha, K.M.; Xu, W.; Turner, C.E. Paxillin family of focal adhesion adaptor proteins and regulation of cancer cell invasion. Int. Rev. Cell Mol. Biol. 2020, 355, 1–52. [Google Scholar] [CrossRef]
  19. Noh, K.; Bach, D.H.; Choi, H.J.; Kim, M.S.; Wu, S.Y.; Pradeep, S.; Ivan, C.; Cho, M.S.; Bayraktar, E.; Rodriguez-Aguayo, C.; et al. The hidden role of paxillin: Localization to nucleus promotes tumor angiogenesis. Oncogene 2020. [Google Scholar] [CrossRef]
  20. Khalili, N.; Nouri-Vaskeh, M.; Hasanpour Segherlou, Z.; Baghbanzadeh, A.; Halimi, M.; Rezaee, H.; Baradaran, B. Diagnostic, prognostic, and therapeutic significance of miR-139-5p in cancers. Life Sci. 2020, 256, 117865. [Google Scholar] [CrossRef]
  21. Wu, X.; Weng, L.; Li, X.; Guo, C.; Pal, S.K.; Jin, J.M.; Li, Y.; Nelson, R.A.; Mu, B.; Onami, S.H.; et al. Identification of a 4-microRNA signature for clear cell renal cell carcinoma metastasis and prognosis. PLoS ONE 2012, 7, e35661. [Google Scholar] [CrossRef] [PubMed]
  22. Fridman, E.; Dotan, Z.; Barshack, I.; David, M.B.; Dov, A.; Tabak, S.; Zion, O.; Benjamin, S.; Benjamin, H.; Kuker, H.; et al. Accurate molecular classification of renal tumors using microRNA expression. J. Mol. Diagn 2010, 12, 687–696. [Google Scholar] [CrossRef] [PubMed]
  23. Catanzaro, G.; Besharat, Z.M.; Miele, E.; Chiacchiarini, M.; Po, A.; Carai, A.; Marras, C.E.; Antonelli, M.; Badiali, M.; Raso, A.; et al. The miR-139-5p regulates proliferation of supratentorial paediatric low-grade gliomas by targeting the PI3K/AKT/mTORC1 signalling. Neuropathol. Appl. Neurobiol. 2018, 44, 687–706. [Google Scholar] [CrossRef] [PubMed] [Green Version]
  24. Noorolyai, S.; Mokhtarzadeh, A.; Baghbani, E.; Asadi, M.; Baghbanzadeh Kojabad, A.; Mogaddam, M.M.; Baradaran, B. The role of microRNAs involved in PI3-kinase signaling pathway in colorectal cancer. J. Cell Physiol. 2019, 234, 5664–5673. [Google Scholar] [CrossRef] [PubMed]
  25. Ji, X.; Guo, H.; Yin, S.; Du, H. miR-139-5p functions as a tumor suppressor in cervical cancer by targeting TCF4 and inhibiting Wnt/β-catenin signaling. Onco Targets Ther. 2019, 12, 7739–7748. [Google Scholar] [CrossRef] [PubMed] [Green Version]
  26. Shirjang, S.; Mansoori, B.; Asghari, S.; Duijf, P.H.G.; Mohammadi, A.; Gjerstorff, M.; Baradaran, B. MicroRNAs in cancer cell death pathways: Apoptosis and necroptosis. Free Radic. Biol. Med. 2019, 139, 1–15. [Google Scholar] [CrossRef]
  27. Niveditha, D.; Jasoria, M.; Narayan, J.; Majumder, S.; Mukherjee, S.; Chowdhury, R.; Chowdhury, S. Common and unique microRNAs in multiple carcinomas regulate similar network of pathways to mediate cancer progression. Sci. Rep. 2020, 10, 2331. [Google Scholar] [CrossRef] [Green Version]
  28. Ma, Y.; Chen, Z.; Yu, G. microRNA-139-3p inhibits malignant behaviors of laryngeal cancer cells via the KDM5B/SOX2 axis and the Wnt/β-catenin pathway. Cancer Manag. Res. 2020, 12, 9197–9209. [Google Scholar] [CrossRef]
  29. Xu, Y.J.; Yu, H.; Liu, G.X. Hsa_circ_0031288/hsa-miR-139-3p/Bcl-6 regulatory feedback circuit influences the invasion and migration of cervical cancer HeLa cells. J. Cell Biochem. 2020, 121, 4251–4260. [Google Scholar] [CrossRef]
  30. Yonemori, M.; Seki, N.; Yoshino, H.; Matsushita, R.; Miyamoto, K.; Nakagawa, M.; Enokida, H. Dual tumor-suppressors miR-139-5p and miR-139-3p targeting matrix metalloprotease 11 in bladder cancer. Cancer Sci. 2016, 107, 1233–1242. [Google Scholar] [CrossRef] [Green Version]
  31. Hipskind, R.A.; Rao, V.N.; Mueller, C.G.; Reddy, E.S.; Nordheim, A. Ets-related protein Elk-1 is homologous to the c-fos regulatory factor p62TCF. Nature 1991, 354, 531–534. [Google Scholar] [CrossRef] [PubMed]
  32. Gille, H.; Kortenjann, M.; Thomae, O.; Moomaw, C.; Slaughter, C.; Cobb, M.H.; Shaw, P.E. ERK phosphorylation potentiates Elk-1-mediated ternary complex formation and transactivation. EMBO J. 1995, 14, 951–962. [Google Scholar] [CrossRef] [PubMed]
  33. Li, Y.; Ye, Z.; Chen, S.; Pan, Z.; Zhou, Q.; Li, Y.Z.; Shuai, W.D.; Kuang, C.M.; Peng, Q.H.; Shi, W.; et al. ARHGEF19 interacts with BRAF to activate MAPK signaling during the tumorigenesis of non-small cell lung cancer. Int. J. Cancer 2018, 142, 1379–1391. [Google Scholar] [CrossRef] [PubMed] [Green Version]
  34. DiDonato, J.A.; Hayakawa, M.; Rothwarf, D.M.; Zandi, E.; Karin, M. A cytokine-responsive IkappaB kinase that activates the transcription factor NF-kappaB. Nature 1997, 388, 548–554. [Google Scholar] [CrossRef] [PubMed]
  35. Mitchell, S.; Vargas, J.; Hoffmann, A. Signaling via the NFκB system. Wiley. Interdiscip. Rev. Syst. Biol. Med. 2016, 8, 227–241. [Google Scholar] [CrossRef] [Green Version]
  36. Oya, M.; Takayanagi, A.; Horiguchi, A.; Mizuno, R.; Ohtsubo, M.; Marumo, K.; Shimizu, N.; Murai, M. Increased nuclear factor-kappa B activation is related to the tumor development of renal cell carcinoma. Carcinogenesis 2003, 24, 377–384. [Google Scholar] [CrossRef] [PubMed] [Green Version]
  37. Yang, W.J.; Zhong, J.; Yu, J.G.; Zhao, F.; Xiang, Y. The structure and functions of paxillin and its roles in neovascularization. Eur. Rev. Med. Pharmacol. Sci. 2017, 21, 1768–1773. [Google Scholar]
  38. López-Colomé, A.M.; Lee-Rivera, I.; Benavides-Hidalgo, R.; López, E. Paxillin: A crossroad in pathological cell migration. J. Hematol. Oncol. 2017, 10, 50. [Google Scholar] [CrossRef] [Green Version]
  39. Deakin, N.O.; Pignatelli, J.; Turner, C.E. Diverse roles for the paxillin family of proteins in cancer. Genes Cancer 2012, 3, 362–370. [Google Scholar] [CrossRef] [Green Version]
  40. Mohanty, A.; Nam, A.; Pozhitkov, A.; Yang, L.; Srivastava, S.; Nathan, A.; Wu, X.; Mambetsariev, I.; Nelson, M.; Subbalakshmi, A.R.; et al. A non-genetic mechanism involving the integrin β4/paxillin axis contributes to chemoresistance in lung cancer. iScience 2020, 23, 101496. [Google Scholar] [CrossRef]
  41. Wu, D.W.; Wu, T.C.; Wu, J.Y.; Cheng, Y.W.; Chen, Y.C.; Lee, M.C.; Chen, C.Y.; Lee, H. Phosphorylation of paxillin confers cisplatin resistance in non-small cell lung cancer via activating ERK-mediated Bcl-2 expression. Oncogene 2014, 33, 4385–4395. [Google Scholar] [CrossRef] [PubMed] [Green Version]
  42. Wen, L.; Zhang, X.; Zhang, L.; Chen, S.; Ma, Y.; Hu, J.; Yue, T.; Wang, J.; Zhu, J.; Wu, T.; et al. Paxillin knockdown suppresses metastasis and epithelial-mesenchymal transition in colorectal cancer via the ERK signalling pathway. Oncol. Rep. 2020, 44, 1105–1115. [Google Scholar] [CrossRef] [PubMed]
  43. Li, D.; Li, Z.; Xiong, J.; Gong, B.; Zhang, G.; Cao, C.; Jie, Z.; Liu, Y.; Cao, Y.; Yan, Y.; et al. MicroRNA-212 functions as an epigenetic-silenced tumor suppressor involving in tumor metastasis and invasion of gastric cancer through down-regulating PXN expression. Am. J. Cancer Res. 2015, 5, 2980–2997. [Google Scholar] [PubMed]
  44. Qin, J.; Wang, F.; Jiang, H.; Xu, J.; Jiang, Y.; Wang, Z. MicroRNA-145 suppresses cell migration and invasion by targeting paxillin in human colorectal cancer cells. Int. J. Clin. Exp. Pathol. 2015, 8, 1328–1340. [Google Scholar]
  45. Qin, J.; Ke, J.; Xu, J.; Wang, F.; Zhou, Y.; Jiang, Y.; Wang, Z. Downregulation of microRNA-132 by DNA hypermethylation is associated with cell invasion in colorectal cancer. Onco. Targets Ther. 2015, 8, 3639–3648. [Google Scholar] [CrossRef] [Green Version]
  46. Bi, Y.; Han, Y.; Bi, H.; Gao, F.; Wang, X. miR-137 impairs the proliferative and migratory capacity of human non-small cell lung cancer cells by targeting paxillin. Hum. Cell 2014, 27, 95–102. [Google Scholar] [CrossRef]
  47. Wu, D.W.; Cheng, Y.W.; Wang, J.; Chen, C.Y.; Lee, H. Paxillin predicts survival and relapse in non-small cell lung cancer by microRNA-218 targeting. Cancer Res. 2010, 70, 10392–10401. [Google Scholar] [CrossRef] [Green Version]
  48. Yoshino, H.; Enokida, H.; Itesako, T.; Kojima, S.; Kinoshita, T.; Tatarano, S.; Chiyomaru, T.; Nakagawa, M.; Seki, N. Tumor-suppressive microRNA-143/145 cluster targets hexokinase-2 in renal cell carcinoma. Cancer Sci. 2013, 104, 1567–1574. [Google Scholar] [CrossRef]
  49. Yamasaki, T.; Seki, N.; Yoshino, H.; Itesako, T.; Hidaka, H.; Yamada, Y.; Tatarano, S.; Yonezawa, T.; Kinoshita, T.; Nakagawa, M.; et al. MicroRNA-218 inhibits cell migration and invasion in renal cell carcinoma through targeting caveolin-2 involved in focal adhesion pathway. J. Urol. 2013, 190, 1059–1068. [Google Scholar] [CrossRef]
  50. Du, C.; Wang, Y.; Zhang, Y.; Zhang, J.; Zhang, L.; Li, J. LncRNA DLX6-AS1 contributes to epithelial-mesenchymal transition and cisplatin resistance in triple-negative breast cancer via modulating Mir-199b-5p/paxillin axis. Cell Transpl. 2020, 29. [Google Scholar] [CrossRef]
Figure 1. The expression and clinical significance of miR-139-5p and miR-139-3p in renal cell carcinoma (RCC) clinical specimens. (A) Expression of miR-139-5p and miR-139-3p were significantly reduced in The Cancer Genome Atlas—Kidney Renal Clear Cell Carcinoma (TCGA-KIRC) cancer specimens compared with adjacent normal specimens (p < 0.001). (B) Spearman’s rank test showed positive correlations between the expression levels of miR-139-5p and miR-139-3p in TCGA-KIRC clinical specimens (R = 0.8278, p < 0.001). (C) Kaplan–Meier survival curves of patients from TCGA-KIRC cohort. Patients were divided into two groups according to the median expression levels of miR-139-5p or miR-139-3p: high- and low-expression groups. Both miR-139-5p and miR-139-3p expression levels were significantly associated with the 5-year survival rate of RCC patients (p < 0.0001).
Biomedicines 08 00599 g001
Figure 2. Functional assays of cell proliferation, migration, and invasion following ectopic expression of miR-139-5p and miR-139-3p in RCC cell lines A498 and 786-O. N.S.: not significant. (A) Cell proliferation was assessed using XTT assays. Data were collected 72 h after miRNA transfection. (B) Cell migration was assessed using wound healing assays. (C) Cell invasions were determined 48 h after seeding miRNA-transfected cells into chambers using Matrigel invasion assays.
Biomedicines 08 00599 g002
Figure 3. Clinical significance of miR-139-5p or miR-139-3p target genes in TCGA-KIRC database. High expression of two miR-139-5p target genes (PLXDC1 and TET3) and six miR-139-3p target genes (PXN, ARHGEF19, ELK1, CSF1, IKBKB, and DCBLD1) were significantly associated with poor prognosis in patients with RCC. Kaplan–Meier curves for 5-year overall survival according to the expression of each miR-139-3p target gene are shown.
Biomedicines 08 00599 g003
Figure 4. Forest plot showing the results of multivariate analyses of eight genes (PLXDC1, TET3, PXN, ARHGEF19, ELK1, CSF1, IKBKB, and DCBLD1). In addition to the gene expression level, the tumor stage, pathological grade, and age group were evaluated as potential independent factors associated with survival. Numbers of cases per each group are shown in Table S2.
Biomedicines 08 00599 g004
Figure 5. Expression levels of miR-139-5p or miR-139-3p target genes (PLXDC1 and TET3 for miR-139-5p, PXN, ARHGEF19, ELK1, CSF1, IKBKB, and DCBLD1 for miR-139-3p) in TCGA-KIRC cohort. Seven genes (PLXDC1, TET3, PXN, ELK1, CSF1, IKBKB, and DCBLD1) were confirmed to be significantly upregulated in clinical specimens. N.S.: not significant.
Biomedicines 08 00599 g005
Figure 6. Expression of paxillin (PXN) was regulated directly by miR-139-3p in RCC cells. (A) Expression of PXN mRNA was significantly suppressed in miR-139-3p-transfected A498 and 786-O cells (48 h after transfection). Expression of GAPDH was used as an internal control. (B) Expression of PXN protein was reduced in miR-139-3p-transfected RCC cells (48 h after transfection). GAPDH was used as a loading control. (C) The TargetScanHuman database predicted one putative miR-139-3p-binding site in the 3’-UTR of PXN. (D) Dual-luciferase reporter assays showed decreased luminescence activity in RCC cells co-transfected with miR-139-3p together with a vector harboring the “wild-type sequence”. Normalized data were calculated as Renilla/firefly luciferase activity ratios. N.S.: not significant.
Biomedicines 08 00599 g006
Figure 7. Effects of PXN knockdown on cell proliferation, migration, and invasion in RCC cells. (A,B) Expression of PXN was successfully reduced after siRNA transfection in RCC cells. (C) Cell proliferation was determined by XTT assays. N.S.: not significant. (D) Cell migration was determined by wound healing assays. (E) Cell invasion was determined by Matrigel invasion assays.
Biomedicines 08 00599 g007
Figure 8. Pathways enriched among the differentially expressed genes in the high PXN expression group according to gene set enrichment analysis. The six significantly enriched pathways (FDR q-value < 0.05) are shown.
Biomedicines 08 00599 g008
Table 1. A. Candidate target genes of miR-139-5p. B. Candidate target genes of miR-139-3p.
A. Candidate target genes of miR-139-5p
Gene
Symbol
Gene NameEntrez
Gene
ID
miR-139-5p-
Transfected
A498 Cells
(log2 FC)
miR-139-5p-
Transfected
786-O Cells
(log2 FC)
GSE36895
(log2 FC)
Total
Binding
Sites
TCGA
5y OS
p-Value
PLXDC1plexin domain containing 157125−0.615791−1.4557031.652815910.0098
TET3tet methylcytosine dioxygenase 3200424−1.074818−1.1528350.735036710.0261
IRF4interferon regulatory factor 43662−2.491284−1.5632160.7295683610.0575
RAB27BRAB27B, member RAS oncogene family5874−0.620716−0.9707450.782326610.1244
FCHSD2FCH and double SH3 domains 29873−1.834753−1.3642810.567363810.1565
DMDdystrophin1756−0.98734−1.124980.4609447710.3891
APOL6apolipoprotein L, 680830−1.363298−0.5741630.4365281820.4733
AP1S2adaptor-related protein complex 1, sigma 2 subunit8905−0.571341−0.634690.5797952410.5072
PTPRUprotein tyrosine phosphatase, receptor type, U10076−1.430874−0.8834790.848153510.6152
TRAT1T cell receptor associated transmembrane adaptor 150852−1.192173−1.7816371.973301820.7395
SLC39A14solute carrier family 39 (zinc transporter), member 1423516−0.536152−0.7050821.040825810.8125
OTUD4OTU deubiquitinase 454726−1.720465−1.595490.2193196610.9338
CDCA7Lcell division cycle associated 7-like55536−1.478013−0.5643772.173391310.969
ZNF678zinc finger protein 678339500−1.585917−0.6218320.2512895220.0086 *
FGFBP2fibroblast growth factor binding protein 283888−0.830757−1.3178871.574246610.0058 *
ATP2B2ATPase, Ca++ transporting, plasma membrane 2491−1.109889−2.6681941.306824630.0050 *
EML1echinoderm microtubule associated protein like 12009−0.56874−0.5419780.3889117520.0014 *
PCSK5proprotein convertase subtilisin/kexin type 55125−1.751102−0.5770520.5754695510.0006 *
FAM168Afamily with sequence similarity 168, member A23201−1.390649−0.9599920.2575413610.0002 *
B. Candidate target genes of miR-139-3p
Gene
Symbol
Gene NameEntrez
Gene
ID
miR-139-3p-
Transfected
A498 Cells
(log2 FC)
miR-139-3p-
Transfected
786-O Cells
(log2 FC)
GSE36895
(log2 FC)
Total
Binding
Sites
TCGA
5y OS
p-Value
PXNpaxillin5829−1.164181−0.7071670.4818192<0.0001
ARHGEF19Rho guanine nucleotide exchange factor (GEF) 19128272−0.607603−1.8269961.10491731<0.0001
ELK1ELK1, member of ETS oncogene family2002−1.518329−0.8399840.598721220.0001
CSF1colony stimulating factor 1 (macrophage)1435−0.952795−0.5370741.015302210.0124
IKBKBinhibitor of kappa light polypeptide gene enhancer in B-cells, kinase beta3551−0.511766−1.8820330.2344186810.0251
DCBLD1discoidin, CUB and LCCL domain containing 1285761−1.398862−0.6682450.2862872810.0285
SYT11synaptotagmin XI23208−1.034462−0.5786170.441152710.0556
SERPINE1serpin peptidase inhibitor, clade E (nexin, plasminogen activator inhibitor type 1), member 15054−2.516404−0.6636381.804902430.0731
KDM6Blysine (K)-specific demethylase 6B23135−0.62567−0.7331710.4230362510.1019
RASSF5Ras association (RalGDS/AF-6) domain family member 583593−1.180982−4.6050491.505967610.3643
ACBD3acyl-CoA binding domain containing 364746−0.688812−0.5421660.6553786410.3841
APOL6apolipoprotein L, 680830−1.350307−0.8581420.4365281810.4733
EPN2epsin 222905−0.619177−0.5209030.2909823410.581
GIT2G protein-coupled receptor kinase interacting ArfGAP 29815−0.64332−0.5449511.411324310.7179
KIF3Ckinesin family member 3C3797−0.694929−0.9565680.2919876310.9148
ARAP2ArfGAP with RhoGAP domain, ankyrin repeat and PH domain 2116984−1.161352−1.2580010.394375310.0940 *
RFX2regulatory factor X, 2 (influences HLA class II expression)5990−0.937881−0.5800921.476691510.0671 *
RNF125ring finger protein 125, E3 ubiquitin protein ligase54941−0.539067−1.8115760.610355810.0394 *
ARSKarylsulfatase family, member K153642−1.505581−0.8874760.432730110.0219 *
STAG2stromal antigen 210735−0.527565−0.5639850.387031381<0.0001 *
TNS1tensin 17145−0.764289−0.6098930.281556251<0.0001 *
* Better prognosis in high-expression group.
Publisher’s Note: MDPI stays neutral with regard to jurisdictional claims in published maps and institutional affiliations.

