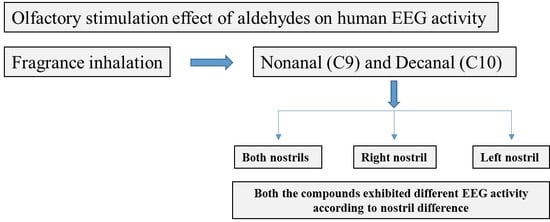
Olfactory Stimulation Effect of Aldehydes, Nonanal, and Decanal on the Human Electroencephalographic Activity, According to Nostril Variation


Abstract
:
1. Introduction
2. Methods
2.1. Materials
2.2. Subjects
2.3. Experimental Design
2.4. EEG Recordings
2.5. Fragrance Administration
2.6. Data Analysis
3. Results
4. Discussion
Author Contributions
Funding
Conflicts of Interest
References
- Ishimaru, T.; Reden, J.; Krone, F.; Scheibe, M. Topographical differences in the sensitivity of the human nasal mucosa to olfactory and trigeminal stimuli. Neurosci. Lett. 2011, 493, 136–139. [Google Scholar] [CrossRef] [PubMed]
- Leopold, D.A.; Hummel, T.; Schwob, J.E.; Hong, S.C.; Knecht, M.; Kobal, G. Anterior distribution of human olfactory epithelium. Laryngoscope 2000, 110, 417–421. [Google Scholar] [CrossRef] [PubMed]
- Small, D.M.; Gerber, J.C.; Mak, Y.E.; Hummel, T. Differential neural responses evoked by orthonasal versus retronasal odorant perception in humans. Neuron 2005, 47, 593–605. [Google Scholar] [CrossRef] [PubMed]
- Kahana-Zweig, R.; Geva-Sagiv, M.; Weissbrod, A.; Secundo, L.; Soroker, N.; Sobel, N. Measuring and characterizing the human nasal cycle. PLoS ONE 2016, 11, e0162918. [Google Scholar] [CrossRef] [PubMed]
- Sobel, N.; Khan, R.M.; Saltman, A.; Sullivan, E.V.; Gabrieli, J.D.E. The world smells different to each nostril. Nature 1999, 402, 35. [Google Scholar] [CrossRef] [PubMed]
- Angelucci, F.L.; Silva, V.V.; Dal Pizzol, C.; Spir, L.G.; Praes, C.E.; Maibach, H. Physiological effect of olfactory stimuli inhalation in humans: An overview. Int. J. Cosmet. Sci. 2014, 36, 117–123. [Google Scholar] [CrossRef] [PubMed]
- Sowndhararajan, K.; Kim, S. Influence of fragrances on human psychophysiological activity: With special reference to human electroencephalographic response. Sci. Pharm. 2016, 84, 724–751. [Google Scholar] [CrossRef] [PubMed]
- Kutlu, A.K.; Yilmaz, E.; Cecen, D. Effects of aroma inhalation on examination anxiety. Teach. Learn. Nurs. 2008, 3, 125–130. [Google Scholar] [CrossRef]
- Robins, J.L. The science and art of aromatherapy. J. Holist. Nurs. 1999, 17, 5–17. [Google Scholar] [CrossRef] [PubMed]
- Kim, M.; Sowndhararajan, K.; Park, S.J.; Kim, S. Effect of inhalation of isomers, (+)-α-pinene and (+)-β-pinene on human electroencephalographic activity according to gender difference. Eur. J. Integr. Med. 2018, 17, 33–39. [Google Scholar] [CrossRef]
- Matsubara, E.; Fukagawa, M.; Okamoto, T.; Ohnuki, K.; Shimizu, K.; Kondo, R. The essential oil of Abies sibirica (Pinaceae) reduces arousal levels after visual display terminal work. Flavour Fragr. J. 2011, 26, 204–210. [Google Scholar] [CrossRef]
- Skoric, M.K.; Ivan Adamec, I.; Jerbic, A.B.; Gabelic, T.; Hajnšek, S.; Habek, M. Electroencephalographic response to different odors in healthy individuals: A promising tool for objective assessment of olfactory disorders. Clin. EEG Neurosci. 2015, 46, 370–376. [Google Scholar] [CrossRef]
- Sowndhararajan, K.; Cho, H.; Yu, B.; Song, J.; Kim, S. Effect of inhalation of essential oil from Inula helenium L. root on electroencephalographic (EEG) activity of the human brain. Eur. J. Integr. Med. 2016, 8, 453–457. [Google Scholar] [CrossRef]
- Seo, M.; Sowndhararajan, K.; Kim, S. Influence of binasal and uninasal inhalations of essential oil of Abies koreana twigs on electroencephalographic activity of human. Behav. Neurol. 2016, 2016, 9250935. [Google Scholar] [CrossRef]
- O’Brien, P.J.; Siraki, A.G.; Shangari, N. Aldehyde sources, metabolism, molecular toxicity mechanisms, and possible effects on human health. Crit. Rev. Toxicol. 2005, 35, 609–662. [Google Scholar] [CrossRef]
- Surburg, H.; Panten, J. Common Fragrance and Flavor Materials, Preparation, Properties and Uses, 5th ed.; Wiley-VCH: Weinheim, Germany, 2005. [Google Scholar]
- Omonov, T.S.; Kharraz, E.; Foley, P.; Curtis, J.M. The production of biobased nonanal by ozonolysis of fatty acids. RSC Adv. 2014, 4, 53617. [Google Scholar] [CrossRef]
- Otienoburu, P.E.; Ebrahimi, B.; Phelan, P.L.; Foster, W.A. Analysis and optimization of a synthetic milkweed floral attractant for mosquitoes. J. Chem. Ecol. 2012, 38, 873–881. [Google Scholar] [CrossRef]
- Haze, S.; Gozu, Y.; Nakamura, S.; Kohno, Y.; Sawano, K.; Ohta, H.; Yamazakiet, K. 2-Nonenal newly found in human body odor tends to increase with aging. J. Investig. Dermatol. 2001, 116, 520–524. [Google Scholar] [CrossRef]
- Baharum, S.N.; Bunawan, H.; Ghani, M.A.; Mustapha, W.A.; Noor, N.M. Analysis of the chemical composition of the essential oil of Polygonum minus Huds. using two-dimensional gas chromatography-time-of-flight mass spectrometry (GC-TOF MS). Molecules 2010, 15, 7006–7015. [Google Scholar] [CrossRef]
- Freires, I.D.A.; Murata, R.M.; Furletti, V.F.; Sartoratto, A.; de Alencar, S.M.D.; Figueira, G.M.; de Oliveira Rodrigues, J.A.; Duarte, M.C.T.; Rosalen, P.L. Coriandrum sativum L. (Coriander) essential oil: Antifungal activity and mode of action on Candida spp., and molecular targets affected in human wholegenome expression. PLoS ONE 2014, 9, e99086. [Google Scholar] [CrossRef]
- Michael, G.A.; Relland, S.; Galich, H. Interhemispheric balance sets nostril differences in color-induced nasal thermal judgments. Behav. Brain Res. 2011, 224, 369–375. [Google Scholar] [CrossRef]
- Iijima, M.; Osawa, M.; Nishitani, N.; Iwata, M. Effects of incense on brain function: Evaluation using electroencephalograms and event–related potentials. Neuropsychobiology 2009, 59, 80–86. [Google Scholar] [CrossRef]
- Lorig, T.S.; Schwartz, G.E. Brain and odor: I. Alteration of human EEG by odor administration. Psychobiology 1988, 16, 281–284. [Google Scholar]
- Sayorwan, W.; Siripornpanich, V.; Piriyapunyaporn, T.; Hongratanaworakit, T.; Kotchabhakdi, N.; Ruangrungsi, N. The effects of lavender oil inhalation on emotional states, autonomic nervous system, and brain electrical activity. J. Med. Assoc. Thail. 2012, 95, 598–606. [Google Scholar]
- Lee, B.G.; Lee, B.L.; Chung, W.Y. Mobile healthcare for automatic driving sleep-onset detection using wavelet-based EEG and respiration signals. Sensors 2014, 14, 17915–17936. [Google Scholar] [CrossRef]
- Greenberg, J.A.; Burke, J.F.; Haque, R.; Kahana, M.J.; Zaghloul, K.A. Decreases in theta and increases in high frequency activity underlie associative memory encoding. NeuroImage 2015, 114, 257–263. [Google Scholar] [CrossRef] [Green Version]
- Razumnikova, O.M. Creativity related cortex activity in the remote associates task. Brain Res. Bull. 2007, 73, 96–102. [Google Scholar] [CrossRef]
- Searleman, A.; Hormung, D.E.; Stein, E.; Brzuskiewicz, L. Nostril dominance: Differences in nasal airflow and preferred handedness. Laterality 2005, 10, 111–120. [Google Scholar] [CrossRef]
- Herz, R.S.; McCall, C.; Cahill, L. Hemispheric lateralization in the processing of odor pleasantness versus odor names. Chem. Senses 1999, 24, 691–695. [Google Scholar] [CrossRef]
- Gudziol, V.; Paech, I.; Hummel, T. Unilateral reduced sense of smell is an early indicator for global olfactory loss. J. Neurol. 2010, 257, 959–963. [Google Scholar] [CrossRef]
- Pal, G.K.; Agarwal, A.; Karthik, S.; Pal, P.; Nanda, N. Slow yogic breathing through right and left nostril influences sympathovagal balance, heart rate variability, and cardiovascular risks in young adults. N. Am. J. Med. Sci. 2014, 6, 145–151. [Google Scholar] [CrossRef]
- Acuna, B.D.; Eliassen, J.C.; Donoghue, J.P.; Sanes, J.N. Frontal and parietal lobe activation during transitive inference in humans. Cereb. Cortex 2002, 12, 1312–1321. [Google Scholar] [CrossRef]


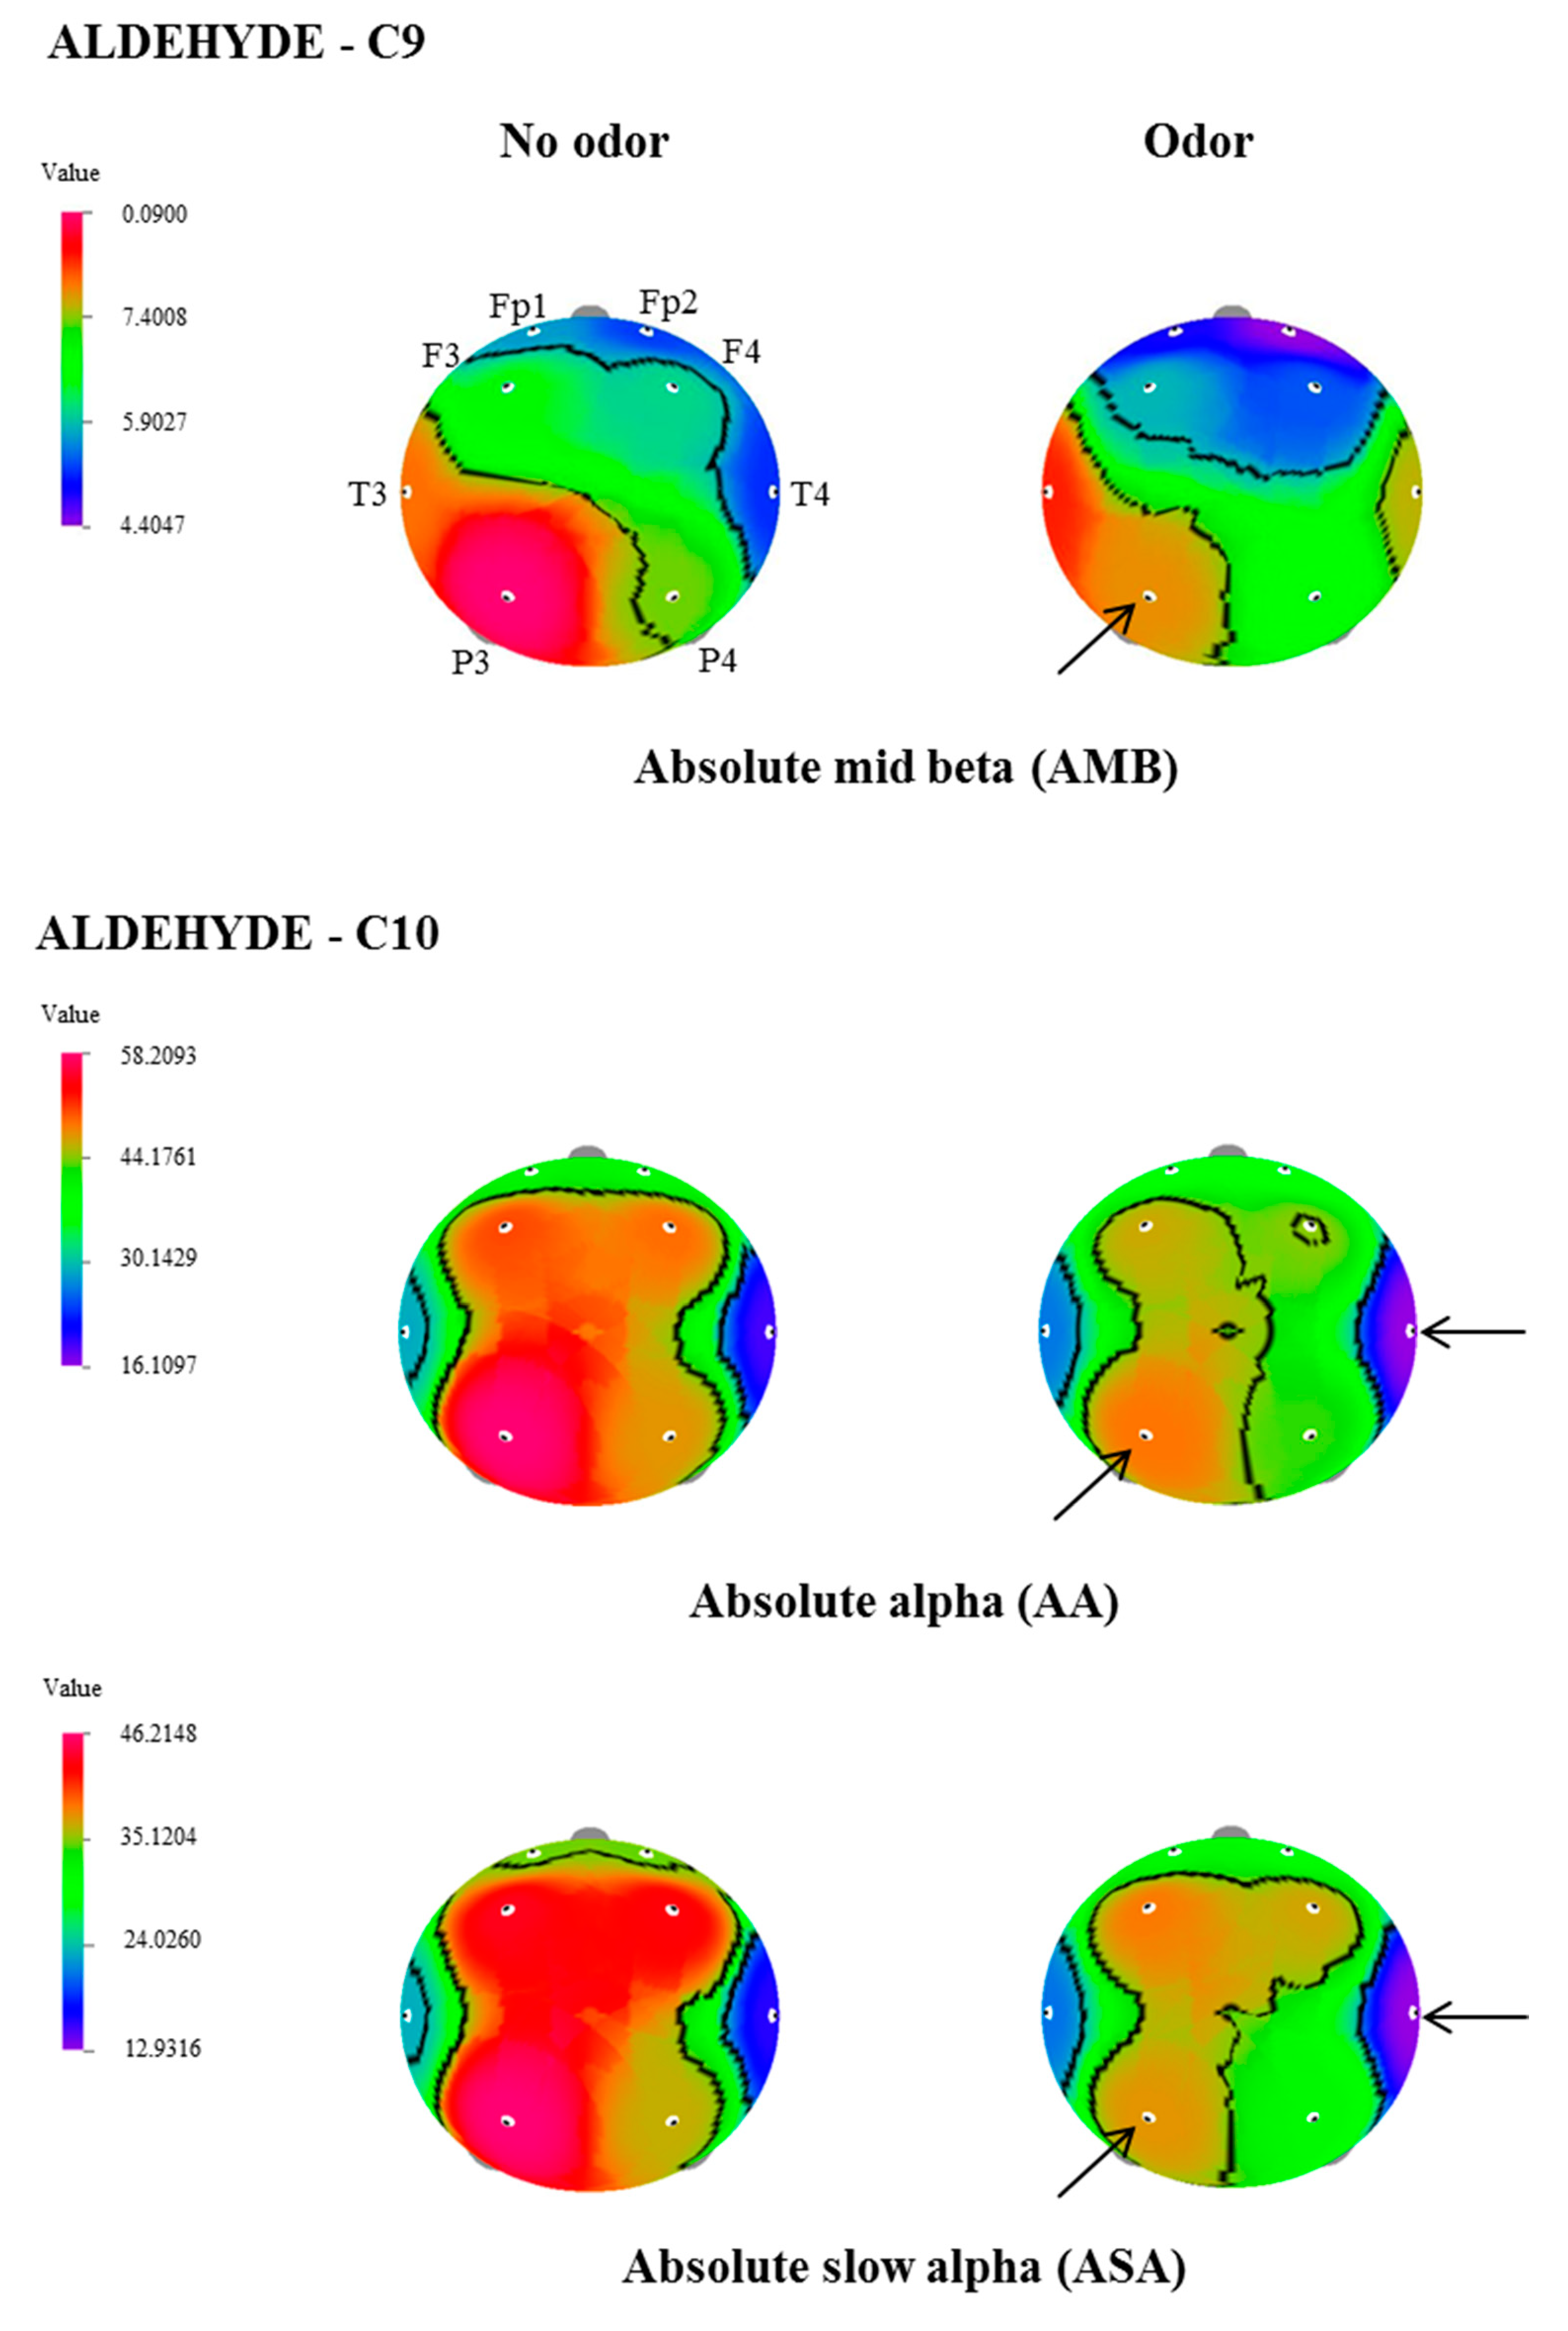
| Aldehyde | EEG Indices | Site | No Odor Exposure (µV2) | Odor Exposure (µV2) | t-Test | p Value * |
|---|---|---|---|---|---|---|
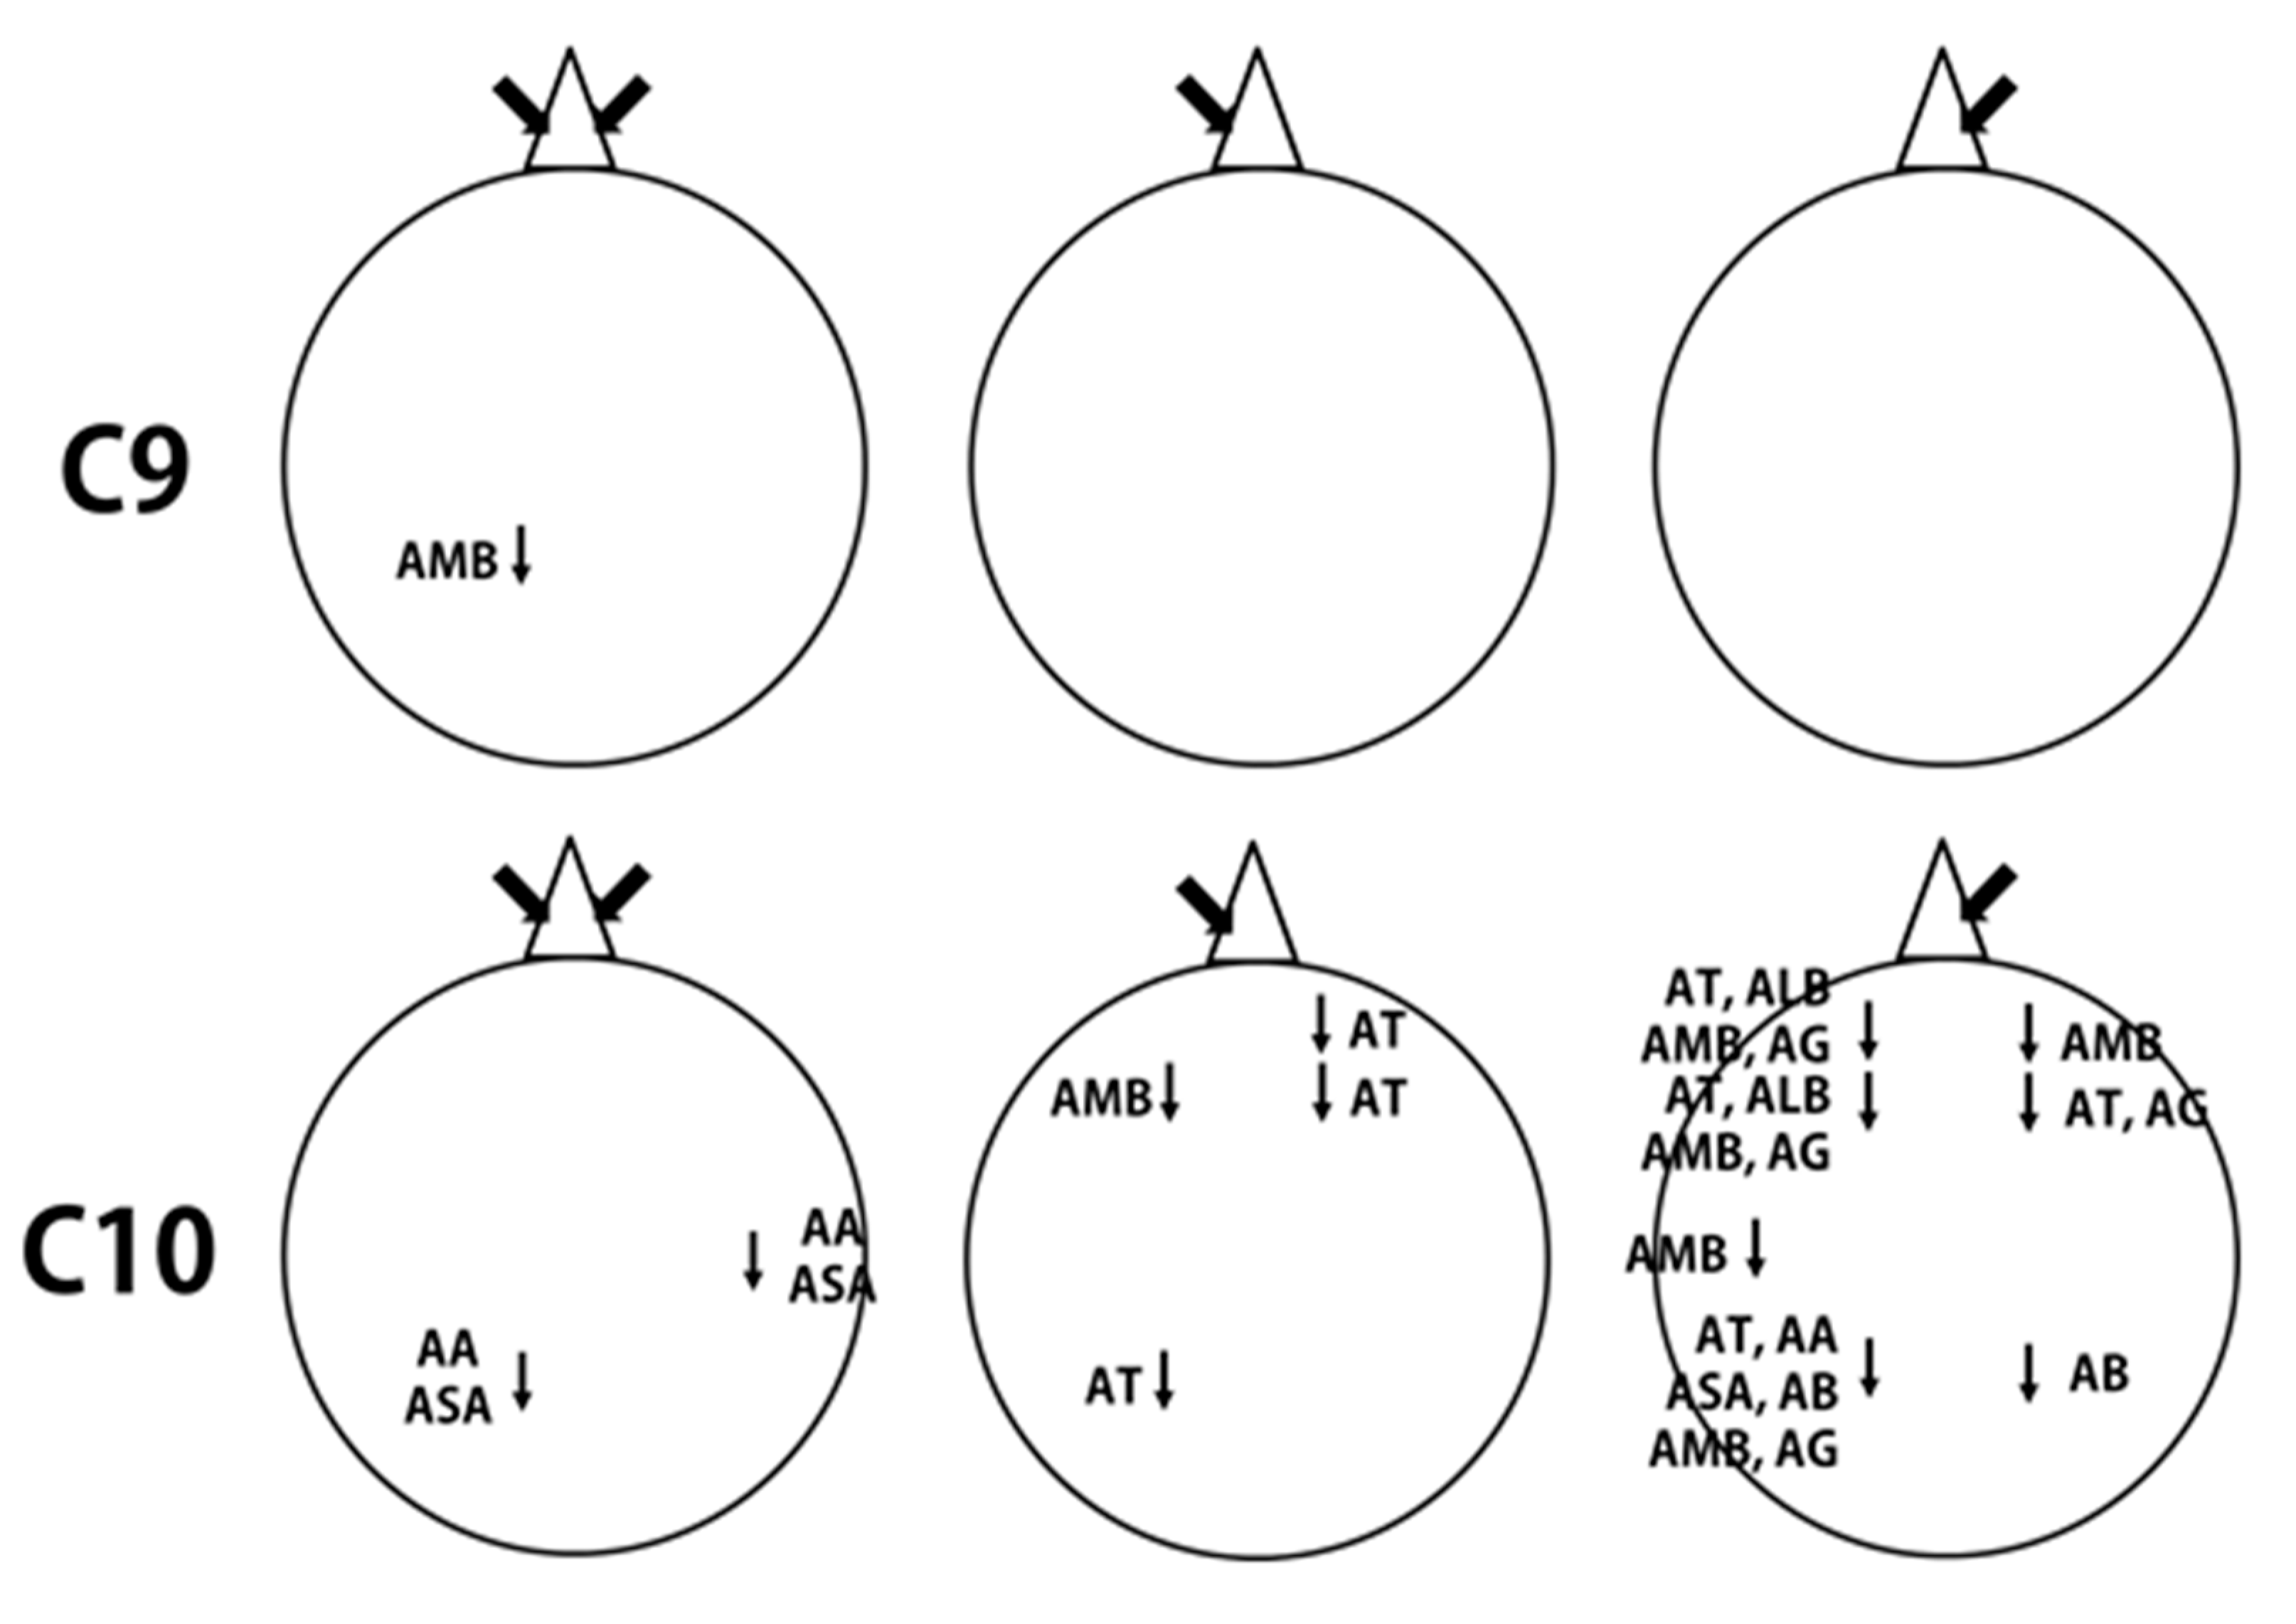
| C9 | AMB | P3 | 8.8988 ± 1.3 | 7.7534 ± 1.4 | 2.119 | 0.047 |
| C10 | AA | T4 | 18.9454 ± 3.2 | 16.1097 ± 2.7 | 2.332 | 0.031 |
| P3 | 58.2094 ± 10.9 | 48.7095 ± 8.2 | 2.356 | 0.029 | ||
| ASA | T4 | 15.9347 ± 3.1 | 12.9317 ± 2.62 | 2.836 | 0.011 | |
| P3 | 46.2148 ± 9.6 | 37.5394 ± 7.5 | 2.458 | 0.024 |
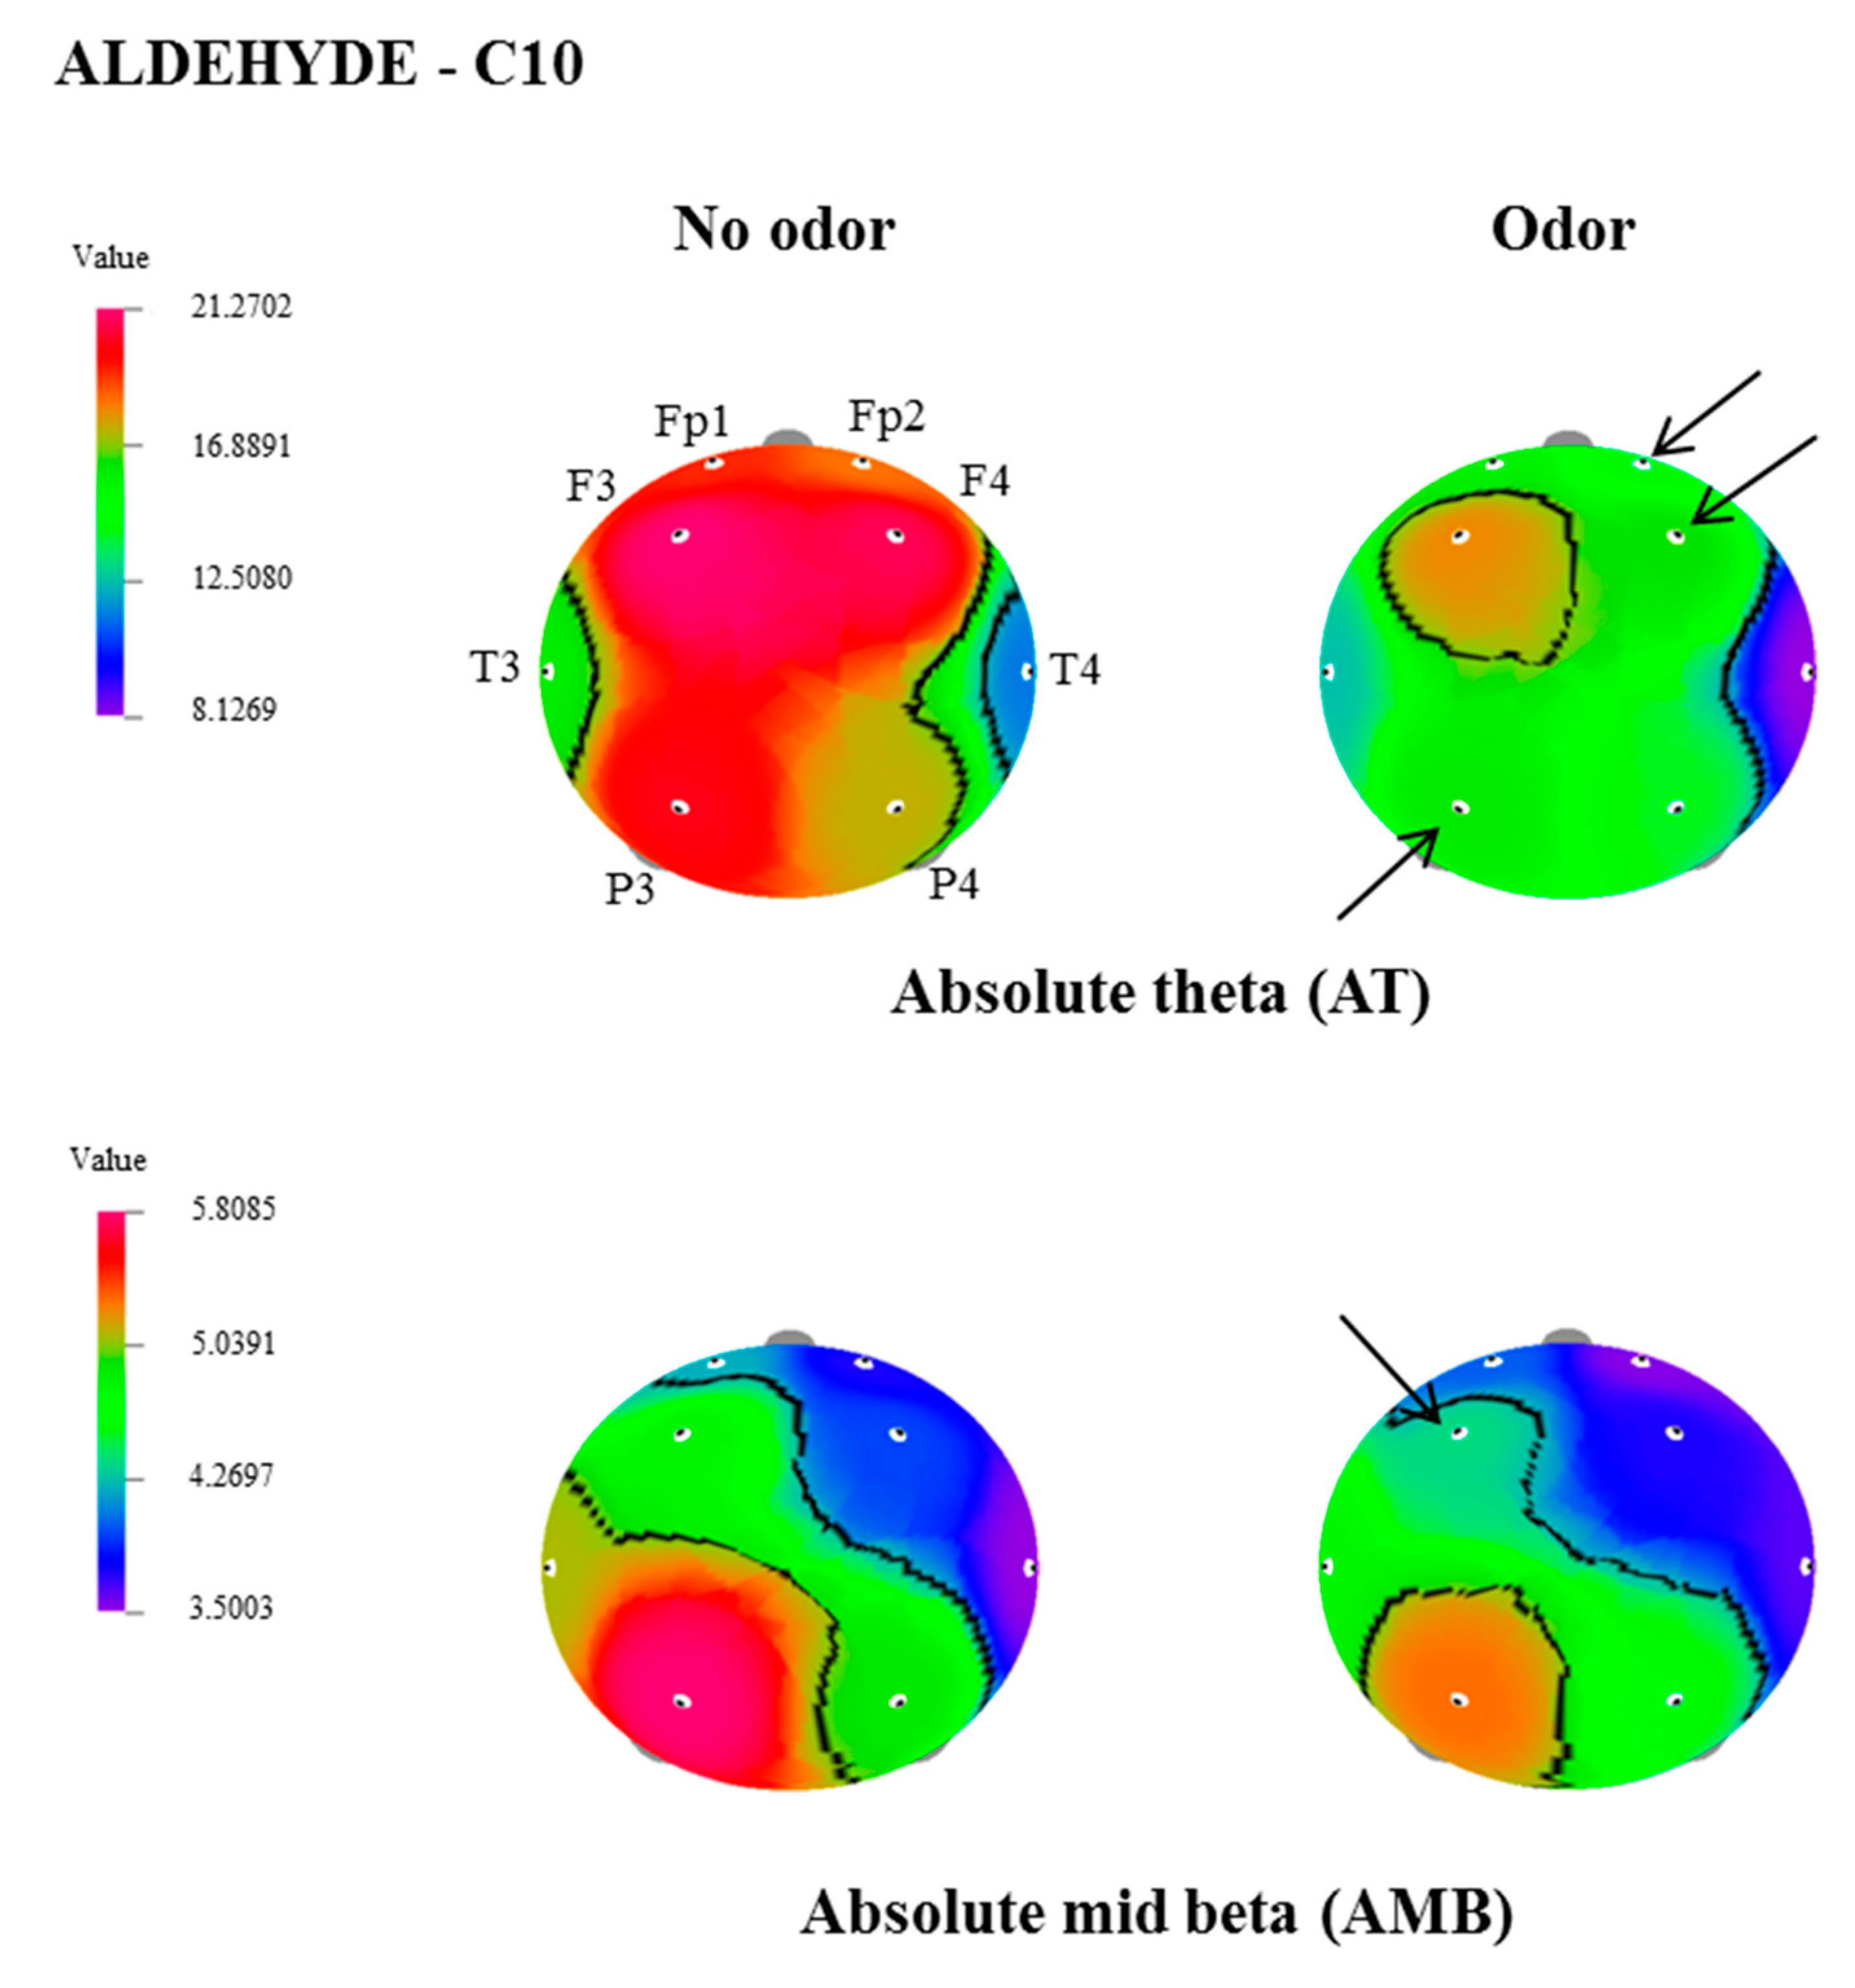
| EEG Indices | Site | No Odor Exposure (µV2) | Odor Exposure (µV2) | t-Test | p Value * |
|---|---|---|---|---|---|
| AT | Fp2 | 18.3174 ± 2.7 | 14.0908 ± 1.7 | 2.130 | 0.046 |
| F4 | 20.8985 ± 2.8 | 16.3078 ± 1.9 | 2.327 | 0.031 | |
| P3 | 20.1413 ± 2.7 | 16.0885 ± 2.2 | 2.240 | 0.037 | |
| AMB | F3 | 4.8342 ± 0.4 | 4.3673 ± 0.3 | 2.307 | 0.032 |
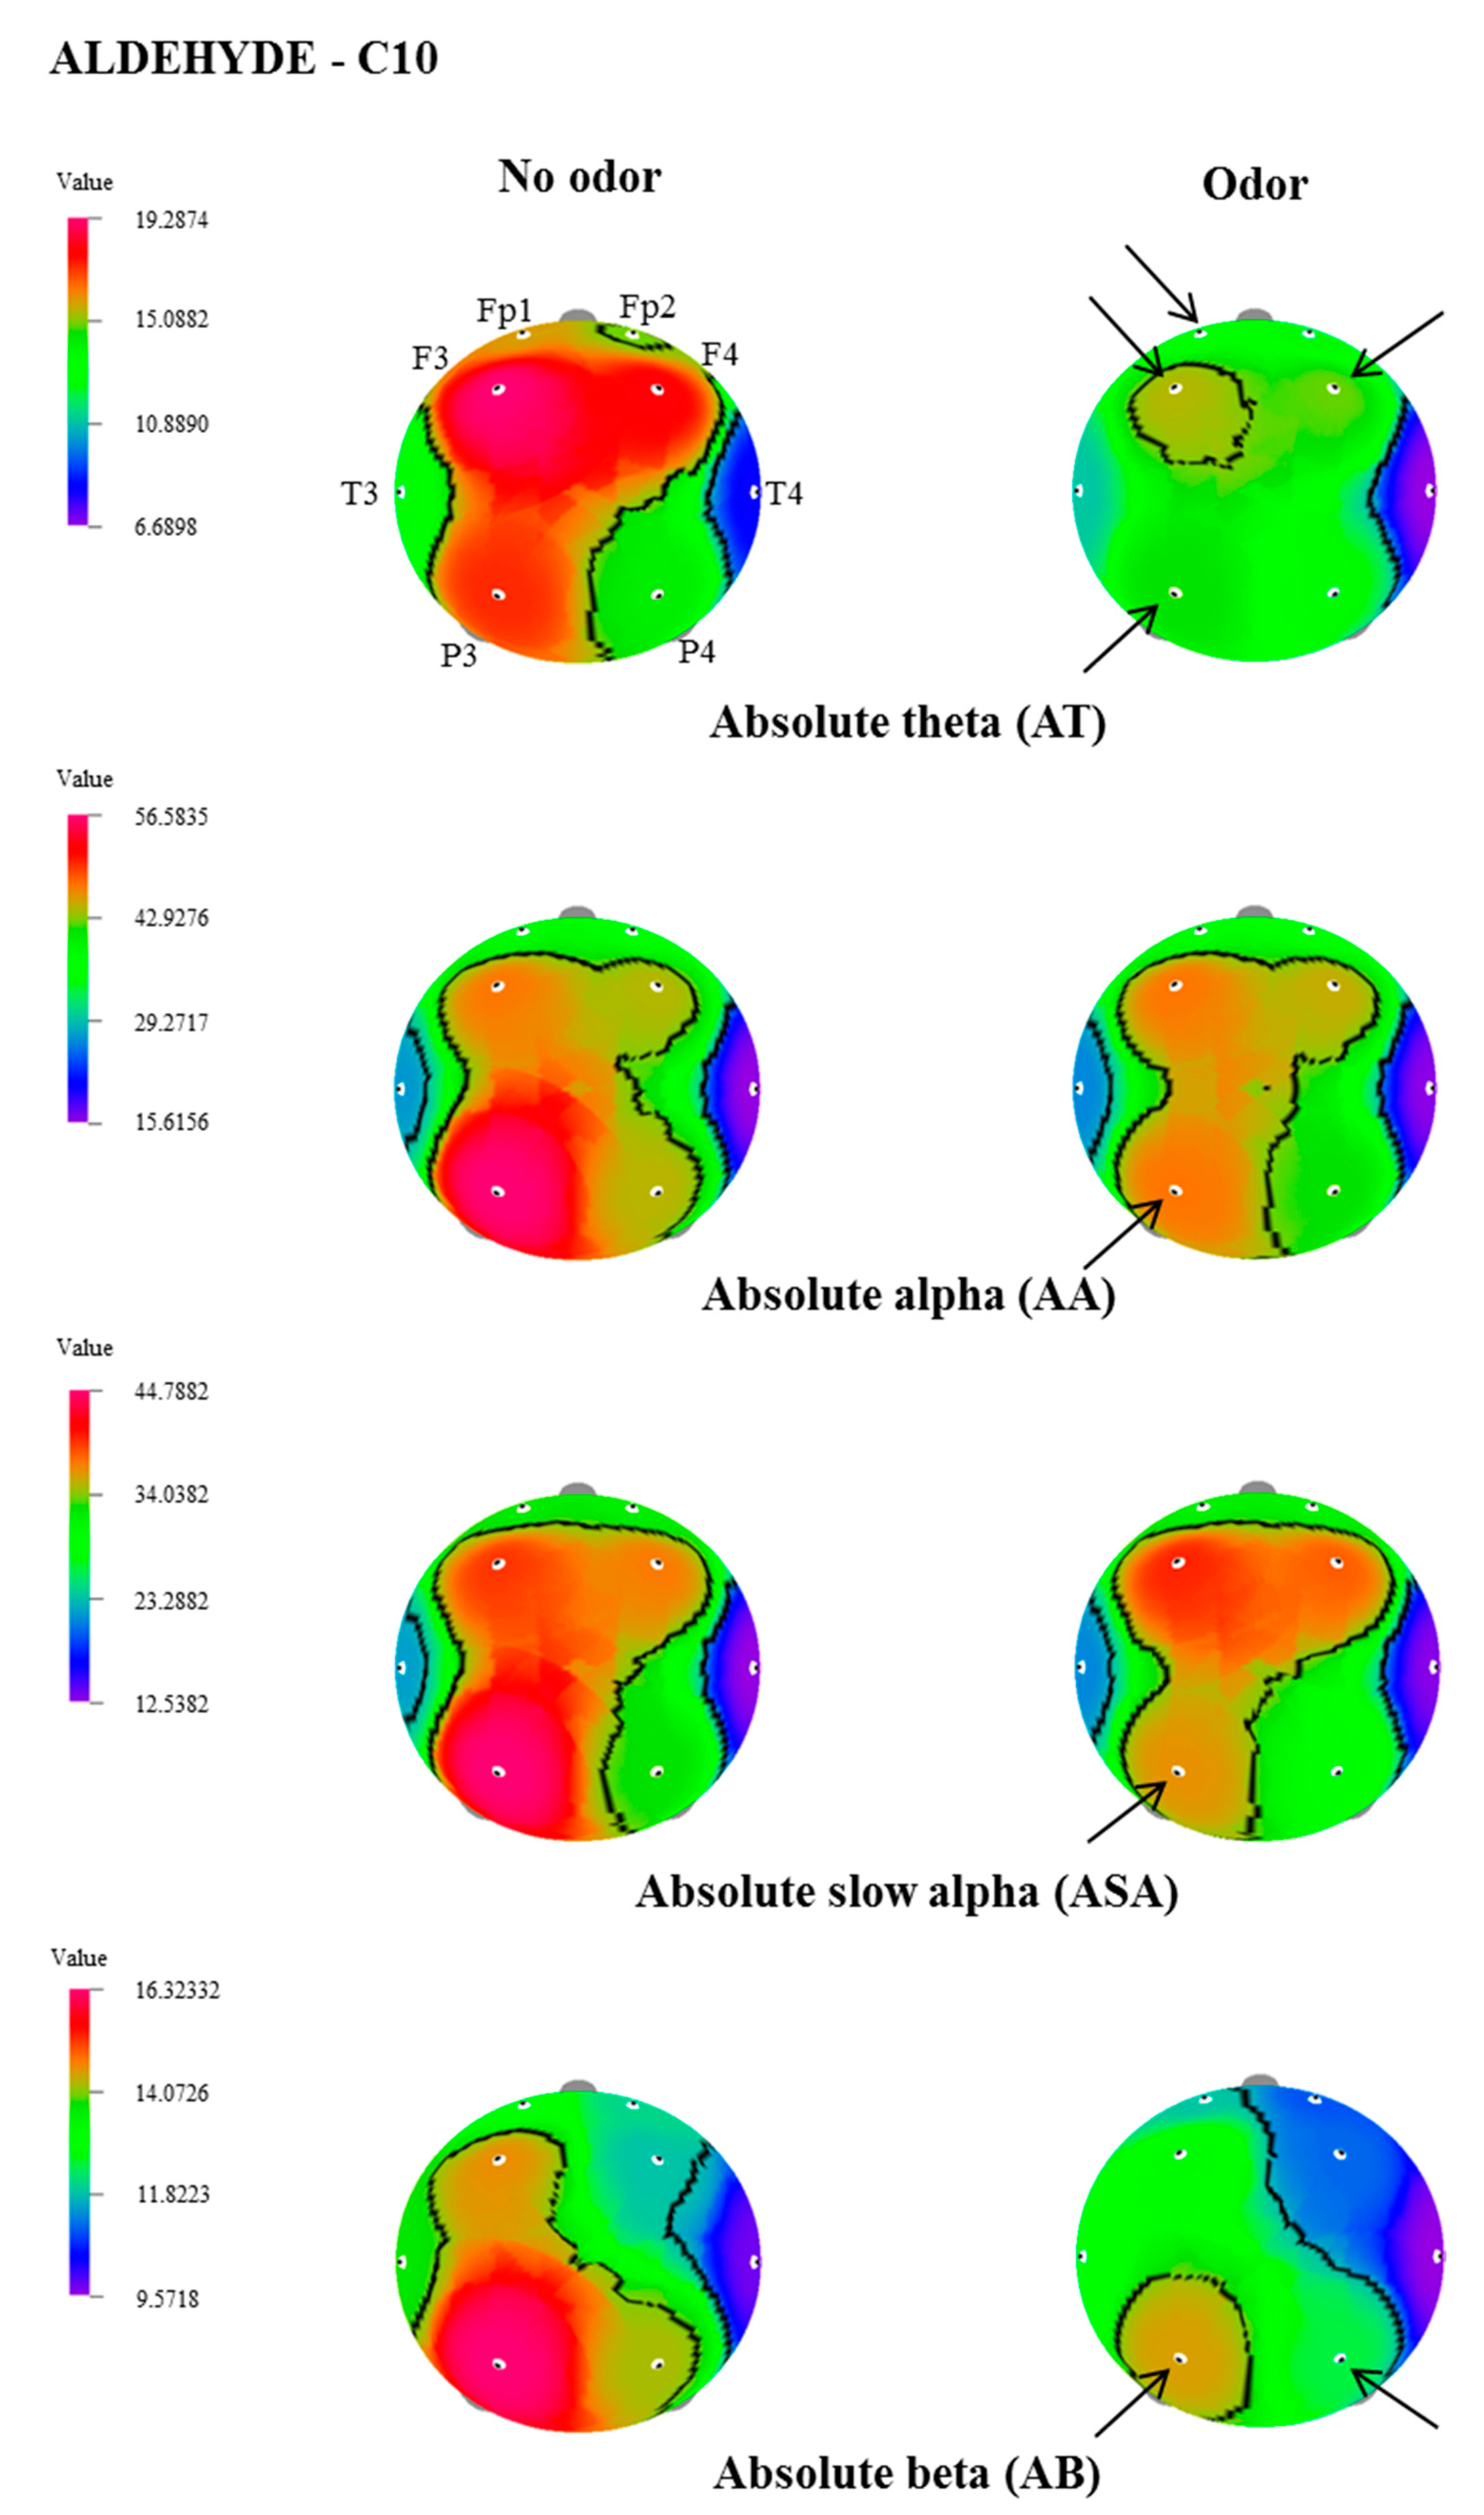
| EEG Indices | Site | No Odor Exposure (µV2) | Odor Exposure (µV2) | t-Test | p Value * |
|---|---|---|---|---|---|
| AT | Fp1 | 15.8579 ± 2.6 | 13.2670 ± 1.7 | 2.153 | 0.044 |
| F3 | 19.2875 ± 3.2 | 15.4492 ± 2.0 | 2.649 | 0.016 | |
| F4 | 18.0308 ± 3.4 | 14.9039 ± 2.2 | 2.113 | 0.048 | |
| P3 | 17.3454 ± 2.8 | 14.5731 ± 1.9 | 2.363 | 0.029 | |
| AA | P3 | 56.5838 ± 9.7 | 47.2791 ± 8.3 | 2.318 | 0.032 |
| ASA | P3 | 44.8242 ± 8.9 | 36.4876 ± 7.6 | 2.273 | 0.035 |
| AB | P3 | 16.3236 ± 1.8 | 14.4824 ± 1.6 | 3.216 | 0.005 |
| P4 | 14.2120 ± 1.5 | 12.4604 ± 1.2 | 3.049 | 0.007 | |
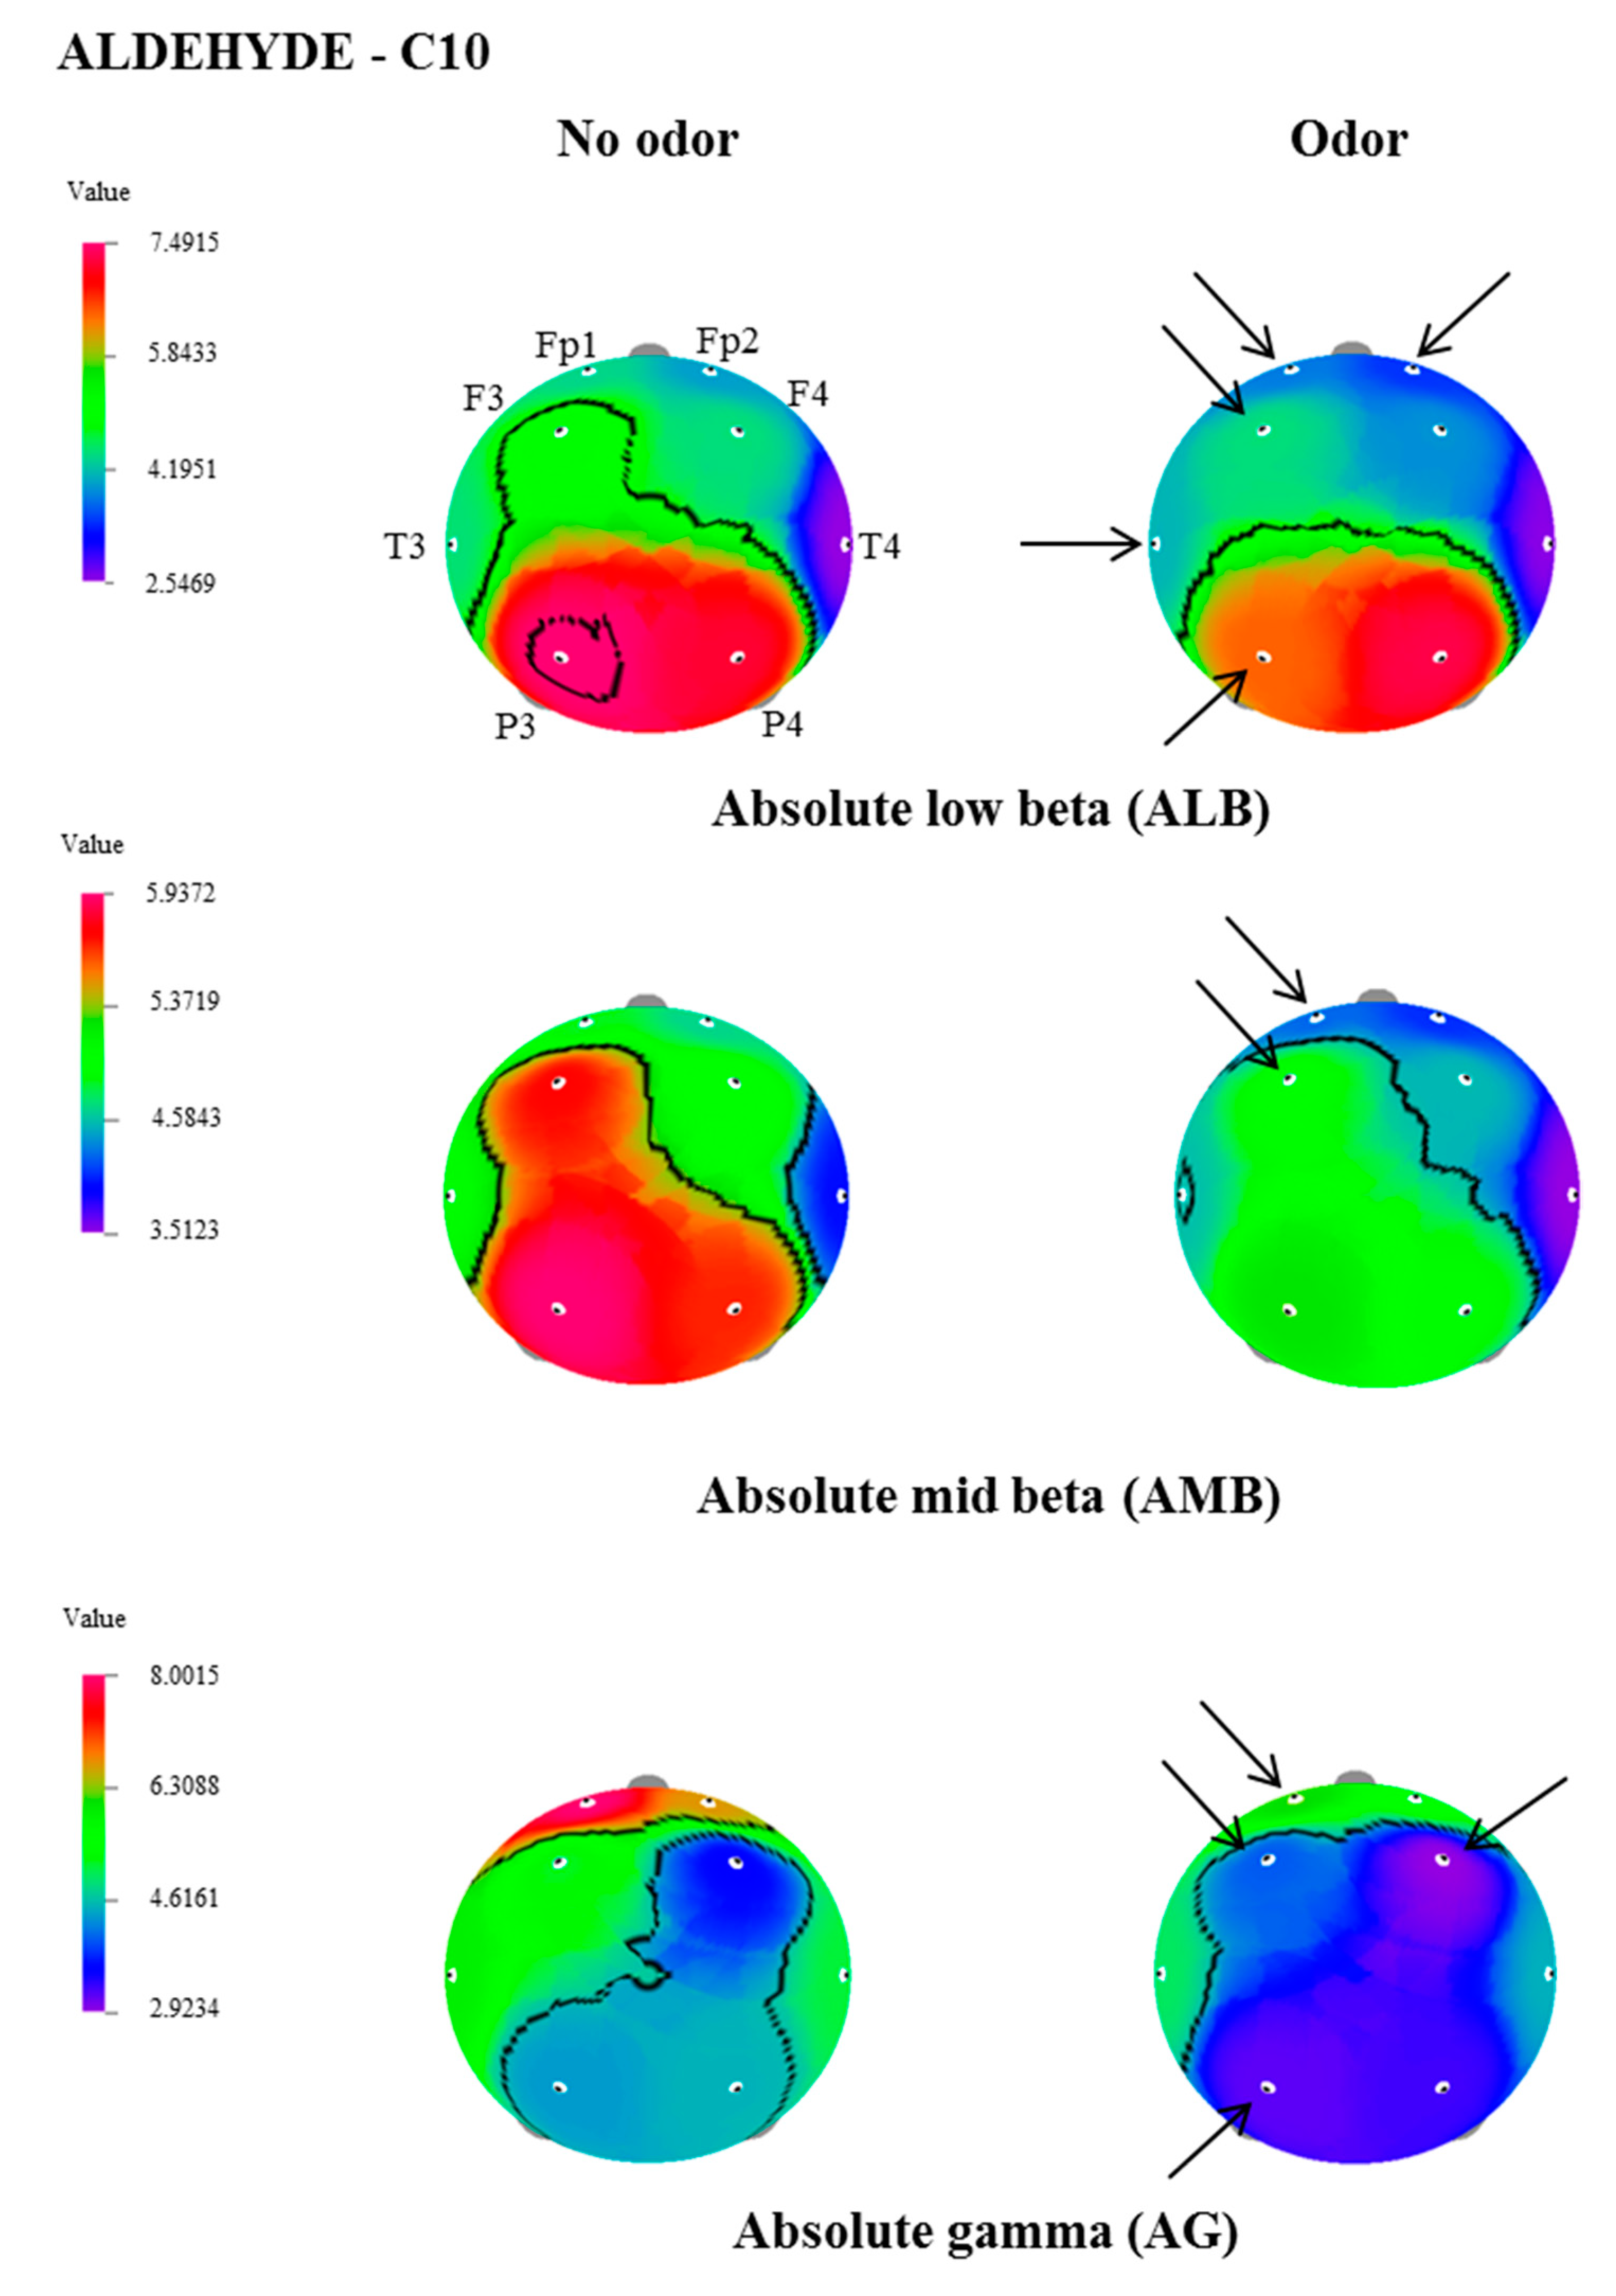
| ALB | Fp1 | 4.3595 ± 0.6 | 3.7719 ± 0.5 | 2.367 | 0.029 |
| F3 | 5.1939 ± 0.7 | 4.4375 ± 0.5 | 2.213 | 0.039 | |
| AMB | Fp1 | 4.4511± 0.4 | 3.7999 ± 0.3 | 3.142 | 0.005 |
| Fp2 | 4.0911 ± 0.4 | 3.6095 ± 0.3 | 2.380 | 0.028 | |
| F3 | 5.3220 ± 0.6 | 4.5441 ± 0.4 | 2.231 | 0.038 | |
| T3 | 4.8826 ± 0.5 | 4.3729 ± 0.5 | 2.541 | 0.020 | |
| P3 | 5.8663± 0.7 | 5.2261 ± 0.6 | 2.409 | 0.026 | |
| AG | Fp1 | 8.0015 ± 1.0 | 6.1253 ± 0.8 | 2.821 | 0.011 |
| F3 | 5.1881 ± 0.7 | 4.0128 ± 0.5 | 2.493 | 0.022 | |
| F4 | 3.5508 ± 0.6 | 2.9234 ± 0.4 | 2.188 | 0.041 | |
| P3 | 4.3676 ± 0.7 | 3.1706 ± 0.4 | 2.204 | 0.040 |
© 2019 by the authors. Licensee MDPI, Basel, Switzerland. This article is an open access article distributed under the terms and conditions of the Creative Commons Attribution (CC BY) license (http://creativecommons.org/licenses/by/4.0/).
Share and Cite
Kim, M.; Sowndhararajan, K.; Choi, H.J.; Park, S.J.; Kim, S. Olfactory Stimulation Effect of Aldehydes, Nonanal, and Decanal on the Human Electroencephalographic Activity, According to Nostril Variation. Biomedicines 2019, 7, 57. https://doi.org/10.3390/biomedicines7030057
Kim M, Sowndhararajan K, Choi HJ, Park SJ, Kim S. Olfactory Stimulation Effect of Aldehydes, Nonanal, and Decanal on the Human Electroencephalographic Activity, According to Nostril Variation. Biomedicines. 2019; 7(3):57. https://doi.org/10.3390/biomedicines7030057
Chicago/Turabian StyleKim, Minju, Kandhasamy Sowndhararajan, Hae Jin Choi, Se Jin Park, and Songmun Kim. 2019. "Olfactory Stimulation Effect of Aldehydes, Nonanal, and Decanal on the Human Electroencephalographic Activity, According to Nostril Variation" Biomedicines 7, no. 3: 57. https://doi.org/10.3390/biomedicines7030057