Article

GJA1/CX43 High Expression Levels in the Cervical Spinal Cord of ALS Patients Correlate to Microglia-Mediated Neuroinflammatory Profile

1
Department of Biomedical and Biotechnological Sciences, Section of Physiology, School of Medicine, University of Catania, 95125 Catania, Italy
2
Department of Biomedical and Biotechnological Sciences, Section of Anatomy, Histology and Movement Sciences, School of Medicine, University of Catania, 95125 Catania, Italy
3
Department of Biomedical and Biotechnological Sciences, Section of Biochemistry, School of Medicine, University of Catania, 95125 Catania, Italy
4
Department of Chemical, Biological, Pharmaceutical and Environmental Sciences, University of Messina, 98166 Messina, Italy
*
Authors to whom correspondence should be addressed.
Biomedicines 2022, 10(9), 2246; https://doi.org/10.3390/biomedicines10092246
Submission received: 14 August 2022 / Revised: 4 September 2022 / Accepted: 7 September 2022 / Published: 10 September 2022
(This article belongs to the Special Issue Mechanisms Leading to Neurodegeneration in the ALS and FTD Spectrum)

Abstract

:
Amyotrophic lateral sclerosis (ALS) is a progressive neurodegenerative disorder affecting motoneurons (MNs) with a fatal outcome. The typical degeneration of cortico-spinal, spinal, and bulbar MNs, observed in post-mortem biopsies, is associated with the activation of neuroimmune cells. GJA1, a member of the connexins (Cxs) gene family, encodes for connexin 43 (Cx43), a core gap junctions (GJs)- and hemichannels (HCs)-forming protein, involved in cell death, proliferation, and differentiation. Recently, Cx43 expression was found to play a role in ALS pathogenesis. Here, we used microarray and RNA-seq datasets from the NCBI of the spinal cord of control (NDC) and ALS patients, which were stratified according to the GJA1 gene expression. Genes that positively or negatively correlated to GJA1 expression were used to perform a genomic deconvolution analysis (GDA) using neuroimmune signatures. Expression analysis revealed a significantly higher GJA1 expression in the MNs of ALS patients as compared to NDC. Gene deconvolution analysis revealed that positively correlated genes were associated with microglia activation, whereas negatively correlated genes were associated with neuronal activation profiles. Moreover, gene ontology analysis, performed on genes characterizing either microglia or neuronal signature, indicated immune activation or neurogenesis as main biological processes. Finally, using a synthetic analysis of drugs able to revert the GJA1 transcriptomic signatures, we found a specific drug profile for ALS patients with high GJA1 expression levels, composed of amlodipine, sertraline, and prednisolone. In conclusion, our exploratory study suggests GJA1 as a new neuro-immunological gene correlated to microglial cellular profile in the spinal cord of ALS patients. Further studies are warranted to confirm these results and to evaluate the therapeutic potential of drugs able to revert typical GJA1/CX43 signature in ALS patients

1. Introduction

Inflammation and reactive glial activation are common hallmarks of degenerative disease [1]. Thus, understanding the overall biological mechanisms underlying triggering factors and potential strategies to modulate glial phenotype are of significant importance in this field [1]. Amyotrophic lateral sclerosis (ALS) is a progressive neurodegenerative disease affecting upper and lower motoneurons (MNs) [1]. Whether loss of function is a direct consequence of neuronal loss, their susceptibility and vulnerability are closely linked to resident glial cell and immune cell activation and neurotoxic potential [1,2].
Neuroglial cross-talk in the central nervous system (CNS) microenvironment are on the spotlight given their contribution to either neuronal suffering and degeneration or, vice versa, as an exploitable biological tool to counteract chronicization and disease progression, favouring either self or exogenous regenerative mechanisms [3]. Intercellular communication and ion channels establish a delicate balance of fundamental importance to maintain tissue homeostasis in adult life and to coordinate patterning during development, whereby their dysfunction irreversibly leads to functional impairment and cell suffering [4]. Disruption of such a delicate balance irreversibly leads to functional impairment and cell suffering, particularly in the CNS [5]. Recent evidence supports the hypothesis of a significant involvement of connexins (CXs)-based channels in the progression and chronicization of inflammatory and degenerative diseases, including multiple sclerosis (MS), Alzheimer’s disease (AD), Parkinson’s disease (PD), and amyotrophic lateral sclerosis (ALS) [6,7,8,9,10,11]. Exchanges of small molecules, metabolites and energy substrates are guaranteed and regulated by gap junctions (GJs) and hemichannels (HCs), composed by CXs, which form transmembrane pores between adjacent cells or between the intracellular and extracellular compartment, respectively [5]. CXs are the core GJs and HCs forming proteins. Six units of CXs form a HC and two docked HCs form a GJ. Such structures are usually aggregated in defined plasma membrane areas called plaques, rapidly assembled and remodelled [5]. In the CNS, GJs and HCs would exert significant effects on neuronal function, astrocytes reactive activation, microglia inflammatory polarization, and neurovascular modulation [12,13,14,15].
A plethora of data have defined the role of CXs signature of glial cell populations to critically influence the working microenvironment of neurons, affecting neuronal homeostasis and plasticity [16]. Astrocytes mainly express CX43, encoded by GJA1, largely involved in maintaining intercellular cross-talk and energy metabolism in physiological conditions, whereas it has been found to sustain degenerative and reactive chronic astroglial activation in pathological conditions [16,17]. Although to a lower level, astrocytes also express CX30, encoded by GJB6, and CX26, encoded by GJB2, critically linked to GJs and HCs formation in degeneration and neurotoxic conditions [18,19]. Microglia, the resident myeloid inflammatory cells of the CNS, express CXs depending on their resting or activated profile [20]. In particular, CX43 plays an important role in mediating heterocellular coupling with astrocytes or neurons [21]. It has been reported that CX43 increase associated with high levels of CX32, encoded by GJB1, and CX36, encoded by GJD2, play a role in the inflammatory polarization of microglia and in the activation of neurotoxic signals [22,23,24]. In fact, in similar conditions, the increase of CX32- and CX43-HCs, allowing the release of neurotoxic levels of glutamate and ATP, modifies the composition of the CNS microenvironment, inducing inflammatory and/or degenerative conditions [23,25,26]; at the same time, CX36, mainly forming heterocellular GJs with neurons, may represent a mechanism for transferring death signals from microglia to neurons [27]. In particular, we recently reported a leading role of either CX43-based HCs and CX43-based GJs in modulating the intercellular network in CNS, thus influencing the operating nervous environment [28,29].
Herein, we used a microarray datasets-based analysis of human brain biopsies from the spinal cord of ALS patients to correlate GJA1 expression and ALS progression and pathological features. Our analysis also aimed at uncovering GJA1 biological functions in ALS pathogenesis and the involved biological signalling pathways correlating with higher GJA1 expression levels in the ALS spinal cord.

2. Materials and Methods

2.1. Daset Selection

The NCBI Gene Expression Omnibus (GEO) database (http://www.ncbi.nlm.nih.gov/geo/, 5 September 2022) was used to select transcriptome datasets of interest [30]. Mesh terms “amyotrophic lateral sclerosis”, “spinal cord”, and “human” were used to identify the potential datasets to select. We sorted the datasets by the number of samples (high to low), and by the clinical data. The datasets were selected following the criteria exposed in the section “Clinical and pathological criteria”. We selected two datasets showed in Table 1.

2.2. Sample Stratification

Microarray datasets from biopsies of NDC and of ALS patients were collected.
As reported by the original authors of the GSE26927, the dataset was composed of 19 dissected snap-frozen cervical spinal cord (<100 mg) of control not ALS affected (NDC = 9) and affected by sporadic Amyotrophic lateral sclerosis (ALS = 10). Complete experimental details are available in the reference publication [31].
Regarding the GSE76220, we obtained the data from RNA-sequencing (RNA-seq) belonging to ALS gene-expression signatures in laser capture micro-dissected (LCM) MNs from post-mortem spinal cords. LCM of spinal cord sections from 10 sporadic ALS patients and 9 controls (NDC) was performed, total RNA was extracted and RNA-seq libraries were sequenced on Illumina GA II platform [32]. Furthermore, by stratifying the ALS patients from GSE26927 according to GJA1 expression levels, as a subset signature, we found that 2542 unique genes (including GJA1) were significantly positively correlated (GSPC) (r-range from 0.50 to 0.94) and 3110 unique genes were significantly negatively correlated (GSNC) (r-range from −0.50 to −0.96) to GJA1 expression levels (Table 2 and supplementary Table S1).

2.3. Clinical and Pathological Criteria

Analyzed samples coming from spinal cord biopsies were collected immediately after surgery and stored at −80 °C until use. Sample selection was made by original authors taking into account sample pH and RNA integrity number (RIN). All patients included in this study signed an informed consent and the study was approved by the medical ethics committees of all sites [31,32].

2.4. Data Processing and Experimental Design

A MultiExperiment Viewer (MeV) software (The Institute for Genomic Research (TIGR), J. Craig Venter Institute, La Jolla, CA, USA) was used to process and identify Significantly Different Expressed Genes (SDEG) within the datasets. When multiple gene probes were found with the same GeneID NCBI, those with the highest variance were used.
With the aim of identifying genes commonly modulated between the GSE datasets present in Table 1 and cell type-specific genes for brain cells, we performed a Venn diagram analysis, using the web-based utility Venn Diagram Generator (http://bioinformatics.psb.ugent.be/webtools/Venn/, 5 September 2022) [33,34]. For the microarray dataset, we also performed a statistical analysis with GEO2R, applying a Benjamini–Hochberg false discovery rate test [35,36,37].
Gene ontology (GO) analysis was performed using the web utility GeneMANIA (http://genemania.org/, 5 September 2022) [38], STRING (https://string-db.org/, 5 September 2022) [39], and the GATHER (Gene Annotation Tool to Help Explain Relationships) (http://changlab.uth.tmc.edu/gather/, 5 September 2022) [40]. The GeneMANIA was also used for building the weighted gene networks commonly modulated, rendered by CorelDRAW2020 (Corel Corporation, Ottawa, ON, Canada). CIRCOS was used to plot the GO analysis (http://mkweb.bcgsc.ca/tableviewer/, 5 September 2022) [41].
Additionally, publicly available RNA-seq data were used to carry out a panel of cell-tissue-specific genes; namely, astrocytes (n = 191), endothelial cells (endotheliocytes) (n = 76), neurons (n = 1032), microglia (n = 118), and oligodendrocytes (n = 111) [42]. From GSE46236, we sorted the SDEG of pericyte inflammatory (n = 333) [43].
Furthermore, we decided to deepen the analysis including the immune system cellular profiles, consisting of classical natural killer (NK) (n = 125), CTLs (n = 62), T helper cell type 1 (Th1) (n = 221) and 2 (Th2) (n = 98), obtained from the GSE22886 and two populations of macrophages, classical and alternative activated, macrophages M1 (n = 823) and macrophages M2 (n = 160) from GSE5099. The immune-cell GSE22886 dataset was composed by isolated 12 different types of human leukocytes from peripheral blood and bone marrow. In order to obtain the genes characterizing these cells, we have excluded all significant genes in common between all types of human leukocytes and successively, we selected only genes that were mutually and exclusively significantly up-regulated [34,44].
The web utility AmiGO 2 (http://amigo.geneontology.org/amigo/landing, 5 September 2022) [45,46] was used to define genes closely linked to the process synaptic transmission genes (n = 45) (GO:0099564). In order to identify genes involved in this process, results were filtered using the following parameters: organism, mammalian-type of sources, gene-evidence type, experimental.
Lastly, in an effort to broaden the results of our analysis, we downloaded data related to different biological processes from the Kyoto Encyclopedia of Genes and Genomes (KEGG) database: host–virus interaction (279), inflammatory response (704), and Synaptic Vesicle Cycle (78). KEGG is a database that contains information related to the biological system, such as cell, organism, and ecosystem, from molecular-level information. We selected the following biological processes: cholinergic synapse, and synaptic vesicle cycle (https://www.genome.jp/kegg/, 5 September 2022) [47,48,49].

2.5. Drugs Analysis Prediction (DAP)

To identify potential pharmacological agents for ALS patients according to sex and GJA1 expression levels, we used the L1000fwd, Large Scale Visualization of Drug Induced Transcriptomic Signatures web-based utility (https://maayanlab.cloud/L1000FWD/, 5 September 2022) [50]. L1000fwd calculates the similarity between an input gene expression signature and the LINCS-L1000 data, in order to rank drugs potentially able to reverse the transcriptional signature [50]. An adjusted p-value (q-value) of 0.05 has been considered as threshold for statistical significance. Combined score (CS) is calculated by multiplying the logarithm of the p-value from the Fisher exact test and the Z-score as a composite index:
C = z × l o g 10   ( p )

2.6. Statistical Analysis

Statistical analysis was performed using Prism 9 software (GraphPad Software, La Jolla, CA, USA). Exact hypergeometric probability was used to calculate statistically significant differences of intersection between 2 lists of genes. The representation factor (RF) shows whether genes from one list (list A) are enriched in another list (list B), assuming that genes behave independently. The RF is defined as (number of genes in common between both lists) (number of genes in the genome)/(number of genes in list A) (number of genes in list B). RF > 1 indicates more overlap than expected between the two independent groups, a RF < 1 indicates less overlap than expected, and a RF of 1 indicates that the two groups are identical by the number of genes expected to be independent in the groups.
T h e   r e p r e s e n t a t i o n   f a c t o r = x ÷ e x p e c t e d   #   o f   g e n e s
E x p e c t e d   #   o f   g e n e s = ( n × D ) ÷ N
The probability of finding x overlapping genes can be calculated using the hypergeometric probability formula:
P r o b a b i l i t y   o f   o v e r l a p p i n g = C ( D ,   x ) × C ( N D ,   n x ) ÷ C ( N , n )
where x = # of genes in common between two groups; n = # of genes in group 1; D = # of genes in group 2; N = total genes, in this case 20,203 genes (RefSeq, a database run by the US National Center for Biotechnology Information (NCBI)); C (a,b) is the number of combinations of a thing taken ‘b’ at ‘a’ time [51,52].
Ordinary one-way Analysis of Variance (ANOVA) followed by Tukey’s multiple comparisons test was used to assess statistical differences between groups and correlations were assessed using Pearson correlation test. Differences between groups were considered as statistically significant with adjusted p value < 0.05.
All data used in the present study were transformed for the analysis in Z-score intensity signal. Z score was constructed by taking the ratio of weighted mean difference and combined standard deviation according to Box and Tiao (1992) [53].
The efficiency of each biomarker was assessed by the receiver operating characteristic (ROC) curve analyses. Nonparametric ROC curves analyzed NDC versus ALS. The area under the ROC curve (AUC) and its 95% confidence interval indicates diagnostic efficiency. The accuracy of the test with the percent error is reported [54].

3. Results

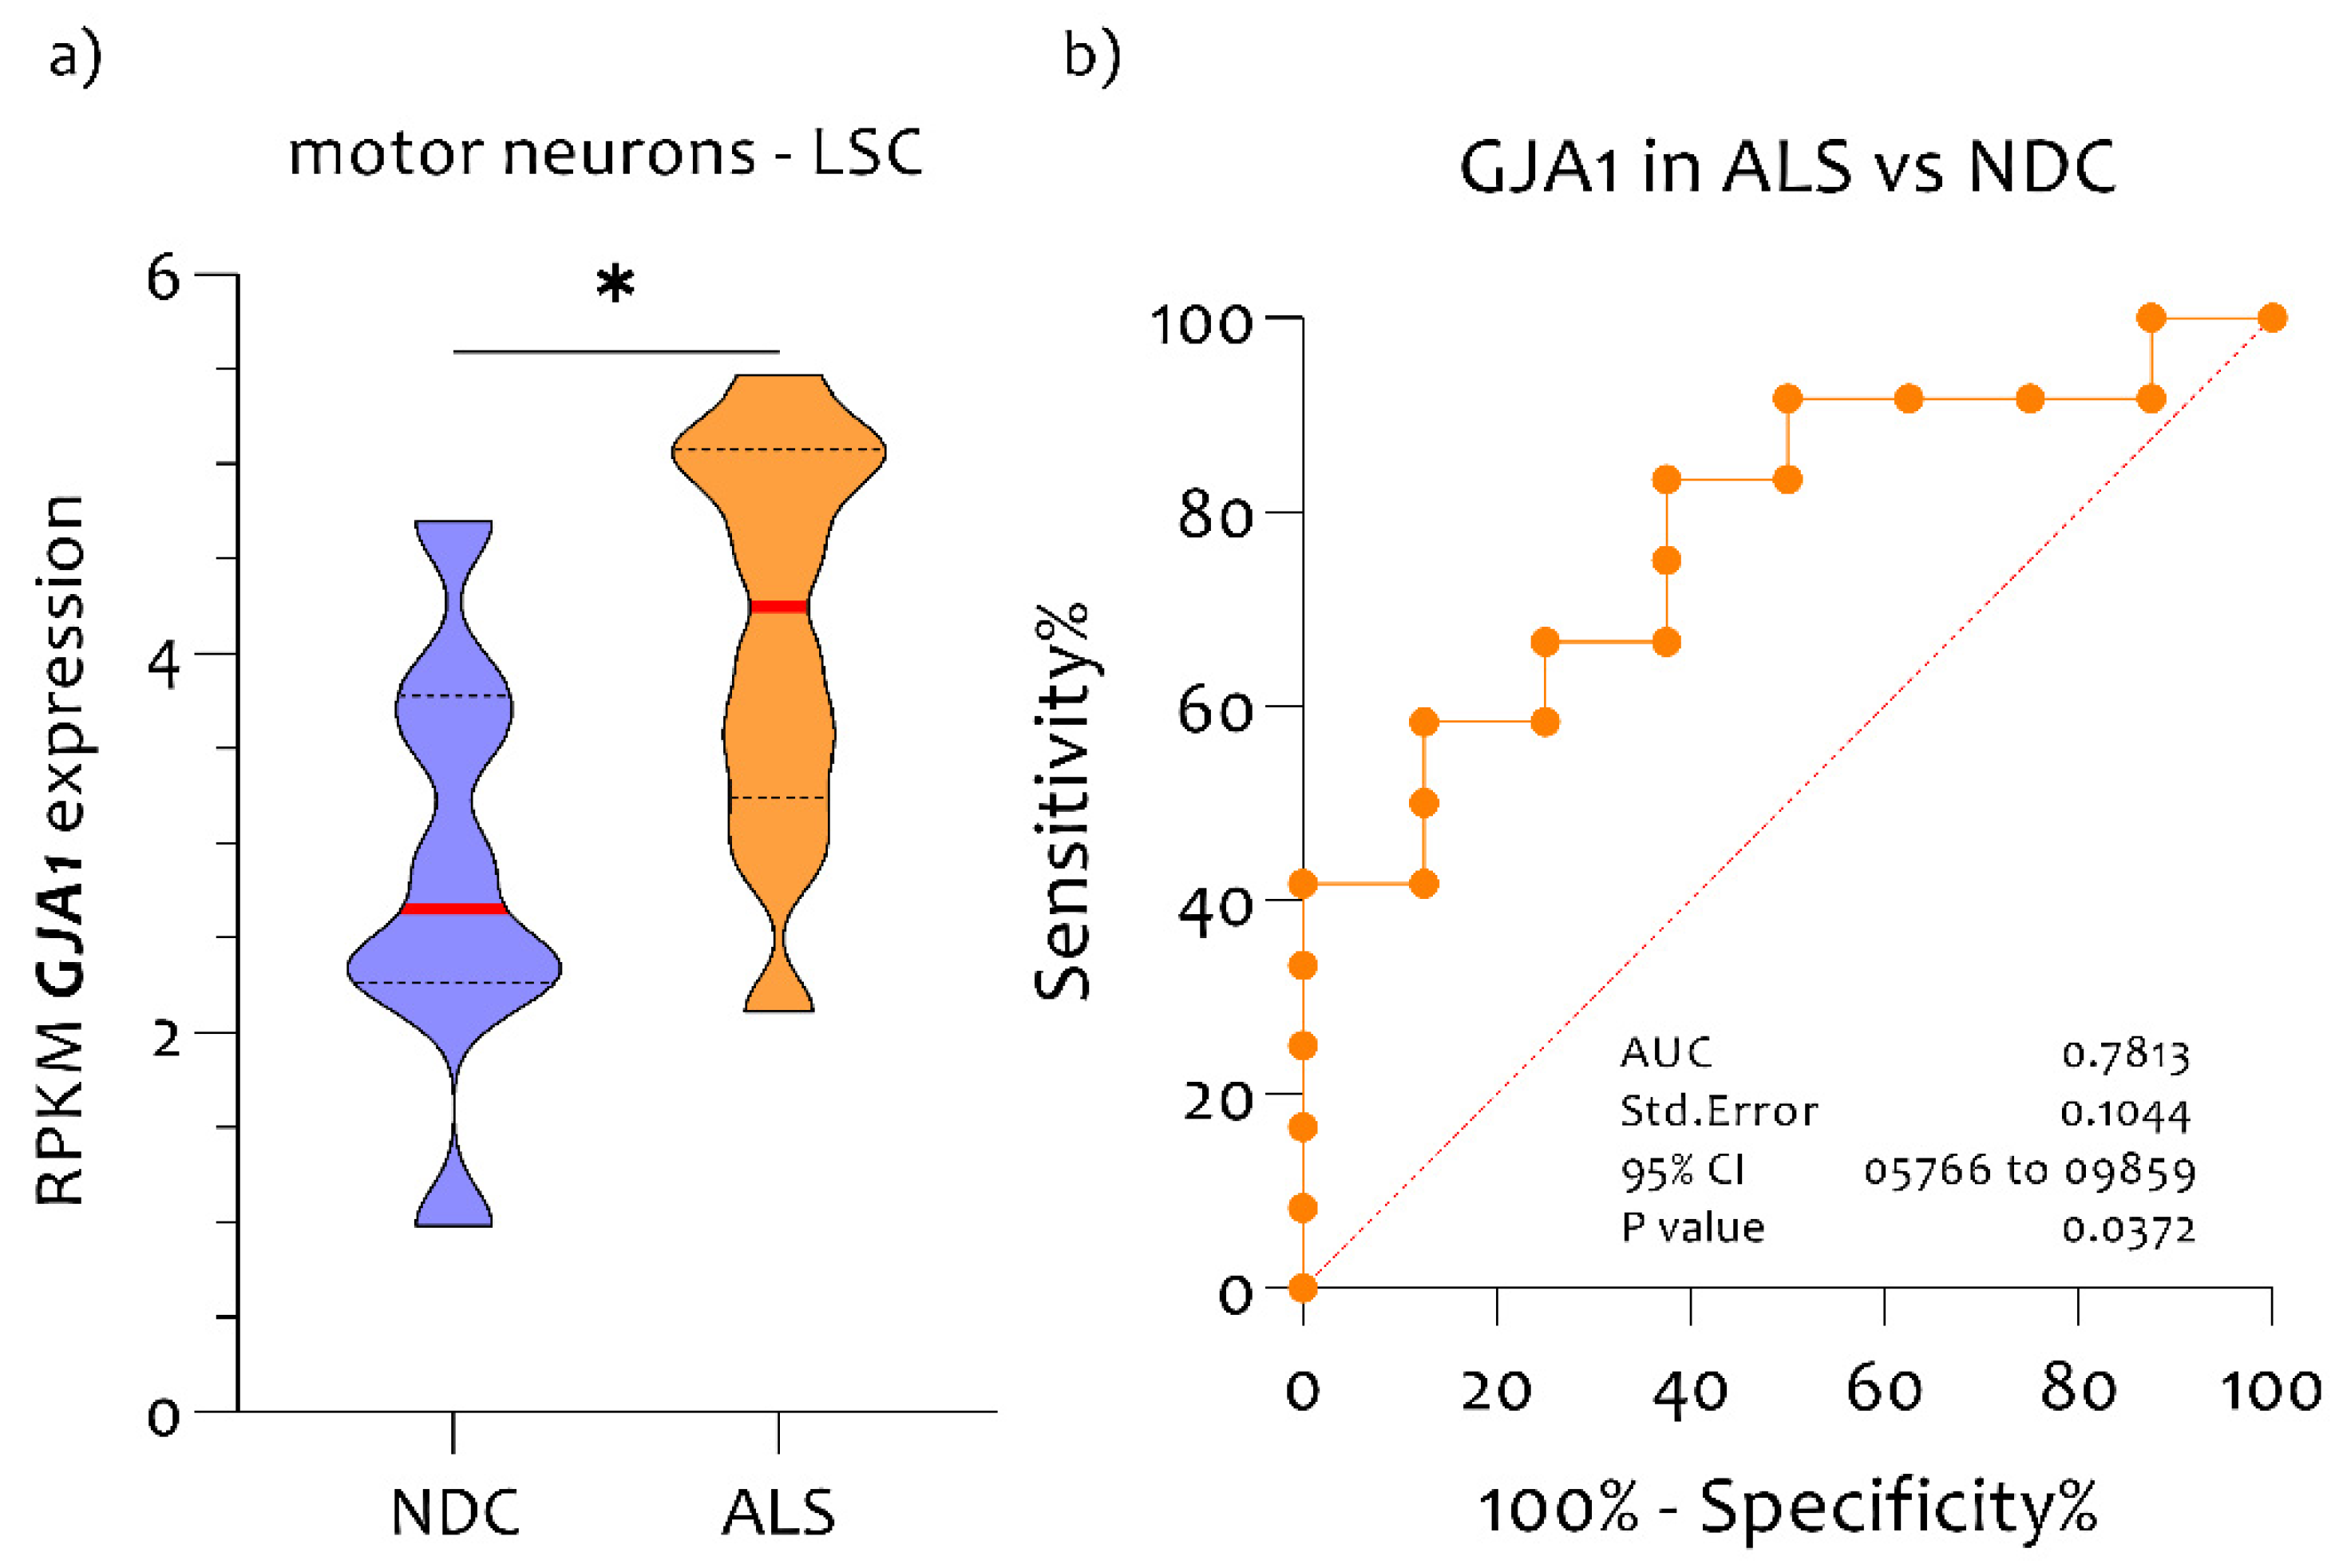
3.1. High Expression Levels of GJA1 in MNs of ALS Patients Compared to NDC

GJA1 expression analysis on LCM dissected MNs from post-mortem spinal cords revealed a significant increase in RNA expression levels in ALS patients compared to NDC subjects (p = 0.023) (Figure 1a). To evaluate the potential diagnostic ability of GJA1 to discriminate between ALS patients to NDC subjects, we applied a receiver operating characteristic (ROC) analysis. GJA1 expressed a good diagnostic ability to discriminate NDC from ALS in spinal cord (AUC = 0.7813, p = 0.037) (Figure 1b).

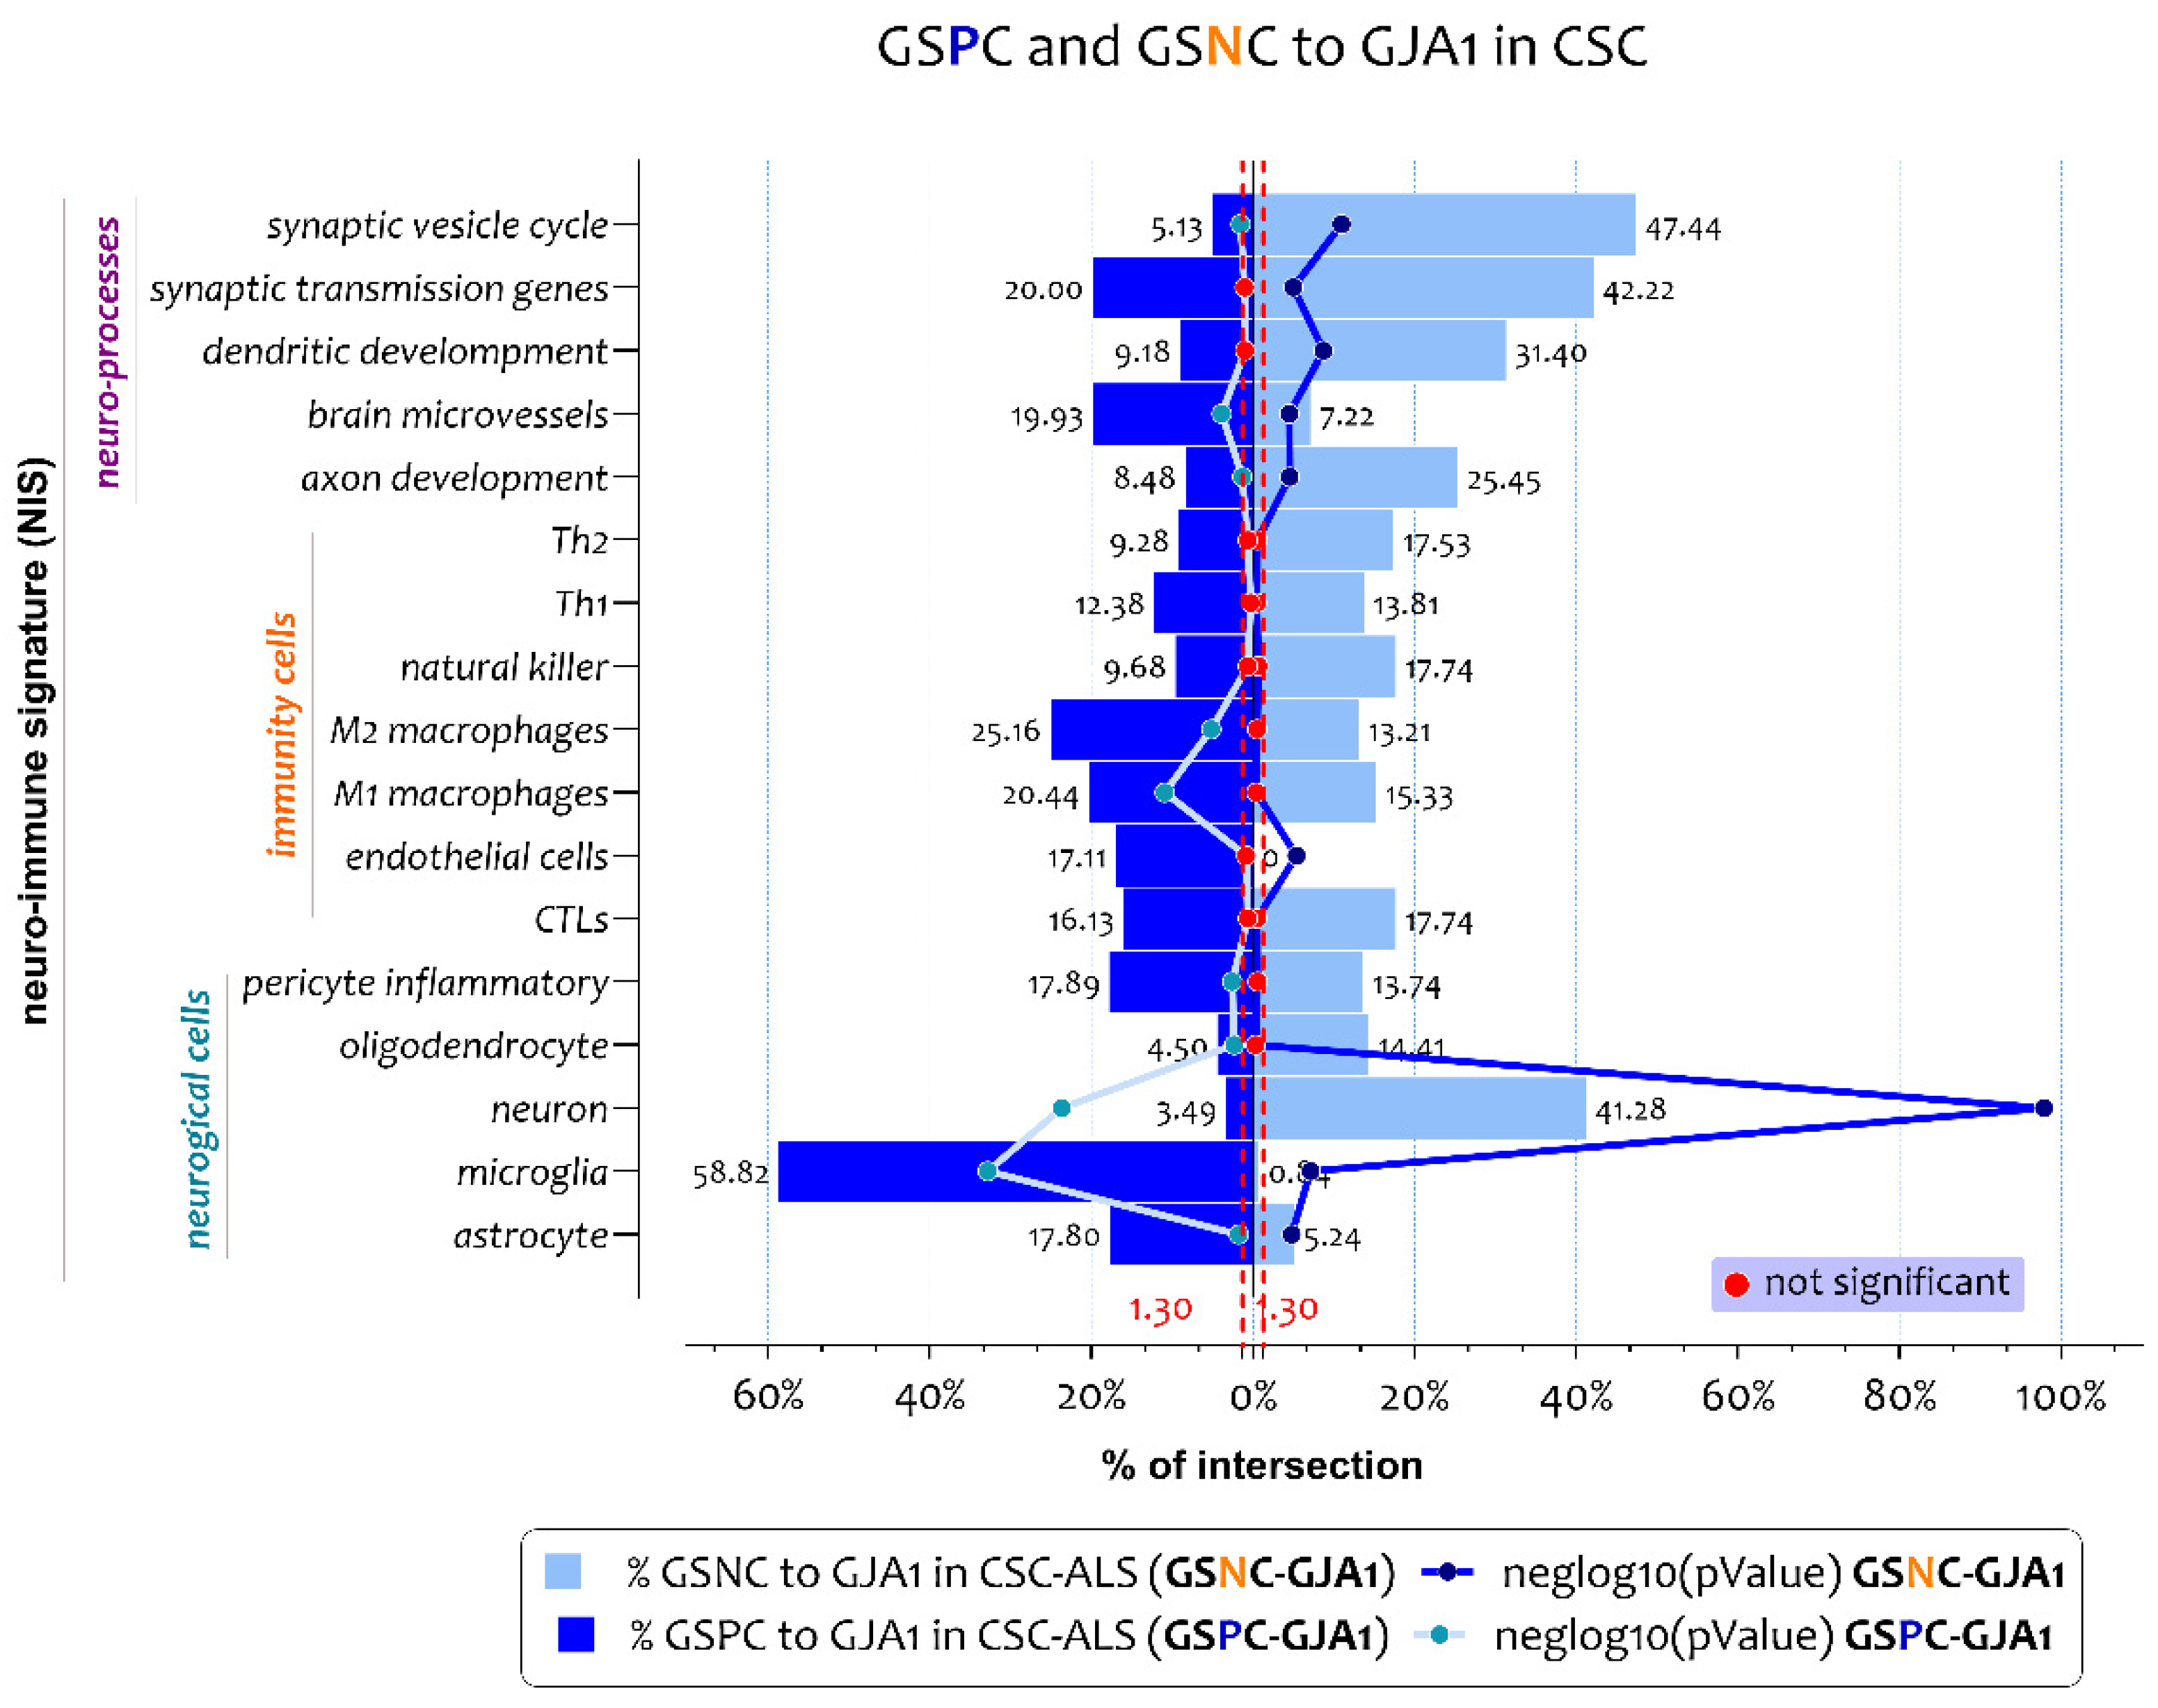
3.2. ALS Patients Exhibit Different Neuro-Immune Cellular Profile According to GJA1 Expression Levels

We conducted a genomic deconvolution analysis (GDA) using neuro-immune signatures obtained from GEO Datasets, KEGG, and AmiGo (Table 3). Cell signatures covered five neurological, seven immune cells populations, and five biological processes, as described in the Section 2.
We intersected the gene lists that characterize the neuro-immune signatures to the gene lists significantly positively and negatively correlated to GJA1 expression levels in spinal cord of ALS patients (Figure 2 and supplementary Table S1).
Neuro-immune signature-weighted GDA showed that genes positively correlated to the GJA1 expression levels (GSPC-GJA1) were closely related to the neuro-immune inflammatory profile (Figure 2). In particular, the list of GSPC-GJA1 significant intersections with neuroimmune signatures were highlighted for the cellular signatures of the microglia (n gene = 70, n% = 58, neglog10 (p-value) = 32.83, RF = 4.77), astrocyte (n gene = 34, n% = 17.80, neglog10 (p-value) = 1.76, RF = 1.44), pericyte inflammatory (n gene = 56, n% = 17.89, neglog10 (p-value) = 2.59, RF = 1.45), M1-macrophages (n gene = 168, n% = 20.43, neglog10 (p-value) = 10.92, RF = 1.65), M2-macrophages (n gene = 40, n% = 25.15, neglog10 (p-value) = 5.11, RF = 2.40), and brain microvessels (n gene = 58, n% = 19.83, neglog10 (p-value) = 3.87, RF = 1.61) (Figure 2, Figure 3a and supplementary Table S1). Regarding the excluded neuro-immune signature, such as oligodendrocyte, neuron, axon development, and synaptic vesicle cycle, the RF value was < 1, so the intersections differed significantly from the individual processes (Figure 2, Figure 3a and supplementary Table S1).
We performed a neuro-immune signature-weighted GDA using the genes negatively correlated to GJA1 expression levels (GSNC-GJA1) in the spinal cord of ALS patients (Figure 2 and supplementary Table S1). The analysis highlighted that negatively correlated genes to the GJA1 expression levels delineated a neuro-protective profile. In particular, we showed significative intersections for the signatures of neuron (n gene = 486, n% = 41.27, neglog10 (p-value) = 97.85, RF = 2.74), axon development (n gene = 57, n% = 25.44, neglog10 (p-value) = 4.51, RF = 1.69), dendritic development (n gene = 65, n% = 31.40, neglog10 (p-value) = 8.70, RF = 2.08), synaptic transmission genes (n gene = 19, n% = 42.22, neglog10 (p-value) = 4.99, RF = 2.80), and synaptic vesicle cycle (n gene = 37, n% = 47.43, neglog10 (p-value) = 10.92, RF = 3.15) (Figure 2, Figure 3b and supplementary Table S1). Regarding the excluded neuro-immune signature, such as astrocyte, microglia, endothelial cells, and brain microvessels, the RF value was < 1, so the intersections differed significantly from the individual processes (Figure 2, Figure 3b and supplementary Table S1).

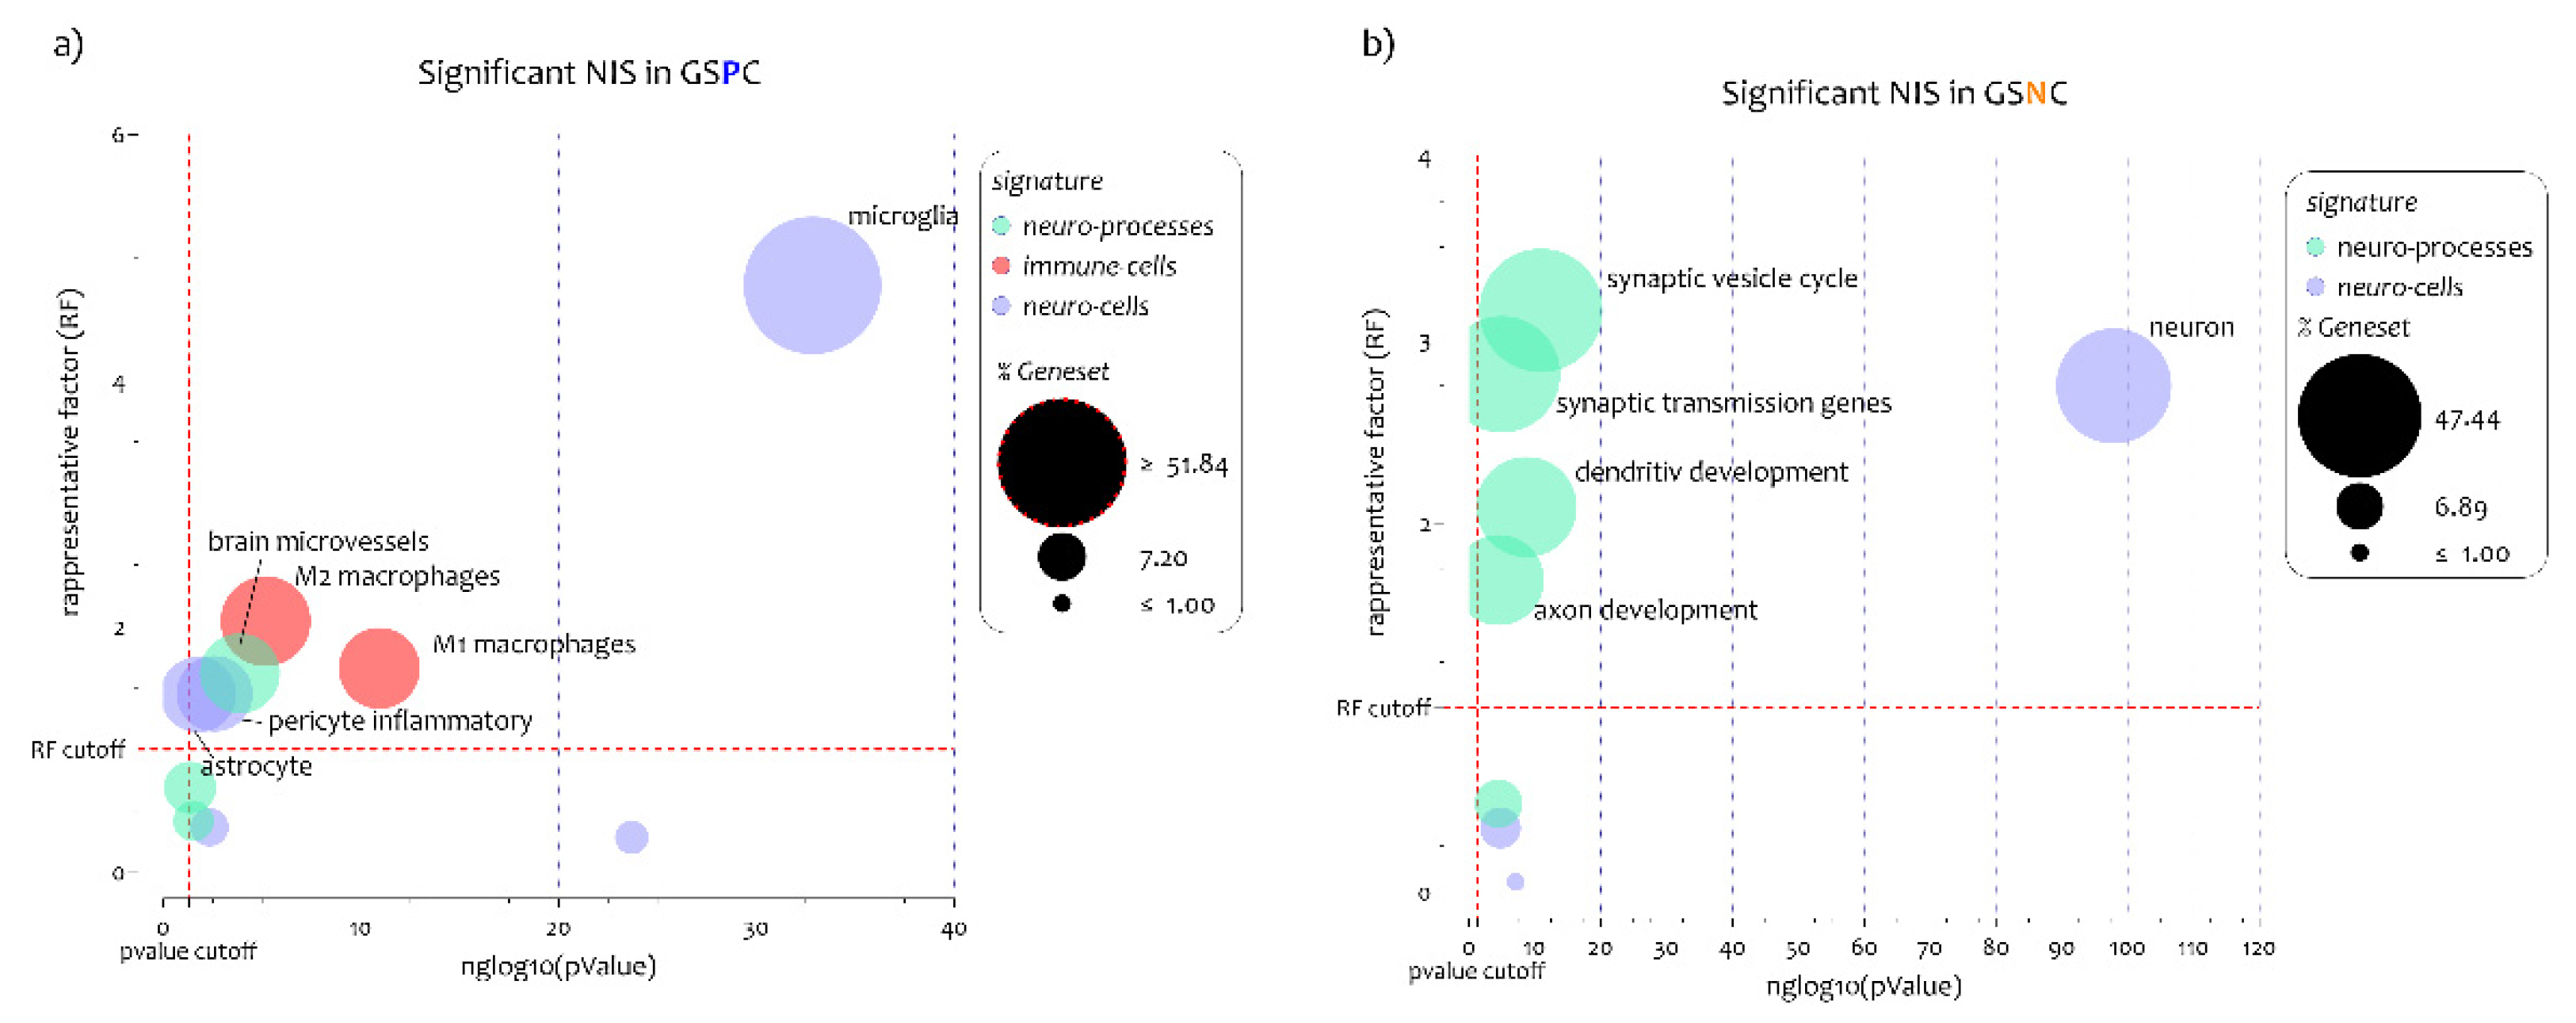
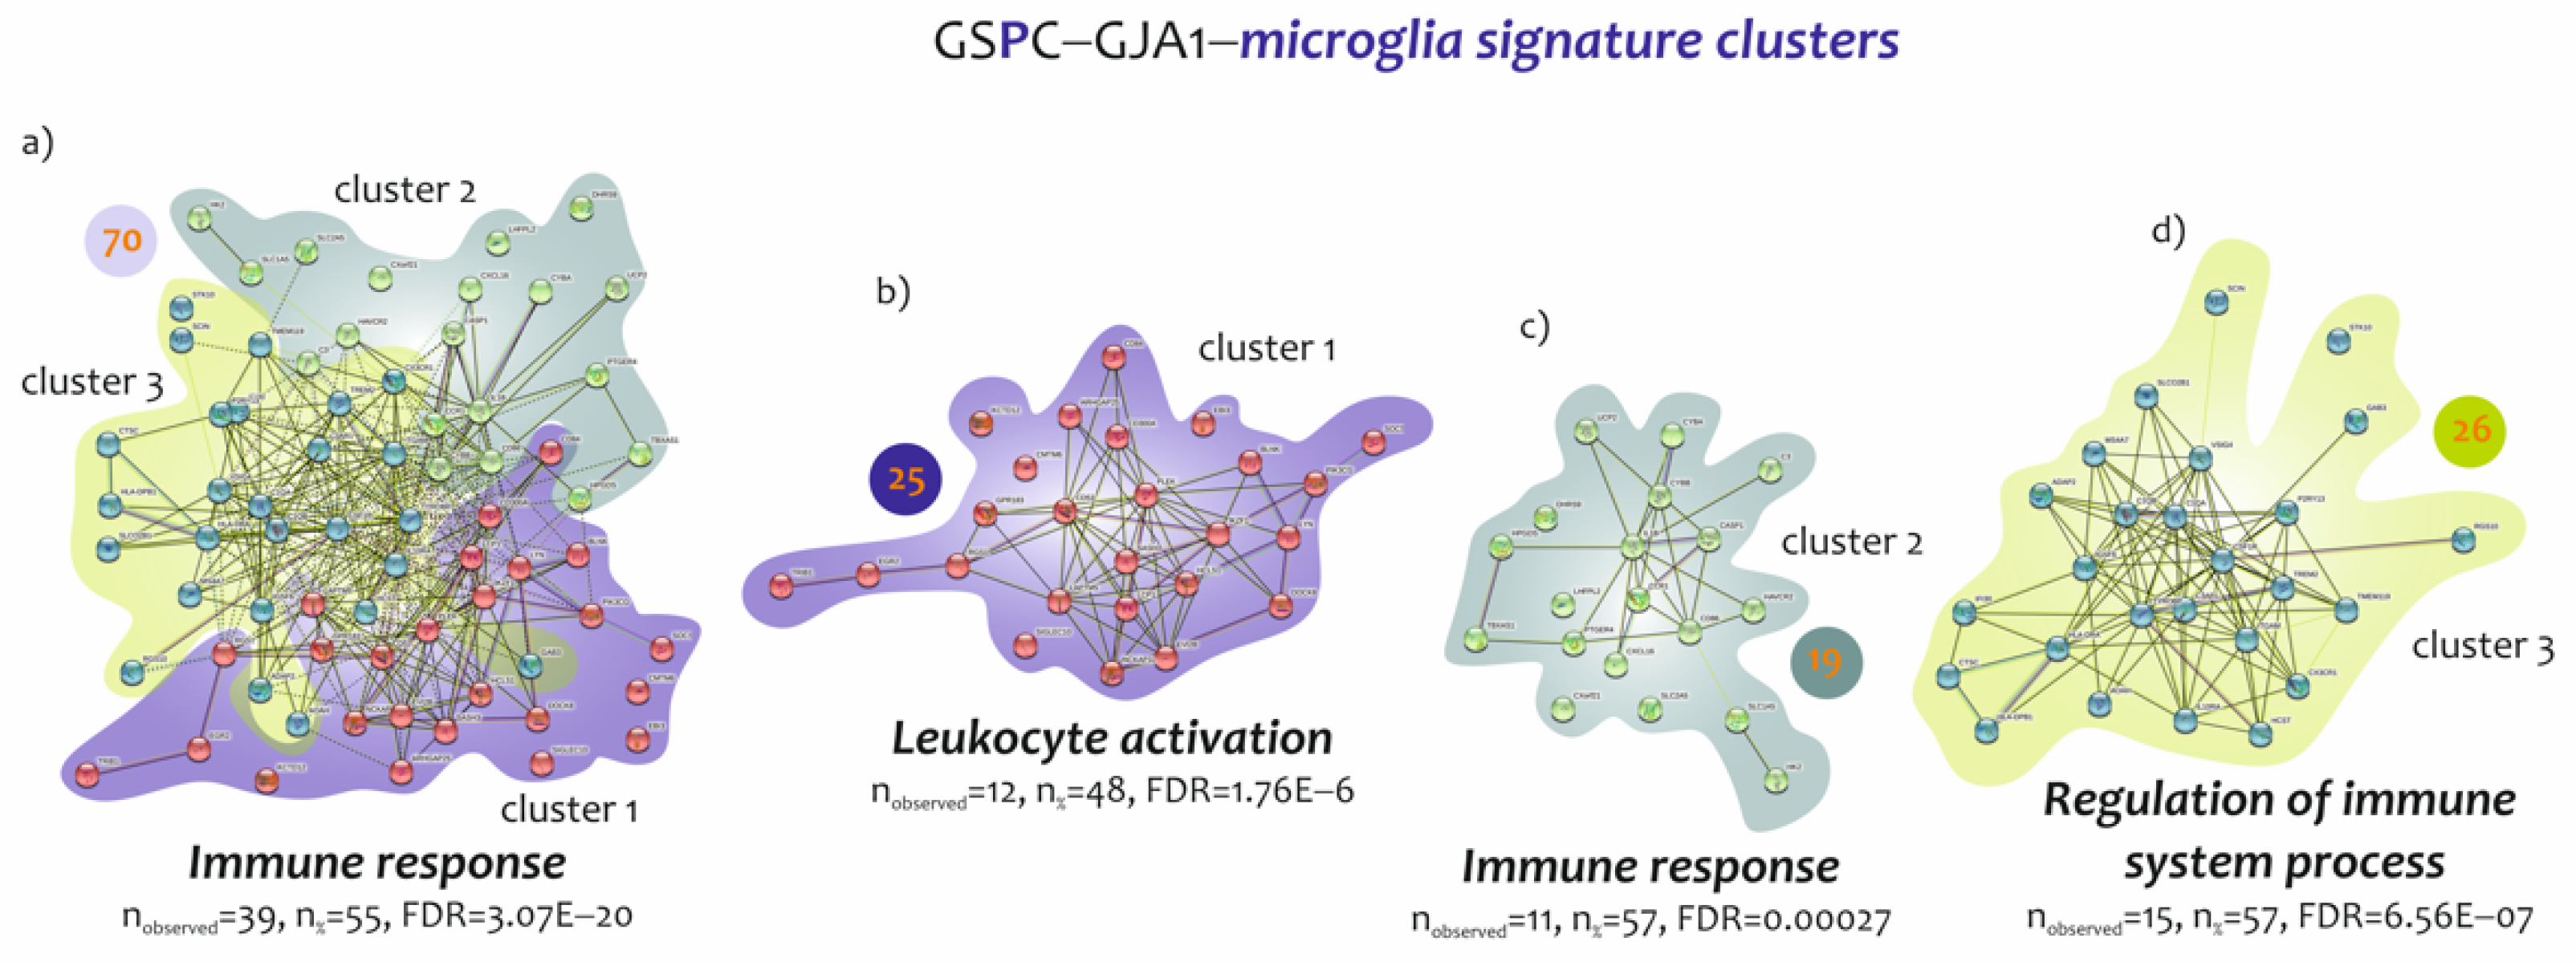
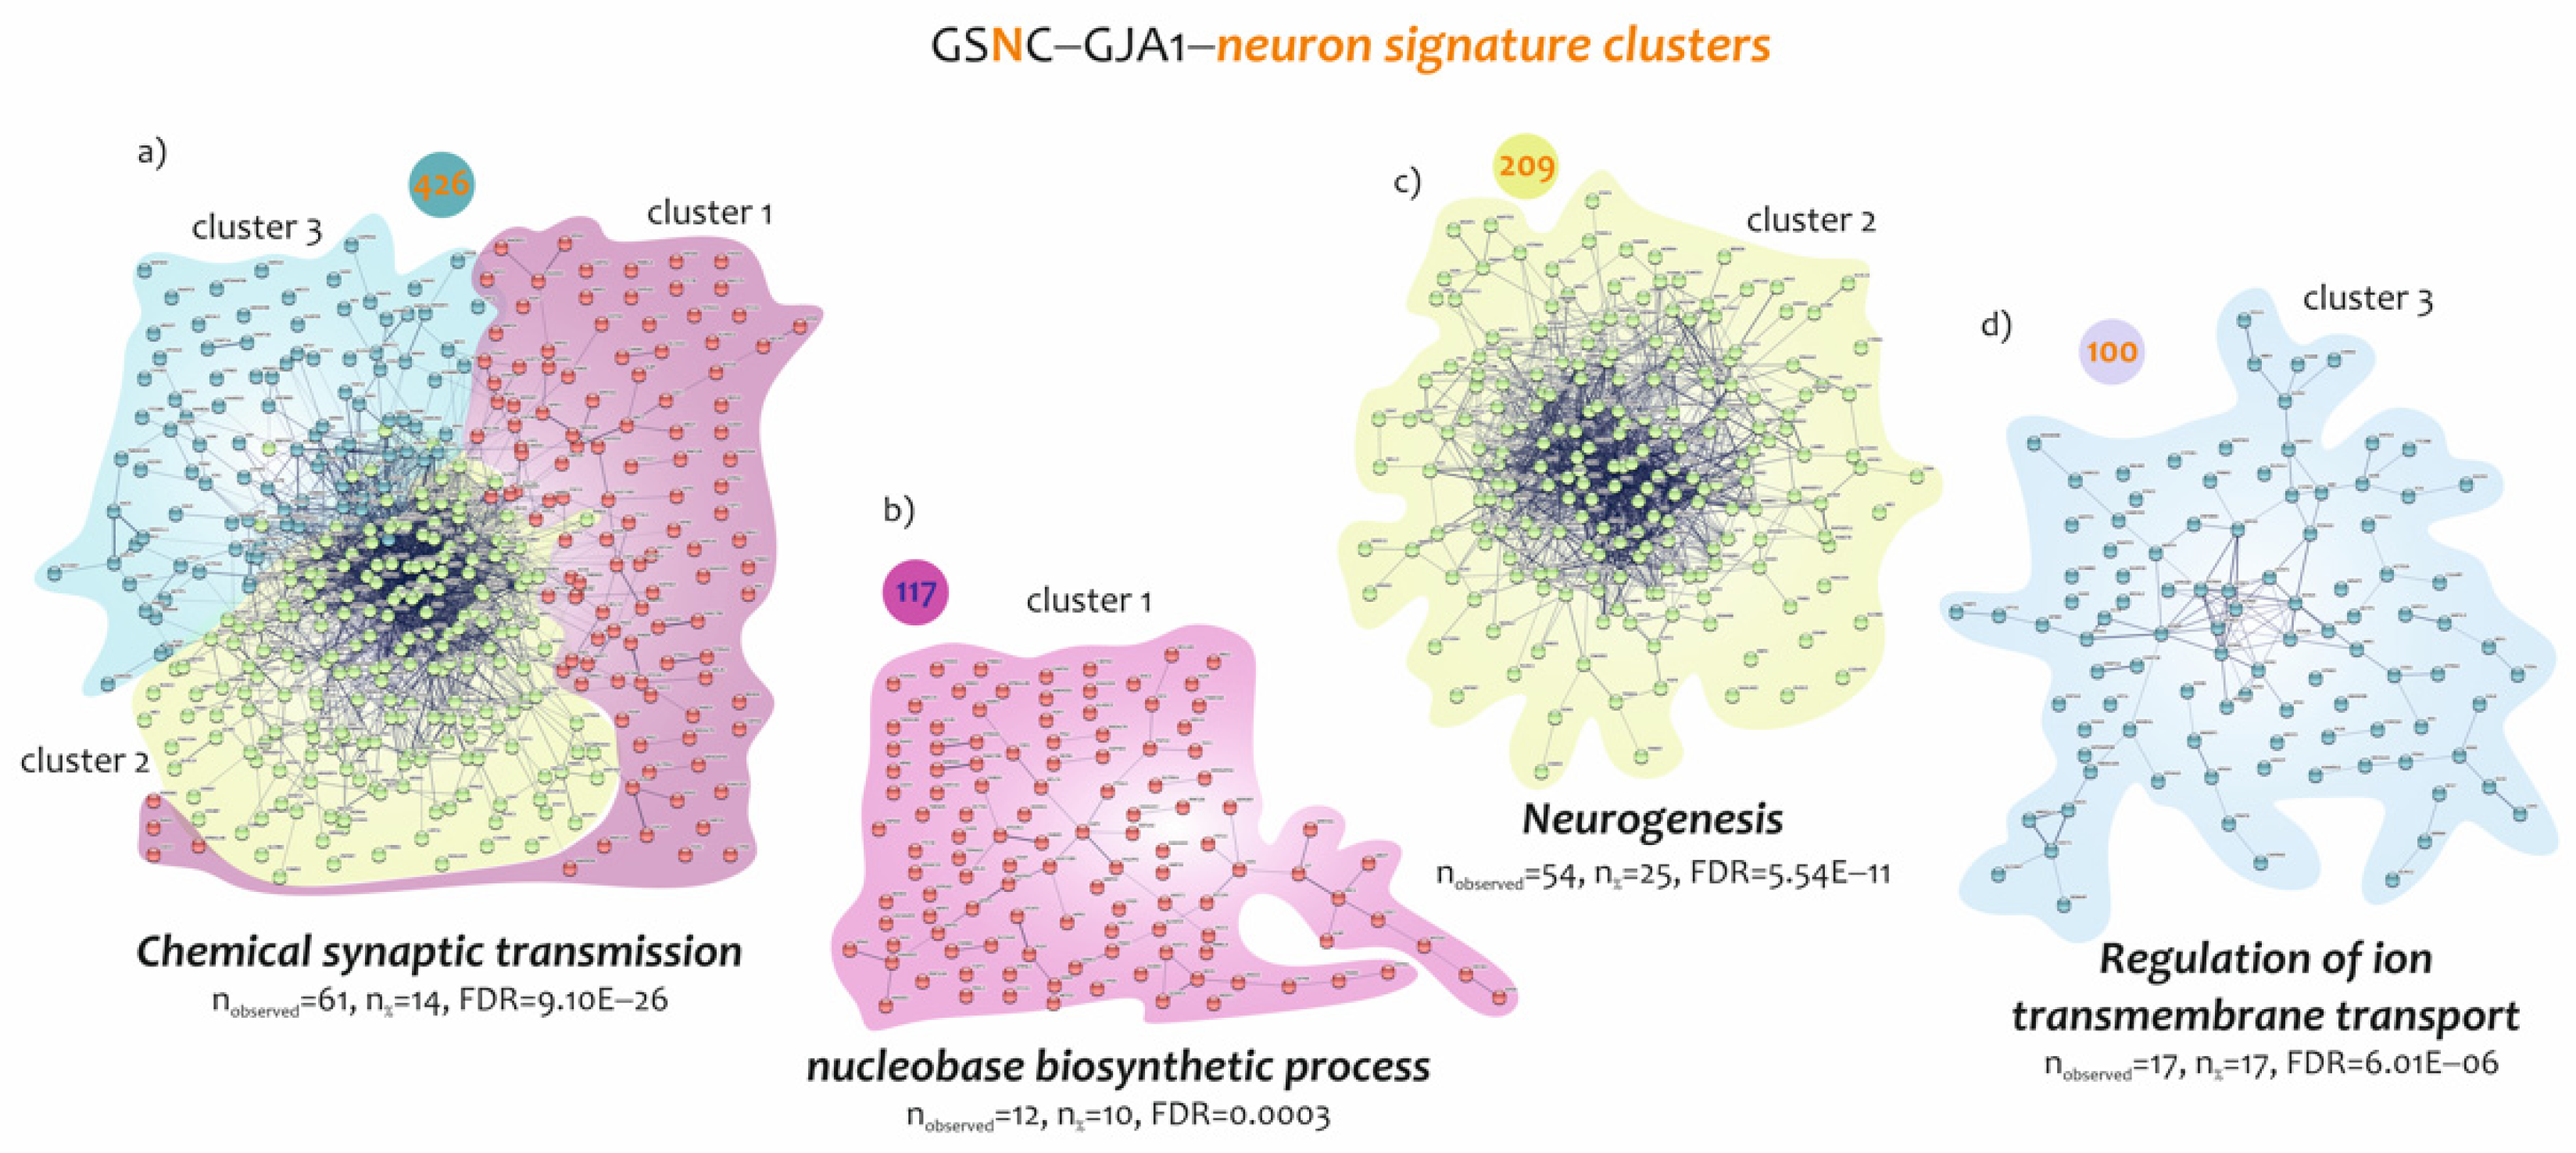
3.3. Biological Processes Identified by the Genes Belonging to Microglia and Neuron Signatures Determined by GJA1 Expression Levels in the Spinal Cord of ALS Patients

Our results highlighted two distinct profiles that characterize ALS patients, closely associated with GJA1 expression levels in the spinal cord MNs. The profiles that emerged were related to microglia and neurons, the most regulated by GJA1 expression levels. According to these results, we decided to perform a GO analysis on genes that characterized the two highlighted signatures. Microglia cells were identified by a signature of 118 genes, of which 70 were found to be positively correlated with GJA1 expression levels. It was possible to divide the 70 genes into three different clusters, each characterized by a specific biological function (Figure 4). GO analysis on the 70 genes (59% of signature) showed that 55% (39 genes) were involved in biological processes of immune response (FDR = 3.07E−20) (Figure 4a and supplementary Table S1). Regarding the cluster 1, it consisted of 25 genes whose expression was closely related to leukocyte activation (n = 12, n = 48%, FDR = 1.76E−06) (Figure 4b). Cluster 2 was composed of 19 genes belonging to biological processes related to response to immune response (n = 11, n = 57%, FDR = 0.00027) (Figure 4c), while cluster 3, composed of 26 genes, highlighted the regulation of the immune-system process as the main biological process (n = 15, n = 57%, FDR = 6.56E−07) (Figure 4d and supplementary Table S1).
Neurons were identified by a signature of 1032 genes, of which 426 were found to be closely negatively correlated with GJA1 expression levels. Moreover, for this signature, it was possible to divide the 426 genes into three different clusters, each characterized by a specific biological function (Figure 5). The 426 gene cluster showed as mainly modulated biological processes the chemical synaptic signalling (n = 61, n = 14%, FDR = 9.10E−26) (Figure 5a and supplementary Table S1). Regard cluster 1, consisted of 117 genes whose expression was closely related to nucleobase biosynthetic process (n = 12, n = 10%, FDR = 0.0003) (Figure 5b and supplementary Table S1). Cluster 2 consisted of 209 genes belonging to biological processes related to neurogenesis (n = 54, n = 25%, FDR = 5.54E−11) (Figure 5c), and cluster 3, composed of 100 genes, highlighted G-protein signalling regulation of ion transmembrane transport as the main biological process (n = 17, n = 17%, FDR = 6.01E−06) (Figure 5d and supplementary Table S1).

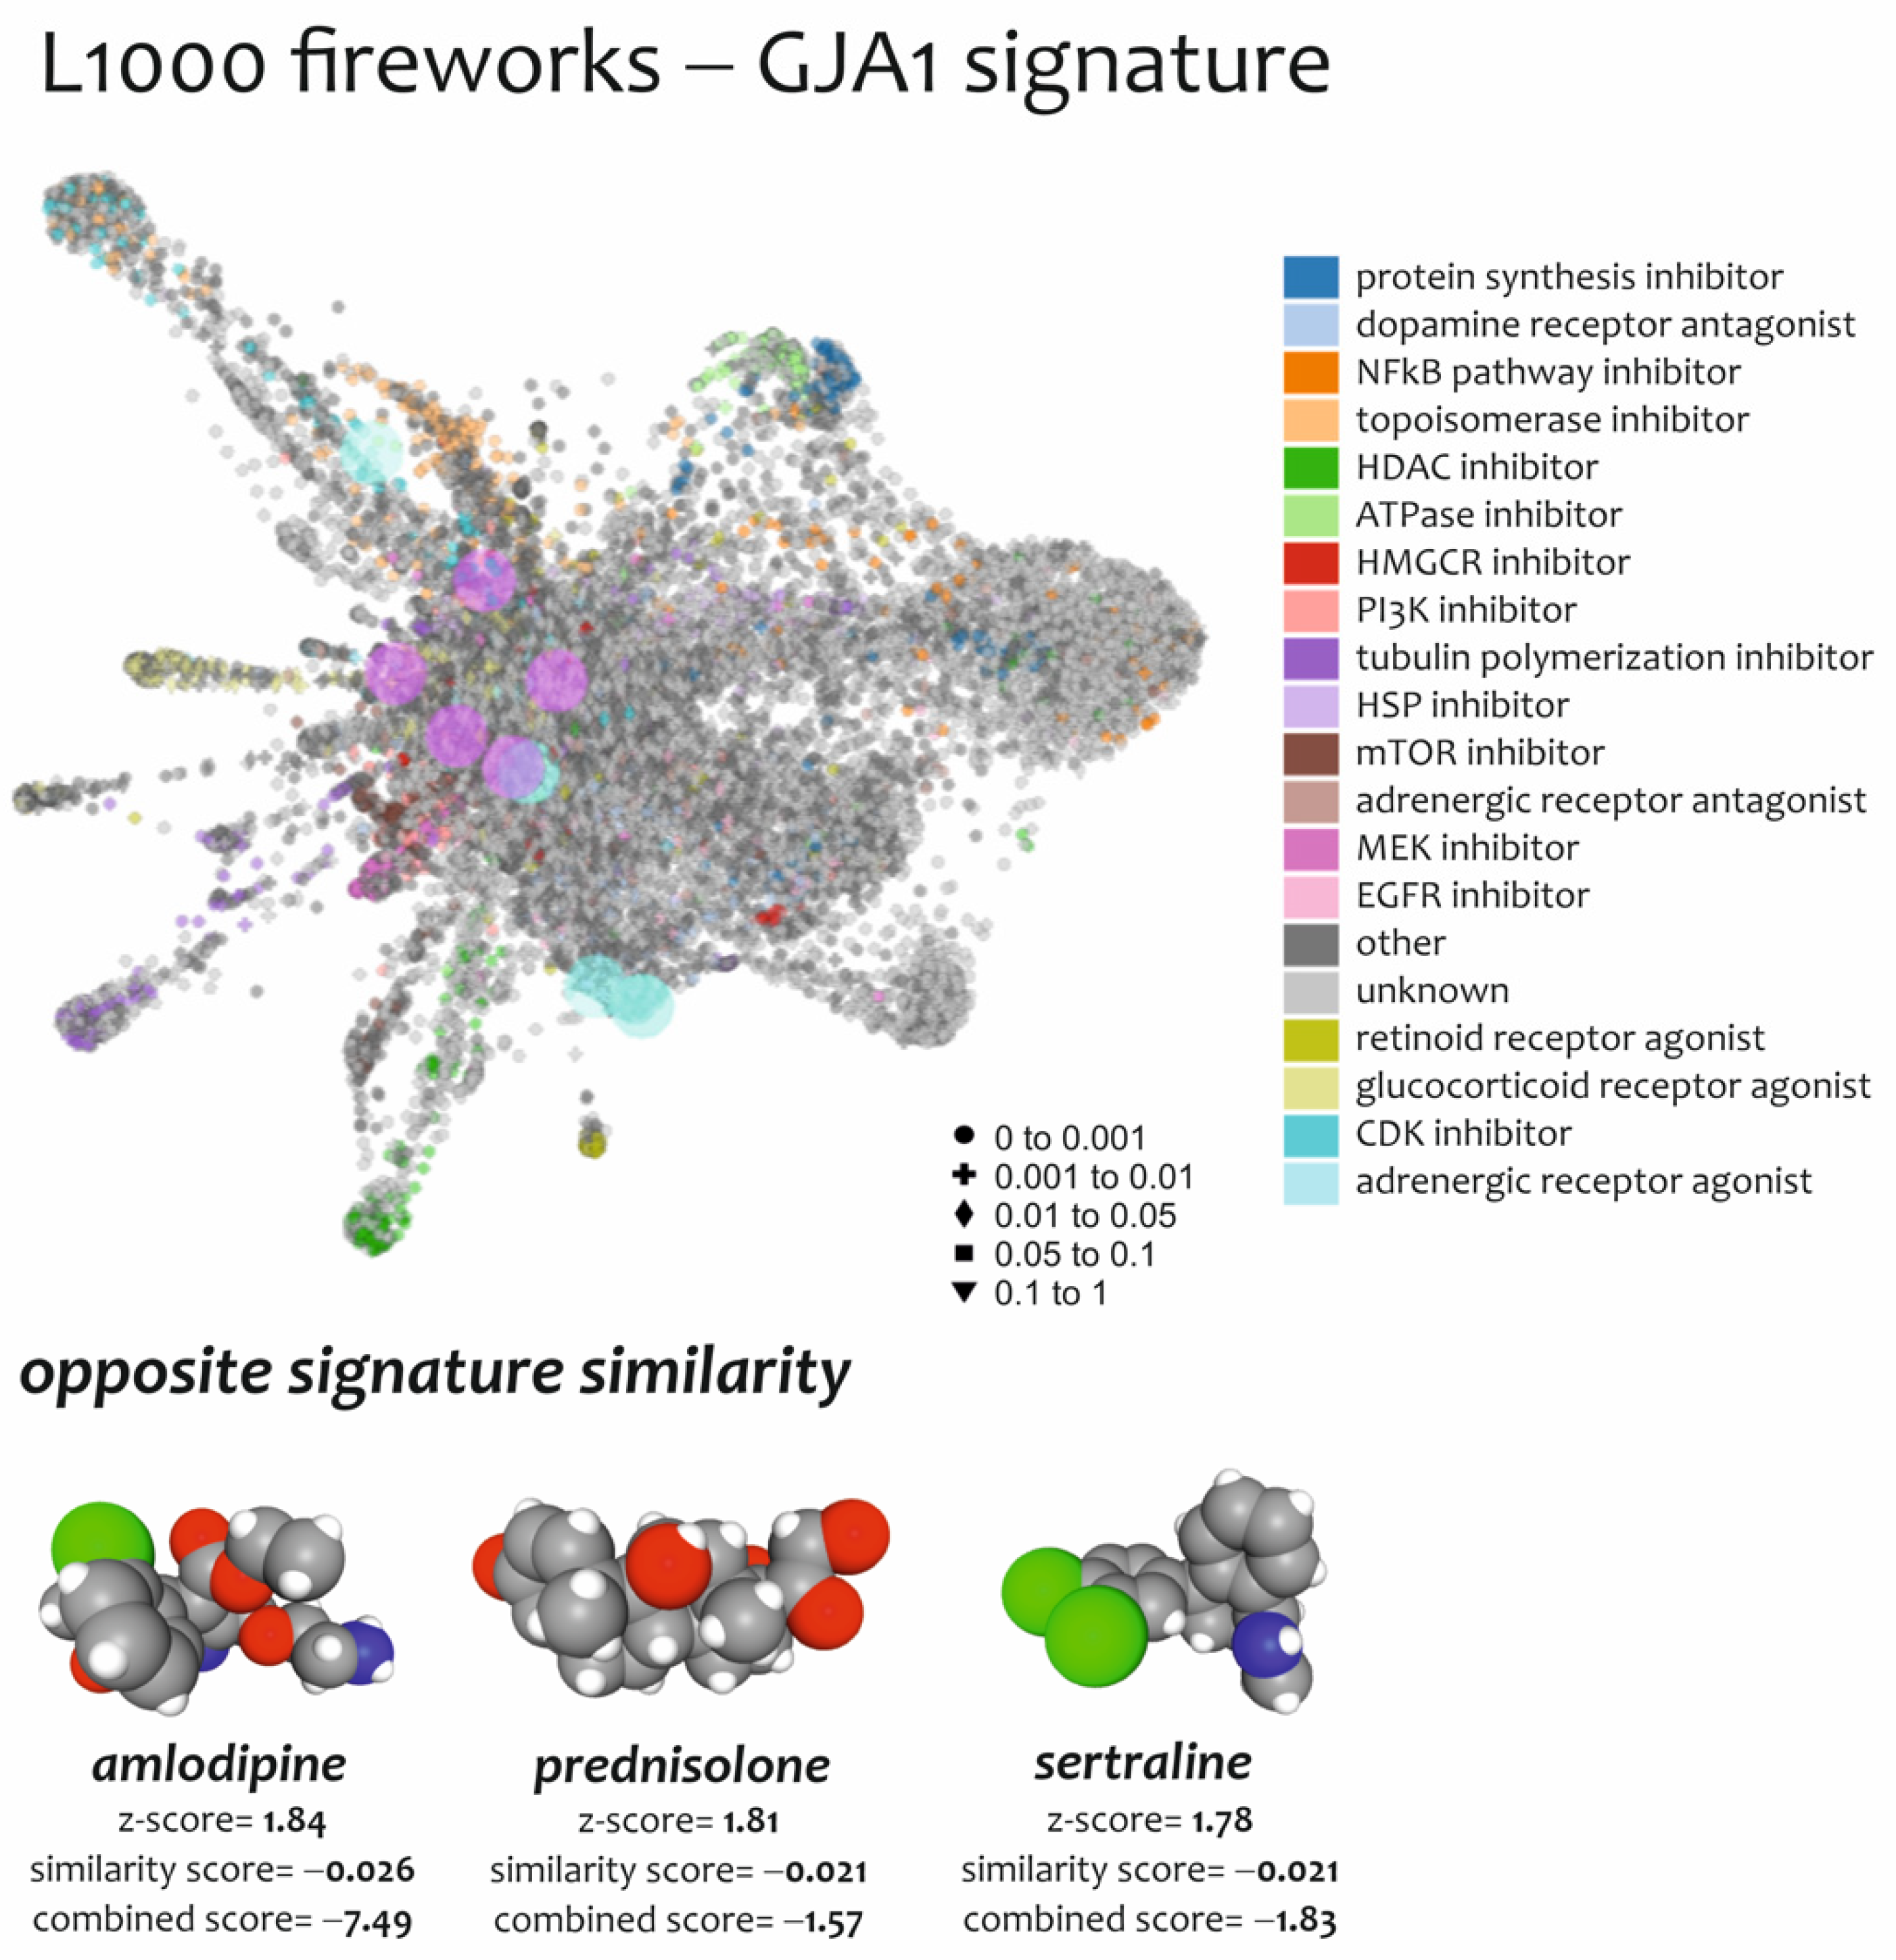
3.4. Effect of Drugs Mimicking and Opposing GJA1 Transcriptomic Signatures Obtained from Spinal Cord of ALS Patients

Anti-signature perturbation analysis was performed using the GSPC-GJA1 and GSNC-GJA1 signatures identified for ALS patients and uploaded to L1000FWD. Among the predicted drugs, we only highlighted those that are already in clinical use (Table 4).
We chose to list in Table 4 the potential anti-ALS drugs identified by L1000FWD analysis using the GSPC/GSNC-GJA1 signature model. The complete list can be retrieved in supplementary Table S1. Among them: amlodipine (CS = −7.49), a second-generation calcium channel blocker that is used in the therapy of hypertension and angina pectoris; sertraline (CS = −1.83), a selective serotonin reuptake inhibitor (SSRI) used in the therapy of depression, anxiety disorders and obsessive–compulsive disorder and prednisolone (CS = −1.57), a glucocorticoid receptor agonist, used in allergies, inflammatory conditions, autoimmune disorders, and cancers (Figure 6, Table 4, and supplementary Table S1).

4. Discussion

Public transcriptome dataset analysis has been extensively used for the identification of novel pathogenic pathways and therapeutic targets in a number of human pathologies [55,56], including neurodegenerative diseases [33,34,57,58] and cancer [59,60]. Meta-analysis of available datasets allows the improvement of statistical power and to obtain differentially expressed gene signatures, and also estimates heterogeneity [61]. This possibility has further sparked the omic approach, which is a formidable tool for the overall assessment of pathological features, allowing pathways to be highlighted that are synergistically involved with molecular factors, and therefore new therapeutic targets towards personalized therapies [62].
The delicate balance of the CNS cell populations, together with their cross-talk, relies on CXs-based channel exchanges that maintain homeostasis controlling ions composition, trophic factors, energy substrates, and removal of waste products [63,64,65]. Neurodegenerative diseases, including MNs diseases, affect brain and/or spinal cord resident cell populations and, among these, ALS is of particular relevance due to the negative outcome and the mostly unknown etiopathology [66]. GJA1/Cx43 expression and its role as GJs- or HCs-forming protein has been investigated in preclinical models of ALS and in human biopsies [16,67,68]. In a previous study, using a selective MNs depletion model, we observed a significant increase in intercellular coupling mediated by GJA1/Cx43 between astrocytes and microglial cells in the ventral horns of the spinal cord [28]. Whether a correlation between GJA1/Cx43 and reactive astrogliosis was observed, the biological pathways involved in the potential glial cells modulation deserved further investigation.
In the present study, we analyzed human spinal cord biopsies of ALS patients to investigate the involvement of GJA1 in ALS pathogenesis and disease progression. We found significantly different GJA1 expression levels in MNs of ALS patients as compared to NDC, supporting the diagnostic potential of GJA1. Accordingly, we recently showed that spinal MNs depletion induces a robust gliosis, resulting in the reactive Cx43 expression, which hamper plasticity and spontaneous compensatory processes [28].
Gene deconvolution analysis performed on the spinal cord of ALS patients’ transcriptome, revealed that genes, positively correlated to GJA1 expression levels, were associated with activation of microglia related to neuro-immune inflammation. Accordingly, the main stimuli influencing the expression of Cx43 are the cytokines including TNF, IL-1β, IFN-c, IL-6, and NO, released following microglial activation [69,70]. Microglia, being the immune effector cells of the CNS, contributes significantly to neuroinflammation by increased levels of the HCs- and GJs-forming CX43 [64]. Indeed, inflammatory microglia via CXs-based channels allows the activation of the cell signalling pathway inducing stimulation of glutaminase and glutamate induced excitotoxicity, IL-1β release and increased extracellular ATP levels, contribute to creating degenerative signalling for neurons and induce reactive astrogliosis [71].
Our analysis also revealed that genes, negatively correlated to GJA1 expression, were associated with neuronal activation profiles, as revealed by the significative intersections with axon development, dendritic development, synaptic transmission genes, and synaptic vesicle cycle. This observation is in line with extensive vacuolation, cytoarchitectural disintegration, reduced numbers of synapses, and an apical dendrite degeneration of Betz cells, which characterize ALS [72]. Moreover, our analysis showed that neurons were identified by a signature of genes mainly clustered in biological processes related to neurogenesis. Although it is well known that CX43 protein itself regulates key signalling pathways during development and neurogenesis [73], its role in modulating synaptic plasticity and compensatory processes in neurodegenerative disease is not fully elucidated [74,75,76]. Data herein described report four main neuronal biological processes that negatively correlate with GJA1 levels, namely axon development, dendritic development, synaptic transmission genes, and synaptic vesicle cycle. This finding is of critical importance, particularly in ALS, given the evidence of potential compensatory mechanisms in neurodegenerative disease [3,77]. Indeed, immune-modulatory and antioxidant treatment for degenerative disease, including ALS, relies on endogenous compensation that involves resident stem cell pool or spared MNs [78,79,80]. In fact, once endogenous regenerative potential or compensatory mechanisms are overwhelmed, neurodegeneration and functional loss ensues [81]. Our data are in accordance with previous published literature reporting a robust MNs degeneration in the early phase of the disease, which is compensated by spared MNs. Such a compensatory process represents the biological bases for an early asymptomatic phase with physiological or near-physiological motor functions concomitant with a significant reduction in MNs [81,82]. It is worth noticing that the early MNs loss reported in the preclinical model of ALS is relatively stable until the end of the disease, supporting the hypothesis of a therapeutic window to stop disease progression and favour endogenous and/or exogenous compensatory/regenerative mechanisms [82]. We previously reported that reactive gliosis upon selective MNs depletion is characterized by a significant increase of CX43 and intercellular communication [28]. Such a phenomenon activates a positive-loop conditioning spinal ventral horn microenvironment affecting spared MNs compensatory potential via homo-cellular (microglia–microglia or astrocyte–astrocyte) or hetero-cellular (microglia–astrocyte) cross-talk [81]. Microglia during neuroinflammatory and degenerative diseases represents a master regulator of neurons and astrocyte functions via HCs- and GJs-mediated microenvironmental conditioning, releasing excitotoxic stimuli, reactive oxygen species, glutamate, and ATP, thus inducing neuronal distress and cell death [83,84,85,86,87].
In an effort to find potential complementary therapy and pharmacological agents able to revert or to reduce the GJA1/CX43-mediated biological cascade, we analyzed GSPC/GSNC-GJA1 signatures using L1000FWD. This set of evidence aimed at identifying specific FDA approved drugs able to revert the GJA1 transcriptomic profile and to counteract ALS progression. We were able to identify three drugs: amlodipine, sertraline, and prednisolone. To the best of our knowledge, none of these drugs have been tested for their efficacy in ALS models. Amlodipine is a calcium channel blocker and holds antioxidant properties and an ability to enhance the production of nitric oxide [88]. It has been reported that amlodipine mediates a significant reduction in neuronal loss in an experimental model of middle cerebral artery occlusion [89]. The increased circulating levels of transforming growth factor β1 (TGF-β1), found in depressed patients treated with selective reuptake inhibitors, such as sertraline, encouraged the evaluation of sertraline as a potential neuroprotective and anti-inflammatory agent in AD and PD [90,91]. TGF-β1 is an anti-inflammatory cytokine that has been reported to exert protective mechanisms in chronic neuroinflammation and degenerative disease [92]. Finally, the methylated form of prednisolone is often used in relapses of multiple sclerosis and immune system disorders, even if it does not slow the overall progression of the disease [93,94,95,96]. The present study is limited by the lack of an experimental validation and by the potential heterogeneity between datasets. We tried to assess both these limitations contextualizing our finding with previously published experimental evidence and using z-score to reduce variability between samples and between datasets. Such a method is considered a reliable procedure of analysis and can be considered a state-of-the-art method to assess multiple datasets, as demonstrated by previously published literature [97,98,99,100,101,102,103,104,105,106,107]. At the same time, our work provides a valuable overview of the dynamic influence that GJA1/CX43 exerts on MNs depletion that characterizes ALS, highlighting both its diagnostic and therapeutic potential to counteract such a dismal disease.

5. Conclusions

The evidence presented in this manuscript shows that substantial differences exist in the cellular brain profile of ALS patients according to the GJA1/CX43 transcripts. However, it should be recalled that this is an exploratory study based on the dataset analysis and more in-depth protein studies are needed to confirm these preliminary results in order to establish the exact role played by the GJA1/CX43 in the spinal cord of patients with ALS. Further studies evaluating the therapeutic potential of drugs able to revert typical GJA1/CX43 signature in ALS patients are needed and may represent a potential therapeutic approach for such a dismal disease.

Supplementary Materials

The following supporting information can be downloaded at: https://www.mdpi.com/article/10.3390/biomedicines10092246/s1, Supplementary Table S1.

Author Contributions

Conceptualization: N.V., M.D.R. and R.P.; methodology: N.V., P.C. and M.D.R.; data curation: N.V., P.C., R.I., S.G., G.M., D.L.F., R.G., A.Z., G.L.V., D.T. and M.D.R.; formal analysis: N.V., P.C., R.I., M.D.R. and R.P.; writing—original draft: N.V., M.D.R. and R.P.; writing—review and editing: N.V., P.C., R.I., S.G., G.M., D.L.F., R.G., A.Z., G.L.V., D.T., M.D.R. and R.P. All authors have read and agreed to the published version of the manuscript.

Funding

This study was supported by the University Research Project Grant (PIACERI 2020–2022), Department of Biomedical and Biotechnological Sciences (BIOMETEC), University of Catania, Italy. N.V. was supported by the PON AIM R&I 2014-2020-E66C18001240007. The funder/sponsor had no role in the design and conduct of the study; collection, management, analysis, and interpretation of the data; preparation, review, or approval of the manuscript; and decision to submit the manuscript for publication.

Institutional Review Board Statement

Not applicable.

Informed Consent Statement

Not applicable.

Data Availability Statement

The datasets analyzed during the current study are available in the GEODataset repository, Home-GEODataset-NCBI (nih.gov).

Acknowledgments

We would like to show our gratitude to the authors of microarray datasets made available online, for consultation and re-analysis. We would like to thank Ludovico Einaudi for inspiring us to write this manuscript.

Conflicts of Interest

The authors declare no conflict of interest.

Ethics Approval

Not applicable. The ethics approval and consent to participate were requested by the authors of the original datasets shown in Table 1, and subsequently analyzed in our study.

Abbreviations

ADAlzheimer’s disease
ALSamyotrophic lateral sclerosis
AUCarea under the ROC curve
CNScentral nervous system
CSCcervical spinal cord
CXconnexin
FDRfalse discovery rate
GDAgenomic deconvolution analysis
GEOgene expression omnibus
GJgap junction
GOgene ontology
GSNCgenes significant negative correlated
GSNC-GJA1genes significantly negatively correlated to GJA1
GSPCgenes significantly positively correlated
GSPC-GJA1genes significantly positively correlated to GJA1
HChemichannel
LCMlaser capture microdissection
MDmicroarray datasets
MeVMultiExperiment Viewer
MNsmotoneurons
MOAmode of action
MSmultiple sclerosis
NDCnot demented control subjects–healthy individuals
PDParkinson’s disease
SDEGsignificantly different expressed genes

References

  1. Glass, C.K.; Saijo, K.; Winner, B.; Marchetto, M.C.; Gage, F.H. Mechanisms underlying inflammation in neurodegeneration. Cell 2010, 140, 918–934. [Google Scholar] [CrossRef] [PubMed]
  2. Chio, A.; Logroscino, G.; Hardiman, O.; Swingler, R.; Mitchell, D.; Beghi, E.; Traynor, B.G.; Eurals, C. Prognostic factors in ALS: A critical review. Amyotroph. Lateral Scler. 2009, 10, 310–323. [Google Scholar] [CrossRef] [PubMed]
  3. Vicario, N.; Spitale, F.M.; Tibullo, D.; Giallongo, C.; Amorini, A.M.; Scandura, G.; Spoto, G.; Saab, M.W.; D’Aprile, S.; Alberghina, C.; et al. Clobetasol promotes neuromuscular plasticity in mice after motoneuronal loss via sonic hedgehog signaling, immunomodulation and metabolic rebalancing. Cell Death Dis. 2021, 12, 625. [Google Scholar] [CrossRef] [PubMed]
  4. Vicario, N.; Turnaturi, R.; Spitale, F.M.; Torrisi, F.; Zappala, A.; Gulino, R.; Pasquinucci, L.; Chiechio, S.; Parenti, C.; Parenti, R. Intercellular communication and ion channels in neuropathic pain chronicization. Inflamm. Res. 2020, 69, 841–850. [Google Scholar] [CrossRef] [PubMed]
  5. Vicario, N.; Zappala, A.; Calabrese, G.; Gulino, R.; Parenti, C.; Gulisano, M.; Parenti, R. Connexins in the Central Nervous System: Physiological Traits and Neuroprotective Targets. Front. Physiol. 2017, 8, 1060. [Google Scholar] [CrossRef]
  6. Harcha, P.A.; Garces, P.; Arredondo, C.; Fernandez, G.; Saez, J.C.; van Zundert, B. Mast Cell and Astrocyte Hemichannels and Their Role in Alzheimer’s Disease, ALS, and Harmful Stress Conditions. Int. J. Mol. Sci. 2021, 22, 1924. [Google Scholar] [CrossRef]
  7. Huang, X.; Su, Y.; Wang, N.; Li, H.; Li, Z.; Yin, G.; Chen, H.; Niu, J.; Yi, C. Astroglial Connexins in Neurodegenerative Diseases. Front. Mol. Neurosci. 2021, 14, 657514. [Google Scholar] [CrossRef]
  8. Stavropoulos, F.; Georgiou, E.; Sargiannidou, I.; Kleopa, K.A. Dysregulation of Blood-Brain Barrier and Exacerbated Inflammatory Response in Cx47-Deficient Mice after Induction of EAE. Pharmaceuticals 2021, 14, 621. [Google Scholar] [CrossRef]
  9. Zhao, Y.; Qi, Y.; Li, Q.; Quan, H.; Liu, D.; Zhou, H. Connexin43 inhibition attenuated dopaminergic neuronal loss in the lipopolysaccharide-induced mice model of Parkinson’s disease. Neurosci. Lett. 2022, 771, 136471. [Google Scholar] [CrossRef]
  10. Zhao, Y.; Yamasaki, R.; Yamaguchi, H.; Nagata, S.; Une, H.; Cui, Y.; Masaki, K.; Nakamuta, Y.; Iinuma, K.; Watanabe, M.; et al. Oligodendroglial connexin 47 regulates neuroinflammation upon autoimmune demyelination in a novel mouse model of multiple sclerosis. Proc. Natl. Acad. Sci. USA 2020, 117, 2160–2169. [Google Scholar] [CrossRef] [PubMed]
  11. Takeuchi, H.; Mizoguchi, H.; Doi, Y.; Jin, S.; Noda, M.; Liang, J.; Li, H.; Zhou, Y.; Mori, R.; Yasuoka, S.; et al. Blockade of gap junction hemichannel suppresses disease progression in mouse models of amyotrophic lateral sclerosis and Alzheimer’s disease. PLoS ONE 2011, 6, e21108. [Google Scholar] [CrossRef] [PubMed]
  12. Zhou, Z.; Wei, X.; Xiang, J.; Gao, J.; Wang, L.; You, J.; Cai, Y.; Cai, D. Protection of erythropoietin against ischemic neurovascular unit injuries through the effects of connexin43. Biochem. Biophys. Res. Commun. 2015, 458, 656–662. [Google Scholar] [CrossRef]
  13. Cibelli, A.; Stout, R.; Timmermann, A.; de Menezes, L.; Guo, P.; Maass, K.; Seifert, G.; Steinhauser, C.; Spray, D.C.; Scemes, E. Cx43 carboxyl terminal domain determines AQP4 and Cx30 endfoot organization and blood brain barrier permeability. Sci. Rep. 2021, 11, 24334. [Google Scholar] [CrossRef] [PubMed]
  14. Chen, B.; Yang, L.; Chen, J.; Chen, Y.; Zhang, L.; Wang, L.; Li, X.; Li, Y.; Yu, H. Inhibition of Connexin43 hemichannels with Gap19 protects cerebral ischemia/reperfusion injury via the JAK2/STAT3 pathway in mice. Brain Res. Bull. 2019, 146, 124–135. [Google Scholar] [CrossRef] [PubMed]
  15. Cicirata, F.; Parenti, R.; Spinella, F.; Giglio, S.; Tuorto, F.; Zuffardi, O.; Gulisano, M. Genomic organization and chromosomal localization of the mouse Connexin36 (mCx36) gene. Gene 2000, 251, 123–130. [Google Scholar] [CrossRef]
  16. Almad, A.A.; Taga, A.; Joseph, J.; Gross, S.K.; Welsh, C.; Patankar, A.; Richard, J.P.; Rust, K.; Pokharel, A.; Plott, C.; et al. Cx43 hemichannels contribute to astrocyte-mediated toxicity in sporadic and familial ALS. Proc. Natl. Acad. Sci. USA 2022, 119, e2107391119. [Google Scholar] [CrossRef]
  17. Vicario, N.; Pasquinucci, L.; Spitale, F.M.; Chiechio, S.; Turnaturi, R.; Caraci, F.; Tibullo, D.; Avola, R.; Gulino, R.; Parenti, R.; et al. Simultaneous Activation of Mu and Delta Opioid Receptors Reduces Allodynia and Astrocytic Connexin 43 in an Animal Model of Neuropathic Pain. Mol. Neurobiol. 2019, 56, 7338–7354. [Google Scholar] [CrossRef]
  18. Karagiannis, A.; Sylantyev, S.; Hadjihambi, A.; Hosford, P.S.; Kasparov, S.; Gourine, A.V. Hemichannel-mediated release of lactate. J. Cereb. Blood Flow Metab. 2016, 36, 1202–1211. [Google Scholar] [CrossRef]
  19. Nagy, J.I.; Ionescu, A.V.; Lynn, B.D.; Rash, J.E. Coupling of astrocyte connexins Cx26, Cx30, Cx43 to oligodendrocyte Cx29, Cx32, Cx47: Implications from normal and connexin32 knockout mice. Glia 2003, 44, 205–218. [Google Scholar] [CrossRef]
  20. Sanchez, O.F.; Rodriguez, A.V.; Velasco-Espana, J.M.; Murillo, L.C.; Sutachan, J.J.; Albarracin, S.L. Role of Connexins 30, 36, and 43 in Brain Tumors, Neurodegenerative Diseases, and Neuroprotection. Cells 2020, 9, 846. [Google Scholar] [CrossRef] [Green Version]
  21. Orellana, J.A.; Saez, P.J.; Shoji, K.F.; Schalper, K.A.; Palacios-Prado, N.; Velarde, V.; Giaume, C.; Bennett, M.V.; Saez, J.C. Modulation of brain hemichannels and gap junction channels by pro-inflammatory agents and their possible role in neurodegeneration. Antioxid. Redox Signal. 2009, 11, 369–399. [Google Scholar] [CrossRef] [PubMed]
  22. Yawata, I.; Takeuchi, H.; Doi, Y.; Liang, J.; Mizuno, T.; Suzumura, A. Macrophage-induced neurotoxicity is mediated by glutamate and attenuated by glutaminase inhibitors and gap junction inhibitors. Life Sci. 2008, 82, 1111–1116. [Google Scholar] [CrossRef] [PubMed]
  23. Takeuchi, H.; Jin, S.; Wang, J.; Zhang, G.; Kawanokuchi, J.; Kuno, R.; Sonobe, Y.; Mizuno, T.; Suzumura, A. Tumor necrosis factor-alpha induces neurotoxicity via glutamate release from hemichannels of activated microglia in an autocrine manner. J. Biol. Chem. 2006, 281, 21362–21368. [Google Scholar] [CrossRef] [PubMed]
  24. Takeuchi, H.; Jin, S.; Suzuki, H.; Doi, Y.; Liang, J.; Kawanokuchi, J.; Mizuno, T.; Sawada, M.; Suzumura, A. Blockade of microglial glutamate release protects against ischemic brain injury. Exp. Neurol. 2008, 214, 144–146. [Google Scholar] [CrossRef]
  25. De Vuyst, E.; Decrock, E.; Cabooter, L.; Dubyak, G.R.; Naus, C.C.; Evans, W.H.; Leybaert, L. Intracellular calcium changes trigger connexin 32 hemichannel opening. EMBO J. 2006, 25, 34–44. [Google Scholar] [CrossRef] [PubMed]
  26. Kang, J.; Kang, N.; Lovatt, D.; Torres, A.; Zhao, Z.; Lin, J.; Nedergaard, M. Connexin 43 hemichannels are permeable to ATP. J. Neurosci. 2008, 28, 4702–4711. [Google Scholar] [CrossRef]
  27. Dobrenis, K.; Chang, H.Y.; Pina-Benabou, M.H.; Woodroffe, A.; Lee, S.C.; Rozental, R.; Spray, D.C.; Scemes, E. Human and mouse microglia express connexin36, and functional gap junctions are formed between rodent microglia and neurons. J. Neurosci. Res. 2005, 82, 306–315. [Google Scholar] [CrossRef]
  28. Spitale, F.M.; Vicario, N.; Rosa, M.D.; Tibullo, D.; Vecchio, M.; Gulino, R.; Parenti, R. Increased expression of connexin 43 in a mouse model of spinal motoneuronal loss. Aging 2020, 12, 12598–12608. [Google Scholar] [CrossRef]
  29. Vicario, N.; Denaro, S.; Turnaturi, R.; Longhitano, L.; Spitale, F.M.; Spoto, S.; Marrazzo, A.; Zappala, A.; Tibullo, D.; Li Volti, G.; et al. Mu and Delta Opioid Receptor Targeting Reduces Connexin 43-Based Heterocellular Coupling during Neuropathic Pain. Int. J. Mol. Sci. 2022, 23, 5864. [Google Scholar] [CrossRef]
  30. Clough, E.; Barrett, T. The Gene Expression Omnibus Database. Methods Mol. Biol. 2016, 1418, 93–110. [Google Scholar] [CrossRef] [Green Version]
  31. Durrenberger, P.F.; Fernando, F.S.; Magliozzi, R.; Kashefi, S.N.; Bonnert, T.P.; Ferrer, I.; Seilhean, D.; Nait-Oumesmar, B.; Schmitt, A.; Gebicke-Haerter, P.J.; et al. Selection of novel reference genes for use in the human central nervous system: A BrainNet Europe Study. Acta Neuropathol. 2012, 124, 893–903. [Google Scholar] [CrossRef] [PubMed]
  32. Krach, F.; Batra, R.; Wheeler, E.C.; Vu, A.Q.; Wang, R.; Hutt, K.; Rabin, S.J.; Baughn, M.W.; Libby, R.T.; Diaz-Garcia, S.; et al. Transcriptome-pathology correlation identifies interplay between TDP-43 and the expression of its kinase CK1E in sporadic ALS. Acta Neuropathol. 2018, 136, 405–423. [Google Scholar] [CrossRef] [PubMed]
  33. Castrogiovanni, P.; Li Volti, G.; Sanfilippo, C.; Tibullo, D.; Galvano, F.; Vecchio, M.; Avola, R.; Barbagallo, I.; Malaguarnera, L.; Castorina, S.; et al. Fasting and Fast Food Diet Play an Opposite Role in Mice Brain Aging. Mol. Neurobiol. 2018, 55, 6881–6893. [Google Scholar] [CrossRef] [PubMed]
  34. Sanfilippo, C.; Castrogiovanni, P.; Imbesi, R.; Tibullo, D.; Li Volti, G.; Barbagallo, I.; Vicario, N.; Musumeci, G.; Di Rosa, M. Middle-aged healthy women and Alzheimer’s disease patients present an overlapping of brain cell transcriptional profile. Neuroscience 2019, 406, 333–344. [Google Scholar] [CrossRef]
  35. Xiao, J.; Cao, H.; Chen, J. False discovery rate control incorporating phylogenetic tree increases detection power in microbiome-wide multiple testing. Bioinformatics 2017, 33, 2873–2881. [Google Scholar] [CrossRef]
  36. Smyth, G.K. Linear models and empirical bayes methods for assessing differential expression in microarray experiments. Stat. Appl. Genet. Mol. Biol. 2004, 3, 3. [Google Scholar] [CrossRef]
  37. Davis, S.; Meltzer, P.S. GEOquery: A bridge between the Gene Expression Omnibus (GEO) and BioConductor. Bioinformatics 2007, 23, 1846–1847. [Google Scholar] [CrossRef]
  38. Zuberi, K.; Franz, M.; Rodriguez, H.; Montojo, J.; Lopes, C.T.; Bader, G.D.; Morris, Q. GeneMANIA prediction server 2013 update. Nucleic Acids Res. 2013, 41, W115–W122. [Google Scholar] [CrossRef]
  39. Szklarczyk, D.; Gable, A.L.; Lyon, D.; Junge, A.; Wyder, S.; Huerta-Cepas, J.; Simonovic, M.; Doncheva, N.T.; Morris, J.H.; Bork, P.; et al. STRING v11: Protein-protein association networks with increased coverage, supporting functional discovery in genome-wide experimental datasets. Nucleic Acids Res. 2019, 47, D607–D613. [Google Scholar] [CrossRef]
  40. Chang, J.T.; Nevins, J.R. GATHER: A systems approach to interpreting genomic signatures. Bioinformatics 2006, 22, 2926–2933. [Google Scholar] [CrossRef] [Green Version]
  41. Krzywinski, M.; Schein, J.; Birol, I.; Connors, J.; Gascoyne, R.; Horsman, D.; Jones, S.J.; Marra, M.A. Circos: An information aesthetic for comparative genomics. Genome Res. 2009, 19, 1639–1645. [Google Scholar] [CrossRef] [PubMed]
  42. Wang, M.; Roussos, P.; McKenzie, A.; Zhou, X.; Kajiwara, Y.; Brennand, K.J.; De Luca, G.C.; Crary, J.F.; Casaccia, P.; Buxbaum, J.D.; et al. Integrative network analysis of nineteen brain regions identifies molecular signatures and networks underlying selective regional vulnerability to Alzheimer’s disease. Genome Med. 2016, 8, 104. [Google Scholar] [CrossRef] [PubMed]
  43. Guijarro-Munoz, I.; Compte, M.; Alvarez-Cienfuegos, A.; Alvarez-Vallina, L.; Sanz, L. Lipopolysaccharide activates Toll-like receptor 4 (TLR4)-mediated NF-kappaB signaling pathway and proinflammatory response in human pericytes. J. Biol. Chem. 2014, 289, 2457–2468. [Google Scholar] [CrossRef] [PubMed]
  44. Abbas, A.R.; Baldwin, D.; Ma, Y.; Ouyang, W.; Gurney, A.; Martin, F.; Fong, S.; van Lookeren Campagne, M.; Godowski, P.; Williams, P.M.; et al. Immune response in silico (IRIS): Immune-specific genes identified from a compendium of microarray expression data. Genes Immun. 2005, 6, 319–331. [Google Scholar] [CrossRef]
  45. Ashburner, M.; Ball, C.A.; Blake, J.A.; Botstein, D.; Butler, H.; Cherry, J.M.; Davis, A.P.; Dolinski, K.; Dwight, S.S.; Eppig, J.T.; et al. Gene ontology: Tool for the unification of biology. The Gene Ontology Consortium. Nat. Genet. 2000, 25, 25–29. [Google Scholar] [CrossRef]
  46. The Gene Ontology Consortium. Expansion of the Gene Ontology knowledgebase and resources. Nucleic Acids Res. 2017, 45, D331–D338. [Google Scholar] [CrossRef]
  47. Kanehisa, M.; Goto, S. KEGG: Kyoto encyclopedia of genes and genomes. Nucleic Acids Res. 2000, 28, 27–30. [Google Scholar] [CrossRef]
  48. Kanehisa, M. Toward understanding the origin and evolution of cellular organisms. Protein Sci. 2019, 28, 1947–1951. [Google Scholar] [CrossRef]
  49. Kanehisa, M.; Furumichi, M.; Sato, Y.; Ishiguro-Watanabe, M.; Tanabe, M. KEGG: Integrating viruses and cellular organisms. Nucleic Acids Res. 2021, 49, D545–D551. [Google Scholar] [CrossRef]
  50. Wang, Z.; Lachmann, A.; Keenan, A.B.; Ma’ayan, A. L1000FWD: Fireworks visualization of drug-induced transcriptomic signatures. Bioinformatics 2018, 34, 2150–2152. [Google Scholar] [CrossRef] [Green Version]
  51. Hillman, C.H.; Erickson, K.I.; Kramer, A.F. Be smart, exercise your heart: Exercise effects on brain and cognition. Nat. Rev. Neurosci. 2008, 9, 58–65. [Google Scholar] [CrossRef]
  52. Buchman, A.S.; Boyle, P.A.; Yu, L.; Shah, R.C.; Wilson, R.S.; Bennett, D.A. Total daily physical activity and the risk of AD and cognitive decline in older adults. Neurology 2012, 78, 1323–1329. [Google Scholar] [CrossRef]
  53. Box, G.E.; Tiao, G.C. Bayesian Inference in Statistical Analysis; Wiley: Hoboken, NJ, USA, 1992. [Google Scholar] [CrossRef]
  54. Zetterberg, H.; Bozzetta, E.; Favole, A.; Corona, C.; Cavarretta, M.C.; Ingravalle, F.; Blennow, K.; Pocchiari, M.; Meloni, D. Neurofilaments in blood is a new promising preclinical biomarker for the screening of natural scrapie in sheep. PLoS ONE 2019, 14, e0226697. [Google Scholar] [CrossRef]
  55. Catrogiovanni, P.; Musumeci, G.; Giunta, S.; Imbesi, R.; Di Rosa, M. The expression levels of CHI3L1 and IL15Ralpha correlate with TGM2 in duodenum biopsies of patients with celiac disease. Inflamm. Res. 2020, 69, 925–935. [Google Scholar] [CrossRef]
  56. Sanfilippo, C.; Pinzone, M.R.; Cambria, D.; Longo, A.; Palumbo, M.; Di Marco, R.; Condorelli, F.; Nunnari, G.; Malaguarnera, L.; Di Rosa, M. OAS Gene Family Expression Is Associated with HIV-Related Neurocognitive Disorders. Mol. Neurobiol. 2018, 55, 1905–1914. [Google Scholar] [CrossRef]
  57. Sanfilippo, C.; Nunnari, G.; Calcagno, A.; Malaguarnera, L.; Blennow, K.; Zetterberg, H.; Di Rosa, M. The chitinases expression is related to Simian Immunodeficiency Virus Encephalitis (SIVE) and in HIV encephalitis (HIVE). Virus Res. 2017, 227, 220–230. [Google Scholar] [CrossRef]
  58. Sanfilippo, C.; Malaguarnera, L.; Di Rosa, M. Chitinase expression in Alzheimer’s disease and non-demented brains regions. J. Neurol. Sci. 2016, 369, 242–249. [Google Scholar] [CrossRef]
  59. Di Rosa, M.; Giallongo, C.; Romano, A.; Tibullo, D.; Li Volti, G.; Musumeci, G.; Barbagallo, I.; Imbesi, R.; Castrogiovanni, P.; Palumbo, G.A. Immunoproteasome Genes Are Modulated in CD34(+) JAK2(V617F) Mutated Cells from Primary Myelofibrosis Patients. Int. J. Mol. Sci. 2020, 21, 2926. [Google Scholar] [CrossRef]
  60. Di Rosa, M.; Sanfilippo, C.; Libra, M.; Musumeci, G.; Malaguarnera, L. Different pediatric brain tumors are associated with different gene expression profiling. Acta Histochem. 2015, 117, 477–485. [Google Scholar] [CrossRef]
  61. Liu, C.C.; Guo, Y.; Vrindten, K.L.; Lau, W.W.; Sparks, R.; Tsang, J.S. OMiCC: An expanded and enhanced platform for meta-analysis of public gene expression data. STAR Protoc. 2022, 3, 101474. [Google Scholar] [CrossRef]
  62. Ruffo, P.; Cavallaro, S.; Conforti, F.L. The Advent of Omics Sciences in Clinical Trials of Motor Neuron Diseases. J. Pers. Med. 2022, 12, 758. [Google Scholar] [CrossRef]
  63. De Bock, M.; Leybaert, L.; Giaume, C. Connexin Channels at the Glio-Vascular Interface: Gatekeepers of the Brain. Neurochem. Res. 2017, 42, 2519–2536. [Google Scholar] [CrossRef]
  64. Kielian, T. Glial connexins and gap junctions in CNS inflammation and disease. J. Neurochem. 2008, 106, 1000–1016. [Google Scholar] [CrossRef]
  65. Kirichenko, E.Y.; Skatchkov, S.N.; Ermakov, A.M. Structure and Functions of Gap Junctions and Their Constituent Connexins in the Mammalian CNS. Biochem. (Mosc.) Suppl. Ser. A Membr. Cell Biol. 2021, 15, 107–119. [Google Scholar] [CrossRef]
  66. Dharmadasa, T.; Matamala, J.M.; Huynh, W.; Zoing, M.C.; Kiernan, M.C. Motor neurone disease. Handb. Clin. Neurol. 2018, 159, 345–357. [Google Scholar] [CrossRef]
  67. Diaz-Amarilla, P.; Olivera-Bravo, S.; Trias, E.; Cragnolini, A.; Martinez-Palma, L.; Cassina, P.; Beckman, J.; Barbeito, L. Phenotypically aberrant astrocytes that promote motoneuron damage in a model of inherited amyotrophic lateral sclerosis. Proc. Natl. Acad. Sci. USA 2011, 108, 18126–18131. [Google Scholar] [CrossRef]
  68. Freitas-Andrade, M.; Naus, C.C. Astrocytes in neuroprotection and neurodegeneration: The role of connexin43 and pannexin1. Neuroscience 2016, 323, 207–221. [Google Scholar] [CrossRef]
  69. Eugenin, E.A.; Eckardt, D.; Theis, M.; Willecke, K.; Bennett, M.V.; Saez, J.C. Microglia at brain stab wounds express connexin 43 and in vitro form functional gap junctions after treatment with interferon-gamma and tumor necrosis factor-alpha. Proc. Natl. Acad. Sci. USA 2001, 98, 4190–4195. [Google Scholar] [CrossRef]
  70. Shaikh, S.B.; Uy, B.; Perera, A.; Nicholson, L.F. AGEs-RAGE mediated up-regulation of connexin43 in activated human microglial CHME-5 cells. Neurochem. Int. 2012, 60, 640–651. [Google Scholar] [CrossRef]
  71. Gajardo-Gomez, R.; Labra, V.C.; Orellana, J.A. Connexins and Pannexins: New Insights into Microglial Functions and Dysfunctions. Front. Mol. Neurosci. 2016, 9, 86. [Google Scholar] [CrossRef]
  72. Genc, B.; Jara, J.H.; Lagrimas, A.K.; Pytel, P.; Roos, R.P.; Mesulam, M.M.; Geula, C.; Bigio, E.H.; Ozdinler, P.H. Apical dendrite degeneration, a novel cellular pathology for Betz cells in ALS. Sci. Rep. 2017, 7, 41765. [Google Scholar] [CrossRef]
  73. Rinaldi, F.; Hartfield, E.M.; Crompton, L.A.; Badger, J.L.; Glover, C.P.; Kelly, C.M.; Rosser, A.E.; Uney, J.B.; Caldwell, M.A. Cross-regulation of Connexin43 and beta-catenin influences differentiation of human neural progenitor cells. Cell Death Dis. 2014, 5, e1017. [Google Scholar] [CrossRef] [PubMed]
  74. Brocardo, L.; Acosta, L.E.; Piantanida, A.P.; Rela, L. Beneficial and Detrimental Remodeling of Glial Connexin and Pannexin Functions in Rodent Models of Nervous System Diseases. Front. Cell. Neurosci. 2019, 13, 491. [Google Scholar] [CrossRef] [PubMed]
  75. Hosli, L.; Binini, N.; Ferrari, K.D.; Thieren, L.; Looser, Z.J.; Zuend, M.; Zanker, H.S.; Berry, S.; Holub, M.; Mobius, W.; et al. Decoupling astrocytes in adult mice impairs synaptic plasticity and spatial learning. Cell Rep. 2022, 38, 110484. [Google Scholar] [CrossRef] [PubMed]
  76. Liang, Z.; Wang, X.; Hao, Y.; Qiu, L.; Lou, Y.; Zhang, Y.; Ma, D.; Feng, J. The Multifaceted Role of Astrocyte Connexin 43 in Ischemic Stroke Through Forming Hemichannels and Gap Junctions. Front. Neurol. 2020, 11, 703. [Google Scholar] [CrossRef]
  77. Gulino, R.; Vicario, N.; Giunta, M.A.S.; Spoto, G.; Calabrese, G.; Vecchio, M.; Gulisano, M.; Leanza, G.; Parenti, R. Neuromuscular Plasticity in a Mouse Neurotoxic Model of Spinal Motoneuronal Loss. Int. J. Mol. Sci. 2019, 20, 1500. [Google Scholar] [CrossRef]
  78. Yacila, G.; Sari, Y. Potential therapeutic drugs and methods for the treatment of amyotrophic lateral sclerosis. Curr. Med. Chem. 2014, 21, 3583–3593. [Google Scholar] [CrossRef]
  79. Kato, H.; Naito, M.; Saito, T.; Hideyama, T.; Suzuki, Y.; Kimura, T.; Kwak, S.; Aizawa, H. Prolyl Isomerase Pin1 Expression in the Spinal Motor Neurons of Patients With Sporadic Amyotrophic Lateral Sclerosis. J. Clin. Neurol. 2022, 18, 463–469. [Google Scholar] [CrossRef]
  80. Pinto, S.; Swash, M.; De Carvalho, M. Compensatory metabolic and central respiratory drive mechanisms in ALS. Amyotroph. Lateral Scler. Front. Degener. 2021, 22, 585–587. [Google Scholar] [CrossRef]
  81. Giusto, E.; Codrich, M.; de Leo, G.; Francardo, V.; Coradazzi, M.; Parenti, R.; Gulisano, M.; Vicario, N.; Gulino, R.; Leanza, G. Compensatory changes in degenerating spinal motoneurons sustain functional sparing in the SOD1-G93A mouse model of amyotrophic lateral sclerosis. J. Comp. Neurol. 2020, 528, 231–243. [Google Scholar] [CrossRef]
  82. Hur, S.K.; Hunter, M.; Dominique, M.A.; Farag, M.; Cotton-Samuel, D.; Khan, T.; Trojanowski, J.Q.; Spiller, K.J.; Lee, V.M. Slow motor neurons resist pathological TDP-43 and mediate motor recovery in the rNLS8 model of amyotrophic lateral sclerosis. Acta Neuropathol. Commun. 2022, 10, 75. [Google Scholar] [CrossRef] [PubMed]
  83. Orellana, J.A.; Sanchez, H.A.; Schalper, K.A.; Figueroa, V.; Saez, J.C. Regulation of intercellular calcium signaling through calcium interactions with connexin-based channels. Adv. Exp. Med. Biol. 2012, 740, 777–794. [Google Scholar] [CrossRef] [PubMed]
  84. Morello, G.; Spampinato, A.G.; Cavallaro, S. Neuroinflammation and ALS: Transcriptomic Insights into Molecular Disease Mechanisms and Therapeutic Targets. Mediat. Inflamm. 2017, 2017, 7070469. [Google Scholar] [CrossRef]
  85. Froger, N.; Orellana, J.A.; Calvo, C.F.; Amigou, E.; Kozoriz, M.G.; Naus, C.C.; Saez, J.C.; Giaume, C. Inhibition of cytokine-induced connexin43 hemichannel activity in astrocytes is neuroprotective. Mol. Cell. Neurosci. 2010, 45, 37–46. [Google Scholar] [CrossRef] [PubMed]
  86. De Bock, M.; Wang, N.; Decrock, E.; Bol, M.; Gadicherla, A.K.; Culot, M.; Cecchelli, R.; Bultynck, G.; Leybaert, L. Endothelial calcium dynamics, connexin channels and blood-brain barrier function. Prog. Neurobiol. 2013, 108, 1–20. [Google Scholar] [CrossRef]
  87. Abudara, V.; Roux, L.; Dallerac, G.; Matias, I.; Dulong, J.; Mothet, J.P.; Rouach, N.; Giaume, C. Activated microglia impairs neuroglial interaction by opening Cx43 hemichannels in hippocampal astrocytes. Glia 2015, 63, 795–811. [Google Scholar] [CrossRef]
  88. Batova, S.; DeWever, J.; Godfraind, T.; Balligand, J.L.; Dessy, C.; Feron, O. The calcium channel blocker amlodipine promotes the unclamping of eNOS from caveolin in endothelial cells. Cardiovasc. Res. 2006, 71, 478–485. [Google Scholar] [CrossRef]
  89. Lukic-Panin, V.; Kamiya, T.; Zhang, H.; Hayashi, T.; Tsuchiya, A.; Sehara, Y.; Deguchi, K.; Yamashita, T.; Abe, K. Prevention of neuronal damage by calcium channel blockers with antioxidative effects after transient focal ischemia in rats. Brain Res. 2007, 1176, 143–150. [Google Scholar] [CrossRef]
  90. Miziak, B.; Blaszczyk, B.; Czuczwar, S.J. Some Candidate Drugs for Pharmacotherapy of Alzheimer’s Disease. Pharmaceuticals 2021, 14, 458. [Google Scholar] [CrossRef]
  91. Sharma, N.; Jamwal, S.; Kumar, P. Beneficial effect of antidepressants against rotenone induced Parkinsonism like symptoms in rats. Pathophysiology 2016, 23, 123–134. [Google Scholar] [CrossRef]
  92. Fidilio, A.; Grasso, M.; Turnaturi, R.; Caruso, G.; Spitale, F.M.; Vicario, N.; Parenti, R.; Spoto, S.; Musso, N.; Marrazzo, A.; et al. The Multimodal MOPr/DOPr Agonist LP2 Reduces Allodynia in Chronic Constriction Injured Rats by Rescue of TGF-beta1 Signalling. Front. Pharm. 2021, 12, 749365. [Google Scholar] [CrossRef] [PubMed]
  93. Diem, R.; Sattler, M.B.; Merkler, D.; Demmer, I.; Maier, K.; Stadelmann, C.; Ehrenreich, H.; Bahr, M. Combined therapy with methylprednisolone and erythropoietin in a model of multiple sclerosis. Brain 2005, 128, 375–385. [Google Scholar] [CrossRef] [PubMed]
  94. Viscomi, M.T.; Florenzano, F.; Latini, L.; Amantea, D.; Bernardi, G.; Molinari, M. Methylprednisolone treatment delays remote cell death after focal brain lesion. Neuroscience 2008, 154, 1267–1282. [Google Scholar] [CrossRef] [PubMed]
  95. Wang, P.; Xie, K.; Wang, C.; Bi, J. Oxidative stress induced by lipid peroxidation is related with inflammation of demyelination and neurodegeneration in multiple sclerosis. Eur. Neurol. 2014, 72, 249–254. [Google Scholar] [CrossRef]
  96. Zhang, H.K.; Ye, Y.; Zhao, Z.N.; Li, K.J.; Du, Y.; Hu, Q.M.; He, J.F. Neuroprotective effects of gypenosides in experimental autoimmune optic neuritis. Int. J. Ophthalmol. 2017, 10, 541–549. [Google Scholar] [CrossRef]
  97. Cheadle, C.; Vawter, M.P.; Freed, W.J.; Becker, K.G. Analysis of microarray data using Z score transformation. J. Mol. Diagn. 2003, 5, 73–81. [Google Scholar] [CrossRef]
  98. Care, M.A.; Barrans, S.; Worrillow, L.; Jack, A.; Westhead, D.R.; Tooze, R.M. A microarray platform-independent classification tool for cell of origin class allows comparative analysis of gene expression in diffuse large B-cell lymphoma. PLoS ONE 2013, 8, e55895. [Google Scholar] [CrossRef]
  99. Wang, J.; Coombes, K.R.; Highsmith, W.E.; Keating, M.J.; Abruzzo, L.V. Differences in gene expression between B-cell chronic lymphocytic leukemia and normal B cells: A meta-analysis of three microarray studies. Bioinformatics 2004, 20, 3166–3178. [Google Scholar] [CrossRef]
  100. Reddy, T.B.; Riley, R.; Wymore, F.; Montgomery, P.; DeCaprio, D.; Engels, R.; Gellesch, M.; Hubble, J.; Jen, D.; Jin, H.; et al. TB database: An integrated platform for tuberculosis research. Nucleic Acids Res. 2009, 37, D499–D508. [Google Scholar] [CrossRef]
  101. Le Cao, K.A.; Rohart, F.; McHugh, L.; Korn, O.; Wells, C.A. YuGene: A simple approach to scale gene expression data derived from different platforms for integrated analyses. Genomics 2014, 103, 239–251. [Google Scholar] [CrossRef]
  102. Chen, Q.R.; Song, Y.K.; Wei, J.S.; Bilke, S.; Asgharzadeh, S.; Seeger, R.C.; Khan, J. An integrated cross-platform prognosis study on neuroblastoma patients. Genomics 2008, 92, 195–203. [Google Scholar] [CrossRef] [PubMed]
  103. Yasrebi, H.; Sperisen, P.; Praz, V.; Bucher, P. Can survival prediction be improved by merging gene expression data sets? PLoS ONE 2009, 4, e7431. [Google Scholar] [CrossRef] [PubMed]
  104. Mehmood, R.; El-Ashram, S.; Bie, R.; Dawood, H.; Kos, A. Clustering by fast search and merge of local density peaks for gene expression microarray data. Sci. Rep. 2017, 7, 45602. [Google Scholar] [CrossRef] [PubMed]
  105. Cheadle, C.; Cho-Chung, Y.S.; Becker, K.G.; Vawter, M.P. Application of z-score transformation to Affymetrix data. Appl. Bioinform. 2003, 2, 209–217. [Google Scholar]
  106. Feng, C.; Wu, J.; Yang, F.; Qiu, M.; Hu, S.; Guo, S.; Wu, J.; Ying, X.; Wang, J. Expression of Bcl-2 is a favorable prognostic biomarker in lung squamous cell carcinoma. Oncol. Lett. 2018, 15, 6925–6930. [Google Scholar] [CrossRef]
  107. Kang, C.; Huo, Y.; Xin, L.; Tian, B.; Yu, B. Feature selection and tumor classification for microarray data using relaxed Lasso and generalized multi-class support vector machine. J. Theor. Biol. 2019, 463, 77–91. [Google Scholar] [CrossRef]
Figure 1. GJA1 is highly expressed in the spinal cord and MNs of ALS patients compared to NDC. (a) GJA1 expression levels in MNs of NDC (n = 9) and ALS (n = 13); (b) perfect diagnostic ability of GJA1 expression levels to discriminate NDC subjects from ALS patients (AUC = 0.7813, p < 0.037). Data are expressed as RPKM intensity expression levels (means and SD) and presented as violin dot plots. * p-value < 0.01.
Biomedicines 10 02246 g001
Figure 2. Neuro-immune signature deconvolution analysis obtained by GSPC/GSNC-GJA1 in the spinal cord of ALS patients. The intersection of gene lists positively/negatively (GSPC/GSNC) correlated to GJA1 expression levels in ALS patients to the 17 neuro-immune signatures belonging to the CNS cells (n = 5), the immune cells (n = 7), and biological processes (n = 5). The genes in common obtained from the overlaps are expressed in percentages and represented as a bar chart.
Biomedicines 10 02246 g002
Figure 3. Significant intersection between neuro-immune signature and GSPC/GSNC-GJA1 in the spinal cord of ALS patients. (a,b) The intersection of gene lists positively ((a), GSPC) and negatively ((b), GSNC) correlated to GJA1 expression levels in ALS patients to the 17neuro-immune signature belonging to the CNS cells (n = 5), the immune cells (n = 7), and biological processes (n = 5). The genes in common obtained from the overlaps are expressed in percentages and represented as the size of bobble chart. The p-value obtained by Fisher’s test is expressed as neglog10 (p-value) (abscissa axis). p-values < 0.05 were considered as statistically significant (neglog10 (p-value) > 1.30). The representation factor is reported to the ordinate axis. A RF > 1 indicates more overlap than expected between the two independent groups, a RF < 1 indicates less overlap than expected, and a RF of 1 indicates that the two groups are identical by the number of genes expected to be independent in the groups.
Biomedicines 10 02246 g003
Figure 4. GO analysis of common genes identified by the microglia signatures determined by GJA1 high spinal cord expression levels. (a) Fisher t-test analysis showed 70 genes significant in common between microglia–neuro-immune signature and GSPC-GJA1 signature. The main biological process involved in activation of 70 genes was the immune response (FDR = 3.07E−20, n = 39). (b) Cluster 1 identified by 25 genes with the leukocyte activation as the main biological process (FDR = 1.76E−06, n = 12). (c) Cluster 2 identified by 19 genes with the immune response as the main biological process (FDR = 0.00027, n = 11). (d) Cluster 3 identified by 26 genes with the regulation of immune system process as the main biological process (FDR = 6.56E−07, n = 15).
Biomedicines 10 02246 g004
Figure 5. GO analysis of common genes identified by the neuron signatures determined by GJA1 low spinal cord expression levels. (a) Fisher t-test analysis showed 426 genes significant in common between neuron–neuro-immune signature and GSNC-GJA1 signature. The main biological process involved in activation of 426 genes was the chemical synaptic transmission (FDR = 9.10E−26, n = 61). (b) Cluster 1 identified by 117 genes with the nucleobase biosynthetic process as the main biological process (FDR = 0.0003, n = 12). (c) Cluster 2 identified by 209 genes with the neurogenesis as the main biological process (FDR = 5.54E−11, n = 54). (d) Cluster 3 identified by 100 genes with the regulation of ion transmembrane transport as the main biological process (FDR = 6.01E−06, n = 17).
Biomedicines 10 02246 g005
Figure 6. Anti-signature perturbation analysis. L1000FDW visualization of drug-induced signature. Input genes are represented by the significantly GSPC-GJA1 and GSNC-GJA1. Dots are color-coded based on the Mode of Action (MOA) of the respective drug. The drugs with a higher CS (i.e., amlodipine, sertraline, and prednisolone) were selected.
Biomedicines 10 02246 g006
Table 1. Datasets selected.
DatasetPlatformOrgSamplesSample OriginPlatformNDCALSRef
1GSE26927MicroarrayHuman19Spinal cordGPL6255910[31]
2GSE76220RNA-seqHuman22Spinal cord MNsGPL9115913[32]
Org: organism; NDC: control not ALS affected; ALS: sporadic amyotrophic lateral sclerosis; MNs: motoneurons.
Table 2. Genes correlated to GJA1 in ALS patients.
SamplesGenesR
Unique Genes significantly positively
correlated (GSPC) to GJA1
25420.50 < R < 0.91
Unique Genes significantly negatively
correlated (GSNC) to GJA1
31100.50 < R < 0.96
Table 3. Neuro-immune cells signature.
SignaturesCells and ProcessesSourceUnique Genes
Neural cells1AstrocyteGSE67835177
2MicrogliaGSE6783593
3NeuronGSE67835974
4OligodendrocyteGSE6783595
5Pericyte immune activatedGSE46236206
Immune cells6M1 macrophagesGSE5099674
7M2 macrophagesGSE5099132
8Natural killer (KN)GSE22886114
9TH1GSE22886191
10TH2GSE2288685
11Endothelial cellsGSE6783555
12CTLsGSE2288662
Biological
processes
13Brain microvesselsGSE22886291
14Host virus interactionKEGG279
15Inflammatory responseKEGG704
16Synaptic transmission genesGO:009881445
17Synaptic vesicle cycleKEGG78
Table 4. Potential anti-ALS drugs identified by the L1000FWD analysis.
DrugsScore
Similarity
Z-ScoreCombined Score (CS)Mechanism of
Action (MOA)
Indication(s)
1Amlodipine−0.0261.84−7.49Calcium channel
blocker
Hypertension
2Sertraline−0.0211.78−1.83Selective serotonin
reuptake inhibitor
Depression;
Obsessive–compulsive disorder; panic disorder; post-traumatic stress disorder
3Prednisolone−0.0211.81−1.57Synthetic
glucocorticoid with anti-inflammatory and
immunomodulatory effect
Adrenergic agent; anti-inflammatory drug; antineoplastic agent; immunosuppressive agent
Publisher’s Note: MDPI stays neutral with regard to jurisdictional claims in published maps and institutional affiliations.

