
A Robust Deep Model for Classification of Peptic Ulcer and Other Digestive Tract Disorders Using Endoscopic Images

 , , ,
, , ,  , ,
, ,
Abstract
:1. Introduction
- We propose a robust CNN architecture for GI tract disorders which offers a variety of filters that can help accurately identify the lesion and we also decrease the model complexity by reducing the number of training parameters to achieve remarkable classification results.
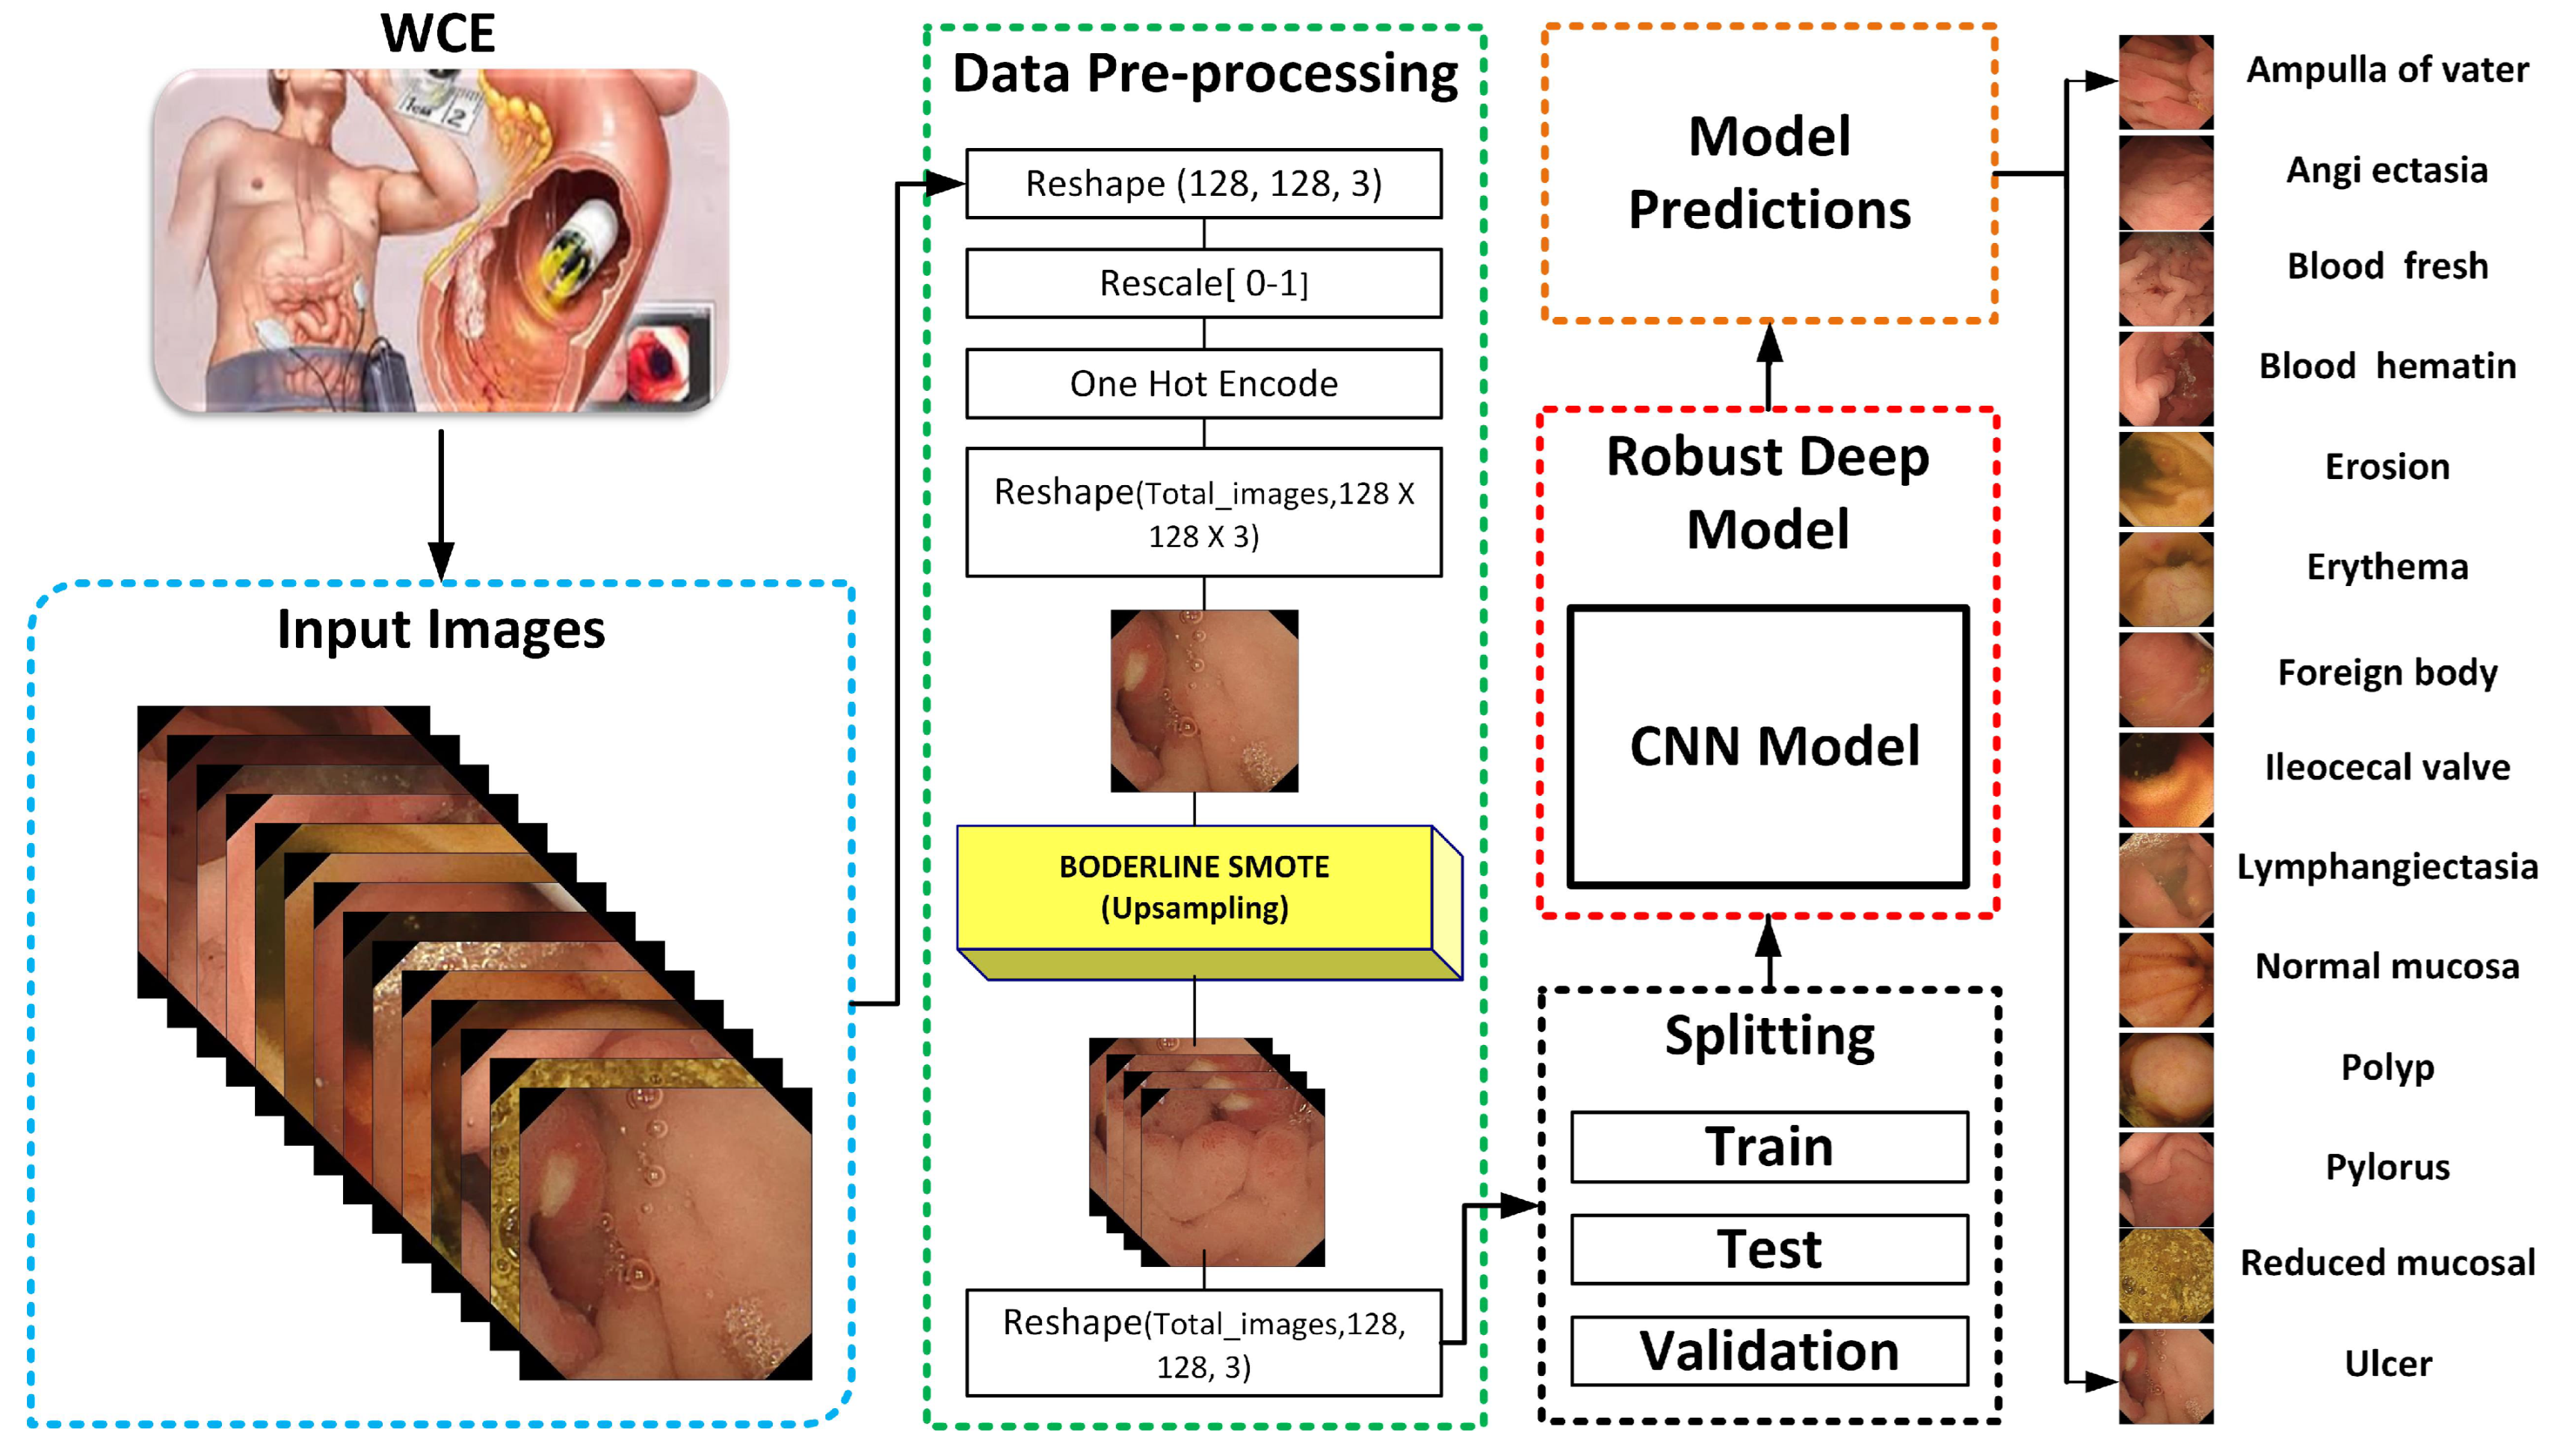
- Due to the class imbalance problem of medical datasets, the accuracy of the CNN models is compromised. We solve this problem by employing an up-sampling algorithm, BL-SMOTE, to generate concoction image samples concerning each class to achieve better accuracy.
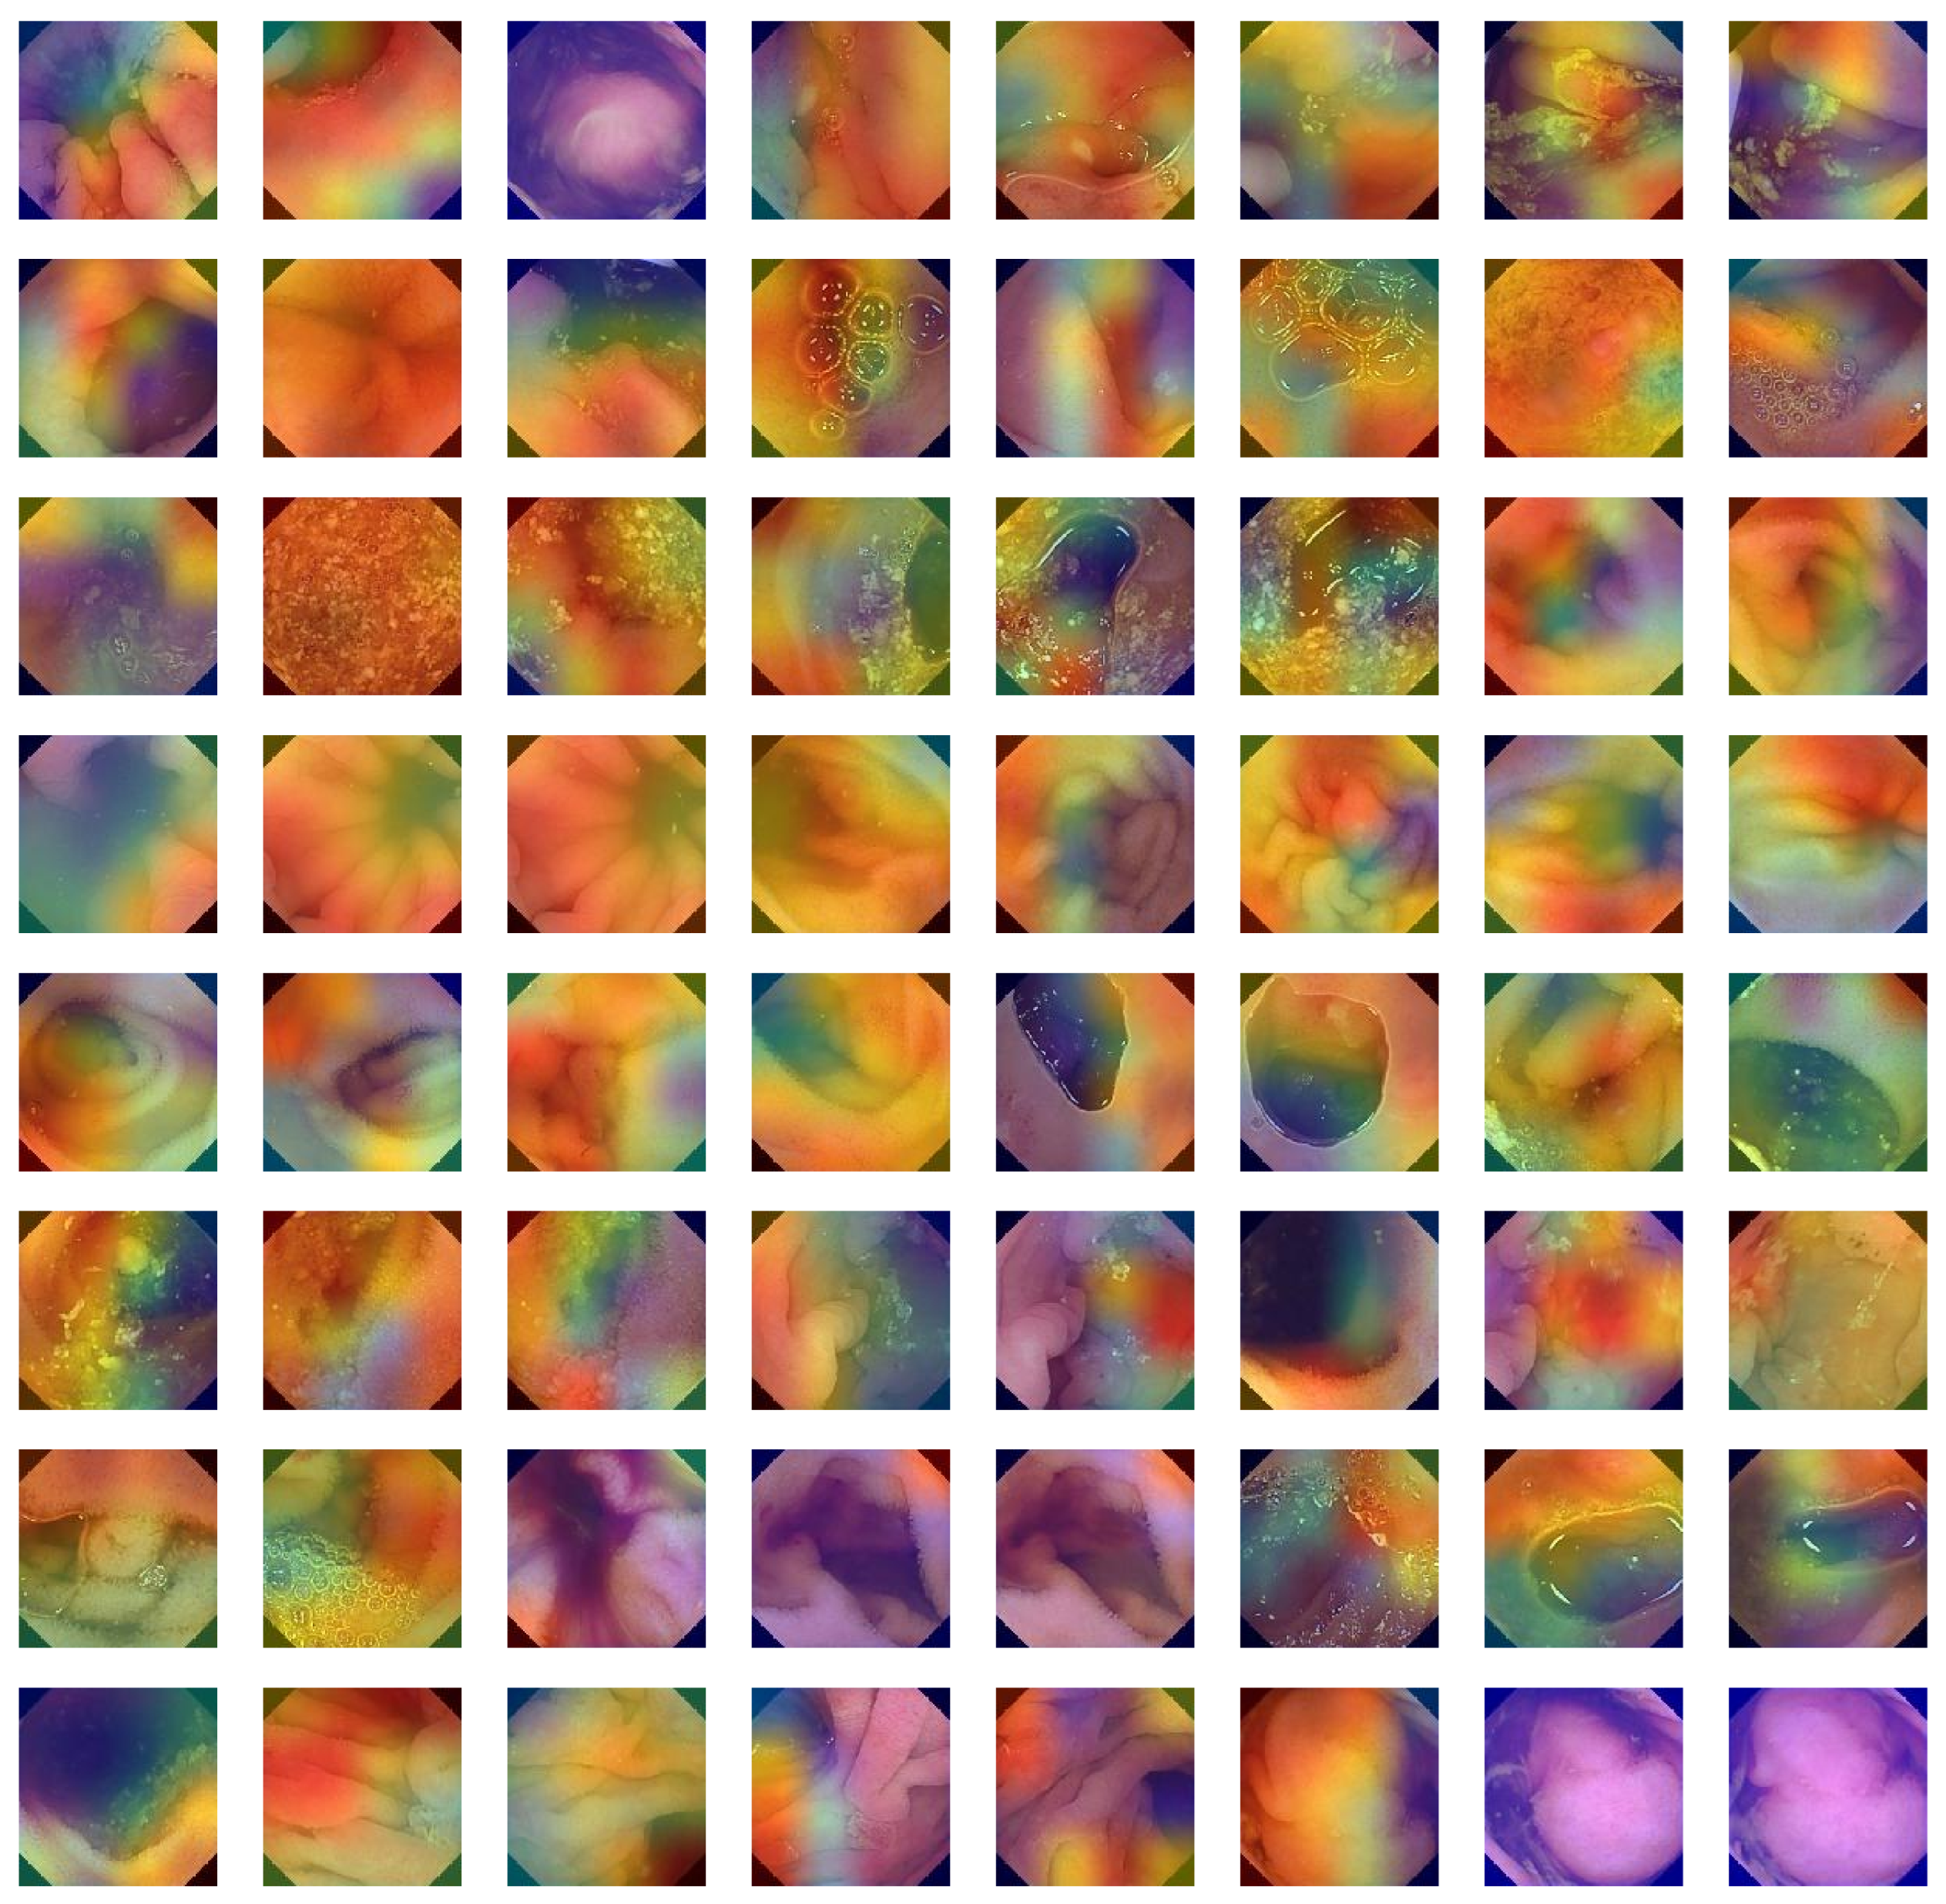
- The Grad-CAM heat-map algorithm is used to depict the visual characteristics of GI tract ailment approaches to reaching classification decisions.
- Using a variety of evaluation metrics, including accuracy, AUC, precision, recall, F1-score, loss, and quantity of trainable parameters, we also compared our proposed architecture to existing models. It has been found that our method performs better than other cutting-edge models.
2. Materials and Methods
3. The Proposed GI-Detection Model
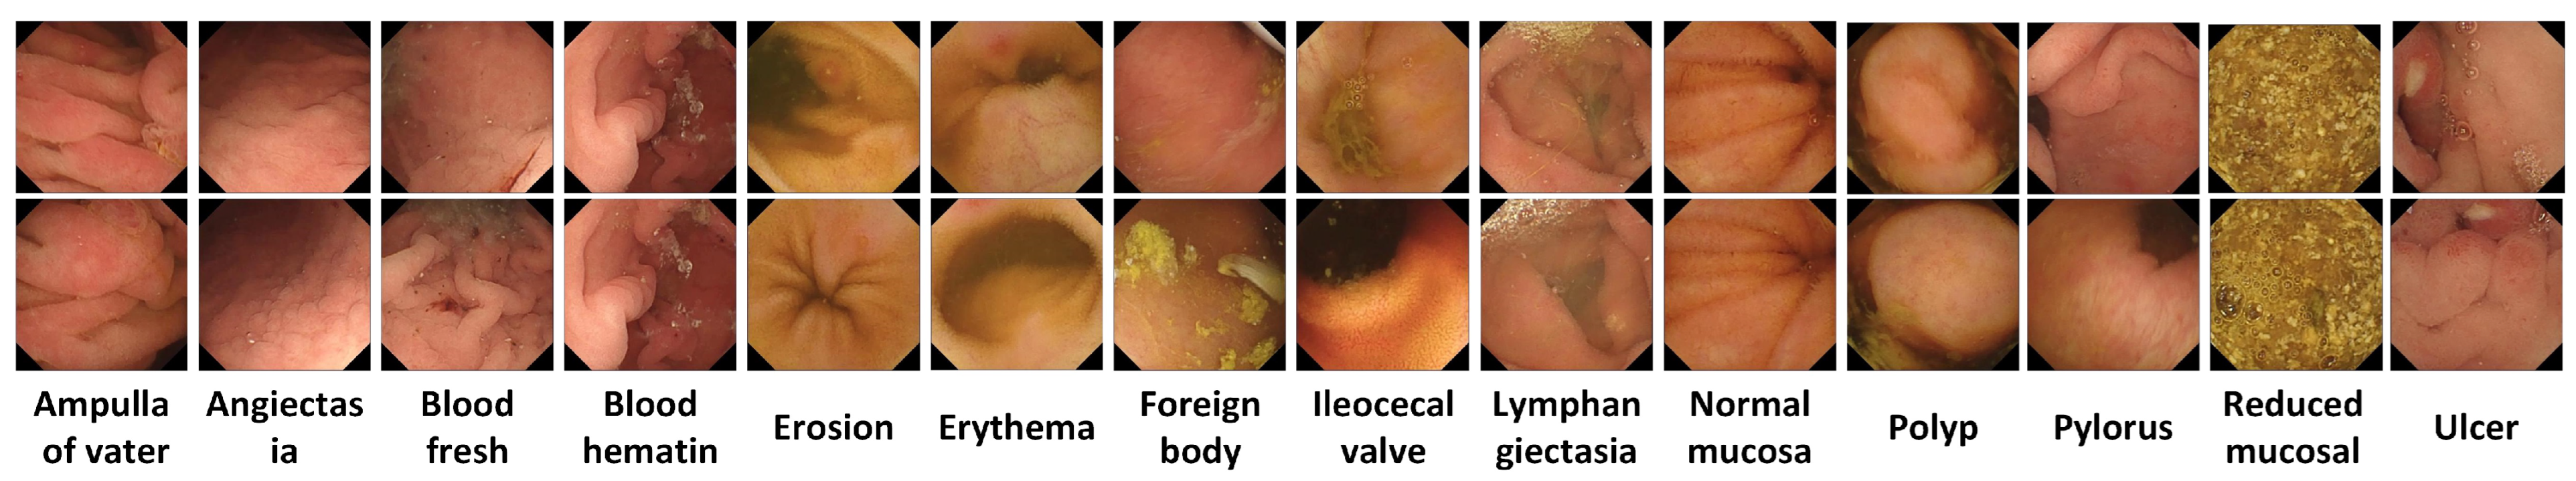
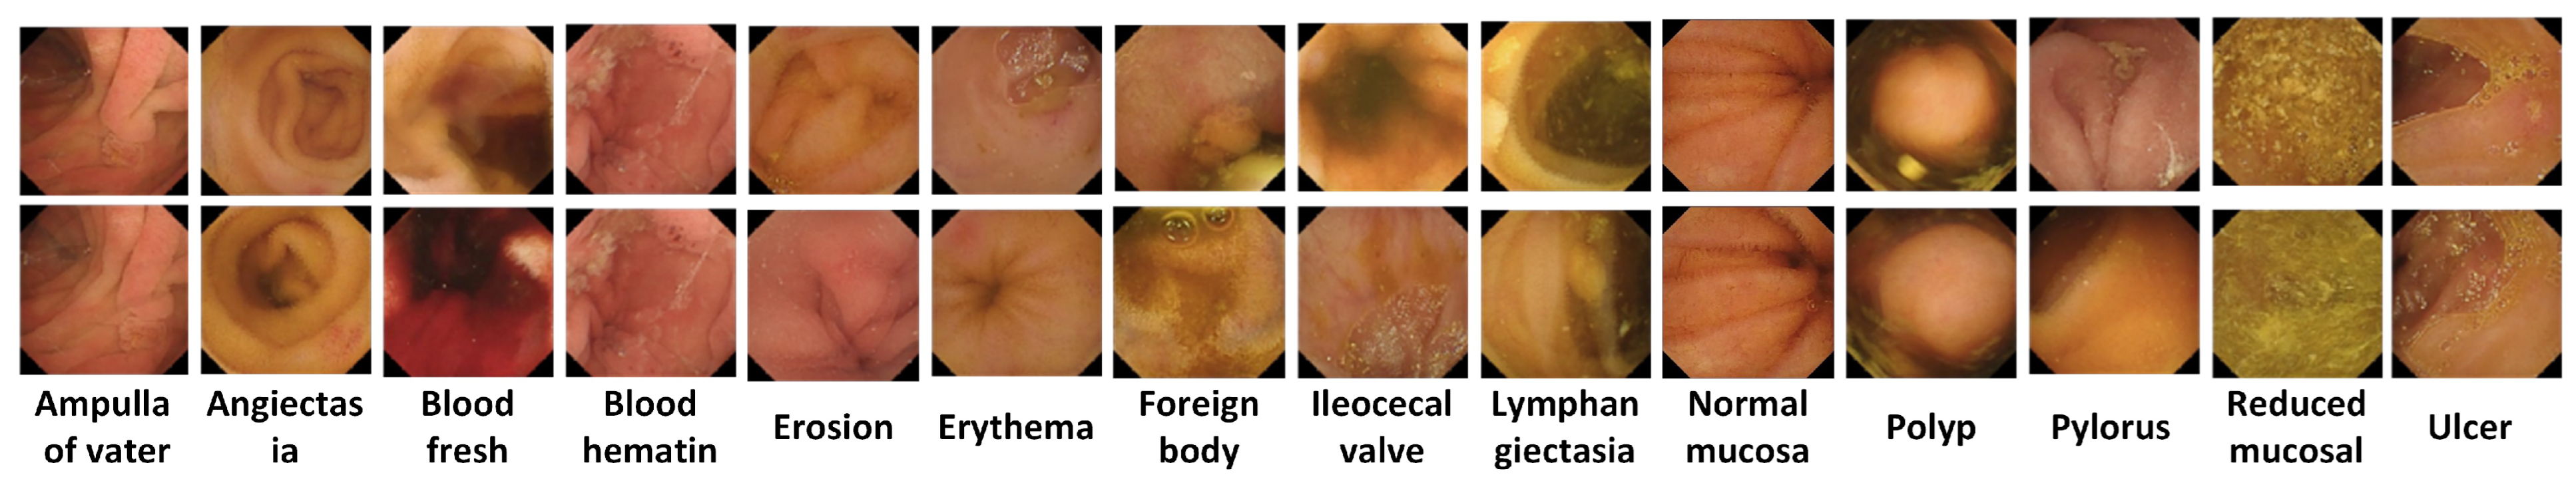
3.1. WCE Dataset Description
3.2. Balanced Each Class Sample Using BL-SMOTE
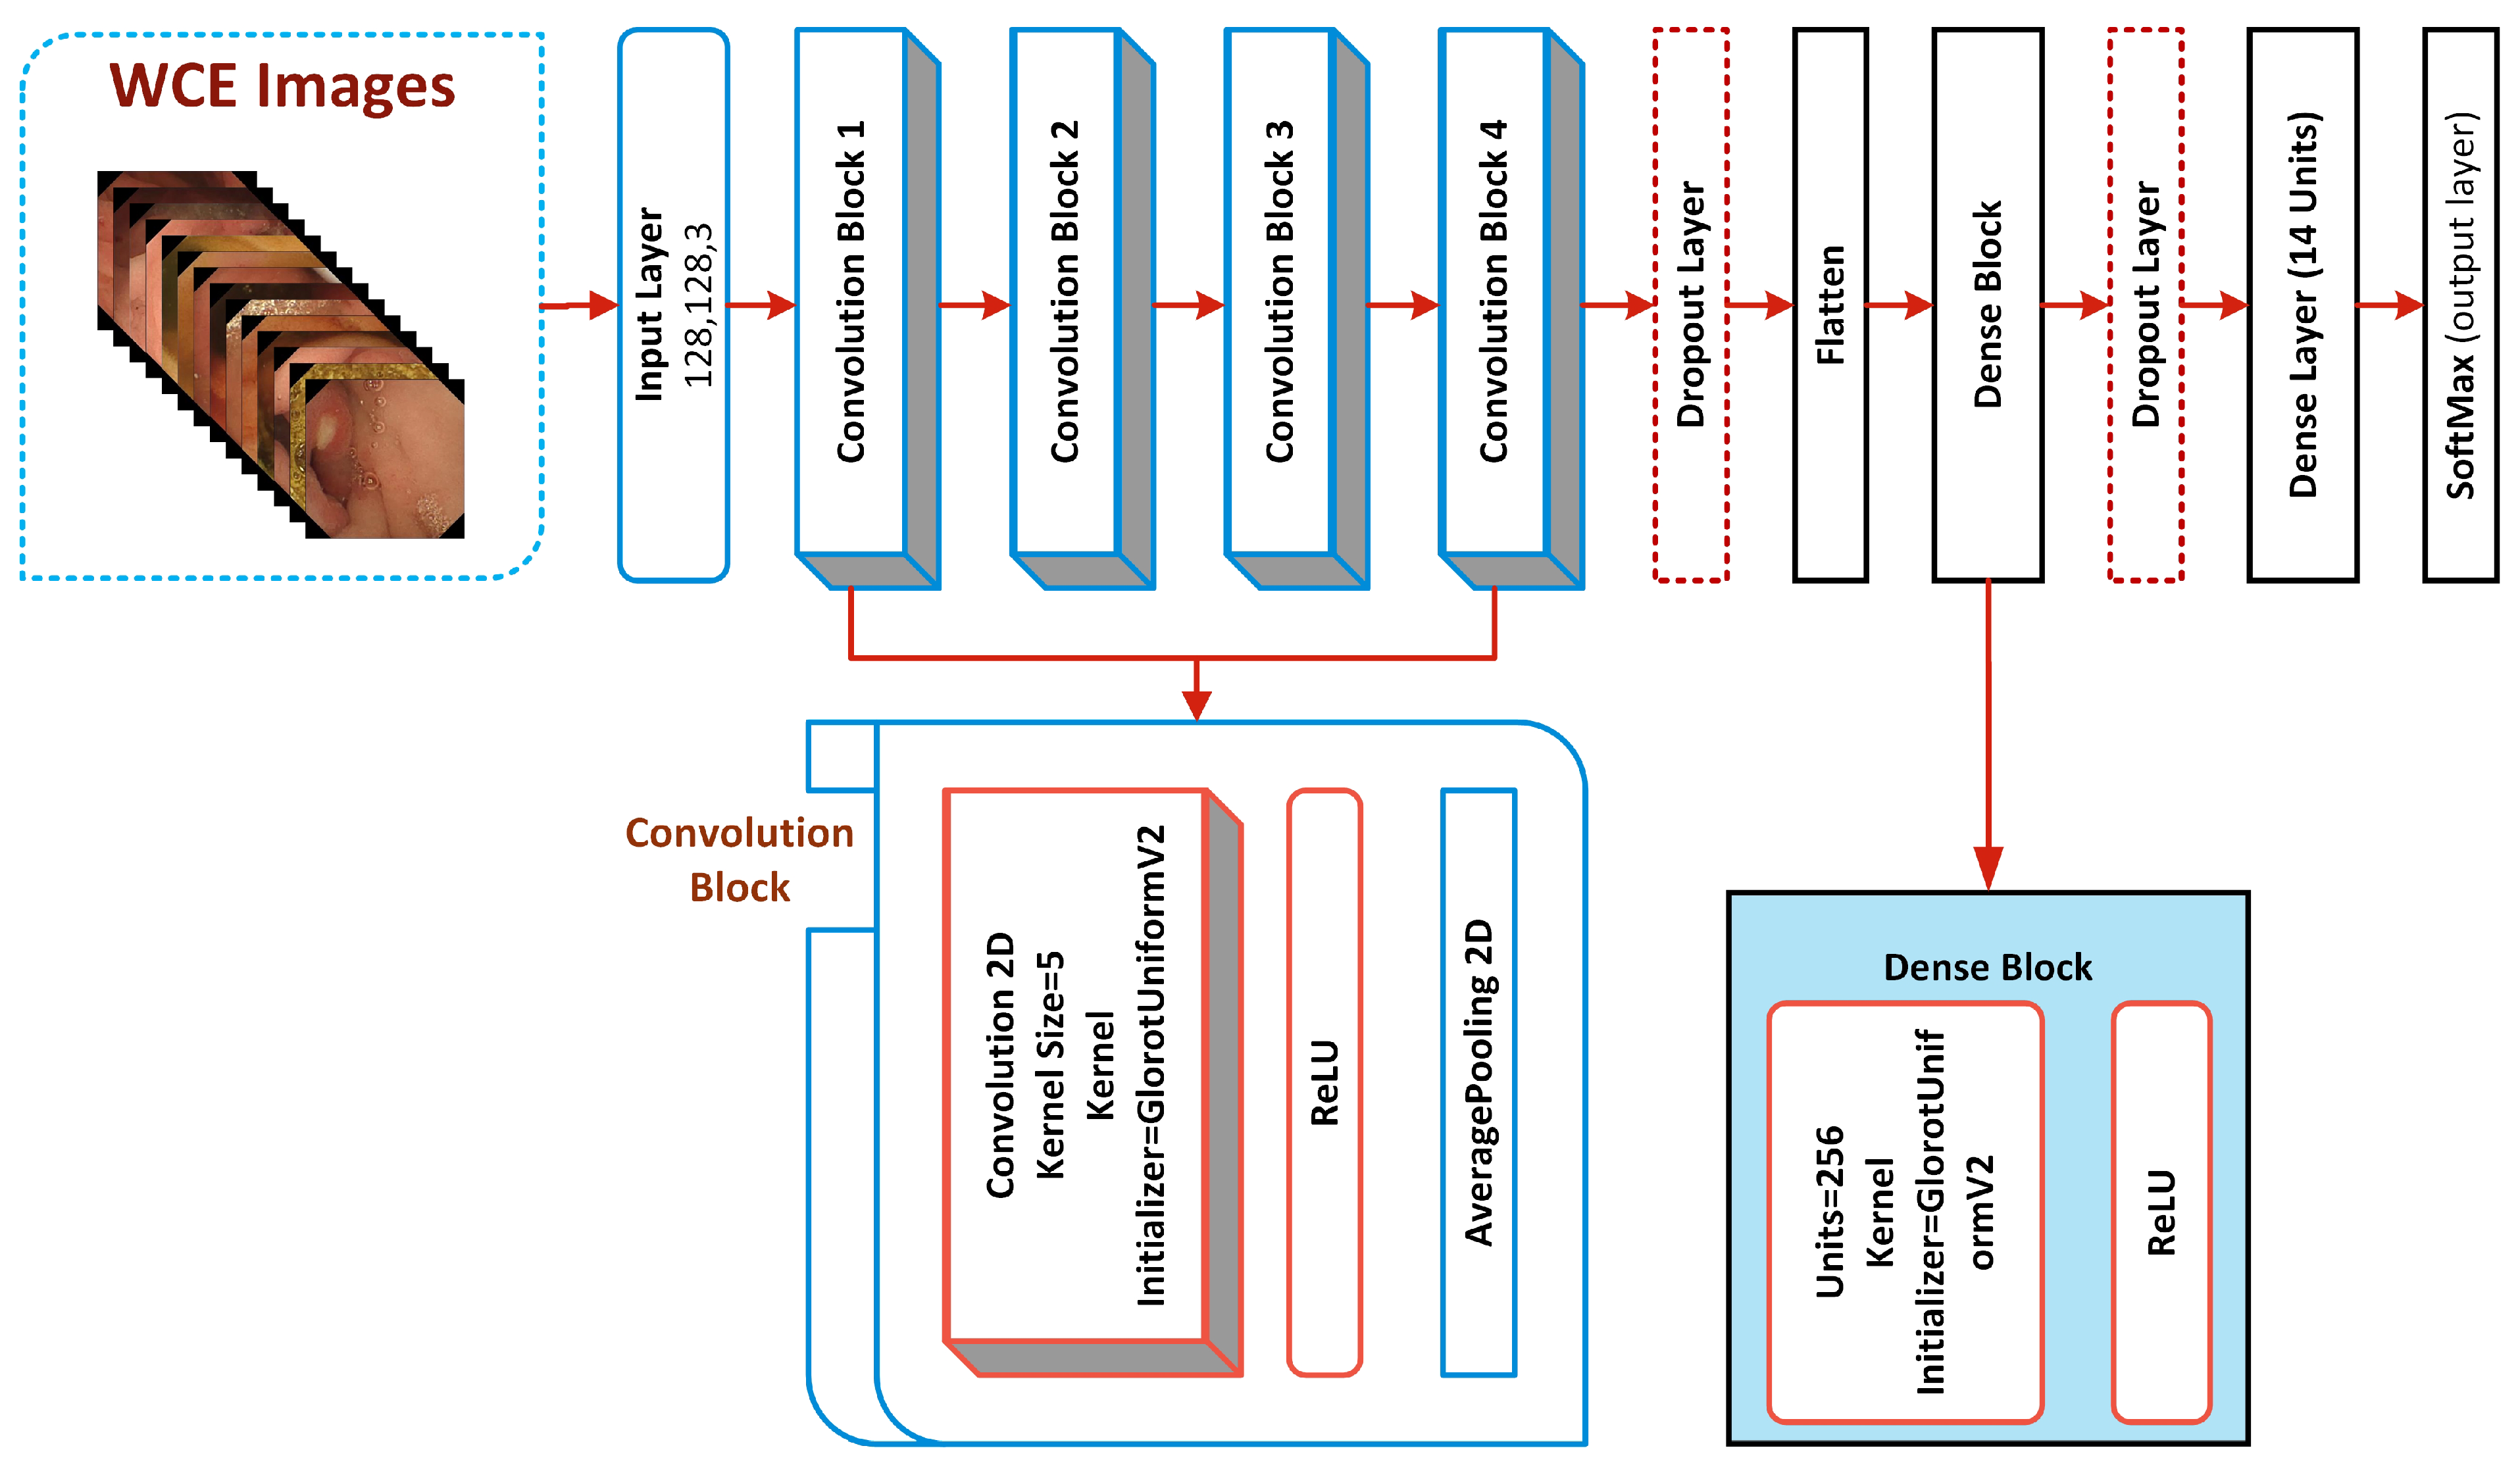
4. Components of Proposed Classification Model for WCE
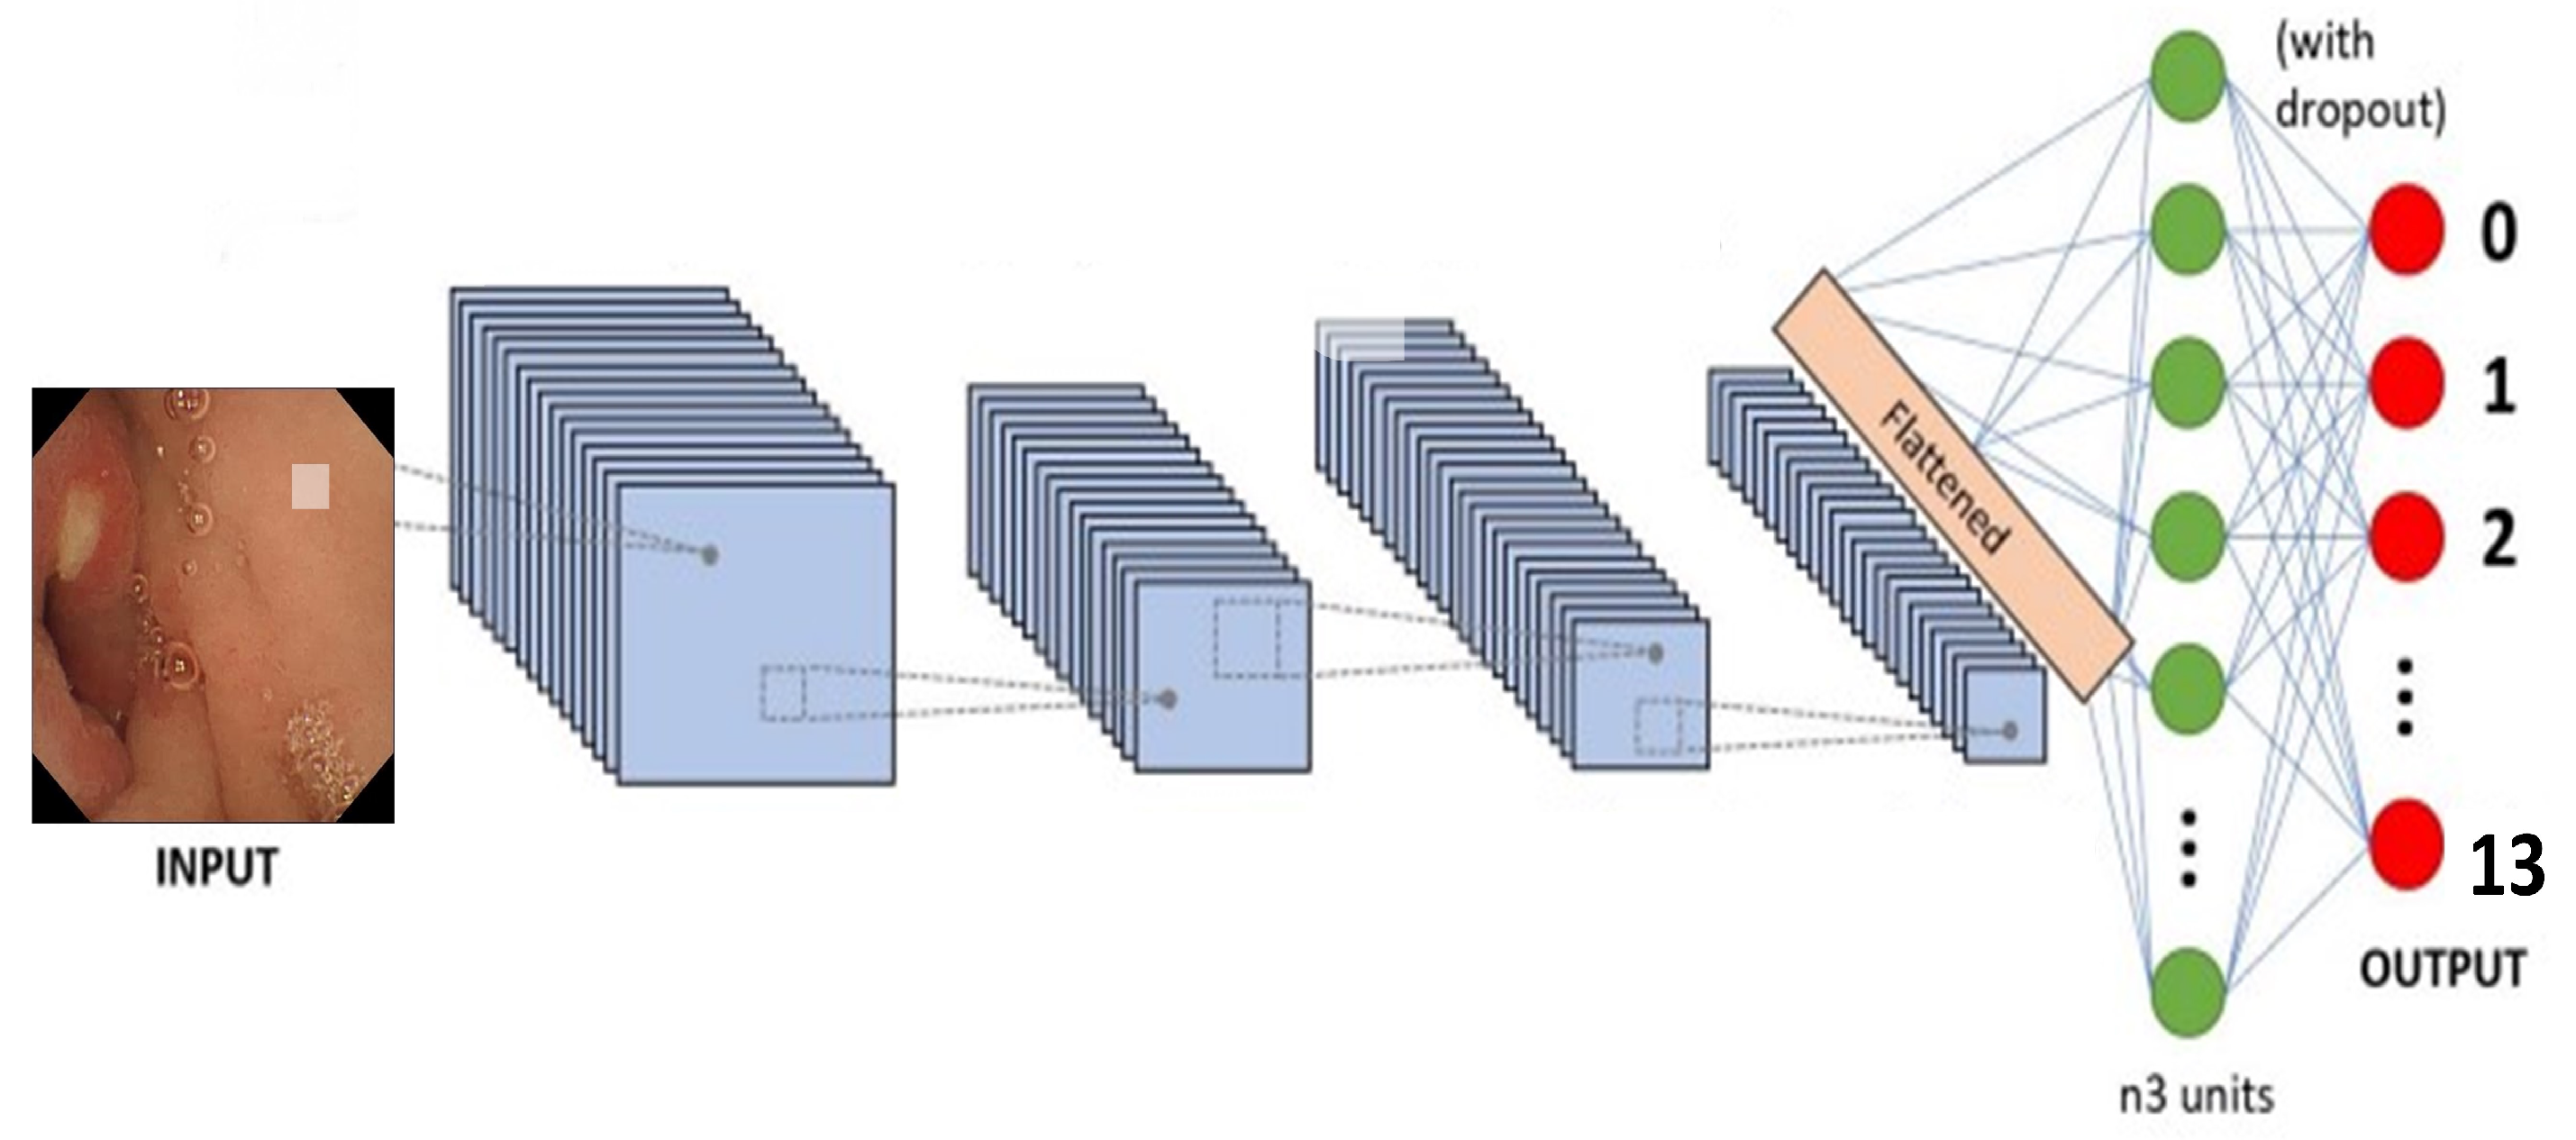
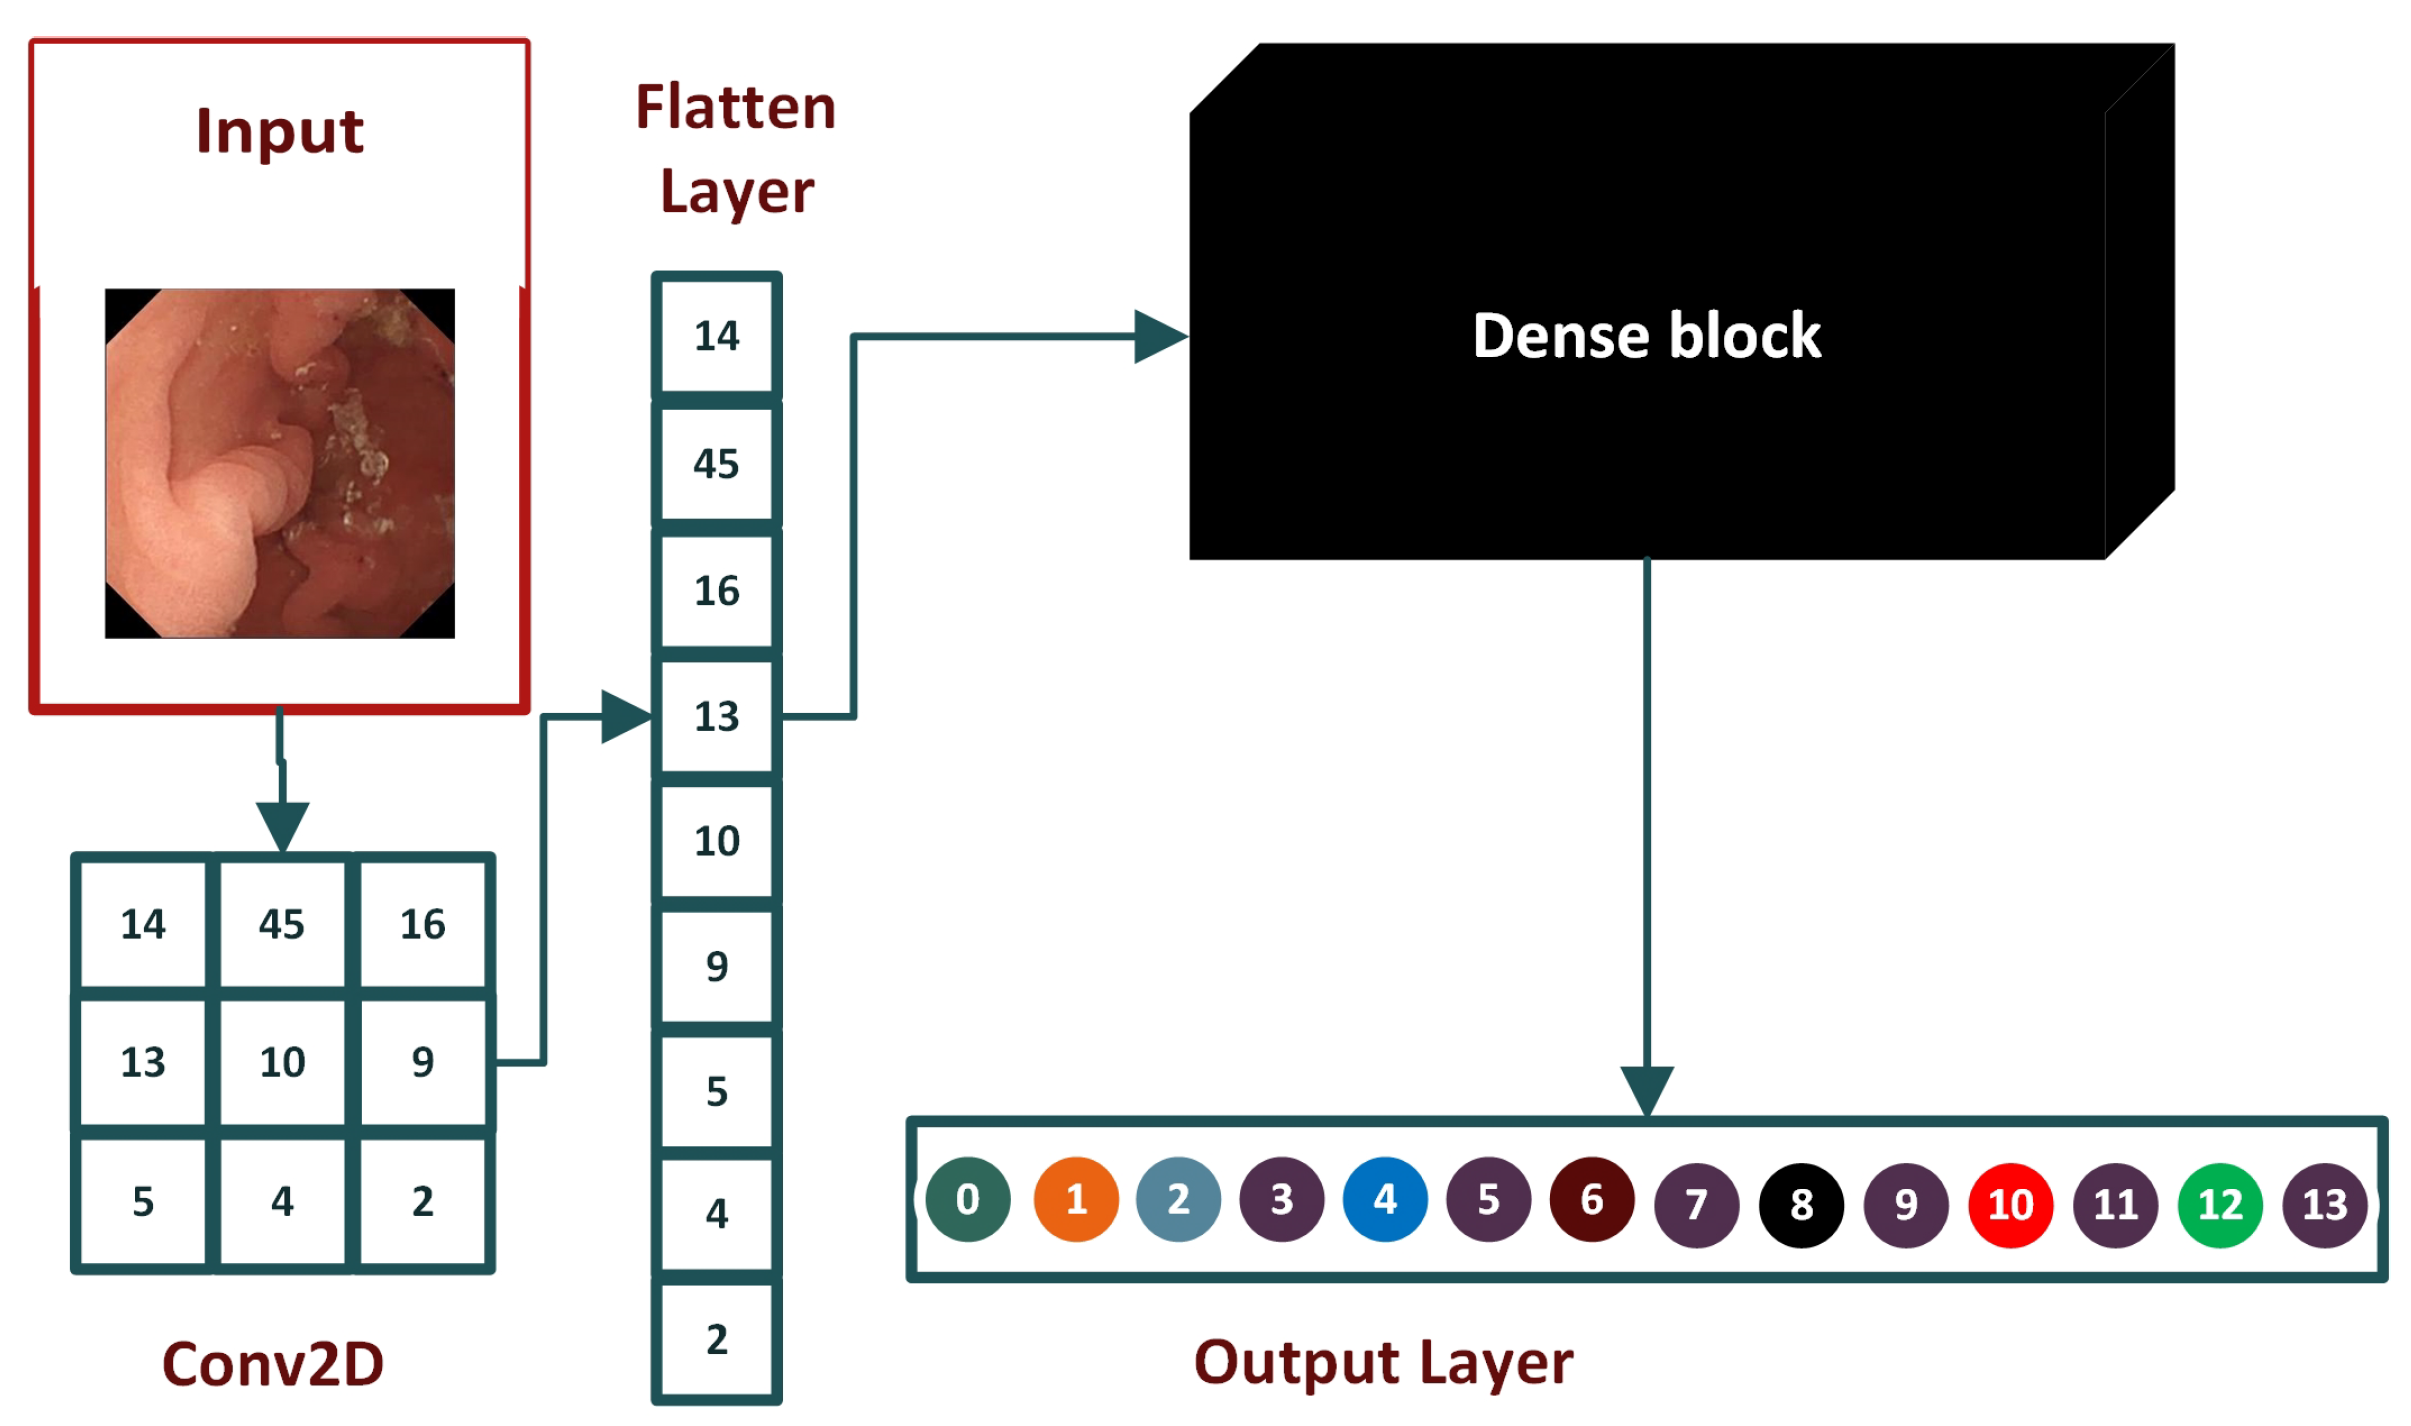
4.1. Detailed Architecture of the Proposed System
4.1.1. Convolutional Blocks of CNN Model
4.1.2. Flattened Layer
4.1.3. Dropout Layer
4.2. Dense Block of Proposed Model
4.2.1. ReLU Activation
4.2.2. Dense Layer
5. Model Evaluations
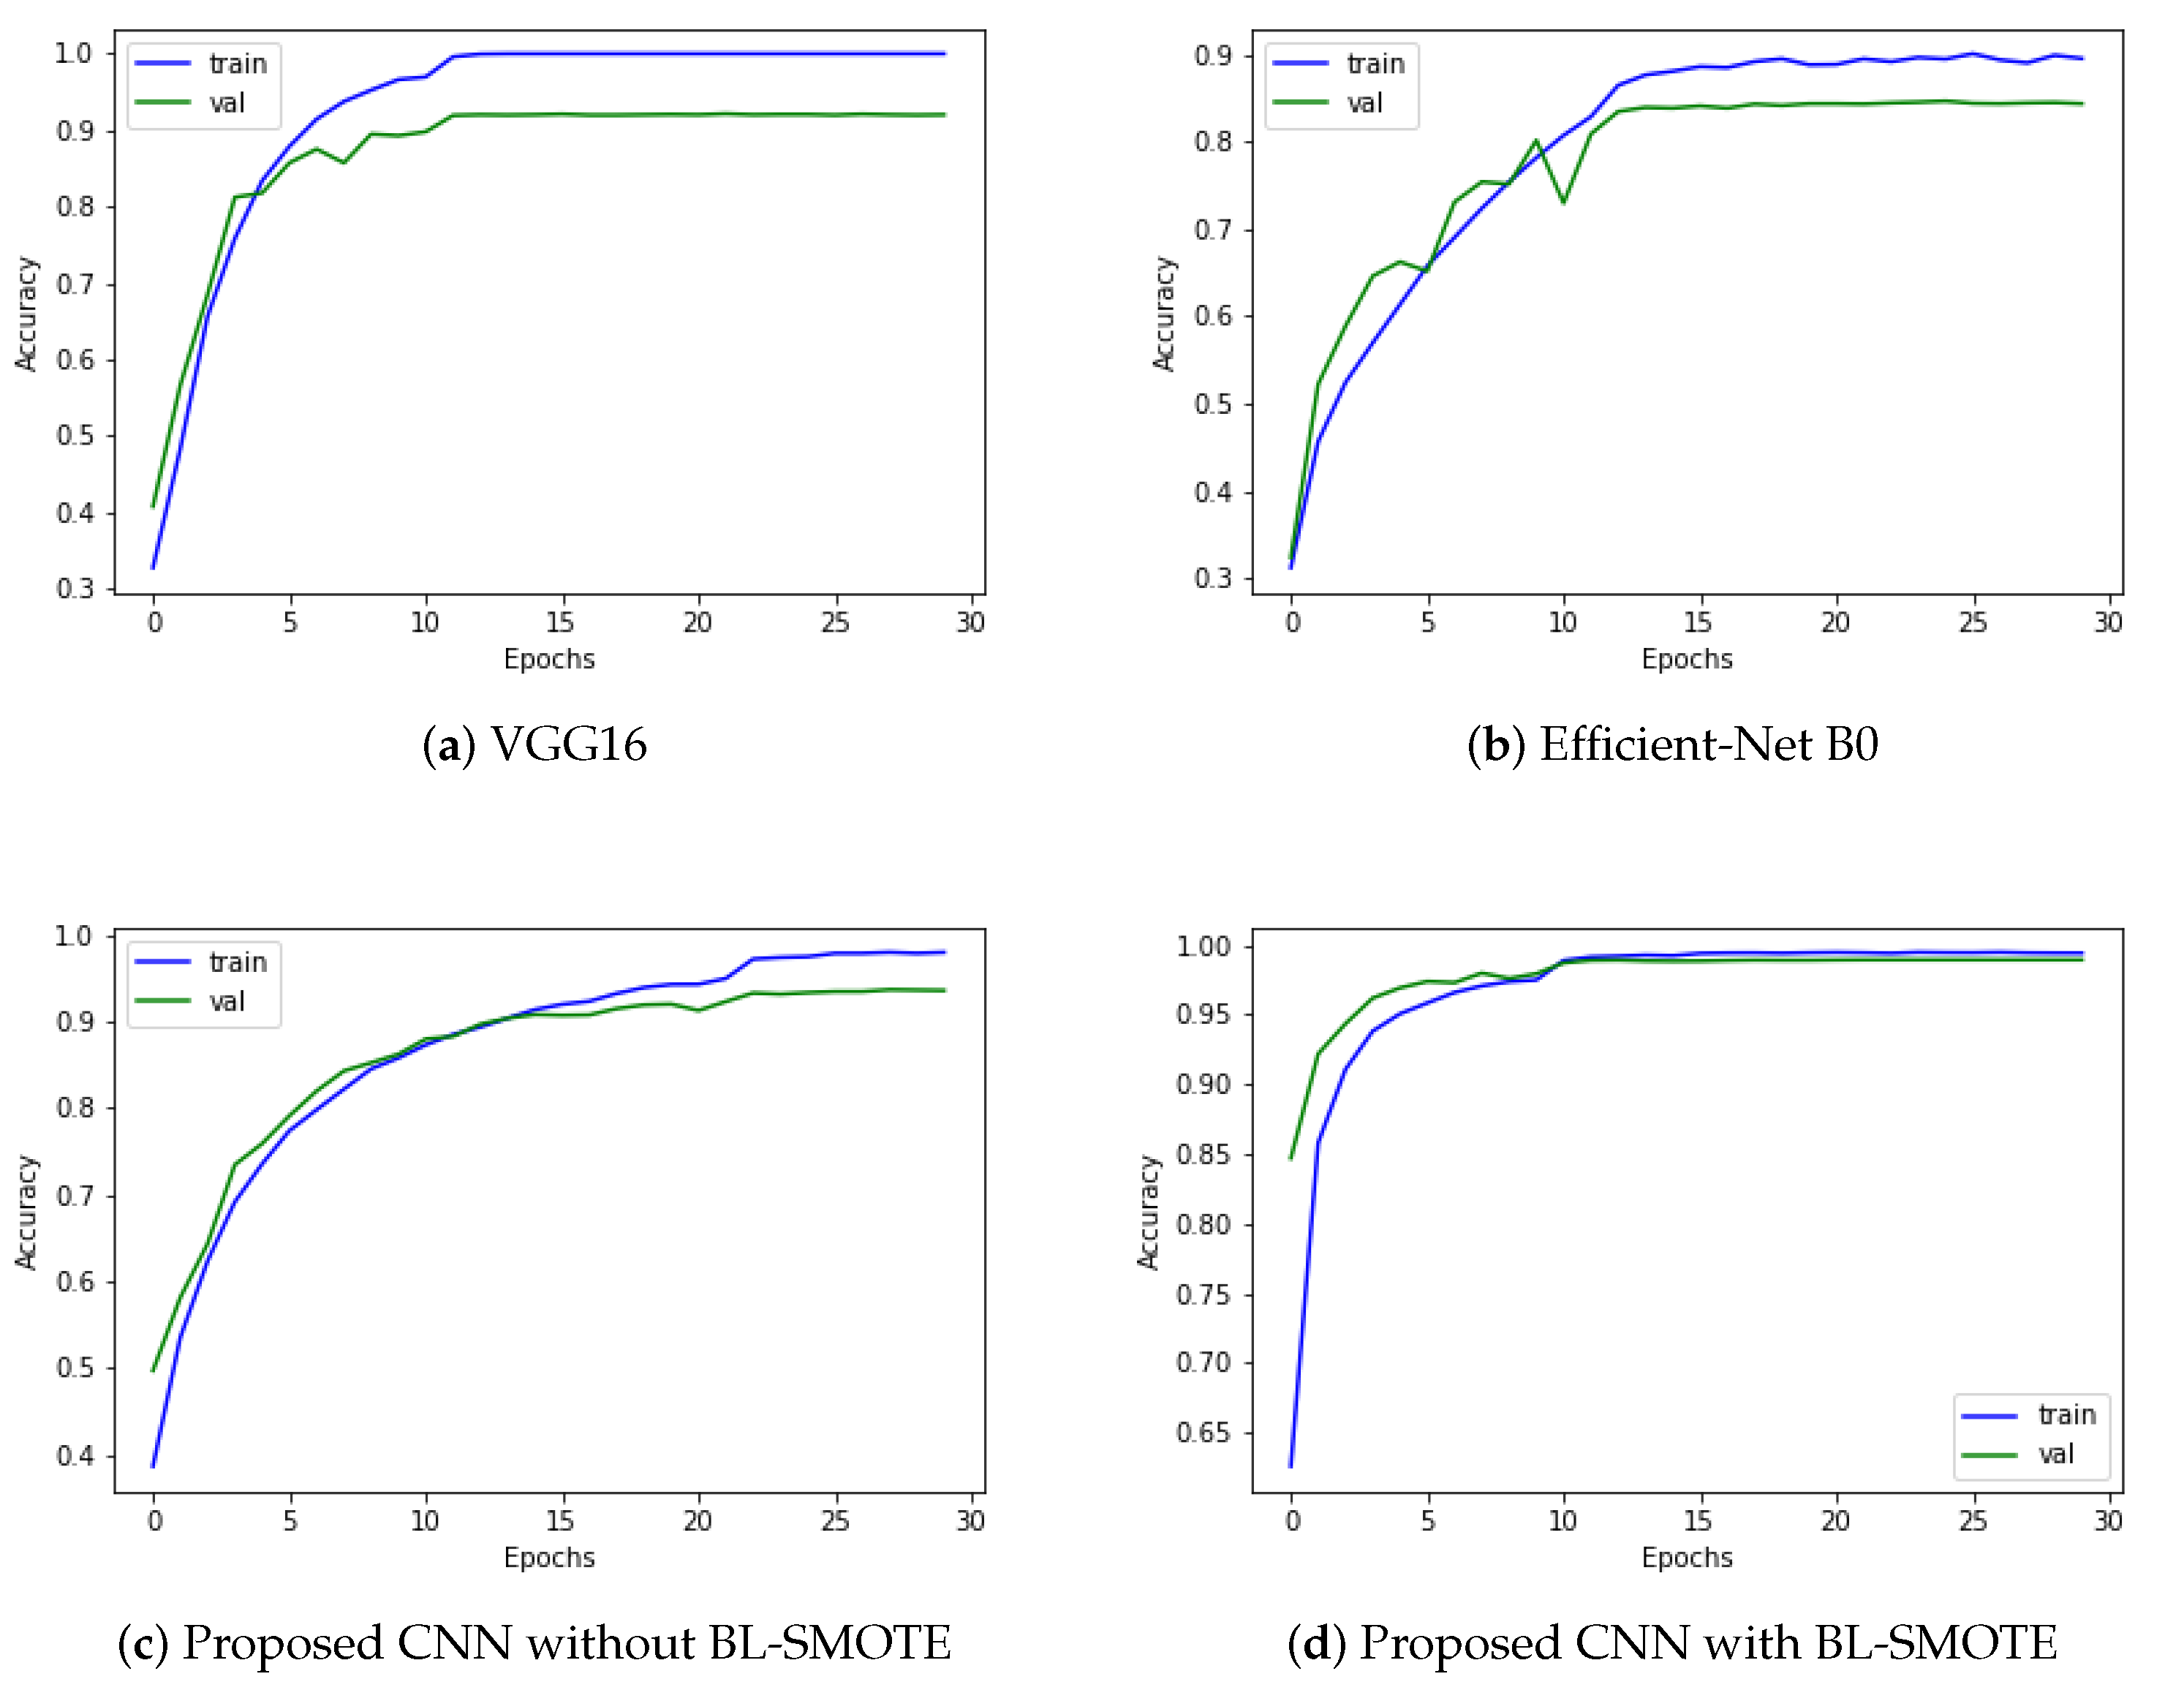
5.1. Accuracy
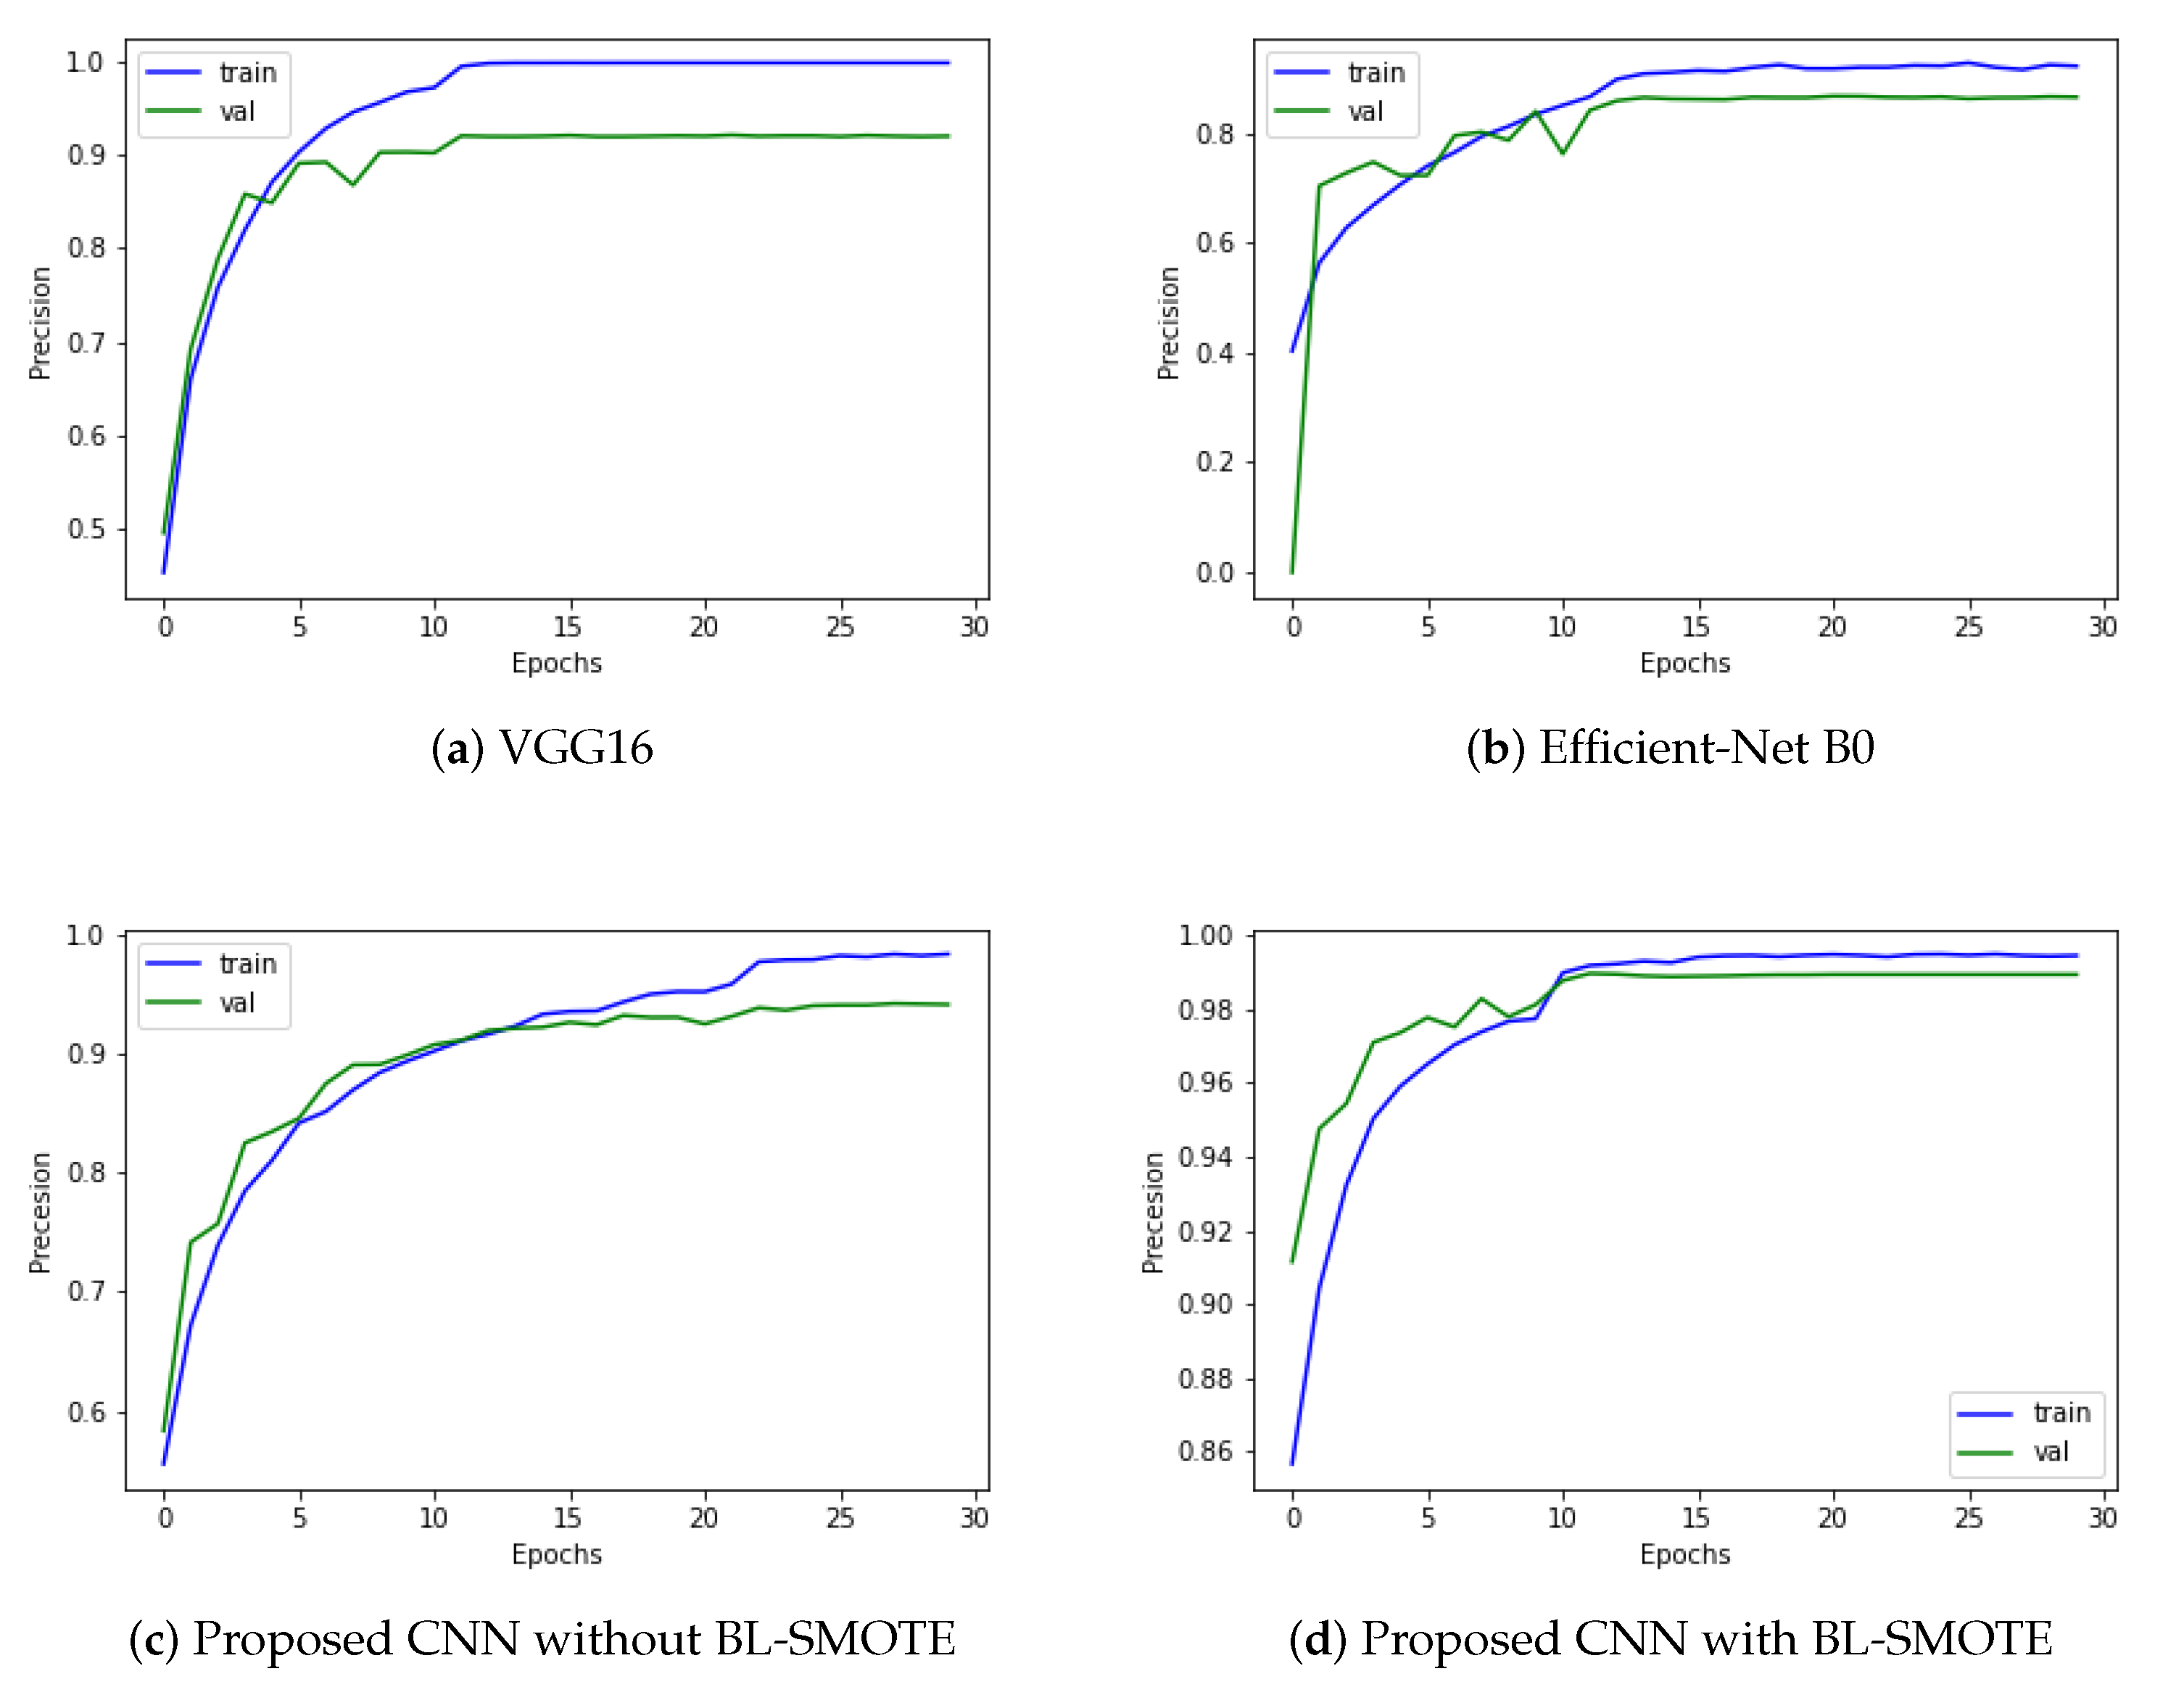
5.2. Precision
5.3. Recall
5.4. F1-Score
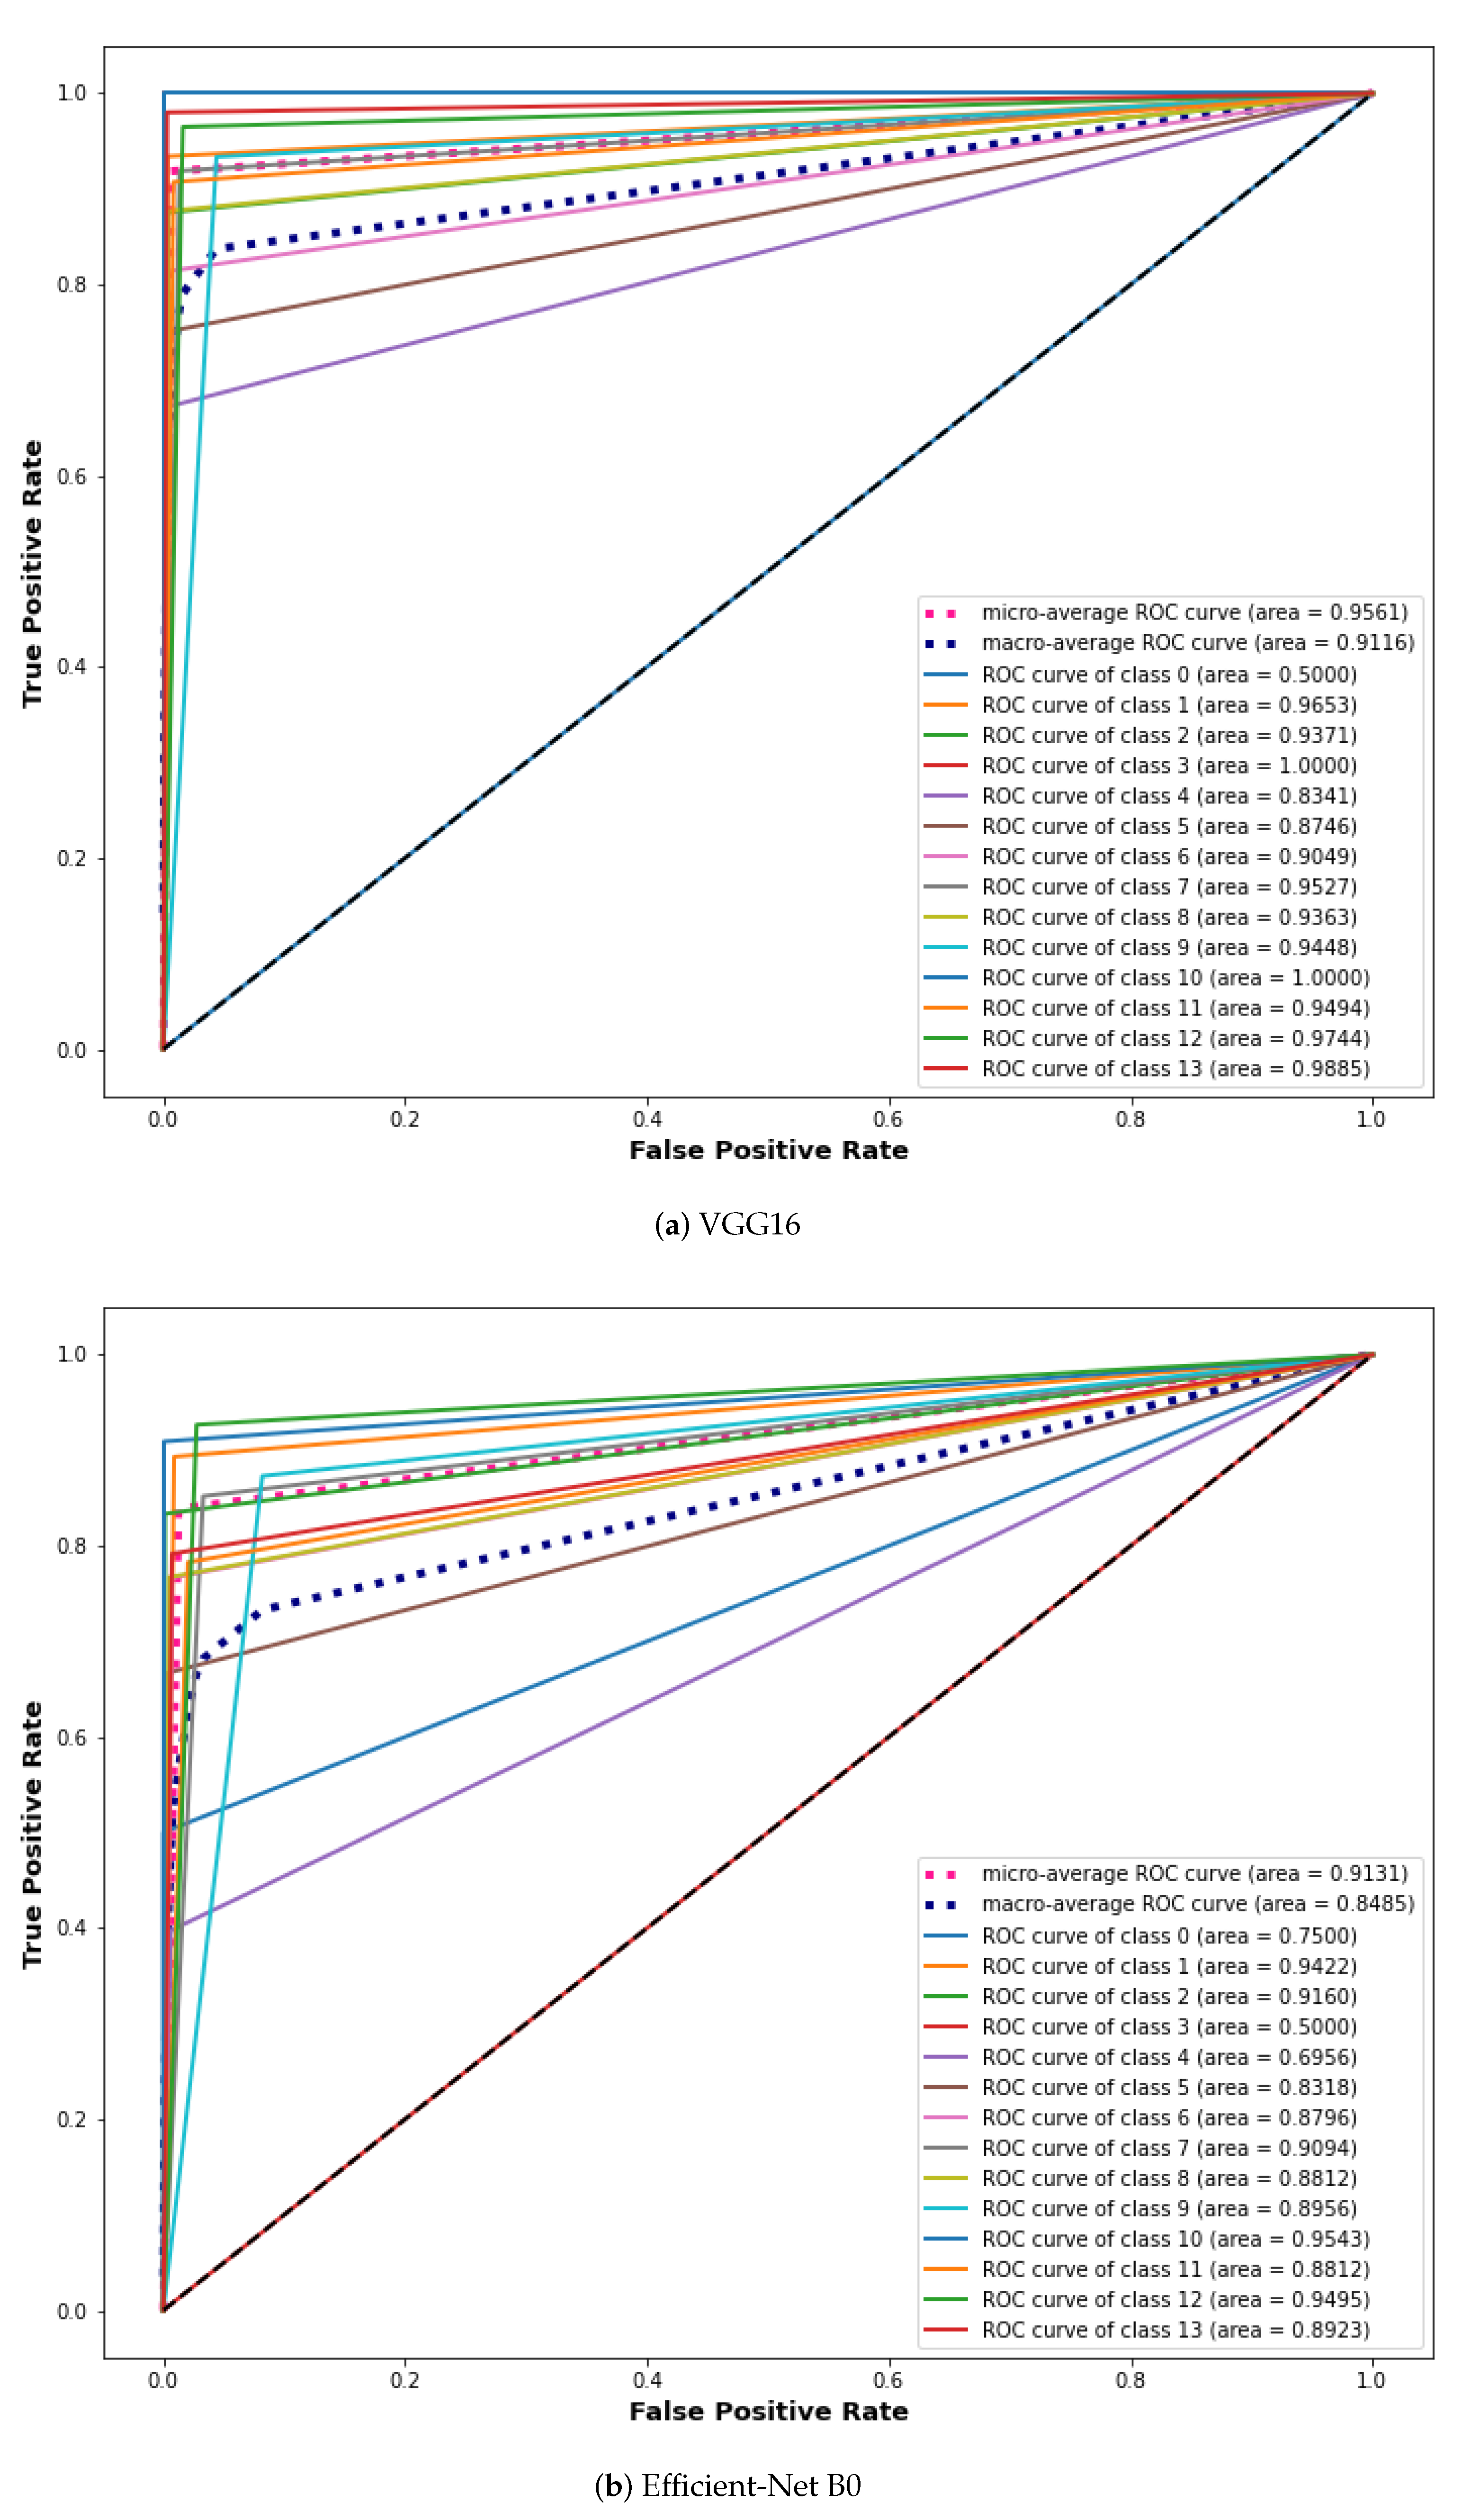
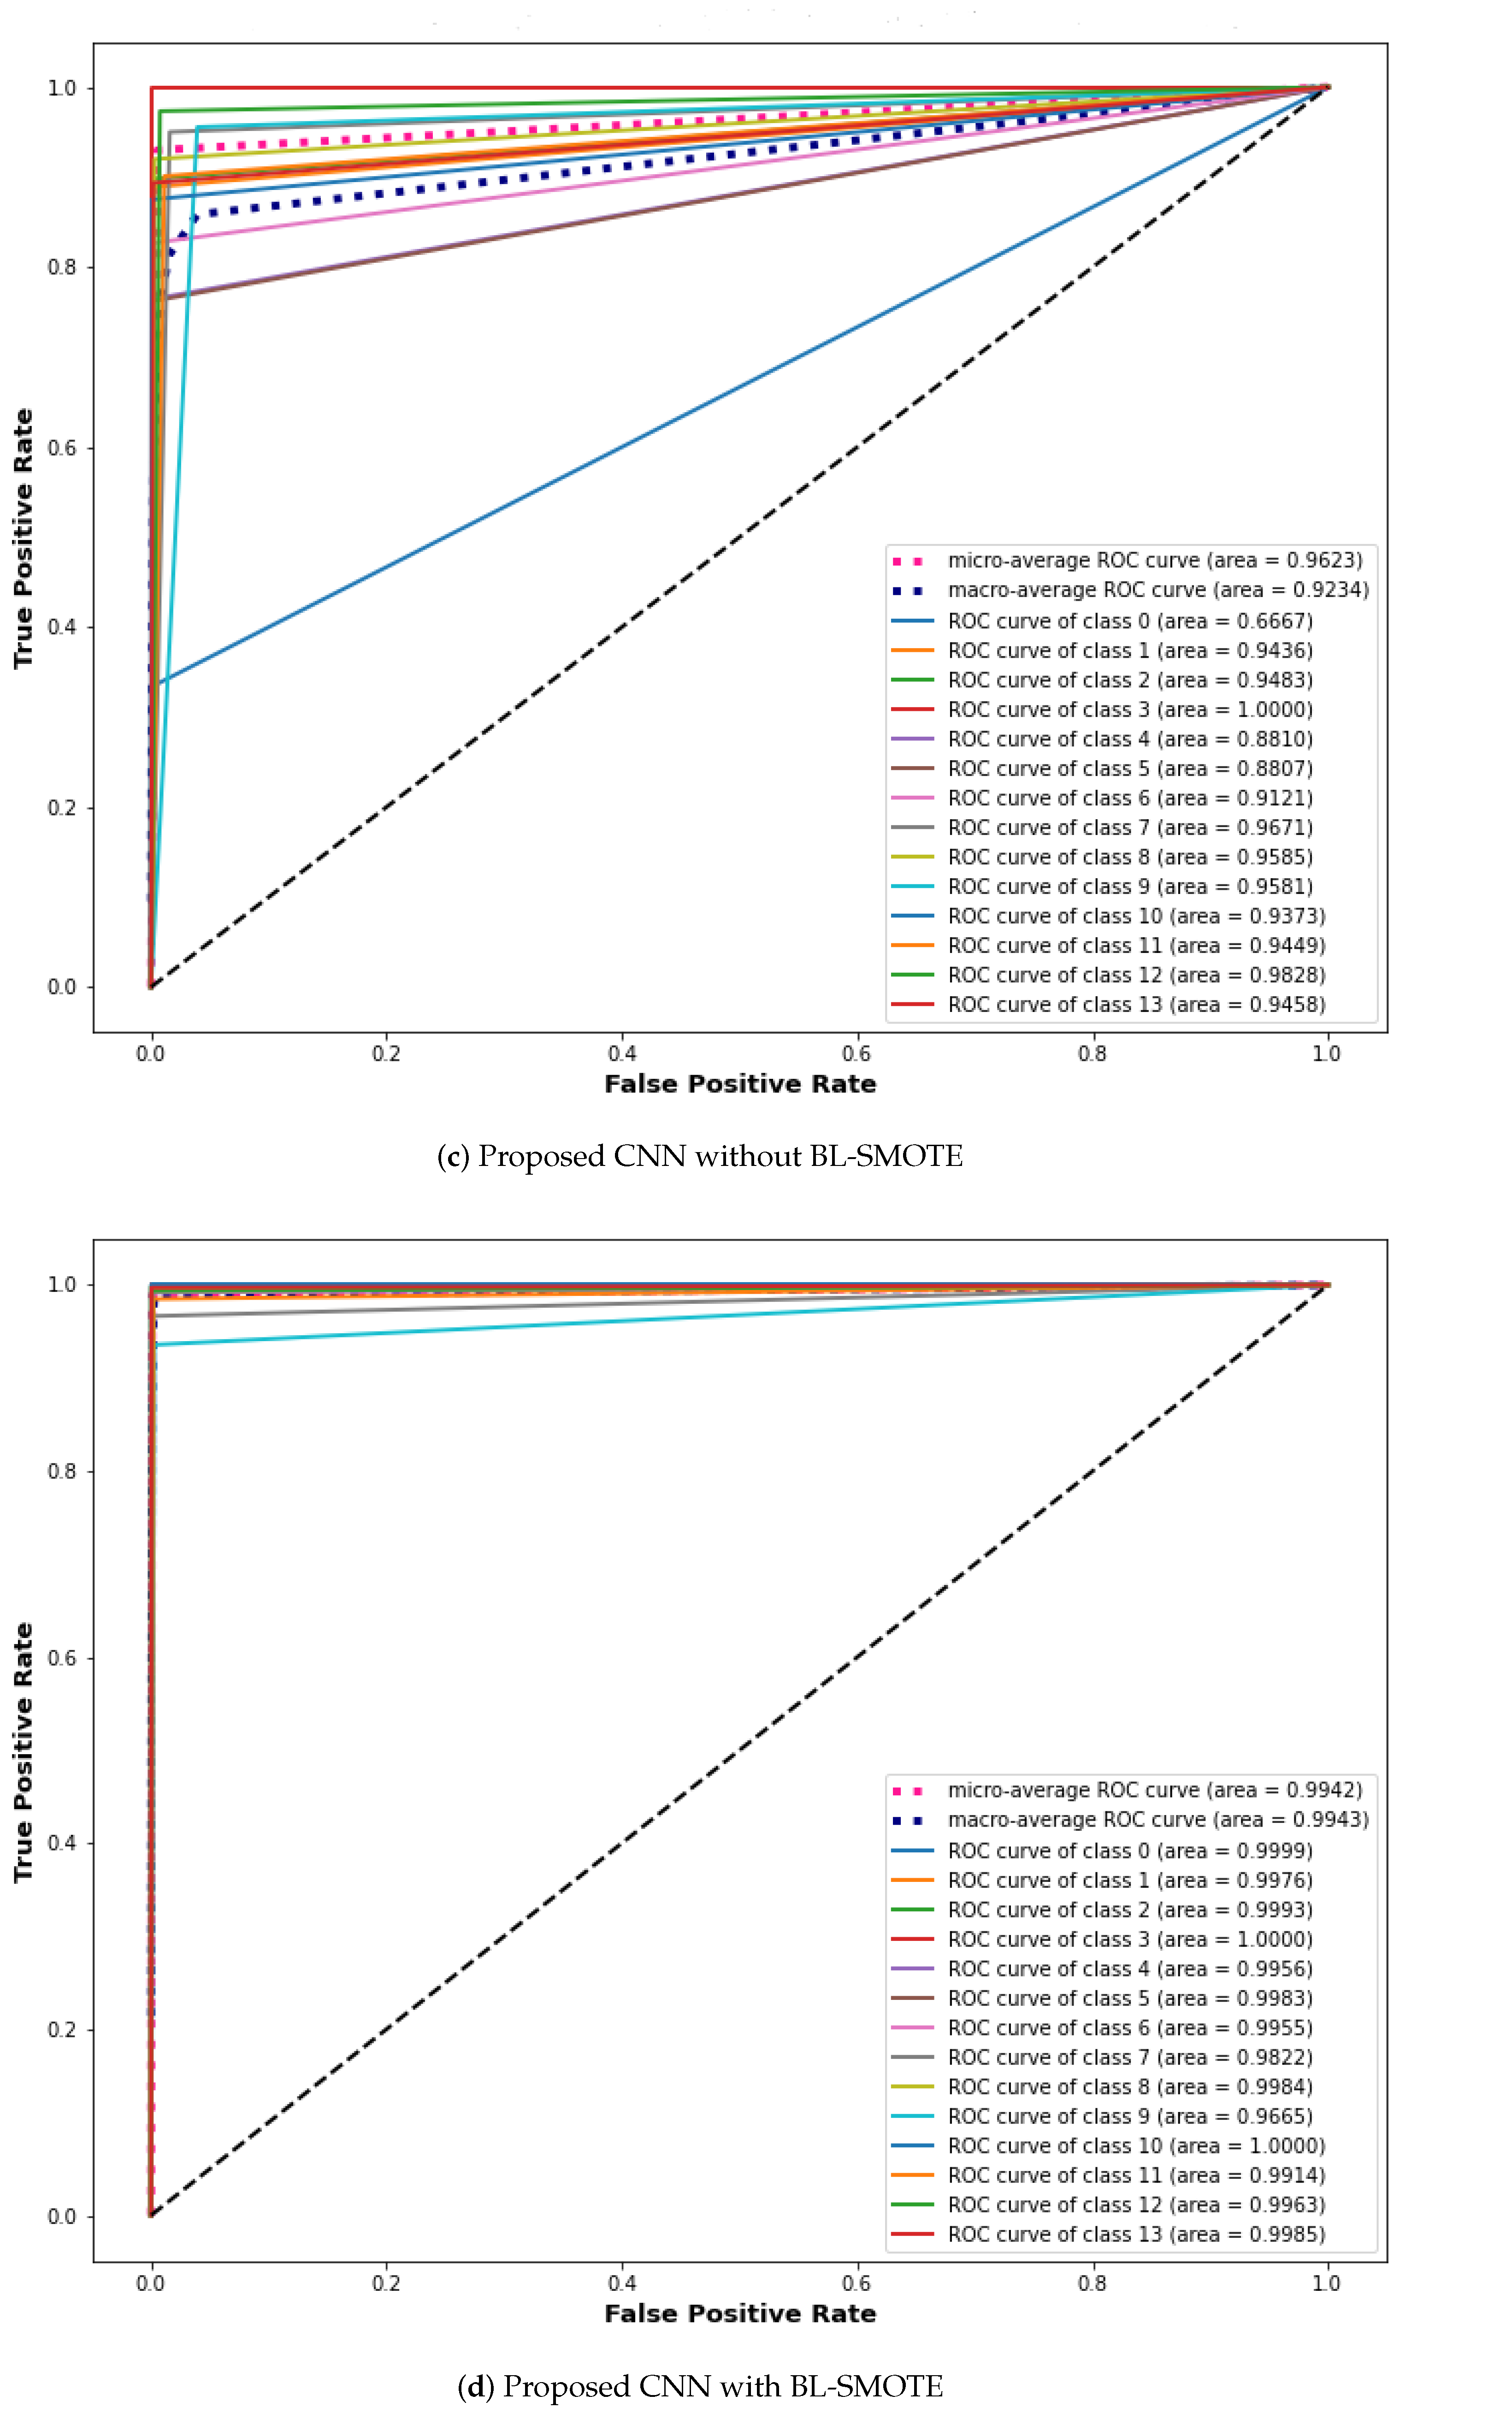
5.5. Receiver Operating Characteristics (ROC) Curve
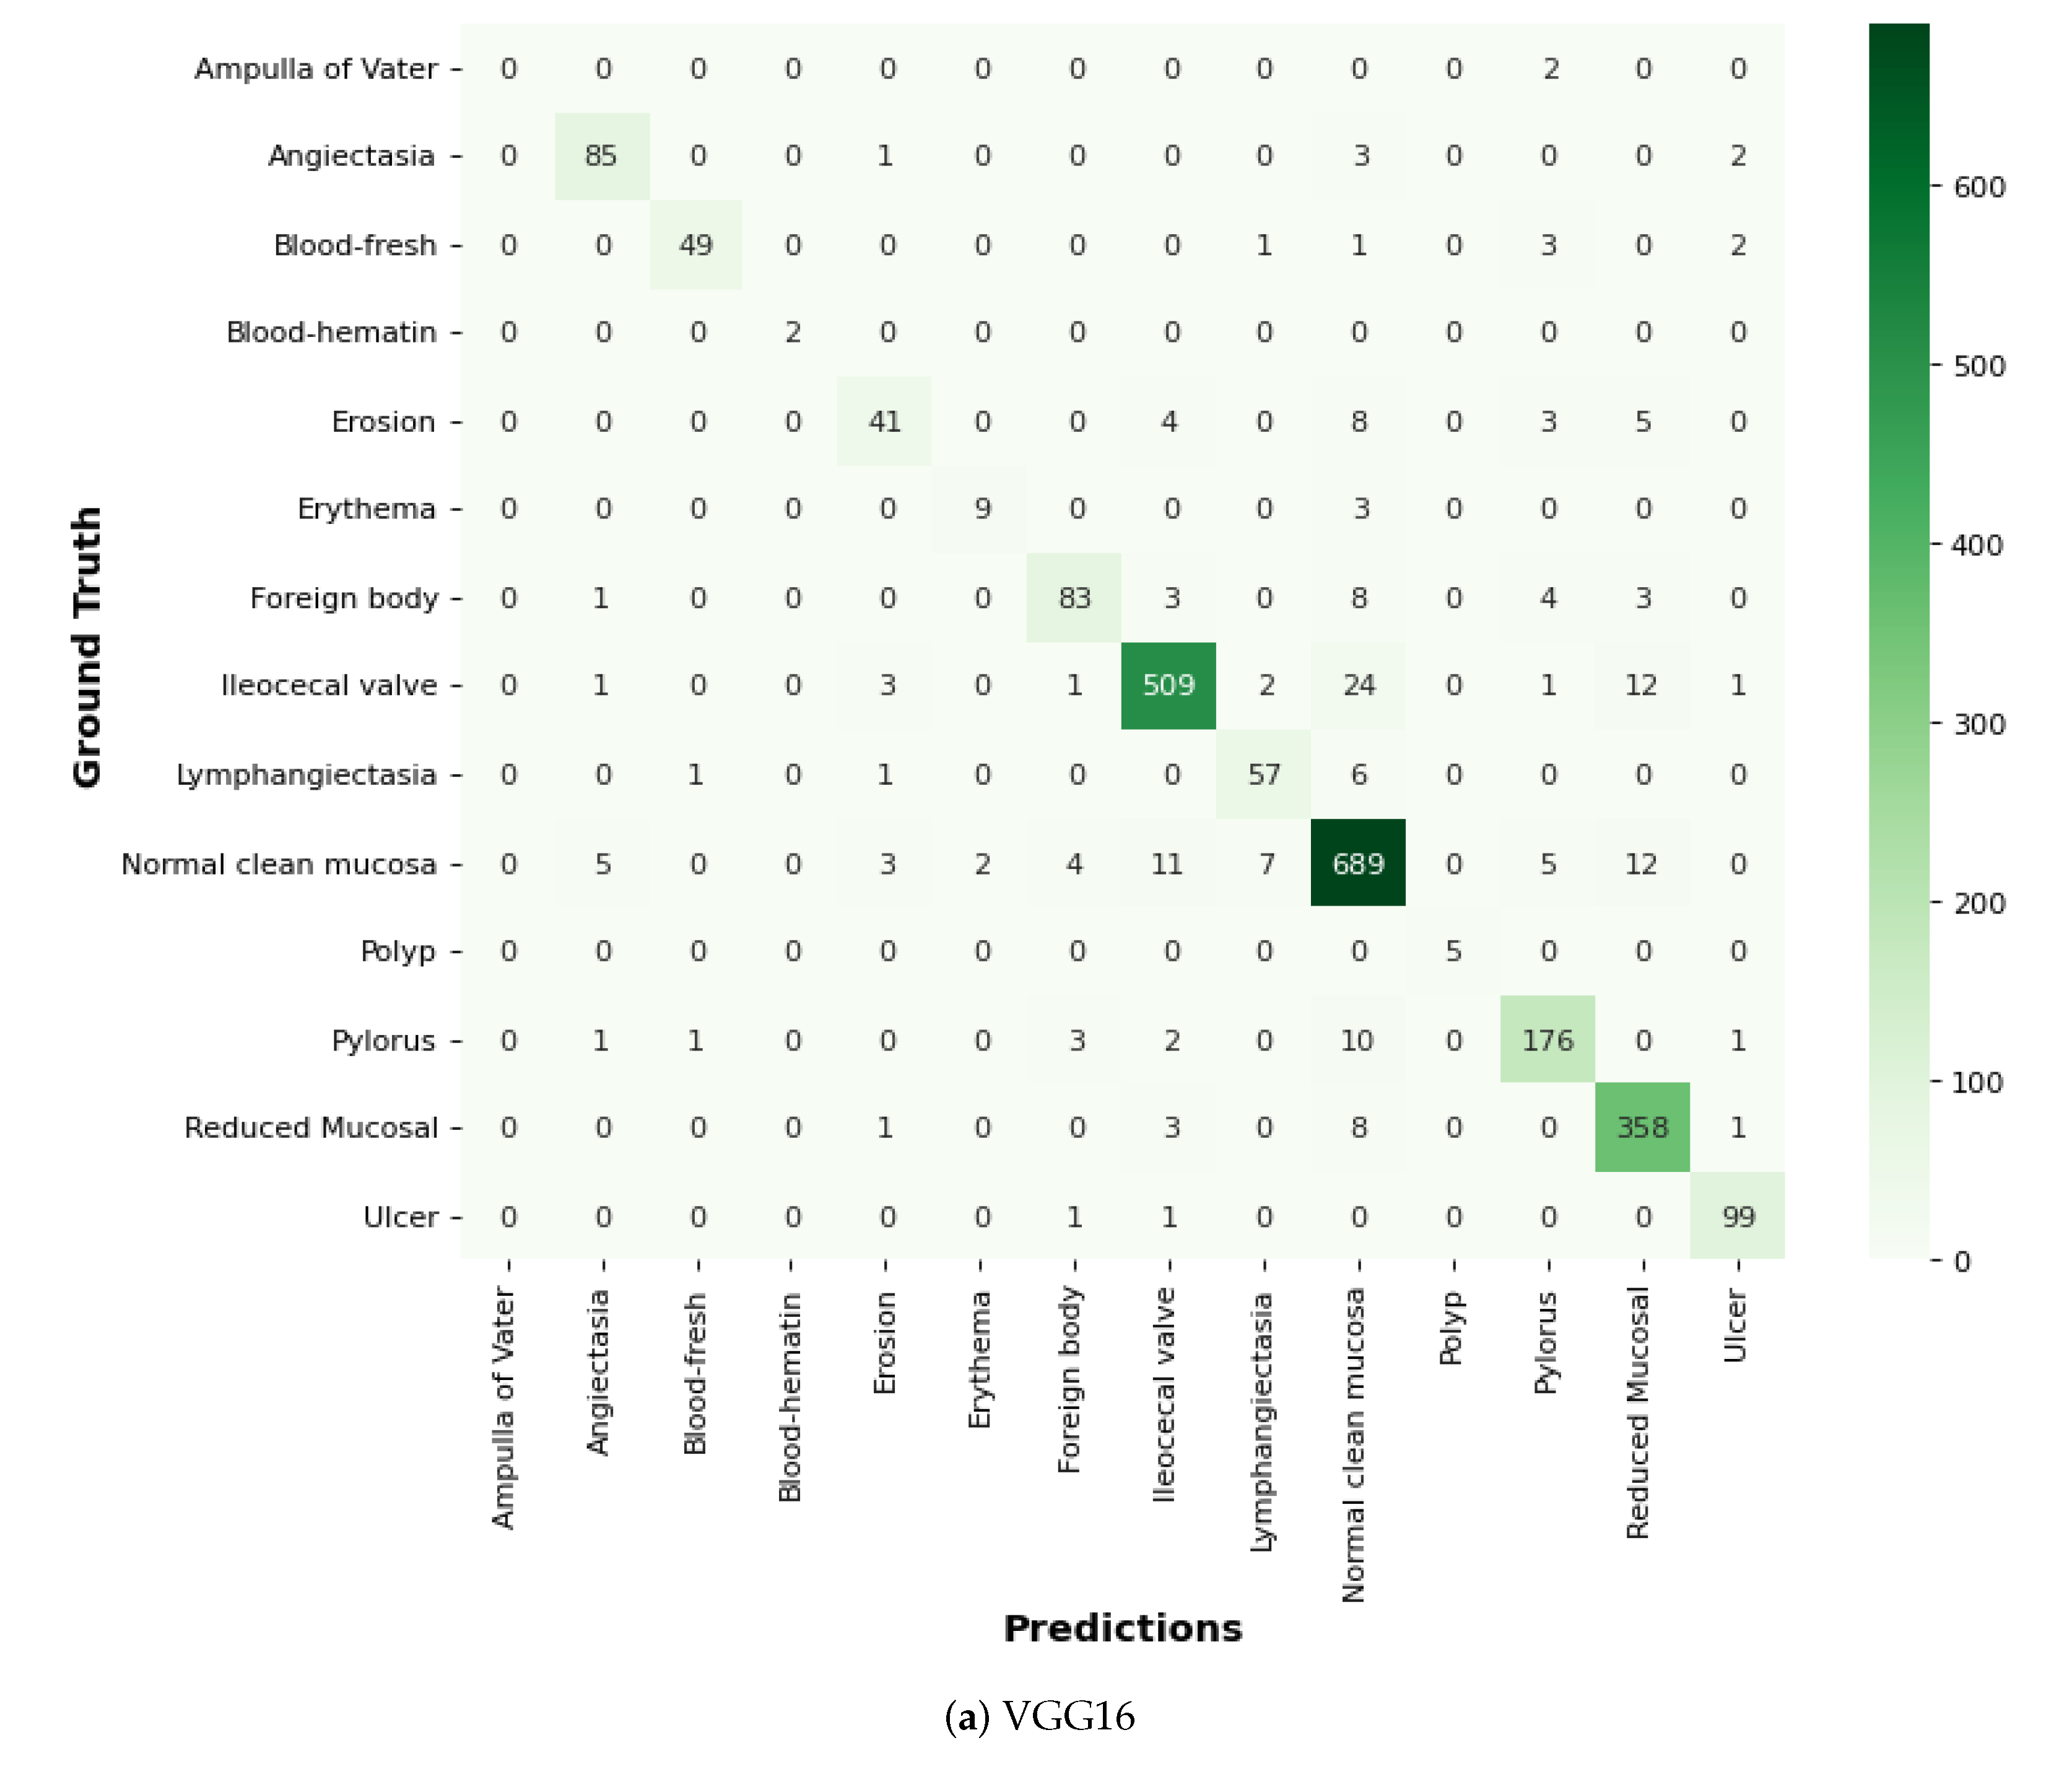
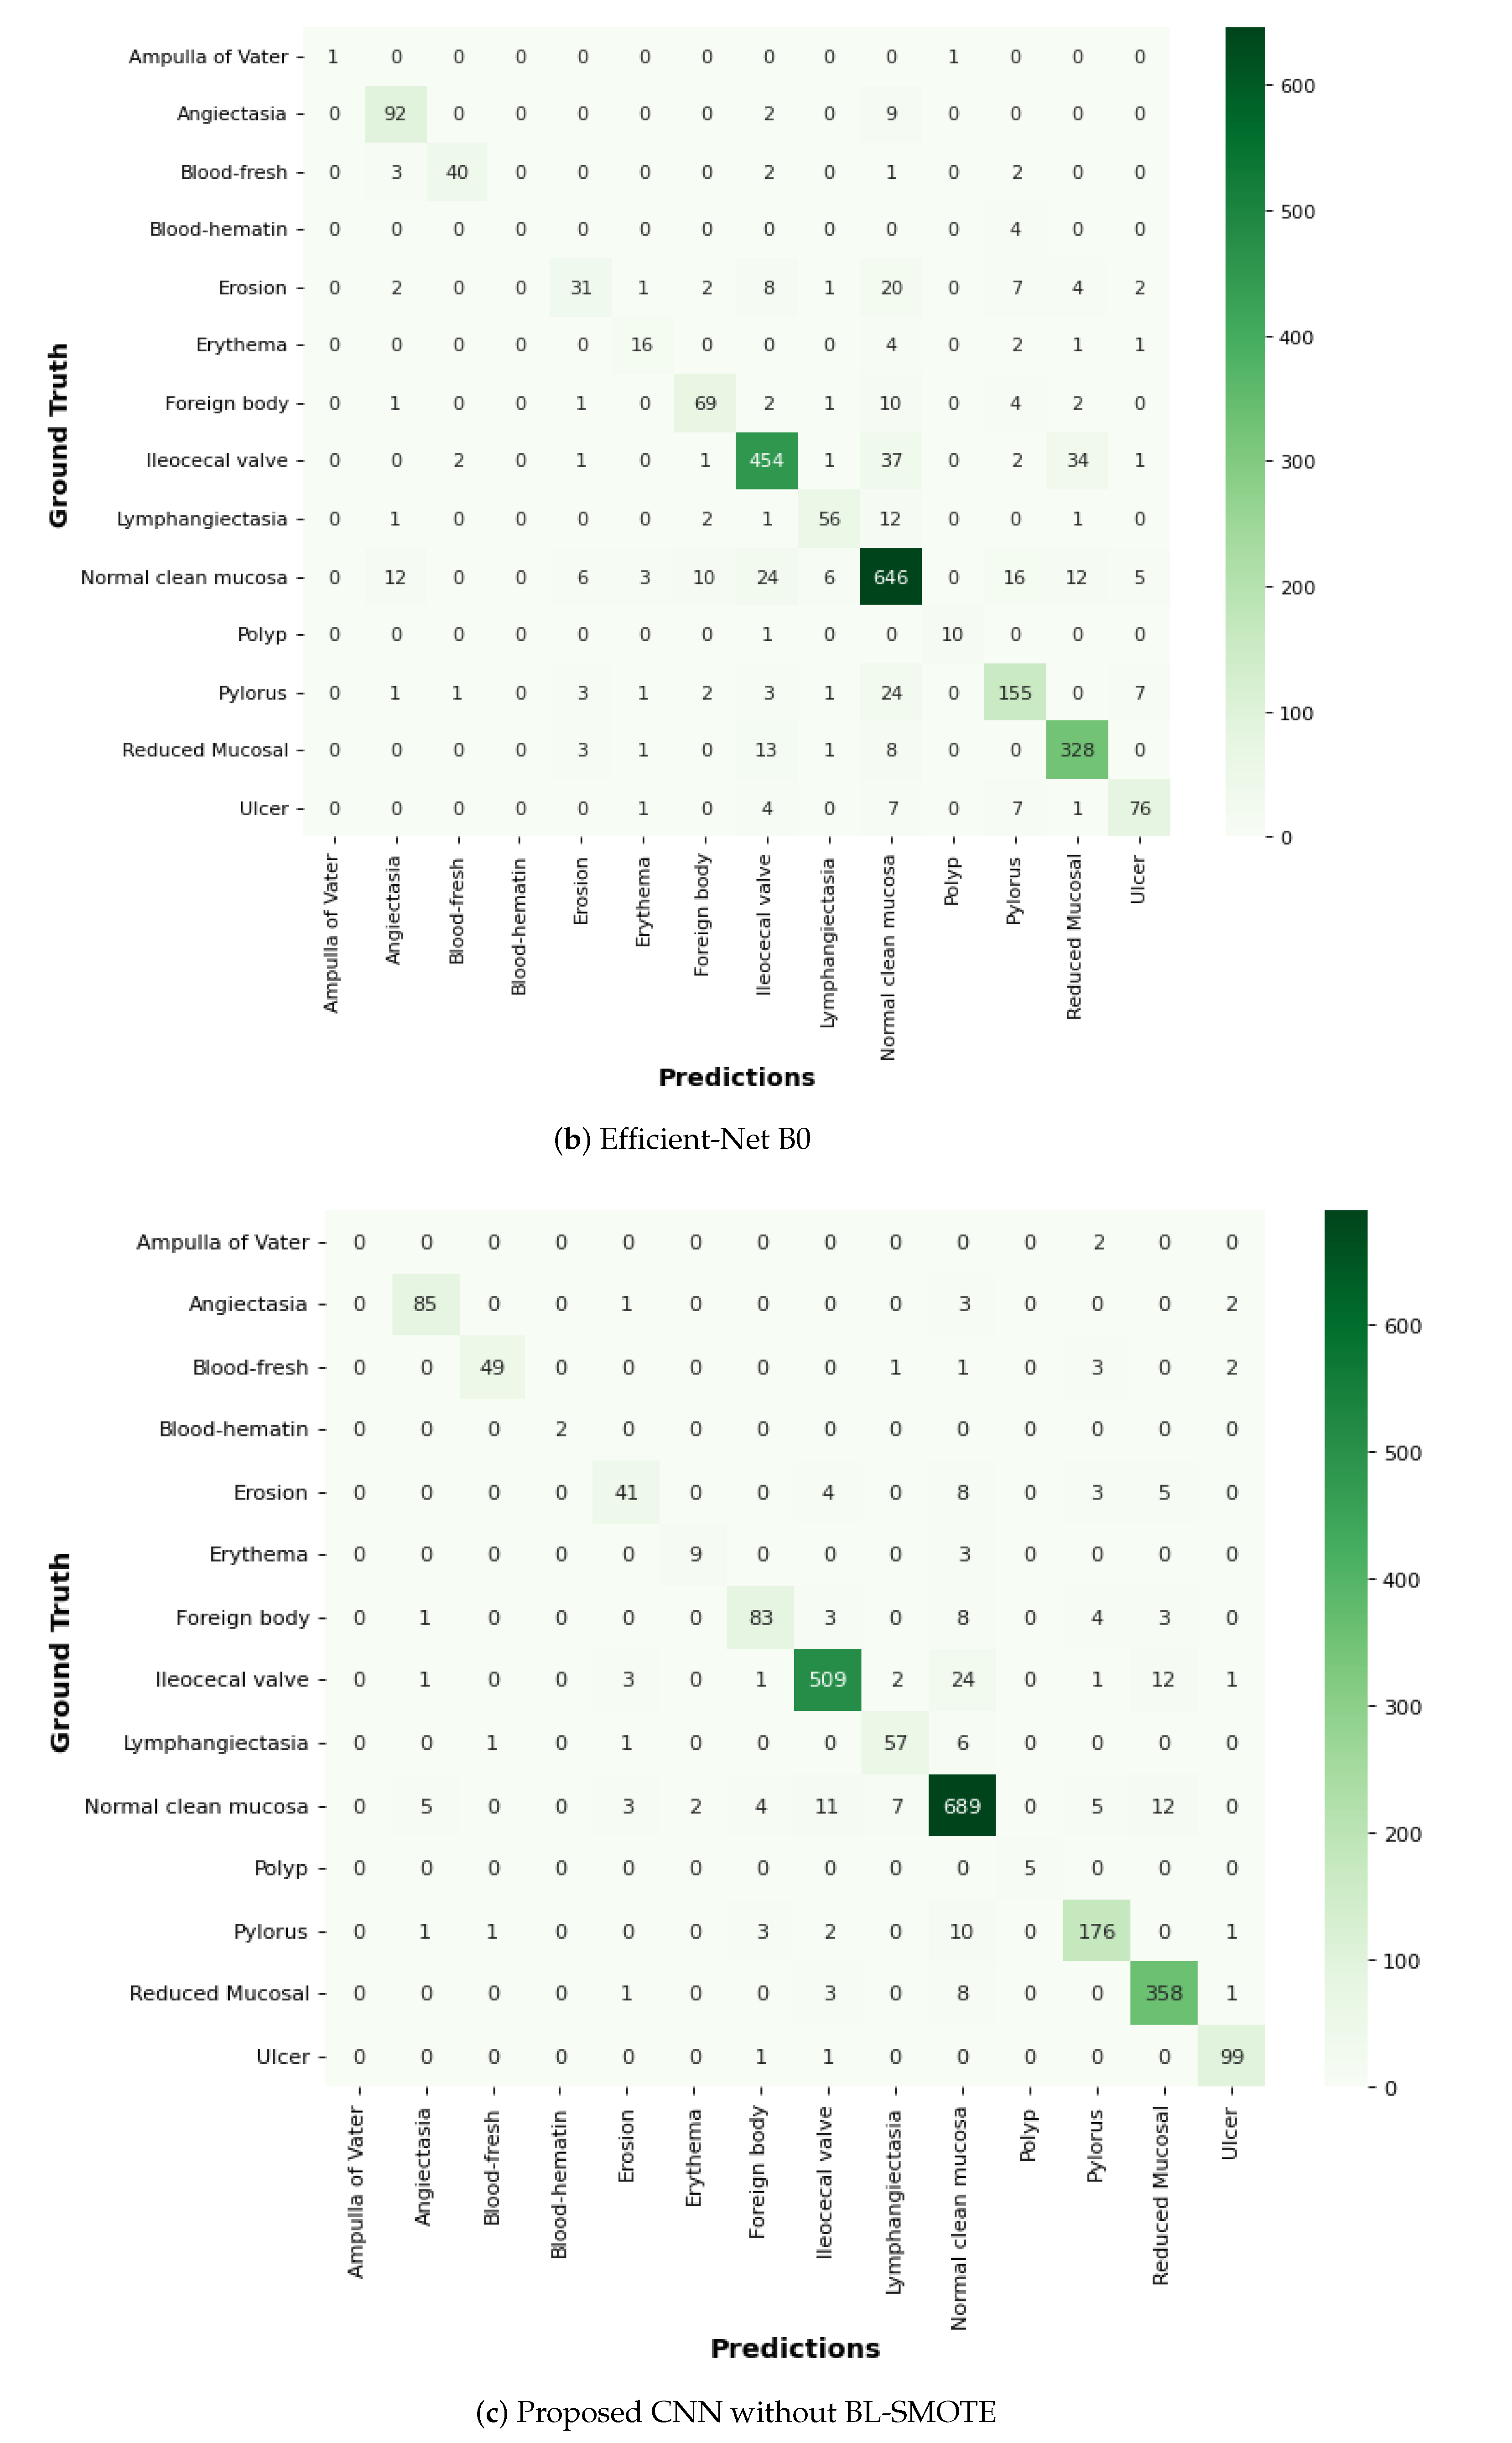
5.6. Confusion Matrix
5.7. Loss Function
6. Results and Discussion
6.1. Accuracy Comparison against Other Models
6.2. AUC Comparison against Other Models
6.3. Comparison with Other Models Using Precision
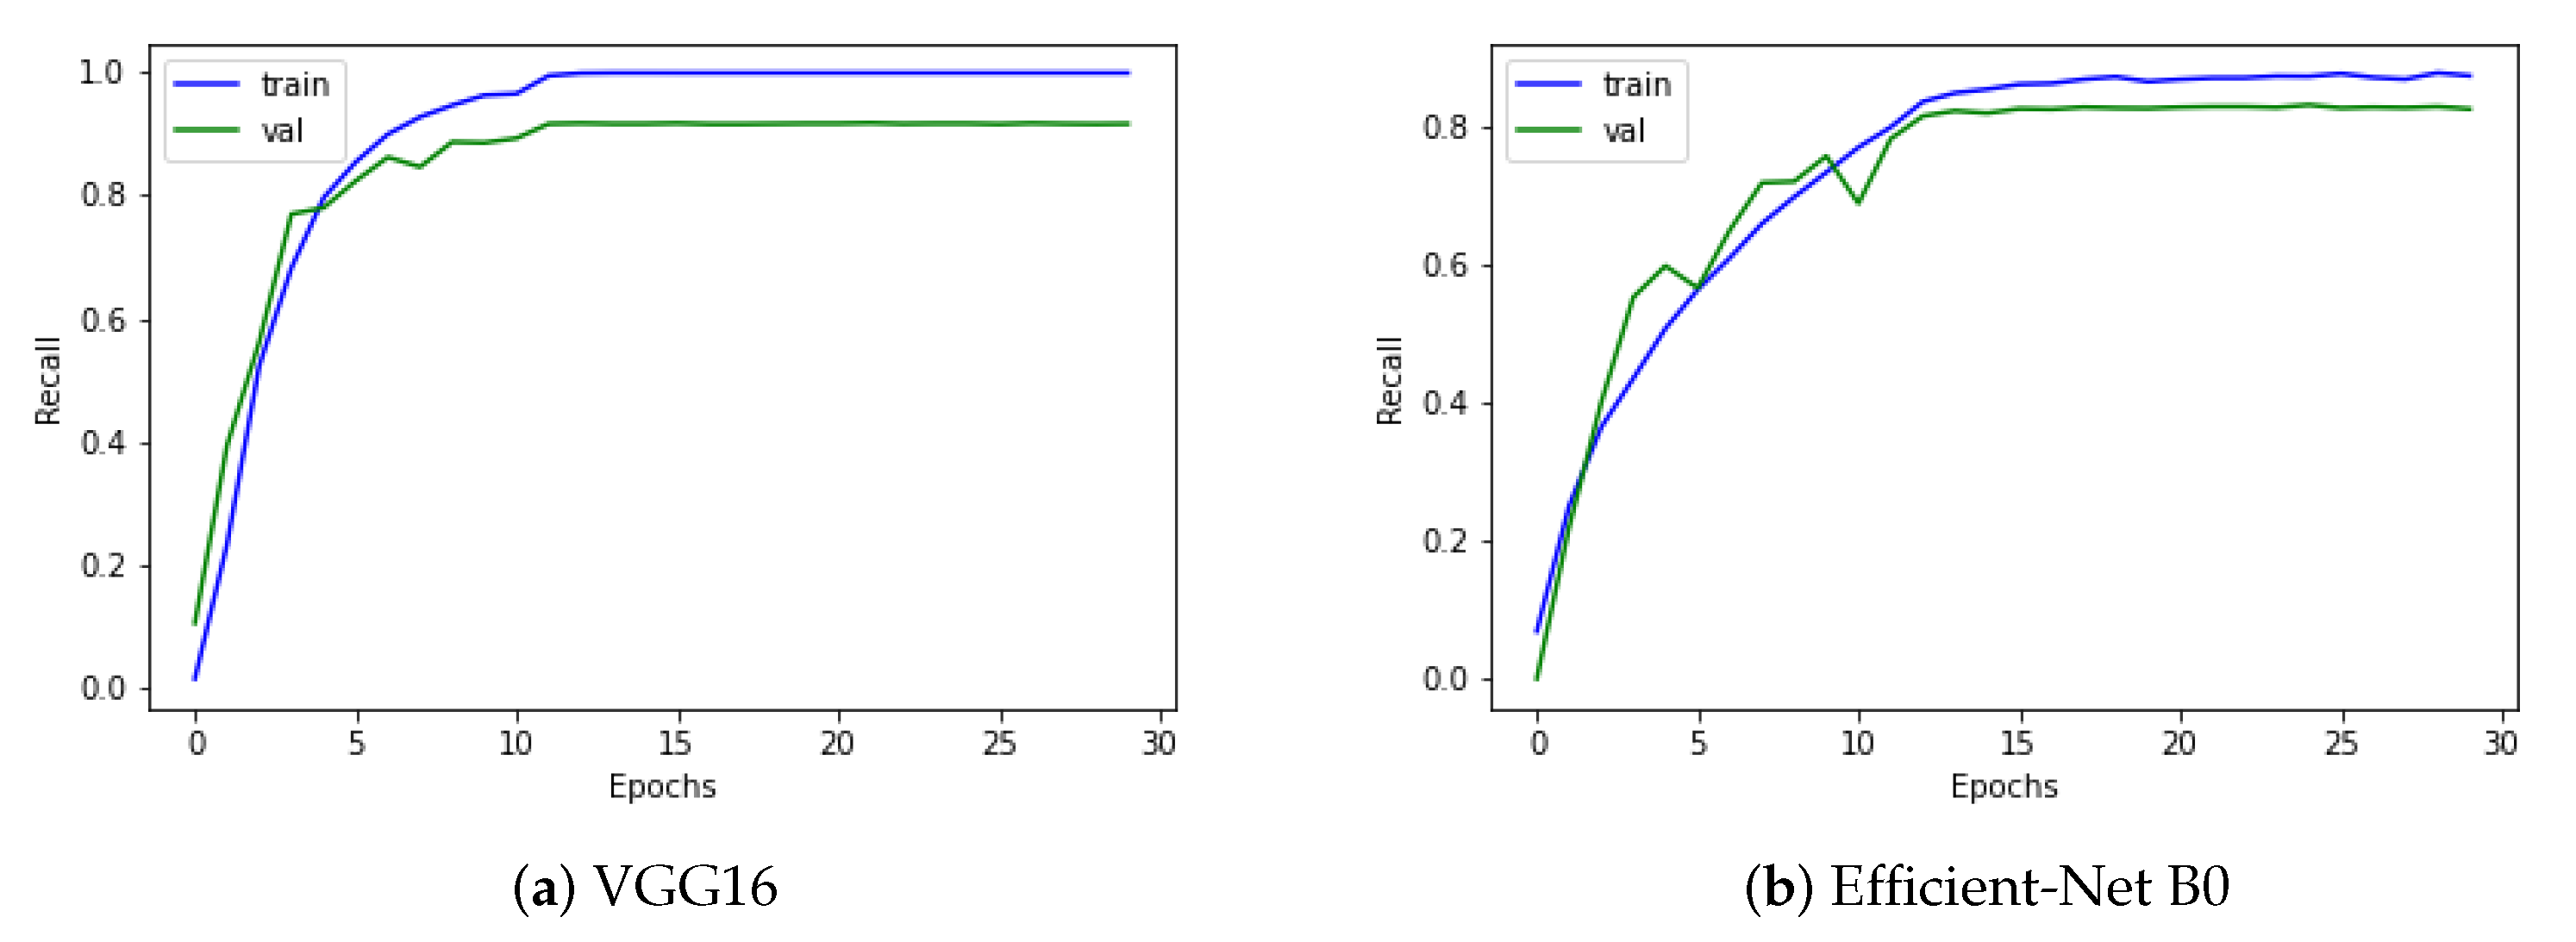
6.4. Comparison of GIDD-Net with Recent Models Using Recall
6.5. Comparison of Proposed CNN with Recent Models Using F1-Score
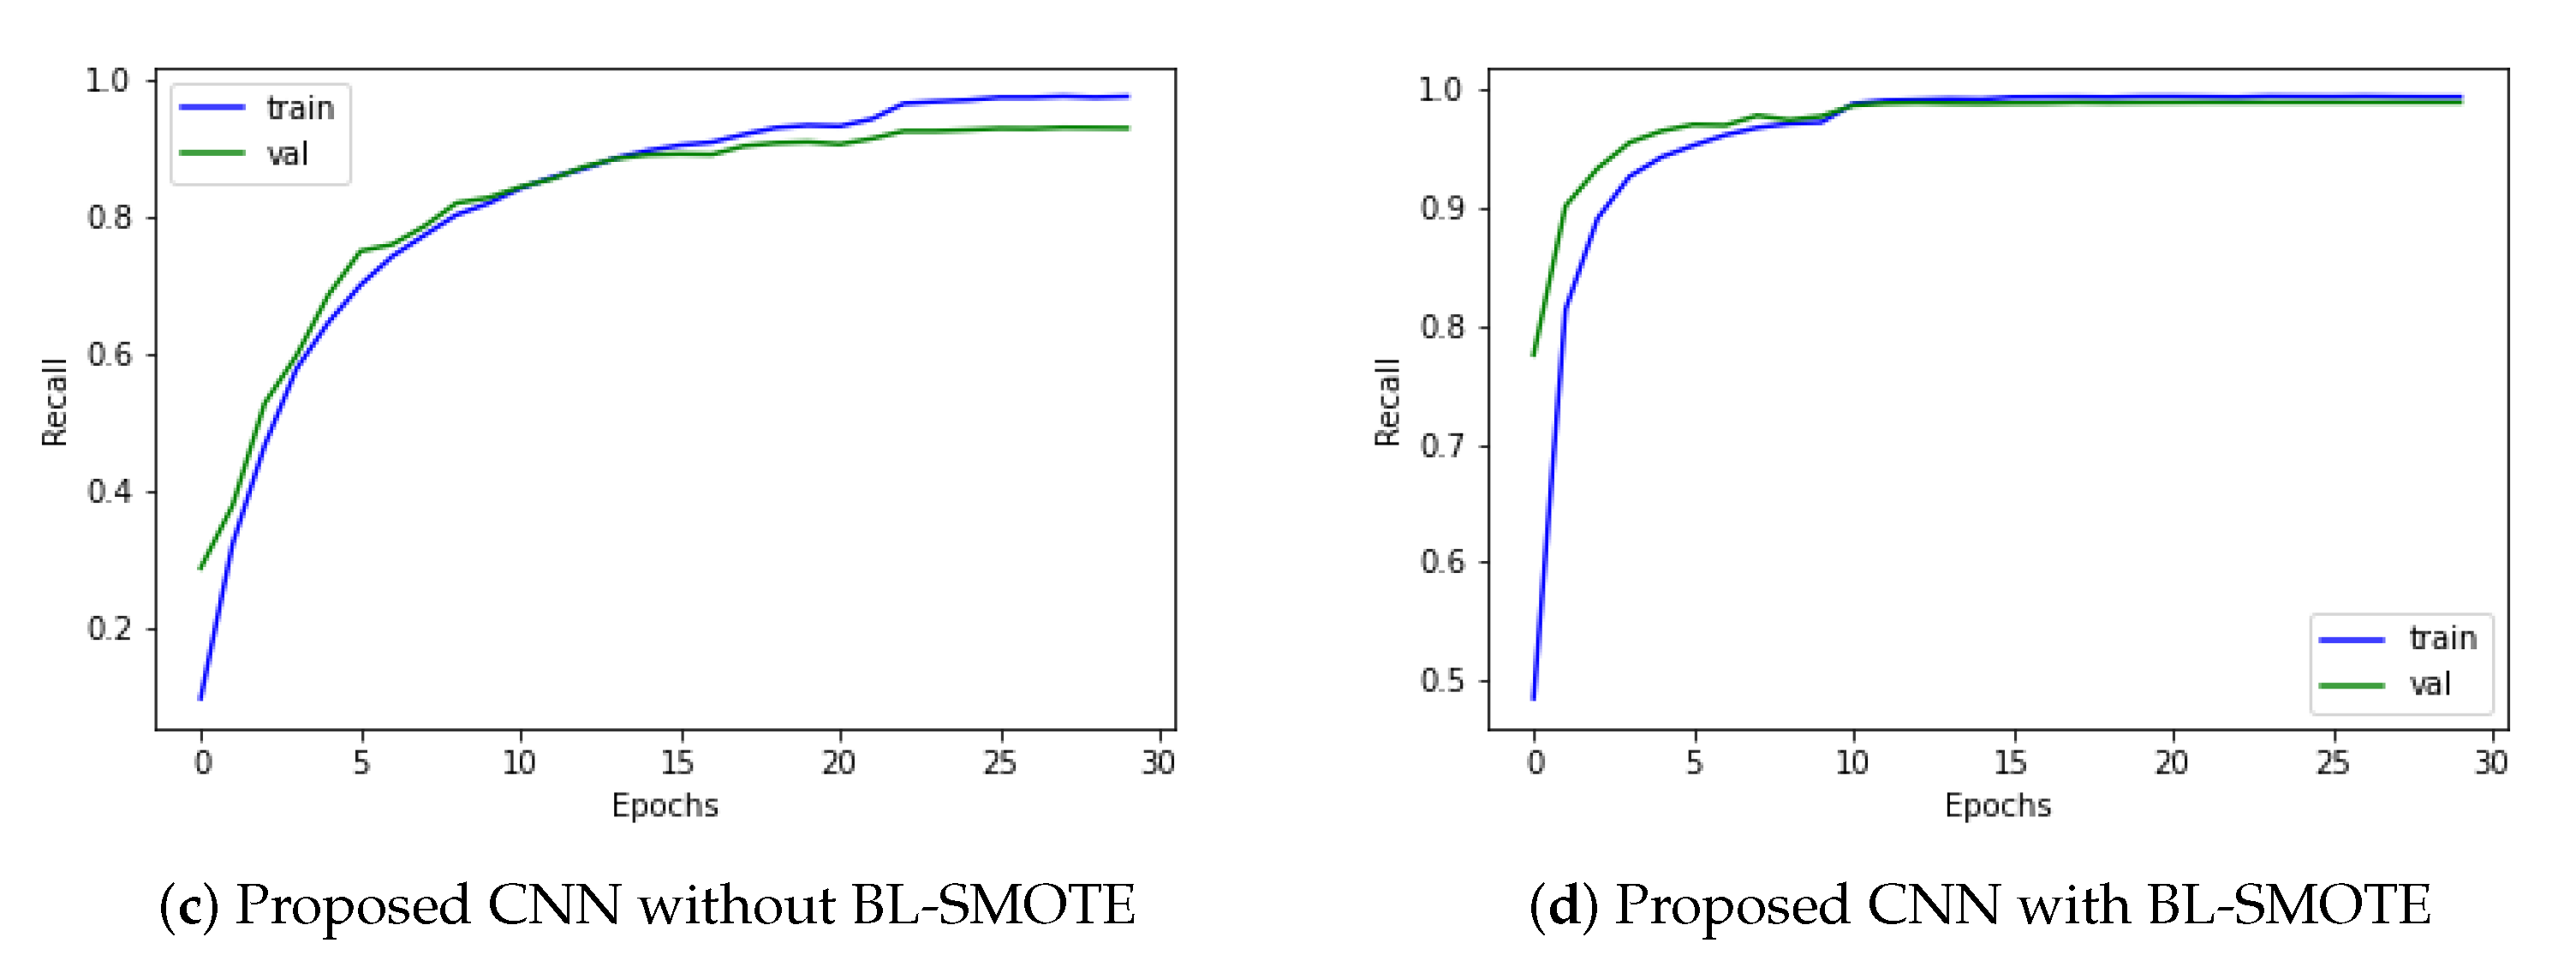
6.6. Loss Comparison with Recent Deep Models
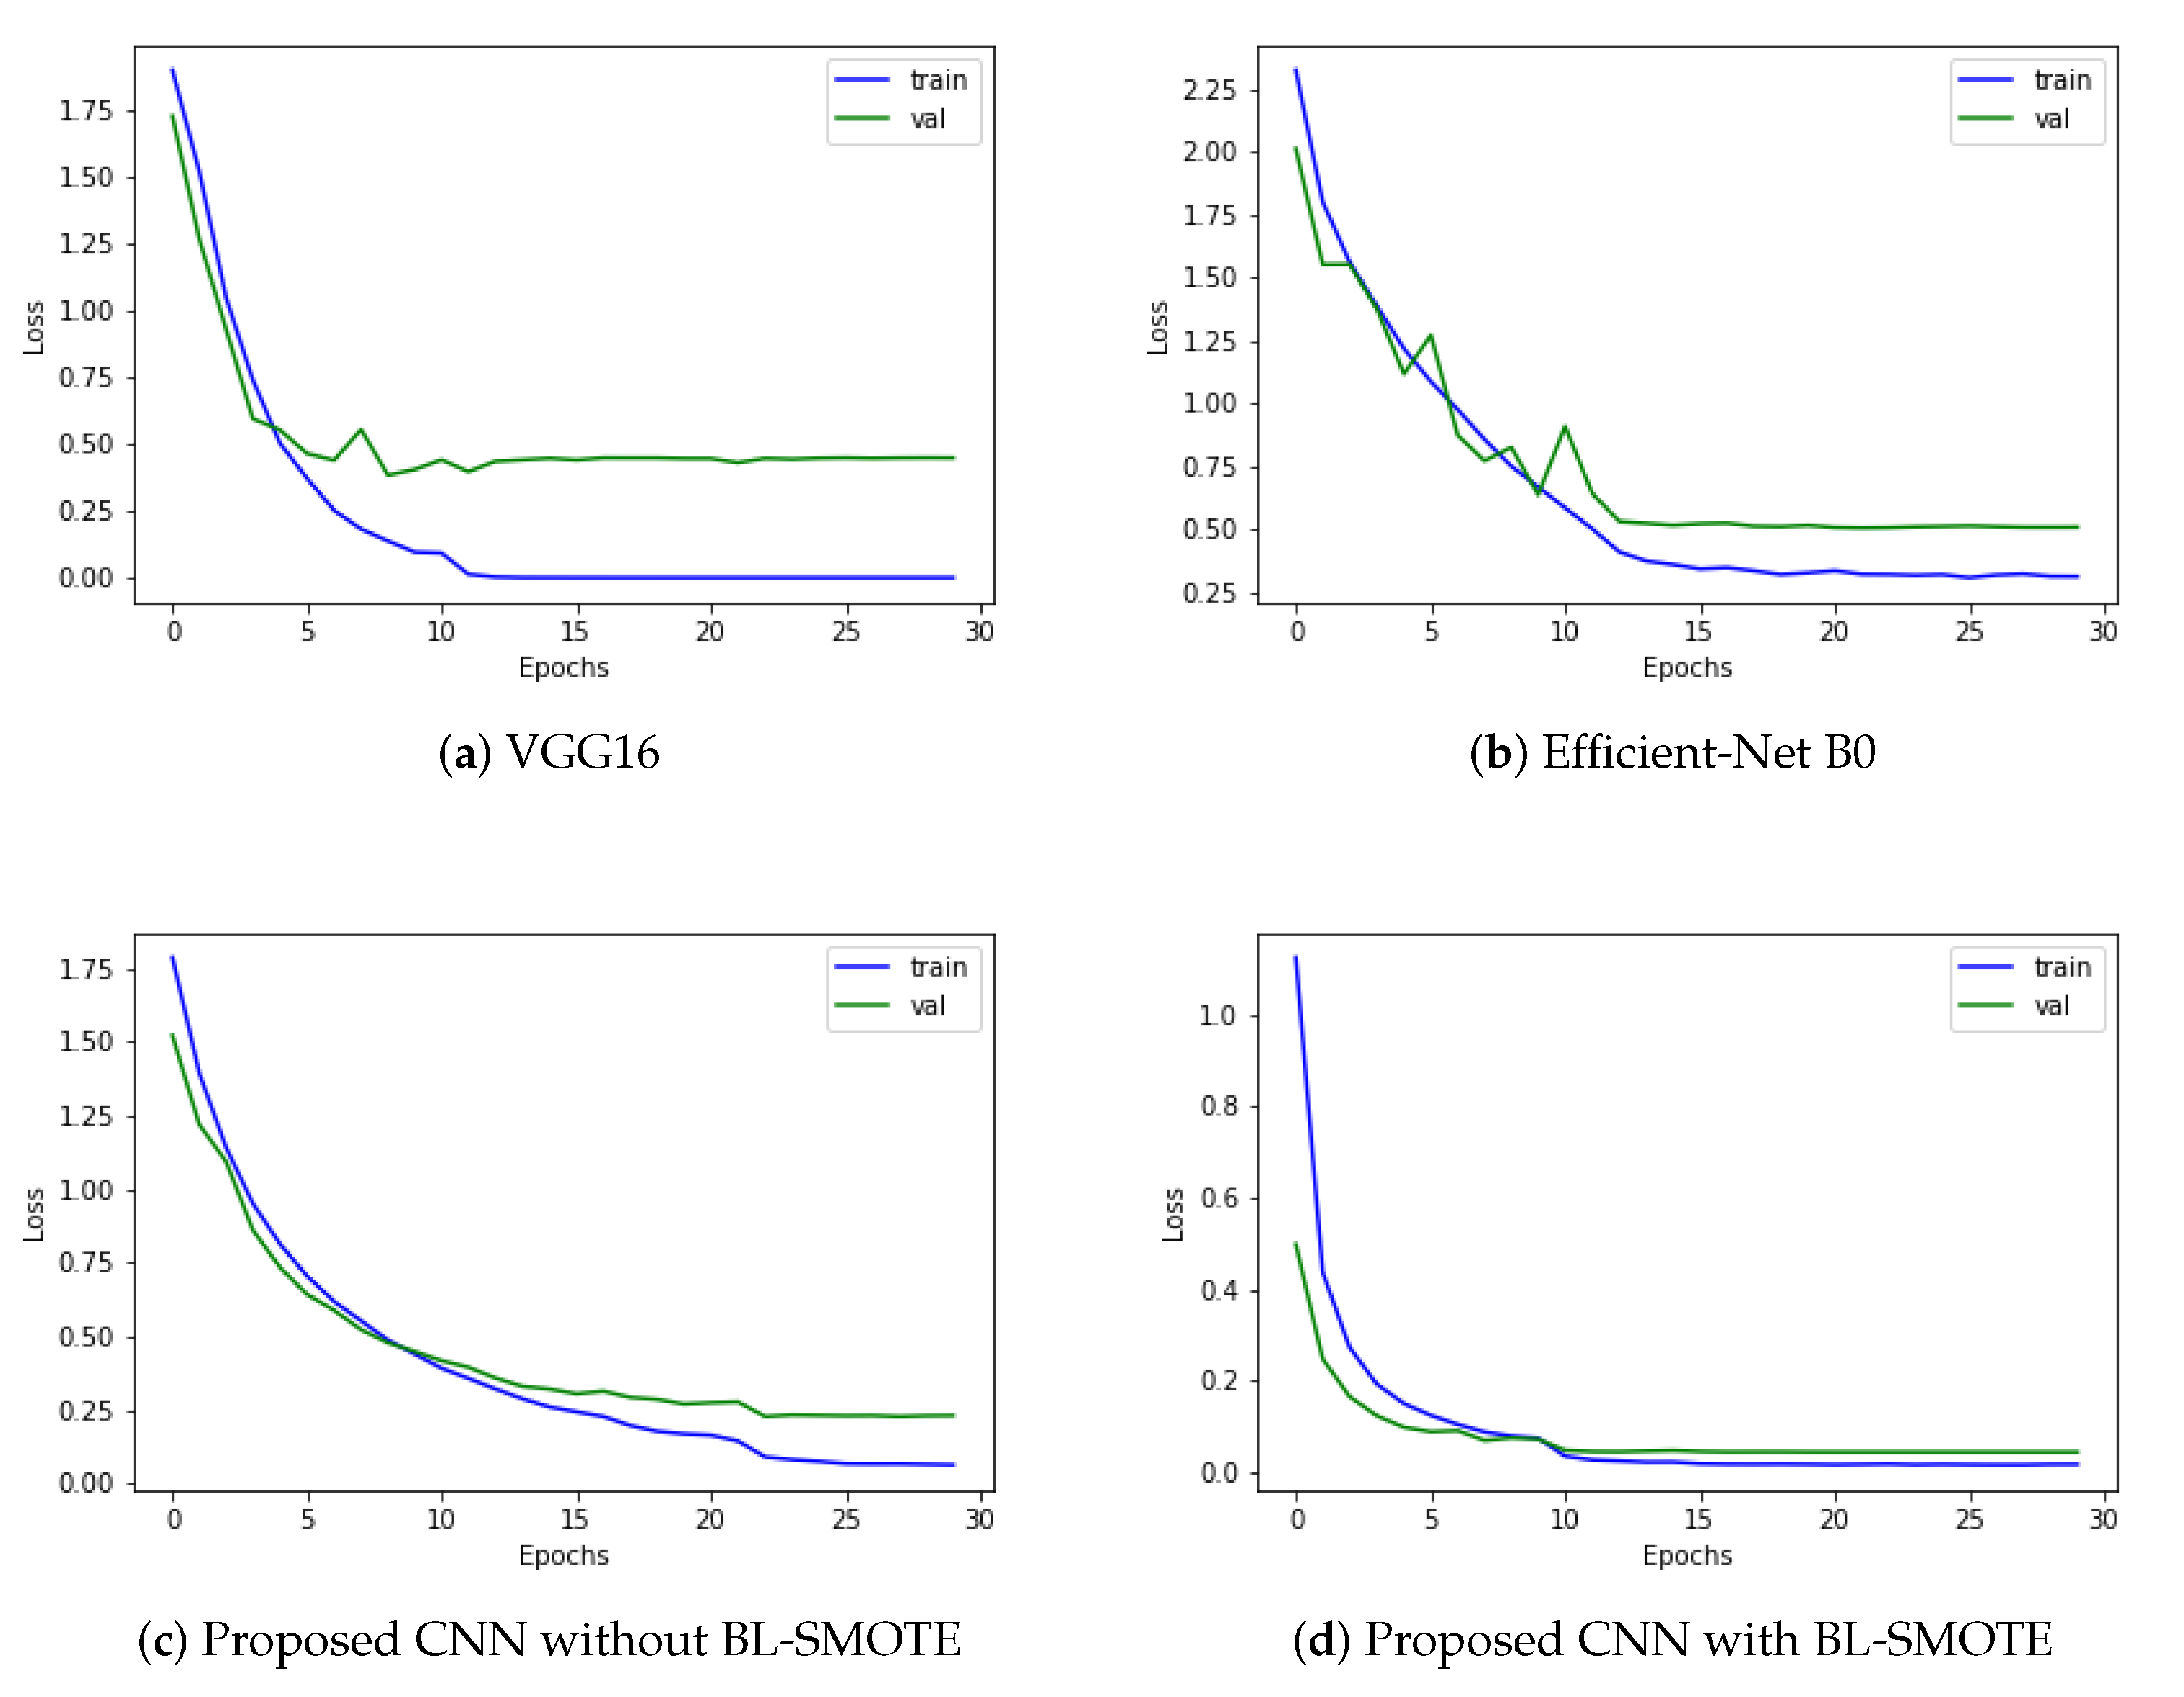
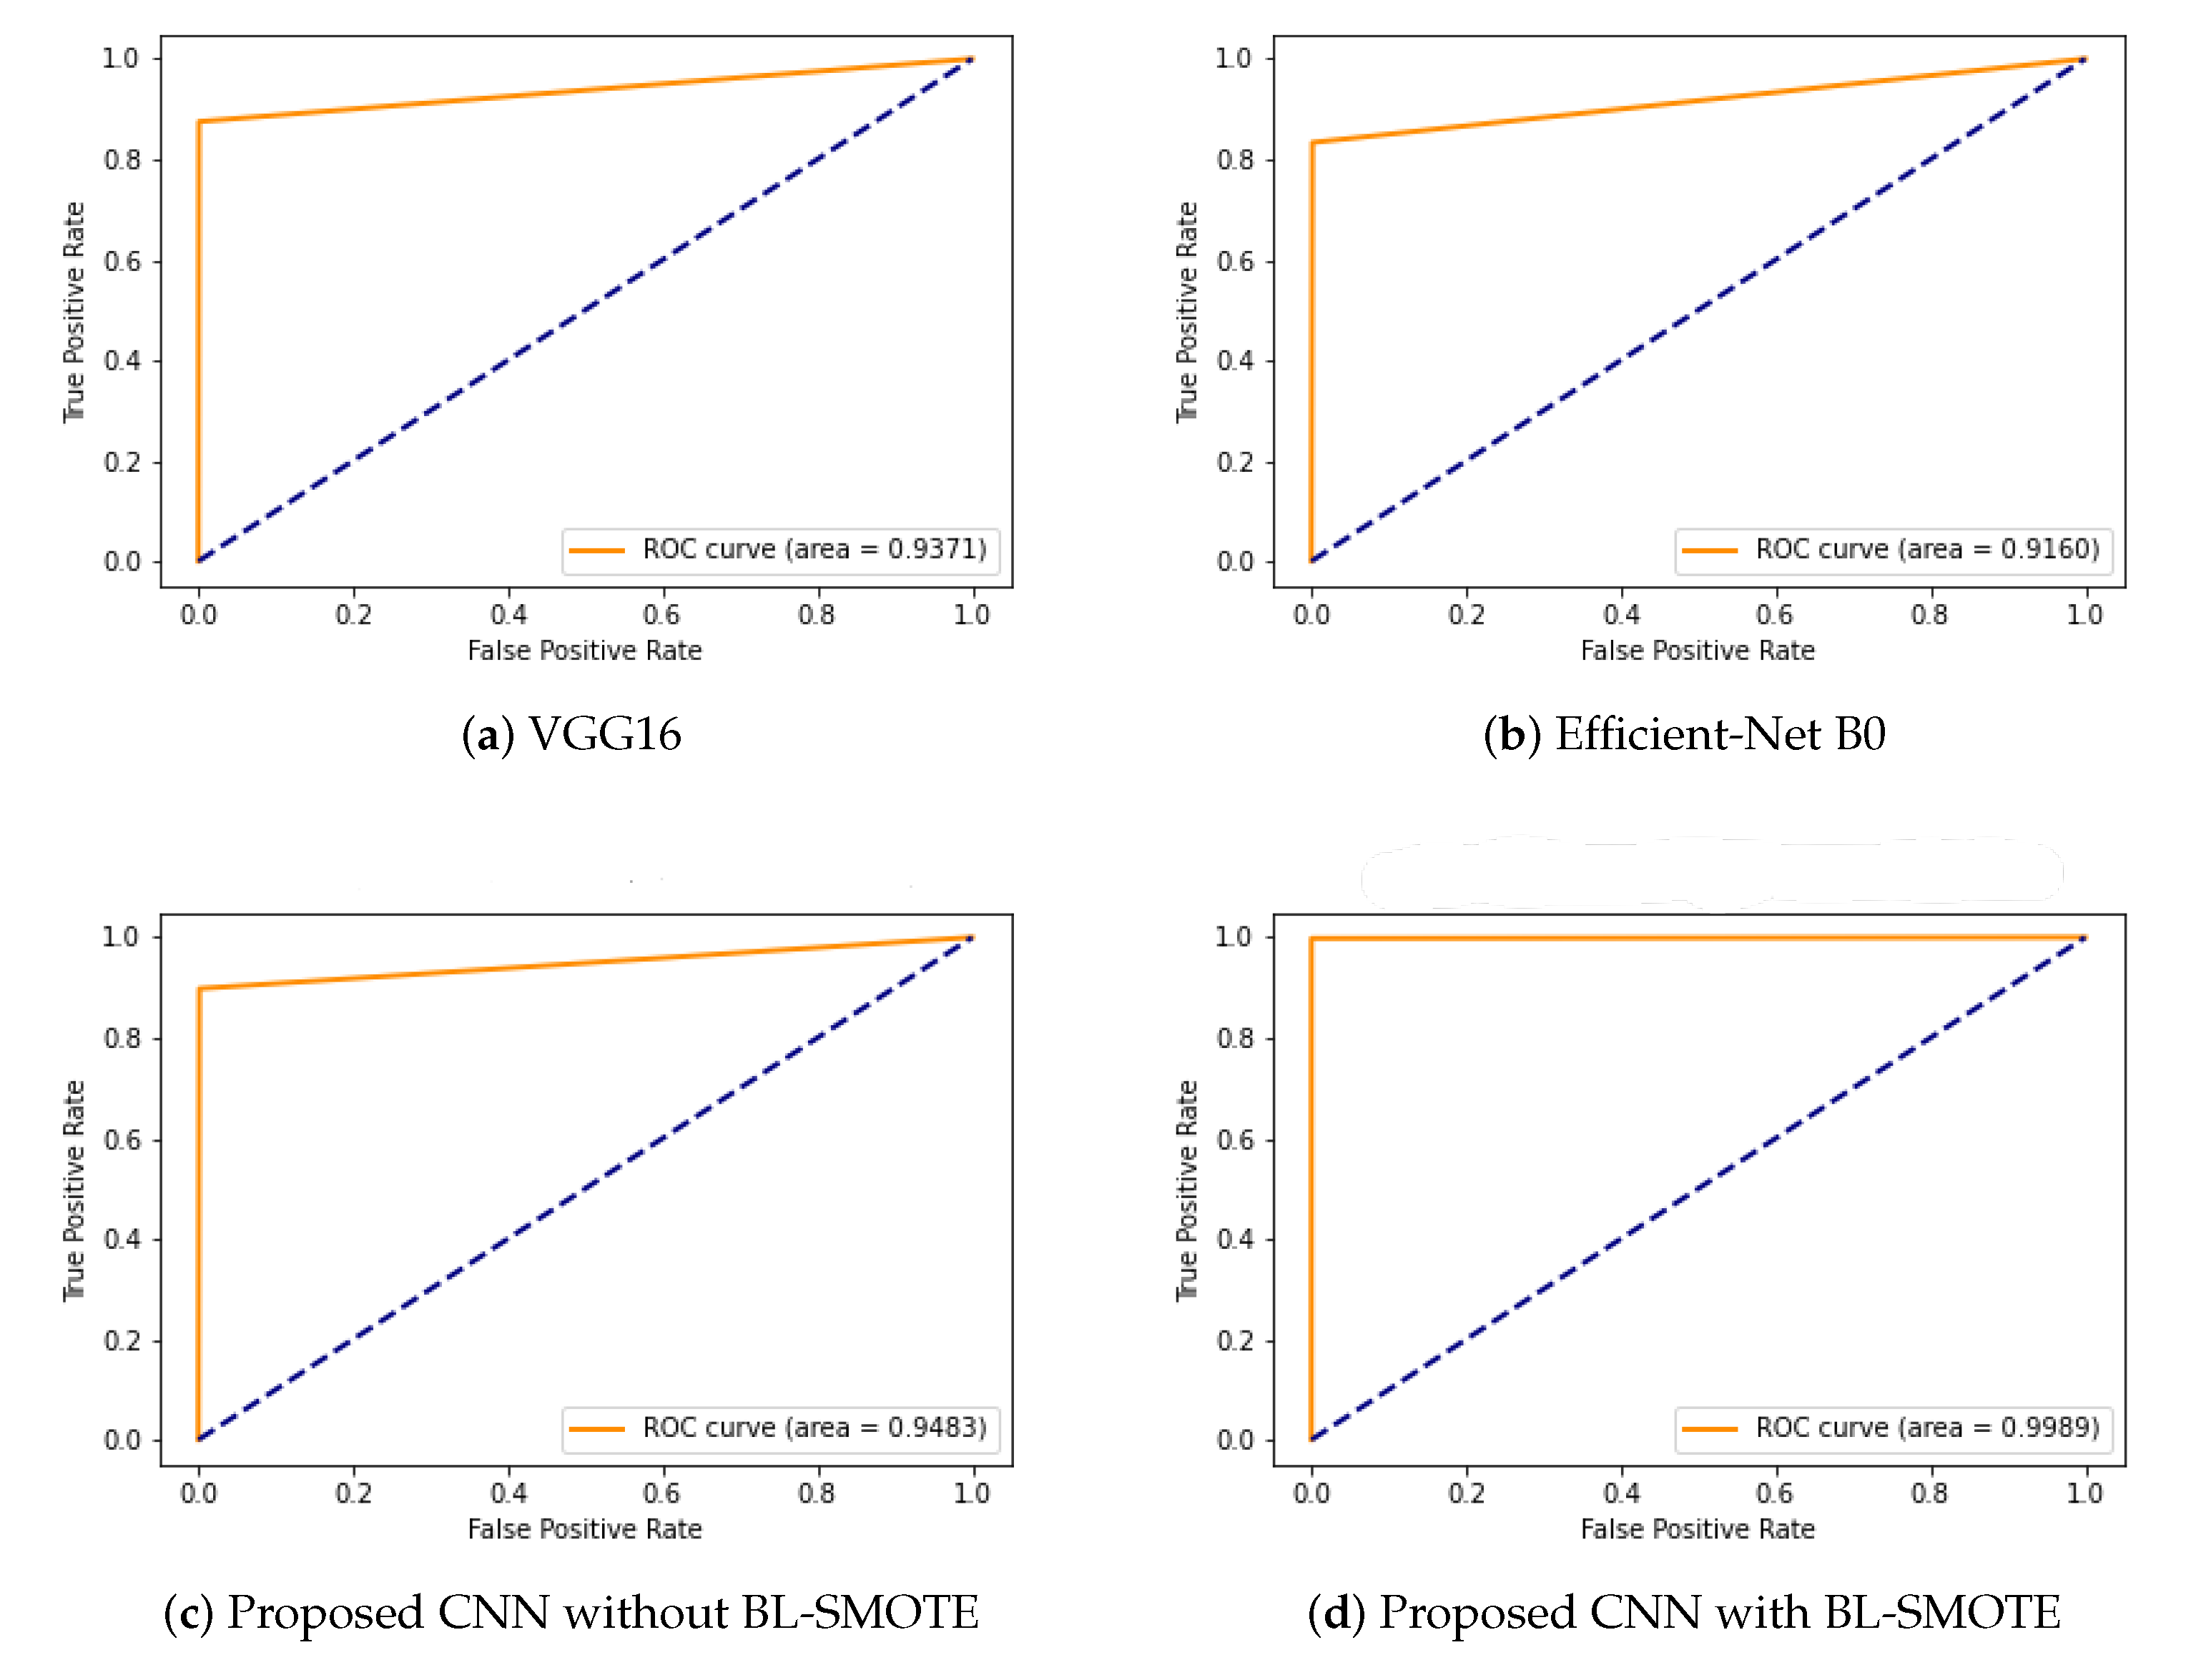
6.7. ROC Comparison with Recent Models
6.8. Comparison with Other Models Using Extension of ROC for Multi-Class
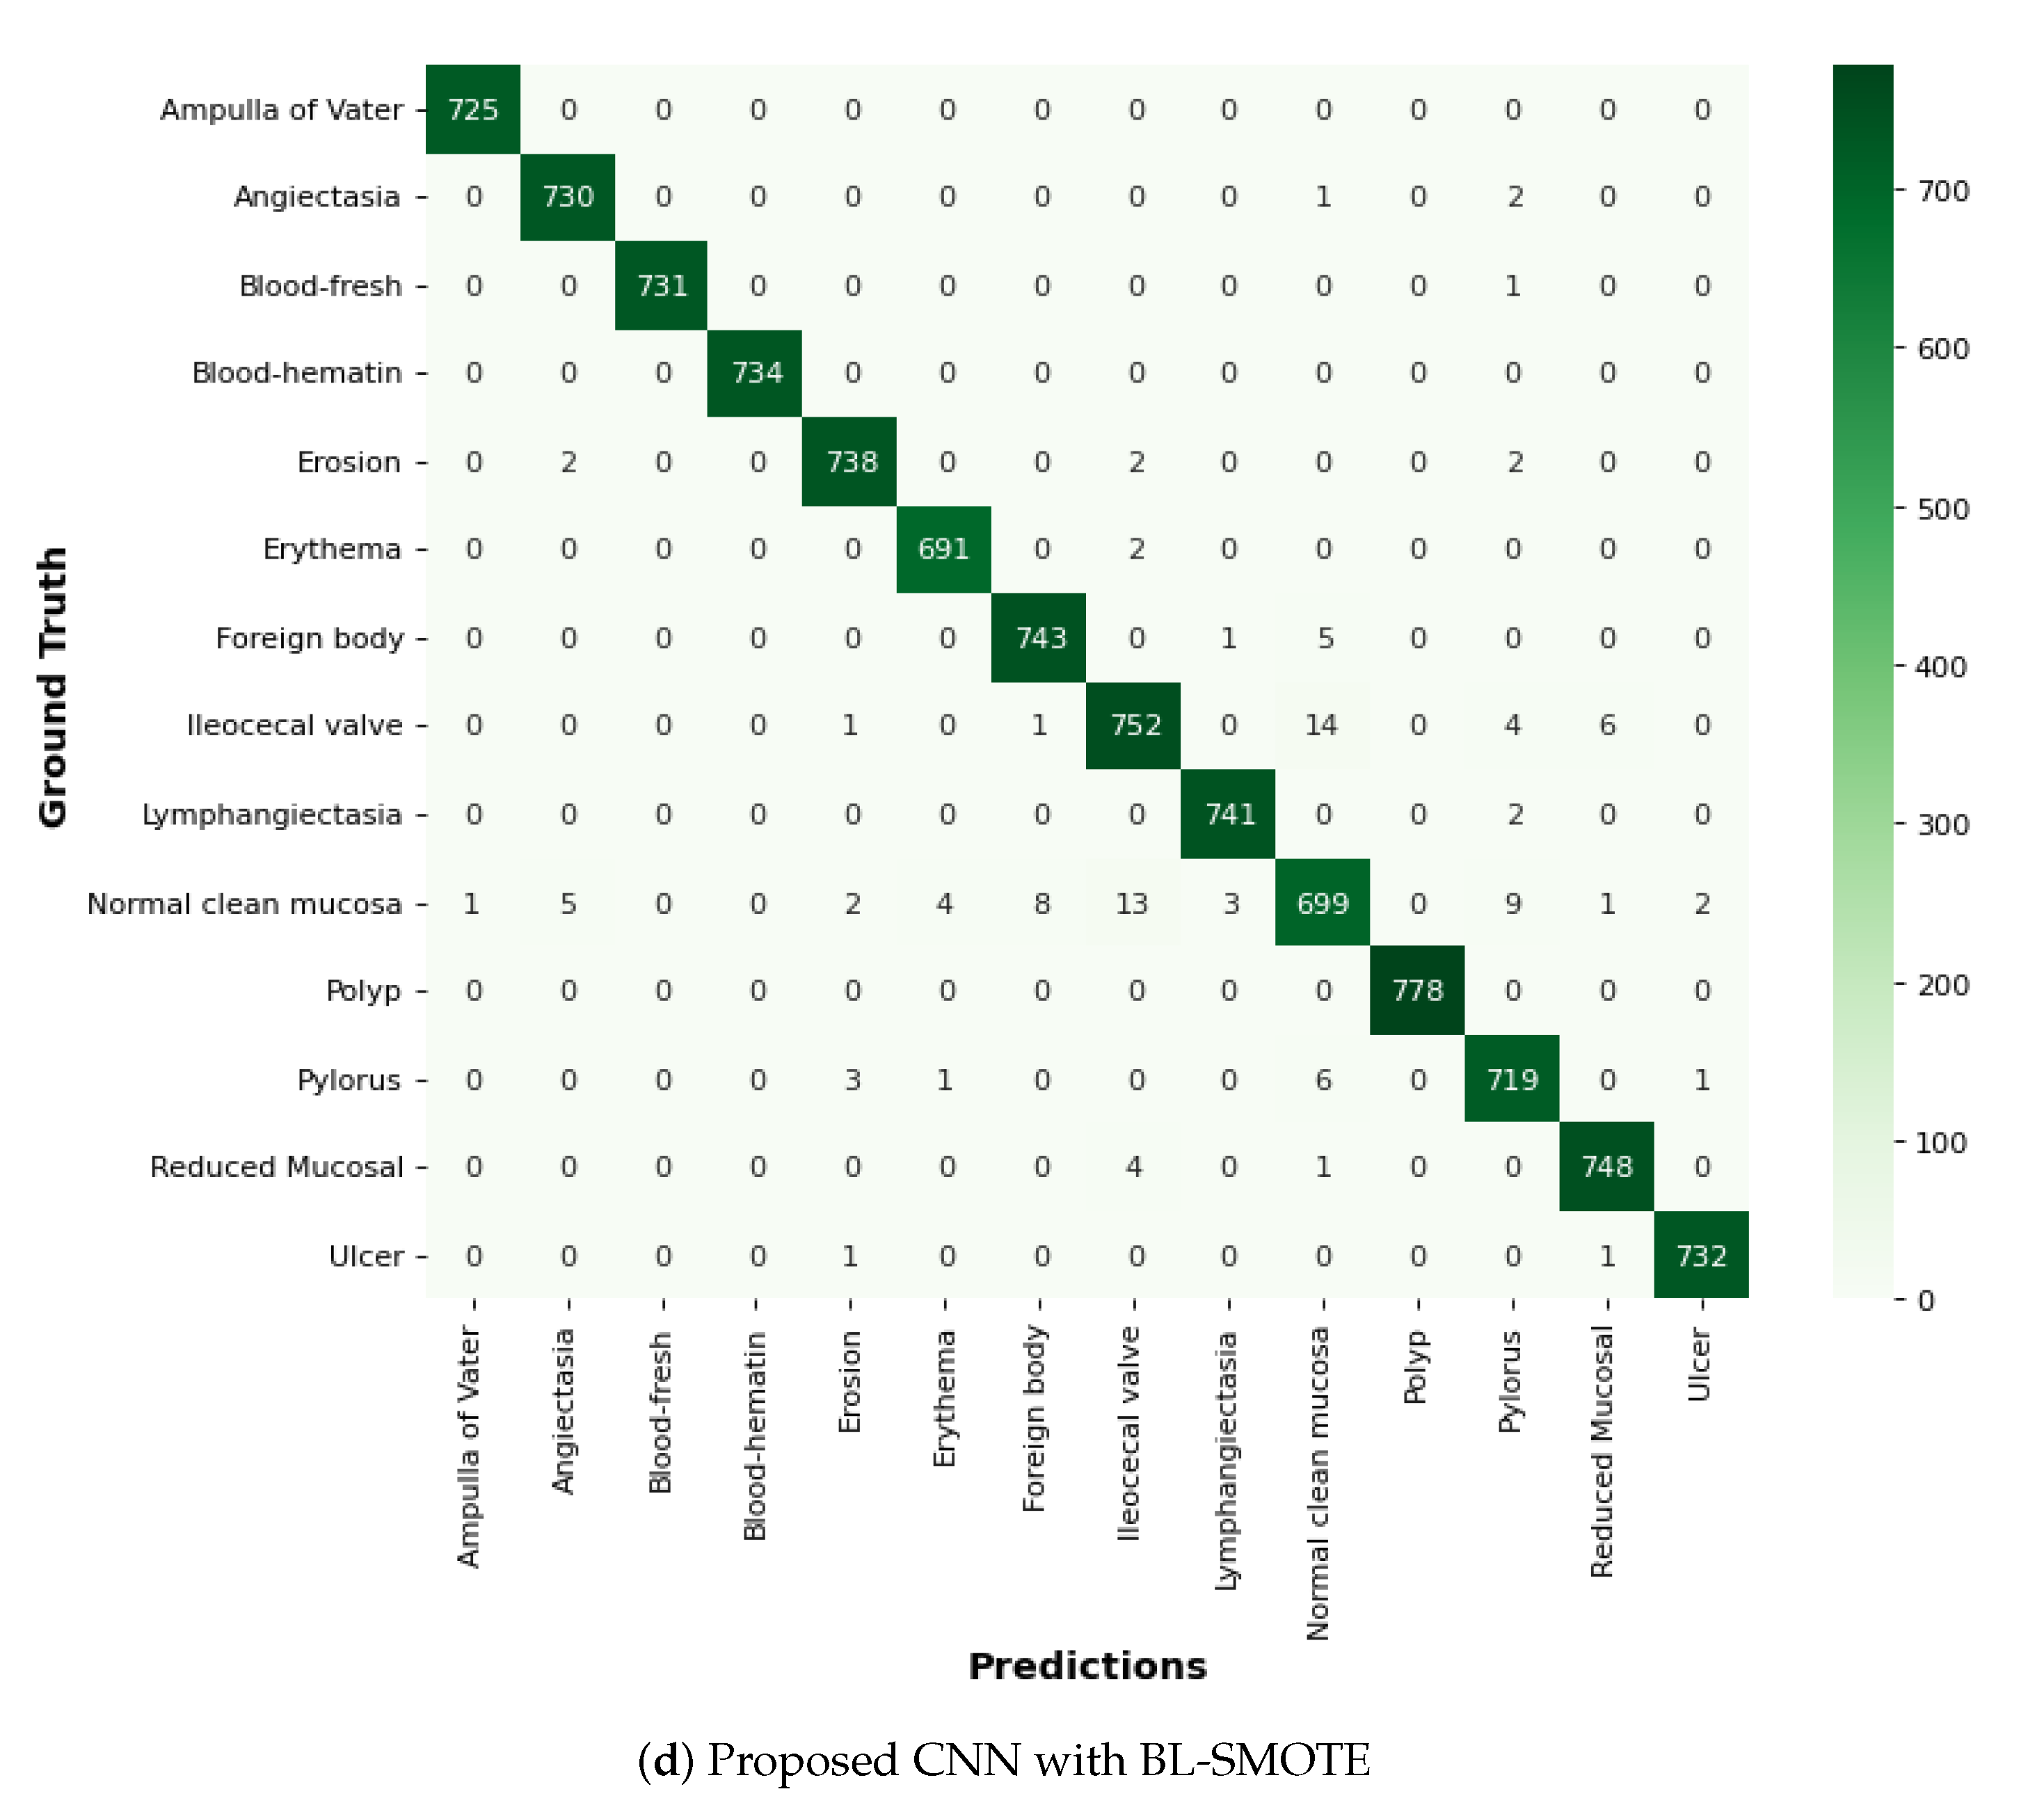
6.9. Comparison of GIDD-Net with Recent Models Using Confusion Matrix
7. Conclusions
Author Contributions
Funding
Institutional Review Board Statement
Informed Consent Statement
Data Availability Statement
Acknowledgments
Conflicts of Interest
References
- WHO. Gastrointestinal Cancer. 2020. Available online: https://www.who.int/news-room/fact-sheets/detail/cancer (accessed on 25 March 2022).
- Shen, L.; Shan, Y.S.; Hu, H.M.; Price, T.J.; Sirohi, B.; Yeh, K.H.; Yang, Y.H.; Sano, T.; Yang, H.K.; Zhang, X.; et al. Management of gastric cancer in Asia: Resource-stratified guidelines. Lancet Oncol. 2013, 14, e535–e547. [Google Scholar] [CrossRef]
- Liao, Z.; Hou, X.; Lin-Hu, E.Q.; Sheng, J.Q.; Ge, Z.Z.; Jiang, B.; Hou, X.H.; Liu, J.Y.; Li, Z.; Huang, Q.Y.; et al. Accuracy of magnetically controlled capsule endoscopy, compared with conventional gastroscopy, in detection of gastric diseases. Clin. Gastroenterol. Hepatol. 2016, 14, 1266–1273. [Google Scholar] [CrossRef] [PubMed]
- Yuan, Y.; Li, B.; Meng, M.Q.H. Bleeding frame and region detection in the Wireless Capsule Endoscopy video. IEEE J. Biomed. Health Inform. 2015, 20, 624–630. [Google Scholar] [CrossRef] [PubMed]
- Shamsudhin, N.; Zverev, V.I.; Keller, H.; Pane, S.; Egolf, P.W.; Nelson, B.J.; Tishin, A.M. Magnetically guided capsule endoscopy. Med. Phys. 2017, 44, e91–e111. [Google Scholar] [CrossRef] [PubMed]
- Ozyoruk, K.B.; Gokceler, G.I.; Bobrow, T.L.; Coskun, G.; Incetan, K.; Almalioglu, Y.; Mahmood, F.; Curto, E.; Perdigoto, L.; Oliveira, M.; et al. EndoSLAM dataset and an unsupervised monocular visual odometry and depth estimation approach for endoscopic videos. Med. Image Anal. 2021, 71, 102058. [Google Scholar] [CrossRef] [PubMed]
- Stewart, B.J.; Ferdinand, J.R.; Clatworthy, M.R. Using single-cell technologies to map the human immune system—implications for nephrology. Nat. Rev. Nephrol. 2020, 16, 112–128. [Google Scholar] [CrossRef] [PubMed]
- Hong, T.C.; Liou, J.M.; Yeh, C.C.; Yen, H.H.; Wu, M.S.; Lai, I.R.; Chen, C.C. Endoscopic submucosal dissection comparing with surgical resection in patients with early gastric cancer–a single center experience in Taiwan. J. Formos. Med. Assoc. 2020, 119, 1750–1757. [Google Scholar] [CrossRef]
- Rustam, F.; Siddique, M.A.; Siddiqui, H.U.R.; Ullah, S.; Mehmood, A.; Ashraf, I.; Choi, G.S. Wireless Capsule Endoscopy bleeding images classification using CNN based model. IEEE Access 2021, 9, 33675–33688. [Google Scholar] [CrossRef]
- Yogapriya, J.; Chandran, V.; Sumithra, M.; Anitha, P.; Jenopaul, P.; Suresh Gnana Dhas, C. Gastrointestinal tract disease classification from wireless endoscopy images using pretrained deep-learning model. Comput. Math. Methods Med. 2021, 2021. [Google Scholar] [CrossRef]
- Zhuang, J.; Cai, J.; Wang, R.; Zhang, J.; Zheng, W.S. Deep kNN for medical image classification. In International Conference on Medical Image Computing and Computer-Assisted Intervention; Springer: Berlin/Heidelberg, Germany, 2020; pp. 127–136. [Google Scholar]
- Vani, V.; Mahendra Prashanth, K. Image and pixel based scheme for bleeding detection in wireless capsule endoscopy images. In The International Symposium on Intelligent Systems Technologies and Applications; Springer: Berlin/Heidelberg, Germany, 2016; pp. 161–175. [Google Scholar]
- Alzubaidi, L.; Fadhel, M.A.; Al-Shamma, O.; Zhang, J.; Santamaría, J.; Duan, Y.; R Oleiwi, S. Towards a better understanding of transfer learning for medical imaging: A case study. Appl. Sci. 2020, 10, 4523. [Google Scholar] [CrossRef]
- Smedsrud, P.H.; Thambawita, V.; Hicks, S.A.; Gjestang, H.; Nedrejord, O.O.; Næss, E.; Borgli, H.; Jha, D.; Berstad, T.J.D.; Eskeland, S.L.; et al. Kvasir-Capsule, a video capsule endoscopy dataset. Sci. Data 2021, 8, 142. [Google Scholar] [CrossRef]
- Islam, J.; Zhang, Y. Early diagnosis of Alzheimer’s disease: A neuroimaging study with deep learning architectures. In Proceedings of the IEEE Conference on Computer Vision and Pattern Recognition Workshops, Salt Lake City, UT, USA, 18–22 June 2018; pp. 1881–1883. [Google Scholar]
- Igarashi, S.; Sasaki, Y.; Mikami, T.; Sakuraba, H.; Fukuda, S. Anatomical classification of upper gastrointestinal organs under various image capture conditions using AlexNet. Comput. Biol. Med. 2020, 124, 103950. [Google Scholar] [CrossRef]
- Biniaz, A.; Zoroofi, R.A.; Sohrabi, M.R. Automatic reduction of Wireless Capsule Endoscopy reviewing time based on factorization analysis. Biomed. Signal Process. Control 2020, 59, 101897. [Google Scholar] [CrossRef]
- Charisis, V.; Tsiligiri, A.; Hadjileontiadis, L.J.; Liatsos, C.N.; Mavrogiannis, C.C.; Sergiadis, G.D. Ulcer detection in Wireless Capsule Endoscopy images using bidimensional nonlinear analysis. In Proceedings of the XII Mediterranean Conference on Medical and Biological Engineering and Computing, Chalkidiki, Greece, 27–30 May 2010; Springer: Berlin/Heidelberg, Germany, 2010; pp. 236–239. [Google Scholar]
- İncetan, K.; Celik, I.O.; Obeid, A.; Gokceler, G.I.; Ozyoruk, K.B.; Almalioglu, Y.; Chen, R.J.; Mahmood, F.; Gilbert, H.; Durr, N.J.; et al. VR-Caps: A virtual environment for capsule endoscopy. Med. Image Anal. 2021, 70, 101990. [Google Scholar] [CrossRef] [PubMed]
- Abra Ayidzoe, M.; Yu, Y.; Mensah, P.K.; Cai, J.; Adu, K.; Tang, Y. Gabor capsule network with preprocessing blocks for the recognition of complex images. Mach. Vis. Appl. 2021, 32, 1–16. [Google Scholar] [CrossRef]
- Mohapatra, S.; Nayak, J.; Mishra, M.; Pati, G.K.; Naik, B.; Swarnkar, T. Wavelet transform and deep Convolutional Neural Network-based smart healthcare system for gastrointestinal disease detection. Interdiscip. Sci. Comput. Life Sci. 2021, 13, 212–228. [Google Scholar] [CrossRef]
- Yu, J.s.; Chen, J.; Xiang, Z.; Zou, Y.X. A hybrid Convolutional Neural Networks with extreme learning machine for WCE image classification. In Proceedings of the 2015 IEEE International Conference on Robotics and Biomimetics (ROBIO), Zhuhai, China, 6–9 December 2015; pp. 1822–1827. [Google Scholar]
- Lan, L.; Ye, C.; Wang, C.; Zhou, S. Deep Convolutional Neural Networks for WCE abnormality detection: CNN architecture, region proposal and transfer learning. IEEE Access 2019, 7, 30017–30032. [Google Scholar] [CrossRef]
- Sekuboyina, A.K.; Devarakonda, S.T.; Seelamantula, C.S. A Convolutional Neural Network approach for abnormality detection in Wireless Capsule Endoscopy. In Proceedings of the 2017 IEEE 14th International Symposium on Biomedical Imaging (ISBI 2017), Melbourne, VIC, Australia, 18–21 April 2017; pp. 1057–1060. [Google Scholar]
- Iakovidis, D.K.; Georgakopoulos, S.V.; Vasilakakis, M.; Koulaouzidis, A.; Plagianakos, V.P. Detecting and locating gastrointestinal anomalies using deep learning and iterative cluster unification. IEEE Trans. Med. Imaging 2018, 37, 2196–2210. [Google Scholar] [CrossRef] [PubMed]
- Wang, S.; Xing, Y.; Zhang, L.; Gao, H.; Zhang, H. Deep Convolutional Neural Network for ulcer recognition in wireless capsule endoscopy: Experimental feasibility and optimization. Comput. Math. Methods Med. 2019, 2019. [Google Scholar] [CrossRef]
- Ghosh, T.; Chakareski, J. Deep transfer learning for automated intestinal bleeding detection in capsule endoscopy imaging. J. Digit. Imaging 2021, 34, 404–417. [Google Scholar] [CrossRef]
- Muruganantham, P.; Balakrishnan, S.M. Attention aware deep-learning model for Wireless Capsule Endoscopy lesion classification and localization. J. Med. Biol. Eng. 2022, 42, 157–168. [Google Scholar] [CrossRef]
- Jha, D.; Tomar, N.K.; Ali, S.; Riegler, M.A.; Johansen, H.D.; Johansen, D.; de Lange, T.; Halvorsen, P. Nanonet: Real-time polyp segmentation in video capsule endoscopy and colonoscopy. In Proceedings of the 2021 IEEE 34th International Symposium on Computer-Based Medical Systems (CBMS), Aveiro, Portugal, 7–9 June 2021; pp. 37–43. [Google Scholar]
- Pannu, H.S.; Ahuja, S.; Dang, N.; Soni, S.; Malhi, A.K. Deep learning based image classification for intestinal hemorrhage. Multimed. Tools Appl. 2020, 79, 21941–21966. [Google Scholar] [CrossRef]
- Han, H.; Wang, W.Y.; Mao, B.H. Borderline-SMOTE: A new over-sampling method in imbalanced datasets learning. In Proceedings of the International Conference on Intelligent Computing, Hefei, China, 23–26 August 2005; Springer: Berlin/Heidelberg, Germany, 2005; pp. 878–887. [Google Scholar]
- Nature. Olympus. The Endocapsule 10 System. Olympus Homepage. 2021. Available online: https://www.olympus-europa.com/medical/en/Products-and-Solutions/Products/Product/ENDOCAPSULE-10-System.html (accessed on 25 March 2022).
- Wen, F.; David, A.K. A genetic algorithm based method for bidding strategy coordination in energy and spinning reserve markets. Artif. Intell. Eng. 2001, 15, 71–79. [Google Scholar] [CrossRef]
- Wang, L.; Wang, X.; Fu, J.; Zhen, L. A Novel Probability Binary Particle Swarm Optimization Algorithm and its Application. J. Softw. 2008, 3, 28–35. [Google Scholar] [CrossRef]


| Approach | Method | Accuracy | AUC | Precision | Recall | F1-Score |
|---|---|---|---|---|---|---|
| J. Yogapriya [10] | VGG16 | 96.3% | – | 96.5% | 96.3% | 96.5% |
| ResNet-18 | ||||||
| Google-Net | ||||||
| Prabhanantha Kumar [28] | ResNet-50 | 95.1% | – | 95.6% | – | 95% |
| See Wang [26] | HAnet | 92.05% | 97.2% | 92.3% | 91.6% | 91.9% |
| ResNet-34 | ||||||
| Abbas Biniaz [17] | CNN Model (SVD) | 96% | – | 91% | 89% | 90% |
| Jia-sheng [22] | CNN Model | 97% | – | 97.8% | – | 96.5% |
| Subhashree Mohapatra [21] | CNN Model | 93.6% | – | 93.7% | 93.6% | 93.6% |
| Debesh Jha [29] | NenoNet-A | 93.8% | – | 93.3% | 97.8% | 93.6% |
| Husanbir Singh Pannu [30] | CNN Model | 95% | – | 91% | 94% | 92% |
| Sr. # | Class Name | No. of Images |
|---|---|---|
| 0 | Ampulla of vater | 10 |
| 1 | Angiectasia | 866 |
| 2 | Blood fresh | 446 |
| 3 | Blood hematin | 12 |
| 4 | Eroson | 506 |
| 5 | Erythema | 159 |
| 6 | Foreign body | 776 |
| 7 | lleocecal valve | 4189 |
| 8 | Lymphangiectasia | 592 |
| 9 | Normal clean mucosa | 5927 |
| 10 | Polyp | 55 |
| 11 | Pylorus | 1529 |
| 12 | Reduced mucosal view | 2906 |
| 13 | Ulcer | 854 |
| Sr. # | Class Name | No. of Images |
|---|---|---|
| 0 | Ampulla of vater | 5927 |
| 1 | Angiectasia | 5927 |
| 2 | Blood fresh | 5927 |
| 3 | Blood hematin | 5927 |
| 4 | Eroson | 5927 |
| 5 | Erythema | 5927 |
| 6 | Foreign body | 5927 |
| 7 | lleocecal valve | 5927 |
| 8 | Lymphangiectasia | 5927 |
| 9 | Normal clean mucosa | 5927 |
| 10 | Polyp | 5927 |
| 11 | Pylorus | 5927 |
| 12 | Reduced mucosal view | 5927 |
| 13 | Ulcer | 5927 |
| Model Summary | ||
|---|---|---|
| Layer Type | Output Shape | Parameters |
| Input Layer | (None, 128, 128, 3) | 0 |
| Block01 | (None, 62, 62, 32) | 2432 |
| Block02 | (None, 29, 29, 64) | 51,264 |
| Block03 | (None, 12, 12, 128) | 204,928 |
| Block04 | (None, 4, 4, 256) | 819,456 |
| Dropout_1 | (None, 4, 4, 256) | 0 |
| Flatten | (None, 4096) | 0 |
| Dense_1 | (None, 256) | 1,048,832 |
| Dropout_2 | (None, 256) | 0 |
| Dense_2 | (None, 14) | 3598 |
| Output: SoftMax | (None, 14) | 0 |
| Total Parameters | 2,130,510 | |
| Trainable Parameters | 2,130,510 | |
| Non-Trainable Parameters | 0 | |
| Architecture | Dataset | Accuracy | AUC | Precision | Recall | F1-Score |
|---|---|---|---|---|---|---|
| Proposed Model (With BL-SMOTE) | Kvasir-Capsule | 98.7% | 99.8% | 98.7% | 98.6% | 98.7% |
| Proposed Model (Without BL-SMOTE) | Kvasir-Capsule | 92.9% | 99% | 93.7% | 92.7% | 88.2% |
| Efficient-Net B0 | Kvasir-Capsule | 83.86% | 98.4% | 86.6% | 82.3% | 73.4% |
| VGG16 | Kvasir-Capsule | 91.84% | 98.6% | 92.3% | 91.7% | 83.87% |
Publisher’s Note: MDPI stays neutral with regard to jurisdictional claims in published maps and institutional affiliations. |
© 2022 by the authors. Licensee MDPI, Basel, Switzerland. This article is an open access article distributed under the terms and conditions of the Creative Commons Attribution (CC BY) license (https://creativecommons.org/licenses/by/4.0/).
Share and Cite
Mahmood, S.; Fareed, M.M.S.; Ahmed, G.; Dawood, F.; Zikria, S.; Mostafa, A.; Jilani, S.F.; Asad, M.; Aslam, M. A Robust Deep Model for Classification of Peptic Ulcer and Other Digestive Tract Disorders Using Endoscopic Images. Biomedicines 2022, 10, 2195. https://doi.org/10.3390/biomedicines10092195
Mahmood S, Fareed MMS, Ahmed G, Dawood F, Zikria S, Mostafa A, Jilani SF, Asad M, Aslam M. A Robust Deep Model for Classification of Peptic Ulcer and Other Digestive Tract Disorders Using Endoscopic Images. Biomedicines. 2022; 10(9):2195. https://doi.org/10.3390/biomedicines10092195
Chicago/Turabian StyleMahmood, Saqib, Mian Muhammad Sadiq Fareed, Gulnaz Ahmed, Farhan Dawood, Shahid Zikria, Ahmad Mostafa, Syeda Fizzah Jilani, Muhammad Asad, and Muhammad Aslam. 2022. "A Robust Deep Model for Classification of Peptic Ulcer and Other Digestive Tract Disorders Using Endoscopic Images" Biomedicines 10, no. 9: 2195. https://doi.org/10.3390/biomedicines10092195