Article

Comparative Proteomic Assessment of Normal vs. Polyhydramnios Amniotic Fluid Based on Computational Analysis

by
Rūta Navakauskienė
1,*,
Sandra Baronaitė
1,2,
Dalius Matuzevičius
3,
Natalija Krasovskaja
4,
Gražina Treigytė
1,
Audronė Arlauskienė
5 and
Dalius Navakauskas
3
1
Department of Molecular Cell Biology, Institute of Biochemistry, Life Sciences Center, Vilnius University, LT-10257 Vilnius, Lithuania
2
Center for Obstetrics and Gynaecology, Clinic of Obstetrics and Gynaecology, Vilnius University Hospital Santaros Klinikos, LT-08660 Vilnius, Lithuania
3
Electronic Systems Department, Faculty of Electronics, Vilnius Gediminas Technical University, LT-03231 Vilnius, Lithuania
4
Medical Genetics Center, Vilnius University Hospital Santaros Klinikos, LT-08660 Vilnius, Lithuania
5
Clinic of Obstetrics and Gynaecology, Faculty of Medicine, Vilnius University, LT-03104 Vilnius, Lithuania
*
Author to whom correspondence should be addressed.
Biomedicines 2022, 10(8), 1821; https://doi.org/10.3390/biomedicines10081821
Submission received: 8 June 2022 / Revised: 21 July 2022 / Accepted: 22 July 2022 / Published: 28 July 2022
(This article belongs to the Special Issue Perinatal-Related Pathology)

Abstract

:
Mass spectrometry-based proteomics have become a valued tool for conducting comprehensive analyses in amniotic fluid samples with pathologies. Our research interest is the finding and characterization of proteins related to normal vs. polyhydramnios (non-immune hydrops) pregnancy. Proteomic analysis was performed on proteins isolated from fresh amniotic fluid samples. Proteins were fractionated by 2DE using a different pI range (pI 3–11, pI 4–7) and analyzed with MALDI-TOF-MS. Furthermore, by using computational analysis, identified proteins in protein maps specific to normal vs. polyhydramnios pregnancy were compared and the quantities of expressed proteins were evaluated mathematically. Comparative analysis of proteome characteristic for the same polyhydramnios pregnancy fractionated by 2DE in different pI range (3–11 and 4–7) was performed and particular protein groups were evaluated for the quantification of changes within the same protein level. Proteins of normal and polyhydramnios pregnancies were fractionated by 2DE in pI range 3–11 and in pI range 4–7. Mass spectrometry analysis of proteins has revealed that the quantity changes of the main identified proteins in normal vs. polyhydramnios pregnancy could be assigned to immune response and inflammation proteins, cellular signaling and regulation proteins, metabolic proteins, etc. Specifically, we have identified and characterized proteins associated with heart function and circulatory system and proteins associated with abnormalities in prenatal medicine. The following are: serotransferrin, prothrombin, haptoglobin, transthyretin, alpha-1-antitrypsin, zinc-alpha-2-glycprotein, haptoglobin kininogen-1, hemopexin, clusterin, lumican, afamin, gelsolin. By using computational analysis, we demonstrated that some of these proteins increased a few times in pathological pregnancy. Computer assistance analysis of 2DE images suggested that, for the better isolation of the proteins’ isoforms, those levels increased/decreased in normal vs. polyhydramnios pregnancy, and the fractionation of proteins in pI rage 3–11 and 4–7 could be substantial. We analyzed and identified by MS proteins specific for normal and polyhydramnios pregnancies. Identified protein levels increased and/or modification changed in case of non-immune hydrops fetus and in cases of cardiovascular, anemia, growth restriction, and metabolic disorders. Computational analysis for proteomic characterization empower to estimate the quantitative changes of proteins specific for normal vs. polyhydramnios pregnancies.

1. Introduction

Since 1997, proteomic profiles of amniotic fluid (AF) have been created by various techniques [1]. Mass spectrometry-based proteomics has become a valuable tool for conducting comprehensive analyses in human fluid samples. Explanation of specific molecular and cellular mechanisms is crucial in order to understand all biological systems. Typically, the metabolite and protein composition of amniotic fluid alters during the gestation period. The successful progression of processes in pregnancy relies upon the intricate interrelationships between multiple biological molecules. Pregnancy disorders such as polyhydramnios, fetal growth restriction, preterm labour, and preeclampsia contribute significantly to maternal and perinatal mortality [2].
Non-immune hydrops fetalis (NIHF) pertains to anomalous fluid collections in soft tissues and serous cavities of the fetus. Fluid is usually present in more than one organ; fluid may collect in the abdominal cavity, pericardial cavity, lungs, and subcutaneous tissues [3]. NIHF is a condition easily diagnosed by an ultrasound. It includes cardiac defects, pulmonary, chromosomal abnormalities, skeletal dysplasia, fetus-maternal hemorrhage and hematologic abnormalities [4,5]. Bellini et al. stated that cardiac and liver failure, lymphatic disorders, and volume overload resulted in high central venous pressure, low oncotic pressure and reduced lymphatic flow, due to which NIHF occurred. Due to the changes in capillary permeability, the amino acid may leak into the amniotic fluid [6].
Tissues of the fetus act as endocrine organs that provide an extensive variety of peptides and proteins which get into the maternal and fetal circulation and affect several systems in various ways [7]. AF is heterogeneous in composition and, in the first half of pregnancy, the composition of AF is the same as maternal plasma except for a much lower concentration of protein [8]. As it is known, multidimensional proteomic analysis of the AF is mostly performed to recognize pathways causing the preterm birth. AF is studied for α-fetoprotein and choline-esterase to relieve the identification of open-tube defects, for definite digestive enzymes to diagnose cystic fibrosis, and for preeclampsia surfactant phospholipids to estimate the maturity of fetus lung when preterm delivery occurs. The amount of proteins like alpha-fetoprotein (AFP) in maternal serum is greatly linked to pregnancy. AFP is intensively studied because an alteration in its concentration in maternal serum is connected with the number of fetal abnormalities, including spina bifida and polyhydramnios. These proteins are generated and secreted by either the placenta or the fetus as pregnancy advances. Consequently, the expression of such markers in AF has been actively investigated for pathologies such as intra-amniotic infection, Down syndrome, trisomy’s 13 and 18, rupture of membrane, preterm delivery, preeclampsia, fetoplacental hypoxia, etc. [9,10].
In this study, we identified proteins specific for normal and polyhydramnios pregnancies. By using computational methods, we have determined their changes and excluded main proteins, the expression of which increased in normal vs. pathological pregnancies. Still, the confirmation of proteins that could be important for the prediction and diagnosis of polyhydramnios would require an extension of the study with a larger number of samples.

2. Materials and Methods

2.1. Sample Preparation

Proteomic analysis of fresh amniotic fluid samples was performed. Amniotic fluid of normal pregnancy (AFN), gestation of age 39 weeks, amniotic fluid of polyhydramnios pregnancy (AFP), and non-immune fetal hydrocephalus at 28 weeks of gestation were chosen, and the samples were prepared by amniocentesis. From both samples, proteins were isolated as described earlier [11], fractionated by 2DE and analyzed by MALDI-TOF-MS.

2.2. Gel Electrophoresis

The proteins were determined by two-dimensional gel electrophoresis (IEF/SDS, 2DE). An Immobiline DryStrip Kit, pH ranges 3–11 and 4–7, and Excel Gel SDS, gradient 8–18% was applied for two-dimensional electrophoresis. It was implemented based on the manufacturer’s instructions (Immobiline DryStrip Kit for 2D electrophoresis with Immobiline DryStrip and ExelGel SDS, Pharmacia Biotech, Uppsala, Sweden). To visualize the proteins, 2DE gels were stained with Colloidal Coomassie Blue-250.

2.3. In-Gel Digestion and MALDI-TOF MS Analysis

The relevant areas were cut off from the gel and exposed to in-gel tryptic digestion for one day. For the short term, the gel pieces were dehydrated with 50% acetonitrile and then dried entirely in a centrifugal evaporator (DNA Mini, Eppendorf). The protein spot was rehydrated in 30 μ L of 25 mM ammonium bicarbonate (pH 8.3) including 20–30 μ g/mL modified trypsin (Promega), and the specimens were incubated overnight at 37 °C. The tryptic peptides were then extracted from the sliced gel pieces in the following manner. Some extraneous solution left after the digestion was withdrawn and put into a fresh tube. The gel pieces were washed with 5% trifluoracetic acid in 50% acetonitrile two times, shaking from time to time. The extract and digestion solutions were afterwards merged and evaporated until the solution has dried completely. For MALDI-TOF analysis, peptides were dissolved in 3 μ L of 30% acetonitrile and 0.01% trifluoracetic acid and were later set up with a matrix (alpha-cyano-4-hydroxicinnamic acid) on the target plate. The analysis was performed on a Voyager MALDI-TOF MS (Perspective Biosystems Inc., MA, USA) and externally calibrated applying synthetic peptides with known masses. Spectra were acquired in the positive ionization mode at 25 kV.
Processed data were analyzed using trypsin as the cleavage protease, one missed cleavage was allowed, and a fixed modification was set to carbamidomethylation of cysteines. The minimum identification criteria included two peptides per protein. The false discovery rate (FDR) for peptide and protein identification was determined based on the search of a reversed database, which was automatically generated using a software tool when the global false discovery rate was set to 1%. UniProtKB/SwissProt databases were used for protein identification. The identified proteins were submitted to AgBase, Version 2.0 (https://agbase.arizona.edu, last accessed on 13 September 2021) for the proteins’ function annotation.

2.4. Gel Image Computational Analysis

The gels were digitized with ImageScanner™ III scanner (GE Healthcare Biosciences, Laupheim, Germany) by applying LabScan 6.0 software application in particular created to obtain images from 2D electrophoresis. Scanner settings were 16-bit pixel depth and 300 dpi resolution. Images were exported as Tagged Image File Format (TIFF™) graphic files. Beforehand, the scanner was calibrated by applying the provided step tablet with known optical values. In this study, the prototype of a new software tool for 2DE gel image analysis was applied. The prototype is executed in Matlab™ environment (The MathWorks, Inc., Natick, MA, USA) and has integral original 2DE gel image processing algorithms as tools for specific tasks:
  • Image preparation tools: image cropping (to remove excess areas), spot labelling, master gel selection (to align the group of gels), molecular mass markers’ calibration (to delineate area of MM marker and input of MM values), pI calibration (to input positions of known pI values);
  • Image preprocessing related tools: image smoothing (to eliminate impulse noise), background elimination (to remove variations of background staining), individual image warping (to straighten protein migration paths);
  • Image segmentation tools: 2DE image splitting (to split image into primary segments), segmented area evaluation (to highlight uncertain segmentations of protein spots for the user), editing of segments (to manually edit protein spots in order to remove false negatives and positives of segmentation by merging, splitting, adding, or removing areas);
  • Image alignment tools: initial registration (to automatically detect some high confident control points for initial image registration), spot pairing and concluding image alignment (to find correspondences between spots), manual editing of alignment vectors (to remove mismatches and add new matches between images);
  • Quantitative analysis tools: spot quantification (to measure normalized quantities of spots), changes evaluation (to calculate change ratios);
  • Visualization tools: 3D viewer (to display small area of image as surface), image fusion (to display overlay of two images using pseudocolors).
The analysis of 2DE images using the listed tools is presented in the Results section. In the following, we focus on the main mathematical tools and algorithms used in image processing.

2.5. Image Preprocessing

The aim of preprocessing is to eliminate accidentally arising white and black pixels (impulse noise), take out background alterations, and straighten great image distortions in the paths of identical molecular mass and identical pI proteins. Image smoothing is required in order to eliminate the impulse noise that damages the images. Impulse noise occurs during image obtaining when the scanning device catches dust, small particles of stains, and other small artefacts. This type of noise can be efficiently declined by smoothing images with a local median filter that eliminates small noise elements on an image though bigger features like spots stay unaffected. The median filter replaces the centre pixel of region by the median of surrounding pixels (neighborhood).
Original background subtraction is used to remove meaningless alterations in the gel background intensity level. Gradual change of background is discovered by applying the morphological approach. We use Top-Hat operation—we subtract the morphologically opened image from the initial image. An employed structuring element is a disk.
Selection of the appropriate master gel is an important task as all the other gels will be registered (aligned) onto it. After gel image registration, all the 2DEG images will embody such absolute geometric distortions as the master gel. The major absolute geometric distortions are image distortions in the paths of identical molecular mass proteins. On the sides of 2DE gels, polypeptides noticeably tend to migrate differently (some times more, some times less) from other places. Such consequences occur because of the drawbacks of electrophoresis technology and clearly need to be compensated to ensure that polypeptides of identical molecular weight have the same horizontal position. After evaluation of the vertical geometric distortions, 2DEG images with minimal ones are selected as a master gel. The algorithm for automatic selection of the master gel consists of the following steps: (a) filtration by asymmetric median filter; (b) horizontal smoothing; (c) contour isolation by modified Canny detector; (d) removal of short contour segments; (e) polynomial approximation of contours; (f) assessment of localized distortion effects; (g) filtration of tilt coefficients; (h) evaluation of image geometric distortions; and (i) selection of the 2DEG image with minimal vertical geometric distortions. If there is no acceptable 2DEG image to be selected as a master gel, such a gel can be constructed by minimizing vertical geometric distortions. Developed software automatically identifies horizontal patterns in gels and submits likely locations for the polypeptides of identical molecular weight [12,13]. Submitted positions can be reviewed and altered by the user manually. Afterwards, the transformation function is created and applied in order to warp the image and reduce the targeted geometrical distortions.

2.6. Gel Image Alignment

To compare protein spots from various 2DE gel images, protein spots must be matched. Overall, during the matching procedure, the landmarks common to both images are determined. In this way, landmarks are reference points applied to warp gel images. We projected and applied a registration algorithm, which at the beginning finds several landmarks that have high certainty [13,14], carries out rigid deformation of the image based on them [15], then locates all spot correspondences between images, and eventually calculates Thin-Plate Spline Transformation [16] for overlaid visualization of images and for the pairing of the protein spots.
During the primary alignment of 2DEG images, matches in 2DEG images with the greatest reliability are searched. The alignment process consists of identification of image regions of interest, assessment of similarity of various areas of gels, and determination of matches and error search. The method to discover similar 2DEG image regions is relying on Multi-Layer Perceptron combined with comparisons of Lowe descriptors [17]. Eventually, when there is an aim to detect all spot correspondences between images, an analogous strategy is applied just limiting the search area to around the spot. After automatic spot pairing is performed, it is possible to start manual editing of alignment vectors to verify and repair mismatches and add new matches between images if required.

Protein Spot Detection and Segmentation

The objective of protein spot detection is to locate possible positions of protein spots. Segmentation leads to a spot boundary which delineates spot area from the background and other spots. Segmented spot area is applied as a region of interest (ROI) for computing of spot volume.
Used protein spot detection and segmentation algorithm relies on Watershed transformation together with symmetrical feature detection [16]. Initially, the rotational feature strength map S of preprocessed 2DE image I is calculated. This computation is done in calculating the second-order symmetries using the Johansson method [18]. Then, due to the complexity of calculated rotational feature strength map, only the real part of it, i.e., S R = Re S is taken and Watershed transform [19] on inverted S R image is applied: S ( w ) = WST S R . Watershed transform divides image into w regions each having one maximum. The maximum indicates location of x max ( w ) and y max ( w ) the centre of rotational symmetry S max ( w ) = max S ( w ) and, at the same time—strength of it. Thus, it is the most probable location of the spot core.
Rotational symmetry gives an identical value for bright and dark spots. Thus, the second derivative is calculated on the image aiming to reject areas with bright spots. This derivative presents information on the curvature of the function. Dark protein spots arise as pits in 3D image representation; therefore, the second derivative is positive in the spot core area. This criterion is often applied in spot segmentation algorithms [13,20,21]. Due to the fact that the noise is amplified during the derivation, smoothing is used beforehand. For smoothing, a Gaussian kernel is used. The convolution property determines the application of smoothing and derivation by convolving image with derivative of Gaussian. Therefore, Laplacian of the Gaussian kernel is applied. Smoothed image regions with negative value in their centre, i.e., I LoG x max ( w ) , y max ( w ) < 0 are removed (that stipulates the elimination of a large part of the irrelevant image area). For the rest of the image regions, subsequent characteristics are extracted:
1.
Mode of each region of the 2DE image;
2.
Weighted difference of maximum and minimum value in contour pixels of each region of the 2DE image;
3.
Weighted difference of maximum and minimum value in contour pixels of each region of the symmetry map;
4.
Maximum value of Kovesi phase symmetry feature detector [22] in each region of the 2DE image;
5.
Maximum Laplacian value of Gaussian in each region of the 2DE image.
According to these features, the image regions with labels were sorted into three classes: C1—“one spot exists in the region”, C2— “only part of spot exists in the region”, and C3—“there is no spot in the region” [14]. Classification was done by a Feedforward Multilayer Neural Network of three layers with 5–10–3–2 neurons and tangent sigmoid transfer functions.
Image areas sorted as having a partial spot are highlighted calling the attention of the user to review these areas and to repair (split, merge, or remove) the segmentation results interactively. Spot boundaries are determined for each gel individually, and they will be applied to delineate the area of the spot to compute the volume. After pairing and segmentation of the protein spots in gel images, the ratio of spots normalized quantities among the image groups can be computed to evaluate alterations of spot abundance between gel groups.

3. Results

3.1. Image Preparation and Preprocessing

After the images were imported to the 2D gel analysis prototype, the first step of image preparation phase was to eliminate the unneeded and incorrect parts of the image, mainly the edges of the image that are empty from the protein spots. This reduces the computational load, decreases the probability of incorrect findings, and enhances the quality of the input images prior to segmentation. In the image studied, the user interactively marks two areas—protein map analysis area and a working area that also includes MW markers. Users also can perform spot labelling, molecular mass marker calibration (to delineate area of MM marker and input of MM values), and pI calibration (input positions of known pI values).

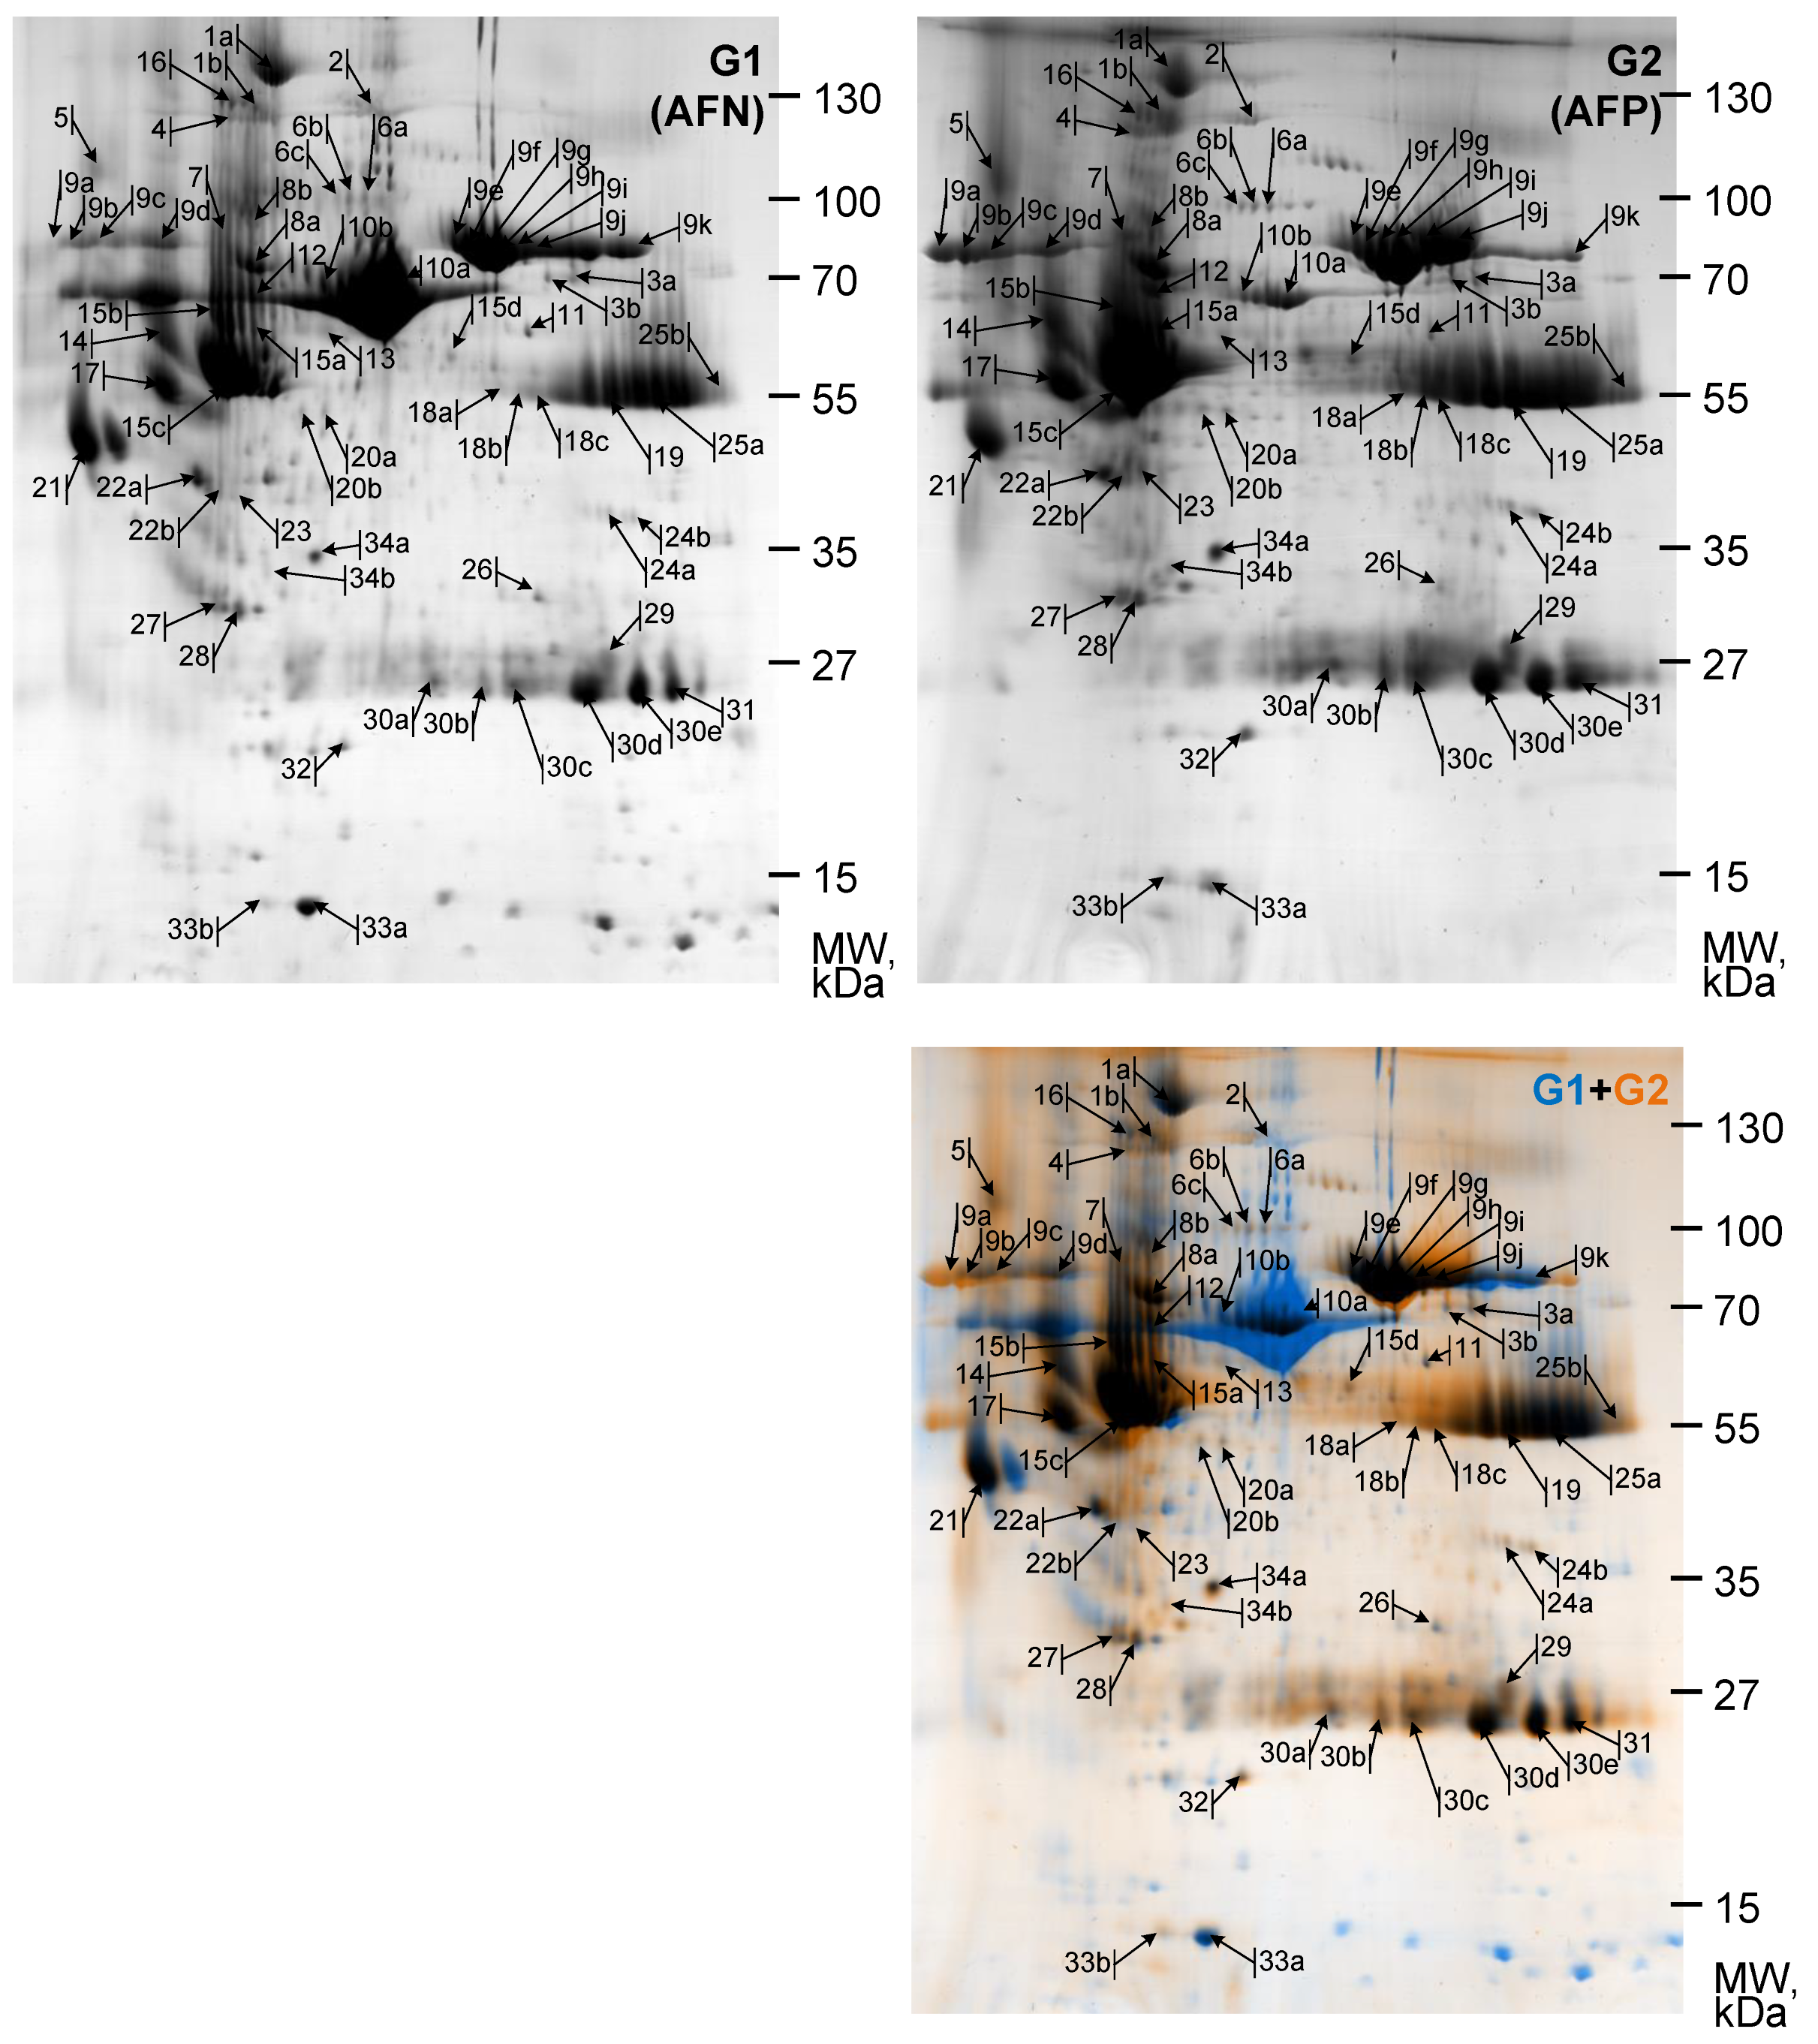
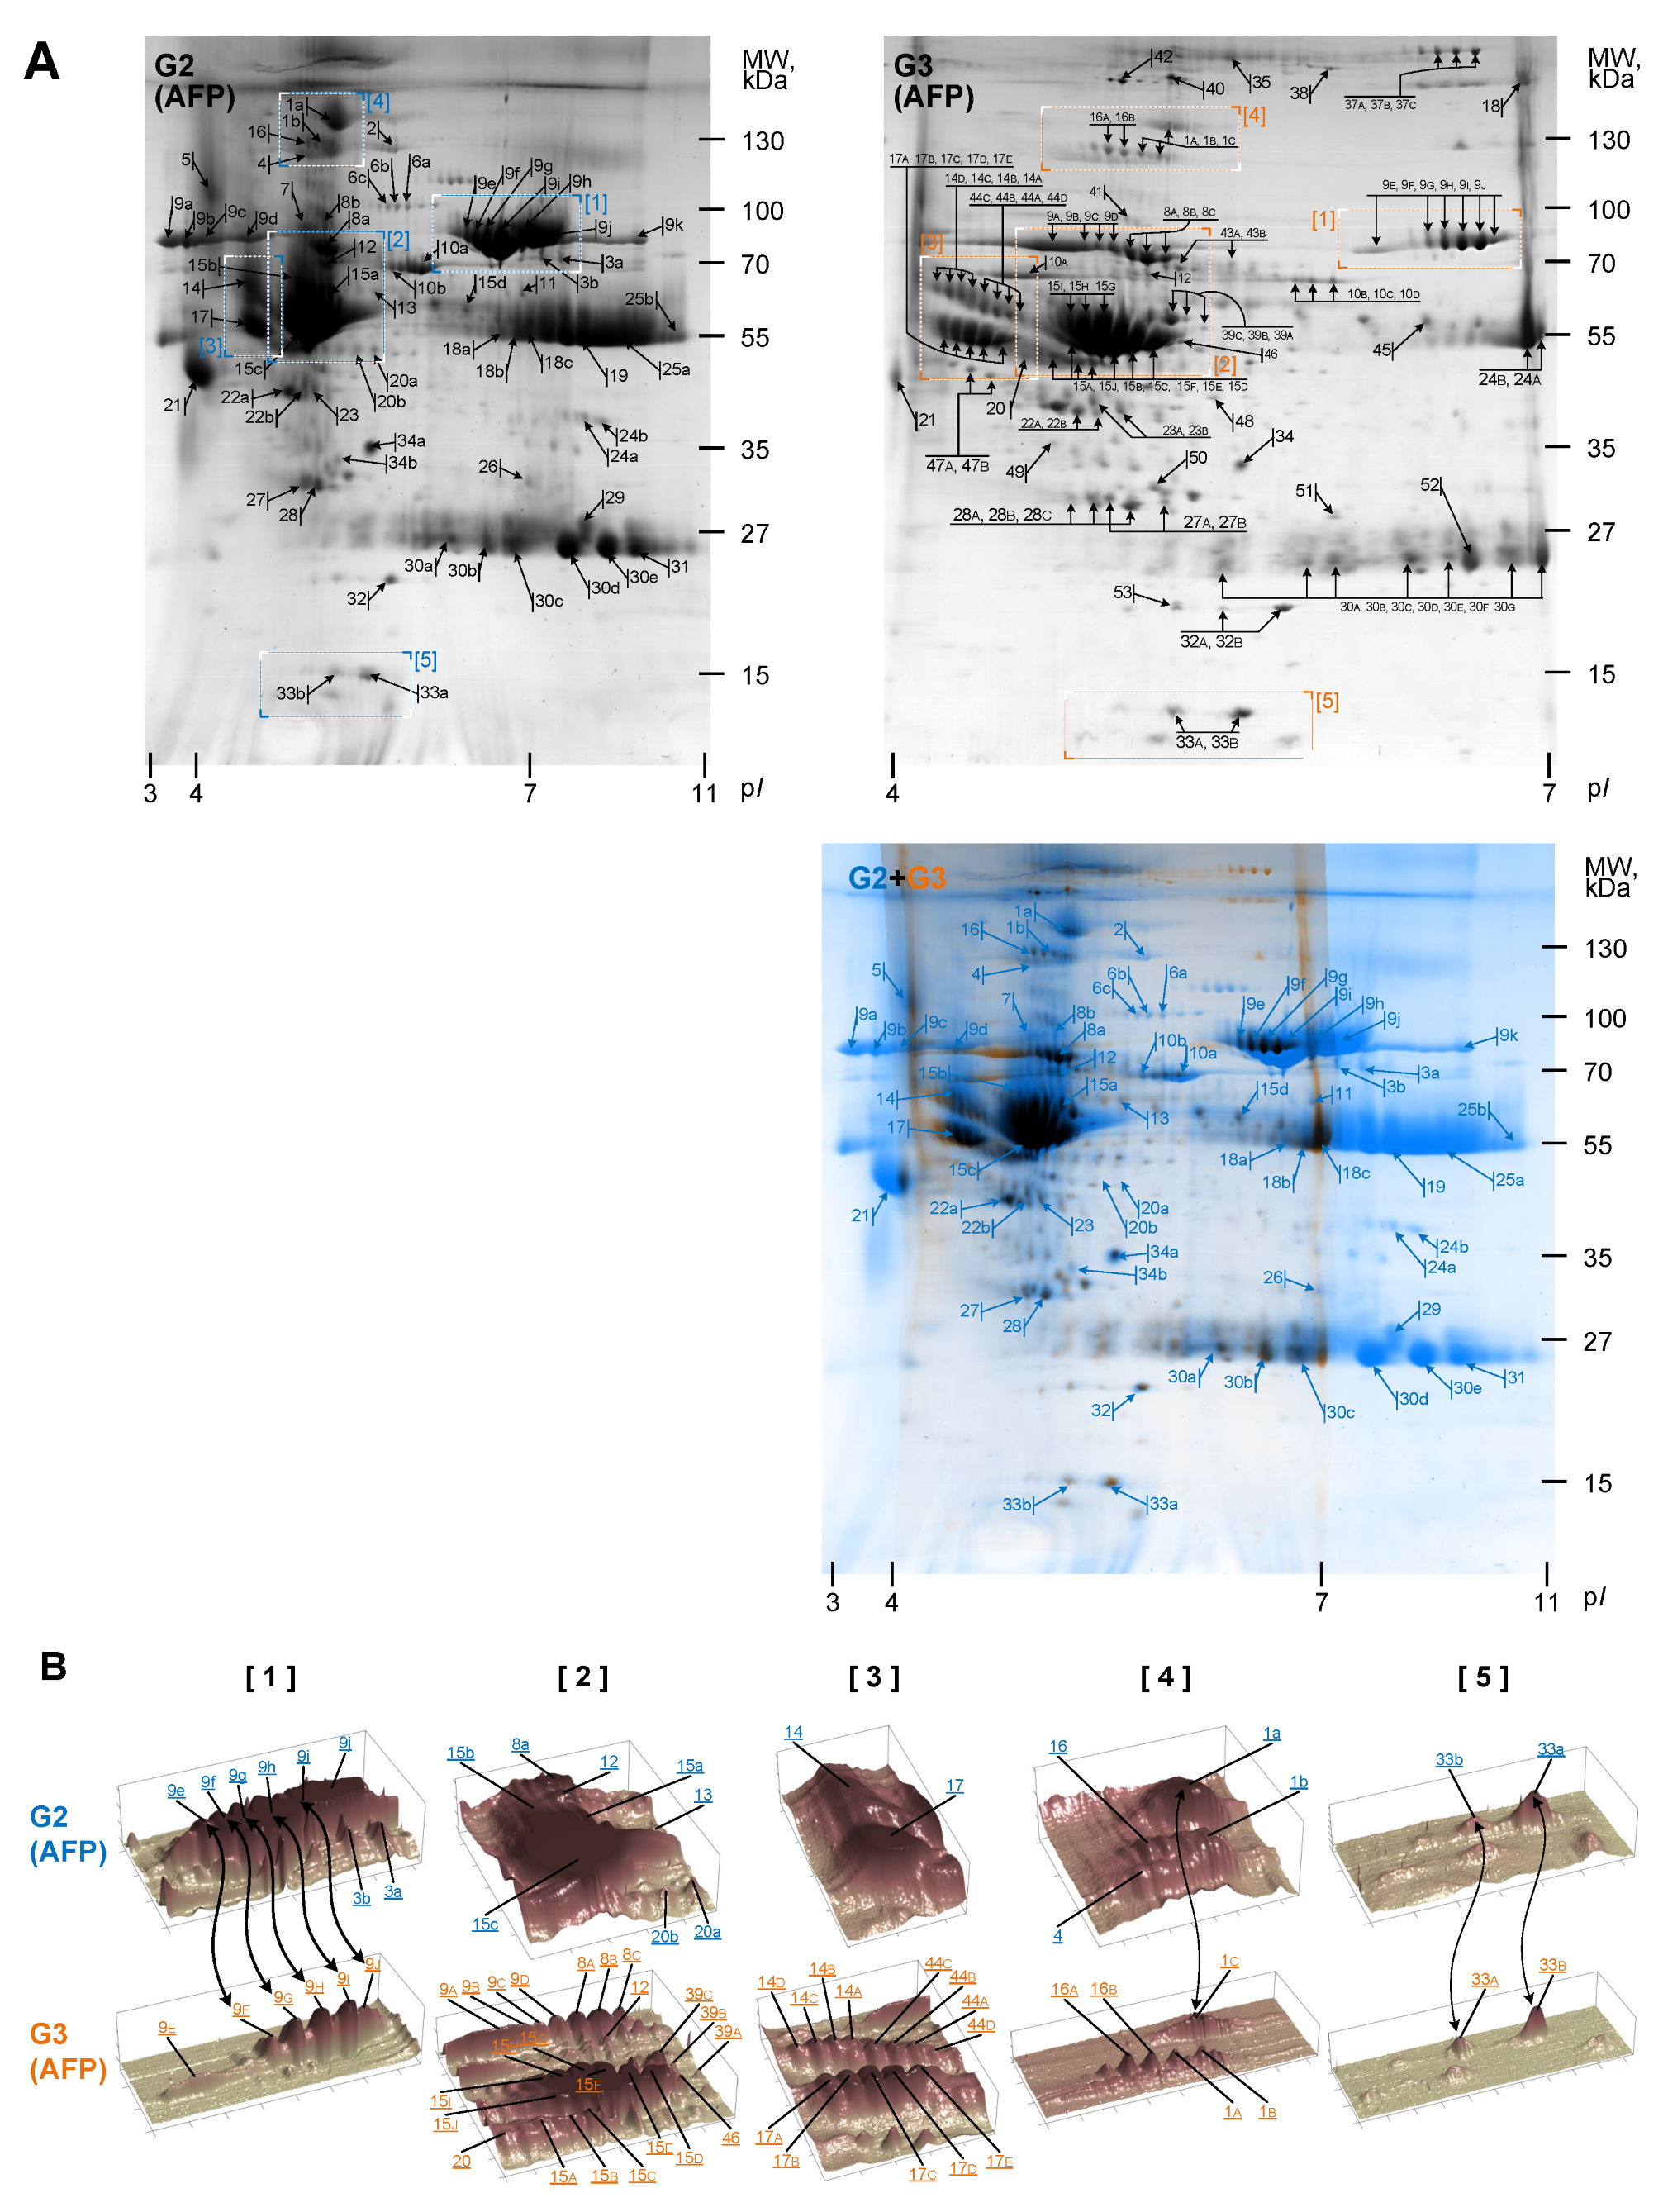
3.2. Gel Image Alignment and Segmentation

When the process of automatic gel segmentation with watershed transformation has finished, the region was edited (splitted or merged) manually. Image areas that were highlighted as “containing partial spot” were studied carefully. A 3D tool was beneficial for complex region analysis. Gel image alignment was conducted as described above. After the alignment process, the isoelectric points and molecular weights of the marked protein spots were calculated.

3.3. Quantitative Analysis

After the determination of the spot area, the number of spots is computed. Spot quantity is determined as the total intensity of a spot in a gel image and relates to the quantity of protein in the actual spot in the gel. The total intensity of an object is the sum of the intensities of all the pixels from which the object is composed. The quantity of each protein spot in a gel is divided by the total quantity of all the protein spots in that gel, in order to acquire the final normalized quantity of the given spot. The process of normalization compensates for no expression-related alterations in spot intensity. After calculating all the paired protein spots between gel images applying the integral spot quantitation tool, the ratio of spot number between images of gels G1 (representing proteins of amniotic fluid from normal pregnancy, AFN) and G2 (representing proteins of amniotic fluid from polyhydramnios pregnancy, AFP) is calculated (Figure 1, Table 1).
The normalized quantity ratio of the protein spot is applied to determine whether a spot in the first image was bigger than the corresponding spot in the second image or vice versa. The calculated values for studied protein spots are presented in Table 1 and Table 2. Because of the existence of variances in biological and technical part of the experiment, protein spots with a change of quantity larger than 2 fold are expected as a changed expression (increased or decreased).

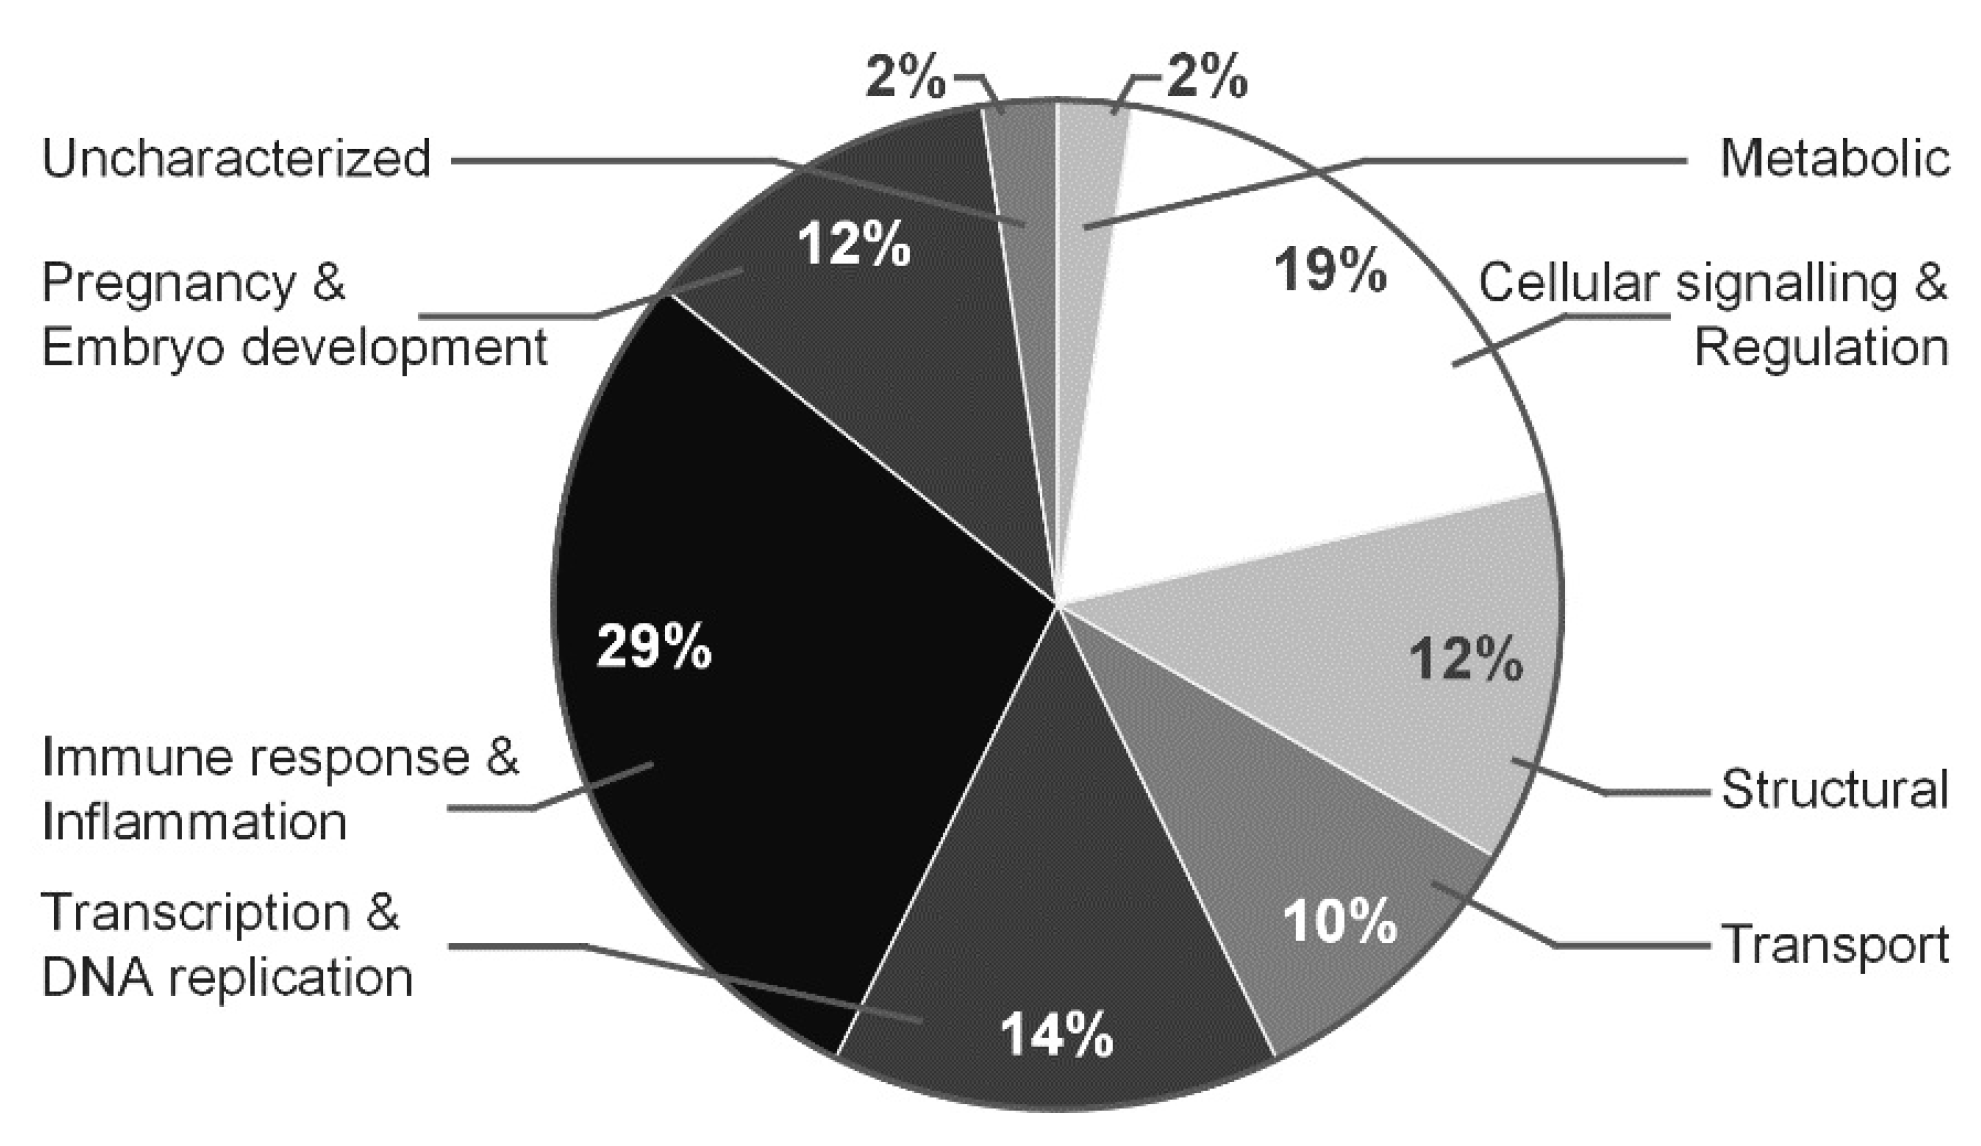
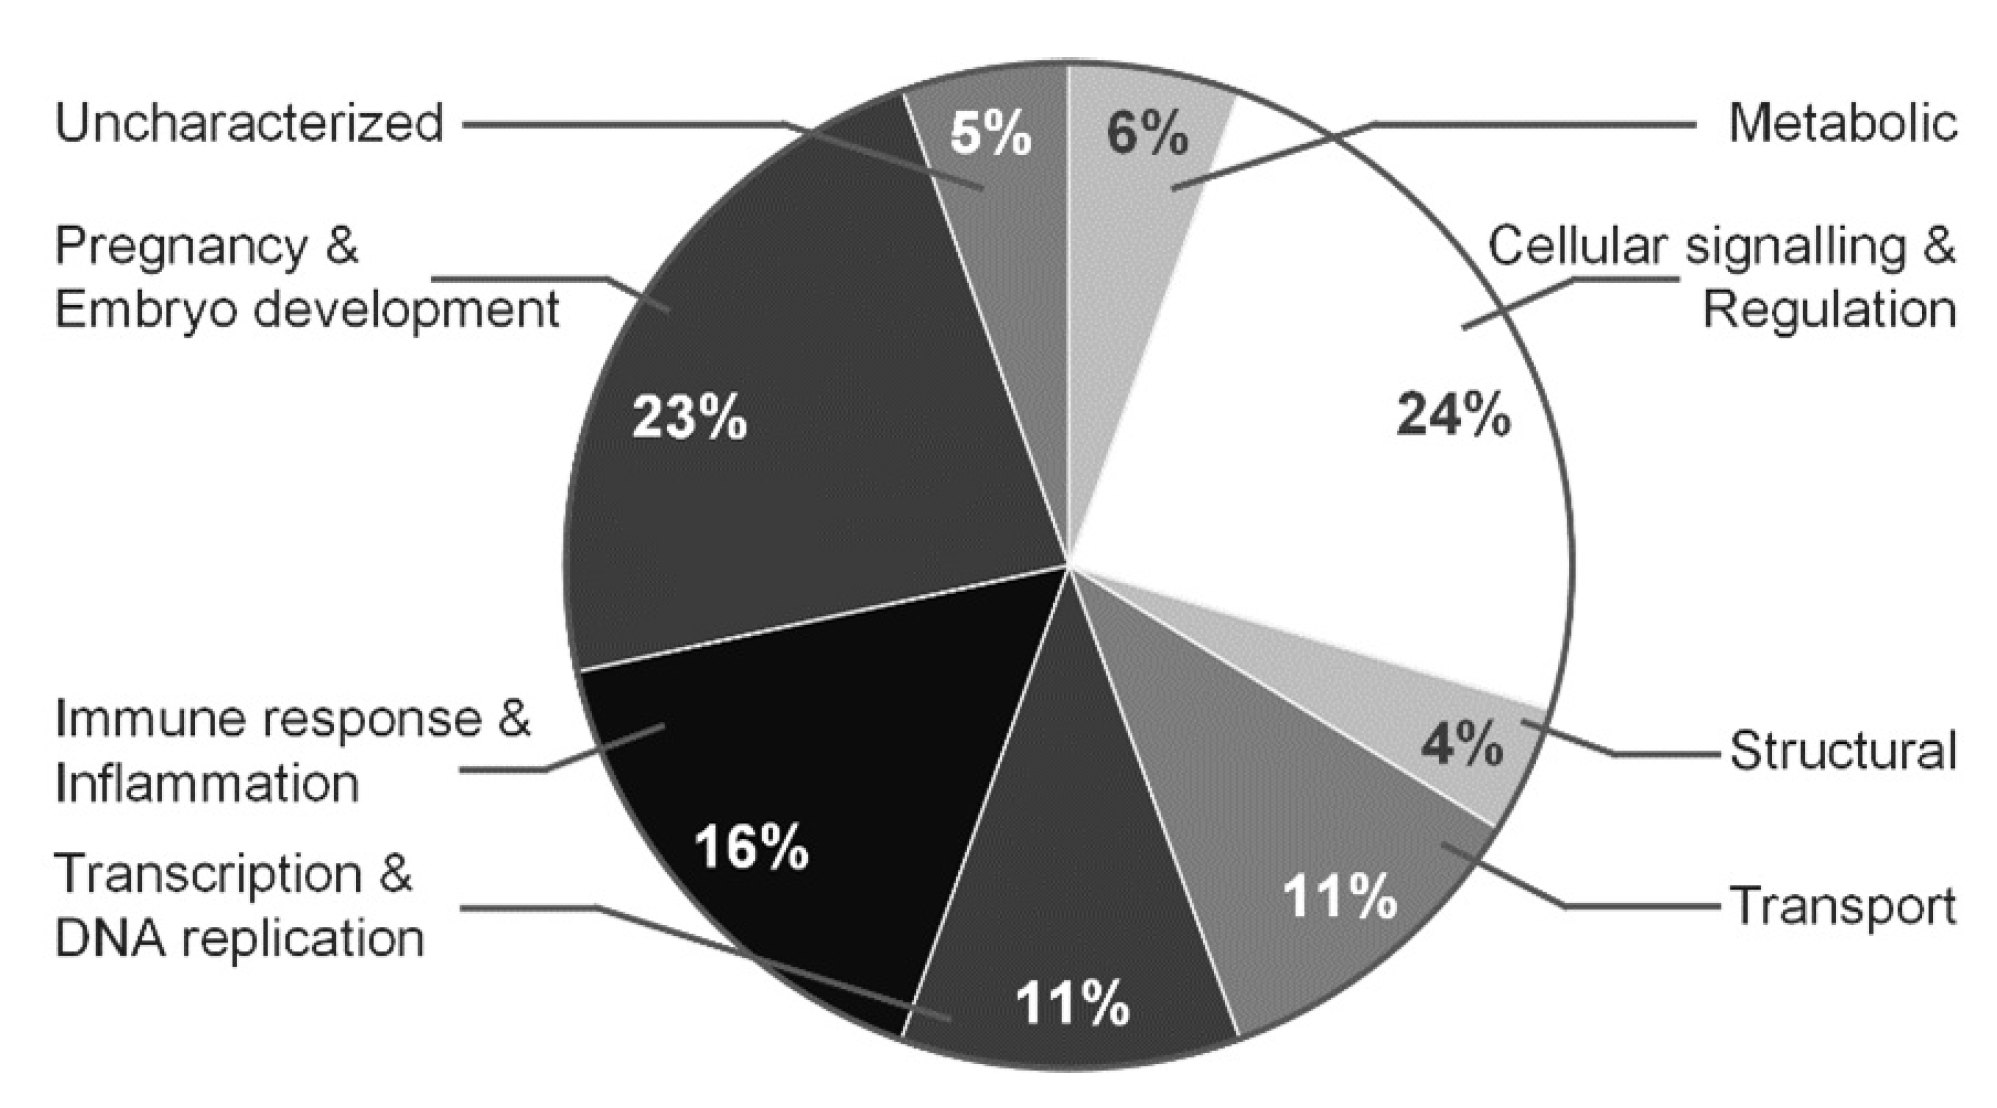
3.4. Proteomic Profile Characteristics for Normal and Polyhydramnios Amniotic Fluid

The protein profiles of amniotic fluid from normal pregnancy (AFN, G1) and from polyhydramnios pregnancy (AFP, G2) fractionated in range pI 3–11 (Figure 1) were visualized, identified (Table 1) and compared (Table 1, Fold change). We analyzed approximately 100 proteins, and only 34 proteins characteristic for AFN and AFP (pI 3–11) with a proper score were successfully identified and are shown in Table 1. Most of the detected proteins are increased in the amniotic fluid of polyhydramnios pregnancy (Table 1, Fold change). Ceruloplasmin, Plasma protease C1 inhibitor, Inter-alpha-trypsin inhibitor heavy chain, Prothrombin, Alpha-1B-glycoprotein, Lumican, Basement membrane-specific heparan sulfate proteoglycan core protein, Transthyretin, and others, the protein spot level of which increased more than 2.5 times can be mentioned. The level of other proteins, e.g., like Serotransferrin in normal pregnancies vs. polyhydramnios, is changed regarding the protein spot pI, i.e., its level could depend on the protein modifications.
Individually, the characteristic proteins for AFP were separated in 2DE with a range of pI 4–7 and approximately 146 proteins were supplied for mass spectrometry analysis. Table 2 presents identified 53 proteins with high score and detailed specification. Furthermore, the images of the protein map images specific for AFP (pI 3–11 and pI 4–7) (Figure 2A(G2,G3)) were analyzed and protein spots in 2DE maps representing pI 3–11 and pI 4–7 were compared by computer assisted methods (Figure 2A(G2,G3)). Computer assisted analysis of protein spot groups’ (Figure 2B) demonstrates that some proteins like Ceruloplasmin (Figure 2B, No. 1), Alpha-1B-glycoprotein (Figure 2B, No. 8), Serotransferrin (Figure 2B, No. 9), Kininogen-1 (Figure 2B, No. 44), and others are spread in few spots with different pI when fractionated in pI 4–7. Different spots of the same protein could be associated with protein modifications. Column “Share, %” in Table 2 represents the distribution between the different points that coincide with different pI of the same protein. The changes in protein spots corresponding to different pI volumes could be valuable findings for prenatal diagnosis.
In AFP samples, we identified the higher expression of some proteins, the levels of which were higher compared to the proteome associated with normal pregnancy. The following are listed in Table 3. Their possible role for the prenatal diagnosis is discussed in the Discussion section.
Each identified protein was assigned to a certain group corresponding to protein function based on information from AgBase (www.agbase.msstate.edu, last accessed 13 September 2021) (Figure 3 and Figure 4). The majority of identified proteins of AFN/AFP separated in range pI 3–11 and pI 4–7 (presented in brackets) belong to immune response and inflammation proteins—29% (16%), cellular signaling and regulation proteins—19% (24%), transcription and DNA replicationproteins—14% (11%), pregnancy and embryo development proteins— 12% (23%), structural proteins—12% (4%), metabolic—2% (6%) and involved in molecular transport system—1% (11%).

4. Discussion

In the study, we examined protein maps characteristic for normal vs. polyhydramnios amniotic fluid. There were identified proteins, the protein levels of which increased in polyhydramnios pregnancy. The level of the number of proteins changed subject to their isoelectric points. This means that different modifications of the same protein could be important for pathological diagnosis of pregnancy. A higher concentration of proteins has been caused by pathology of polyhydramnios—non-immune hydrops fetalis (NIHF)—and it may happen due to various etiological conditions, in approximately one-third of cases, no cause could be found. Hydrops fetalis is found in about 1/2000 births [23]. One-third of hydropicfetuses are accidentally detected during prenatal ultrasound in the first or second trimester of gestation [24]. Etiologies of non-immune hydrops fetalis can be classified into groups: cardiovascular (17–35%), unknown (15–25%), lymphatic dysplasia (15.0%), chromosomal (7–16%), hematologic (4–12%), twin-twin transfusion (3–10%), infections (5–7%), thoracic (6%), syndromic (5.5%), skeletal dysplasias (3–4%), miscellaneous (3.6%), gastrointestinal (1.3%), inborn errors of metabolism (1–2%), urinary tract malformations (0.9%), and extra thoracic tumors (0.7%) [25]. Multiple cardiac lesions have been involved: the three significant subgroups are structural anomalies, vascular abnormalities, and arrhythmias. The most frequently found cardiac structural anomalies related with hydrops are atrioventricular septal defect, hypoplastic left and right heart, and isolated ventricular or atrial septal defects [23]. Evaluation of results from our study shows an increase in proteins associated with heart function and circulatory system. Results of analysis showed increased prothrombin and transthyretin relative amounts. Prothrombin as a glycoprotein occurring in blood plasma is a component of the blood-clotting mechanism. During pregnancy, alterations in the coagulation system that are seen to be adaptive to prevent hemorrhage at the time of delivery and normal pregnancy have been related with excessive maternal thrombin generation [26]. These cardiovascular proteins—prothrombin and serotransferrin—have been reported as increased in the maternal circulation in a few obstetrical syndromes as preterm labor [27,28], preeclampsia [29], and fetal growth restriction. Overall, it was demonstrated that, under oxidative stress conditions, increased phospholipase A2 activity would result in a growth of decomposition of arachidonic acid, which eventually leads to more production of prothrombin and serotransferrin [30,31]. Obstetric complications such as fetal growth, preeclampsia, rupture of membranes, restriction, preterm labor, and fetal demise is the clinical endpoint of different underlying mechanisms (i.e., infection, thrombosis, inflammation, endocrine disorder, immunologic rejection, genetic, and environmental reasons); thus, they may be considered as syndromes. Placental vascular pathology and higher thrombin generation were determined in all of these obstetrical syndromes [31,32]. A study by Karamessinis reported alterations at the post-translational modification level in alpha-2-HS glycoprotein (fetuin-A) protein in intrauterine growth restriction cases, and this glycoprotein is inextricably bound to fetal growth, cell replication, and osteogenesis [33]. It is known that transthyretin (TTR) is secreted by the liver, choroid plexus, and retinal cells, it is a homotetrameric protein which transports retinol and thyroxine (T4). The mechanism assisting in the development of hydrops in storage diseases may include obstruction of venous blood return due to organomegaly [34]. Over the past years, multiple research was conducted on TTR to resolve its participation in few amyloid diseases such as central nervous system amyloidosis (CNSA), senile systemic amyloidosis (SSA), and familial amyloid cardiomyopathy (FAC). SSA is caused by the aggregation of wild-type protein (WT-TTR), mainly in the heart, and more than 100 various point mutations are related with the other three TTR-related amyloidosis [35]. The certain pathophysiologic function of thrombin in AF still has to be identified because alterations happen despite the absence of coagulation, assuming that thrombin has other functions within the amniotic cavity that may be not associated with its task in the coagulation system [36]. Anemia provoked by hypersplenism or the decrease of erythropoietin bone marrow stem cells due to the infiltrating storage cells could be a trigger. Hypoproteinemia caused by liver dysfunction can also lead to hydrops [37,38].
As investigated, normal fetus blood plasma and hydropic fetuses show changes. Hypoalbuminemia was identified in six of the seven hydropic fetuses and in two of the non-hydropic fetuses. High albumin concentrations were also found in four hydropic fetuses, and the values of three were determined to be more than 50% of the corresponding plasma levels [39]. The findings of our study support these results.
Low weight protein clusterin (CLU) was identified in AFP (pI 3–7), which is called an enigmatic glycoprotein with apparent involvement in biological processes, and this protein was detected in diverse disease states intensifying neuronal death in hypoxia-ischemia [40]. An increased level of clusterin has been confirmed in pregnancies with pathologies in pregnancy associated with preeclampsia [41,42]. It was reported that clusterin may be the latest therapeutic target to modulate non-caspase-dependent neuronal death occurring due to acute brain injury [43]. Proteins: transthyretin (TTHY), APO-E, ceruloplasmin (CERU), α-1-microglobulin (AMBP), serum amyloid P-component (SAMP), afamin (AFAM), histidine-rich glycoprotein (HRG) and α-1-antitrypsin (A1AT), and clusterin were upregulated in AFP. All these proteins have tasks in fetal growth and development. Identified kinins are factors for the biological activity of the amniotic fluid on smooth muscle organs [44].
Ceruloplasmin was identified in an increased level in AFP; it is a copper-binding glycoprotein which has a crucial role in the metabolism and development of nervous tissue [44]. Copper participates in diverse biological reduction-oxidation processes, and is a significant cofactor of many redox enzymes. It may affect fetal lung development or pulmonary antioxidant defense. It participates in iron transport across the cell membrane and supplies Cu 2 + ions for the ascorbate-mediated deaminase degradation of heparan sulfate chains. As it is known, ceruloplasmin levels are reduced in Wilson disease, in which copper cannot be involved into ceruloplasmin in the liver due to defects in the copper-transporting ATPase 2. Serum ceruloplasmin is the major diagnostic criteria for Wilson disease [45,46]. The alteration in the degree of copper and ceruloplasmin oxidase activity in human amniotic fluid from 20 weeks’ gestation to term was detected. The protein content of amniotic fluid reduced towards term. Ceruloplasmin demonstrated a major rise during 20–38 weeks of gestation, with a later decrease after 38 weeks [47,48]. Anagnostopoulos and co-workers reported that ceruloplasmin, alpha-1-antitrypsin, and zinc-alpha-2-glycoprotein are upregulated in specimens from pregnancies with Klinefelter syndrome fetuses, and were downregulated against proteins identified in specimens from normal fetuses [49]. Oxidative stress happens when the rate of free radical production transcends the rate of elimination by the cellular defense mechanisms. As noted earlier, oxidative stress has been related to PTL and early delivery as well as preeclampsia, PPROM, and IUGR, and other multiple conditions and diseases in the preterm infant [50].
Protein alpha-1 acid glycoprotein and complement C3 are mostly associated with metabolism (34%) and immune response (18%) [51]. Alpha-1-antitrypsin is an inhibitor of elastase and trypsin. The physiological role is the protection of the lower respiratory tract against proteolytic destruction by leukocyte elastase (HLE). For plasma protease C1, activation of the C1 complex is subordinate to the C1-inhibitor. It creates a proteolytically inactive complex with the C1r or C1s proteases. This protein can perform a task in regulating significant physiological pathways, e.g., blood coagulation, fibrinolysis, complement activation, and the generation of kinins. Alpha 1-antichymotrypsin is also related to the pathogenesis of pathology, including Alzheimer’s disease, as it strengthens the formation of amyloid-fibrils during this disease [52]. In pregnancies complicated with anencephaly and spina bifida, no substantial difference was shown for alpha-1-antichymotrypsin [53]. Alfa-2-HS-glycoprotein, also known as fetuin A, is very important in the first half of pregnancy with other proteins and is related to metabolism [54]. Glycoprotein is mostly expressed in the liver and placenta. It also piles up in bones and teeth as a major fraction of non-collagenous bone proteins. Fetuin A also plays a positive role in insulin resistance and is related to the metabolic syndrome [55].
Complement component C9 in the membrane attack complex (MAC) has a crucial role in the innate and adaptive immune response being responsible for forming pores in the plasma membrane of target cells. C9 is the pore-forming subunit of the MAC. Identified protein lumican (LUM) regulates collagen fibril organization and circumferential growth and it is a small leucine-rich proteoglycan (SLRP). Chakravarti et al. has described lumican as one of the important extracellular components in interstitial collagenous matrices of the corneal stroma, skin, aorta, lung, bone, skeletal muscle, kidney, cartilage, and intervertebral discs [56]. LUM also affects the interaction of collagen fibrils with other compounds of the extracellular matrix, being involved in its maintenance. It was identified that it interacts with fibrillar collagen [57].
Insulin-like growth factor-binding protein participates in modulating the impact of the insulin-like growth factors I and II (IGF-I and II), which play significant roles in growth, development, metabolism, and apoptosis. In early pregnancy, the IGF family (IGF peptides, IGFBPs and IGFBP proteases) has great influence on implantation and trophoblast invasion. Abnormal trophoblast invasion in early pregnancy may promote the clinic pathological entities of impaired placentation which have effects on the feto-placental unit. Impaired placentation may occur clinically in later pregnancy as preeclampsia, placental insufficiency, and intrauterine growth restriction [58,59]. The quantity of insulin-like growth factor binding protein 1 in amniotic fluid at mid pregnancy is a reliable marker of fetal growth failure [60]. In the AFP sample, we identified protein afamin whose expression is increased in cerebrovascular endothelial cells, and it eases vitamin E transport/transfer across the blood–brain barrier in a proper cell culture model [61]. This suggests the potential function of afamin in the regulation of vitamin E uptake and transport at the blood–brain barrier.

5. Conclusions

We observed that, in amniotic fluid with polyhydramnios, substantially different levels of several proteins are characterized. We applied computational analysis methods for proteomic characterization of amniotic fluid that empower estimating the quantitative protein changes specific to normal and polyhydramnios pregnancies. Studies show that such proteins as serotransferrin, prothrombin, kininogen-I, alpha-1-antitrypsin, zinc-alpha-2-glycoprotein, haptoglobin, lumican, and insulin-binding protein 1 could demonstrate a possible association with the pathological state of pregnancies. To confirm the importance of these molecules for the diagnostic potential and prediction of clinical risk factors, further research is needed.

Author Contributions

Conceptualization, R.N.; methodology, G.T., R.N.; software, D.M., D.N.; validation, D.M., D.N.; investigation, S.B., G.T., N.K., D.M.; writing—original draft preparation, S.B., D.M.; writing—review and editing, R.N., D.M., D.N.; formal analysis, S.B., N.K., A.A., G.T., D.M.; data curation, N.K., A.A., R.N., D.N.; visualization, D.M., D.N., G.T.; supervision, R.N. All authors have read and agreed to the published version of the manuscript.

Funding

This research received no external funding.

Institutional Review Board Statement

The study was conducted in accordance with the Declaration of Helsinki, and approved by by the Ethics Committee of Biomedical Research of Vilnius District (No. 158200-18/7-1049-550, protocol No. P-3/2019, 5 November 2019).

Informed Consent Statement

Informed consent was obtained from all subjects involved in the study.

Data Availability Statement

Not applicable.

Acknowledgments

We thank to Ilona Zaikova for the excellent experimental assistance.

Conflicts of Interest

The authors declare no conflict of interest.

References

  1. Clapp, J.F., 3rd; Schmidt, S.; Paranjape, A.; Lopez, B. Maternal insulin-like growth factor-I levels (IGF-I) reflect placental mass and neonatal fat mass. Am. J. Obstet. Gynecol. 2004, 190, 730–736. [Google Scholar] [CrossRef] [PubMed]
  2. Angel, T.E.; Aryal, U.K.; Hengel, S.M.; Baker, E.S.; Kelly, R.T.; Robinson, E.W.; Smith, R.D. Mass spectrometry-based proteomics: Existing capabilities and future directions. Chem. Soc. Rev. 2012, 41, 3912–3928. [Google Scholar] [CrossRef] [PubMed]
  3. Kurdi, W. Non-immune fetal hydrops: Are we doing the appropriate tests each time? J. Prenat. Med. 2007, 1, 26. [Google Scholar] [PubMed]
  4. Henrich, W.; Heeger, J.; Schmider, A.; Dudenhausen, J. Complete spontaneous resolution of severe nonimmunological hydrops fetalis with unknown etiology in the second trimester—A case report. J. Perinat. Med. 2002, 30, 522–527. [Google Scholar] [CrossRef] [PubMed]
  5. Abbasi, N.; Ryan, G. Fetal primary pleural effusions: Prenatal diagnosis and management. Best Pract. Res. Clin. Obstet. Gynaecol. 2019, 58, 66–77. [Google Scholar] [CrossRef] [PubMed]
  6. Bellini, C.; Hennekam, R.C.; Fulcheri, E.; Rutigliani, M.; Morcaldi, G.; Boccardo, F.; Bonioli, E. Etiology of nonimmune hydrops fetalis: A systematic review. Am. J. Med. Genet. Part A 2009, 149, 844–851. [Google Scholar] [CrossRef] [PubMed]
  7. Kolialexi, A.; Mavrou, A.; Spyrou, G.; Tsangaris, G.T. Mass spectrometry-based proteomics in reproductive medicine. Mass Spectrom. Rev. 2008, 27, 624–634. [Google Scholar] [CrossRef]
  8. Okeke, T.; Ezenyeaku, C.; Ikeako, L. Recent Perspective of Amniotic Fluid Embolism: A Review Article. Br. J. Med. Med. Res. 2015, 8, 408–418. [Google Scholar] [CrossRef]
  9. Cho, C.K.J.; Shan, S.J.; Winsor, E.J.; Diamandis, E.P. Proteomics analysis of human amniotic fluid. Mol. Cell. Proteom. 2007, 6, 1406–1415. [Google Scholar] [CrossRef]
  10. Huang, W.; Gu, H.; Yuan, Z. Identifying biomarkers for prenatal diagnosis of neural tube defects based on “omics”. Clin. Genet. 2022, 101, 381–389. [Google Scholar] [CrossRef]
  11. Navakauskiene, R.; Baronaite, S.; Matuzevicius, D.; Zaikova, I.; Arlauskiene, A.; Navakauskas, D.; Treigyte, G. Identification and Characterization of Amniotic Fluid Proteins Incident to Normal, Preeclampsia and Polyhydramnios Pregnancies. Curr. Proteom. 2016, 13, 206–217. [Google Scholar] [CrossRef]
  12. Matuzevičius, D.; Žurauskas, E.; Navakauskienė, R.; Navakauskas, D. Improved proteomic characterization of human myocardium and heart conduction system by computational methods. Biologija 2008, 54, 283–289. [Google Scholar] [CrossRef]
  13. Navakauskienė, R.; Navakauskas, D.; Borutinskaitė, V.; Matuzevičius, D. Epigenetics and Proteomics of Leukemia—A Synergy of Experimental Biology and Computational Informatics; Springer: Cham, Switzerland, 2021; p. 406. [Google Scholar]
  14. Matuzevičius, D. Analysis of 2D Electrophoresis Gel Images Using Intelligent Techniques. Ph.D. Thesis, Vilnius Gediminas Technical University, Vilnius, Lithuania, 2010. [Google Scholar]
  15. Mateika, D.; Martavičius, R. Large image formation using Harris-Plessey corner detection algorithm. Elektron. Elektrotech. 2008, 5, 21–24. [Google Scholar]
  16. Bookstein, F.L. Principal warps: Thin-plate splines and the decomposition of deformations. IEEE Trans. Pattern Anal. Mach. Intell. 1989, 11, 567–585. [Google Scholar] [CrossRef]
  17. Lowe, D.G. Distinctive image features from scale-invariant keypoints. Int. J. Comput. Vis. 2004, 60, 91–110. [Google Scholar] [CrossRef]
  18. Johansson, B. Low Level Operations and Learning in Computer Vision. Ph.D. Thesis, Linköping University Electronic Press, Linköping, Sweden, 2004. [Google Scholar]
  19. Vincent, L.; Soille, P. Watersheds in digital spaces: An efficient algorithm based on immersion simulations. IEEE Trans. Pattern Anal. Mach. Intell. 1991, 13, 583–598. [Google Scholar] [CrossRef]
  20. Dowsey, A.W.; Dunn, M.J.; Yang, G.Z. The role of bioinformatics in two-dimensional gel electrophoresis. Proteom. Int. Ed. 2003, 3, 1567–1596. [Google Scholar] [CrossRef]
  21. Matuzevičius, D.; Serackis, A.; Navakauskas, D. Mathematical models of oversaturated protein spots. Elektron. Elektrotech. 2007, 73, 63–68. [Google Scholar]
  22. Kovesi, P. Image features from phase congruency. Videre J. Comput. Vis. Res. 1999, 1, 1–26. [Google Scholar]
  23. Yetgin, S.; Aytac, S.; Gurakan, F.; Yurdakok, M. Nonimmune hydrops fetalis in two cases of consanguineous parents and associated with hereditary spherocytosis and hemophagocytic hystiocytosis. J. Perinatol. 2007, 27, 252–254. [Google Scholar] [CrossRef]
  24. Yurdakök, M. Non-immune hydrops fetalis. J. Pediatr. Neonatal Individ. Med. (JPNIM) 2014, 3, e030214. [Google Scholar]
  25. Bellini, C.; Donarini, G.; Paladini, D.; Calevo, M.G.; Bellini, T.; Ramenghi, L.A.; Hennekam, R.C. Etiology of non-immune hydrops fetalis: An update. Am. J. Med. Genet. Part A 2015, 167, 1082–1088. [Google Scholar] [CrossRef]
  26. Chaiworapongsa, T.; Espinoza, J.; Yoshimatsu, J.; Kim, Y.; Bujold, E.; Edwin, S.; Yoon, B.; Romero, R. Activation of coagulation system in preterm labor and preterm premature rupture of membranes. J. Matern. -Fetal Neonatal Med. 2002, 11, 368–373. [Google Scholar] [CrossRef]
  27. Elovitz, M.A.; Baron, J.; Phillippe, M. The role of thrombin in preterm parturition. Am. J. Obstet. Gynecol. 2001, 185, 1059–1063. [Google Scholar] [CrossRef]
  28. Padda, J.; Khalid, K.; Mohan, A.; Pokhriyal, S.; Batra, N.; Hitawala, G.; Cooper, A.; Jean-Charles, G. Factor V Leiden G1691A and Prothrombin Gene G20210A Mutations on Pregnancy Outcome. Cureus 2021, 13, e17185. [Google Scholar] [CrossRef]
  29. Schjetlein, R.; Abdelnoor, M.; Haugen, G.; Husby, H.; Sandset, P.; Wisløff, F. Hemostatic variables as independent predictors for fetal growth retardation in preeclampsia. Acta Obstet. Gynecol. Scand. 1999, 78, 191–197. [Google Scholar]
  30. Hayashi, M.; Ohkura, T. Elevated levels of serum macrophage colony-stimulating factor in normotensive pregnancies complicated by intrauterine fetal growth restriction. Exp. Hematol. 2002, 30, 388–393. [Google Scholar] [CrossRef]
  31. Erez, O.; Othman, M.; Rabinovich, A.; Leron, E.; Gotsch, F.; Thachil, J. DIC in Pregnancy–Pathophysiology, Clinical Characteristics, Diagnostic Scores, and Treatments. J. Blood Med. 2022, 13, 21–44. [Google Scholar] [CrossRef]
  32. Mastrolia, S.A.; Mazor, M.; Loverro, G.; Klaitman, V.; Erez, O. Placental vascular pathology and increased thrombin generation as mechanisms of disease in obstetrical syndromes. PeerJ 2014, 2, e653. [Google Scholar] [CrossRef]
  33. Karamessinis, P.M.; Malamitsi-Puchner, A.; Boutsikou, T.; Makridakis, M.; Vougas, K.; Fountoulakis, M.; Vlahou, A.; Chrousos, G. Marked defects in the expression and glycosylation of α2-HS glycoprotein/fetuin-A in plasma from neonates with intrauterine growth restriction: Proteomics screening and potential clinical implications. Mol. Cell. Proteom. 2008, 7, 591–599. [Google Scholar] [CrossRef]
  34. Hutchison, A.A.; Drew, J.H.; Yu, V.; Williams, M.L.; Fortune, D.W.; Beischer, N.A. Nonimmunologic hydrops fetalis: A review of 61 cases. Obstet. Gynecol. 1982, 59, 347–352. [Google Scholar] [PubMed]
  35. Krishnaswamy, S. Exosite-driven substrate specificity and function in coagulation. J. Thromb. Haemost. 2005, 3, 54–67. [Google Scholar] [CrossRef] [PubMed]
  36. Erez, O.; Romer, R.; Vaisbuch, E.; Chaiworapongsa, T.; Kusanovic, J.P.; Mazaki-Tovi, S.; Gotsch, F.; Gomez, R.; Maymon, E.; Pacora, P.; et al. Changes in amniotic fluid concentration of thrombin–antithrombin III complexes in patients with preterm labor: Evidence of an increased thrombin generation. J. Matern. -Fetal Neonatal Med. 2009, 22, 971–982. [Google Scholar] [CrossRef] [PubMed]
  37. Staretz-Chacham, O.; Lang, T.C.; LaMarca, M.E.; Krasnewich, D.; Sidransky, E. Lysosomal storage disorders in the newborn. Pediatrics 2009, 123, 1191–1207. [Google Scholar] [CrossRef]
  38. Anderson, S. Congenital Nephrotic Syndrome of the Finnish Type in a Dominican Newborn: An Overview and Case Report. Neonatal Netw. 2022, 41, 83–88. [Google Scholar] [CrossRef]
  39. Nicolaides, K.; Warenski, J.; Rodeck, C. The relationship of fetal plasma protein concentration and hemoglobin level to the development of hydrops in rhesus isoimmunization. Am. J. Obstet. Gynecol. 1985, 152, 341–344. [Google Scholar] [CrossRef]
  40. Jones, S.E.; Jomary, C. Clusterin. Int. J. Biochem. Cell Biol. 2002, 34, 427–431. [Google Scholar] [CrossRef]
  41. Blumenstein, M.; McCowan, L.M.; Wu, S.; Cooper, G.J.; North, R.A. Plasma clusterin increased prior to small for gestational age (SGA) associated with preeclampsia and decreased prior to SGA in normotensive pregnancies. Reprod. Sci. 2012, 19, 650–657. [Google Scholar] [CrossRef]
  42. Zeng, S.; Pan, Y.; Liu, F.; Yin, J.; Jiang, M.; Long, Y.; Zhao, X.; Lash, G.E.; Yang, H. Role of clusterin in the regulation of trophoblast development and preeclampsia. Biochem. Biophys. Res. Commun. 2021, 583, 128–134. [Google Scholar] [CrossRef]
  43. Han, B.H.; DeMattos, R.B.; Dugan, L.L.; Kim-Han, J.S.; Brendza, R.P.; Fryer, J.D.; Kierson, M.; Cirrito, J.; Quick, K.; Harmony, J.A.; et al. Clusterin contributes to caspase-3–independent brain injury following neonatal hypoxia-ischemia. Nat. Med. 2001, 7, 338–343. [Google Scholar] [CrossRef]
  44. Choolani, M.; Narasimhan, K.; Kolla, V.; Hahn, S. Proteomic technologies for prenatal diagnostics: Advances and challenges ahead. Expert Rev. Proteom. 2009, 6, 87–101. [Google Scholar] [CrossRef]
  45. Mak, C.M.; Lam, C.W.; Tam, S. Diagnostic accuracy of serum ceruloplasmin in Wilson disease: Determination of sensitivity and specificity by ROC curve analysis among ATP7B-genotyped subjects. Clin. Chem. 2008, 54, 1356–1362. [Google Scholar] [CrossRef]
  46. Sanchez-Monteagudo, A.; Ripolles, E.; Berenguer, M.; Espinos, C. Wilson’s Disease: Facing the Challenge of Diagnosing a Rare Disease. Biomedicines 2021, 9, 1100. [Google Scholar] [CrossRef]
  47. Chan, W.Y.; Richichi, J.; Griesmann, G.E.; Cushing, W.; Kling, O.R.; Rennert, O.M. Copper and ceruloplasmin activity in human amniotic fluid. Am. J. Obstet. Gynecol. 1980, 138, 257–259. [Google Scholar] [CrossRef]
  48. Bellos, I.; Papantoniou, N.; Pergialiotis, V. Serum ceruloplasmin levels in preeclampsia: A meta-analysis. J. Matern. -Fetal Neonatal Med. 2018, 31, 2342–2348. [Google Scholar] [CrossRef]
  49. Anagnostopoulos, A.K.; Kolialexi, A.; Mavrou, A.; Vougas, K.; Papantoniou, N.; Antsaklis, A.; Kanavakis, E.; Fountoulakis, M.; Tsangaris, G.T. Proteomic analysis of amniotic fluid in pregnancies with Klinefelter syndrome foetuses. J. Proteom. 2010, 73, 943–950. [Google Scholar] [CrossRef]
  50. Knuppel, R.A.; Hassan, M.I.; McDermott, J.J.; Tucker, M.; Morrison, J.C. Oxidative stress and antioxidants: Preterm birth and preterm infants. In Preterm Birth—Mother and Child; InTech: Rijeka, Croatia, 2012; pp. 125–150. [Google Scholar]
  51. Hitti, J.; Lapidus, J.A.; Lu, X.; Reddy, A.P.; Jacob, T.; Dasari, S.; Eschenbach, D.A.; Gravett, M.G.; Nagalla, S.R. Noninvasive diagnosis of intraamniotic infection: Proteomic biomarkers in vaginal fluid. Am. J. Obstet. Gynecol. 2010, 203, 32-e1. [Google Scholar] [CrossRef]
  52. Kalsheker, N.A. α1-antichymotrypsin. Int. J. Biochem. Cell Biol. 1996, 28, 961–964. [Google Scholar] [CrossRef]
  53. Legge, M. Amniotic fluid fibrinolytic system in fetal neural tube defects. Prenat. Diagn. 1983, 3, 145–149. [Google Scholar] [CrossRef]
  54. Iliodromiti, S.; Vrachnis, N.; Samoli, E.; Iliodromiti, Z.; Pangalos, C.; Drakoulis, N.; Creatsas, G.; Botsis, D. Fetuin A concentration in the second trimester amniotic fluid of fetuses with trisomy 21 appears to be lower: Phenotypic considerations. Mediat. Inflamm. 2012, 2012, 4. [Google Scholar] [CrossRef]
  55. Jenkins, N.T.; McKenzie, J.A.; Hagberg, J.M.; Witkowski, S. Plasma fetuin-A concentrations in young and older high-and low-active men. Metabolism 2011, 60, 265–271. [Google Scholar] [CrossRef]
  56. Chakravarti, S.; Magnuson, T.; Lass, J.H.; Jepsen, K.J.; LaMantia, C.; Carroll, H. Lumican regulates collagen fibril assembly: Skin fragility and corneal opacity in the absence of lumican. J. Cell Biol. 1998, 141, 1277–1286. [Google Scholar] [CrossRef]
  57. Mavrou, A.; Anagnostopoulos, A.K.; Kolialexi, A.; Vougas, K.; Papantoniou, N.; Antsaklis, A.; Fountoulakis, M.; Tsangaris, G.T. Proteomic analysis of amniotic fluid in pregnancies with Turner syndrome fetuses. J. Proteome Res. 2008, 7, 1862–1866. [Google Scholar] [CrossRef]
  58. Jirka, M.; Blanickỳ, P.; Šarajer, J.; Zwinger, A.; Jirasek, J. Human serum Zn-α2-glycoprotein in amniotic fluid. Clin. Chim. Acta 1978, 85, 107–110. [Google Scholar] [CrossRef]
  59. Opichka, M.A.; Rappelt, M.W.; Gutterman, D.D.; Grobe, J.L.; McIntosh, J.J. Vascular Dysfunction in Preeclampsia. Cells 2021, 10, 3055. [Google Scholar] [CrossRef]
  60. Chevallier, B.; Lagarde, A.; Degrelle, H.; Belaisch-Allart, J.; Giraudet, P.; Gallet, J.P. Insulin-like growth factor binding protein 1 level in amniotic fluid: Correlation with birth weight. Neonatology 1998, 73, 404–406. [Google Scholar] [CrossRef]
  61. Kratzer, I.; Bernhart, E.; Wintersperger, A.; Hammer, A.; Waltl, S.; Malle, E.; Sperk, G.; Wietzorrek, G.; Dieplinger, H.; Sattler, W. Afamin is synthesized by cerebrovascular endothelial cells and mediates α-tocopherol transport across an in vitro model of the blood–brain barrier. J. Neurochem. 2009, 108, 707–718. [Google Scholar] [CrossRef]
Figure 1. Comparative analysis of 2DE proteome maps characteristic for normal and polyhydramnios pregnancies. The proteins were resolved by 2DE, pH range 3–11, and Excel Gel SDS, gradient 8–18%. 2DE images of proteins of amniotic fluid of normal pregnancy (AFN, G1; blue in G1 + G2 and amniotic fluid of polyhydramnios pregnancy (AFP, G2; orange in G1 + G2) were superposed and presented in G1 + G2. Arrows and numbers in the 2DE maps indicate the positions of proteins supplied to MALDI-TOF MS/MS and identified. Spot labels are the same as in Table 1. Molecular weight (Mw) markers are presented on the left. Representative images from one of three experiments showing similar results are shown.
Biomedicines 10 01821 g001
Figure 2. Comparative analysis of 2DE protein maps corresponding amniotic fluid of polyhydramnios pregnancy fractionated in different pI range. (A) proteins corresponding amniotic fluid of polyhydramnios pregnancy (AFP), fractionated in different pI range: pI 3–11 (G2, blue in G2 + G3) and pI 4–7 (G3, orange in G2 + G3) range and Excel Gel SDS, gradient 8–18%. Arrows and numbers in the 2DE maps indicate the positions of proteins supplied to MALDI-TOF MS/MS and identified. Spot labels for the proteins fractionated in the range pI 3–11 are the same as in Table 2. Spot labels for the proteins fractionated in the range pI 4–7 are the same as in Table 2. (B) Computational analysis of several protein groups is performed to evaluate their distribution in different pI value ranges. It shows that the same protein level with different pI changes because of modification level. In Table 2, the proteins’ spot distribution corresponding to the different modification level is presented (column— Share, %). Representative images from one of three experiments showing similar results are shown.
Biomedicines 10 01821 g002
Figure 3. Functions of proteins identified in normal vs. polyhydramnios pregnancies, proteins fractionated in the pI 3–11 range. Proteins were clustered according to their functions by using AgBase [2.00 v].
Biomedicines 10 01821 g003
Figure 4. Functions of proteins identified in normal vs. polyhydramnios pregnancies, proteins fractionated in the pI 4–7 range. Proteins were clustered according to their functions by using AgBase [2.00 v].
Biomedicines 10 01821 g004
Table 1. The summarized search results (by UniProt, Expasy) of proteins identified from 2DE gels representing protein maps of amniotic fluid of normal and polyhydramnios pregnancies fractionated in the pI 3–11 range. An increase in spot intensity yields a positive fold-change and a decrease accordingly a negative fold-change in AFN/AFP (marked as G1/G2). a) AC—accession number; b) Score—protein Score C.I. %; c) Match—Matching (sequence coverage, %); d) TP—Theoretical Peptides; e) DP—Digest Peptides; f) FC—Fold Change.
Nmb.AC  a ) EntryProtein Description/NameScore b ) Match c ) TP d ) DP e ) TheoreticalExperimentalFC f )
Mw, kDapIMw, kDapIG1/G2
1aP00450CERU_HUMANCeruloplasmin OS = Homo sapiens GN = CP PE = 1 SV = 11002010721122.1285.44155.475.00−1.57
1b 10012 13 137.484.93−2.11
2P01024CO3_HUMANComplement C3 OS = Homo sapiens GN = C3 PE = 1 SV = 299.951119621187.0306.02138.405.40−1.05
3aP01024CO3_HUMANComplement C3 OS = Homo sapiens GN = C3 PE = 1 SV = 21001519629187.0306.0277.146.511.29
3b 98.6614 28 76.936.381.05
4Q14624ITIH4_HUMANInter-alpha-trypsin inhibitor heavy chain H4 OS = Homo sapiens GN = ITIH4 PE = 1 SV = 4100189818103.2936.51132.414.83−5.11
5P05155IC1_HUMANPlasma protease C1 inhibitor OS = Homo sapiens GN = SERPING1 PE = 1 SV = 2100744355.1196.09110.984.16−2.93
6aP06396GELS_HUMANGelsolin OS = Homo sapiens GN = GSN PE = 1 SV = 110013881185.6445.9100.955.491.08
6b 94.552 2 100.685.41−1.12
6c 1008 7 100.475.351.12
7P00734THRB_HUMANProthrombin OS = Homo sapiens GN = F2 PE = 1 SV = 299.99574469.9925.6489.004.80−12.51
8aP04217A1BG_HUMANAlpha-1B-glycoprotein OS = Homo sapiens GN = A1BG PE = 1 SV = 41001645754.2205.5679.914.95−2.36
8b 99.8911 5 92.194.93−4.39
9aP02787TRFE_HUMANSerotransferrin OS = Homo sapiens GN = TF PE = 1 SV = 310022861977.0146.8185.763.89−3.49
9b 10013 11 85.994.00−1.85
9c 99.9917 15 86.264.13−2.53
9d 99.9920 17 85.524.42−3.20
9e 10019 16 86.635.882.28
9f 10023 20 85.035.943.04
9g 10014 12 82.636.012.41
9h 10015 13 82.256.111.59
9i 10023 20 83.996.251.11
9j 1005 4 84.306.39−1.01
9k 10019 16 84.567.032.99
10aP02768ALBU_HUMANSerum albumin OS = Homo sapiens GN = ALB PE = 1 SV = 210024882169.3215.9270.295.595.45
10b 10019 17 75.285.38−1.37
11P02768ALBU_HUMANSerum albumin OS = Homo sapiens GN = ALB PE = 1 SV = 210015881369.3215.9264.256.261.09
12P02748CO9_HUMANComplement component C9 OS = Homo sapiens GN = C9 PE = 1 SV = 210017701263.1335.4372.204.94−3.02
13P01876IGHA1_HUMANIg alpha-1 chain C region OS = Homo sapiens GN = IGHA1 PE = 1 SV = 299.962326637.6316.0864.705.26−1.32
14P01011AACT_HUMANAlpha-1-antichymotrypsin OS = Homo sapiens GN = SERPINA3 PE = 1 SV = 210026431147.6215.3363.684.43−2.11
15aP01009A1AT_HUMANAlpha-1-antitrypsin OS = Homo sapiens GN = SERPINA1 PE = 1 SV = 310046411946.7075.3765.214.97−2.11
15b 10054 22 68.914.74−4.52
15c 10017 7 55.644.82−3.24
15d 94.6729 12 59.765.882.12
16P01009A1AT_HUMANAlpha-1-antitrypsin OS = Homo sapiens GN = SERPINA1 PE = 1 SV = 310039411646.7075.37139.434.82−5.12
17P02765FETUA_HUMANAlpha-2-HS-glycoprotein OS = Homo sapiens GN = AHSG PE = 1 SV = 194.422129639.3005.4354.464.47−2.18
18aP01859IGHG2_HUMANIg gamma-2 chain C region OS = Homo sapiens GN = IGHG2 PE = 1 SV = 299.491932635.8787.6654.116.122.05
18b 99.3116 5 53.516.221.45
18c 99.4919 6 53.386.301.19
19P01860IGHG3_HUMANIg gamma-3 chain C region OS = Homo sapiens GN = IGHG3 PE = 1 SV = 299.5340141.2608.2352.996.67−1.08
20aP51884LUM_HUMANLumican OS = Homo sapiens GN = LUM PE = 1 SV = 21002335838.4056.1650.275.26−1.80
20b 10017 6 50.645.16−2.26
21P02763A1AG1_HUMANAlpha-1-acid glycoprotein 1 OS = Homo sapiens GN = ORM1 PE = 1 SV = 11001323323.4974.9346.024.10−1.39
22aP25311ZA2G_HUMANZinc-alpha-2-glycoprotein OS = Homo sapiens GN = AZGP1 PE = 1 SV = 210041341434.2375.7141.514.68−4.38
22b 98.8932 11 39.714.79−4.48
23P00738HPT_HUMANHaptoglobin OS = Homo sapiens GN = HP PE = 1 SV = 145.471845845.1776.1339.414.86−3.54
24aP01857IGHG1_HUMANIg gamma-1 chain C region OS = Homo sapiens GN = IGHG1 PE = 1 SV = 199.981834636.0838.4637.546.671.86
24b 34.459 3 37.016.80−1.63
25aP01857IGHG1_HUMANIg gamma-1 chain C region OS = Homo sapiens GN = IGHG1 PE = 1 SV = 11002434836.0838.4653.656.931.14
25b 10021 7 53.237.30−1.13
26P0C0L5CO4B_HUMANComplement C4-B OS = Homo sapiens GN = C4B PE = 1 SV = 299.36618712192.6316.8929.706.291.25
27P08833IBP1_HUMANInsulin-like growth factor-binding protein 1 OS = Homo sapiens GN = IGFBP1 PE = 1 SV = 199.972421527.8855.1128.944.80−3.41
28P02760AMBP_HUMANProtein AMBP OS = Homo sapiens GN = AMBP PE = 1 SV = 1100838338.9745.9528.514.89−1.41
29A0M8Q6LAC7_HUMANIg lambda-7 chain C region OS = Homo sapiens GN = IGLC7 PE = 1 SV = 299.452512311.2968.4925.216.671.07
30aP01834IGKC_HUMANIg kappa chain C region OS = Homo sapiens GN = IGKC PE = 1 SV = 154.82711311.6025.5823.895.773.89
30b 54.6527 3 23.476.032.58
30c 96.4818 2 23.326.181.71
30d 99.6627 3 23.306.561.27
30e 99.9318 2 23.436.811.33
31P01622KV304_HUMANIg kappa chain V-III region Ti OS = Homo sapiens PE = 1 SV = 154.652010211.7818.7223.397.02−1.38
32P98160PGBM_HUMANBasement membrane-specific heparan sulfate proteoglycan core protein OS = Homo sapiens GN = HSPG2 PE = 1 SV = 410023298468.5326.0620.255.37−2.76
33aP02766TTHY_HUMANTransthyretin OS = Homo sapiens GN = TTR PE = 1 SV = 11002114315.8775.5214.105.21−2.08
33b 47.636 5 14.225.00−2.48
34aP02766TTHY_HUMANTransthyretin OS = Homo sapiens GN = TTR PE = 1 SV = 11005714815.8775.5232.995.24−1.82
34b 43.336 5 31.485.01−2.61
Table 2. The summarized search results (by UniProt, Expasy) of proteins identified from 2DE gels representing protein maps of amniotic fluid of polyhydramnios pregnancy fractionated in pI 3–11 and pI 4–7 range. a) AC—accession number; b) Score—protein Score C.I. %; c) Match—Matching (sequence coverage, %); d) TP—Theoretical Peptides; e) DP—Digest Peptides; f) FC—Fold Change.
Nmb.AC  a ) EntryProtein Description/NameScore b ) Match c ) TP d ) DP e ) TheoreticalExperimentalFC f )
Mw, kDapIMw, kDapIG1/G2
1AP00450CERU_HUMANCeruloplasmin OS = Homo sapiens GN = CP PE = 1 SV = 110071076122.1285.44125.4135.1113.8
1B 38.7613 11 124.3945.215.9
1C 1007 6 160.4385.2270.3
8AP04217A1BG_HUMANAlpha-1B-glycoprotein OS = Homo sapiens GN = A1BG PE = 1 SV = 495.32045754.2205.5678.9135.130.7
8B 10031 11 73.6125.1923.6
8C 91.3520 8 73.4605.2245.7
9AP02787TRFE_HUMANSerotransferrin OS = Homo sapiens GN = TF PE = 1 SV = 310024861777.0146.8182.4604.7227.6
9B 99.9921 16 82.6174.855.0
9C 99.9917 13 82.3094.977.2
9D 10020 13 82.4165.0413.1
9E 92.4615 11 81.0326.112.3
9F 10016 12 87.6916.335.1
9G 10023 17 86.7036.377.7
9H 10025 17 86.9956.467.5
9I 10024 16 87.6406.516.4
9J 99.9922 16 88.0036.68.0
10AP02768ALBU_HUMANSerum albumin OS = Homo sapiens GN = ALB PE = 1 SV = 210026881769.3215.9268.4064.6382.4
10B 99.8115 10 66.9825.834.6
10C 99.7519 13 66.9035.878.3
10D 97.6124 14 66.7835.964.7
12P02748CO9_HUMANComplement component C9 OS = Homo sapiens GN = C9 PE = 1 SV = 299.6421701263.1335.4367.9435.18
14AP01011AACT_HUMANAlpha-1-antichymotrypsin OS = Homo sapiens GN = SERPINA3 PE = 1 SV = 299.9936431247.6215.3363.3914.4228.4
14B 10037 13 64.1304.421.1
14C 10040 14 64.9804.3731.8
14D 10036 12 65.1034.3218.7
15AP01009A1AT_HUMANAlpha-1-antitrypsin OS = Homo sapiens GN = SERPINA1 PE = 1 SV = 395.4625411246.7075.3752.1674.812.8
15B 10036 15 52.3404.95.3
15C 99.4834 13 51.9424.981.9
15D 10043 20 55.5945.1216.9
15E 10043 18 56.4105.0610.0
15F 10016 8 57.4185.0416.4
15G 10045 16 58.7085.0219.8
15H 10051 21 57.6944.9910.5
15I 10053 22 58.7464.938.3
15J 10038 15 54.3404.878.0
16AP01009A1AT_HUMANAlpha-1-antitrypsin OS = Homo sapiens GN = SERPINA1 PE = 1 SV = 399.9935411546.7075.37125.7794.9865.1
16B 77.76364114 124.9435.0534.9
17AP02765FETUA_HUMANAlpha-2-HS-glycoprotein OS = Homo sapiens GN = AHSG PE = 1 SV = 199.41529439.3005.4357.1324.3128.2
17B 99.9913 3 57.9424.3919.9
17C 98.9414 4 57.1364.4318.9
17D 99.3315 4 57.4614.5115.8
17E 10015 4 56.9844.5817.2
18P01859IGHG2_HUMANIg gamma-2 chain C region OS = Homo sapiens GN = IGHG2 PE = 1 SV = 299.861432535.8787.66246.0316.62
20P51884LUM_HUMANLumican OS = Homo sapiens GN = LUM PE = 1 SV = 299.991535638.4056.1651.2344.69
21P02763A1AG1_HUMANAlpha-1-acid glycoprotein 1 OS = Homo sapiens GN = ORM1 PE = 1 SV = 197.21723423.4974.9348.1134.16
22AP25311ZA2G_HUMANZinc-alpha-2-glycoprotein OS = Homo sapiens GN = AZGP1 PE = 1 SV = 210035341234.2375.7142.8664.9240.5
22B 99.9926 9 42.7455.0259.5
23AP00738HPT_HUMANHaptoglobin OS = Homo sapiens GN = HP PE = 1 SV = 195.861845845.1776.1344.9884.9768.2
23B 95.8618458 43.9465.1131.8
24AP01857IGHG1_HUMANIg gamma-1 chain C region OS = Homo sapiens GN = IGHG1 PE = 1 SV = 11001234336.0838.4658.1646.8233.7
24B 10041 10 57.9426.7566.3
27AP08833IBP1_HUMANInsulin-like growth factor-binding protein 1 OS = Homo sapiens GN = IGFBP1 PE = 1 SV = 175.32921627.8855.1131.0245.0755.4
27B 24.7319 4 30.4605.344.6
28AP02760AMBP_HUMANProtein AMBP OS = Homo sapiens GN = AMBP PE = 1 SV = 198.5838338.9745.9530.6484.922.4
28B 98.0611 4 30.7125.0246.0
28C 10021 8 29.8435.1731.5
30AP01834IGKC_HUMANIg kappa chain C region OS = Homo sapiens GN = IGKC PE = 1 SV = 176.741811211.6025.5824.1065.5918.3
30B 92.8118 2 25.0135.96.9
30C 73.445 5 25.6476.017.1
30D 99.9736 4 25.6876.328.2
30E 95.9636 4 25.9466.494.5
30F 54.827 3 26.7686.724.8
30G 85.9818 2 26.4166.930.3
32AP98160PGBM_HUMANBasement membrane-specific heparan sulfate proteoglycan core protein OS = Homo sapiens GN = HSPG2 PE = 1 SV = 497.9333299468.5326.0621.0355.5957.8
32B 1005 15 21.5465.8242.2
33AP02766TTHY_HUMANTransthyretin OS = Homo sapiens GN = TTR PE = 1 SV = 11003614515.8775.5213.6455.3851.0
33B 10050 7 13.6815.6849.0
34P02766TTHY_HUMANTransthyretin OS = Homo sapiens GN = TTR PE = 1 SV = 11003614515.8775.5234.1005.63
35P02751FINC_HUMANFibronectin OS = Homo sapiens GN = FN1 PE = 1 SV = 434.381620428262.4605.46281.6405.43
36P00450CERU_HUMANCeruloplasmin OS = Homo sapiens GN = CP PE = 1 SV = 198.81910716122.1285.44301.3945.17
37AP02787TRFE_HUMANSerotransferrin OS = Homo sapiens GN = TF PE = 1 SV = 399.9517861277.0146.81282.9426.3135.9
37B 99.9517 12 279.4806.3832.5
37C 99.9917 7 280.3426.4431.5
38P02768ALBU_HUMANSerum albumin OS = Homo sapiens GN = ALB PE = 1 SV = 289.8324881469.3215.92250.9925.88
39AP01008ANT3_HUMANAntithrombin-III OS = Homo sapiens GN = SERPINC1 PE = 1 SV = 190.2933601352.5696.3258.7615.4318.5
39B 10031 12 60.4635.3813.7
39C 10038 16 59.4655.3467.8
40P01008ANT3_HUMANAntithrombin-III OS = Homo sapiens GN = SERPINC1 PE = 1 SV = 110036601752.5696.32246.1085.18
41P43652AFAM_HUMANAfamin OS = Homo sapiens GN = AFM PE = 1 SV = 190.0722761469.0245.6495.4055.08
42P01009A1AT_HUMANAlpha-1-antitrypsin OS = Homo sapiens GN = SERPINA1 PE = 1 SV = 31001741746.7075.37232.6915.03
43AP02790HEMO_HUMANHemopexin OS = Homo sapiens GN = HPX PE = 1 SV = 210024461051.6436.5568.4035.3147.2
43B 98.1916 6 69.7305.5252.8
44AP01042KNG1_HUMANKininogen-1 OS = Homo sapiens GN = KNG1 PE = 1 SV = 210015731071.9126.3460.4184.6224.2
44B 10016 9 61.4704.5728.5
44C 10013 8 63.0114.5136.8
44D 1009 6 59.1374.6410.5
45P02749APOH_HUMANBeta-2-glycoprotein 1 OS = Homo sapiens GN = APOH PE = 1 SV = 319.26841338.2738.3460.1346.33
46P01019ANGT_HUMANAngiotensinogen OS = Homo sapiens GN = AGT PE = 1 SV = 171.352239753.1215.8755.9935.37
47AP02750A2GL_HUMANLeucine-rich alpha-2-glycoprotein OS = Homo sapiens GN = LRG1 PE = 1 SV = 299.851332438.1546.4550.6404.4156.3
47B 99.8513 4 48.9404.5243.7
48P63261ACTG_HUMANActin. cytoplasmic 2 OS = Homo sapiens GN = ACTG1 PE = 1 SV = 181.071738541.7665.3144.0975.32
49P10909CLUS_HUMANClusterin OS = Homo sapiens GN = CLU PE = 1 SV = 176.74759452.4615.8937.0614.78
50P02452CO1A1_HUMANCollagen alpha-1(I) chain OS = Homo sapiens GN = COL1A1 PE = 1 SV = 599.731294138.8575.632.1065.25
51P08123CO1A2_HUMANCollagen alpha-2(I) chain OS = Homo sapiens GN = COL1A2 PE = 1 SV = 799.9851226129.2359.0829.5146.02
52P18136KV313_HUMANIg kappa chain V-III region HIC OS = Homo sapiens PE = 2 SV = 291.752010214.0806.1826.5436.57
53P02753RET4_HUMANRetinol-binding protein 4 OS = Homo sapiens GN = RBP4 PE = 1 SV = 349.112227622.9955.7621.8425.37
Table 3. Identified AFP proteins—those expressions are higher in comparison to proteome associated with normal pregnancy in 2DE gels with pI 3–11 ranges (right panel) and AFP proteins, the spots number of which (proportionate to modification) in AFP pI 4–7 differ in comparison to fractionated in pI 3–11 range (left panel).
Proteins Corresponding Different Spots
in AFP (pI 4–7)
Proteins with Higher Expression Level
in AFP (pI 3–11)
SerotransferrinProthrombin
Kininogen-1Alpha-1-antitrypsin
Alpha-antichymotrypsinInter-alpha-trypsin inhibitor heavy chain H4
Insulin-like growth factor-binding protein 1Ig kappa chain C region
Zinc-alpha-2-glycoproteinZinc-alpha-2-glycoprotein
Protein AMBPAlpha-1B-glycoprotein
CeruloplasminSerotransferrin
TransthyretinInsulin-like growth factor-binding protein 1
HaptoglobinComplement component C9
Alpha-1-antitrypsinPlasma protease C1 inhibitor
KininogenProtein AMBP
Antithrombin-IIITransthyretin
Alpha-1B-glycoprotein
Ceruloplasmin
Alpha-1-antichymotrypsin
Basement membrane-specific heparan sulfate proteoglycan core protein Alpha-1B-glycoprotein
Publisher’s Note: MDPI stays neutral with regard to jurisdictional claims in published maps and institutional affiliations.

