
SARS-CoV-2 mRNA Vaccine-Induced Cellular and Humoral Immunity in Hemodialysis Patients

 , , ,
, , ,
Abstract
:1. Introduction
2. Materials and Methods
2.1. Patients
- Obtaining written consent for study enrollment;
- Age > 18 years;
- Consent to vaccination;
- Vaccination with one of the available mRNA vaccines, with two doses administered at least 21 days apart;
- HD treatment for at least 1 month.
- Refusal to participate in the study;
- Incomplete vaccination—less than two doses;
- Interval between two doses of vaccination greater than 60 days.
2.2. Methods
2.2.1. Humoral Response
2.2.2. Cellular Response
2.2.3. Statistical Analysis
3. Results
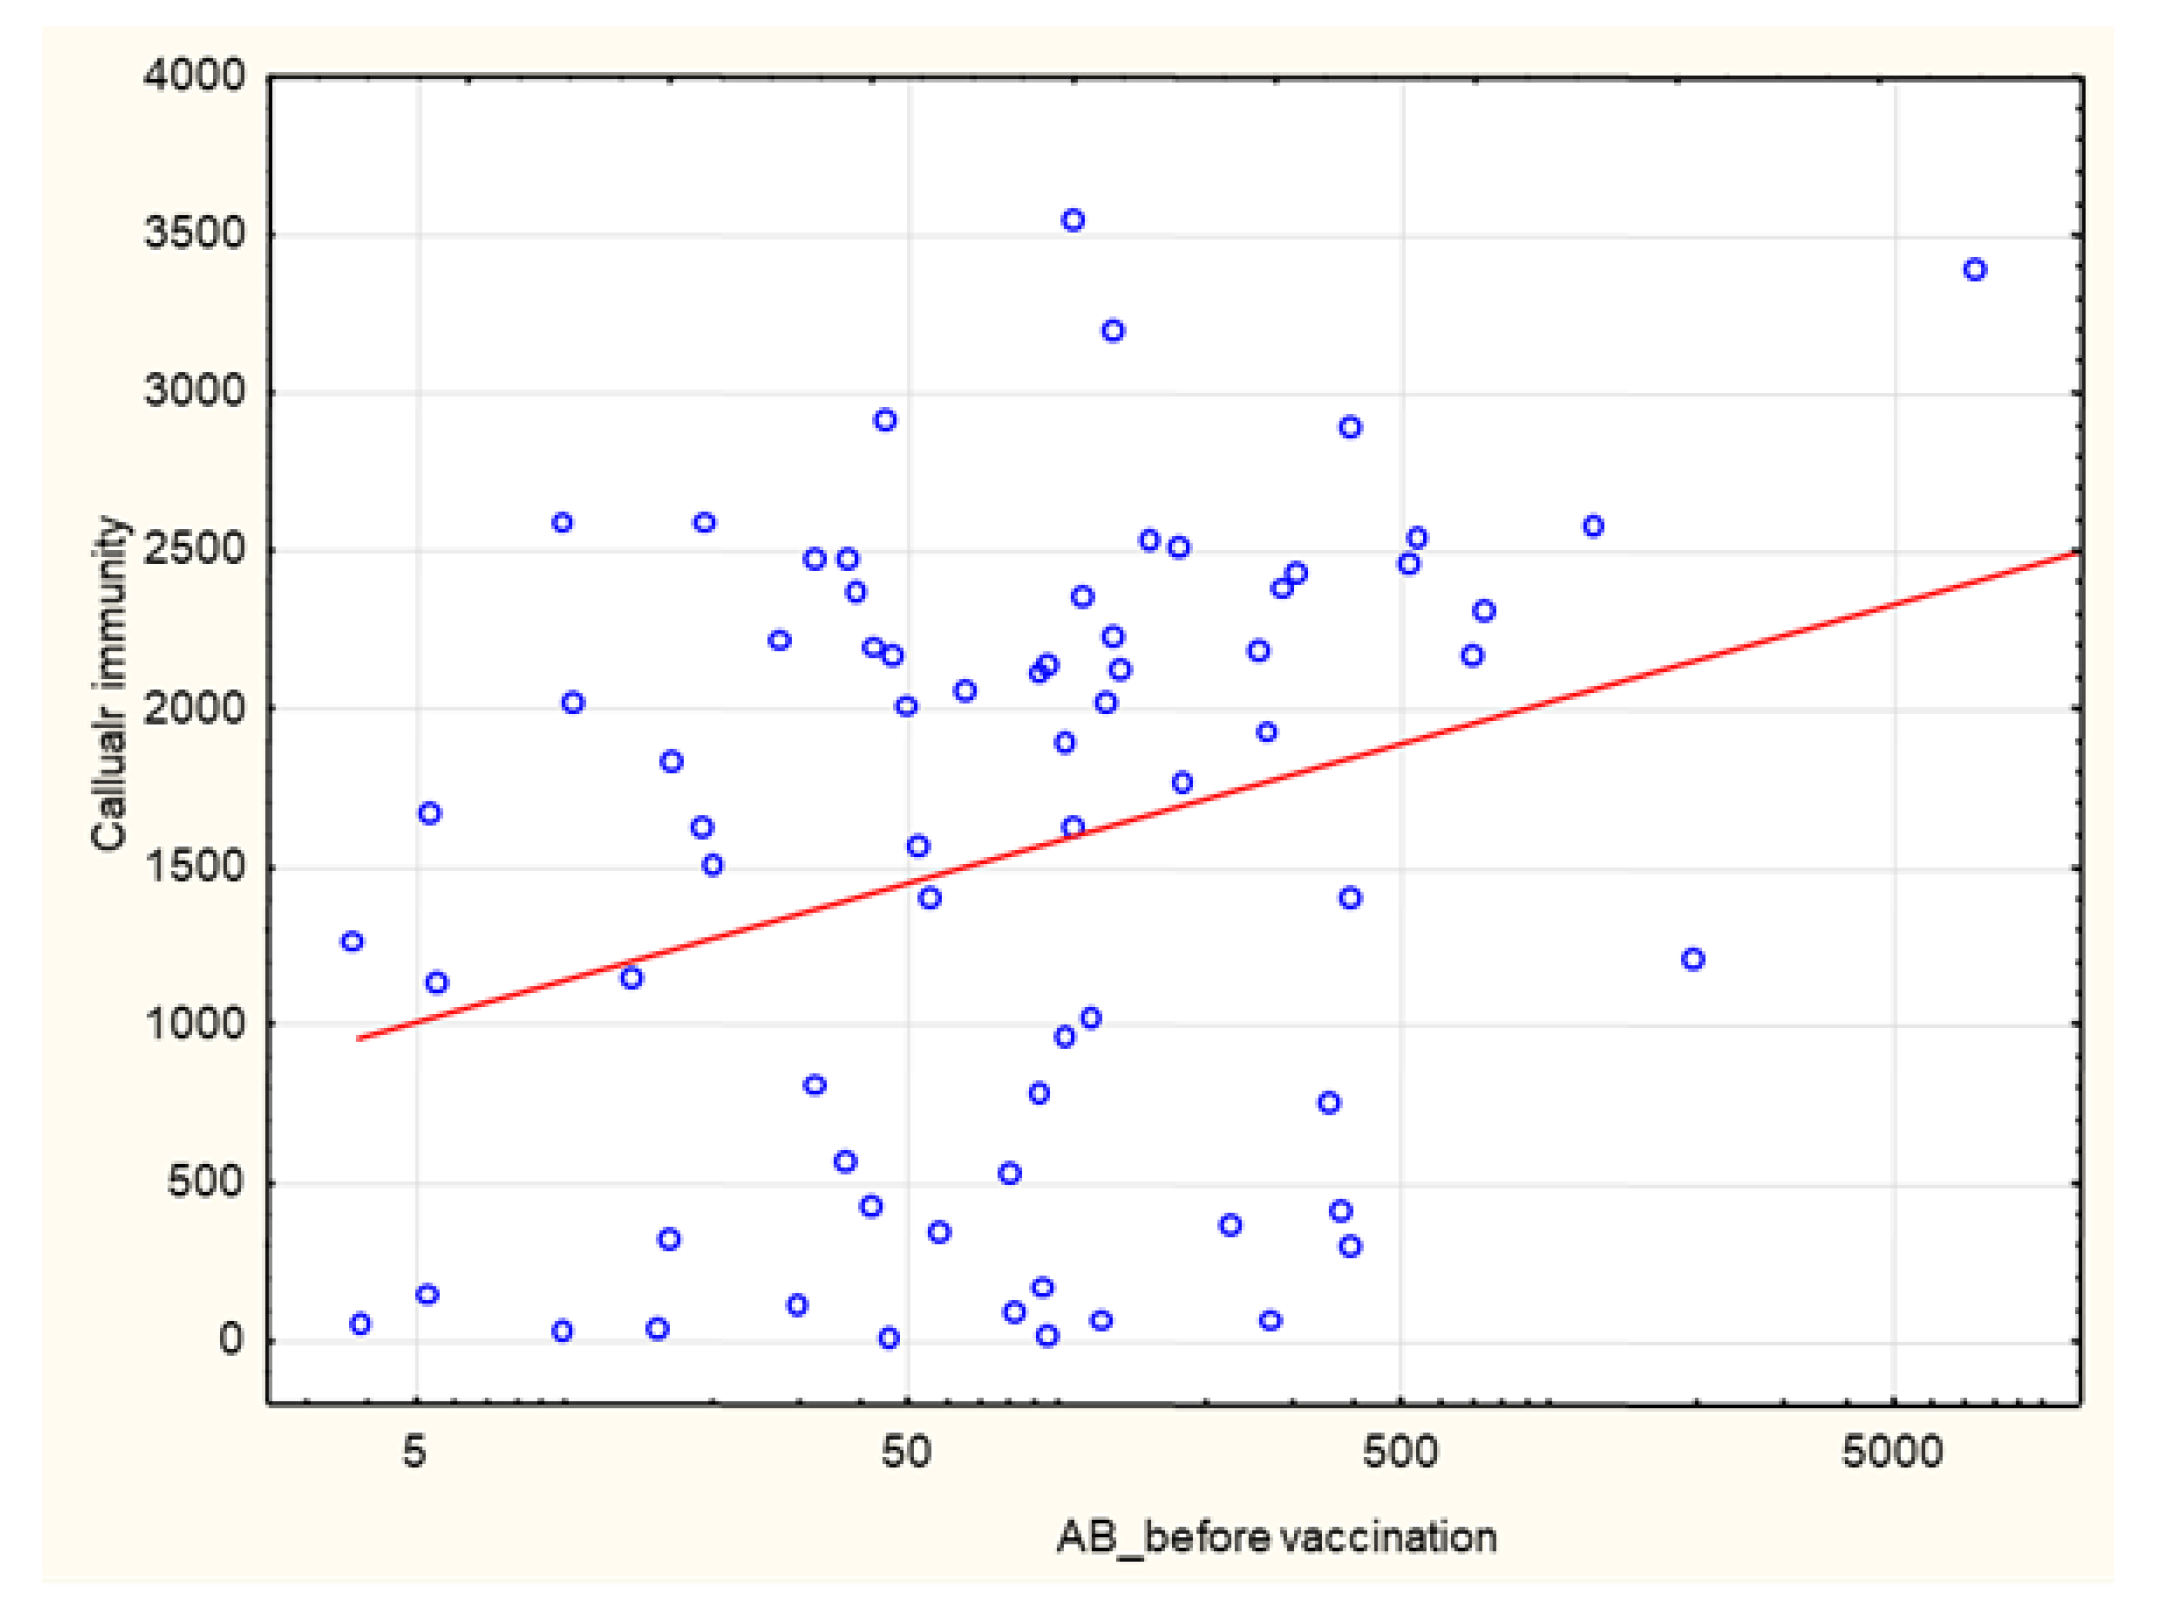
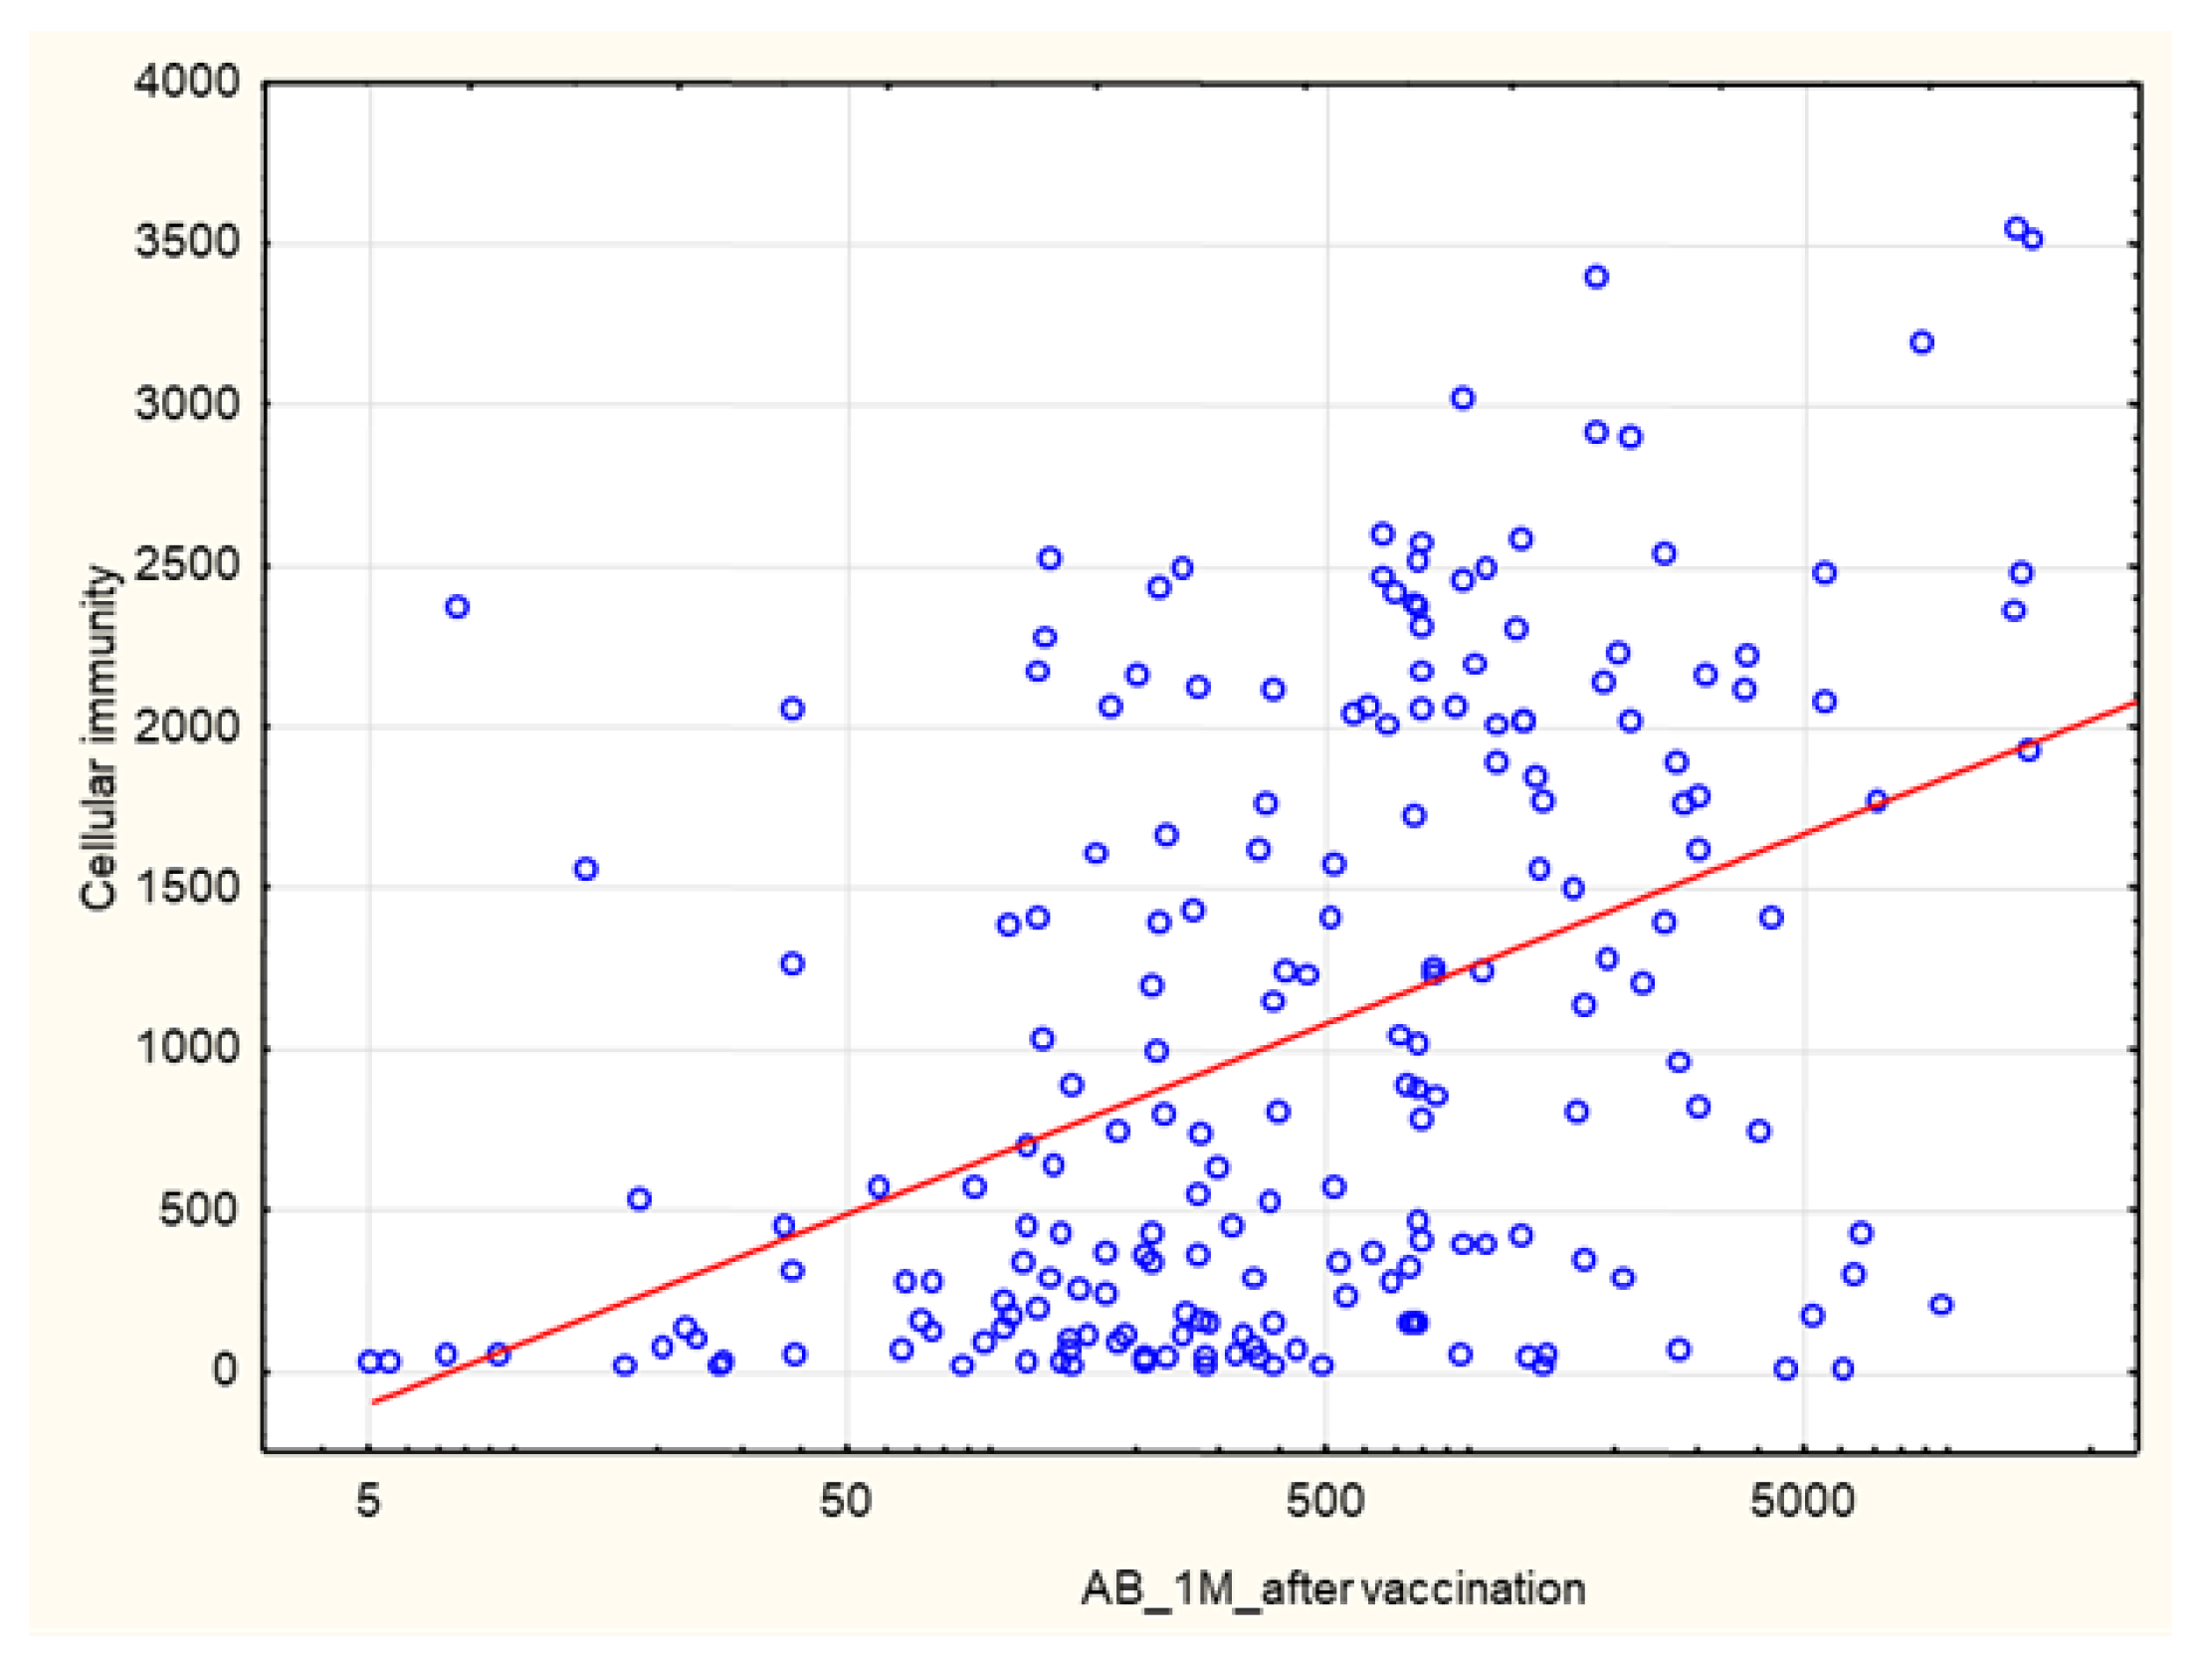
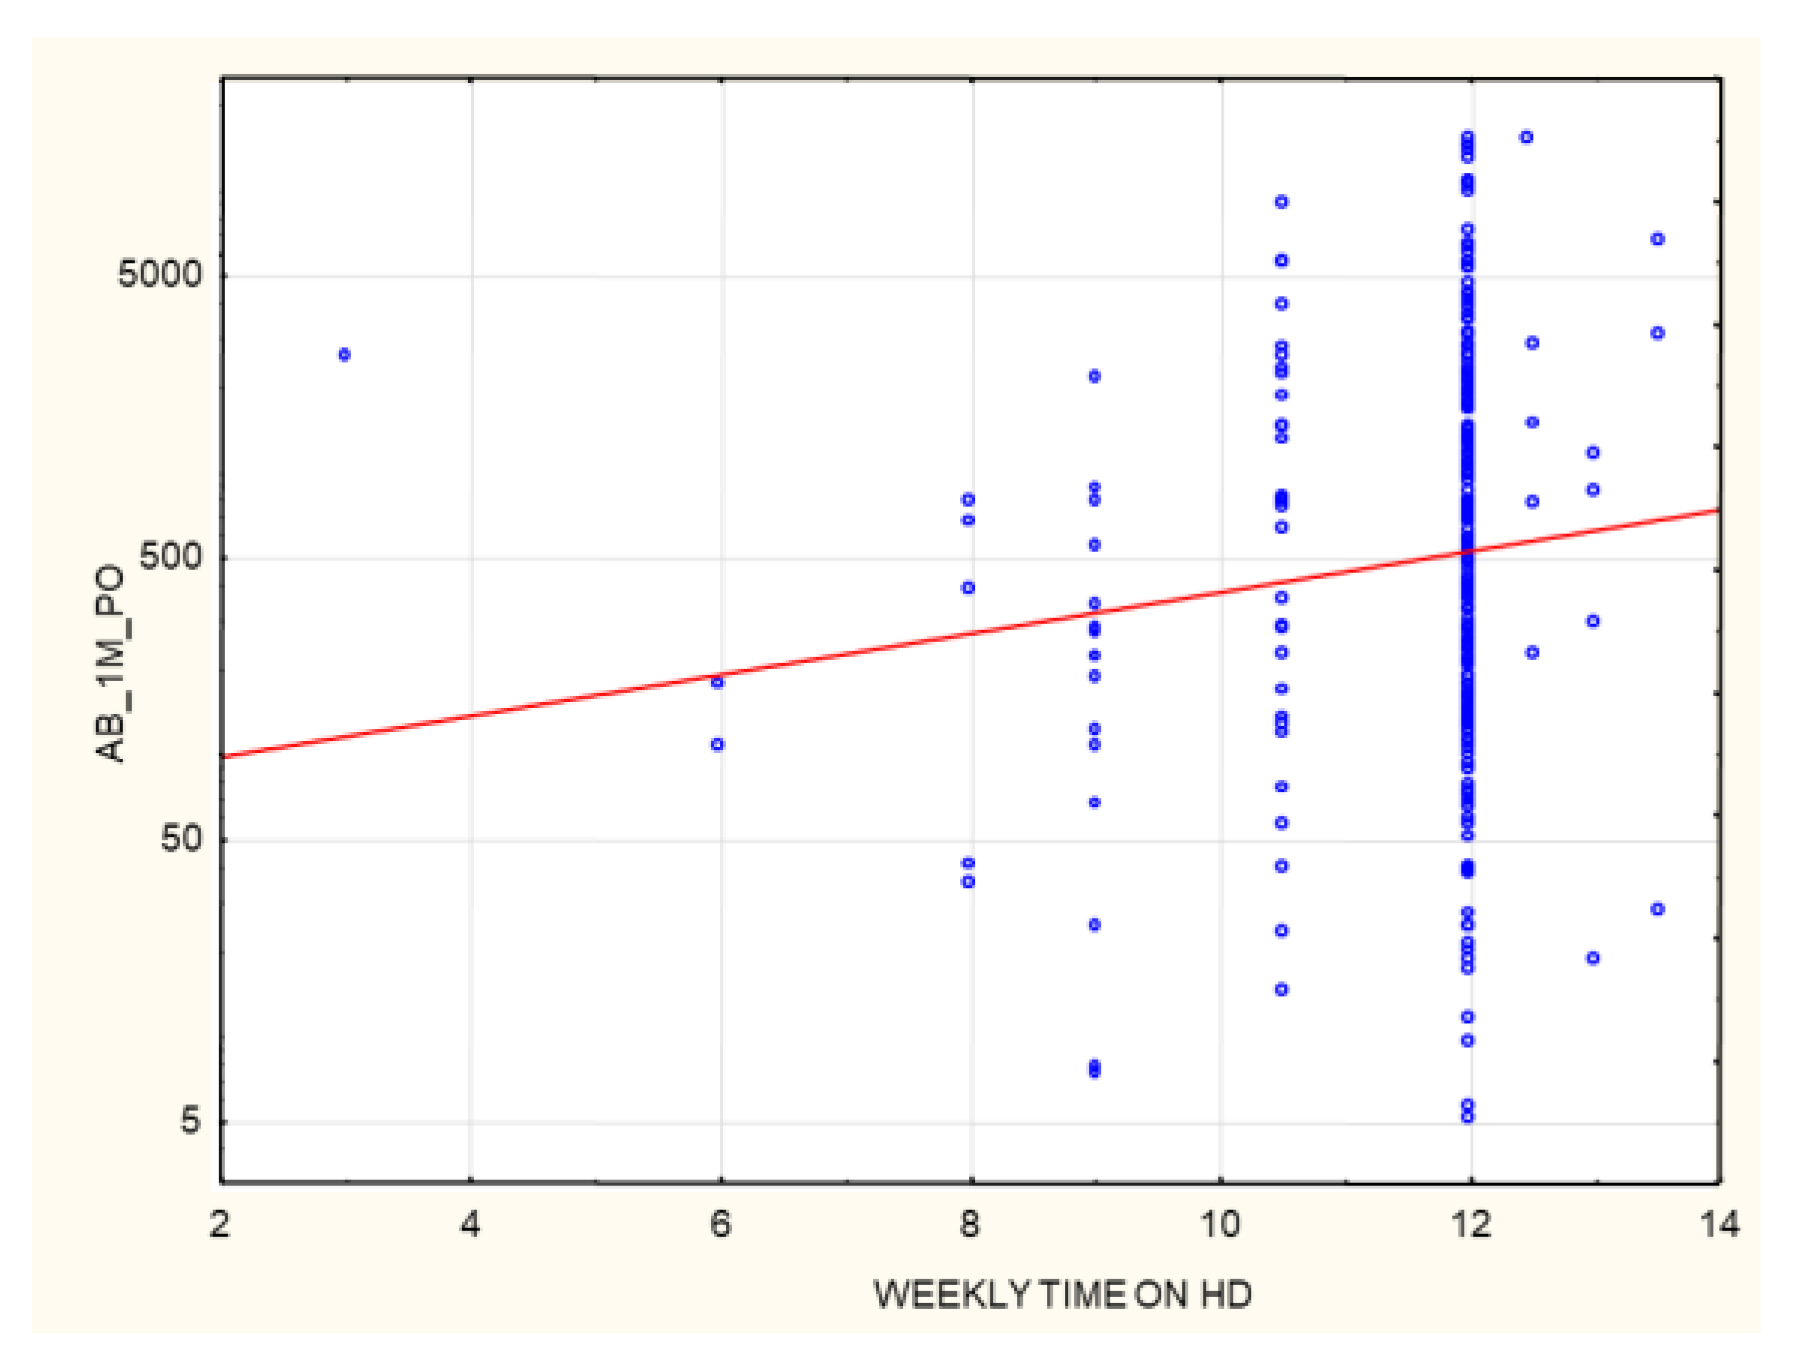
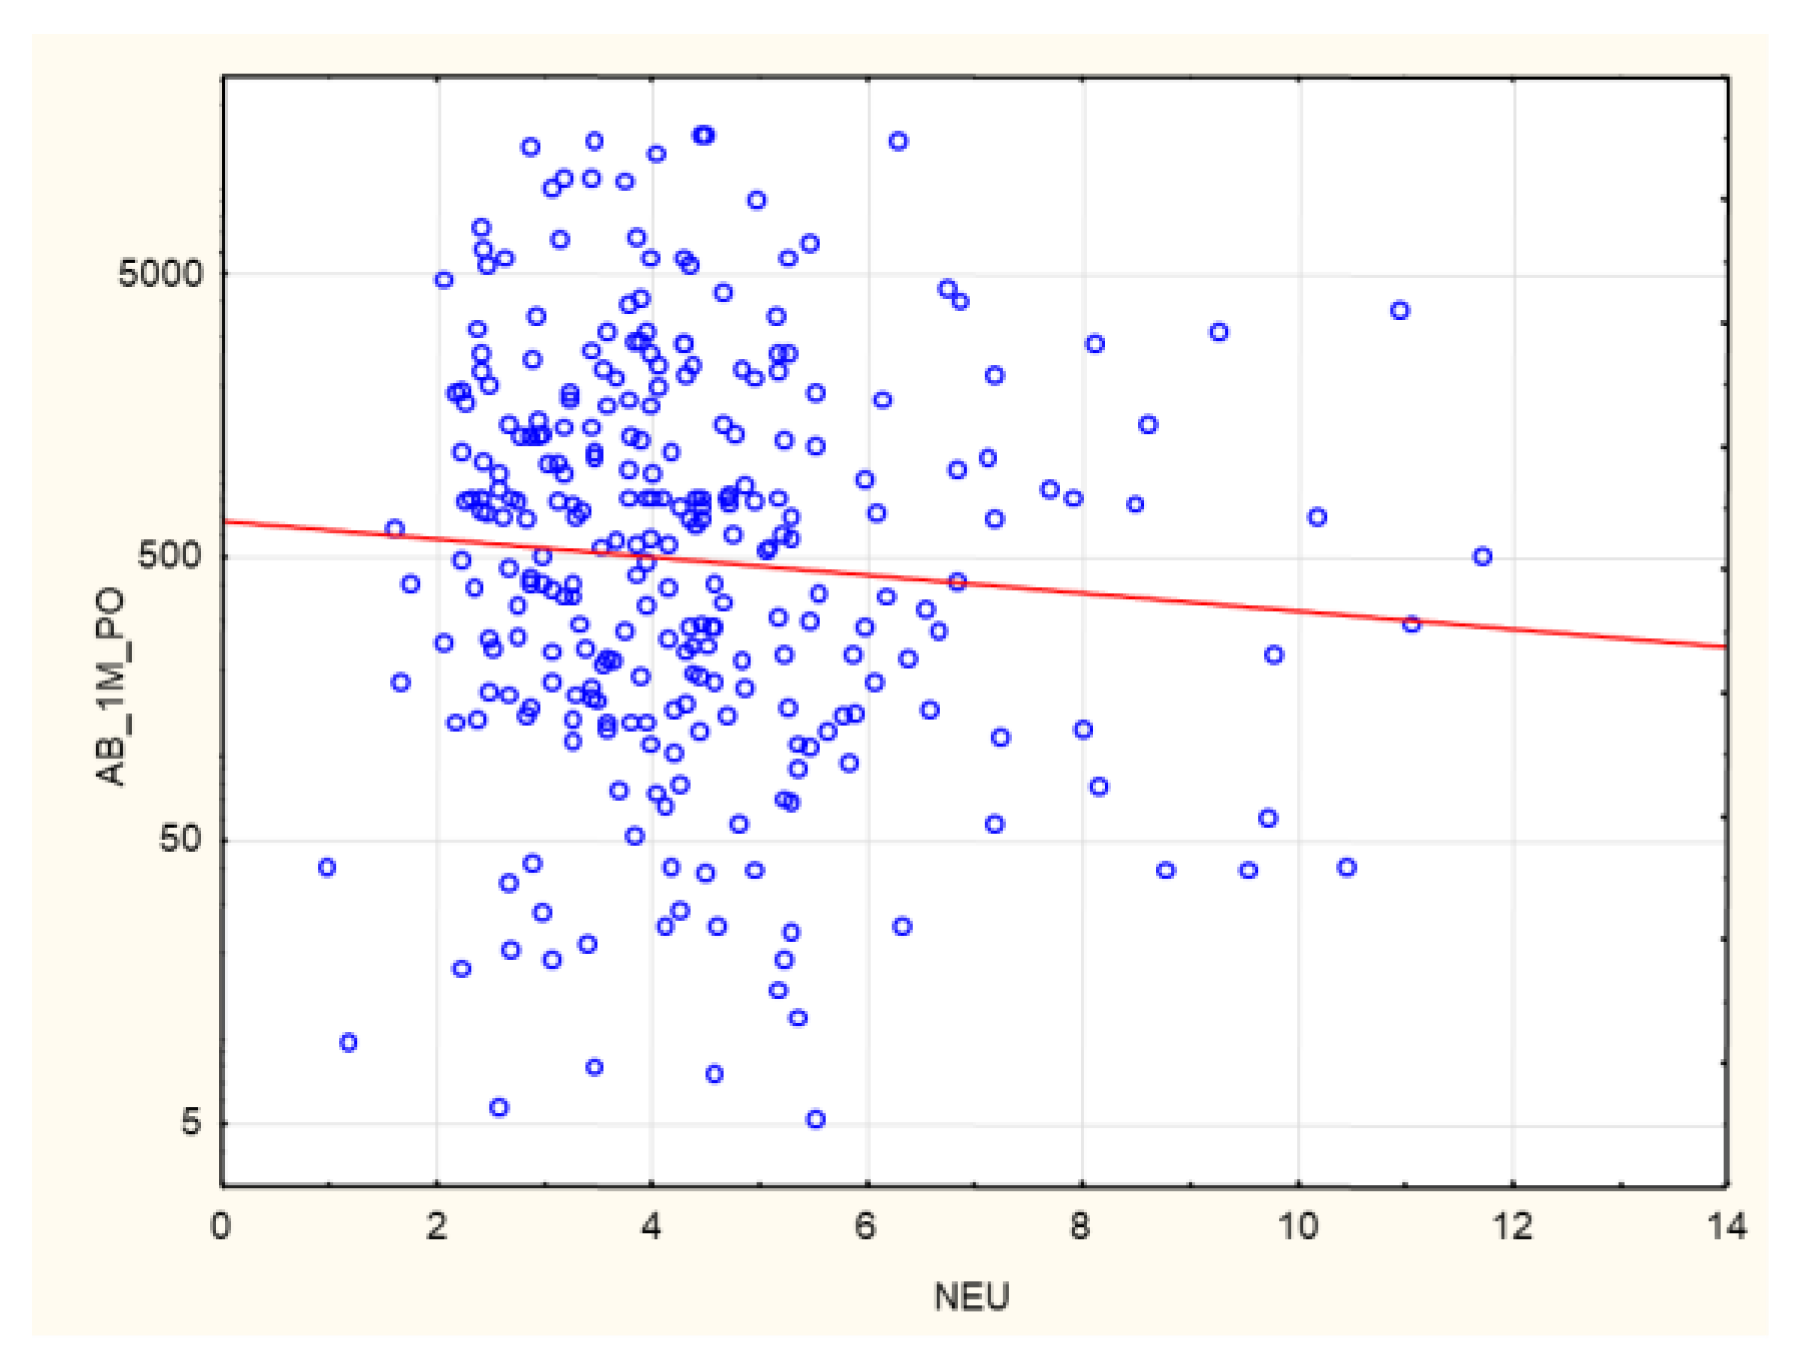
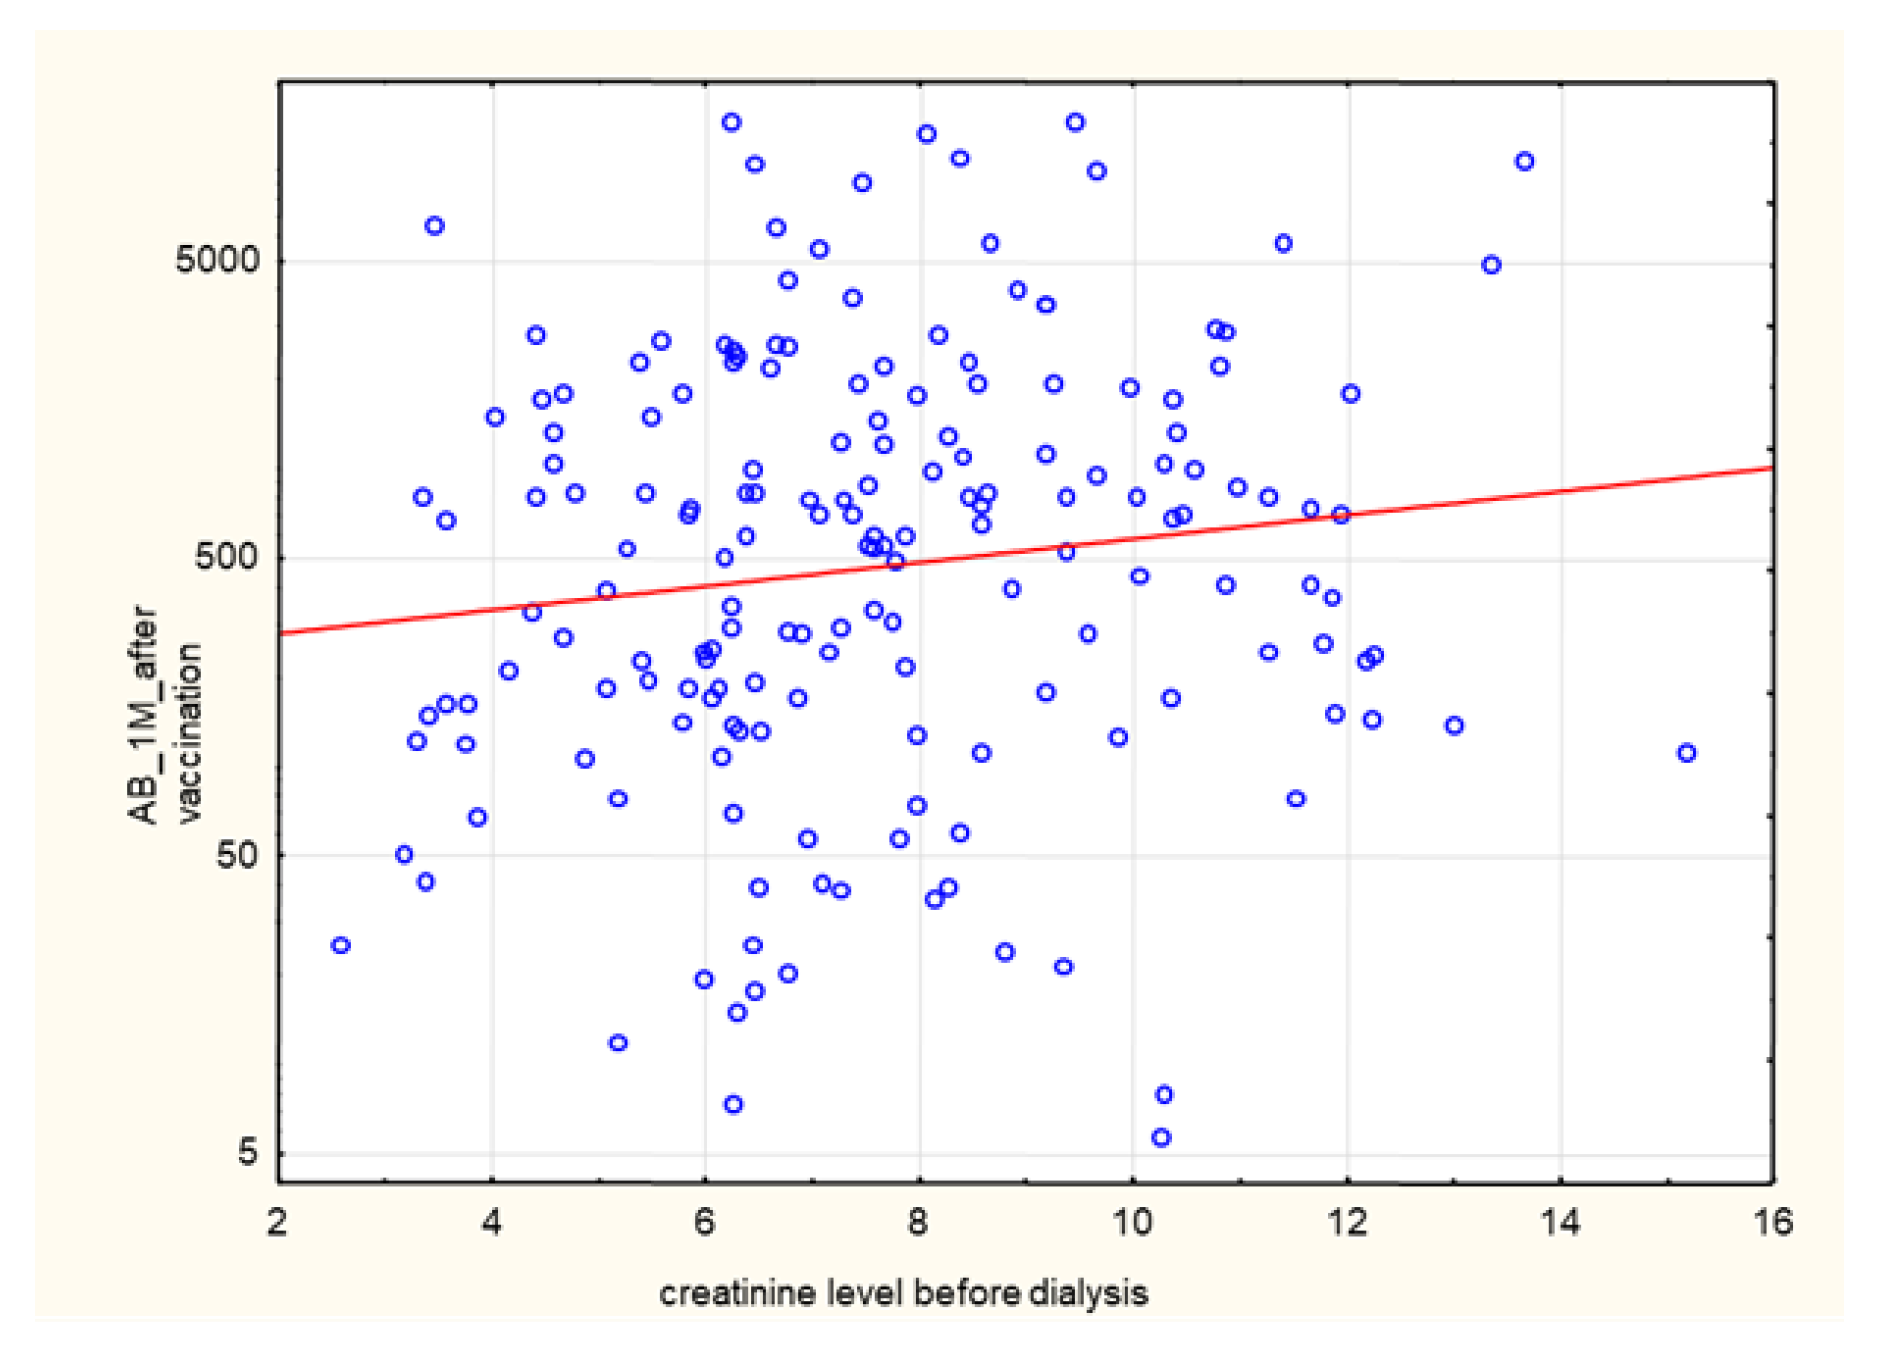
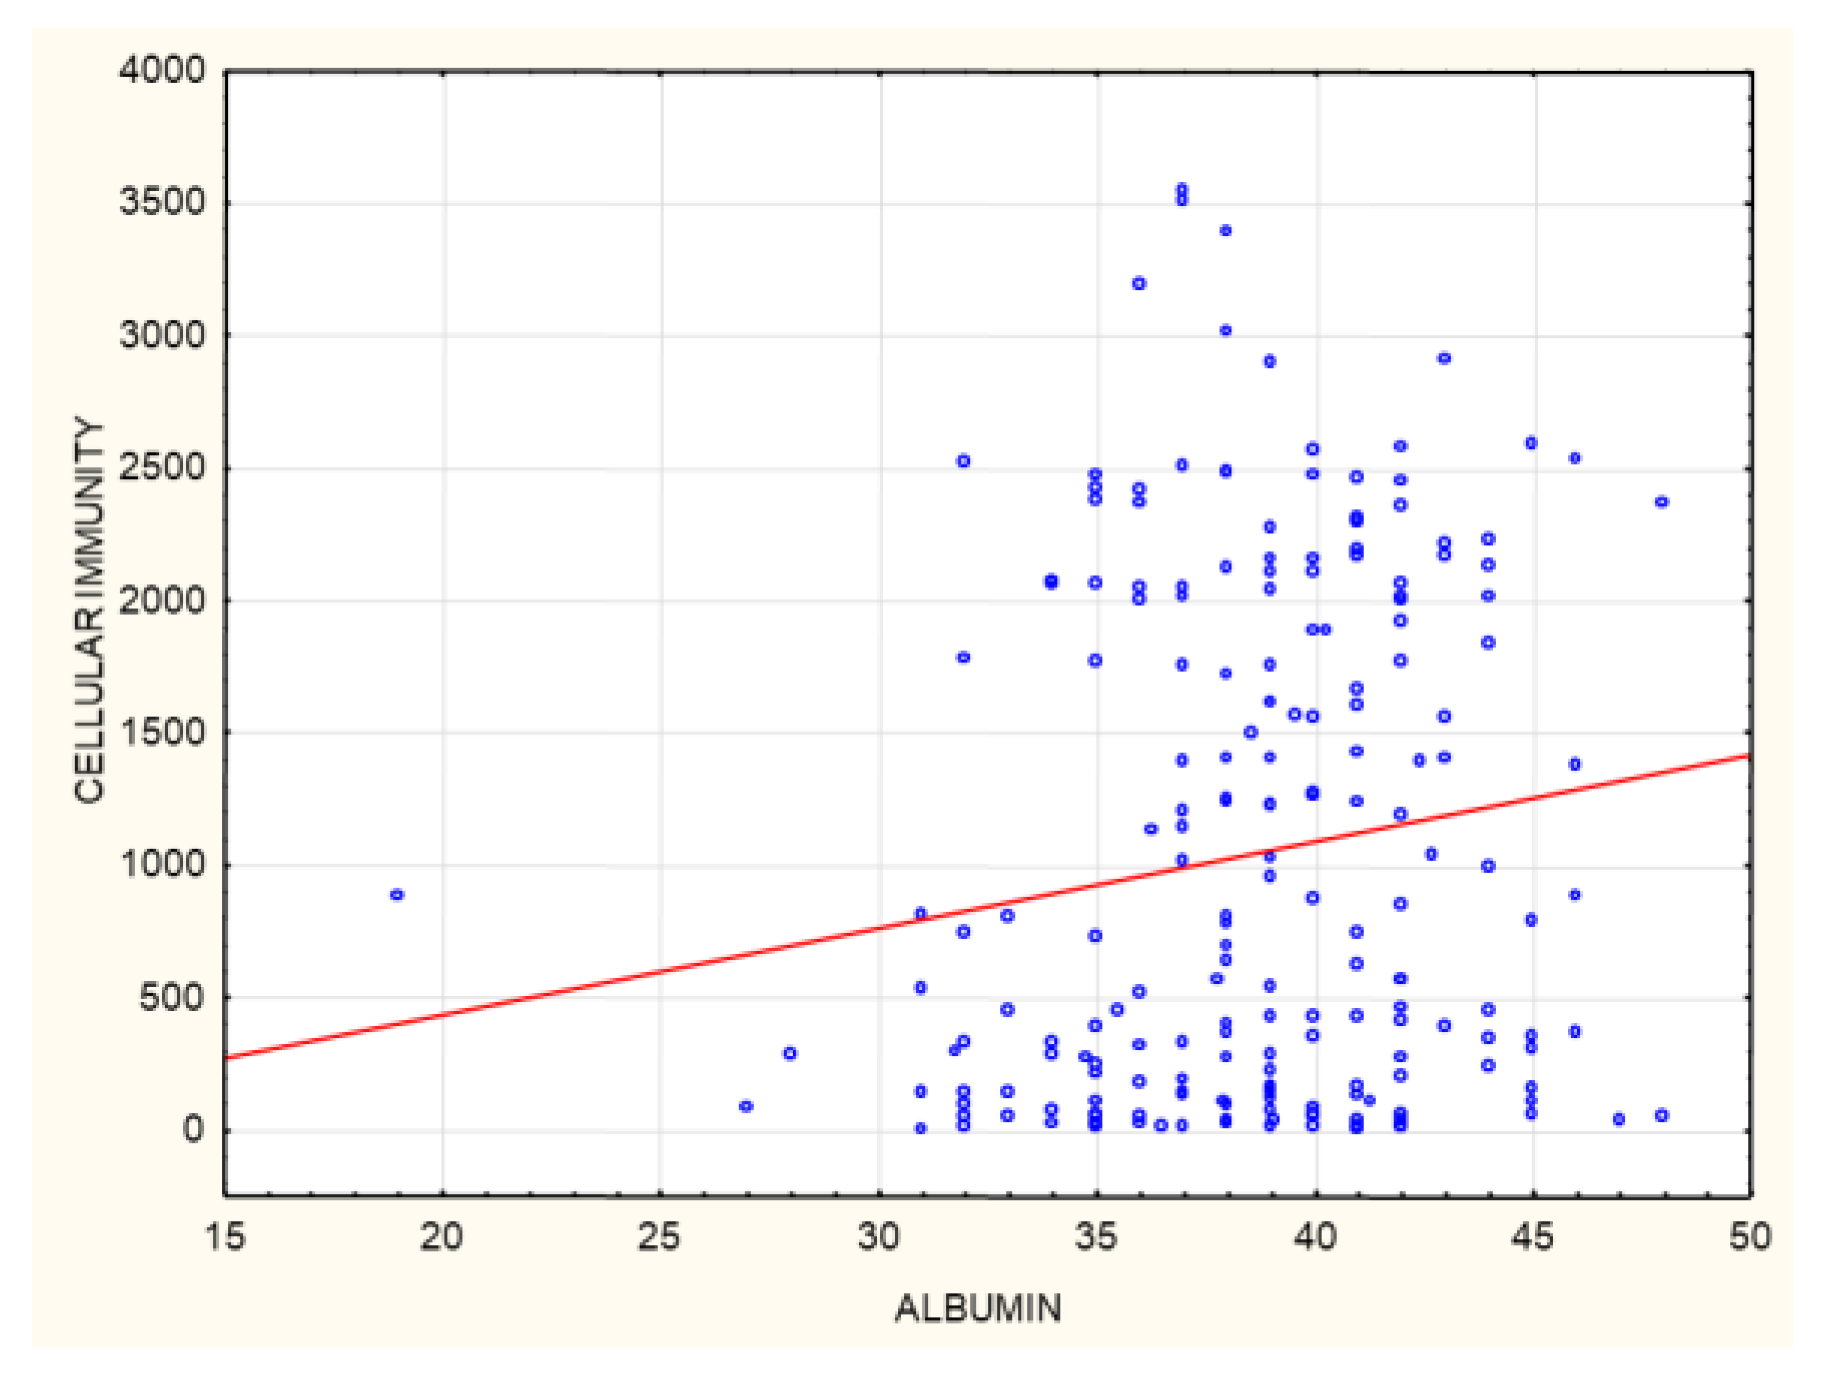
3.1. Correlations
3.1.1. The Entire Group
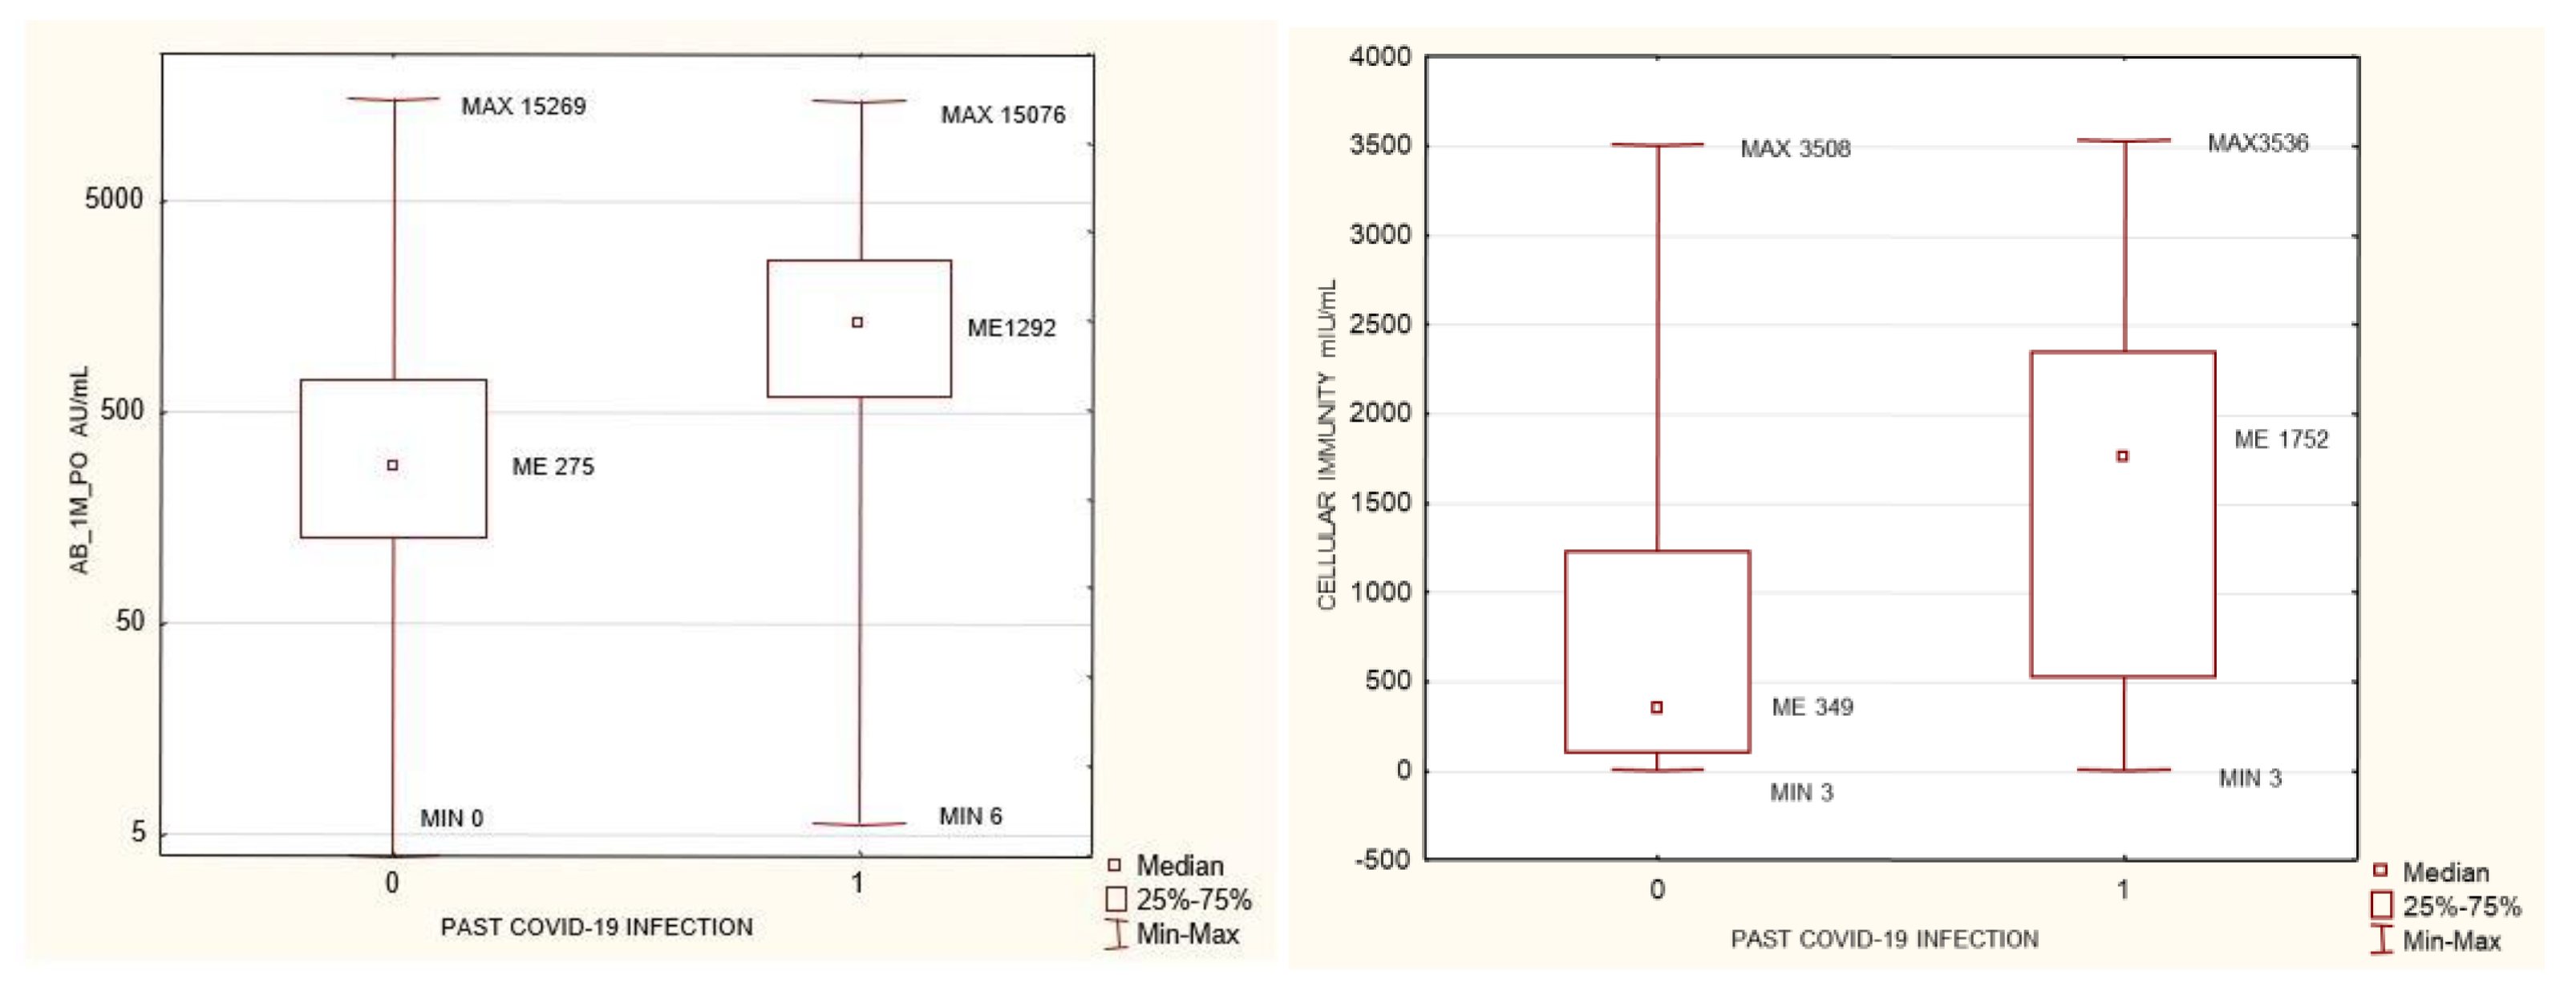
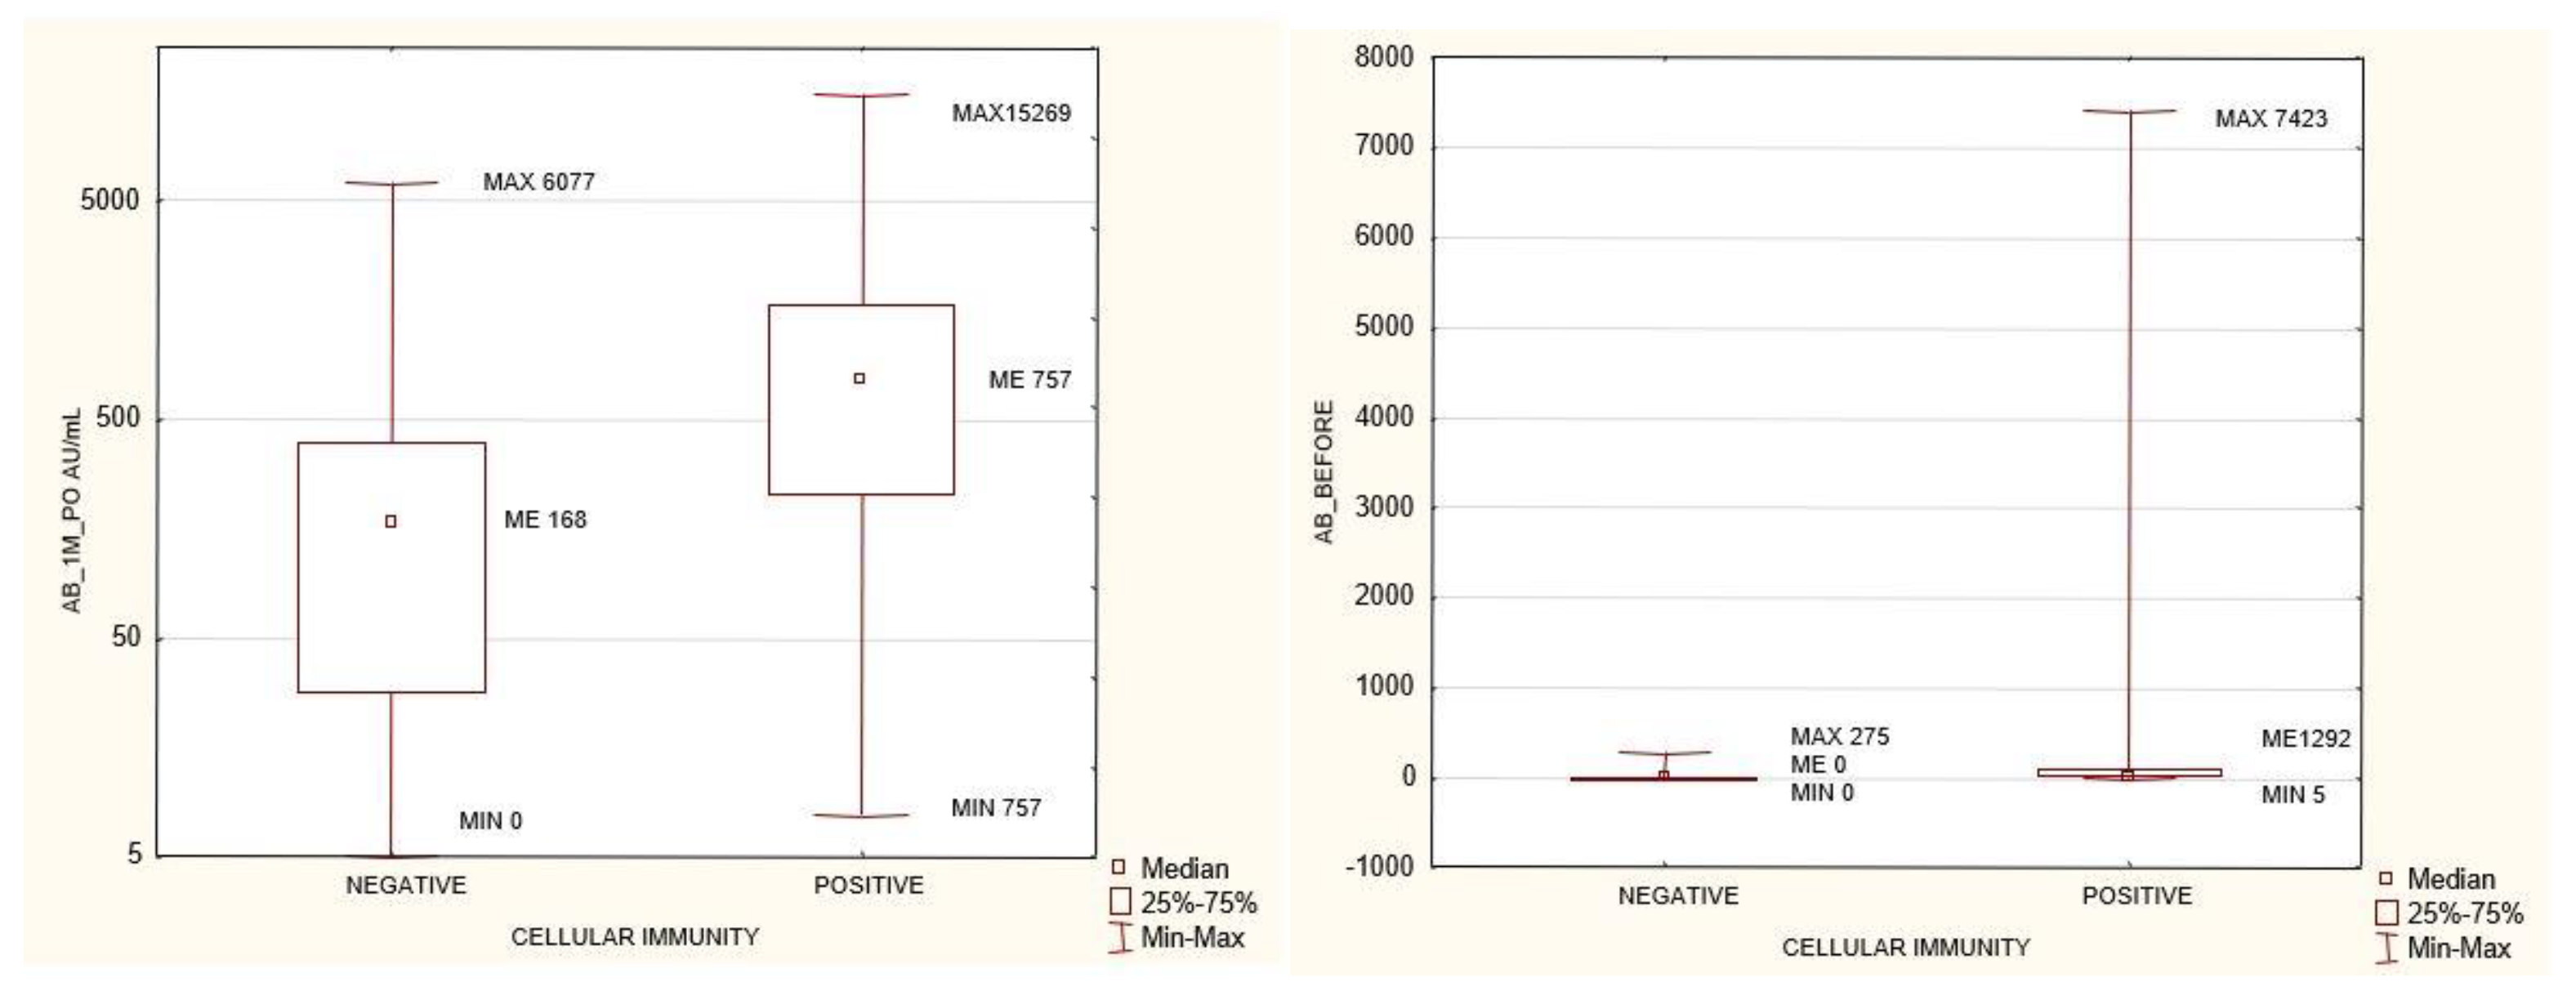
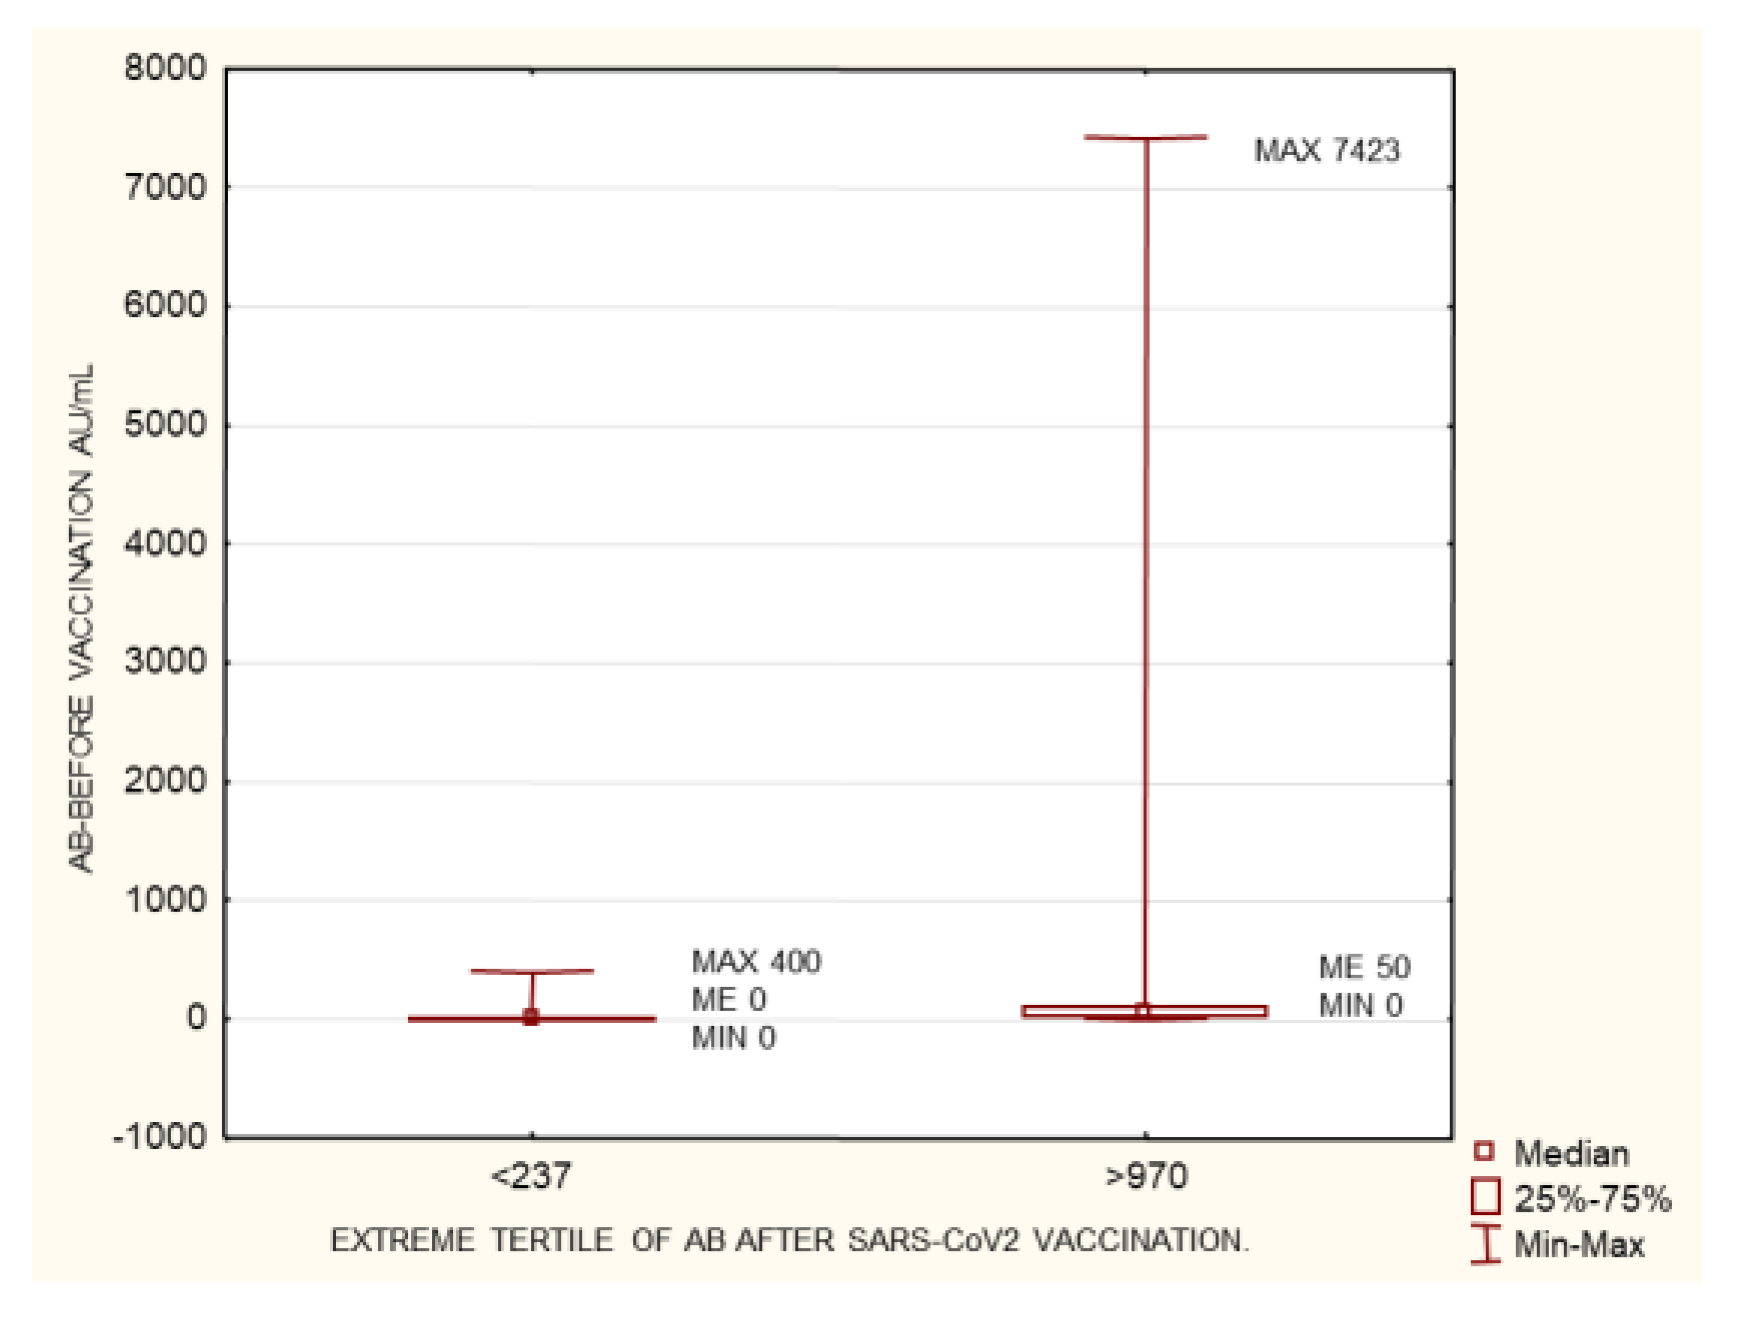
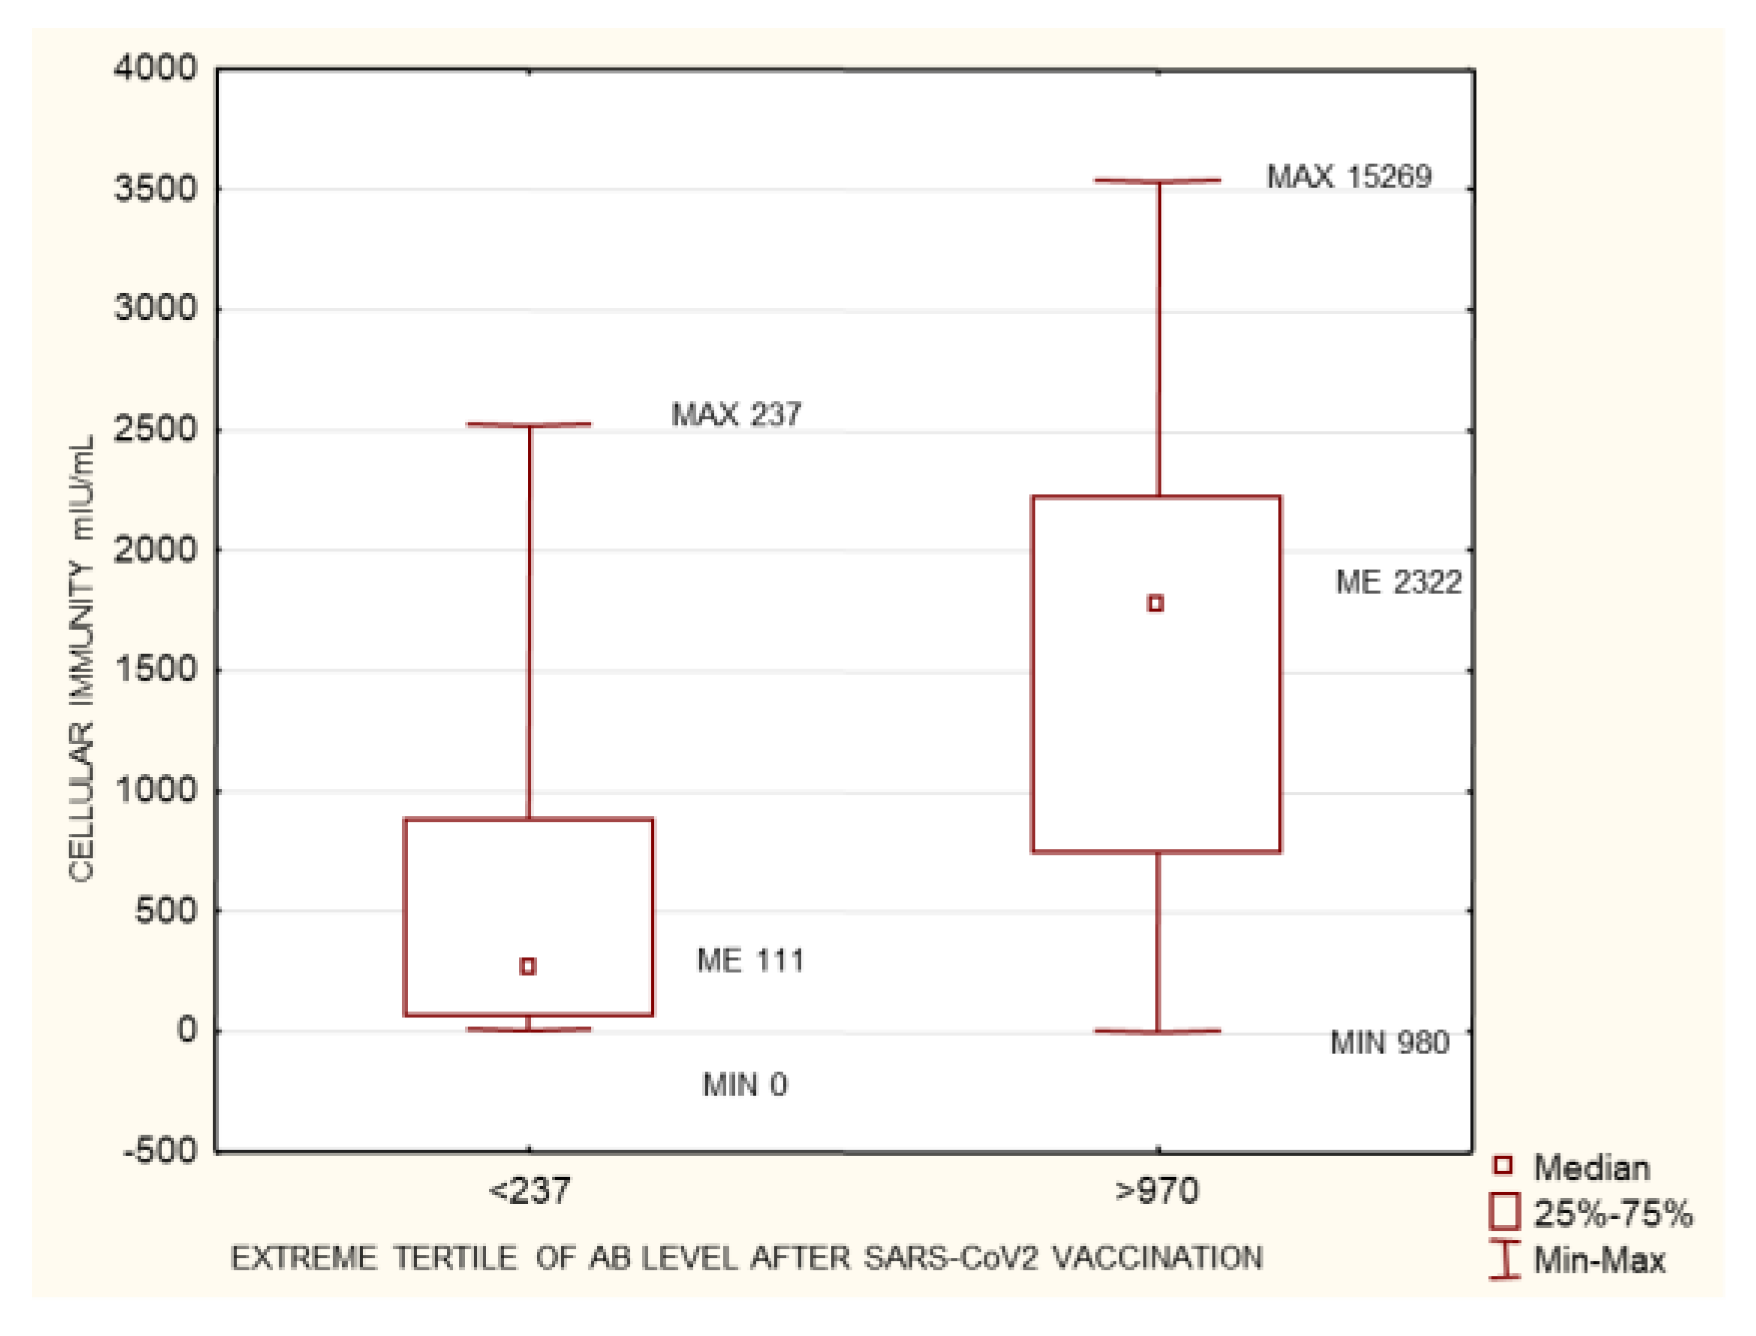
3.1.2. The Group of Patients with No History of SARS-CoV-2 Infection Prior to Vaccination
4. Discussion
4.1. Humoral Immunity
4.2. Cellular Immunity
4.3. Humoral Immunity and the Type of Vaccine
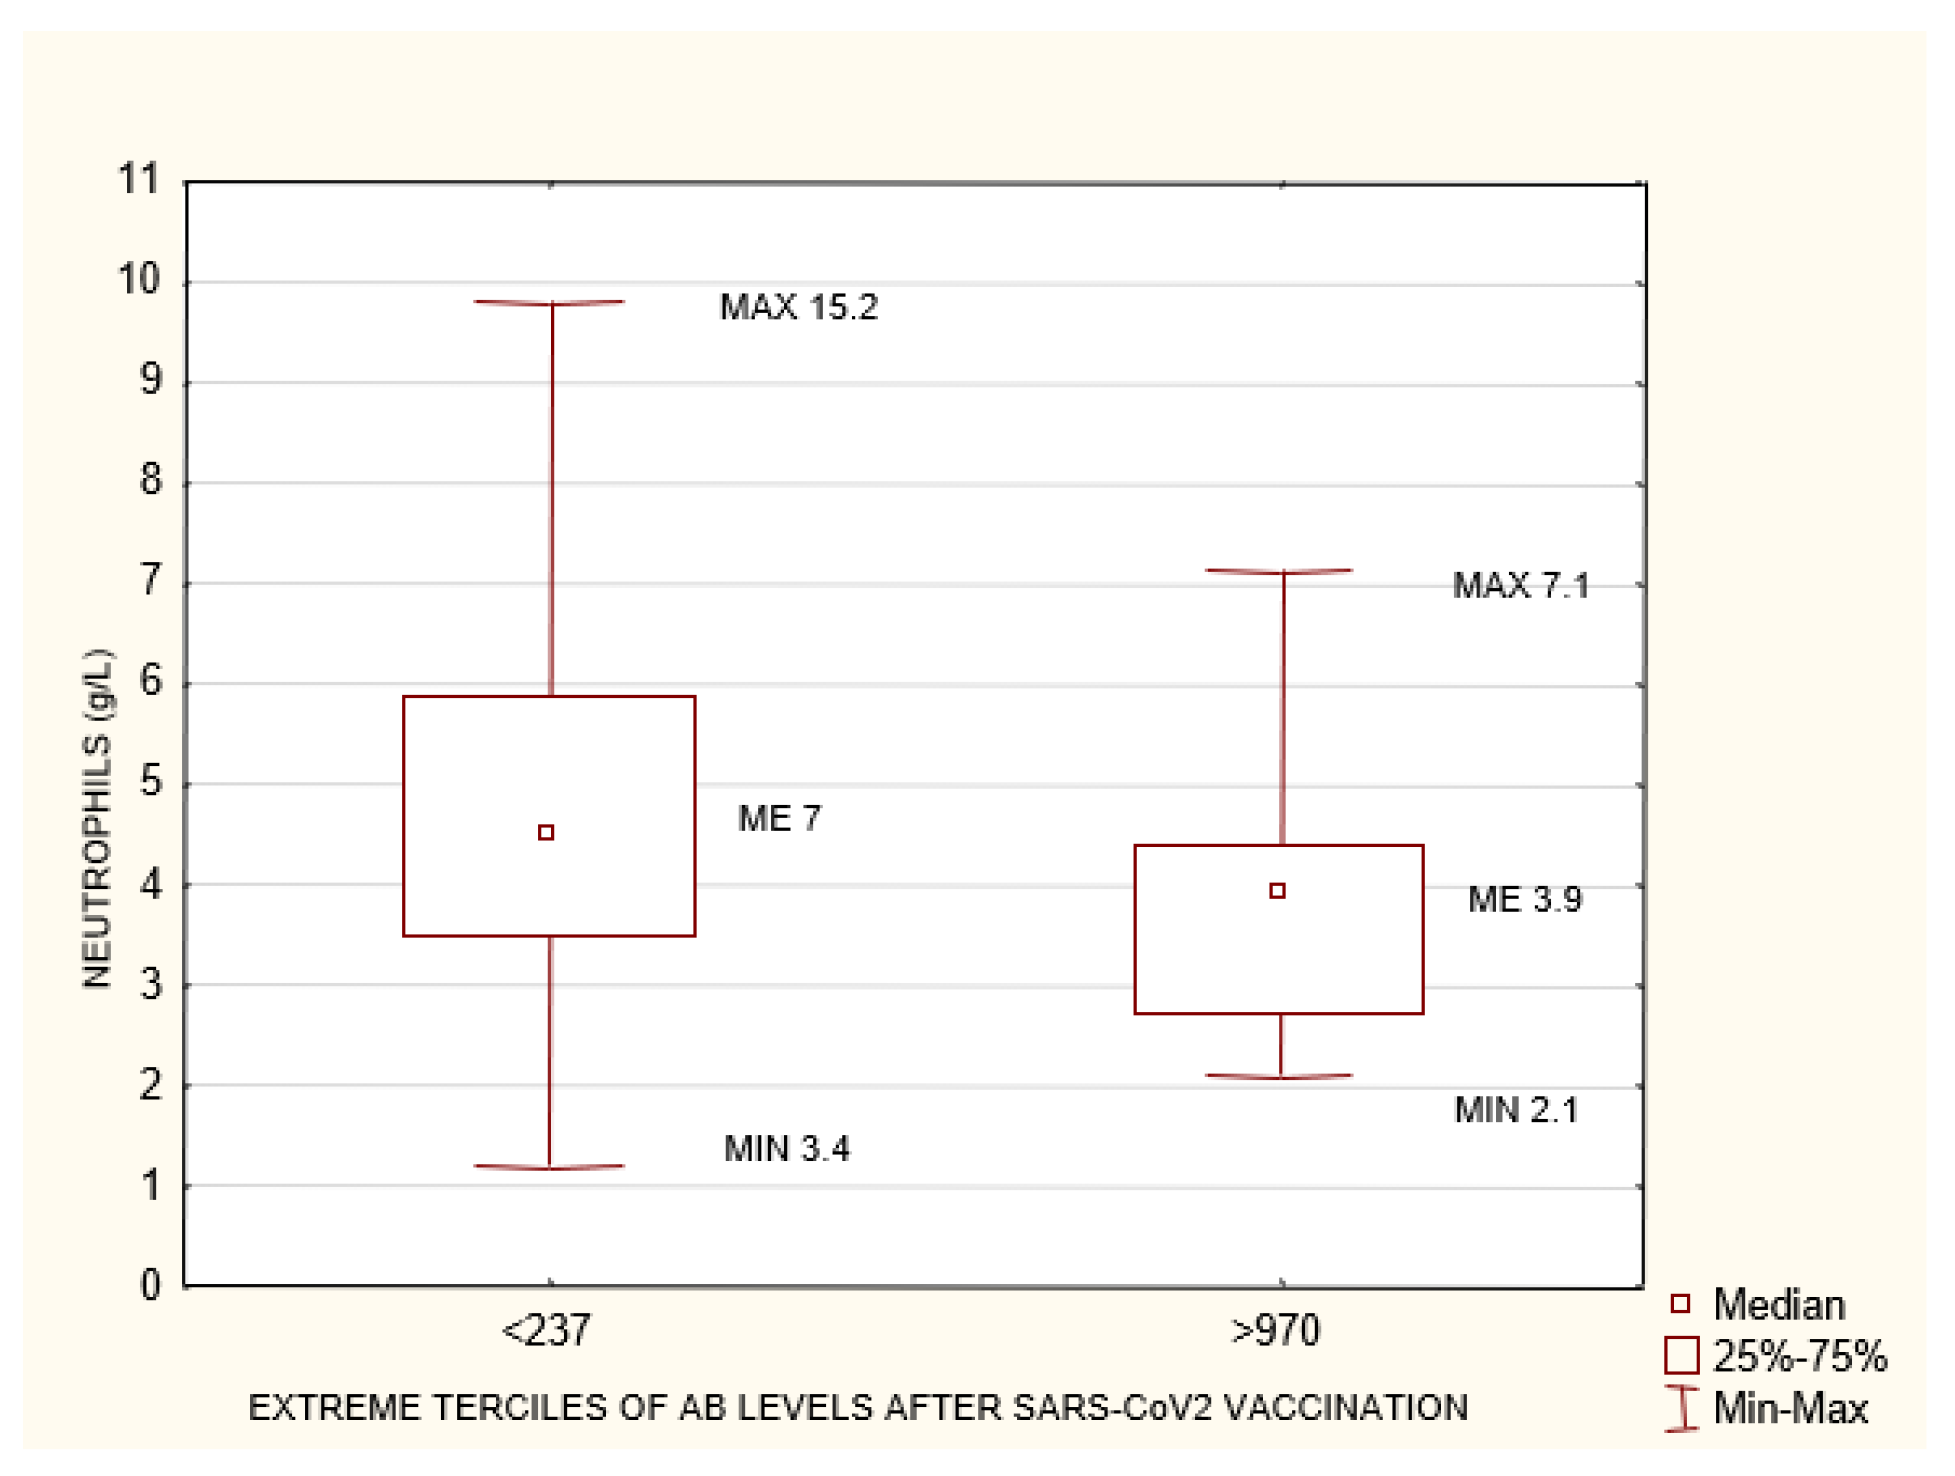
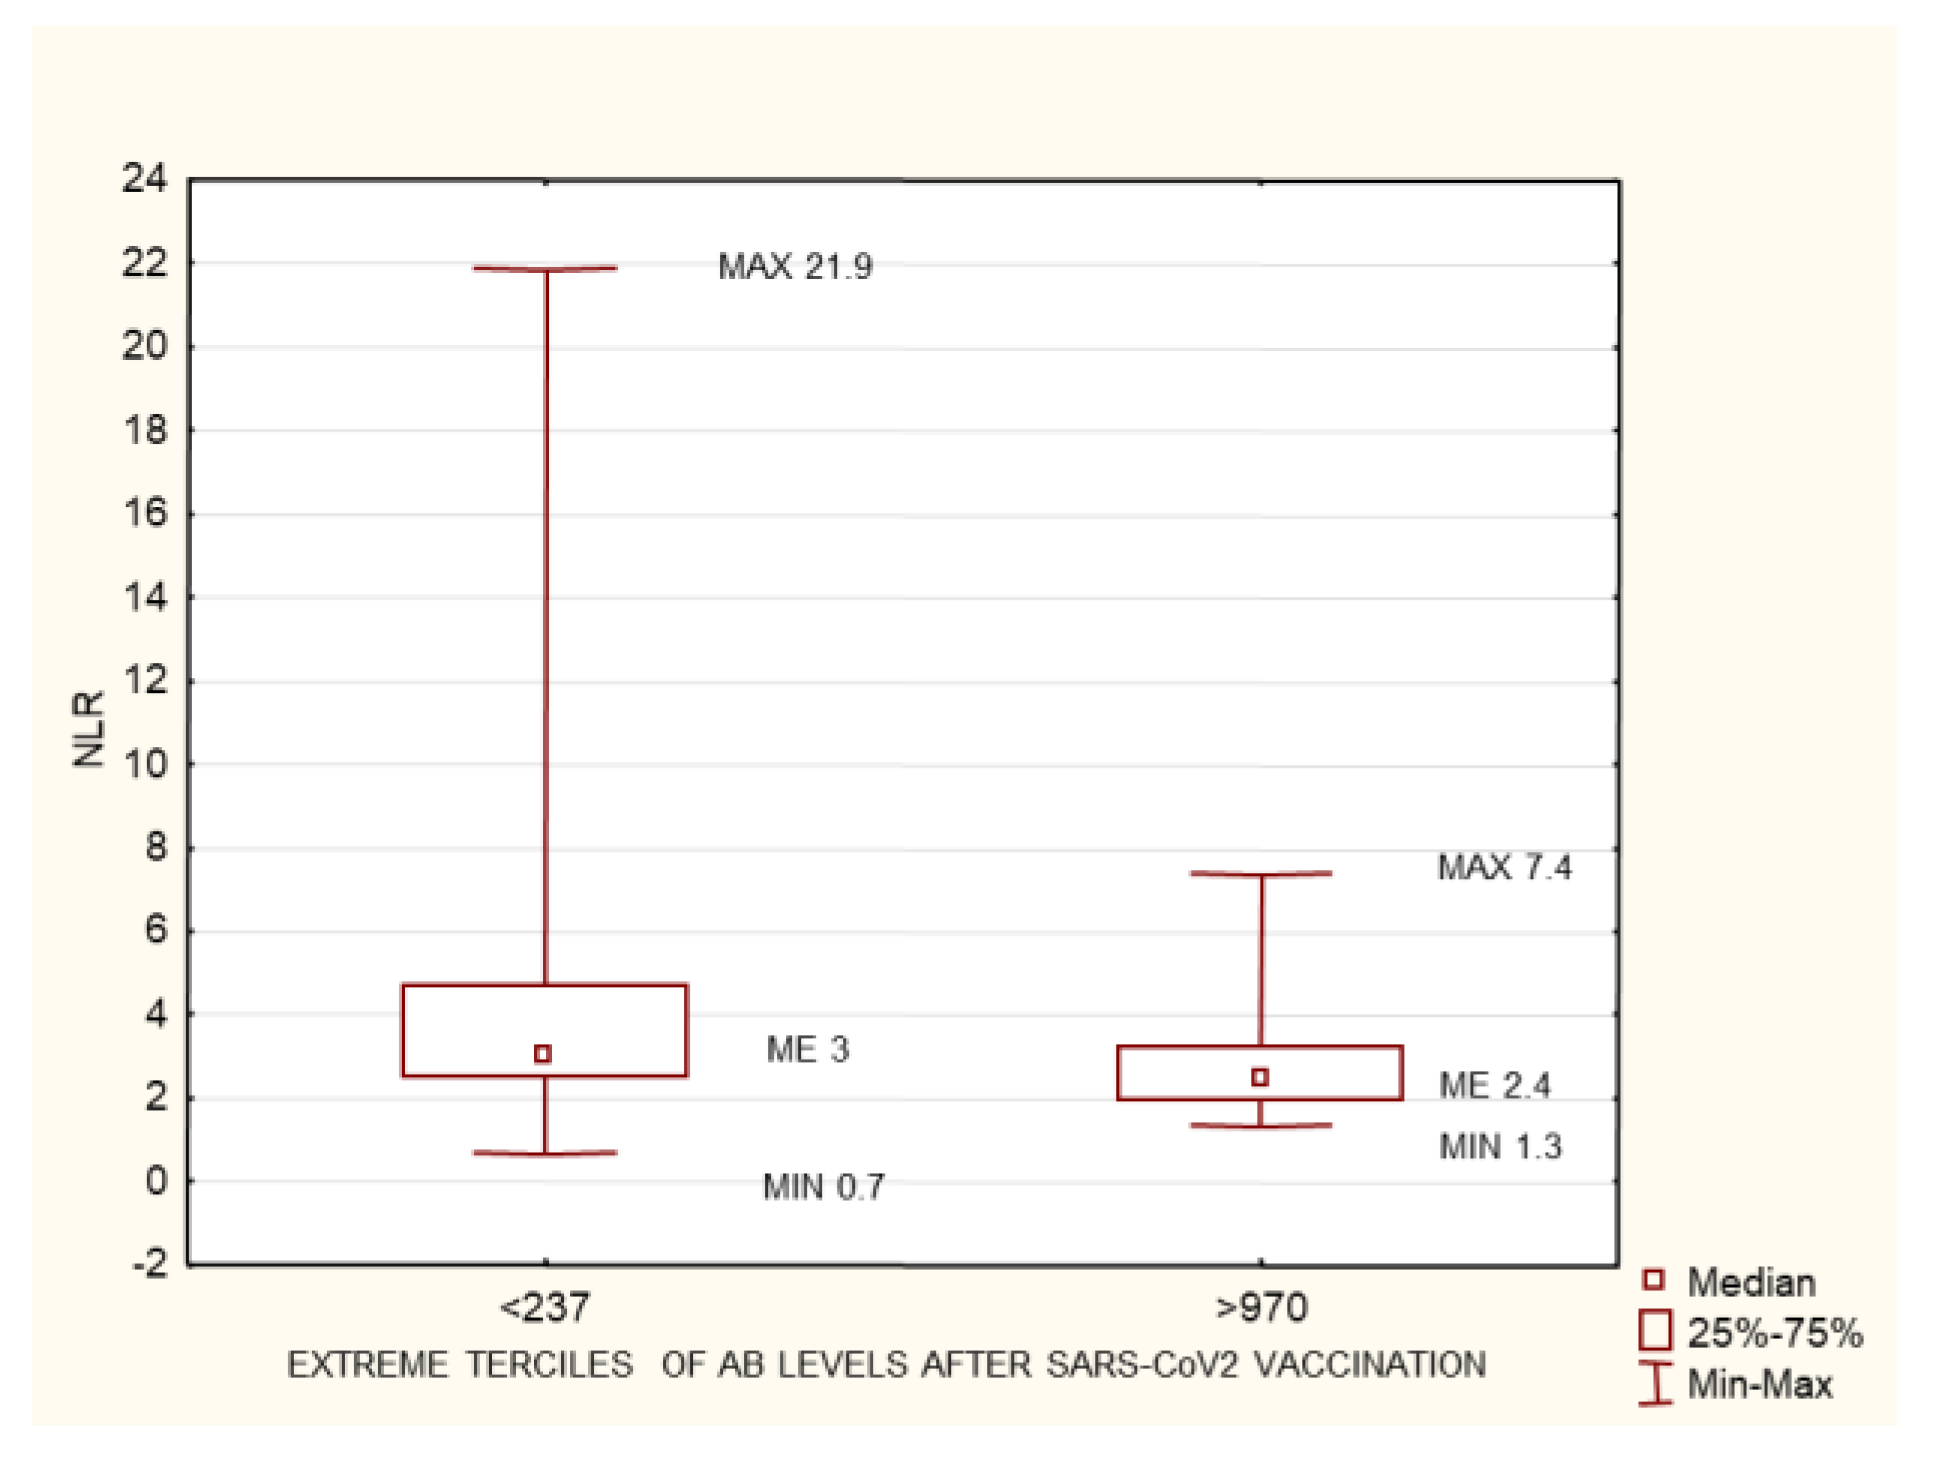
4.4. Neutrophil-to-Lymphocyte Ratio and Neutrophil Count
4.5. Hemoglobin Level
5. Summary
6. Conclusions
Author Contributions
Funding
Institutional Review Board Statement
Informed Consent Statement
Data Availability Statement
Conflicts of Interest
References
- Mahase, E. COVID-19: First coronavirus was described in The BMJ in 1965. BMJ 2020, 369, m1547. [Google Scholar] [CrossRef] [PubMed] [Green Version]
- Inchingolo, A.D.; Inchingolo, A.M.; Bordea, I.R.; Malcangi, G.; Xhajanka, E.; Scarano, A.; Lorusso, F.; Farronato, M.; Tartaglia, G.M.; Isacco, C.G.; et al. SARS-CoV-2 Disease through Viral Genomic and Receptor Implications: An Overview of Diagnostic and Immunology Breakthroughs. Microorganisms 2021, 9, 793. [Google Scholar] [CrossRef] [PubMed]
- Bordea, I.R.; Candrea, S.; Sălăgean, T.; Pop, I.D.; Lucaciu, O.; Ilea, A.; Manole, M.; Băbțan, A.-M.; Sirbu, A.; Hanna, R. Impact of COVID-19 Pandemic on Healthcare Professionals and Oral Care Operational Services: A Systemic Review. Risk Manag. Heal. Policy 2021, 14, 453–463. [Google Scholar] [CrossRef] [PubMed]
- Francis, A.; Baigent, C.; Ikizler, T.A.; Cockwell, P.; Jha, V. The urgent need to vaccinate dialysis patients against severe acute respiratory syndrome coronavirus 2: A call to action. Kidney Int. 2021, 99, 791–793. [Google Scholar] [CrossRef] [PubMed]
- De Meester, J.; De Bacquer, D.; Naesens, M. Incidence, characteristics, and outcome of COVID-19 in adults on kidney replacement therapy: A regionwide registry study. J. Am. Soc. Nephrol. 2021, 32, 385–396. [Google Scholar] [CrossRef] [PubMed]
- Savino, M.; Casula, A.; Santhakumaran, S.; Pitcher, D.; Wong, E.; Magadi, W.; Evans, K.M.; Benoy-Deeney, F.; Griffin, J.; Plumb, L.; et al. Sociodemographic features and mortality of individuals on haemodialysis treatment who test positive for SARS-CoV-2: A UK renal registry data analysis. PLoS ONE 2020, 15, e0241263. [Google Scholar] [CrossRef] [PubMed]
- Ng, J.H.; Hirsch, J.S.; Wanchoo, R. Outcomes of patients with end-stage kidney disease hospitalized with COVID-19. Kidney Int. 2020, 98, 1530–1539. [Google Scholar] [CrossRef] [PubMed]
- Jager, K.J.; Kramer, A.; Chesnaye, N.C. Results from the ERA-EDTA Registry indicate a high mortality due to COVID-19 in dialysis patients and kidney transplant recipients across Europe. Kidney Int. 2020, 98, 1540–1548. [Google Scholar] [CrossRef] [PubMed]
- Udomkarnjananun, S.; Takkavatakarn, K.; Praditpornsilpa, K.; Nader, C.; Eiam-Ong, S.; Jaber, B.L.; Susantitaphong, P. Hepatitis B virus vaccine immune response and mortality in dialysis patients: A meta-analysis. J. Nephrol. 2019, 33, 343–354. [Google Scholar] [CrossRef]
- Cordova, E.; Miglia, I.; Festuccia, F.; Sarlo, M.G.; Scornavacca, G.; Punzo, G.; Menè, P.; Fofi, C. Hepatitis B vaccination in haemodialysis patients: An underestimated problem. Factors influencing immune responses in ten years of observation in an Italian haemodialysis centre and literature review. Ann. Ig. 2017, 29, 27–37. [Google Scholar]
- Nacasch, N.; Erez, D.; Lishner, M.; Benchetrit, S.; Rozenberg, I.; Sarel, E.; Shitrit, P.; Wand, O.; Cohen-Hagai, K. Long-term Antibody Response to the BNT162b2 Vaccine among Maintenance Hemodialysis Patients. Am. J. Kidney Dis. 2022, 79, 137–139. [Google Scholar] [CrossRef] [PubMed]
- Strengert, M.; Becker, M.; Ramos, G.M.; Dulovic, A.; Gruber, J.; Juengling, J.; Lürken, K.; Beigel, A.; Wrenger, E.; Lonnemann, G.; et al. Cellular and humoral immunogenicity of a SARS-CoV-2 mRNA vaccine in patients on haemodialysis. eBioMedicine 2021, 70, 103524. [Google Scholar] [CrossRef] [PubMed]
- Melin, J.; Svensson, M.K.; Albinsson, B.; Winqvist, O.; Pauksens, K. Humoral and cellular response to SARS-CoV-2 BNT162b2 mRNA vaccine in hemodialysis patients. BMC Immunol. 2021, 22, 70. [Google Scholar] [CrossRef] [PubMed]
- Anand, S.; Montez-Rath, M.E.; Han, J.; Garcia, P.; Cadden, L.; Hunsader, P.; Kerschmann, R.; Beyer, P.; Dittrich, M.; Block, G.A.; et al. Antibody Response to COVID-19 Vaccination in Patients Receiving Dialysis. J. Am. Soc. Nephrol. 2021, 32, 2435–2438. [Google Scholar] [CrossRef] [PubMed]
- Broseta, J.J.; Rodríguez-Espinosa, D.; Rodríguez, N.; Mosquera, M.D.M.; Marcos, M.; Egri, N.; Pascal, M.; Soruco, E.; Bedini, J.L.; Bayés, B.; et al. Humoral and Cellular Responses to mRNA-1273 and BNT162b2 SARS-CoV-2 Vaccines Administered to Hemodialysis Patients. Am. J. Kidney Dis. 2021, 78, 571–581. [Google Scholar] [CrossRef] [PubMed]
- Attias, P.; Sakhi, H.; Rieu, P.; Soorkia, A.; Assayag, D.; Bouhroum, S.; Nizard, P.; El Karoui, K. Antibody response to the BNT162b2 vaccine in maintenance hemodialysis patients. Kidney Int. 2021, 99, 1490–1492. [Google Scholar] [CrossRef] [PubMed]
- Santos-Araújo, C.; Veiga, P.M.; Santos, M.J.; Santos, L.; Romãozinho, C.; Silva, M.; Lucas, C.; Duarte, M.L.; Haarhaus, M.; Haase, M.; et al. Time-dependent evolution of IgG antibody levels after first and second dose of mRNA-based SARS-CoV-2 vaccination in haemodialysis patients: A multicentre study. Nephrol. Dial. Transplant. 2021, 37, 375–381. [Google Scholar] [CrossRef] [PubMed]
- Danthu, C.; Hantz, S.; Dahlem, A.; Duval, M.; Ba, B.; Guibbert, M.; El Ouafi, Z.; Ponsard, S.; Berrahal, I.; Achard, J.-M.; et al. Humoral Response after SARS-CoV-2 mRNA Vaccination in a Cohort of Hemodialysis Patients and Kidney Transplant Recipients. J. Am. Soc. Nephrol. 2021, 32, 2153–2158. [Google Scholar] [CrossRef] [PubMed]
- Krammer, F. Correlates of protection from SARS-CoV-2 infection. Lancet 2021, 397, 1421–1423. [Google Scholar] [CrossRef]
- Sui, Y.; Bekele, Y.; Berzofsky, J.A. Potential SARS-CoV-2 immune correlates of protection in infection and vaccine immunization. Pathogens 2021, 10, 138. [Google Scholar] [CrossRef] [PubMed]
- Schrezenmeier, E.; Bergfeld, L.; Hillus, D.; Lippert, J.-D.; Weber, U.; Tober-Lau, P.; Landgraf, I.; Schwarz, T.; Kappert, K.; Stefanski, A.-L.; et al. Immunogenicity of COVID-19 Tozinameran Vaccination in Patients on Chronic Dialysis. Front. Immunol. 2021, 12, 690698. [Google Scholar] [CrossRef] [PubMed]
- Lonnemann, G.; Novick, D.; Rubinstein, M.; Dinarello, C.A. Interleukin-18, interleukin-18 binding protein and impaired production of interferon-gamma in chronic renal failure. Clin. Nephrol. 2003, 60, 327–334. [Google Scholar] [CrossRef] [PubMed]
- Lonnemann, G.; Bahlmann, F.; Freise, J.; Hertel, B.; Dinarello, C. Low-flux hemodialysis suppresses interferon-gamma production: The possible role of beta2-microglobulin. Clin. Nephrol. 2009, 72, 170–176. [Google Scholar] [CrossRef] [PubMed]
- Hartzell, S.; Bin, S.; Cantarelli, C.; Haverly, M.; Manrique, J.; Angeletti, A.; La Manna, G.; Murphy, B.; Zhang, W.; Levitsky, J.; et al. Kidney Failure Associates with T Cell Exhaustion and Imbalanced Follicular Helper T Cells. Front. Immunol. 2020, 11, 583702. [Google Scholar] [CrossRef] [PubMed]
- Lacson, E.; Argyropoulos, C.P.; Manley, H.J.; Aweh, G.; Chin, A.I.; Salman, L.H.; Hsu, C.M.; Johnson, D.S.; Weiner, D.E. Immunogenicity of SARS-CoV-2 vaccine in dialysis. JASN 2021, 32, 2735–2742. [Google Scholar] [CrossRef] [PubMed]
- Yanay, N.B.; Freiman, S.; Shapira, M.; Wishahi, S.; Hamze, M.; Elhaj, M.; Zaher, M.; Armaly, Z. Experience with SARS-CoV-2 BNT162b2 mRNA vaccine in dialysis patients. Kidney Int. 2021, 99, 1496–1498. [Google Scholar] [CrossRef] [PubMed]
- Simon, B.; Rubey, H.; Treipl, A.; Gromann, M.; Hemedi, B.; Zehetmayer, S.; Kirsch, B. Hemodialysis patients show a highly diminished antibody response after COVID-19 mRNA vaccination compared to healthy controls. Nephrol. Dial. Transplantation 2021, 9, 1709–1716. [Google Scholar] [CrossRef]
- Grupper, A.; Sharon, N.; Finn, T.; Cohen, R.; Israel, M.; Agbaria, A.; Rechavi, Y.; Schwartz, I.F.; Schwartz, D.; Lellouch, Y.; et al. Humoral Response to the Pfizer BNT162b2 Vaccine in Patients Undergoing Maintenance Hemodialysis. Clin. J. Am. Soc. Nephrol. 2021, 16, 1037–1042. [Google Scholar] [CrossRef] [PubMed]
- Van Praet, J.; Reynders, M.; De Bacquer, D.; Viaene, L.; Schoutteten, M.K.; Caluwé, R.; Doubel, P.; Heylen, L.; De Bel, A.V.; Van Vlem, B.; et al. Predictors and Dynamics of the Humoral and Cellular Immune Response to SARS-CoV-2 mRNA Vaccines in Hemodialysis Patients: A Multicenter Observational Study. J. Am. Soc. Nephrol. 2021, 32, 3208–3220. [Google Scholar] [CrossRef]
- Ghamar-Chehreh, M.E.; Agah, S.; Khedmat, H.; Aaghaei, A.; Alavian, S.-M. Serum albumin level as an indicator of response to Hepatitis B vaccination in dialysis patients: A systematic review and meta-analysis. Casp. J. Intern. Med. 2017, 8, 250–257. [Google Scholar] [CrossRef]
- Johansen, K.L.; Dalrymple, L.S.; Delgado, C.; Chertow, G.M.; Segal, M.R.; Chiang, J.; Grimes, B.; Kaysen, G.A. Factors Associated with Frailty and Its Trajectory among Patients on Hemodialysis. Clin. J. Am. Soc. Nephrol. 2017, 12, 1100–1108. [Google Scholar] [CrossRef] [PubMed] [Green Version]
- Turkmen, K.; Guney, I.; Yerlikaya, F.H.; Tonbul, H.Z. The Relationship between Neutrophil-to-Lymphocyte Ratio and Inflammation in End-Stage Renal Disease Patients. Ren. Fail. 2011, 34, 155–159. [Google Scholar] [CrossRef] [PubMed]
- Ahbap, E.; Sakaci, T.; Kara, E.; Sahutoglu, T.; Koc, Y.; Basturk, T.; Sevinc, M.; Akgöl, C.; Kayalar, A.O.; Ucar, Z.A.; et al. Neutrophil-to-lymphocyte ratio and platelet-tolymphocyte ratio in evaluation of inflammation in end-stage renal disease. Clin. Nephrol. 2016, 85, 199–208. [Google Scholar] [CrossRef] [PubMed]
- Turkmen, K.; Erdur, F.M.; Ozcicek, F.; Ozcicek, A.; Akbas, E.M.; Ozbicer, A.; Demirtas, L.; Turk, S.; Tonbul, H.Z. Platelet-to-lymphocyte ratio better predicts inflammation than neutrophil-to-lymphocyte ratio in end-stage renal disease patients. Hemodial. Int. 2013, 17, 391–396. [Google Scholar] [CrossRef] [PubMed]
- Catabay, C.; Obi, Y.; Streja, E.; Soohoo, M.; Park, C.; Rhee, C.M.; Kovesdy, C.P.; Hamano, T.; Kalantar-Zadeh, K. Lymphocyte Cell Ratios and Mortality among Incident Hemodialysis Patients. Am. J. Nephrol. 2017, 46, 408–416. [Google Scholar] [CrossRef] [PubMed]
- Ouellet, G.; Malhotra, R.; Penne, E.L.; Usvyat, L.; Levin, N.W.; Kotanko, P. Neutrophil-lymphocyte ratio as a novel predictor of survival in chronic hemodialysis patients. Clin. Nephrol. 2016, 85, 191–198. [Google Scholar] [CrossRef] [PubMed]
- Li, P.; Xia, C.; Liu, P.; Peng, Z.; Huang, H.; Wu, J.; He, Z. Neutrophil-to-lymphocyte ratio and platelet-to-lymphocyte ratio in evaluation of inflammation in non-dialysis patients with end-stage renal disease (ESRD). BMC Nephrol. 2020, 21, 511. [Google Scholar] [CrossRef] [PubMed]
- Mutinelli-Szymanski, P.; Hude, I.; Merle, E.; Lombardi, Y.; Seris, P.; Abtahi, M.; Azeroual, L.; Bourgain, C.; Ensergueix, G.; Katerinis, I.; et al. Neutrophil: Lymphocyte ratio predicts short-term outcome of COVID-19 in haemodialysis patients. Clin. Kidney J. 2020, 14, 124–131. [Google Scholar] [CrossRef] [PubMed]


| N | Median | Min | Max | |
|---|---|---|---|---|
| AGE (years) | 281 | 68 | 18 | 93 |
| AB before vaccination AU/mL | 281 | 0 | 0 | 7423 |
| AB 1-month post-vaccination AU/mL | 281 | 576.92 | 0 | 15,269.23 |
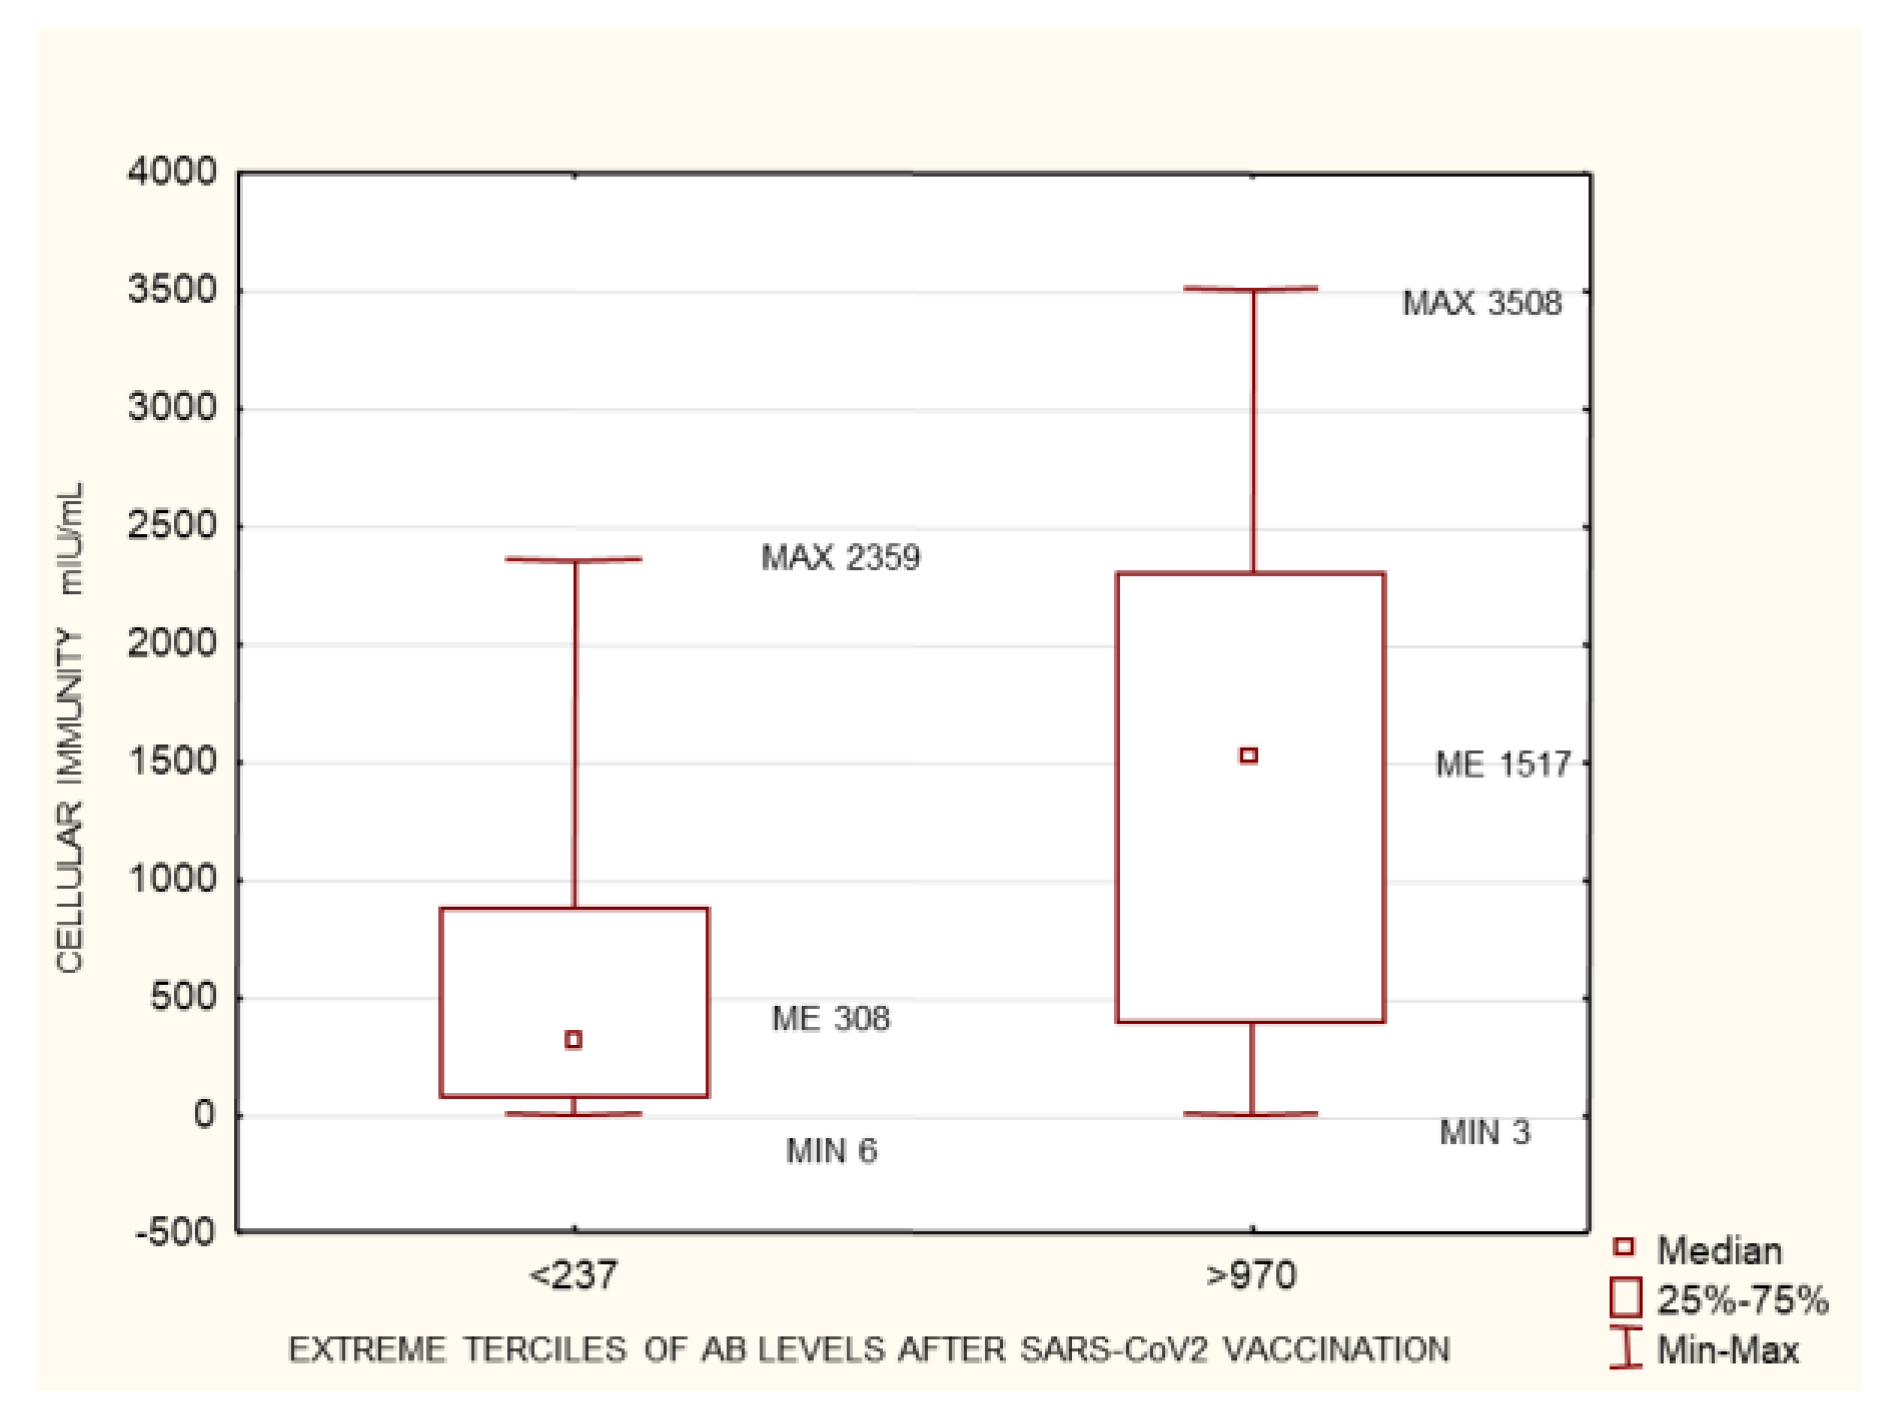
| Cell immunity 1-month post-vaccination mIU/mL | 202 | 757.05 | 3.032 | 3535.69 |
| Time on hemodialysis (months) | 281 | 38 | 1 | 411 |
| KT/V | 281 | 1.38 | 0.67 | 3.48 |
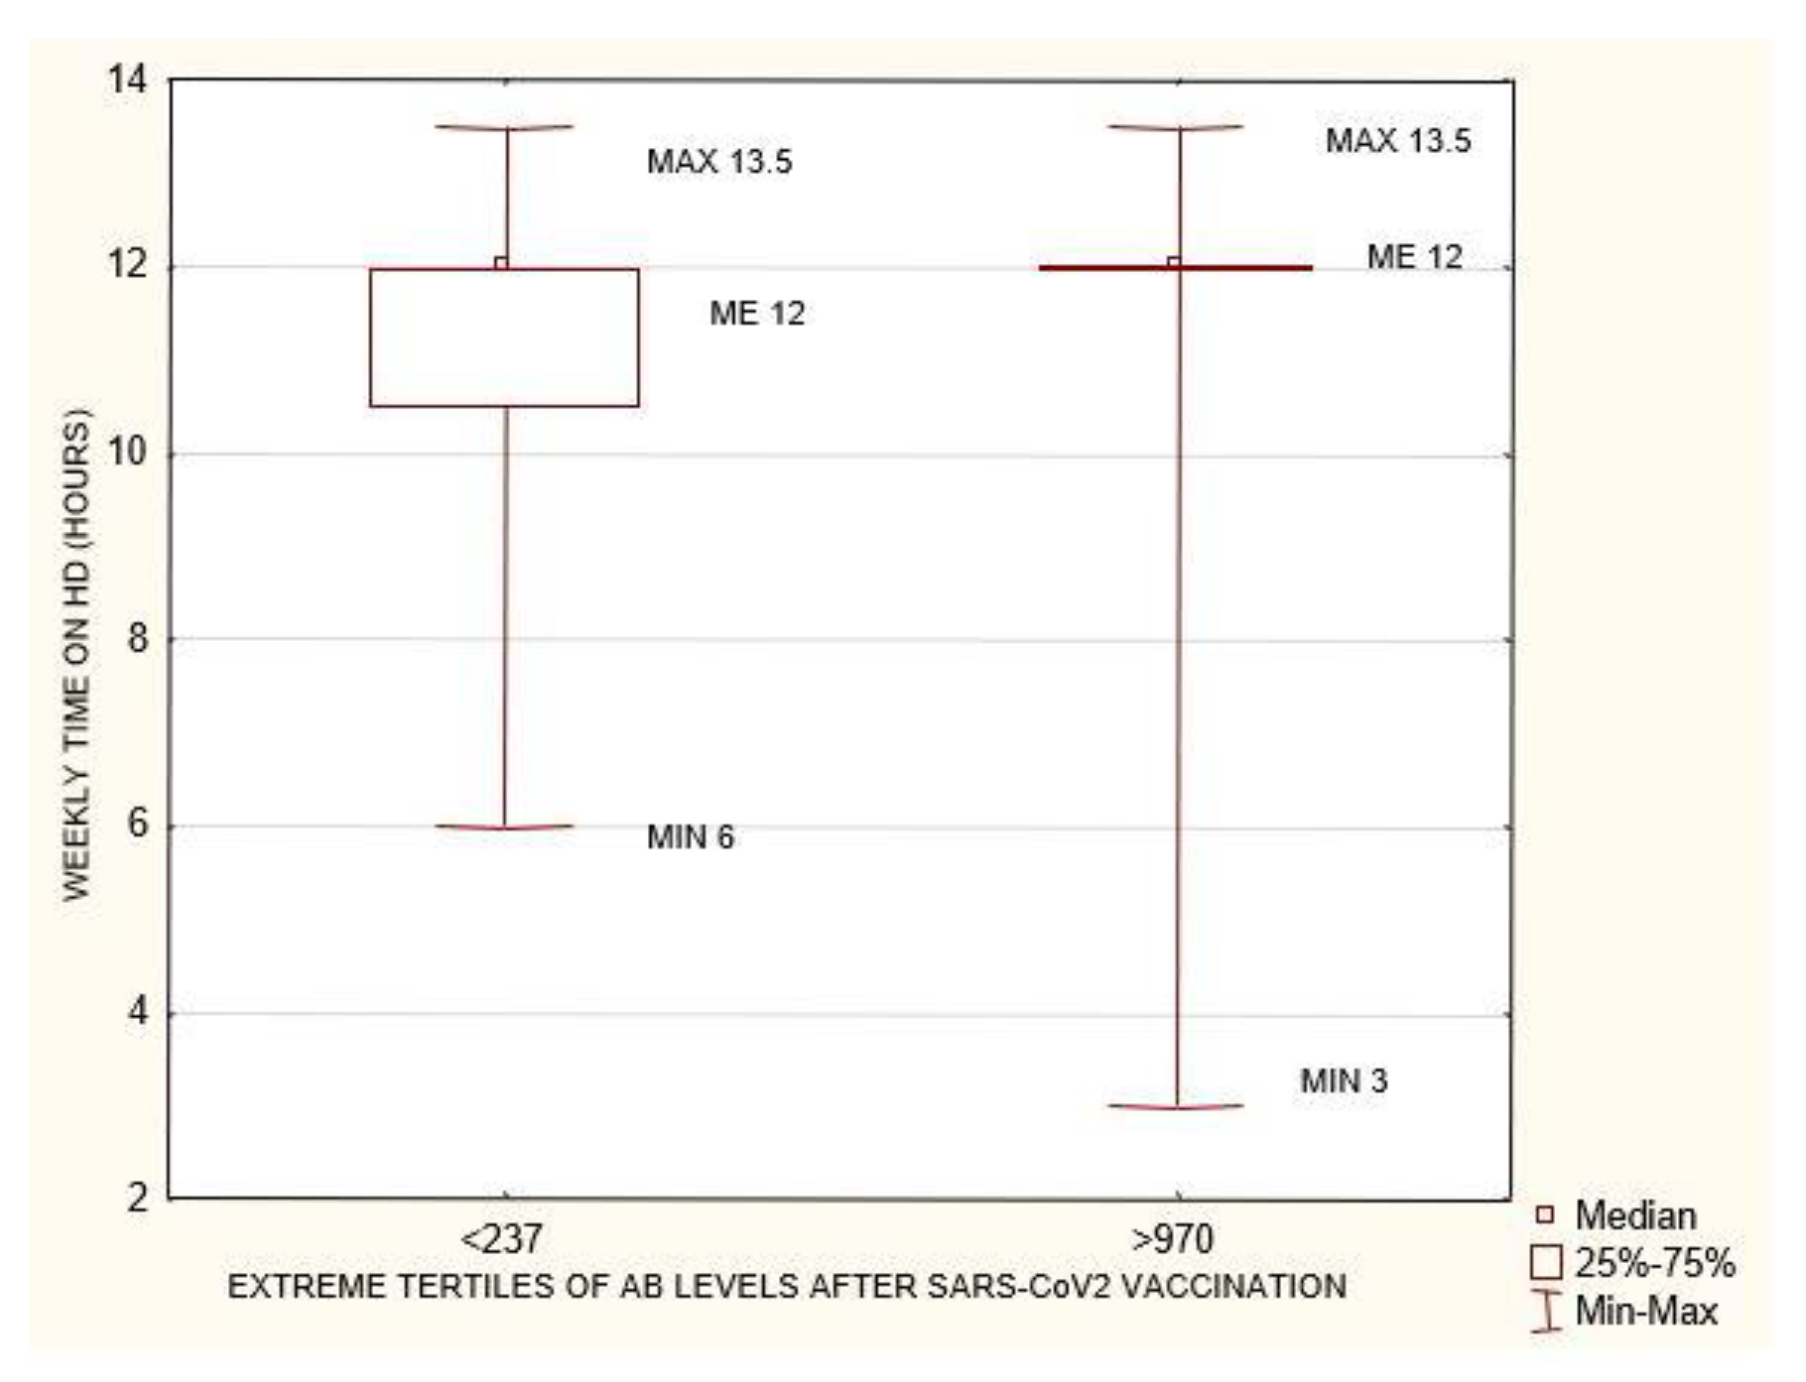
| Time of dialysis per week (hours) | 281 | 12 | 3 | 13.5 |
| BMI (kg/m2) | 281 | 27 | 15.2 | 45.5 |
| SGA-DMS | 90 | 12 | 8 | 32 |
| Albumin (g/L) | 281 | 39 | 19 | 48 |
| Transferrin (g/L) | 159 | 1.64 | 0.52 | 2.91 |
| Hgb (g/dL) | 281 | 10.8 | 6 | 15.1 |
| PTH Pg/mL) | 281 | 6.54 | 0.33 | 1148 |
| Ferritin (ng/mL) | 281 | 109 | 1 | 1367.09 |
| Lymphocytes (g/L) | 281 | 1.43 | 0.2 | 3.5 |
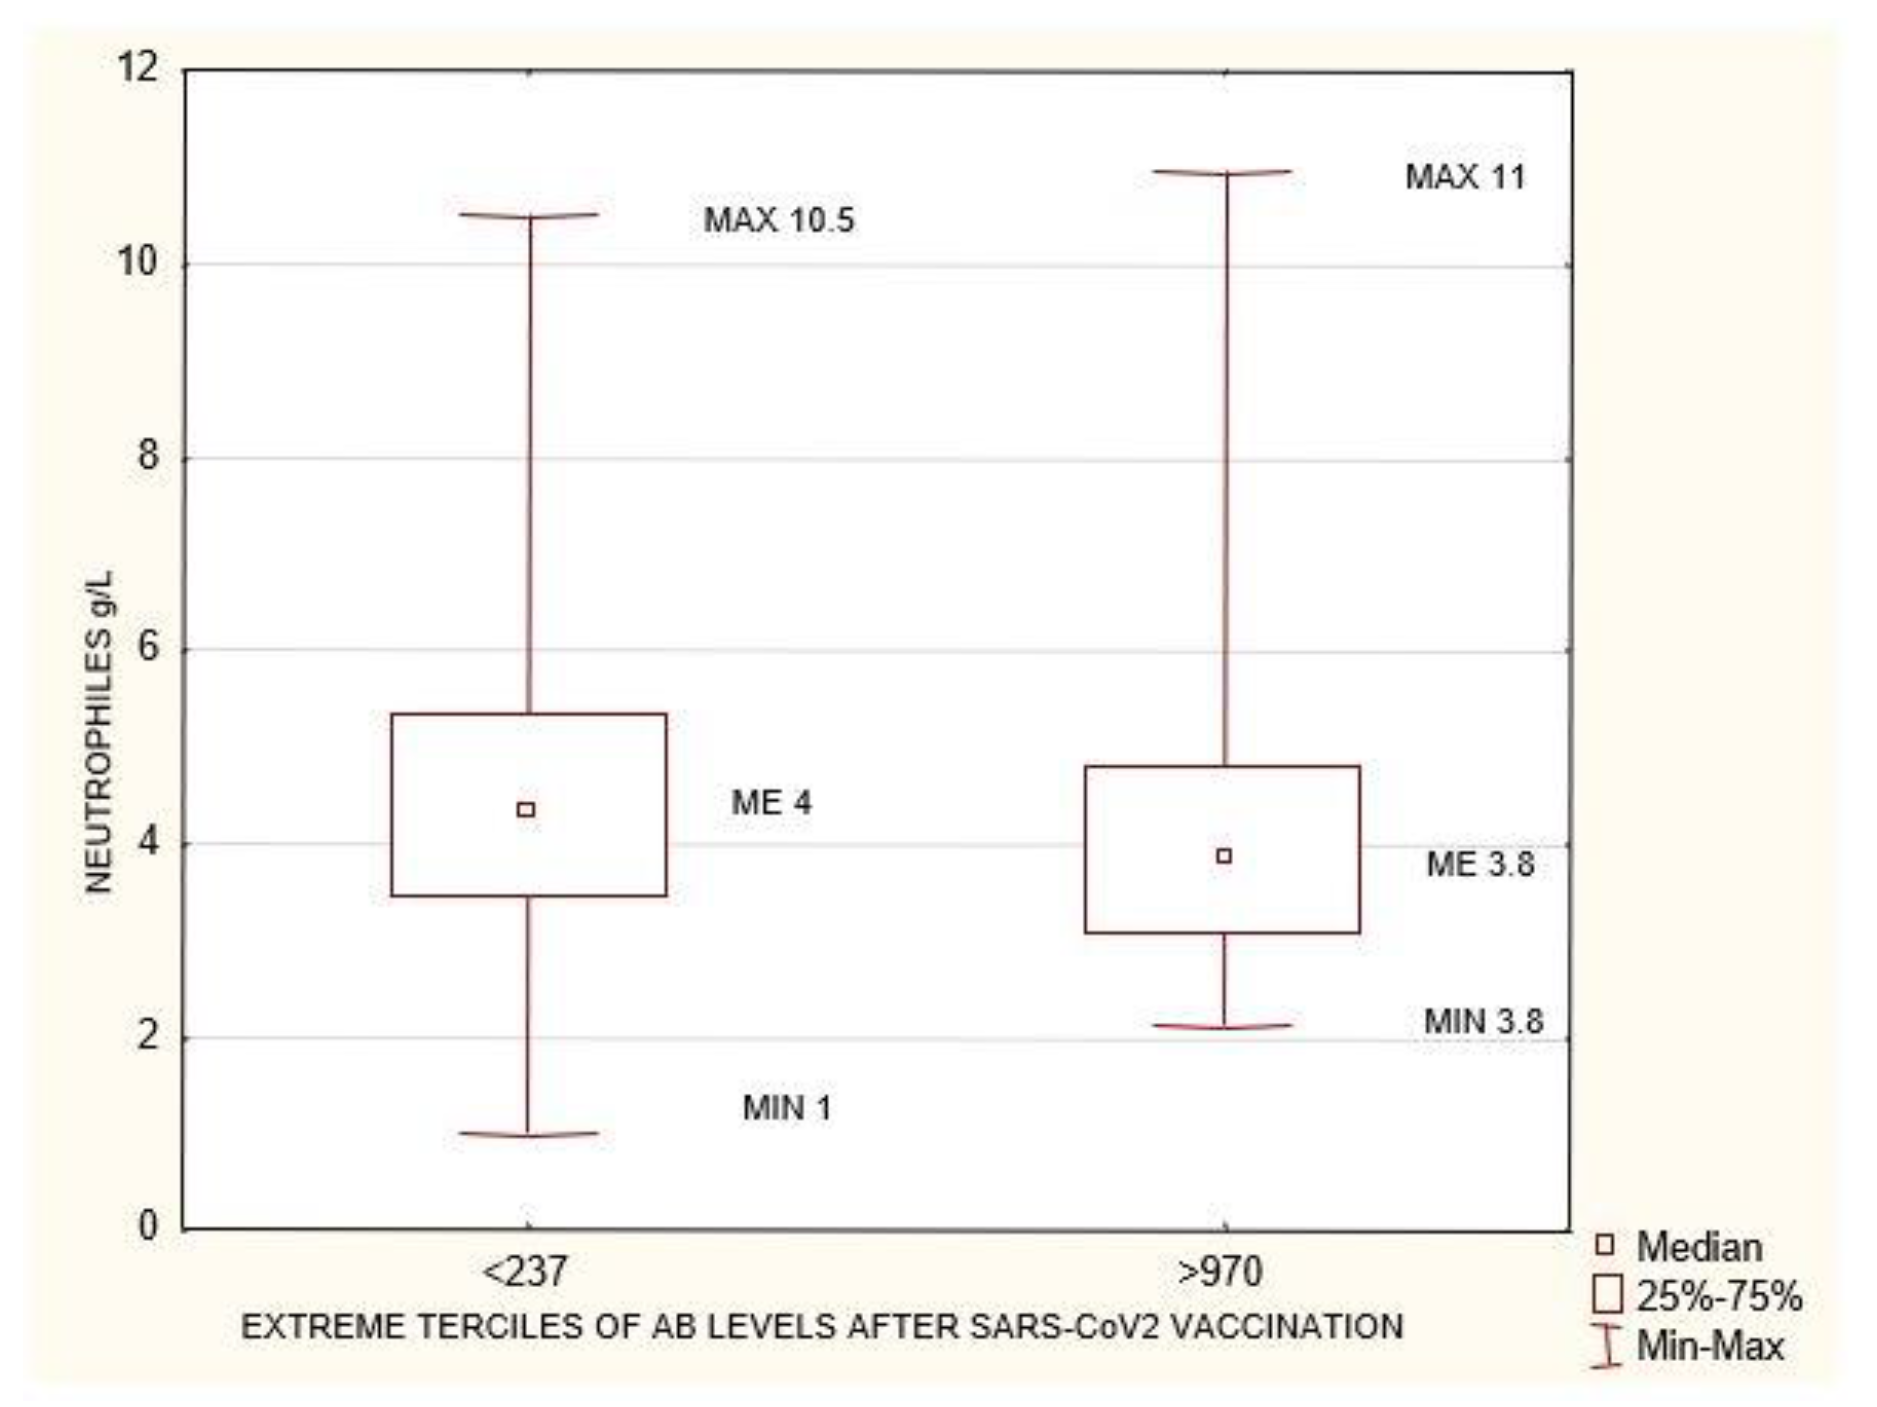
| Neutrophiles (g/L) | 281 | 4.02 | 1 | 11.75 |
| Urea before HD (mg/dL) | 281 | 111.8 | 53 | 256 |
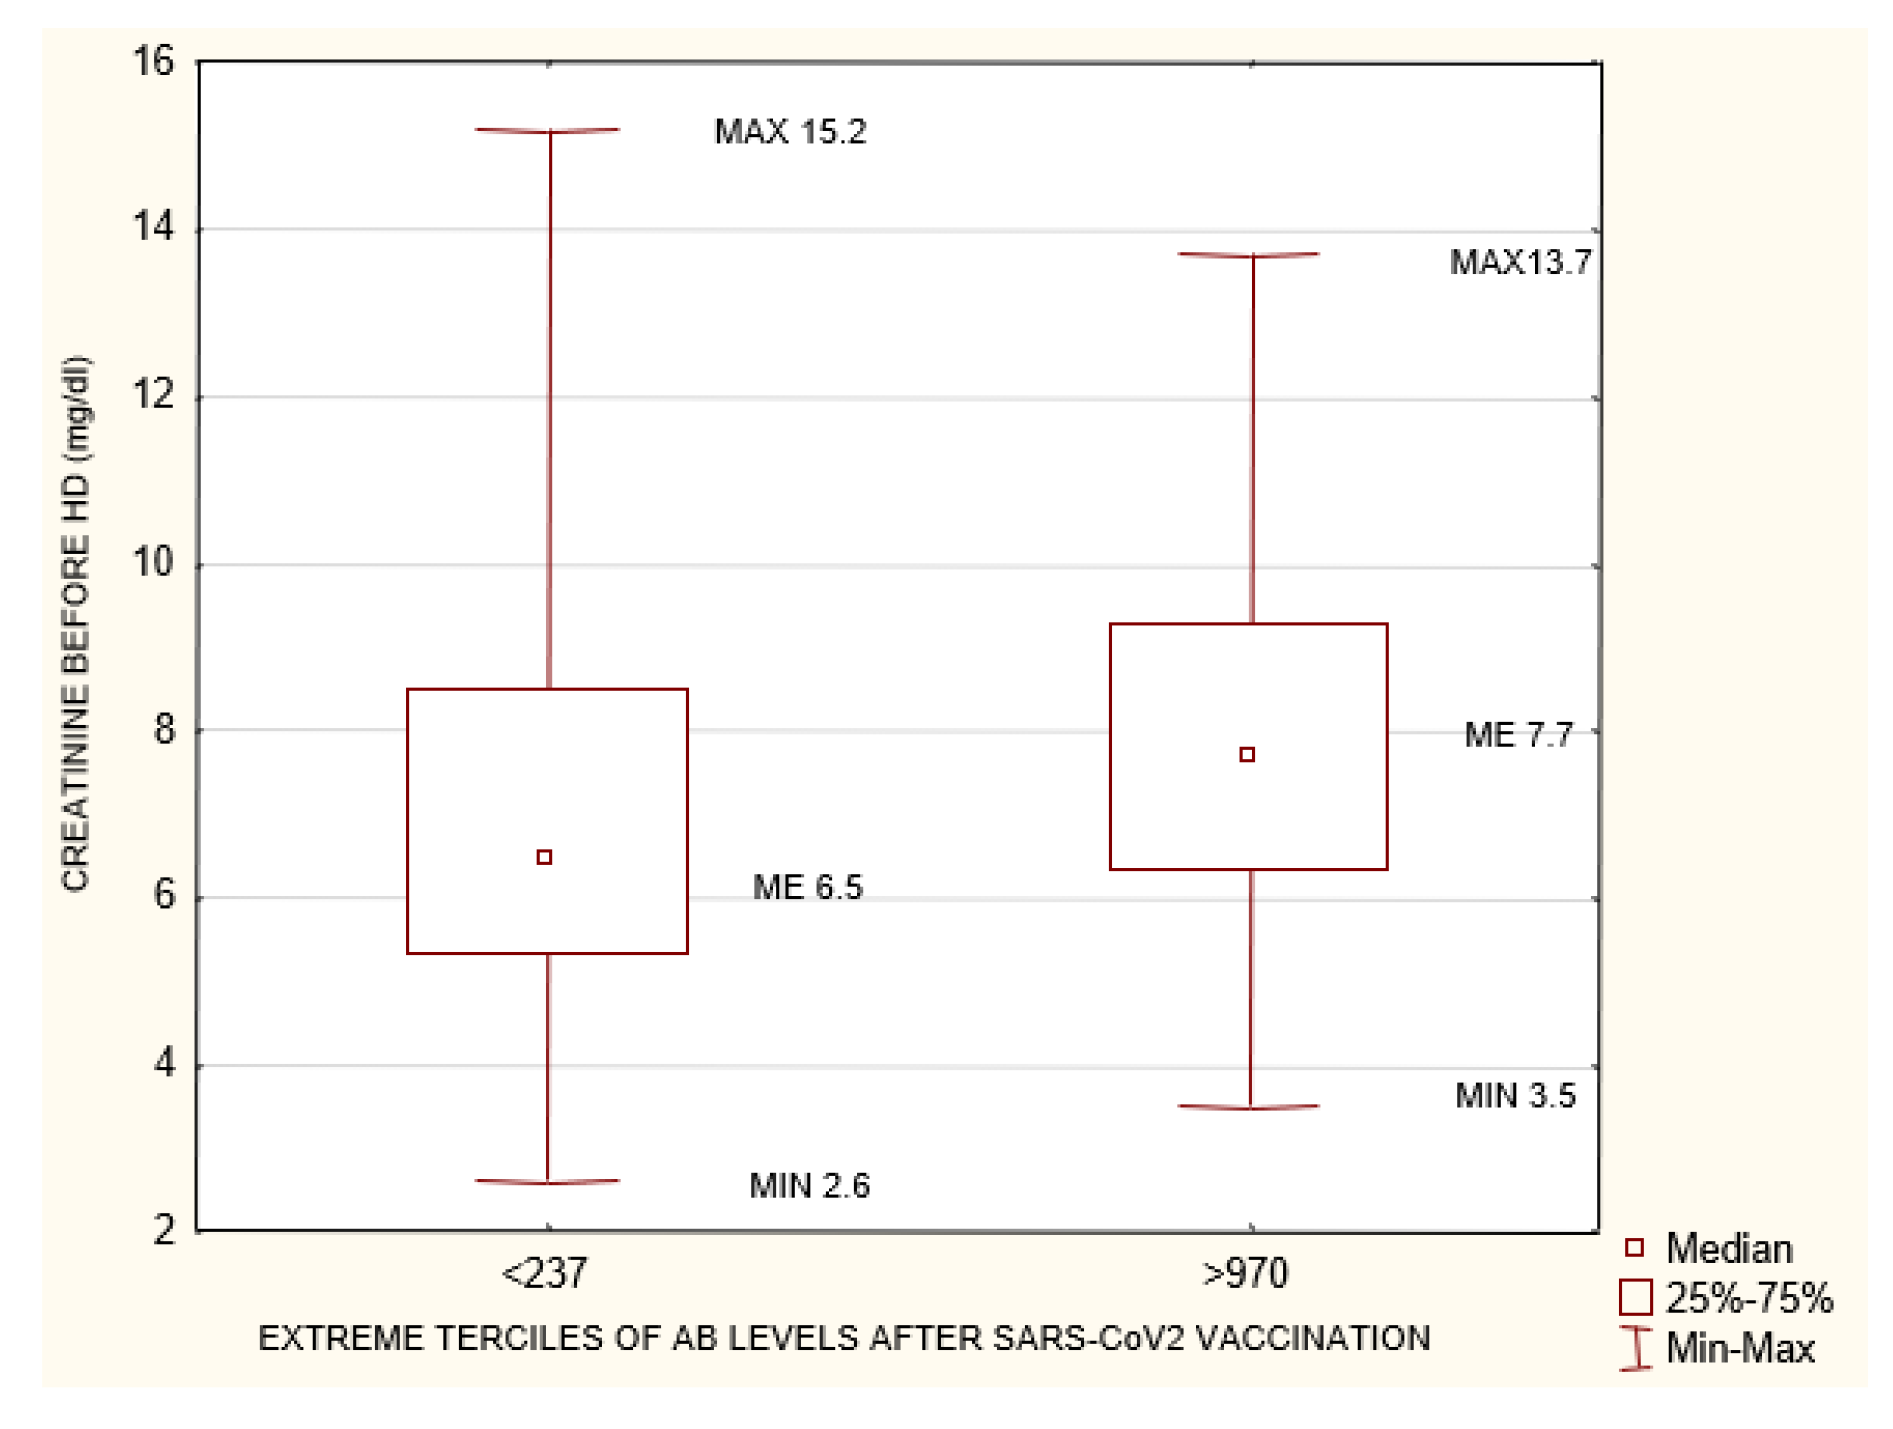
| Creatinine before HD (mg/dL) | 180 | 7.32 | 2.6 | 15.21 |
| Anti HBS antibody (mIU/mL) | 268 | 48.15 | 0 | 1000 |
| Delta of antibodies (AU/mL) | 281 | 450.46 | −5549.92 | 15,269.23 |
| Cell. Immunity Borderline Interferon Gamma 100–200 mIU/mL N = 38 | Cell. Immunity Positive Interferon Gamma >200 mIU/mL N = 146 | ||||||
|---|---|---|---|---|---|---|---|
| AB-Antibody | Me | Min | Max | Me | Min | Max | p |
| AB before vac. AU/mL | 0 | 0 | 95 | 1292.3 | 5.4 | 7423 | 0.001 |
| AB after vac. AU/mL | 255.53 | 23.4 | 5269.23 | 757.12 | 7.76 | 15,269.23 | 0.0037 |
| Death during the 6-Month Follow-Up n = 12 | No Death during the 6-Month Follow-Up n = 269 | ||||||
|---|---|---|---|---|---|---|---|
| Me | Min | Max | Me | Min | Max | p | |
| Cell Immunity 1-month post-vac. mIU/mL | 158.17 | 4.09 | 775.57 | 805.39 | 3.03 | 3535.69 | 0.007 |
| Albumin (g/L) | 36.6 | 32 | 42 | 39 | 19 | 48 | 0.019 |
| Neutrophils (g/L) | 4.785 | 3.06 | 8.63 | 4 | 1 | 11.75 | 0.04 |
| NLR | 12.88 | 3.44 | 36 | 2.92 | 0.68 | 10.33 | 0.019 |
| Creatinine before HD (mg/dL) | 5.21 | 2.6 | 9.7 | 7.45 | 3.2 | 15.21 | 0.007 |
| Time on HD per week (hours) | 10.5 | 8 | 12 | 12 | 3 | 13.5 | 0.019 |
| COVID-19 during the 6-Month Follow-Up after Vaccination n = 8 | No COVID-19 during the 6-Month Follow-Up after Vaccination n = 273 | ||||||
| Me | Min | Max | Me | Min | Max | p | |
| Hgb (g/dL) | 9.25 | 6 | 12.2 | 10.854 | 7.29 | 15.1 | 0.02 |
| Albumin (g/L) | 34.5 | 19 | 39.8 | 39 | 27 | 48 | 0.002 |
| Group 1 <570 AU/mL | Group 2 ≥570 AU/mL | ||||||
|---|---|---|---|---|---|---|---|
| Me | Min | Max | Me | Min | Max | p | |
| Cell. Immunity 1-month post-vac. mIU/mL | 264.0 | 5.7 | 2359.1 | 62 | 26 | 88 | 0.0017 |
| Age (years) | 68 | 27 | 92 | 62 | 26 | 88 | 0.04 |
Publisher’s Note: MDPI stays neutral with regard to jurisdictional claims in published maps and institutional affiliations. |
© 2022 by the authors. Licensee MDPI, Basel, Switzerland. This article is an open access article distributed under the terms and conditions of the Creative Commons Attribution (CC BY) license (https://creativecommons.org/licenses/by/4.0/).
Share and Cite
Kwiatkowska, E.; Safranow, K.; Wojciechowska-Koszko, I.; Roszkowska, P.; Dziedziejko, V.; Myślak, M.; Różański, J.; Ciechanowski, K.; Stompór, T.; Przybyciński, J.; et al. SARS-CoV-2 mRNA Vaccine-Induced Cellular and Humoral Immunity in Hemodialysis Patients. Biomedicines 2022, 10, 636. https://doi.org/10.3390/biomedicines10030636
Kwiatkowska E, Safranow K, Wojciechowska-Koszko I, Roszkowska P, Dziedziejko V, Myślak M, Różański J, Ciechanowski K, Stompór T, Przybyciński J, et al. SARS-CoV-2 mRNA Vaccine-Induced Cellular and Humoral Immunity in Hemodialysis Patients. Biomedicines. 2022; 10(3):636. https://doi.org/10.3390/biomedicines10030636
Chicago/Turabian StyleKwiatkowska, Ewa, Krzysztof Safranow, Iwona Wojciechowska-Koszko, Paulina Roszkowska, Violetta Dziedziejko, Marek Myślak, Jacek Różański, Kazimierz Ciechanowski, Tomasz Stompór, Jarosław Przybyciński, and et al. 2022. "SARS-CoV-2 mRNA Vaccine-Induced Cellular and Humoral Immunity in Hemodialysis Patients" Biomedicines 10, no. 3: 636. https://doi.org/10.3390/biomedicines10030636