1. Introduction
Adipocytes produce various mediators involved in pathogenesis of cardiovascular diseases. Adiponectin is a 28 kDa protein [
1] that plays a crucial role in vascular physiology, controls the metabolism of glucose and fatty acids, modulates insulin sensitivity, suppresses proliferation of vascular smooth muscle cells, and has a general anti-inflammatory effect, thus regulating the important components of atherogenesis [
2,
3,
4].
Adiponectin is encoded by the
ADIPOQ gene. Activity of the
ADIPOQ gene is one of the key factors contributing to production of adiponectin. Various single nucleotide polymorphisms (SNPs) of the
ADIPOQ gene are associated with the development of type 2 diabetes mellitus (T2D) [
5], metabolic syndrome [
6], and cardiovascular diseases [
4,
7]. However, associations described in various studies in different populations are variable apparently due to differences in ethnicity of the participating subjects, study design, cohort size, environmental effects, etc. [
7,
8,
9]. Only a few studies have investigated the SNPs of the
ADIPOQ gene in Russia [
10,
11]. Thus, associations of the SNPs of the
ADIPOQ gene with various pathological conditions and factors are poorly understood and require additional investigation.
We have selected five specific SNPs that were expected to influence the circulating adiponectin levels according to the OMIM database (omim.org), provided that their anticipated mean allele frequency (MAF) is more than 1%, in the European population. Associations of the selected SNPs with adiponectin levels have been previously detected in multiple studies [
5,
12,
13,
14,
15,
16,
17].
In general, the effects of specific SNPs are relatively small and significant associations are difficult to demonstrate. Moreover, certain SNPs can be linked to other SNPs forming a linkage group. Hence, reliability of SNP haplotype associations with pathological factors can be substantially improved by inclusion of linkage disequilibrium (LD) to identify the most important associations and unfavorable haplotypes.
The goal of the present study was to determine associations of five ADIPOQ SNPs (rs17300539, rs266729, rs182052, rs2241766, and rs17366743) with serum levels of adiponectin, coronary artery disease (CAD), and T2D in a cohort of Russian patients who underwent coronary angiography.
2. Materials and Methods
2.1. Subjects
At the planning stage, design of the study implied the use of available blood samples from a previously described cohort (N = 500) that included patients treated at the National Research Center for Preventive Medicine, Ministry of Healthcare of Russian Federation (Moscow, Russia) in 2011–2012. Details and characteristics have been published by us previously [
18]. A total of 447 patients from this cohort were randomly selected for SNP assessment based on the selection of the SNPs, quality of the blood sample, and specific expected mean allele frequencies to ensure sufficient power of the study.
The patients were suspected to have coronary artery disease and were subjected to transfemoral coronary angiography by the method of Judkins (GE Innova 4100IQ system, General Electric, Milwaukee, WI, USA) with subsequent transluminal balloon coronary angioplasty and stenting if required. Typical indications for angiography included positive exercise test, positive stress echocardiography, clear symptoms of advanced angina pectoris if there were contraindications for a stress test, and symptoms of unstable angina. Extent of stenosis was quantified with Advantage Workstation software version 4.4 (General Electric, Waukesha, WI, USA). Gensini score was used to estimate the extent of the lesions of coronary arteries [
19].
Exclusion criteria included previous myocardial infarction or stroke less than 6 months before the study, any acute inflammatory disease, chronic kidney failure with glomerular filtration rate below 60 mL/min/1.73 m2, diabetes mellitus type I, left ventricular ejection fraction below 40%, oncological diseases, hematological diseases with abnormal platelet count, blood coagulation disorders, immune diseases, pregnancy, and lactation.
Coronary artery disease was diagnosed in patients with unstable angina, prior myocardial infarction (over 6 months ago), prior revascularization, and positive stress test in conjunction with the Gensini score ≥ 3. Unstable angina was diagnosed based on the anamnesis, dynamics of angina progression, or signs of ischemia on electrocardiogram [
20].
T2D was diagnosed according to the WHO guidelines in patients with fasting glucose levels ≥ 7 mmol/L or glycated hemoglobin ≥ 6.5 [
21].
The study was compliant with the good clinical practice standards and the principles of the Helsinki Declaration. All participants signed an informed consent prior to enrollment. The study protocol was approved by the Ethics Committee of National Medical Research Center for Preventive Medicine.
2.2. Sample Collection and Measurements
The blood was withdrawn from the cubital vein after 12 to 14 h of fasting. Serum was prepared by centrifugation at 1000×
g for 20 min at 4 °C, aliquoted and stored at −26 °C. Total cholesterol and triglycerides were assayed using a Konelab 20i automatic analyzer (Thermo Electron Corp., Vantaa, Finland) using ELISA kits from Human (Wiesbaden, Germany). High density lipoprotein (HDL) cholesterol was assayed after precipitation of low and very low density lipoproteins. Level of low density lipoprotein (LDL) cholesterol was calculated according to the Friedewald equation in samples with serum triglycerides below 4.5 mmol/L [
22]. Blood glucose and high sensitivity C-reactive protein (hsCRP) were tested with kits from DiaSys (Holzheim, Germany) using a Sapphire 400 automatic turbidimetry analyzer (Tokyo, Japan). Insulin was measured by chemiluminescence using an Architect i2000 sr analyzer (Abbot Diagnostics, Lake Bluff, IL, USA). Homeostatic model assessment insulin resistance index (HOMA-IR) was calculated according to Equation (1):
Concentration of adiponectin was determined by an ELISA kit (BioVendor, Brno, Czech Republic).
Genomic DNA was extracted from the whole blood samples using a QIAamp® DNA blood mini kit (QIAGEN, Hilden, Germany) and stored at −20 °C until analysis. DNA concentration was measured by a Nano photometer (Implen, München, Germany).
2.3. SNP Selection
Five SNPs of the
ADIPOQ gene were selected based on the Exac database (
http://exac.broadinstitute.org/) and previous publications [
4,
5,
7,
12,
13,
14,
15,
16,
17] including rs17300539, rs182052, rs266729, rs2241766, and rs17366743, with minor allele frequency (MAF) > 1%. These polymorphisms are distributed throughout the gene and their associations with adiponectin levels or CAD and related phenotypes were demonstrated previously [
4,
5,
7,
23].
2.4. Genotyping
Sequences of the primers and probes are listed in
Table 1. Genotypes of five SNPs of the
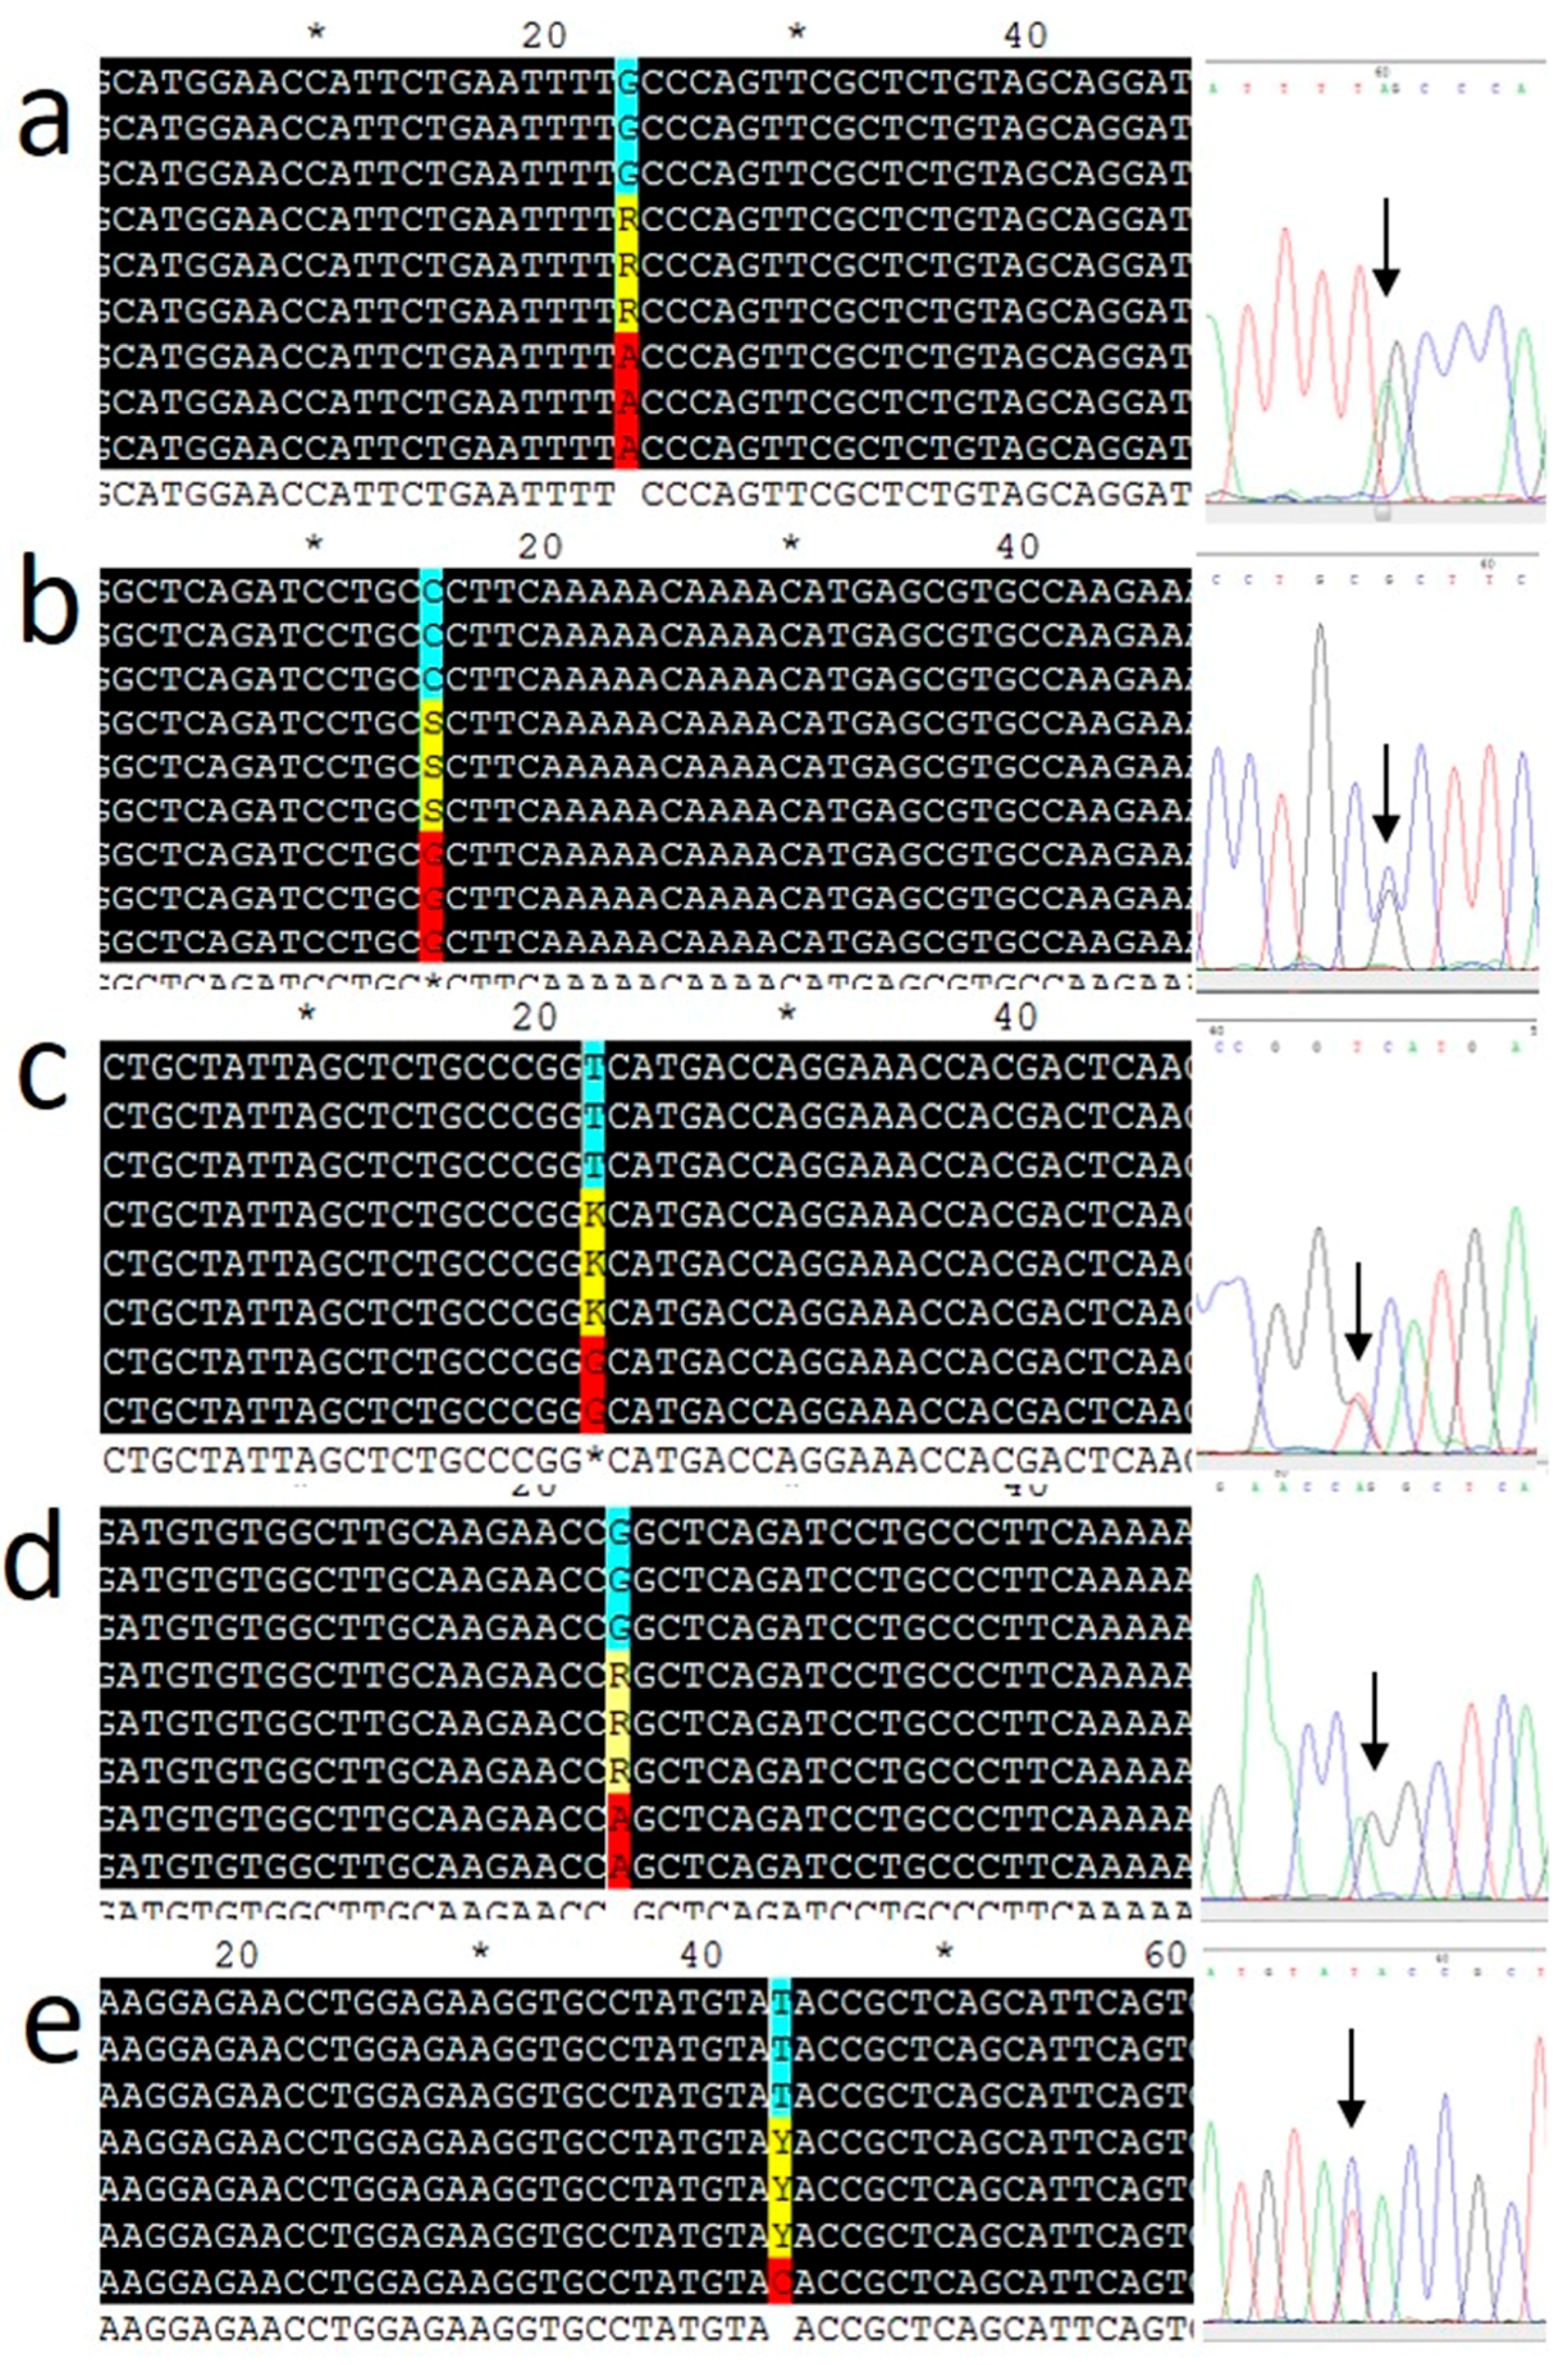
ADIPOQ gene (rs17300539, rs182052, rs266729, rs2241766, and rs17366743) were determined using an ABI-7500 fast real-time PCR system (Applied Biosystems, Thermo Fisher Scientific, Foster City, CA, USA) with TaqMan probes from Syntol (Moscow, Russia). Thermal cycling was performed as follows: 63 °C for 1 min and 95 °C for 3 min, followed by 40 cycles at 95 °C for 15 s and 63 °C for 40 s. After PCR amplification, allelic discrimination was performed using an ABI-7500 instrument. Ten percent of the samples were genotyped in duplicates. Real-time PCR data were validated in selected samples (at least three for each genotype) by Sanger sequencing of the PCR products (Genom Medicobiological Center, Moscow, Russia). The results are shown in
Figure 1. Hardy–Weinberg equilibrium (HWE) was verified for genotype frequencies by the χ
2 test [
24]. All SNPs were found to be in HWE in the cohort with an exception of rs266729 (
p = 0.001).
2.5. Statistical Analysis
Statistical data analysis was performed using R version 3.5.1.
Continuous variables with Groeneveld–Meeden (GM) skewness less than 0.2 [
25] were approximated by normal distribution and thus are presented as the mean ± SD. Continuous variables with GM skewness over 0.2 are presented as the median and interquartile range. Dichotomous categorical variables are presented as frequency and 95% confidence interval (CI). The concentrations of adiponectin, C-reactive protein, and triglycerides (TG) had the GM skewness more than 0.2, while their logarithms had the GM skewness less than 0.2. Thus, logarithms of these variables were used for calculations.
Associations between logarithm of adiponectin concentration and SNPs were estimated by multivariate linear regression models in different genetic models adjusted for the following covariates: sex, age, LDL and HDL cholesterol, logarithm of TG and hsCRP concentrations, presence of T2D and hypertension, and use of warfarin and statins. A fraction of the data was incomplete (0.2% of hsCRP levels, 0.2% of warfarin use, 3.6% of HDL levels, and less than 1.2% of other data of the lipid profile); these missing values were replaced with the median values [
26]. To assess the associations with the genotypes, additive, dominant, and recessive genetic models were used. In the additive model, all SNP genotypes were evaluated separately, including MM, Mm, and mm, where M corresponds to the major allele and m corresponds to the minor allele. In the dominant and recessive models, the heterozygote genotypes were combined with the major or minor genotypes, respectively. In analysis of SNP associations with various parameters, results of multivariate parametric methods were validated with univariate nonparametric methods.
p < 0.05 was used to indicate statistical significance. The associations with categorical variables representing diseases were calculated as odds ratio (OR) and their significance was estimated by Fisher’s exact test.
Heavily-tailed parametric distributions may be unstable. Therefore, we decided to additionally validate the models using a nonparametric test. Moreover, adjustment for covariates may interfere with assessment of the SNP associations. Specific justification is similar to that outlined previously in a relevant study [
27].
The results of the regression analysis were validated by the Mann–Whitney test for dominant and recessive models and adjusted for multiple comparisons by the Westfall and Young method [
28] using the multtest module for R [
29]. The maximum variance inflation factor for the covariates list was 1.4, which indicates no significant linear dependence between the covariates [
30]. Associations between the prevalence of various diseases and SNPs were estimated by multivariate logistic regression with adjustment for the previous list of covariates. The results were validated by the exact Fisher test and adjusted for multiple comparisons by the Holm method.
Linkage disequilibrium was visualized using the Haploview software version 4.2 [
31]. The haplotypes were constructed using the Plink software [
32]. Multivariate linear and logistic regressions with adjustment for previous list of covariates were used to estimate associations of the haplotypes with adiponectin levels and CAD under assumption of additive haplotypes effect. A haplotype with the highest frequency was selected as the reference.
3. Results
3.1. Subject Characteristics and Genotyping
The study included 447 thoroughly examined subjects; mean age 61 ± 9 years. Baseline clinical assessment, biochemical parameters, diagnosis, and medications are shown in
Table 2. A total of 64% (N = 286) of the participants were diagnosed with coronary artery disease. The cohort included patients with unstable angina (4.9%; N = 22), T2D patients (17.2%; N = 77), and subjects with arterial hypertension (81.4%; N = 364). Details of the clinical assessment of the cohort have been published previously [
33].
The genotypes of the rs17366743, rs17300539, rs266729, rs182052, and rs2241766 SNPs of the
ADIPOQ gene were determined and the results are shown in
Table 3. MAFs of the SNPs observed in the study are within the range of MAFs of European populations.
3.2. Associations of the ADIPOQ SNPs with Serum Concentrations of Adiponectin
The results of analysis of associations between the SNPs and the circulating adiponectin levels for the most significant genetic models are listed in
Table 4.
Regression analysis showed significant association of rs182052 and logarithm of adiponectin concentrations (β = −0.11; 95% CI: −0.19, −0.03; p = 0.016). This value is equivalent to a 1.12-fold (1.03–1.21) decrease in the adiponectin levels per copy of the minor A allele. The univariate nonparametric analysis by Mann–Whitney test showed that the rs182052 and rs266729 SNPs are associated with adiponectin concentrations in the dominant and recessive models, respectively. The subjects with the GG genotype (N = 53) of the rs266729 SNP had lower adiponectin concentrations than that in the subjects with the C allele (CC (N = 240) plus CG (N = 154) genotypes). The median adiponectin levels were 6.77 µg/mL (25% 4.97; 75% 9.54) and 7.95 µg/mL (25% 5.80; 75% 12.16) in the subjects with the GG and CC+CG genotypes of rs266729, respectively, and the differences were statistically significant (p = 0.04). The subjects with the GG genotype (N = 177) of the rs182052 SNP had higher levels of adiponectin than that in the subjects with the A allele (GA (N = 196) plus AA (N = 74) genotypes). The adiponectin levels were 8.07 µg/mL (25% 6.1; 75% 12.61) and 7.68 µg/mL (25% 5.35; 75% 10.73) in the subjects with the GG and GA+AA genotypes of rs182052, respectively, and the differences were statistically significant (p = 0.034).
No significant associations of rs17300539, rs2241766, and rs17366743 SNPs of the ADIPOQ gene with adiponectin concentrations were detected due to insufficient statistical power.
3.3. Associations of the rs266729 and rs182052 SNPs with CAD and T2D
Associations of the rs266729 and rs182052 with various diseases were analyzed because these SNPs were associated with adiponectin concentrations. The results are presented in
Table 5. Regression analysis of rs182052 showed that the prevalence of unstable angina was significantly increased by 2.55-fold (95%CI 1.4–4.82;
p = 0.018) and the prevalence of CAD was significantly increased by 1.55-fold (95%CI 1.15–2.09;
p = 0.021) per copy of the A allele. These associations were confirmed by Fisher’s exact test that detected significantly increased prevalence of unstable angina and CAD in the subjects with the AA genotype of the rs182052 compared with that in the GG and GA genotypes carriers (OR = 3.11; 95%CI 1.20–7.56;
p = 0.017 and OR = 1.93; 95%CI 1.07–3.64;
p = 0.024, respectively).
Prevalence of type T2D was higher in the subjects with the A allele of the rs182052 SNP (OR = 2.29; 95%CI 1.29–4.21,
p = 0.024) and the association was confirmed by Fisher’s exact tests (OR = 2.1; 95%CI 1.23–3.71;
p = 0.007) (
Table 5).
Regression analysis of rs266729 showed that prevalence of unstable angina was increased by 3.59-fold (95%CI 1.17–10.01; p = 0.045) in the subjects with the GG genotype and prevalence of CAD was significantly increased by 1.48-fold (95%CI 1.09–2.03; p = 0.045) per copy of the G allele. These associations were confirmed by Fisher’s exact test that detected significantly increased prevalence of unstable angina and CAD in the subjects with the GG genotype of the rs266729 SNP compared with that in the CC and CG genotypes carriers (OR = 3.02; 95%CI 1.04–7.74; p = 0.035 and OR = 2.07; 95%CI 1.03–4.48; p = 0.033, respectively).
3.4. Haplotype Analysis
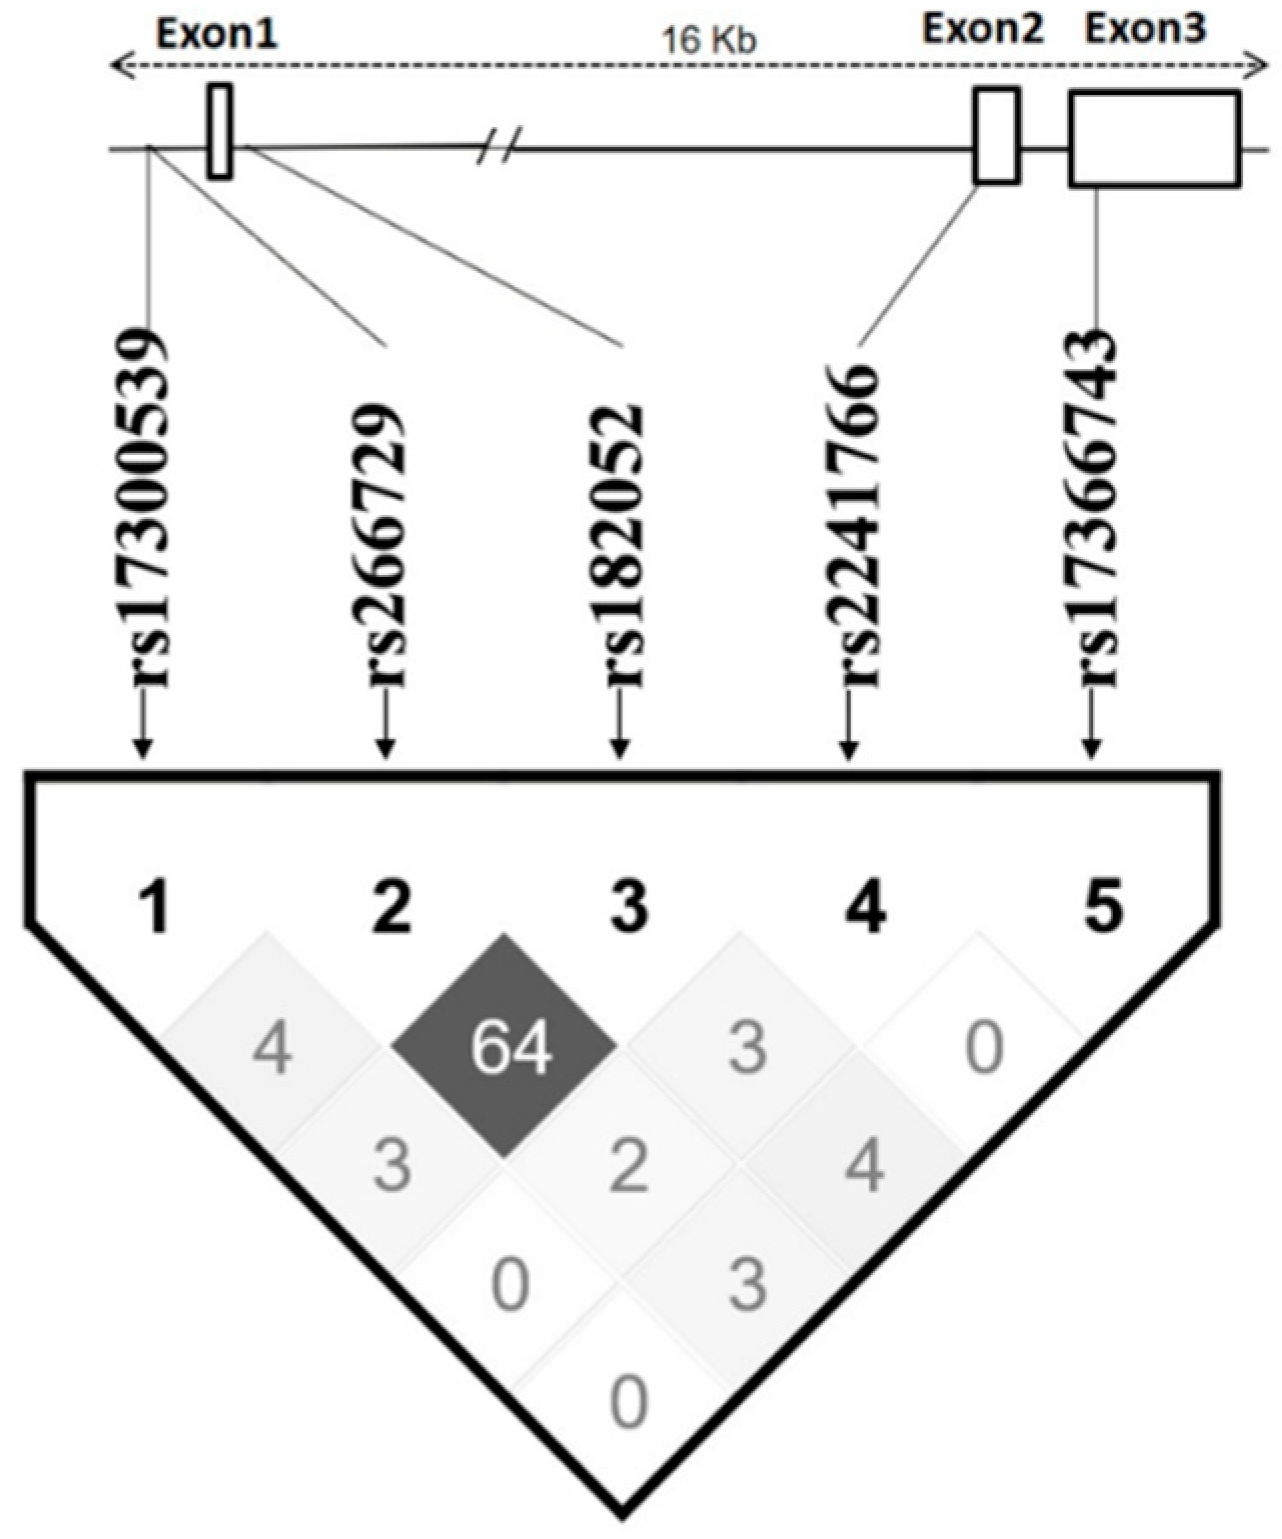
Two SNPs, rs266729 and rs182052, are highly linked with each other (Dʹ > 0.8; r
2 = 0.64), while other SNPs are apparently independent (
r2 < 0.05) (
Figure 2). Haplotypes were constructed using all five SNPs according to their position in the
ADIPOQ gene as follows: rs17300539, rs266729, rs182052, rs2241766, and rs17366743. Five haplotypes had frequency >5% and were analyzed as shown in
Table 6. The GCGTT haplotype had the highest frequency (48.7%) and was selected as the reference.
The results of regression analysis indicate that the subjects with the second in frequency GGATT haplotype (27.4%) had lower adiponectin levels (β= −0.094; p = 0.047) and higher prevalence of unstable angina (OR = 2.054; p = 0.041). Moreover, these subjects had higher prevalence of coronary artery disease (OR = 1.546; p = 0.014).
Subjects with the GCATT haplotype (9.8%) were characterized by lower adiponectin levels (β= −0.15; p = 0.042) and higher prevalence of unstable angina (OR = 3.597; p = 0.007).
4. Discussion
The results of the present study demonstrate that the rs266729 and rs182052 SNPs of the
ADIPOQ gene are significantly associated with the circulating levels of adiponectin. Moreover, the minor alleles of these SNPs are associated with the prevalence of coronary artery disease including unstable angina and T2D. These associations may be explained by the antiatherogenic effects of the product of the
ADIPOQ gene, adiponectin, which regulates vascular endothelial cells and promotes insulin sensitivity [
34]. These considerations are indirectly confirmed in the present study which demonstrated significantly lower levels of adiponectin in patients with unstable angina in agreement with the data of meta-analysis [
35].
The effects of the rs182052 SNP, which is located in intron 1 of the
ADIPOQ gene, on the circulating adiponectin levels may be due to a disruption or loss of the Sp1-binding site and a gain of a C/EBP-β-binding site, which may influence the regulation of the expression of the
ADIPOQ gene [
36,
37,
38]. The effects of the rs266729 SNP may be mediated by changes in the activity of the
ADIPOQ gene promoter because the minor G allele has been shown to influence DNA-binding activity of the promoter in a 3T3-L1 adipocyte model [
39]. Moreover, the minor G allele of the rs266729 SNP may result in a loss of the stimulatory Sp1-binding site [
40].
The results of meta-analysis revealed a number of contradictions with regard to associations of the rs266729 SNP and cardiovascular morbidity [
7,
8]. Apparently, associations between various SNPs and adiponectin concentrations are manifested differentially depending on the ethnic background of recruited cohorts of the subjects. In our study, the rs266729 and rs182052 SNPs were significantly associated with adiponectin levels which are in a perfect agreement with the data [
36] obtained in a Chinese population. It should be noted that rs182052 SNP was shown to be associated with adiponectin levels in a European population [
4].
Rare, low-frequency SNPs of the
ADIPOQ gene are poorly studied due to complexity of recruitment of a representative group of subjects with sufficient number of specific minor alleles. For example, the nonsynonymous rs17366743 SNP (MAF < 1.5%) has been shown to be associated with prevalence of T2D and fasting glucose levels, while no significant associations with the circulating adiponectin levels were found [
5]. A Framingham Offspring Study [
5] demonstrated a significant association of the rs17300539 SNP with adiponectin levels. These SNPs (rs17366743 and rs17300539) were used in the present study and were not associated with adiponectin levels in our cohort. The lack of associations may be due to insufficient power of the present study, which was limited by the number of participants.
We have observed significant linkage between the rs266729 and rs182052 SNPs. Haplotype analysis indicates that the minor allele of the rs266729 SNP is linked with the minor allele of the rs182052 SNP to yield the GGATT haplotype (27.4% frequency). Thus, we were unable to differentiate the effects of these two SNPs directly. However, indirect evidence suggests that certain differences may be possible. For example, the GCATT haplotype (9.8% frequency) includes only the minor allele of the rs182052 SNP and has a more pronounced association with the levels of adiponectin and higher prevalence of unstable angina than those in the subjects with the GGATT haplotype. However, the GGATT haplotype demonstrated a significant association with the prevalence of coronary artery disease, which was higher than that of the GCATT haplotype apparently due to the presence of two minor alleles of the rs266729 and rs182052 SNPs.
5. Conclusions
We found that the minor A allele of rs182052 of the ADIPOQ gene is significantly associated with a decrease in serum adiponectin levels, and two SNPs (rs182052 and rs266729) of the ADIPOQ gene are significantly associated with cardiovascular and metabolic diseases.
Author Contributions
Conceptualization, A.M.; methodology, A.K. (Anna Kiseleva); formal analysis, V.K. and E.Y.; investigation, S.S., M.K. and O.S.; resources, M.K. and A.K. (Anna Kiseleva); writing—original draft preparation, S.S. and M.K.; writing—review and editing, A.K. (Alexander Kots), N.G., A.K. (Anna Kiseleva), O.D. and V.M.; visualization, V.K.; supervision, N.G., A.E., V.M., and A.M.; project administration, N.G., A.K. (Anna Kiseleva); funding acquisition, M.K. and O.D.
Funding
The reported study was funded by RFBR research project No. 18-315-00272.
Conflicts of Interest
The authors declare no conflict of interest.
References
- Shimada, K.; Miyazaki, T.; Daida, H. Adiponectin and atherosclerotic disease. Clin. Chim. Acta 2004, 344, 1–12. [Google Scholar] [CrossRef]
- Ntaios, G.; Gatselis, N.K.; Makaritsis, K.; Dalekos, G.N. Adipokines as mediators of endothelial function and atherosclerosis. Atherosclerosis 2013, 227, 216–221. [Google Scholar] [CrossRef]
- Shehzad, A.; Iqbal, W.; Shehzad, O.; Lee, Y.S. Adiponectin: Regulation of its production and its role in human diseases. Hormones 2012, 11, 8–20. [Google Scholar] [CrossRef] [PubMed]
- Wassel, C.L.; Pankow, J.S.; Rasmussen-Torvik, L.J.; Li, N.; Taylor, K.D.; Guo, X.; Goodarzi, M.O.; Palmas, W.R.; Post, W.S. Associations of SNPs in ADIPOQ and subclinical cardiovascular disease in the multi-ethnic study of atherosclerosis (MESA). Obesity 2011, 19, 840–847. [Google Scholar] [CrossRef] [PubMed]
- Hivert, M.F.; Manning, A.K.; McAteer, J.B.; Florez, J.C.; Dupuis, J.; Fox, C.S.; O’Donnell, C.J.; Cupples, L.A.; Meigs, J.B. Common Variants in the Adiponectin Gene (ADIPOQ) Associated with Plasma Adiponectin Levels, Type 2 Diabetes, and Diabetes-Related Quantitative Traits. Diabetes 2008, 57, 3353–3359. [Google Scholar] [CrossRef] [PubMed]
- Ferguson, J.F.; Phillips, C.M.; Tierney, A.C.; Pérez-Martínez, P.; Defoort, C.; Helal, O.; Lairon, D.; Planells, R.; Shaw, D.I.; Lovegrove, J.A.; et al. Gene-nutrient interactions in the metabolic syndrome: Single nucleotide polymorphisms in ADIPOQ and ADIPOR1interact with plasma saturated fatty acids to modulate insulin resistance. Am. J. Clin. Nutr. 2009, 91, 794–801. [Google Scholar] [CrossRef]
- Hou, H.; Ge, S.; Zhao, L.; Wang, C.; Wang, W.; Zhao, X.; Sun, Z. An Updated Systematic Review and Meta-analysis of Association Between Adiponectin Gene Polymorphisms and Coronary Artery Disease. OMICS J. Integr. Boil. 2017, 21, 340–351. [Google Scholar] [CrossRef]
- Kanu, J.S.; Qiu, S.; Cheng, Y.; Li, R.; Kou, C.; Gu, Y.; Bai, Y.; Shi, J.; Li, Y.; Liu, Y.; et al. Associations between three common single nucleotide polymorphisms (rs266729, rs2241766, and rs1501299) of ADIPOQ and cardiovascular disease: A meta-analysis. Lipids Health Dis. 2018, 17, 126. [Google Scholar] [CrossRef]
- Anagnostis, P.; Athyros, V.G.; Kita, M.; Karagiannis, A. Is there any association between adiponectin gene polymorphisms and cardiovascular disease? Angiology 2013, 64, 253–256. [Google Scholar] [CrossRef] [PubMed]
- Potapov, V.A.; Chistiakov, D.A.; Dubinina, A.; Shamkhalova, M.S.; Shestakova, M.V.; Nosikov, V.V. Adiponectin and Adiponectin Receptor Gene Variants in Relation to Type 2 Diabetes and Insulin Resistance-Related Phenotypes. Rev. Diabet. Stud. 2008, 5, 28–37. [Google Scholar] [CrossRef] [PubMed] [Green Version]
- Korytina, G.F.; Akhmadishina, L.Z.; Kochetova, O.V.; Aznabaeva, Y.G.; Zagidullin, S.Z.; Victorova, T.V. Inflammatory and Immune Response Genes Polymorphisms are Associated with Susceptibility to Chronic Obstructive Pulmonary Disease in Tatars Population from Russia. Biochem. Genet. 2016, 54, 388–412. [Google Scholar] [CrossRef] [PubMed]
- Gao, H.; Fall, T.; van Dam, R.M.; Flyvbjerg, A.; Zethelius, B.; Ingelsson, E.; Hägg, S. Evidence of a causal relationship between adiponectin levels and insulin sensitivity: A Mendelian randomization study. Diabetes 2013, 62, 1338–1344. [Google Scholar] [CrossRef] [PubMed]
- Menzaghi, C.; Salvemini, L.; Concetta De Bonis, P.; Fini, G.; Doria, A.; Trischitta, V. Circulating HMW adiponectin isoform is heritable and shares a common genetic background with insulin resistance in non diabetic white Caucasians from Italy: Evidence from a family-based study. J. Intern. Med. 2010, 267, 287–294. [Google Scholar] [CrossRef] [PubMed]
- Dhillon, P.K.; Penney, K.L.; Schumacher, F.; Rider, J.R.; Sesso, H.D.; Pollak, M.; Mucci, L.A. Common polymorphisms in the adiponectin and its receptor genes, adiponectin levels and the risk of prostate cancer. Cancer Epidemiol. Prev. Biomark. 2011, 20, 2618–2627. [Google Scholar] [CrossRef]
- Han, L.Y.; Wu, Q.H.; Jiao, M.L.; Hao, Y.H.; Liang, L.B.; Gao, L.J.; Kang, Z. Associations between single-nucleotide polymorphisms (+ 45T> G,+ 276G> T,− 11377C> G,− 11391G> A) of adiponectin gene and type 2 diabetes mellitus: A systematic review and meta-analysis. Diabetologia 2011, 54, 2303–2314. [Google Scholar] [CrossRef] [PubMed]
- Guzman-Ornelas, M.O.; Chavarria-Avila, E.; Munoz-Valle, J.F.; Armas-Ramos, L.E.; Castro-Albarran, J.; Aldrete, M.E.; Oregon-Romero, E.; Vazquez-Del Mercado, M.; Navarro-Hernandez, R.E. Association of ADIPOQ+ 45T> G polymorphism with body fat mass and blood levels of soluble adiponectin and inflammation markers in a Mexican-Mestizo population. Diabetes Metab. Syndr. Obes. Targets Ther. 2012, 5, 369. [Google Scholar] [CrossRef]
- Ramya, K.; Ayyappa, K.A.; Ghosh, S.; Mohan, V.; Radha, V. Genetic association of ADIPOQ gene variants with type 2 diabetes, obesity and serum adiponectin levels in south Indian population. Gene 2013, 532, 253–262. [Google Scholar] [CrossRef] [PubMed]
- Gumanova, N.G.; Gavrilova, N.E.; Chernushevich, O.I.; Kots, A.Y.; Metelskaya, V.A. Ratios of leptin to insulin and adiponectin to endothelin are sex-dependently associated with extent of coronary atherosclerosis. Biomarkers 2017, 22, 239–245. [Google Scholar] [CrossRef] [PubMed]
- Gensini, G.G. A more meaningful scoring system for determining the severity of coronary heart disease. Am. J. Cardiol. 1983, 51, 606. [Google Scholar] [CrossRef]
- Hamm, C.W.; Bassand, J.P.; Agewall, S.; Boersma, E.; Bueno, H.; Caso, P.; Dudek, D.; Gielen, S.; Huber, K.; Ohman, M.; et al. ESC Guidelines for the management of acute coronary syndromes in patients presenting without persistent ST-segment elevation: The Task Force for the management of acute coronary syndromes (ACS) in patients presenting without persistent ST-segment elevation of the European Society of Cardiology (ESC). Eur. Heart J. 2011, 32, 2999–3054. [Google Scholar] [CrossRef] [Green Version]
- World Health Organization. Use of Glycated Haemoglobin (HbA1c) in the Diagnosis of Diabetes Mellitus: Abbreviated Report of a WHO Consultation; WHO Guidelines Approved by the Guidelines Review Committee; World Health Organization: Geneva, Switzerland, 2011. [Google Scholar]
- Friedewald, W.T.; Levy, R.I.; Fredrickson, D.S. Estimation of the concentration of low-density lipoprotein cholesterol in plasma, without use of the preparative ultracentrifuge. Clin. Chem. 1972, 18, 499–502. [Google Scholar] [PubMed]
- Shen, D.; Xing, S.; Chen, C. Adiponectin gene polymorphisms contributes to ischemic stroke risk: A meta-analysis. J. Renin Angiotensin Aldosterone Syst. 2015, 16, 178–184. [Google Scholar] [CrossRef] [PubMed]
- Rodriguez, S.; Gaunt, T.R.; Day, I.N.M. Hardy-Weinberg equilibrium testing of biological ascertainment for Mendelian randomization studies. Am. J. Epidemiol. 2009, 169, 505–514. [Google Scholar] [CrossRef] [PubMed]
- Groeneveld, R.A.; Meeden, G. Measuring Skewness and Kurtosis. J. R. Stat. Soc. Ser. D Stat. 1984, 33, 391–399. [Google Scholar] [CrossRef]
- Zhang, Z. Missing data imputation: Focusing on single imputation. Ann. Transl. Med. 2016, 4, 9. [Google Scholar] [CrossRef] [PubMed]
- Hart, A. Mann–Whitney test is not just a test of medians: Differences in spread can be important. BMJ 2001, 323, 391–393. [Google Scholar] [CrossRef] [PubMed]
- Westfall, P.H.; Young, S.S. Resampling-Based Multiple Testing: Examples and Methods for p-Value Adjustment; John Wiley & Sons: Hoboken, NJ, USA, 1993; Volume 279. [Google Scholar]
- Pollard, K.S.; Dudoit, S.; Van Der Laan, M.J. Multiple Testing Procedures: The multtest Package and Applications to Genomics. In Nonclinical Statistics for Pharmaceutical and Biotechnology Industries; Springer Science and Business Media LLC: New York, NY, USA, 2005; pp. 249–271. [Google Scholar]
- Sheather, S. A Modern Approach to Regression with R; Springer Science and Business Media LLC: New York, NY, USA, 2009. [Google Scholar]
- Barrett, J.; Fry, B.; Maller, J.; Daly, M.J. Haploview: Analysis and visualization of LD and haplotype maps. Bioinformatics 2004, 21, 263–265. [Google Scholar] [CrossRef]
- Purcell, S.; Neale, B.; Todd-Brown, K.; Thomas, L.; Ferreira, M.A.; Bender, D.; Sham, P.C. PLINK: A tool set for whole-genome association and population-based linkage analyses. Am. J. Hum. genet. 2007, 81, 559–575. [Google Scholar] [CrossRef] [PubMed]
- Klimushina, M.V.; Gumanova, N.G.; Kutsenko, V.A.; Divashuk, M.G.; Smetnev, S.A.; Kiseleva, A.V.; Metelskaya, V.A.; Meshkov, A.N. Association of common polymorphisms in IL-6 and IL6ST genes with levels of inflammatory markers and coronary stenosis. Meta Gene 2019, 21, 100593. [Google Scholar] [CrossRef]
- Guerre-Millo, M. Adiponectin: An update. Diabetes Metab. 2008, 34, 12–18. [Google Scholar] [CrossRef]
- Zhang, H.; Mo, X.; Hao, Y.; Gu, D. Association between polymorphisms in the adiponectin gene and cardiovascular disease: A meta-analysis. BMC Med. Genet. 2012, 13, 40. [Google Scholar] [CrossRef] [PubMed]
- Tong, G.; Wang, N.; Leng, J.; Tong, X.; Shen, Y.; Yang, J.; Ye, X.; Zhou, L.; Zhou, Y. Common variants in adiponectin gene are associated with coronary artery disease and angiographical severity of coronary atherosclerosis in type 2 diabetes. Cardiovasc. Diabetol. 2013, 12, 67. [Google Scholar] [CrossRef] [PubMed]
- Qiao, L.; MacLean, P.S.; Schaack, J.; Orlicky, D.J.; Darimont, C.; Pagliassotti, M.; Friedman, J.E.; Shao, J. C/EBP Regulates Human Adiponectin Gene Transcription Through an Intronic Enhancer. Diabetes 2005, 54, 1744–1754. [Google Scholar] [CrossRef] [PubMed]
- Grabe, N. AliBaba2: Context specific identification of transcription factor binding sites. Silico Biol. 2002, 2, S1–S15. [Google Scholar]
- Laumen, H.; Saningong, A.D.; Heid, I.M.; Hess, J.; Herder, C.; Claussnitzer, M.; Klopp, N. Functional characterization of promoter variants of the adiponectin gene complemented by epidemiological data. Diabetes 2009, 58, 984–991. [Google Scholar] [CrossRef] [PubMed]
- Zhang, D.; Ma, J.; Brismar, K.; Efendić, S.; Gu, H.F. A single nucleotide polymorphism alters the sequence of SP1 binding site in the adiponectin promoter region and is associated with diabetic nephropathy among type 1 diabetic patients in the Genetics of Kidneys in Diabetes Study. J. Diabetes Complicat. 2009, 23, 265–272. [Google Scholar] [CrossRef]
© 2019 by the authors. Licensee MDPI, Basel, Switzerland. This article is an open access article distributed under the terms and conditions of the Creative Commons Attribution (CC BY) license (http://creativecommons.org/licenses/by/4.0/).

 ,
, 

