
Influence of Diets Enriched with Flavonoids (Cocoa and Hesperidin) on the Systemic Immunity of Intensively Trained and Exhausted Rats
 ,
,  , and
, and 
Abstract
:1. Introduction
2. Materials and Methods
2.1. Animals
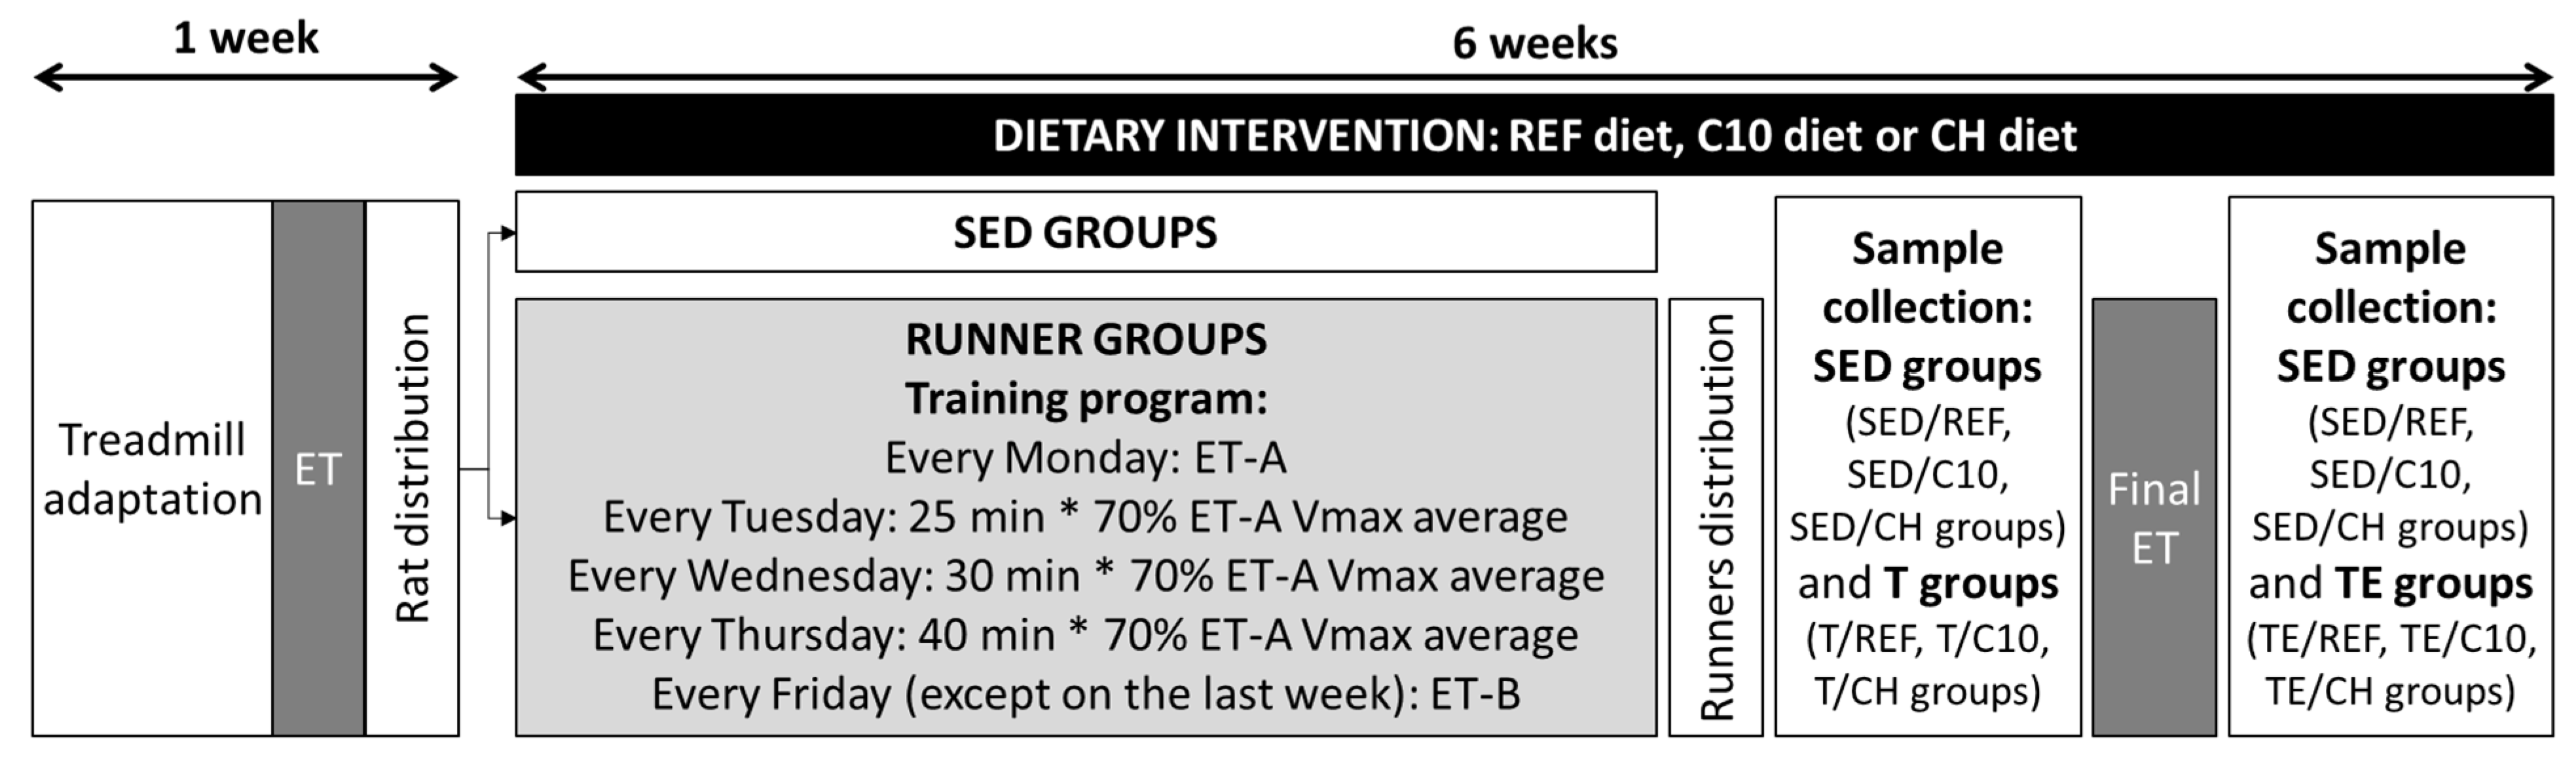
2.2. Exercise and Nutritional Interventions
2.3. Sample Collection
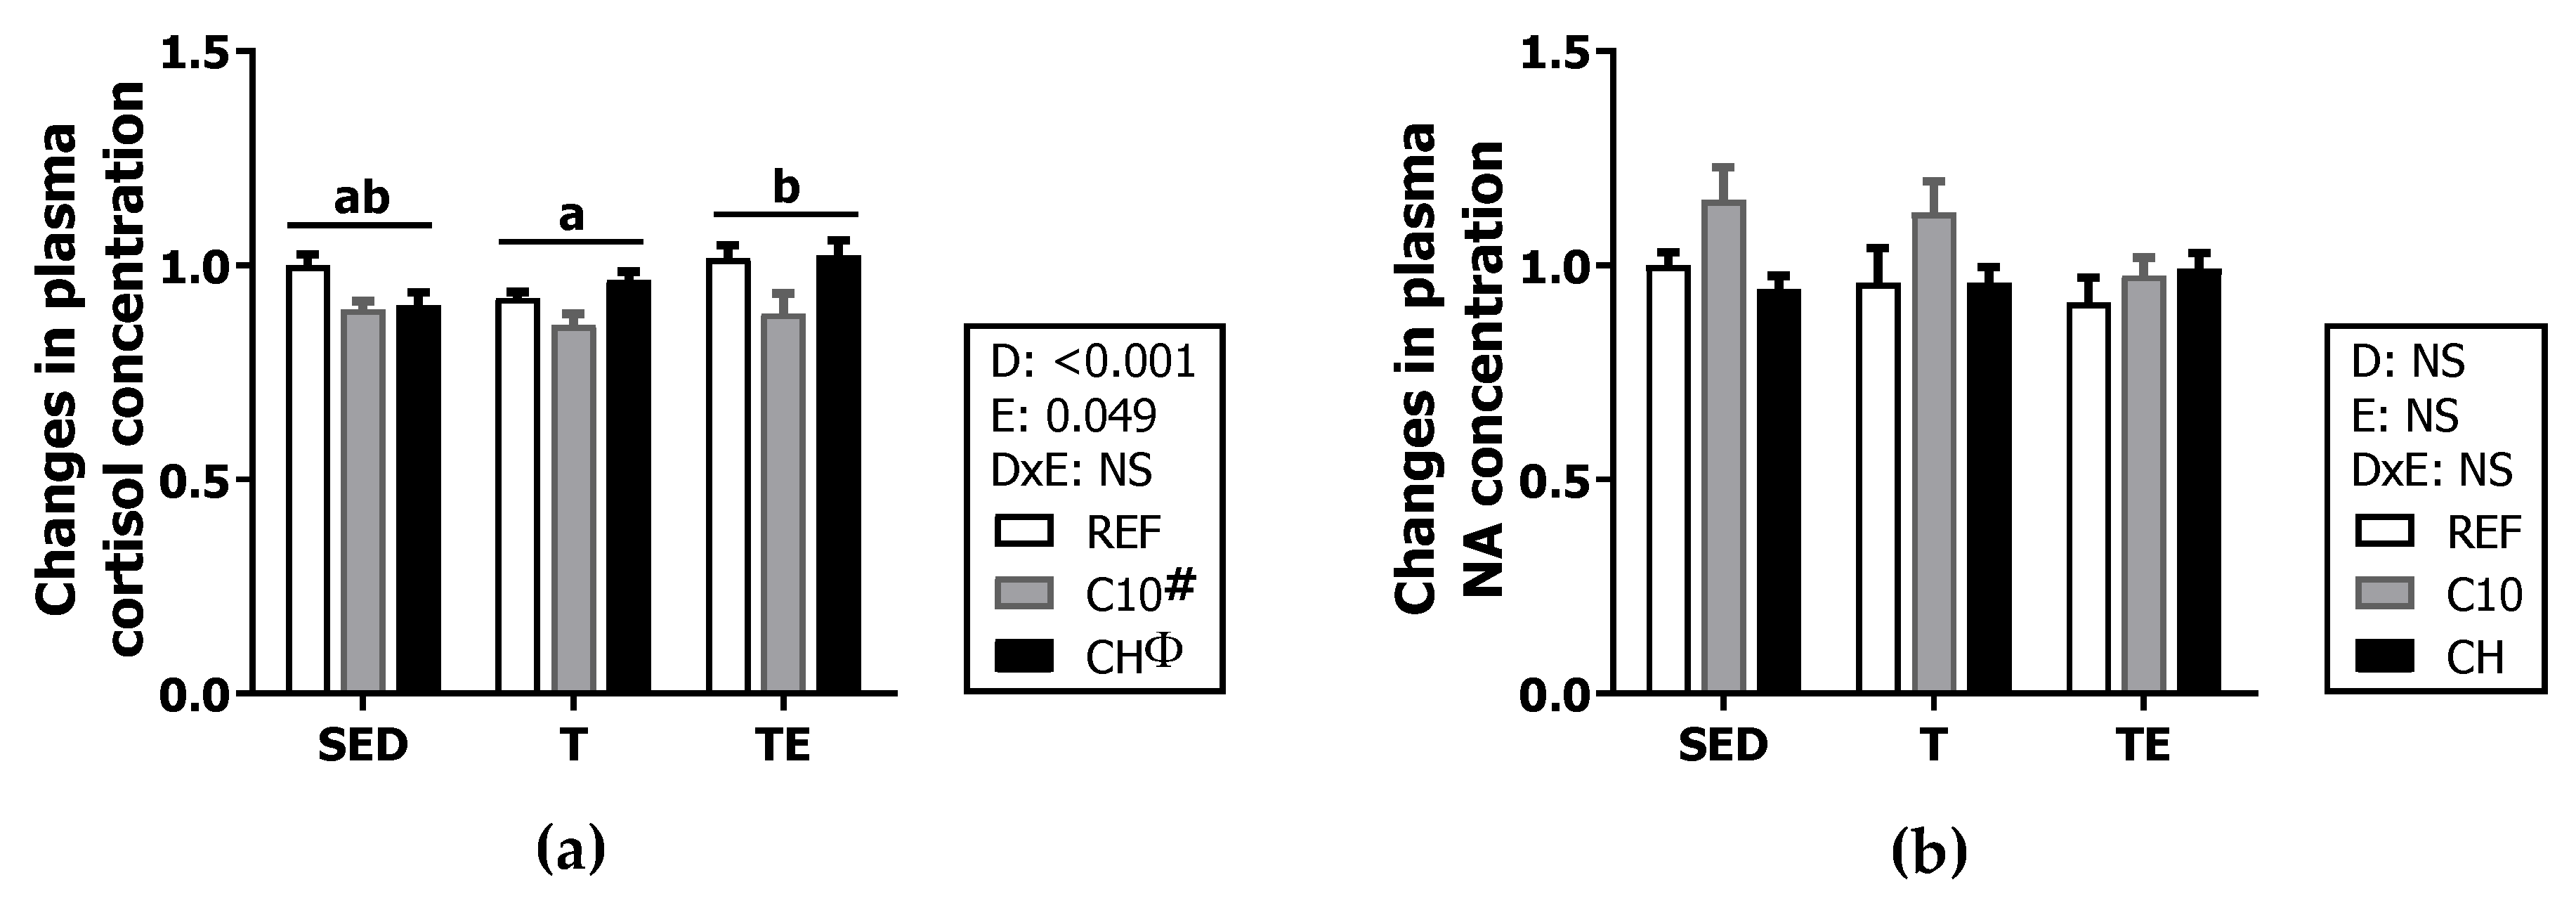
2.4. Plasma Cortisol and Noradrenaline Concentration
2.5. Spleen Lymphocyte Isolation and Phenotypic Analysis
2.6. Spleen Lymphocyte Stimulation and Proliferation
2.7. Cytokine and Immunoglobulin Quantification
2.8. Phagocytic Activity
2.9. Natural Killer (NK) Cell Cytotoxic Activity
2.10. Statistical Analysis
3. Results
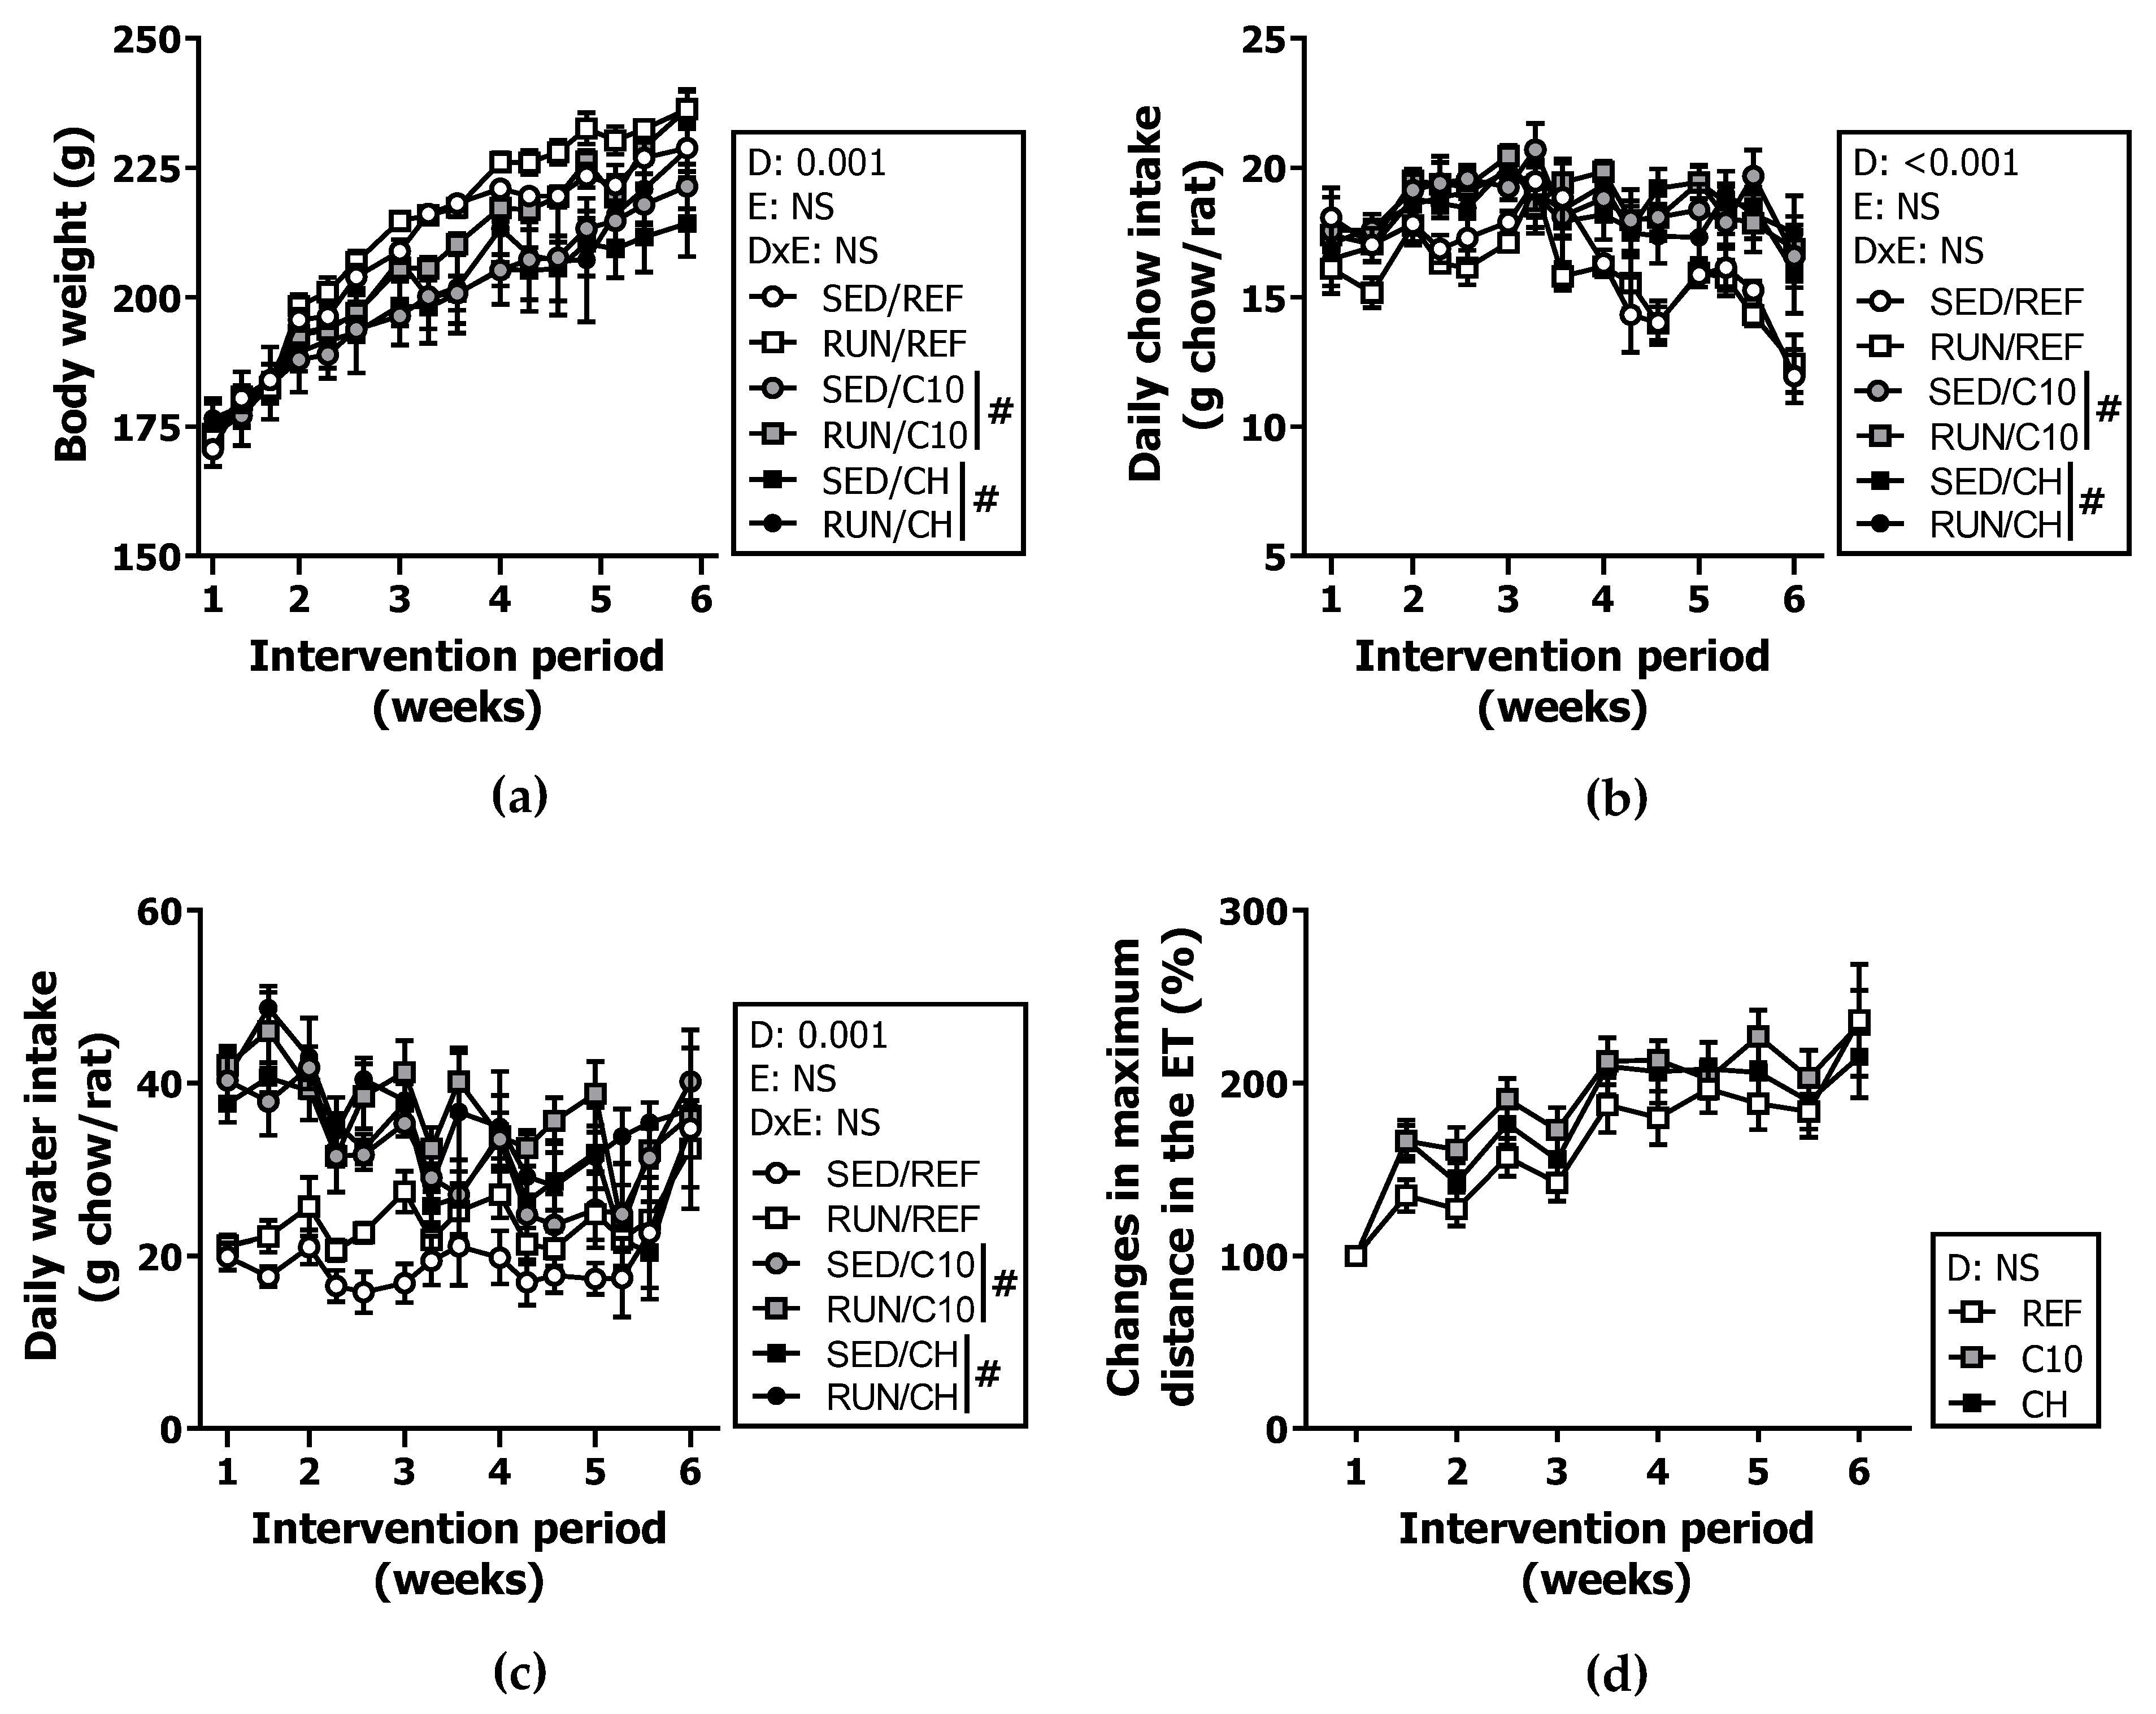
3.1. Body Weight, Chow Intake and Training Performance
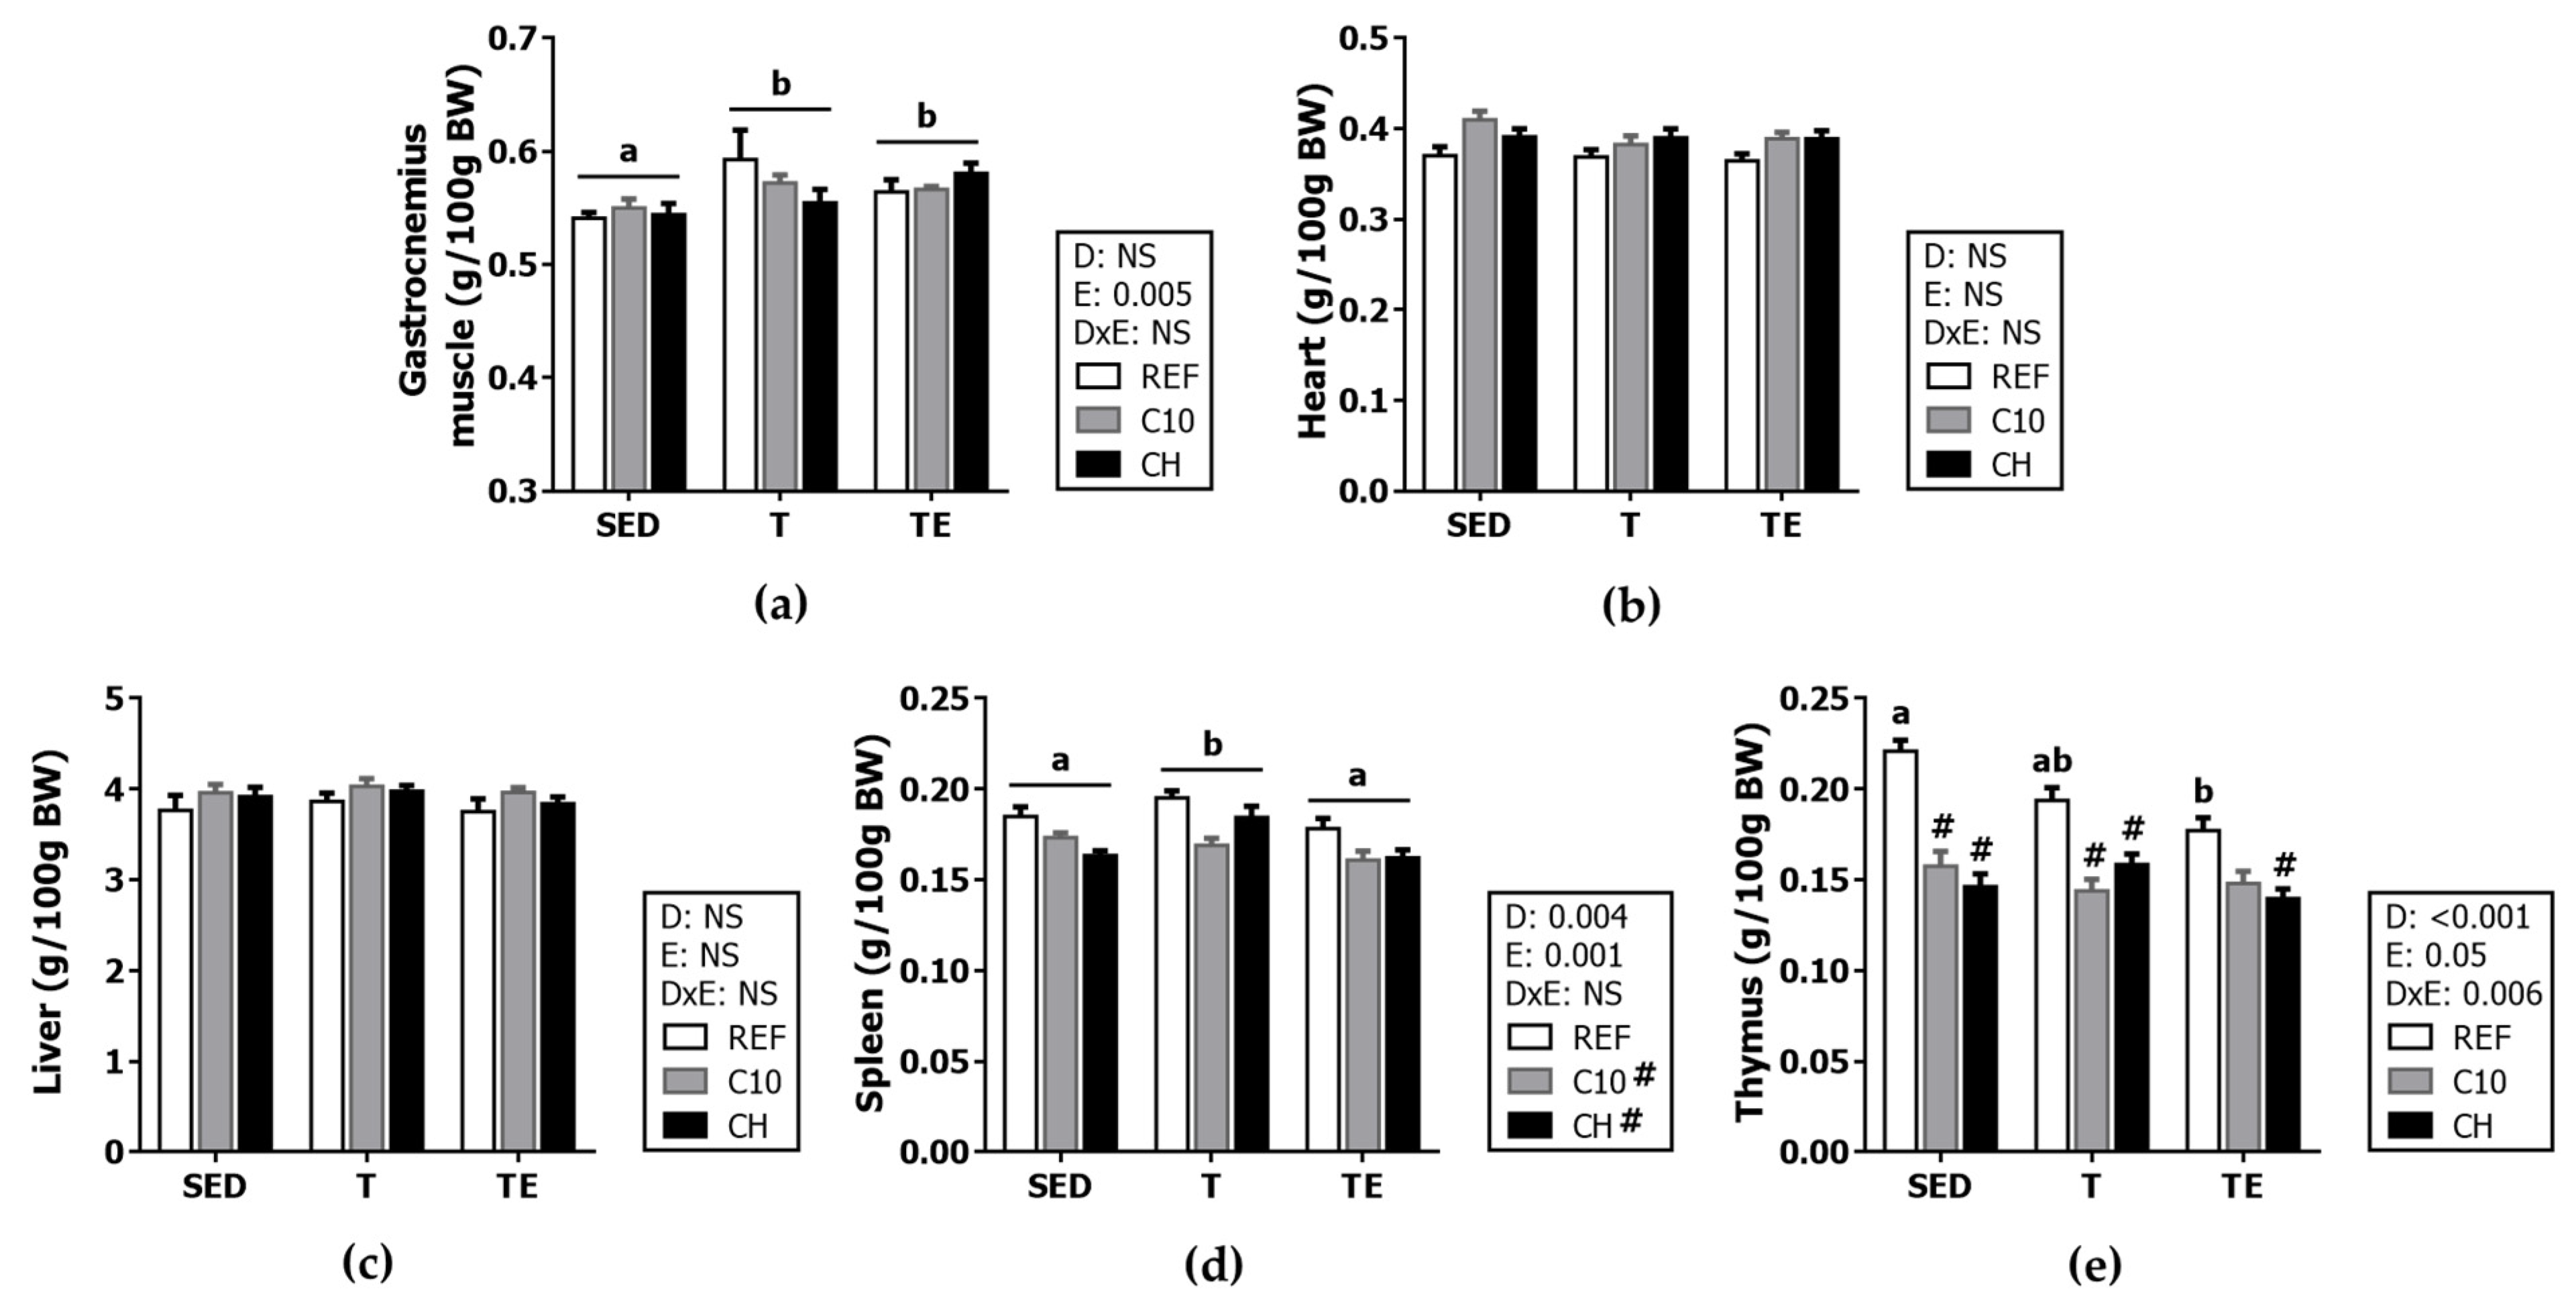
3.2. Organ Weight
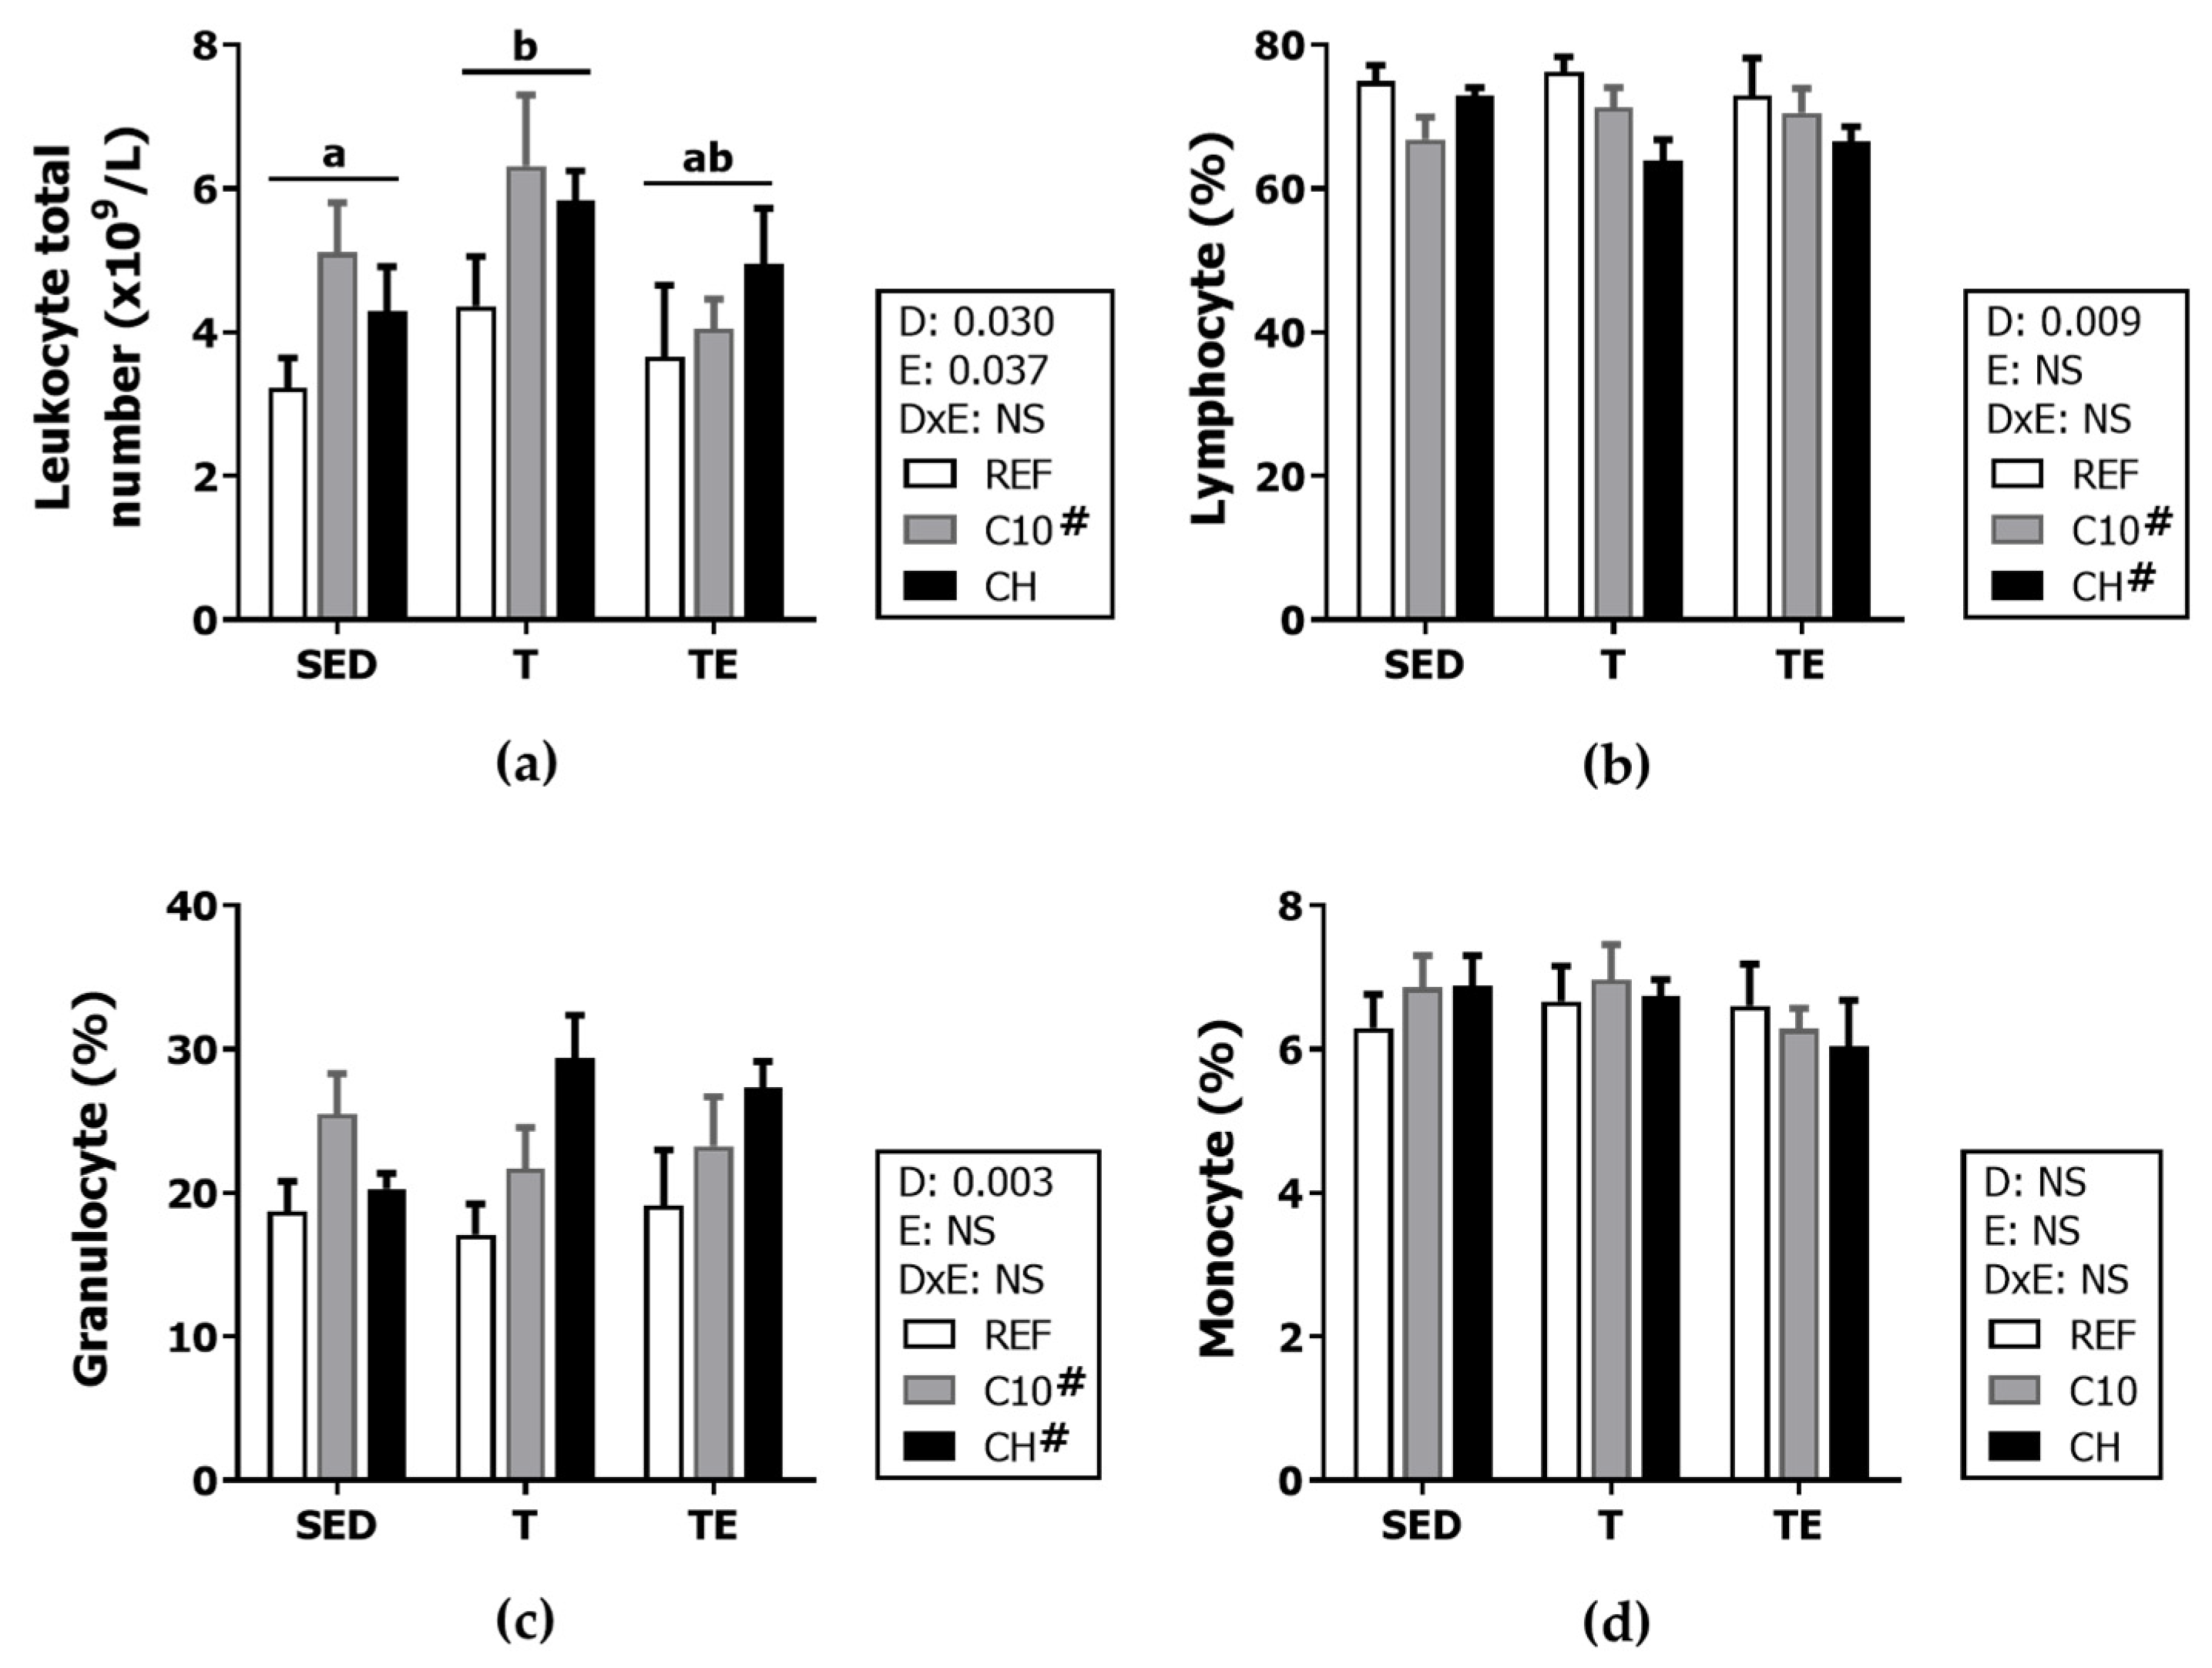
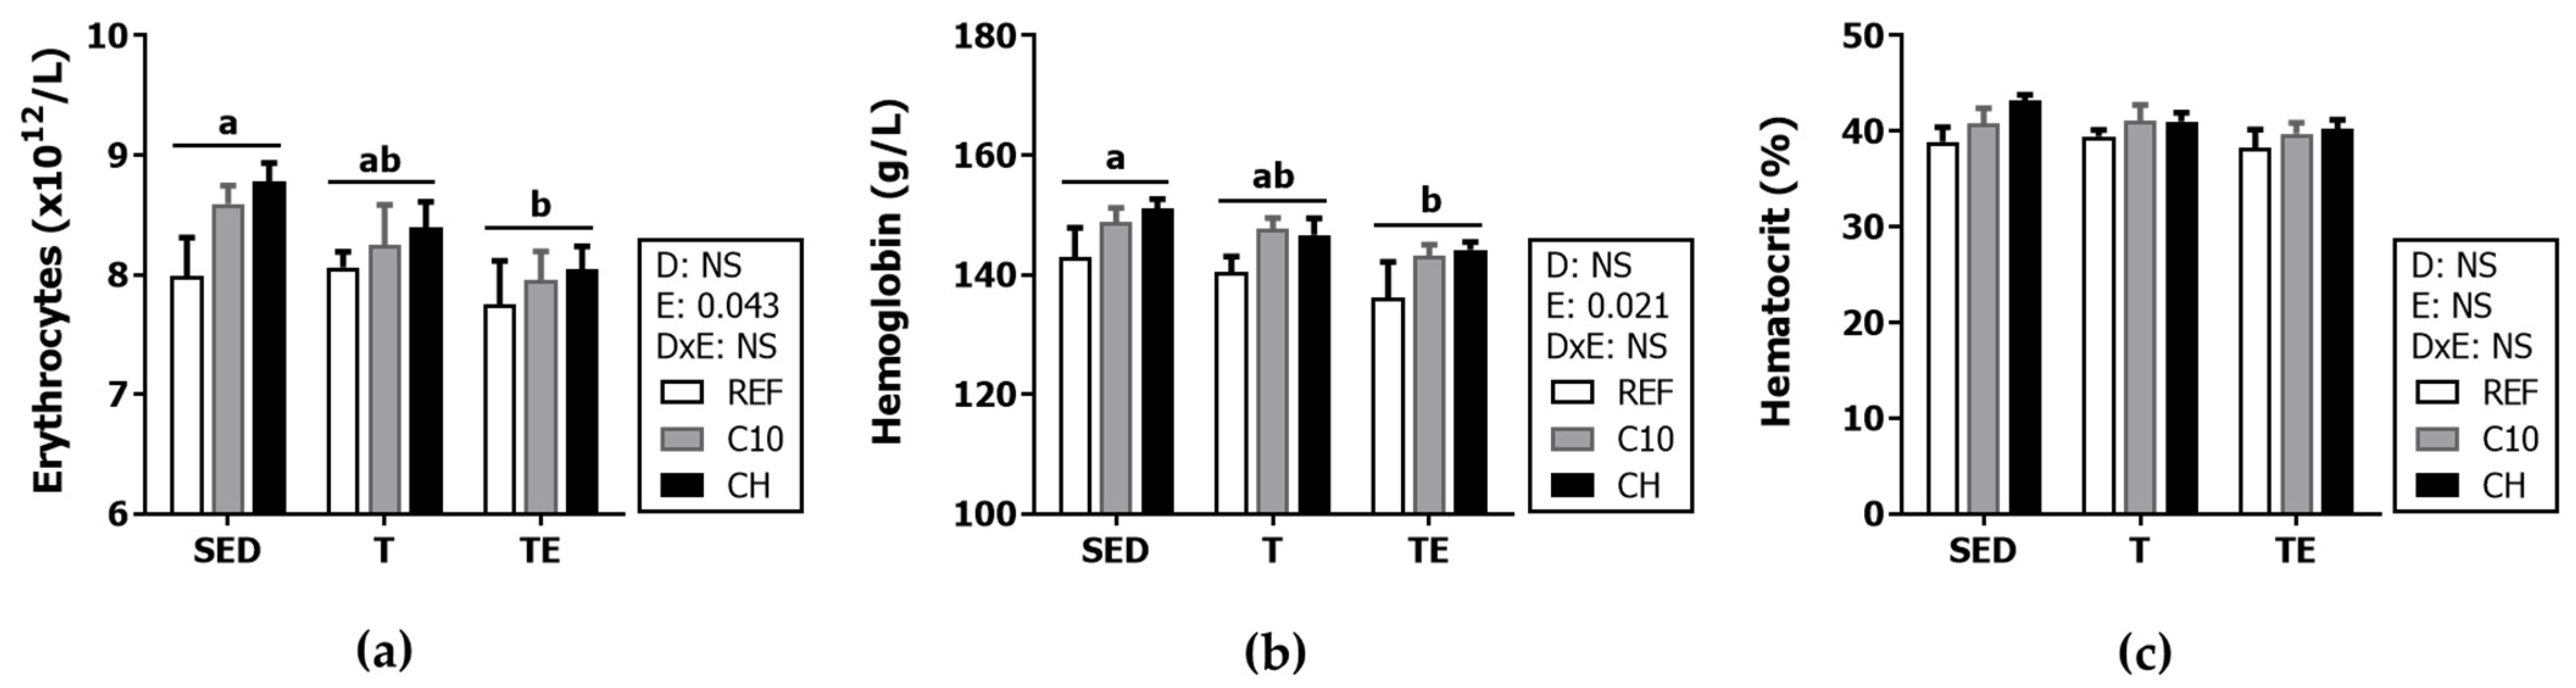
3.3. Hemograme
3.4. Serum Immunoglobulins
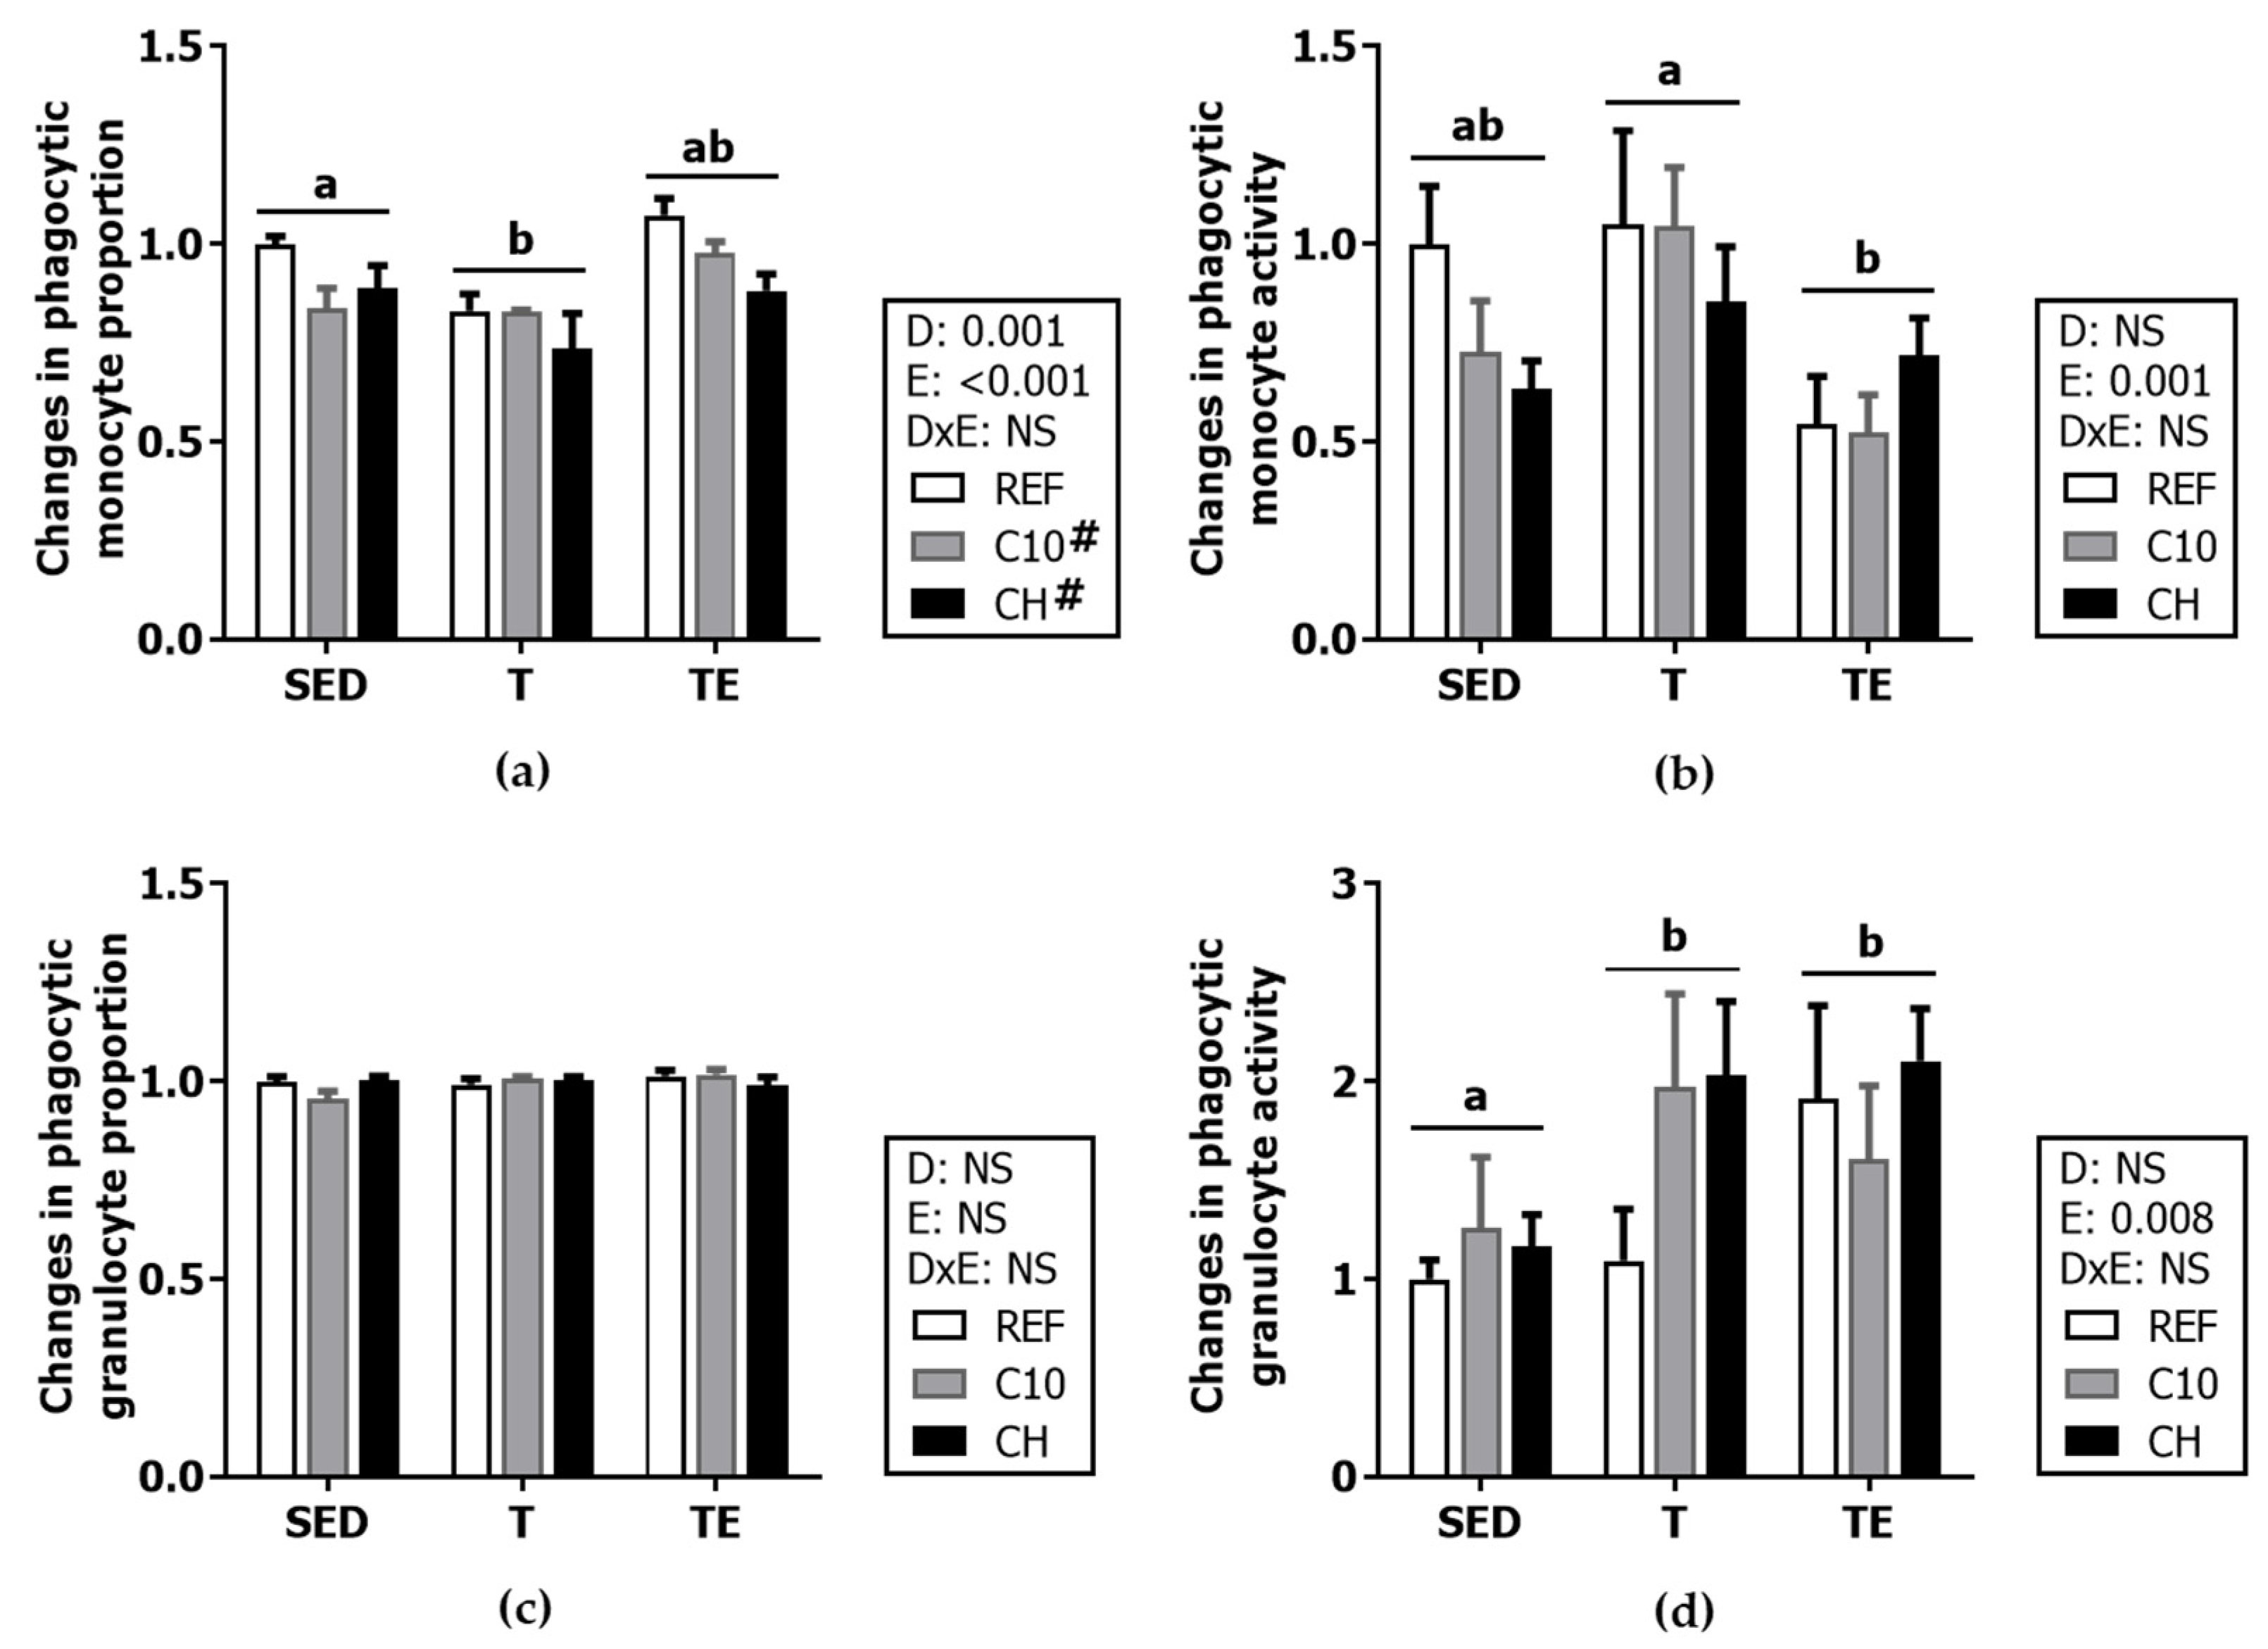
3.5. Phagocytic Activity
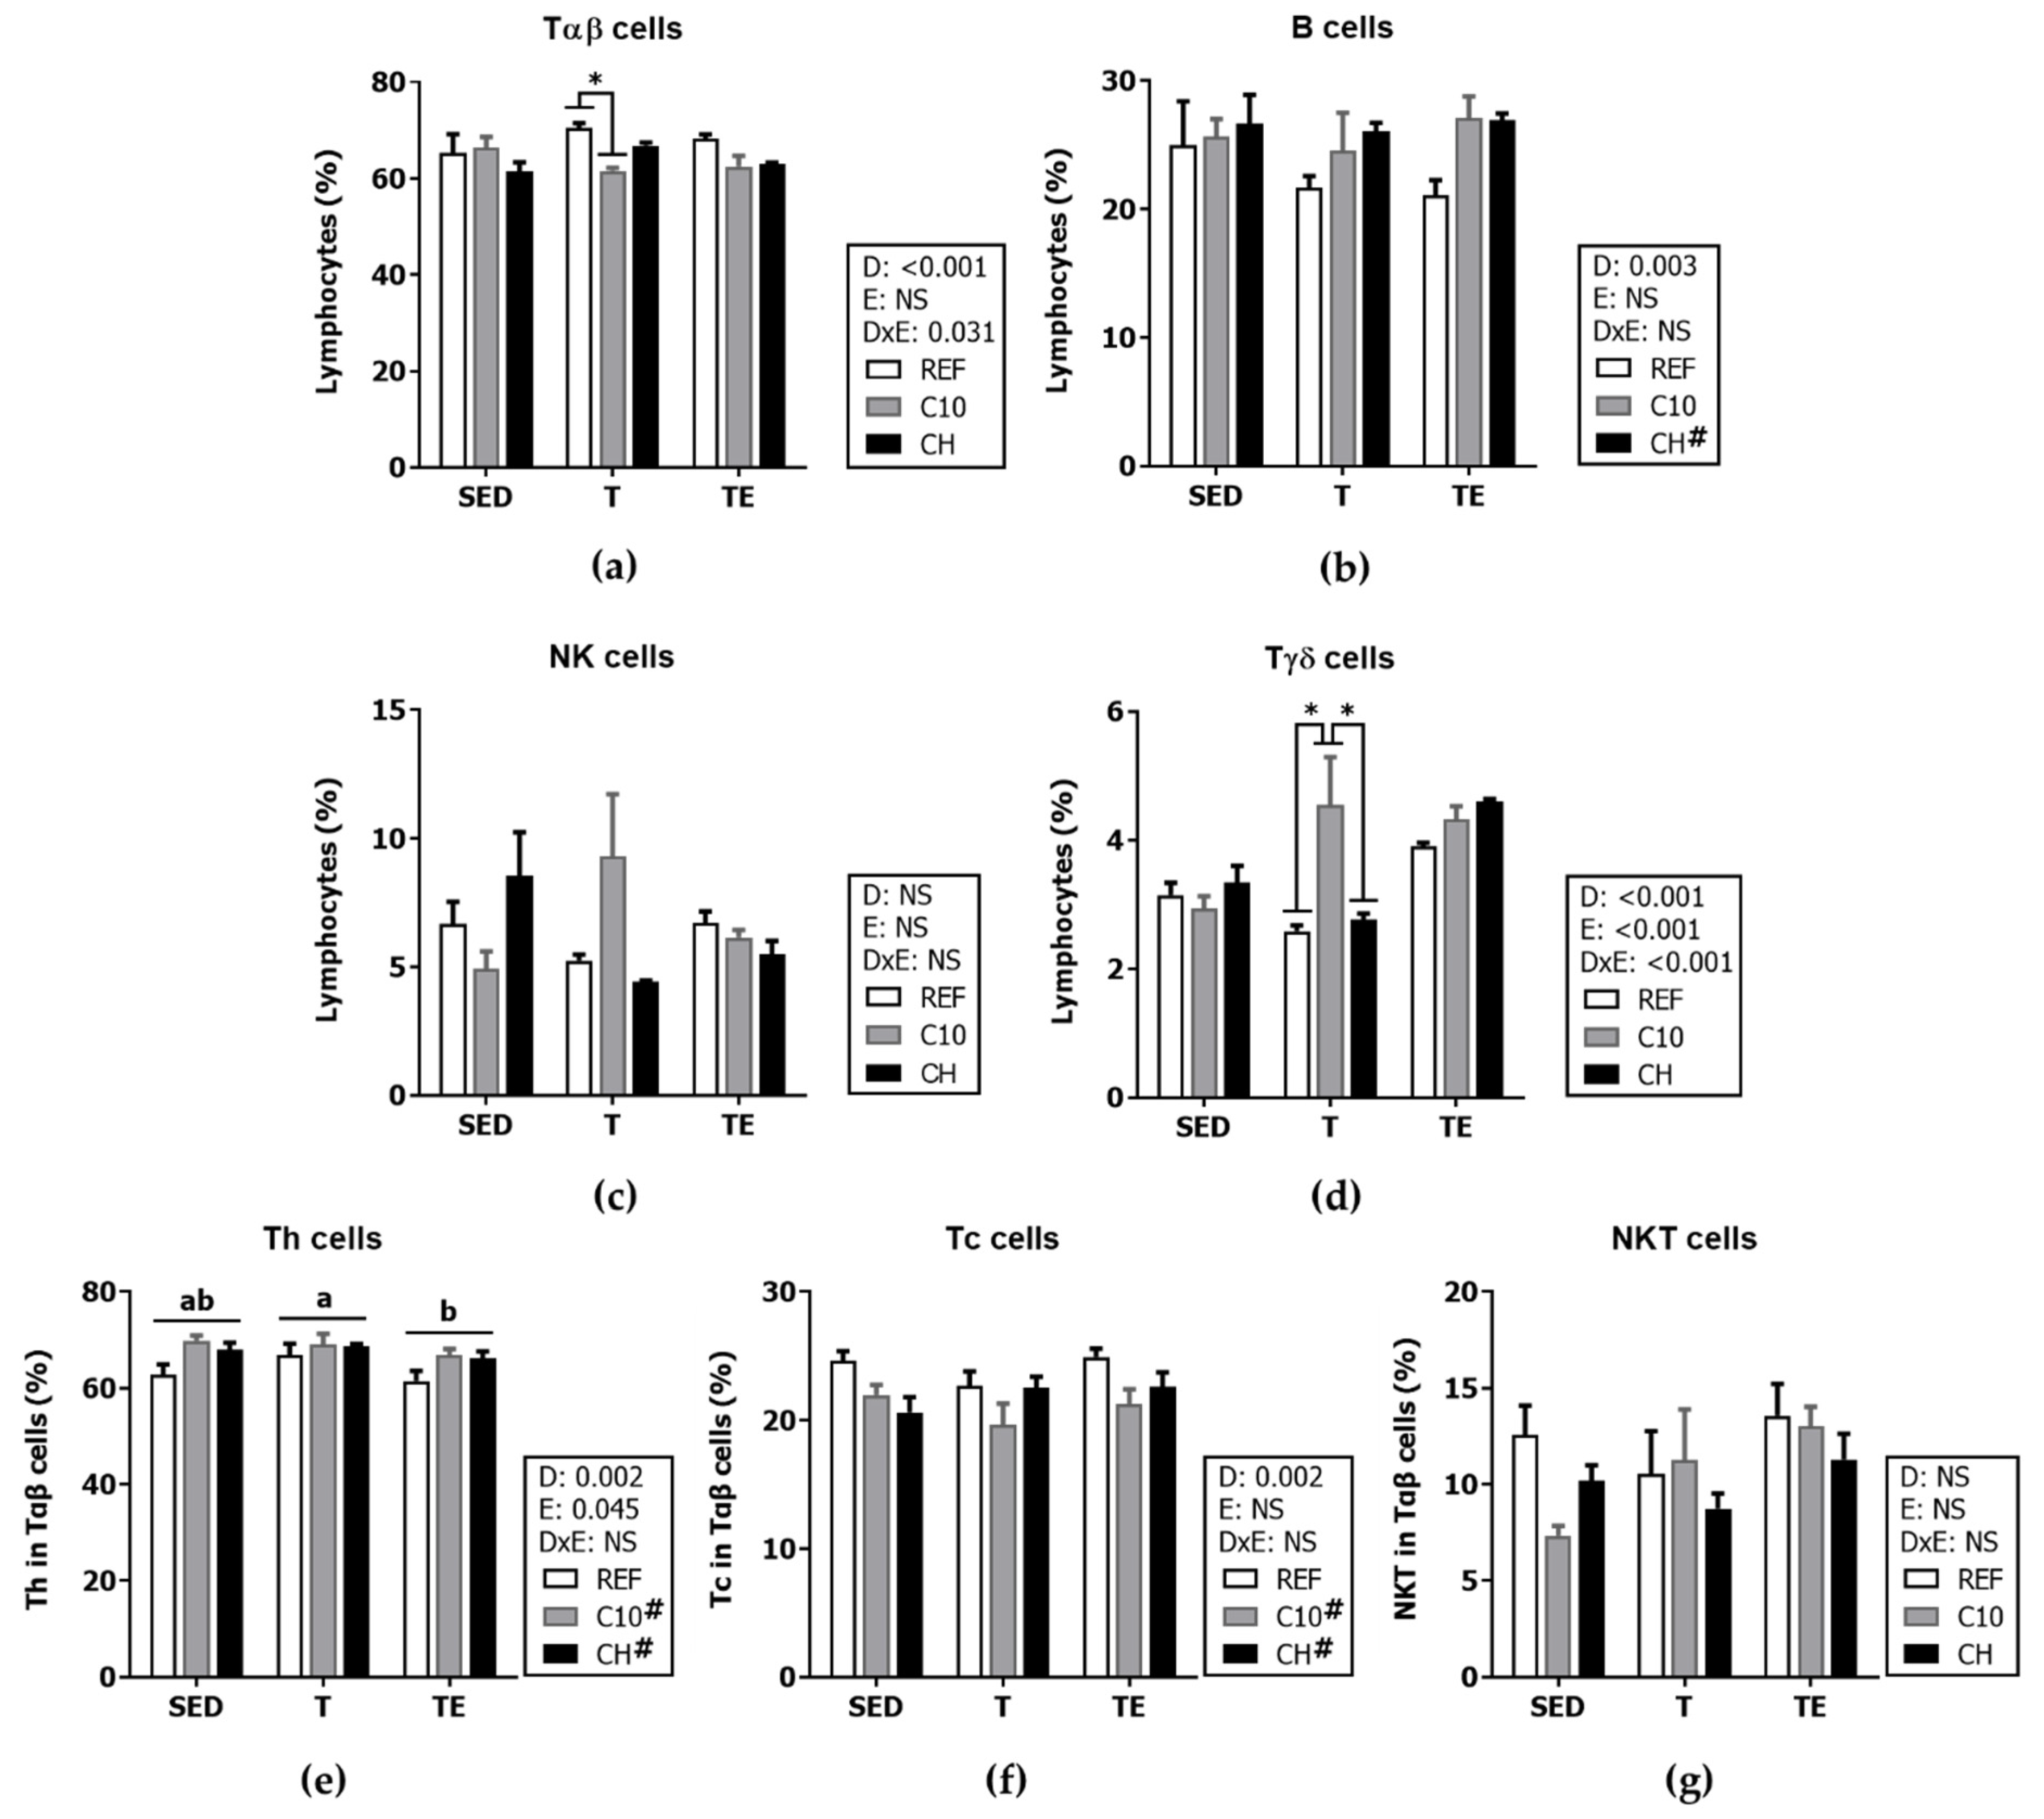
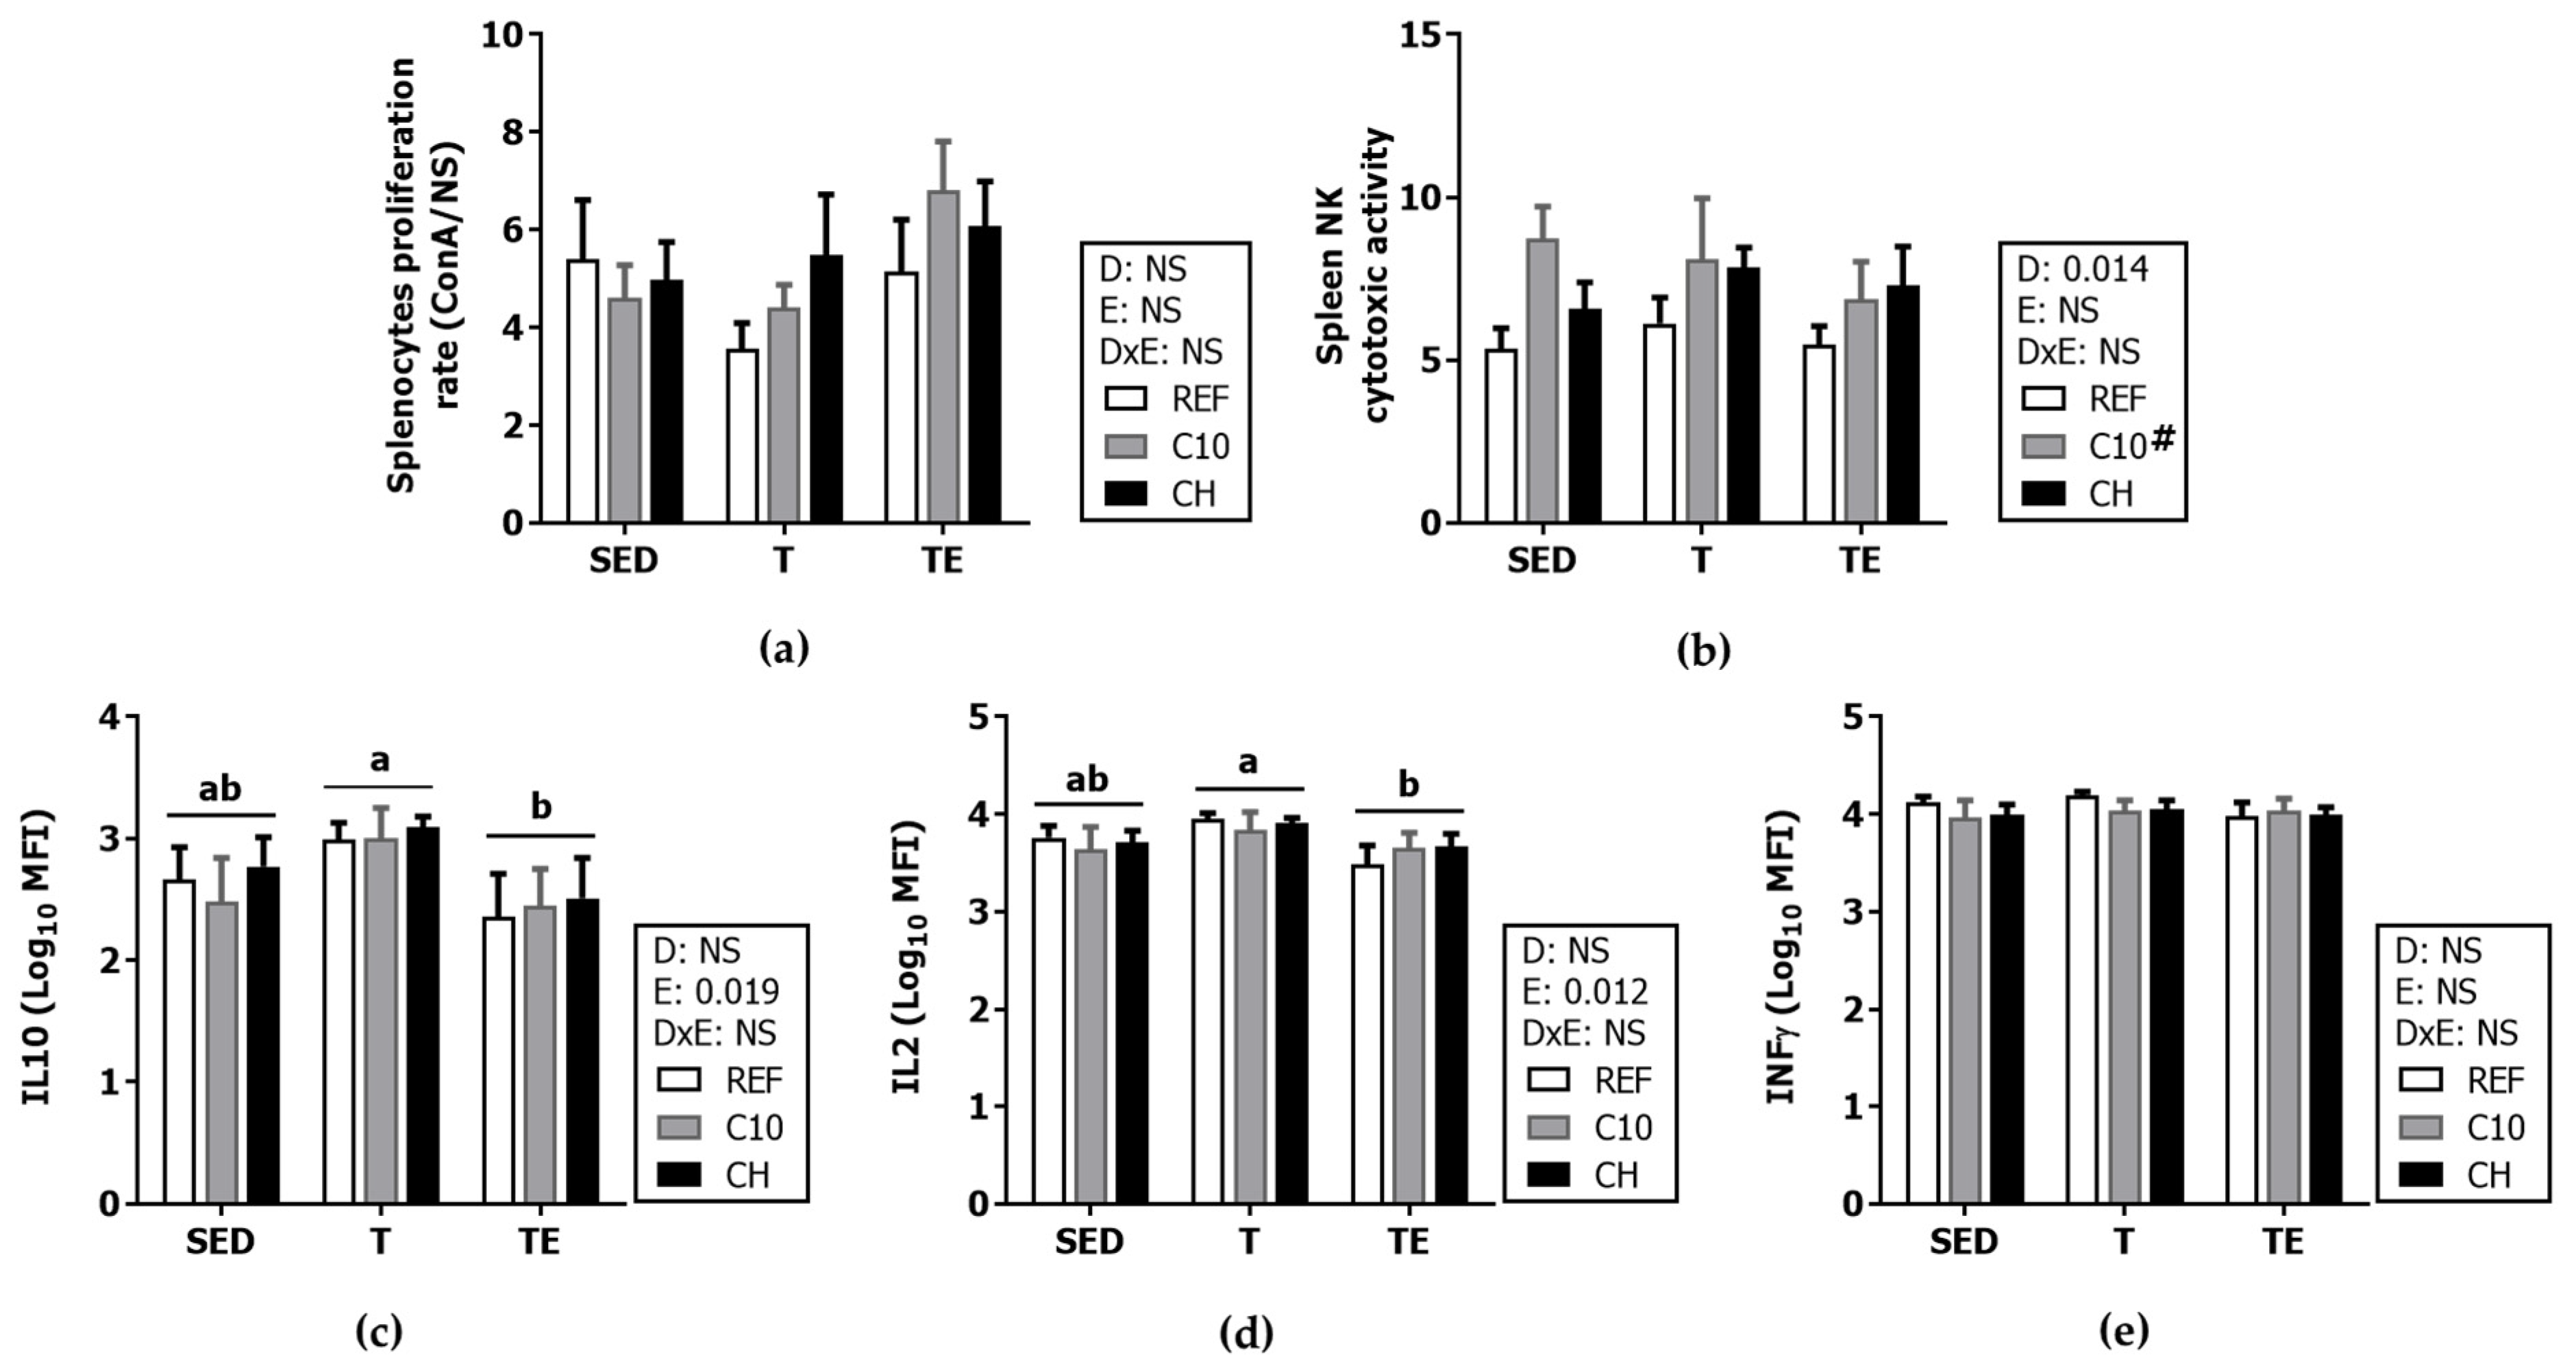
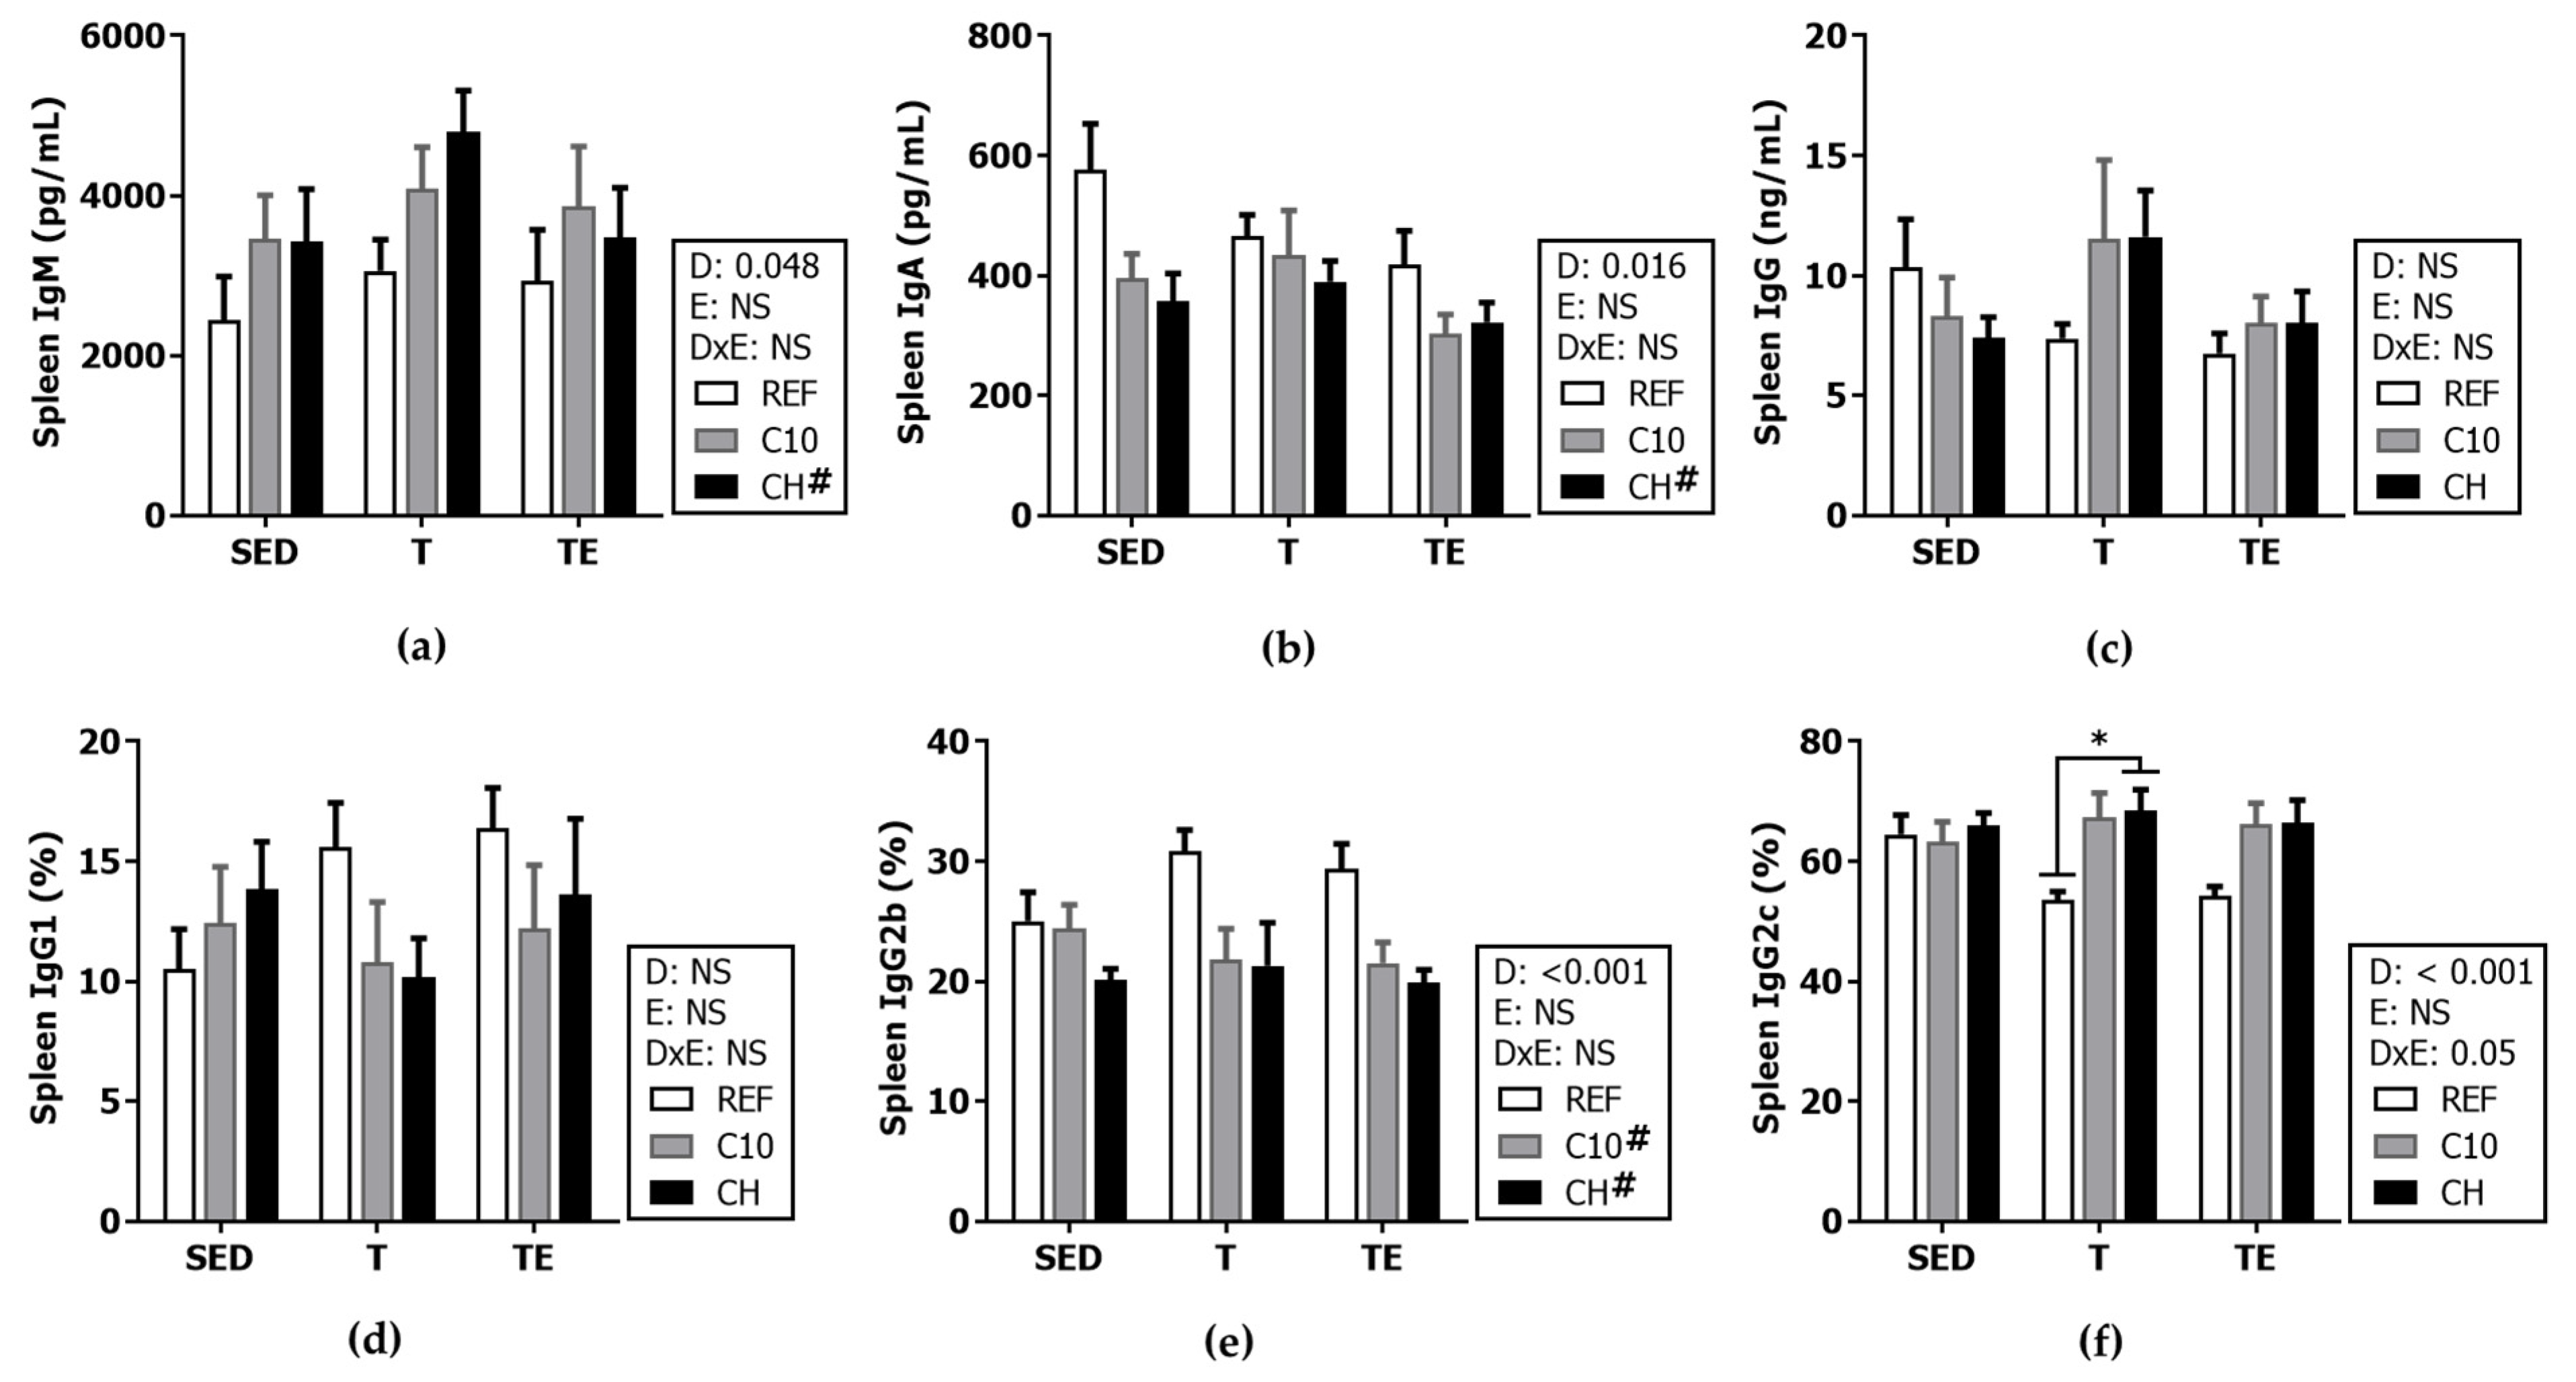
3.6. Spleen Lymphocyte Composition and Function
4. Discussion
5. Conclusions
Author Contributions
Funding
Institutional Review Board Statement
Informed Consent Statement
Data Availability Statement
Acknowledgments
Conflicts of Interest
References
- Krüger, K.; Mooren, F.-C.; Pilat, C. The immunomodulatory effects of physical activity. Curr. Pharm. Des. 2016, 22, 3730–3748. [Google Scholar] [CrossRef]
- Gleeson, M.; Bishop, N.C.; Stensel, D.J.; Lindley, M.R.; Mastana, S.S.; Nimmo, M.A. The anti-inflammatory effects of exercise: Mechanisms and implications for the prevention and treatment of disease. Nat. Publ. Gr. 2011, 11, 607–615. [Google Scholar] [CrossRef]
- Pedersen, B.K.; Saltin, B. Exercise as medicine—Evidence for prescribing exercise as therapy in 26 different chronic diseases. Scand. J. Med. Sci. Sport. 2015, 25, 1–72. [Google Scholar] [CrossRef] [Green Version]
- Holland, A.M.; Hyatt, H.W.; Smuder, A.J.; Sollanek, K.J.; Morton, A.B.; Roberts, M.D.; Kavazis, A.N. Influence of endurance exercise training on antioxidant enzymes, tight junction proteins, and inflammatory markers in the rat ileum. BMC Res. Notes 2015, 8, 514. [Google Scholar] [CrossRef] [Green Version]
- Walsh, N.P.; Oliver, S.J. Exercise, immune function and respiratory infection: An update on the influence of training and environmental stress. Immunol. Cell Biol. 2016, 94, 132–139. [Google Scholar] [CrossRef]
- Svendsen, I.S.; Taylor, I.M.; Tonnessen, E.; Bahr, R.; Gleeson, M. Training-related and competition-related risk factors for respiratory tract and gastrointestinal infections in elite cross-country skiers. Br. J. Sports Med. 2016, 50, 809–815. [Google Scholar] [CrossRef] [Green Version]
- Estruel-Amades, S.; Ruiz-Iglesias, P.; Périz, M.; Franch, À.; Pérez-Cano, F.J.; Camps-Bossacoma, M.; Castell, M. Changes in lymphocyte composition and functionality after intensive training and exhausting exercise in rats. Front. Physiol. 2019, 10, 1491. [Google Scholar] [CrossRef]
- Ruiz-Iglesias, P.; Estruel-Amades, S.; Camps-Bossacoma, M.; Massot-Cladera, M.; Castell, M.; Pérez-Cano, F.J. Alterations in the mucosal immune system by a chronic exhausting exercise in Wistar rats. Sci. Rep. 2020, 10, 17950. [Google Scholar] [CrossRef]
- Simpson, R.J.; Kunz, H.; Agha, N.; Graff, R. Exercise and the regulation of immune functions. In Progress in Molecular Biology and Translational Science; Elsevier Inc.: Amsterdam, The Netherlands, 2015; Volume 135, pp. 355–380. [Google Scholar]
- Krüger, K.; Lechtermann, A.; Fobker, M.; Völker, K.; Mooren, F.C. Exercise-induced redistribution of T lymphocytes is regulated by adrenergic mechanisms. Brain. Behav. Immun. 2008, 22, 324–338. [Google Scholar] [CrossRef]
- Krüger, K.; Alack, K.; Ringseis, R.; Mink, L.; Pfeifer, E.; Schinle, M.; Gindler, K.; Kimmelmann, L.; Walscheid, R.; Muders, K.; et al. Apoptosis of T-cell subsets after acute high-intensity interval exercise. Med. Sci. Sports Exerc. 2016, 48, 2021–2029. [Google Scholar] [CrossRef]
- Estruel-Amades, S.; Camps-Bossacoma, M.; Massot-Cladera, M.; Pérez-Cano, F.J.; Castell, M. Alterations in the innate immune system due to exhausting exercise in intensively trained rats. Sci. Rep. 2020, 10, 967. [Google Scholar] [CrossRef] [PubMed] [Green Version]
- Wisnuwardani, R.W.; De Henauw, S.; Androutsos, O.; Forsner, M.; Gottrand, F.; Huybrechts, I.; Knaze, V.; Kersting, M.; Le Donne, C.; Marcos, A.; et al. Estimated dietary intake of polyphenols in European adolescents: The HELENA study. Eur. J. Nutr. 2019, 58, 2345–2363. [Google Scholar] [CrossRef]
- Rees, A.; Dodd, G.F.; Spencer, J.P.E. The effects of flavonoids on cardiovascular health: A review of human intervention trials and implications for cerebrovascular function. Nutrients 2018, 10, 1852. [Google Scholar] [CrossRef] [Green Version]
- Cichon, N.; Saluk-Bijak, J.; Gorniak, L.; Przyslo, L.; Bijak, M. Flavonoids as a natural enhancer of neuroplasticity-an overview of the mechanism of neurorestorative action. Antioxidants 2020, 9, 1035. [Google Scholar] [CrossRef]
- Ullah, A.; Munir, S.; Badshah, S.L.; Khan, N.; Ghani, L.; Poulson, B.G.; Emwas, A.; Jaremko, M. Important flavonoids and their role as a therapeutic agent. Molecules 2020, 25, 5243. [Google Scholar] [CrossRef]
- Ayaz, M.; Sadiq, A.; Junaid, M.; Ullah, F.; Ovais, M.; Ullah, I.; Ahmed, J.; Shahid, M. Flavonoids as prospective neuroprotectants and their therapeutic propensity in aging associated neurological disorders. Front. Aging Neurosci. 2019, 11, 155. [Google Scholar] [CrossRef] [Green Version]
- Liu, Y.J.; Zhan, J.; Liu, X.L.; Wang, Y.; Ji, J.; He, Q.Q. Dietary flavonoids intake and risk of type 2 diabetes: A meta-analysis of prospective cohort studies. Clin. Nutr. 2014, 33, 59–63. [Google Scholar] [CrossRef]
- Rufino, A.T.; Costa, V.M.; Carvalho, F.; Fernandes, E. Flavonoids as antiobesity agents: A review. Med. Res. Rev. 2021, 41, 556–585. [Google Scholar] [CrossRef]
- Kopustinskiene, D.M.; Jakstas, V.; Savickas, A.; Bernatoniene, J. Flavonoids as anticancer agents. Nutrients 2020, 12, 457. [Google Scholar] [CrossRef] [Green Version]
- Hamilton, K.; Bennett, N.C.; Purdie, G.; Herst, P.M. Standardized cranberry capsules for radiation cystitis in prostate cancer patients in New Zealand: A randomized double blinded, placebo controlled pilot study. Support. Care Cancer 2015, 23, 95–102. [Google Scholar] [CrossRef]
- Procházková, D.; Boušová, I.; Wilhelmová, N. Antioxidant and prooxidant properties of flavonoids. Fitoterapia 2011, 82, 513–523. [Google Scholar] [CrossRef]
- Maleki, S.J.; Crespo, J.F.; Cabanillas, B. Anti-inflammatory effects of flavonoids. Food Chem. 2019, 299, 125124. [Google Scholar] [CrossRef]
- Pérez-Cano, F.J.; Franch, À.; Pérez-Berezo, T.; Ramos-Romero, S.; Castellote, C.; Castell, M. The effects of flavonoids on the immune system. In Bioactive Food as Dietary Interventions for Arthritis and Related Inflammatory Diseases; Watson, R.R., Preedy, V.R., Eds.; Elsevier Inc.: San Diego, CA, USA, 2013; pp. 175–188. ISBN 9780123971562. [Google Scholar]
- Ruiz-Iglesias, P.; Gorgori-González, A.; Massot-Cladera, M.; Castell, M.; Pérez-Cano, F.J. Does flavonoid consumption improve exercise performance? Is it related to changes in the immune system and inflammatory biomarkers? A systematic review of clinical studies since 2005. Nutrients 2021, 13, 1132. [Google Scholar] [CrossRef]
- Davis, J.M.; Murphy, E.A.; Carmichael, M.D.; Davis, B. Quercetin increases brain and muscle mitochondrial biogenesis and exercise tolerance. Am. J. Physiol. Regul. Integr. Comp. Physiol. 2009, 296, R1071–R1077. [Google Scholar] [CrossRef] [Green Version]
- Shokri Afra, H.; Zangooei, M.; Meshkani, R.; Ghahremani, M.H.; Ilbeigi, D.; Khedri, A.; Shahmohamadnejad, S.; Khaghani, S.; Nourbakhsh, M. Hesperetin is a potent bioactivator that activates SIRT1-AMPK signaling pathway in HepG2 cells. J. Physiol. Biochem. 2019, 75, 125–133. [Google Scholar] [CrossRef]
- Pallauf, K.; Duckstein, N.; Hasler, M.; Klotz, L.O.; Rimbach, G. Flavonoids as Putative Inducers of the Transcription Factors Nrf2, FoxO, and PPAR γ. Oxid. Med. Cell. Longev. 2017, 2017, 4397340. [Google Scholar] [CrossRef] [Green Version]
- Li, Y.R.; Li, G.H.; Zhou, M.X.; Xiang, L.; Ren, D.M.; Lou, H.X.; Wang, X.N.; Shen, T. Discovery of natural flavonoids as activators of Nrf2-mediated defense system: Structure-activity relationship and inhibition of intracellular oxidative insults. Bioorganic Med. Chem. 2018, 26, 5140–5150. [Google Scholar] [CrossRef]
- Pingitore, A.; Pace, G.; Lima, P.; Mastorci, F.; Quinones, A.; Iervasi, G.; Vassalle, C. Exercise and oxidative stress: Potential effects of antioxidant dietary strategies in sports. Nutrition 2015, 31, 916–922. [Google Scholar] [CrossRef]
- Valacchi, G.; Virgili, F.; Cervellati, C.; Pecorelli, A. OxInflammation: From subclinical condition to pathological biomarker. Front. Physiol. 2018, 9, 858. [Google Scholar] [CrossRef] [Green Version]
- Nieman, D.; Mitmesser, S. Potential impact of nutrition on immune system recovery from heavy exertion: A metabolomics perspective. Nutrients 2017, 9, 513. [Google Scholar] [CrossRef]
- Somerville, V.S.; Braakhuis, A.J.; Hopkins, W.G. Effect of Flavonoids on Upper Respiratory Tract Infections and Immune Function: A Systematic Review and Meta-Analysis. Adv. Nutr. 2016, 7, 488–497. [Google Scholar] [CrossRef] [PubMed] [Green Version]
- Andújar, I.; Recio, M.C.; Giner, R.M.; Ríos, J.L. Cocoa polyphenols and their potential benefits for human health. Oxid. Med. Cell. Longev. 2012, 2012, 906252. [Google Scholar] [CrossRef] [PubMed] [Green Version]
- Martínez-Noguera, F.J.; Marín-Pagán, C.; Carlos-Vivas, J.; Alcaraz, P.E. Effects of 8 weeks of 2S-hesperidin supplementation on performance in amateur cyclists. Nutrients 2020, 12, 3911. [Google Scholar] [CrossRef] [PubMed]
- Allgrove, J.; Farrell, E.; Gleeson, M.; Williamson, G.; Cooper, K. Regular dark chocolate consumption’s reduction of oxidative stress and increase of free-fatty-acid mobilization in response to prolonged cycling. Int. J. Sport Nutr. Exerc. Metab. 2011, 21, 113–123. [Google Scholar] [CrossRef] [Green Version]
- Decroix, L.; Tonoli, C.; Lespagnol, E.; Balestra, C.; Descat, A.; Drittij-Reijnders, M.J.; Blackwell, J.R.; Stahl, W.; Jones, A.M.; Weseler, A.R.; et al. One-week cocoa flavanol intake increases prefrontal cortex oxygenation at rest and during moderate-intensity exercise in normoxia and hypoxia. J. Appl. Physiol. 2018, 125, 8–18. [Google Scholar] [CrossRef] [PubMed]
- Ruiz-Iglesias, P.; Massot-Cladera, M.; Rodríguez-Lagunas, M.J.; Franch, À.; Camps-Bossacoma, M.; Pérez-Cano, F.J.; Castell, M. Protective Effect of a Cocoa-Enriched Diet on Oxidative Stress Induced by Intensive Acute Exercise in Rats. Antioxidants 2022, 11, 753. [Google Scholar] [CrossRef]
- Martínez-Noguera, F.J.; Marín-Pagán, C.; Carlos-Vivas, J.; Alcaraz, P.E. 8-week supplementation of 2S-hesperidin modulates antioxidant and inflammatory status after exercise until exhaustion in amateur cyclists. Antioxidants 2021, 10, 432. [Google Scholar] [CrossRef]
- Estruel-Amades, S.; Massot-Cladera, M.; Garcia-Cerdà, P.; Pérez-Cano, F.J.; Franch, Á.; Castell, M.; Camps-Bossacoma, M. Protective effect of hesperidin on the oxidative stress induced by an exhausting exercise in intensively trained rats. Nutrients 2019, 11, 783. [Google Scholar] [CrossRef] [Green Version]
- De Oliveira, D.M.; Dourado, G.K.Z.S.; Cesar, T.B. Hesperidin associated with continuous and interval swimming improved biochemical and oxidative biomarkers in rats. J. Int. Soc. Sports Nutr. 2013, 10, 27. [Google Scholar] [CrossRef] [Green Version]
- Ruiz-Iglesias, P.; Massot-Cladera, M.; Rodríguez-Lagunas, M.J.; Franch, À.; Camps-Bossacoma, M.; Castell, M.; Pérez-Cano, F.J. A cocoa diet can partially attenuate the alterations in microbiota and mucosal immunity induced by a single session of intensive exercise in rats. Front. Nutr. 2022, 9, 861533. [Google Scholar] [CrossRef]
- Ruiz-Iglesias, P.; Estruel-Amades, S.; Camps-Bossacoma, M.; Massot-Cladera, M.; Franch, À.; Pérez-Cano, F.J.; Castell, M. Influence of Hesperidin on Systemic Immunity of Rats Following an Intensive Training and Exhausting Exercise. Nutrients 2020, 12, 1291. [Google Scholar] [CrossRef] [PubMed]
- Lalanza, J.F.; Sanchez-Roige, S.; Cigarroa, I.; Gagliano, H.; Fuentes, S.; Armario, A.; Capdevila, L.; Escorihuela, R.M. Long-term moderate treadmill exercise promotes stress-coping strategies in male and female rats. Sci. Rep. 2015, 5, 16166. [Google Scholar] [CrossRef] [PubMed] [Green Version]
- Kay, M.; Elkin, L.; Higgins, J.; Wobbrock, J. ARTool: Aligned Rank Transform for Nonparametric Factorial ANOVAs. Available online: https://zenodo.org/record/4721941#.Y51wYHaZOUk (accessed along 2021).
- Wobbrock, J.; Findlater, L.; Gergle, D.; Higgins, J. The Aligned Rank Transform for Nonparametric Factorial Analyses Using Only ANOVA Procedures. In Proceedings of the SIGCHI Conference on Human Factors Computing Systems, Vancouver, BC, Canada, 7–12 May 2011; pp. 143–146. [Google Scholar] [CrossRef] [Green Version]
- Lenth, R.V.; Buerkner, P.; Herve, M.; Love, J.; Miguez, F.; Riebl, H.; Singmann, H. Package “emmeans”. Am. Stat. 2022, 34, 216–221. [Google Scholar] [CrossRef]
- Saoudi, A.; Bernard, I.; Hoedemaekers, A.; Cautain, B.; Martinez, K.; Druet, P.; De Baets, M.; Guéry, J.-C. Experimental autoimmune myasthenia gravis may occur in the context of a polarized Th1- or Th2-type immune response in rats. J. Immunol. 1999, 162, 7189–7197. [Google Scholar] [PubMed]
- García-Merino, J.Á.; Moreno-Pérez, D.; De Lucas, B.; Montalvo-Lominchar, M.G.; Muñoz, E.; Sánchez, L.; Naclerio, F.; Herrera-Rocha, K.M.; Moreno-Jiménez, M.R.; Rocha-Guzmán, N.E.; et al. Chronic flavanol-rich cocoa powder supplementation reduces body fat mass in endurance athletes by modifying the follistatin/myostatin ratio and leptin levels. Food Funct. 2020, 11, 3441–3450. [Google Scholar] [CrossRef] [PubMed]
- Shaw, K.; Singh, J.; Sirant, L.; Neary, P.; Chilibeck, P.D. Effect of Dark Chocolate Supplementation on Tissue Oxygenation, Metabolism, and Performance in Trained Cyclists at Altitude. Int. J. Sport Nutr. Exerc. Metab. 2020, 30, 420–426. [Google Scholar] [CrossRef] [PubMed]
- De Carvalho, F.G.; Fisher, M.G.; Thornley, T.T.; Roemer, K.; Pritchett, R.; Freitas, E.C.; Pritchett, K. Cocoa flavanol effects on markers of oxidative stress and recovery after muscle damage protocol in elite rugby players. Nutrition 2019, 62, 47–51. [Google Scholar] [CrossRef]
- Overdevest, E.; Wouters, J.A.; Wolfs, K.H.M.; van Leeuwen, J.J.M.; Possemiers, S. Citrus flavonoid supplementation improves exercise performance in trained athletes. J. Sports Sci. Med. 2018, 17, 24–30. [Google Scholar]
- Van Iersel, L.E.; Stevens, Y.R.; Conchillo, J.M.; Troost, F.J. The effect of citrus flavonoid extract supplementation on anaerobic capacity in moderately trained athletes: A randomized controlled trial. J. Int. Soc. Sports Nutr. 2021, 18, 2. [Google Scholar] [CrossRef]
- Camps-Bossacoma, M.; Pérez-Cano, F.J.; Franch, À.; Castell, M. Theobromine is responsible for the effects of cocoa on the antibody immune status of rats. J. Nutr. 2018, 148, 464–471. [Google Scholar] [CrossRef] [Green Version]
- Camps-Bossacoma, M.; Abril-Gil, M.; Saldaña-Ruiz, S.; Franch, À.; Pérez-Cano, F.J.; Castell, M. Cocoa diet prevents antibody synthesis and modifies lymph node composition and functionality in a rat oral sensitization model. Nutrients 2016, 8, 242. [Google Scholar] [CrossRef] [PubMed] [Green Version]
- Peraldi, M.-N.; Berrou, J.; Dulphy, N.; Seidowsky, A.; Haas, P.; Boissel, N.; Metivier, F.; Randoux, C.; Kossari, N.; Guérin, A.; et al. Oxidative Stress Mediates a Reduced Expression of the Activating Receptor NKG2D in NK Cells from End-Stage Renal Disease Patients. J. Immunol. 2009, 182, 1696–1705. [Google Scholar] [CrossRef] [PubMed] [Green Version]
- Chang, C.W.; Chen, C.Y.; Yen, C.C.; Wu, Y.T.; Hsu, M.C. Repressed exercise-induced hepcidin levels after Danggui Buxue Tang supplementation in male recreational runners. Nutrients 2018, 10, 1318. [Google Scholar] [CrossRef] [Green Version]
- Montagnana, M.; Danese, E.; Lima-Oliveira, G.; Salvagno, G.L.; Lippi, G. Dark chocolate intake acutely enhances neutrophil count in peripheral venous blood. Iran. J. Pathol. 2017, 12, 311–312. [Google Scholar] [CrossRef] [PubMed]
- Heptinstall, S.; May, J.; Fox, S.; Kwik-Uribe, C.; Zhao, L. Cocoa flavanols and platelet and leukocyte function: Recent in vitro and ex vivo studies in healthy adults. J. Cardiovasc. Pharmacol. 2006, 47, 197–205. [Google Scholar] [CrossRef] [PubMed] [Green Version]
- Kliszczewicz, B.M.; Esco, M.R.; Quindry, J.C.; Blessing, D.L.; Oliver, G.D.; Taylor, K.J.; Price, B.M. Autonomic Responses to an Acute Bout of High-Intensity Body Weight Resistance Exercise vs. Treadmill Running. J. Strength Cond. Res. 2016, 30, 1050–1058. [Google Scholar] [CrossRef]
- Kröpfl, J.M.; Stelzer, I.; Mangge, H.; Pekovits, K.; Fuchs, R.; Allard, N.; Schinagl, L.; Hofmann, P.; Dohr, G.; Wallner-Liebmann, S.; et al. Exercise-induced norepinephrine decreases circulating hematopoietic stem and progenitor cell colony-forming capacity. PLoS ONE 2014, 9, e106120. [Google Scholar] [CrossRef]
- Tsang, C.; Hodgson, L.; Bussu, A.; Farhat, G.; Al-Dujaili, E. Effect of polyphenol-rich dark chocolate on salivary cortisol and mood in adults. Antioxidants 2019, 8, 149. [Google Scholar] [CrossRef] [Green Version]
- Su, S.; Chen, H.; Jen, C.J. Severe exercise enhances phagocytosis by murine bronchoalveolar macrophages. J. Leukoc. Biol. 2001, 69, 75–80. [Google Scholar] [CrossRef]
- Ortega, E. Neuroendocrine mediators in the modulation of phagocytosis by exercise: Physiological implications. Exerc. Immunol. Rev. 2003, 9, 70–93. [Google Scholar]
- Ellinger, S.; Stehle, P. Impact of cocoa consumption on inflammation processes—A critical review of randomized controlled trials. Nutrients 2016, 8, 321. [Google Scholar] [CrossRef] [PubMed]
- Mckune, A.J.; Smith, L.L.; Semple, S.J. Influence of ultra-endurance exercise on immunoglobulin isotypes and subclasses. Br. J. Sports Med. 2005, 39, 665–670. [Google Scholar] [CrossRef] [PubMed] [Green Version]
- Hejazi, K.; Reza, S.; Hosseini, A. Effect of Selected Exercise on Serum Immunoglobulin (IgA, IgG, and IgM) In Middle-Endurance Elite Runners. Int. J. Sport Stud. 2012, 2, 509–514. [Google Scholar]
- Vahid, I.; Valiollah, S.; Mehdi, A. The effects of physical activity on homoral immune system. Procedia-Soc. Behav. Sci. 2009, 1, 2718–2721. [Google Scholar] [CrossRef] [Green Version]
- Massot-Cladera, M.; Franch, A.; Castellote, C.; Castell, M.; Pérez-Cano, F.J.; Franch, À.; Castellote, C.; Castell, M.; Pérez-Cano, F.J. Cocoa flavonoid-enriched diet modulates systemic and intestinal immunoglobulin synthesis in adult Lewis rats. Nutrients 2013, 5, 3272–3286. [Google Scholar] [CrossRef] [Green Version]
- Massot-Cladera, M.; Franch, À.; Pérez-Cano, F.J.; Castell, M. Cocoa and cocoa fibre differentially modulate IgA and IgM production at mucosal sites. Br. J. Nutr. 2016, 115, 1539–1546. [Google Scholar] [CrossRef] [Green Version]
- Pérez-Berezo, T.; Franch, A.; Ramos-Romero, S.; Castellote, C.; Pérez-Cano, F.J.; Castell, M. Cocoa-enriched diets modulate intestinal and systemic humoral immune response in young adult rats. Mol. Nutr. Food Res. 2011, 55, 56–66. [Google Scholar] [CrossRef]


Publisher’s Note: MDPI stays neutral with regard to jurisdictional claims in published maps and institutional affiliations. |
© 2022 by the authors. Licensee MDPI, Basel, Switzerland. This article is an open access article distributed under the terms and conditions of the Creative Commons Attribution (CC BY) license (https://creativecommons.org/licenses/by/4.0/).
Share and Cite
Ruiz-Iglesias, P.; Massot-Cladera, M.; Pérez-Cano, F.J.; Castell, M. Influence of Diets Enriched with Flavonoids (Cocoa and Hesperidin) on the Systemic Immunity of Intensively Trained and Exhausted Rats. Biomolecules 2022, 12, 1893. https://doi.org/10.3390/biom12121893
Ruiz-Iglesias P, Massot-Cladera M, Pérez-Cano FJ, Castell M. Influence of Diets Enriched with Flavonoids (Cocoa and Hesperidin) on the Systemic Immunity of Intensively Trained and Exhausted Rats. Biomolecules. 2022; 12(12):1893. https://doi.org/10.3390/biom12121893
Chicago/Turabian StyleRuiz-Iglesias, Patricia, Malén Massot-Cladera, Francisco J. Pérez-Cano, and Margarida Castell. 2022. "Influence of Diets Enriched with Flavonoids (Cocoa and Hesperidin) on the Systemic Immunity of Intensively Trained and Exhausted Rats" Biomolecules 12, no. 12: 1893. https://doi.org/10.3390/biom12121893