Article

Improvement of Biomass and Phycoerythrin Production by a Strain of Rhodomonas sp. Isolated from the Tunisian Coast of Sidi Mansour

1
Laboratoire de Génie Enzymatique et Microbiologie, Equipe de Biotechnologie des Algues, Ecole Nationale d’Ingénieurs de Sfax, University of Sfax, 3038 Sfax, Tunisia
2
Department of Chemical, Biological, Pharmaceutical and Environmental Sciences, University of Messina, Viale F. Stagno d’Alcontres, 31, 98166 Messina, Italy
3
Institut Pascal, Université Clermont Auvergne, CNRS, Clermont Auvergne INP, 63178 Clermont-Ferrand, France
4
Laboratory of Plant Biotechnology, Faculty of Sciences of Sfax, University of Sfax, 3038 Sfax, Tunisia
*
Authors to whom correspondence should be addressed.
Biomolecules 2022, 12(7), 885; https://doi.org/10.3390/biom12070885
Submission received: 26 April 2022 / Revised: 17 June 2022 / Accepted: 18 June 2022 / Published: 24 June 2022

Abstract

:
Microalgae are photoautotrophic microorganisms known as producers of a large variety of metabolites. The taxonomic diversity of these microorganisms has been poorly explored. In this study, a newly isolated strain was identified based on the 18S rRNA encoding gene. The phylogenetic analysis showed that the isolated strain was affiliated with the Rhodomonas genus. This genus has greatly attracted scientific attention according to its capacity to produce a large variety of metabolites, including phycoerythrin. Growth and phycoerythrin production conditions were optimized using a Plackett–Burman design and response surface methodology. An expression profile analysis of the cpeB gene, encoding the beta subunit of phycoerythrin, was performed by qRT-PCR under standard and optimized culture conditions. The optimization process showed that maximum cell abundance was achieved under the following conditions: CaCl2 = 2.1328 g/L, metal solution = 1 mL/L, pH = 7 and light intensity = 145 μmol photons/m2/s, whereas maximum phycoerythrin production level occurred when CaCl2 = 1.8467 g/L, metal solution = 1 mL/L, pH = 7 and light intensity = 157 μmol/m2/s. In agreement, positive transcriptional regulation of the cpeB gene was demonstrated using qRT-PCR. This study showed the successful optimization of abiotic conditions for highest growth and phycoerythrin production, making Rhodomonas sp. suitable for several biotechnological applications.

1. Introduction

Microalgae are photosynthetic organisms classified based on their color into four groups, namely, red, green, blue-green and brown microalgae. They are able to synthesize a large variety of metabolites such as proteins, lipids, carbohydrates and pigments [1,2,3,4,5]. These compounds may serve in several biotechnological fields including food, cosmetics, as well as the biomedical and pharmaceutical sectors [6,7,8,9].
Among these metabolites, phycobiliproteins (PBPs) are the major pigments of red algae, Cyanobacteria and Cryptophyta. They have attracted great attention from the scientific community thanks to their spectral, fluorescent and colorant properties [10]. These chromoproteins are light-harvesting compounds absorbing in a spectral region different to that of chlorophylls [11,12]. Phycobiliproteins can be classified into phycoerythrins (PEs; λmax = 540–570 nm), phycocyanins (PCs; λmax = 610–620 nm), allophycocyanins (APCs; λmax = 650–655 nm) and phycoerythrocyanins (PECs; λmax = 560–600 nm) [13,14].
In red algae (Rhodophyta) and Cyanobacteria, PBPs are organized into phycobilisomes, but in cryptomonads, the phycobiliprotein antenna is usually unique and located in the thylakoid lumen [15,16,17,18]. Phycoerythrins are the major light harvesting pigments for Cryptophyta species [1]. They can be used in several biotechnological applications, including food, cosmetic, immunochemistry, clinical diagnostics, biological engineering as well as the therapeutic field [7,8,19,20]. Thus, the enhancement of PE biosynthesis, as well as an understanding of its regulatory pathway, are of interest. Cryptophyta microalgae belonging to Rhodomonas genus are known as potential candidates for PE production, as this pigment represent about 51% of total pigments produced by some strains of this genus [21]. Many abiotic factors affect PE production by Rhodomonas genus, including temperature, nutrient concentrations, light quality (wavelength) and intensity [22,23,24]. In fact, high temperature and nitrate concentration combined with low light intensity enhanced PE content in R. salina [22]. The crystal structure of phycoerythrin from the marine cryptophyte Rhodomonas has been determined [25]. It is an α1α2ββ heterodimeric protein encoded by the cpeB cpeA operon that is partially regulated by light quality [11,13,26].
The aim of this work was first to optimize the culture conditions for providing high phycoerythrin production by a newly isolated microalga, Rhodomonas sp., and then to investigate the phycoerythrin production profile under optimal and standard experimental conditions, with a corresponding transcriptome analysis.

2. Materials and Methods

2.1. Isolation of Axenic Monoclonal Cultures

Microalgae cells were isolated from the Tunisian Coast of Sidi Mansour (governorate of Sfax, Mediterranean Sea) (Latitude: 34°47′41.8″ N; Longitude: 10°51′06.9″ E) in January 2018. Water samples were collected from the sampling site using a plastic bucket. The collected seawater samples were loaded into a sterile transparent glass jar and transported in an isotherm icebox to the Biotechnology Unit of Algae (UBA), where they were immediately processed. Seawater samples were subjected to successive filtration. Firstly, a 60 µm pore size membrane was used to eliminate protozoa. Then, the obtained filtrates underwent filtration with a 2.5 μm pore size membrane to remove bacteria. Each membrane was divided afterwards into two portions: the first portion was flooded with 100 mL of F/2 Provasoli medium [27] (Supplementary Table S1) and the second was immersed into 50 mL of Pm medium (Supplementary Table S1) [27,28]. Algal growth was monitored using an inverted microscope (Motic microscope AE 2000, Barcelona, Spain). Pure cultures were obtained by micromanipulation after serial dilutions and successive plating on agar media [4]. The obtained isolated strain was maintained in F/2 medium at 23 ± 2 °C continuously illuminated by white light with an intensity irradiance of approximately 80 µmol/m2/s. The algae density was measured daily by measuring optical density (OD) at 550 nm and cell counting using a Malassez counting chamber and an inverted microscope (Motic microscope AE 2000, Barcelona, Spain).

2.2. DNA Extraction, PCR Amplification, Sequencing and Phylogenetic Analysis

Genomic DNA from the newly isolated strain was extracted using Pure link Genomic DNA Mini kit (Invitrogen, Waltham, MA, USA) according to the manufacturer’s protocol. Two universal primers were used for the PCR reaction to amplify the 18S rRNA gene (Table 1) [29]. PCR was performed as described by Fendri et al. [30]. After purification of the PCR products, sequencing with EukA and EukB primers was performed [31]. The obtained sequences were compared with the sequences available in GenBank using the BLAST server from the NCBI website (http://www.ncbi.nlm.nih.gov/BLAST; accessed on 1 June 2019).

2.3. Growth and Phycoerythrin Accumulation

Five growth media were tested for isolated microalgae growth: BG-11 [32], standard and modified F/2 [27], Pm [33] and sterilized artificial seawater (Supplementary Table S1).
PE production was monitored every 48 h for 21 days. PE extraction was performed according to the method reported by Gargouch et al. [20]. Two mL of microalgal culture were centrifuged at 7200× g for 10 min. Pellets were suspended in 1 mL of sodium phosphate buffer (0.1 M, pH 6.0) and cell lysis was performed with a combination of repetitive freeze-thaw cycles followed by sonication for 10 min. Samples were maintained at 4 °C for 4 h to ensure maximum extraction of pigments [34] and centrifuged at 10,000× g for 30 min at 4 °C. Supernatants were collected and PE concentration was calculated according to Lawrenz et al. [34] using Equation (1):
PE (µg/L) = (A545 − A750)/ɛd × Mw × Vsample/Vbuffer × 106
where ε and Mw are the molar extinction coefficients (2.41 × 10⁶ L/mol/cm) and molecular weight of the phycoerythrin (240,000 g/mol), respectively, d is the path length of the cuvette, and Vsample and Vbuffer are the volume of the sample and buffer, respectively.

2.4. Experimental Design and Data Analysis

2.4.1. Screening of Factors Influencing Phycoerythrin Production

In order to screen the main factors affecting the production of PE, a Plackett–Burman statistical experimental design was performed. Thirteen variables were chosen, corresponding to all modified F/2 medium components as well as pH and light intensity. Each independent variable was investigated at a high (+1) and a low (−1) level based on bibliographic data. Table 2 presents all factors and the tested levels.
Each experiment was performed in 250 mL Erlenmeyer flasks containing 100 mL culture media and inoculated with the exponentially growing microalgae culture at 10% (v/v). All experiments were performed in duplicate and PE production level was assessed after 16 days of incubation at 25 °C. A Plackett–Burman design was carried out using STATISTICA software 12.0 (Stat Soft. Inc., 1984–2014, Tulsa, OK, USA). Plackett–Burman data analysis allowed the identification of factors that had a significant effect, either positively or negatively, on PE production.

2.4.2. Optimization of Growth and Phycoerythrin Production Using a Box–Behnken Model

A Box–Behnken design was employed to study the interaction effects between four significant variables identified by Plackett–Burman design to determine their optimal levels. Based on the results of a preliminary experiment, the ranges of the variables were chosen (Table 3). A total of 27 trials were performed, and the independent variables were investigated at three different levels (−1, 0 and +1). All experiments were performed in duplicate, as described previously (Section 2.4.1.). The amount of PE (YPE) and biomass abundance (YBiomass) were determined after 16 days of incubation at 25 °C and compared for each combination of the independent variables. The amount of PE was determined by the method mentioned above. Biomass abundance was determined as previously described [35]. Briefly, cells were harvested by centrifugation at 10,000× g for 10 min and washed twice with sterile distilled water. The obtained fresh biomass was then oven-dried at 105 °C until a constant weight.
Subsequently, response surface methodology (RSM) was used to determine their optimal levels and to study individual and mutual interactions among the tested variables [36]. A second-degree polynomial equation was used to calculate the relationship between the independent variables and the design experiment responses, YPE and YBiomass. Given all linear, square and interaction coefficients, the quadratic regression model can be illustrated as follows:
Y = β0 + Σ βiXi + Σ βijXiXj + ΣβiiXi2
where Y is the predicted response; β0 is the intercept term; βi is the linear coefficient; βii is the quadratic coefficient; βij is the interaction coefficient. Xi and Xj are the levels of the independent variables. The dependent response value was the mean of two independent experiments. The independent variables and the dependent output responses were modelled using an analysis of variance (ANOVA) to justify the adequacy of the models using Nemrod-W® software (LPRAI, Marseille, France). The chosen confidence interval was of the order of 95%, corresponding to p < 0.05.

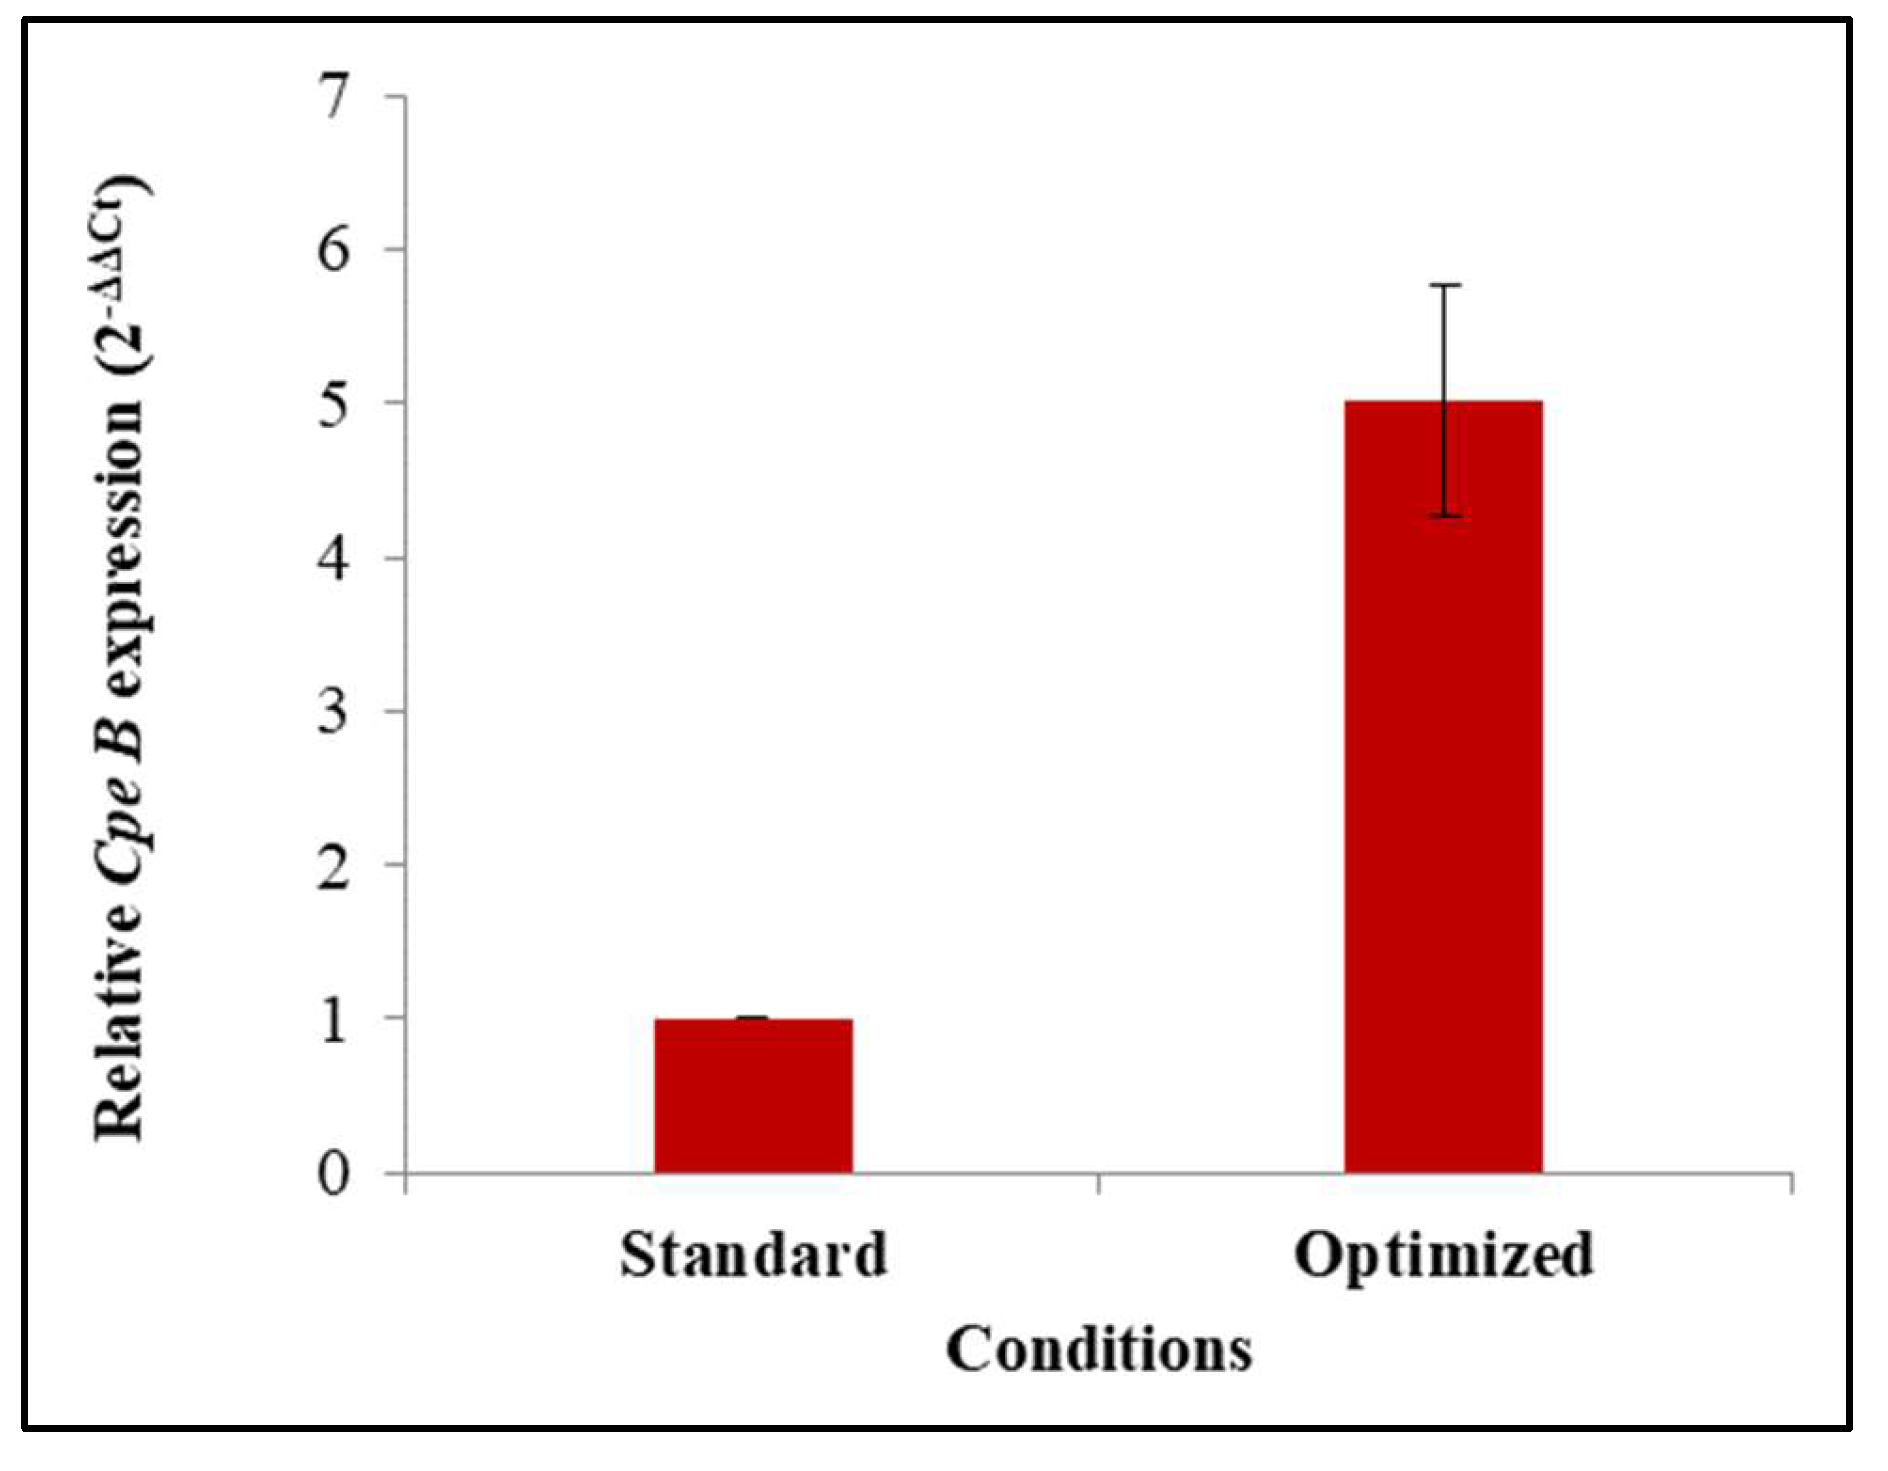
2.5. Gene Expression Analysis

Day 15-aged cells from standard and optimized cultures were harvested by centrifugation at 10,000× g for 10 min at 4 °C and used for total RNA extraction using TRIzol reagent (Invitrogen, Carlsbad, CA, USA) according to the protocol adapted from Meng and Feldman [37]. Briefly, pellets were suspended in 1 mL of TRIzol reagent and vortexed until total dissolution. Then, 200 µL of chloroform was added and the mixtures were incubated for 2 min and then centrifuged at 12,000× g at 4 °C for 15 min. The upper aqueous phases were recovered and mixed with isopropyl alcohol and then incubated for 10 min. After centrifugation at 12,000× g at 4 °C for 10 min, pellets were dissolved with 75% ethanol and incubated overnight at −20 °C. The mixtures were then centrifuged at 7500× g at 4 °C for 5 min and the pellets were dried. Total RNA was then dissolved in RNase-free water and stored at −80 °C. The resulting total RNA was analyzed using agarose gel electrophoresis (2%) [38] and its purity and quantity were determined spectrometrically using a NanoDrop 2000 spectrometer (Thermo Scientific, Waltham, MA, United States).
One µg of each RNA sample was used for cDNA synthesis using PrimeScript™ RT Reagent Kit with gDNA Eraser (Perfect Real Time) (Takara, Kyoto, Japan) according to the manufacturer’s procedure. Real-time q-PCR was conducted for cpeB gene (Table 1). All q-PCR assays were carried out on a StepOnePlus™ PCR cycler (Applied Biosystems, Foster City, CA, USA). Amplification reactions were performed in a 20-μL reaction mix containing 10 μL of TB Green Premix Ex Taq II (Tli RNase H Plus) (2x) (Takara, Kyoto, Japan), 1 μM of each primer (Bio Basic Canada Inc, Markham, Canada), and 3 μL of each appropriate cDNA sample. The used cycling conditions were 30 s at 95 °C, followed by 40 cycles of 15 s at 95 °C and 1 min at 60 °C. At the end of the q-PCR cycles, the amplification specificity of each primer pair was verified with a fusion step performed by heating from 60 °C to 95 °C. All experiments were run in triplicate. The α-tubulin gene was used as a housekeeping gene (Table 1). Reactions with an amplification efficiency between 95% and 105% were considered acceptable [39,40,41]. Relative mRNA expression values were determined with the 2-ΔΔCt method [42,43].

2.6. Statistical Analysis

The occurrence of statistically significant differences in the analyzed data was determined using a one-way ANOVA followed by Duncan multiple range tests. Differences were considered significant at p < 0.05. All analyses were carried out using SPSS 17.0 software (SPSS, Inc., Chicago, IL, USA). All measurements were made in triplicate and the results were expressed as means.

3. Results

3.1. Isolation and Identification of the Microalgae Strain

A microalgae strain was isolated from the Sfax coast and identified as belonging to the Cryptophyceae class based on morphometric characteristics using light microscopy. The 18S rRNA coding gene from the newly isolated strain was successfully amplified and partially sequenced using universal primers (Table 1) (Supplementary Table S2). The BLASTn results for the obtained 18S rDNA sequence showed 88.89% identity with the Rhodomonas genus.

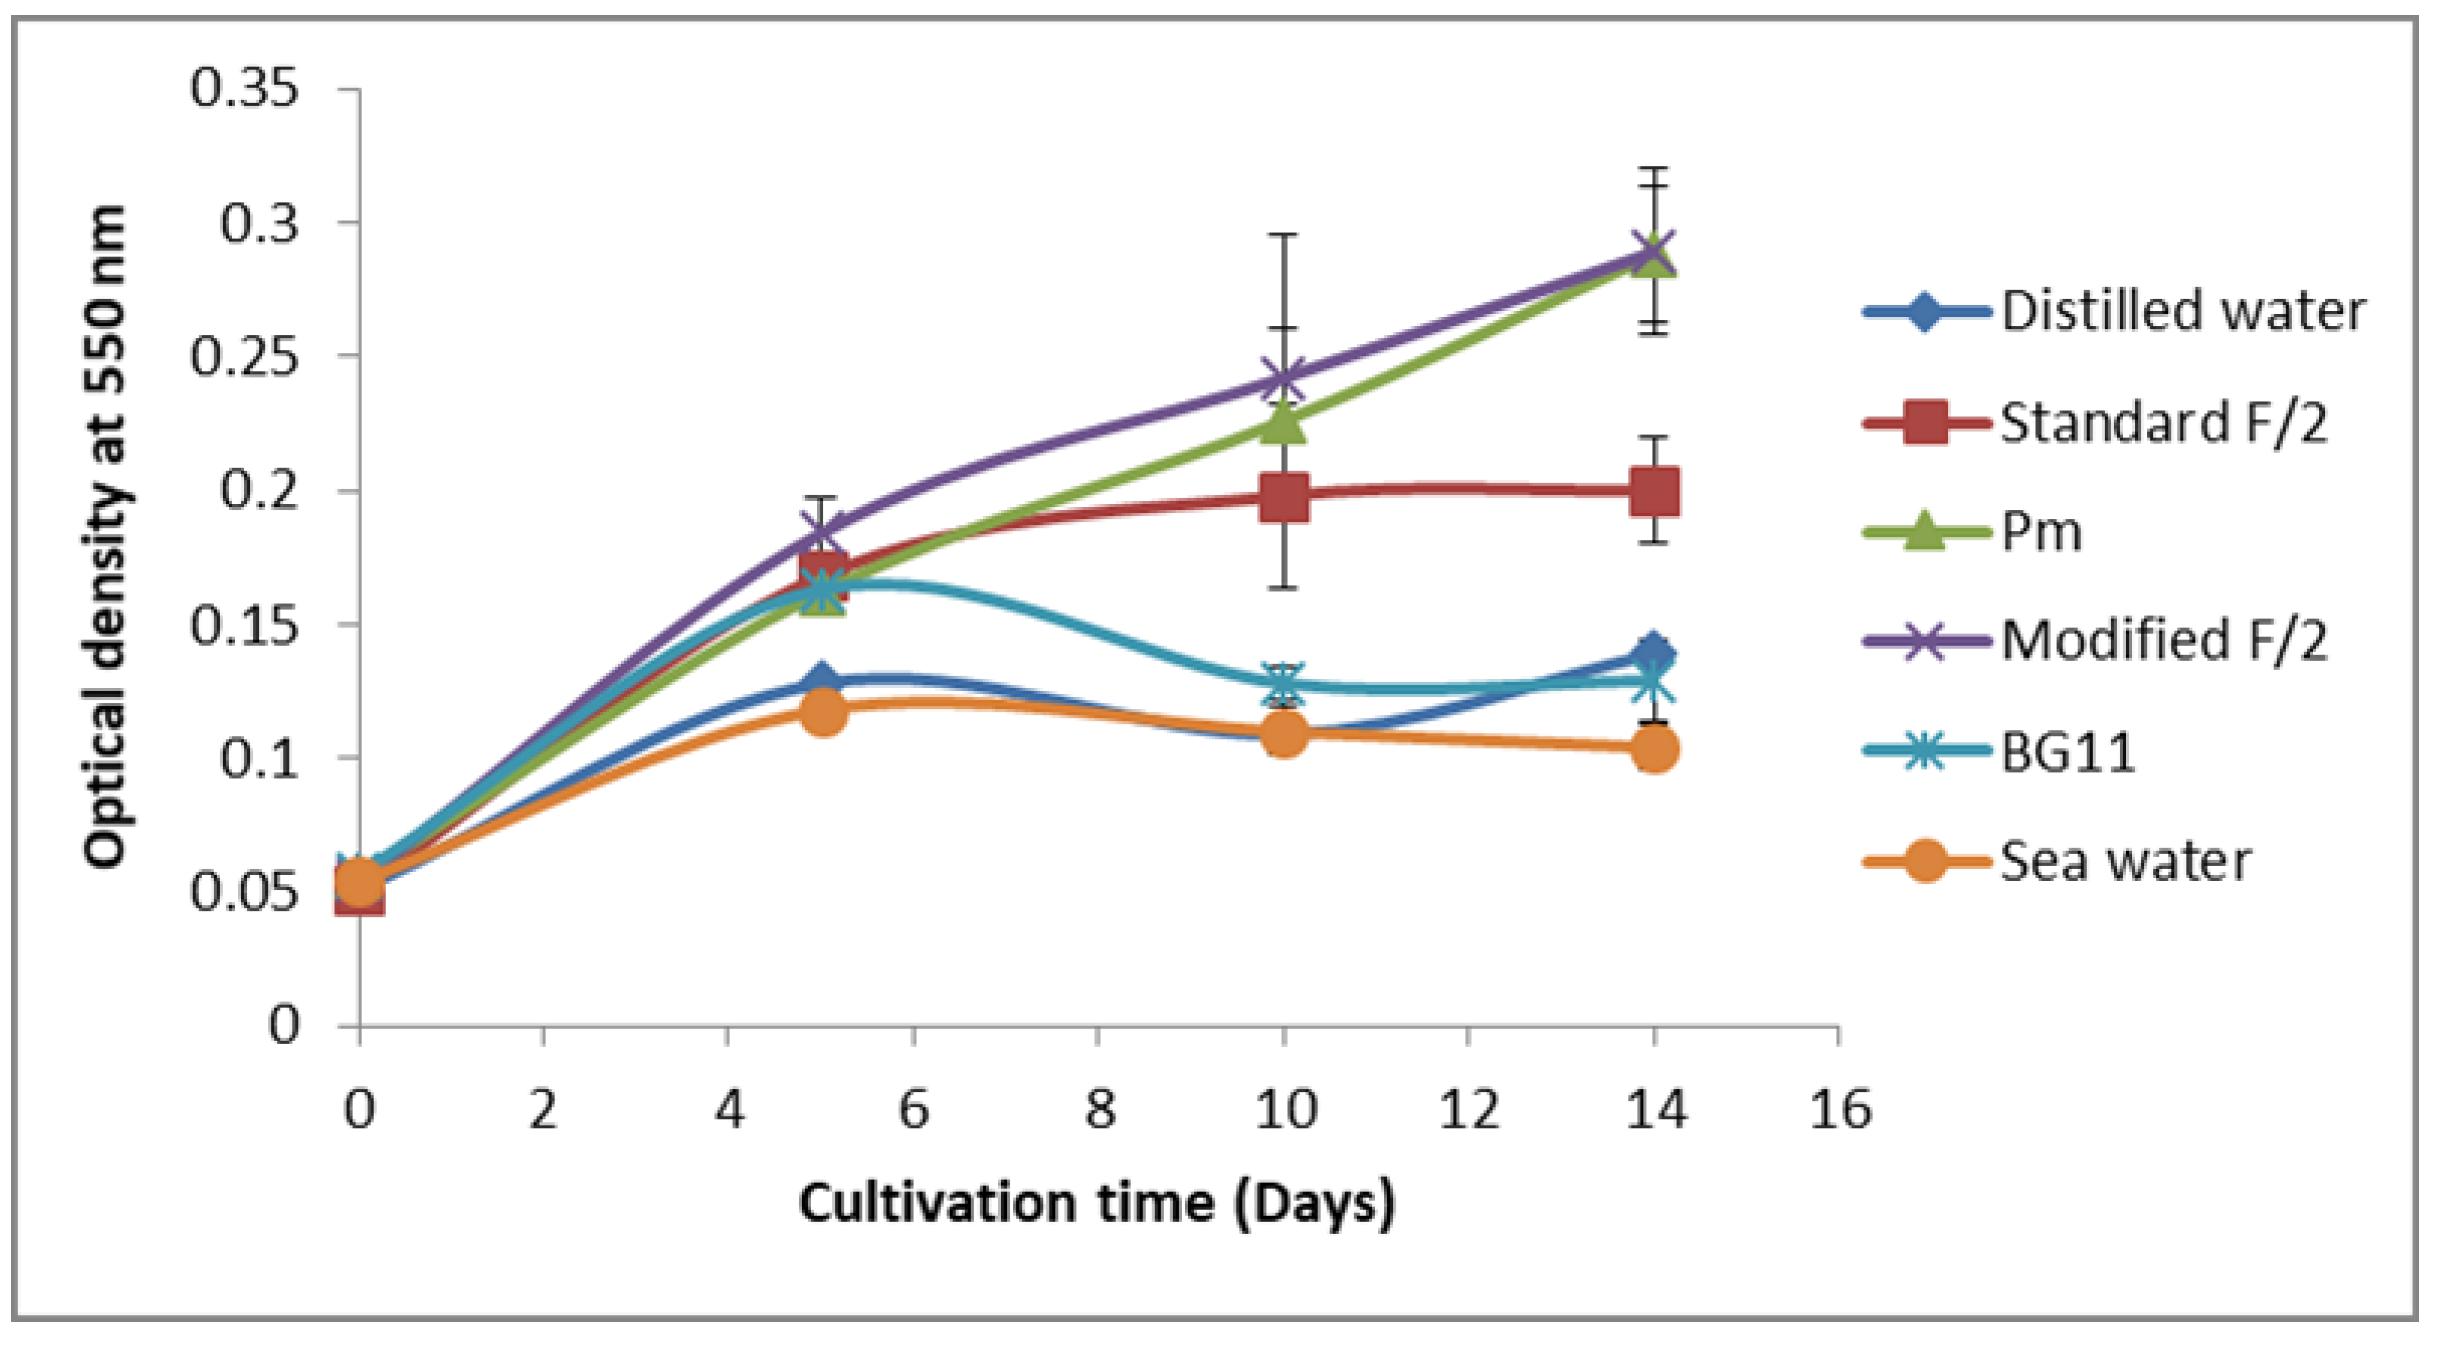
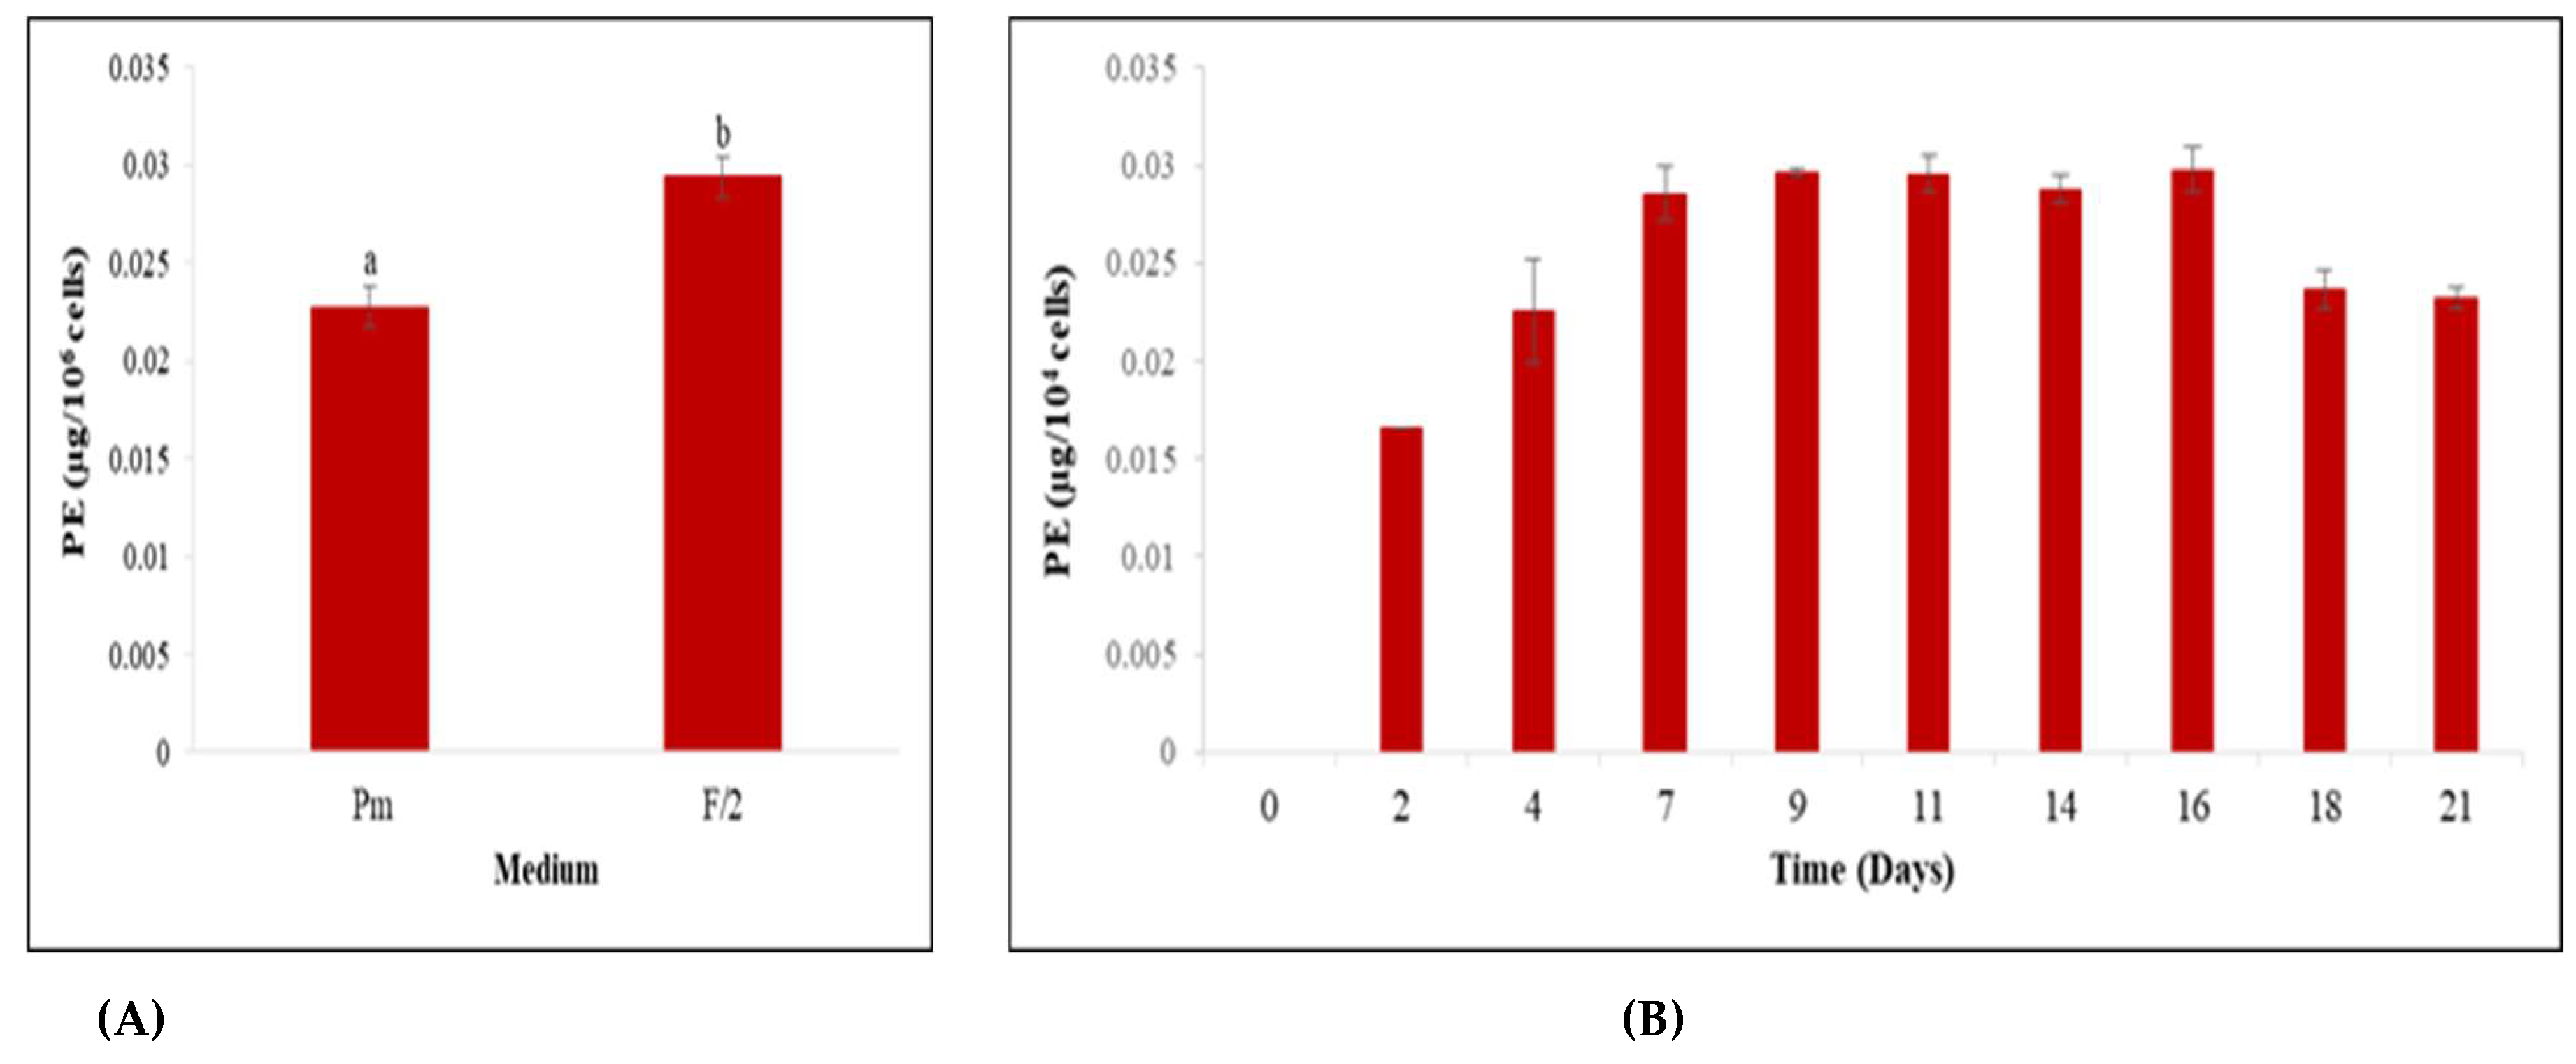
3.2. Screening for Culture Media Suitable for Cell Growth and Phycoerythrin Production

Different culture media with diverse chemical compositions were tested to select the best growth medium and the most suitable one for PE production (Figure 1 and Figure 2).
Data presented in Figure 1 showed that the maximum growth of Rhodomonas sp. was supported by modified F/2 and Pm media. Thus, PE production by Rhodomonas sp. was then evaluated for these two media.
Regarding PE production, the obtained results (Figure 2A) demonstrated that the PE yield obtained from Rhodomonas sp. cells was significantly better when cultured in modified F/2 medium than Pm medium (p < 0.05). Therefore, modified F/2 was selected for the rest of this study.
To determine the optimum time required for PE production by Rhodomonas sp. cells, both cell growth and PE production rates in accordance with time were taken into consideration. The obtained results, summarized in Figure 2B, showed that Rhodomonas sp. reached the highest PE content of 0.29 µg/104 cells on day 16, which coincides with the stationary phase.

3.3. Screening of Factors Influencing Phycoerythrin Production

A Plackett–Burman design was used to evaluate the effects of all components of modified F/2 medium, as well as pH and light intensity, on phycoerythrin production. Table 4 illustrates the statistical significance of the variables, as determined by Student’s t-test.
Results from the Plackett–Burman design revealed that CaCl2 concentration (X3), metal solution (X10), light intensity (X12) and pH (X13) were the most significant factors affecting PE production, and thus, were selected for further optimization using Box–Behnken design. As shown in Table 5, metal solution and pH exerted a negative effect on PE production, whereas the PE rate reached higher values with high light intensities and CaCl2 concentrations. Other low significant and insignificant variables were maintained in all subsequent trials according to their concentration in modified F/2 medium for further optimization by Box-Behnken design.

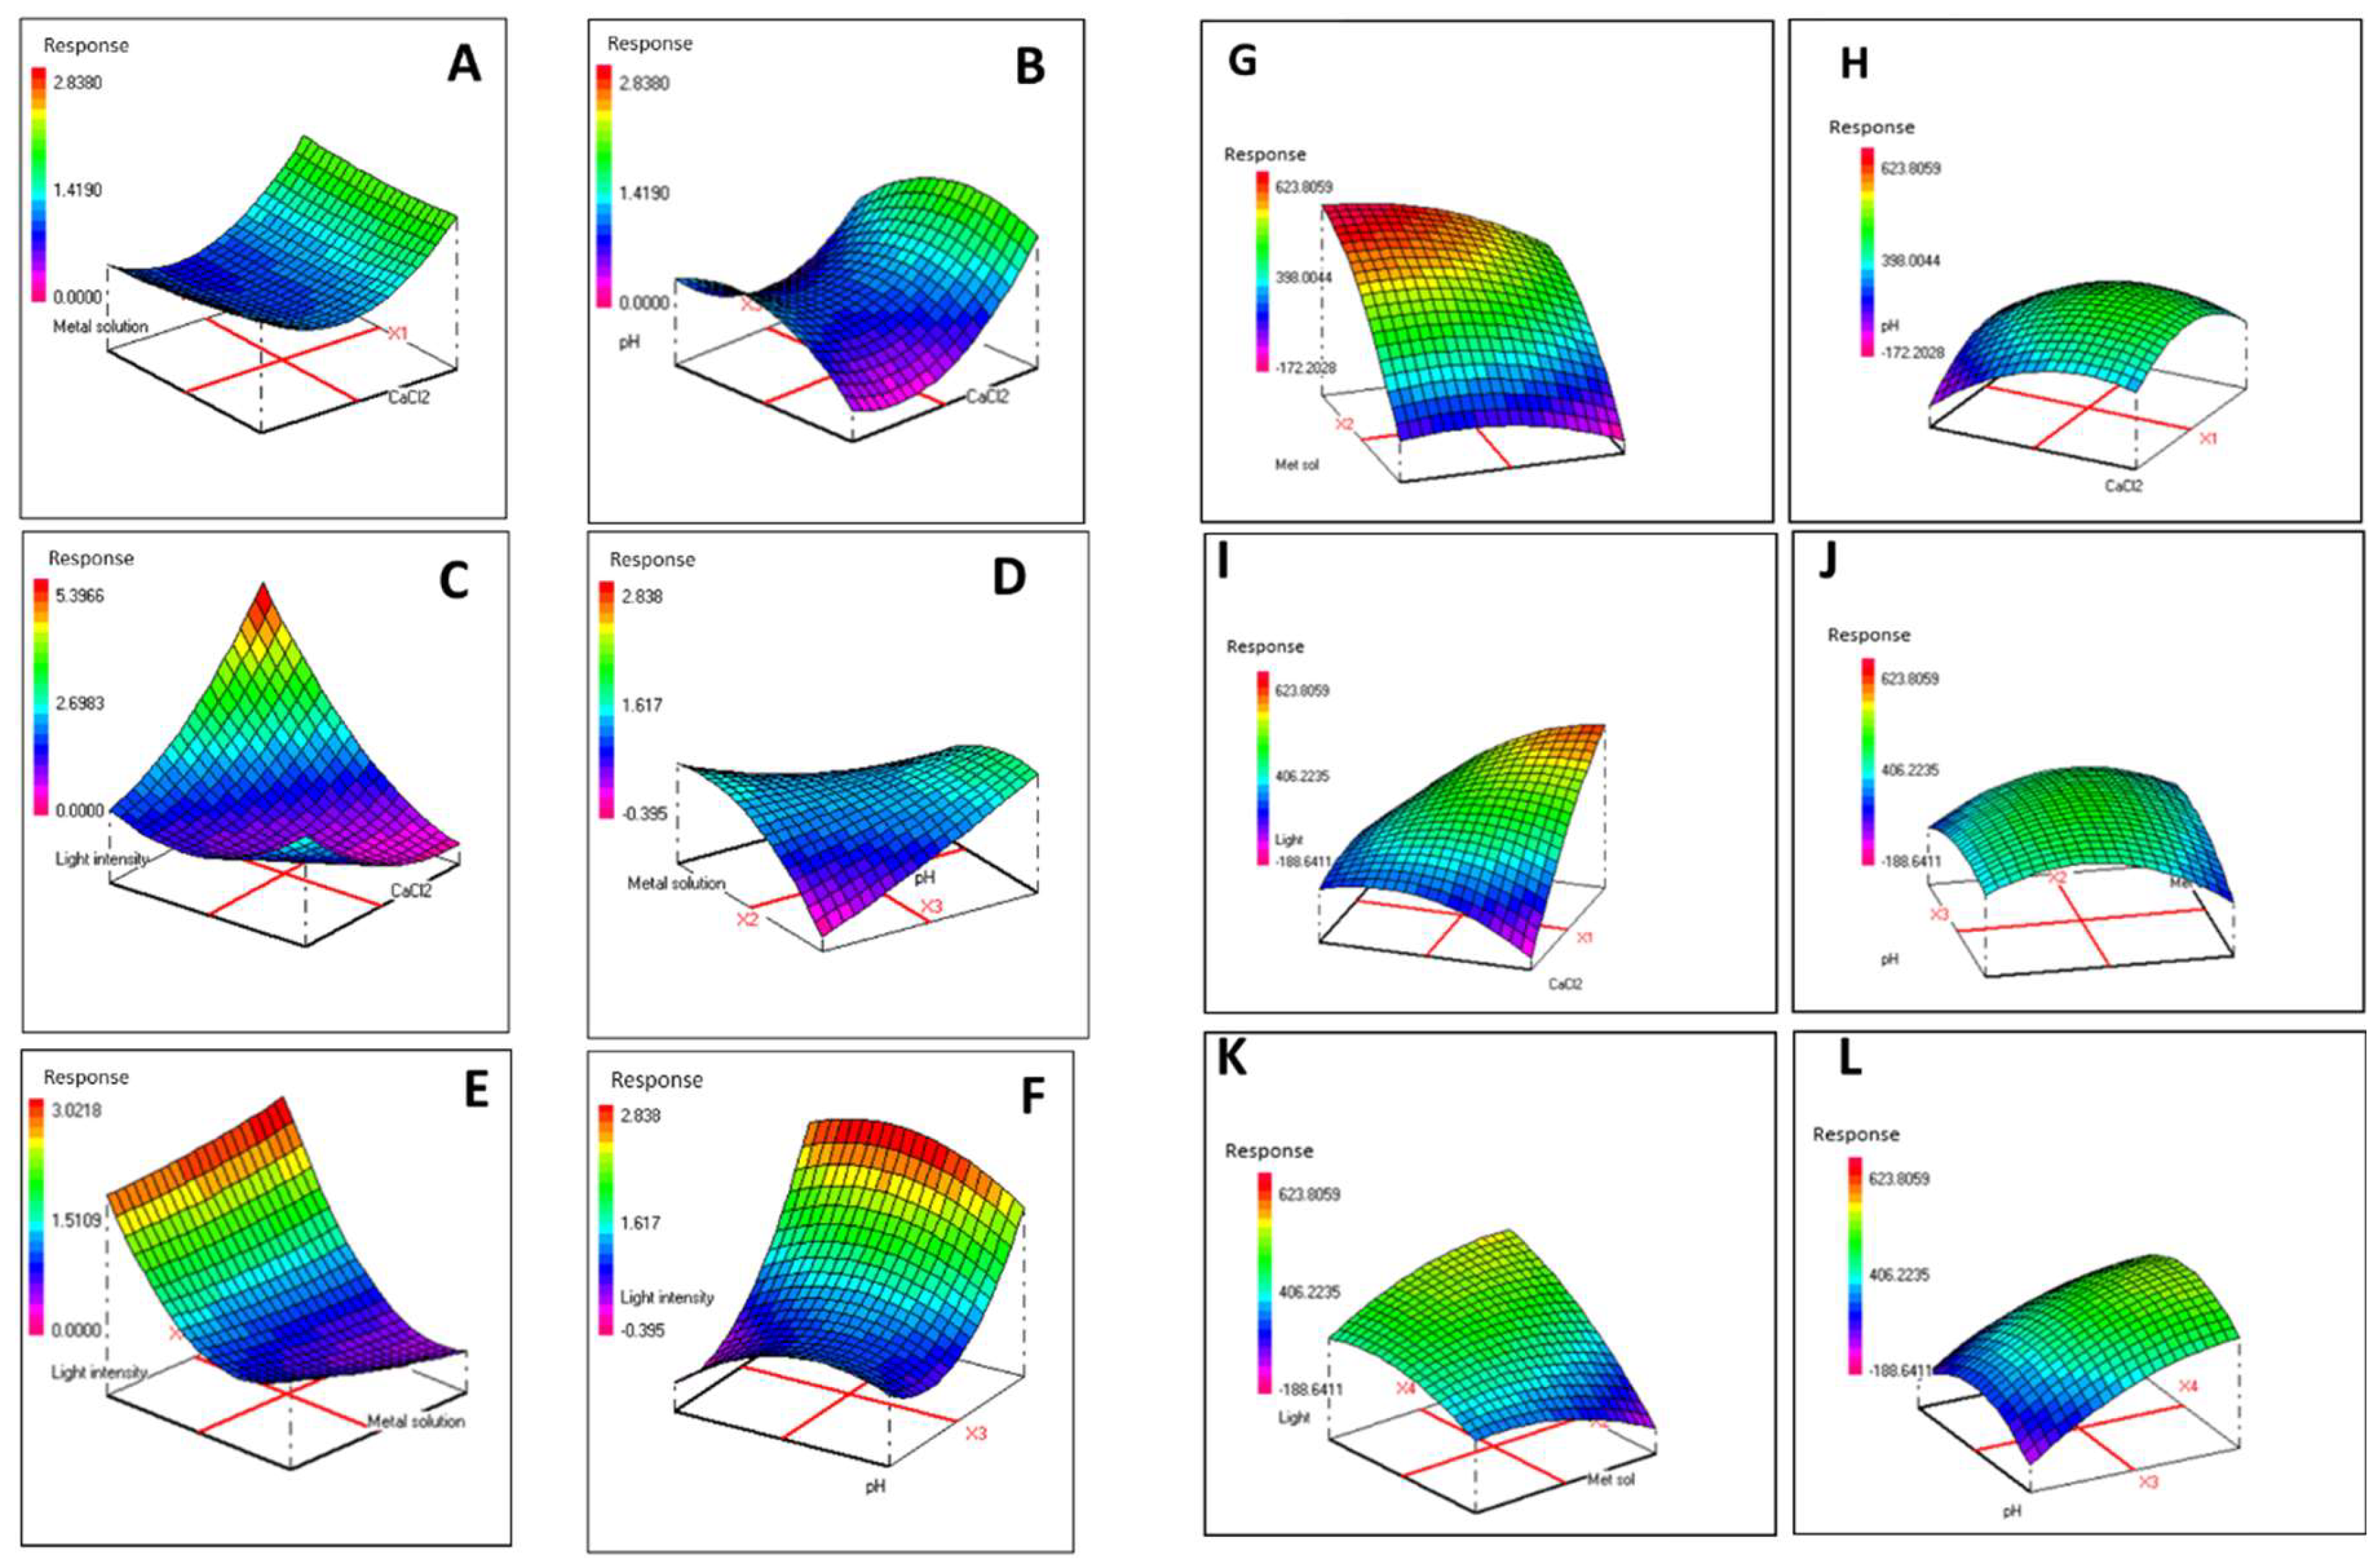
3.4. Combined Effects of Modified F/2 Medium Components on Biomass and Phycoerythrin Production

After selecting the most significant factors for PE production based on the data obtained from the Plackett–Burman plan, a Box–Behnken design was used in order to accomplish the optimization of the selected variables by studying their effects on PE production as well as biomass accumulation. Table 3 summarizes the variables and experimental levels used for optimizing culture conditions. Twenty-seven experiments were carried out, and the relationship between the independent variables and both responses (PE production and biomass accumulation) were determined by multiple-regression statistical analysis. The regression variables for the predicted response surface quadratic model are presented in Table 6 and Table 7.
An ANOVA was conducted to test the significance of the fit of the second-order polynomial equation to the experimental data, as given in Table 8 and Table 9. Statistical significance of the variables and their interactions at various levels of probability are depicted based on a distribution test and analysis of variance fitted to second-order polynomial Equation (2). The most significant corresponding coefficients were selected. The obtained results revealed linear and quadratic effects of light intensity, X4 and X42, respectively, and the interaction between light intensity and CaCl2 had a highly positive significant effect on the production of PE (Table 8).
Regarding biomass accumulation, it was found that CaCl2 concentration (X1) as well as light intensity (X4) had highly positive significant effects. The quadratic significant effect of pH (X3 2) was identified as negative, whereas CaCl2 concentration (X1 X4) presented a positive effect on biomass production (Table 9).
Therefore, Equation (2) was rearranged to Equations (3) and (4).
YPE = 0.8115 + 0.7468 X4 + 0.4625 X42 + 0.7845 X1X4
YBiomass = 283.33333 + 67.70833 X1 + 120.87500 X4 − 79.72917 X32 + 96.87500 X1X4
where YPE and YBiomass represent the predicted PE production level and biomass accumulation, respectively. The obtained results showed a non-significant value for the lack of fit (p > 0.05) as well as highly significant R2 values of 0.86 and 0.83 related to PE production and biomass accumulation, respectively.
Response surface methodology (RSM) was then used to examine the effect of interactions between the tested variables on PE production and biomass accumulation. Three dimensional (3D) plots were used to visualize the relationship between two parameters while the other parameters were held constant (Figure 3). The effects of light intensity and CaCl2 concentration on PE production and biomass accumulation are shown in Figure 3C.I, respectively. PE production clearly increased as light intensity and CaCl2 concentration increased. Similar results were obtained for biomass accumulation.
Accordingly, optimized PE production (5.36 ± 0.68% of DW) was obtained under the following conditions: CaCl2 = 1.8467 g/L, metal solution = 1 mL/L, pH = 7 and light intensity = 157 μmol/m2/s. Maximum biomass accumulation (633.33 ± 57.73 mg/L) was achieved using 2.1328 g/L CaCl2, 1 mL/L of metal solution, pH 7 and 145 μmol/m2/s light intensity.
By comparison, PE production and biomass accumulation under standard conditions (1.08 ± 0.04% of DW and 333.33 ± 28.86 mg/L, respectively) were enhanced by about 5- and 2-fold, respectively, using the optimized conditions.
3.5. cpeB Gene Expression Profile under Optimal Conditions
Due to the capacity of Rhodomonas sp. to produce PEs [23], an understanding of regulatory mechanisms involved in its synthesis is of great interest. Therefore, the expression level of the cpeB gene was investigated. Reverse transcription (RT) followed by the real-time polymerase chain reaction was used to analyze mRNA expression in microalgae cells cultured under optimized and standard conditions. To investigate physiological changes in cpeB gene expression, the relative expression of cpeB target gene versus the α-tubulin reference gene was determined. The obtained results showed that the expression level of the cpeB gene was up-regulated by approximately 5-fold by the optimal conditions for PE production compared to the control (Figure 4). Thus, modulation of the expression of the cpeB gene, coding for a PE subunit, proves the existence of a transcriptional regulatory mechanism.

4. Discussion

Thanks to their various interesting biotechnological applications in food, pharmaceuticals, and cosmetics industries, phycobiliproteins attract the attention of researchers and consumers. However, market development of this pigment is dependent on limiting the costs for large-scale production. Cryptophyte microalgae are one possible source of phycobiliproteins, especially PE. Members of the Rhodomonas genus, belonging to Cryptophyte microalgae, are typically found in marine environments, although freshwater strains have been reported [42], and are known to be good producers of PE. In the present study, a Rhodomonas sp. strain has been isolated from the local marine environment showing potential for PE production. The monitoring of PE production showed that the highest PE yield was reached on day 16 of culture, which correspond to the stationary phase. This result is in concordance with previous data reported by Marraskuranto et al. in 2018 [44]. Many publications support that abiotic factors have substantial effects on biomass and pigments production. It has been shown that the amount of PE accumulating in Rhodomonas sp. depends on cultivation conditions [24,45]. Thus, an experimental screening of the factors that could impact the production of PE was performed using a Plackett–Burman design. The obtained results revealed that CaCl2 concentration, metal solution, pH and light intensity were the most important PE production variables. It has previously been reported that PE production by R. salina could be affected by a variety of abiotic factors, particularly temperature, nutrients, light quality and intensity [22,23,24].
After selecting the most significant factors for PE production, a Box–Behnken design was used in order to accomplish the optimization of the selected factors by studying their effects as well as their interactions. Regarding the optimization of PE content, CaCl2 concentration and light intensity were the two main factors impacting PE production by Rhodomonas sp. (Figure 3). In fact, the highest PE yield (5.36 ± 0.68% of DW) was achieved by increasing the light intensity and CaCl2 concentration to 157 μmol/m2/s and 1.8467 g/L, respectively, and fixing the metal solution and pH factors at 1 mL/L and 7, respectively. Interestingly, PE synthesis increased significantly under optimized conditions by approximately 5-fold compared to the control. In concordance, Chaloub et al. [12] and Xie et al. [14] reported that PE production by Rhodomonas genus depended on light quality and quantity [14,24]; however, R. salina culture at pH 8.5 and 40% salinity also increased phycoerythrin productivity [46]. It is important to note that these studies were performed for a shorter culture duration (between 4 and 10 days) compared to the present study. Xie et al. [14] evaluated PE production by R. salina cultured for different times and under different light intensities. They demonstrated that PE concentration during long culture periods was enhanced as the light intensity increased, which was due to the accumulation of high cell densities at these light intensities [14,24]. This finding can explain the higher optimal value for light intensity found in the present study compared to previous studies [12,44].
The highest biomass productivity (633.33 ± 57.73 mg/L) was obtained with a light intensity and CaCl2 concentration of about 145.5 μmol/m2/s and 2.1328 g/L, respectively. In concordance, Oostlander et al. [46] reported an increase in biomass yield for Rhodomonas sp. strain obtained with light intensities ranging from 110 to 220 μmol/m2/s. High biomass productivity was previously observed under continuous green light illumination conditions [24] and increasing calcium concentration had a positive impact on algae biomass production [47].
A transcriptomic-based analysis of the cpeB gene expression for Rhodomonas sp. under different growth conditions was conducted. In fact, the expression level of the cpeB gene, encoding the beta subunit of phycoerythrin, was investigated in microalgae cells cultivated under standard and optimized conditions using qRT-PCR. The expression profile of cpeB gene was significantly up-regulated by the optimal conditions for PE production compared to the control. This result suggests the existence of a transcriptional regulation mechanism for the studied gene. There are few data available concerning the control and regulation of PE production [48]. The expression of photosynthetic related genes is regulated in response to environmental conditions and controlled at the transcriptional and post-transcriptional levels in algae and cyanobacteria [49,50]. He et al. [51] reported that under high light irradiance, the expression of genes involved in carotenoid biosynthesis, as well as the genes related to photosynthesis-antenna proteins, fatty acid elongation and carbon fixation, was significantly changed in photosynthetic organisms. Furthermore, several studies found that PE and PC synthesis in red algae were affected by both irradiance and spectral composition [24,52,53,54]. Another study suggested that the expression of genes involved in the pathway for photosynthesis-antenna proteins could be inhibited by acetate addition [51]. In addition, Thien et al. [55] found that under CO2 enrichment, the expressions of genes related to phycobilisome, PE and photosystem proteins were upregulated in Kappaphycus alvarezii (Rhodophyta).

5. Conclusions

An isolated microalga strain was identified as belonging to the Rhodomonas genus based on 18S rRNA gene sequencing. Plackett–Burman and Box–Behnken designs were used to maximize PE production and biomass accumulation in this strain. Following the optimization, the production of biomass and PE were enhanced by 2- and 5-fold, respectively, compared to standard conditions. Therefore, the high potential for the production of PE revealed by Rhodomonas sp. makes this strain a promising candidate for various biotechnological and industrial applications. In concordance, a transcriptomic study revealed that the cpeB gene was over-expressed under optimized conditions compared to standard culture conditions. This provides a better understanding about the metabolic pathway of the PE biosynthesis in Rhodomonas genus.

Supplementary Materials

The following supporting information can be downloaded at: https://www.mdpi.com/article/10.3390/biom12070885/s1, Table S1: Nutrients composition of the different growth media used; Table S2: Partial sequence of 18S rRNA gene of the isolated Rhodomonas sp.

Author Contributions

Conceptualization, H.D., J.E., I.F. and S.A.; methodology, H.D., J.E., M.S.N., M.G.R., I.F. and S.A.; software, J.E., I.F. and S.A.; validation, P.M., I.F. and S.A.; formal analysis, H.D., J.E., I.F. and S.A.; investigation, H.D., L.T., J.E., I.F. and S.A., H.D.; writing—original draft preparation, J.E., P.M., I.F. and S.A. All authors have read and agreed to the published version of the manuscript.

Funding

This research received no external funding.

Institutional Review Board Statement

Not applicable.

Informed Consent Statement

Not applicable.

Data Availability Statement

Not applicable.

Conflicts of Interest

The authors declare no conflict of interest.

References

  1. Dammak, M.; Haase, S.M.; Miladi, R.; Ben Amor, F.; Barkallah, M.; Gosset, D.; Pichon, C.; Huchzermeyer, B.; Fendri, I.; Denis, M.; et al. Enhanced lipid and biomass production by a newly isolated and identified marine microalga. Lipids Health Dis. 2016, 15, 209. [Google Scholar] [CrossRef] [PubMed] [Green Version]
  2. Delattre, C.; Pierre, G.; Laroche, C.; Michaud, P. Production, extraction and characterization of microalgal and cyanobacterial exopolysaccharides. Biotechnol. Adv. 2016, 34, 1159–1179. [Google Scholar] [CrossRef] [PubMed]
  3. Ben Amor, F.; Barkallah, M.; Elleuch, F.; Karkouch, N.; Dammak, M.; Baréa, B.; Villeneuve, P.; Abdelkafi, S.; Fendri, I. Cyanobacteria as source of marine bioactive compounds: Molecular specific detection based on Δ9 desaturase gene. Int. J. Biol. Macromol. 2017, 105, 1440–1445. [Google Scholar] [CrossRef] [PubMed]
  4. Ben Amor, F.; Elleuch, F.; Ben Hlima, H.; Garnier, M.; Saint-Jean, B.; Barkallah, M.; Pichon, C.; Abdelkafi, S.; Fendri, I. Proteomic analysis of the Chlorophyta Dunaliella new strain AL-1 revealed global changes of metabolism during high carotenoid production. Mar. Drugs 2017, 15, 293. [Google Scholar] [CrossRef] [PubMed] [Green Version]
  5. Ben Hlima, H.; Dammak, M.; Karkouch, N.; Hentati, F.; Laroche, C.; Michaud, P.; Fendri, I.; Abdelkafi, S. Optimal cultivation towards enhanced biomass and floridean starch production by Porphyridium marinum. Int. J. Biol. Macromol. 2019, 129, 152–161. [Google Scholar] [CrossRef]
  6. Borowitzka, M.A. Microalgae as sources of pharmaceuticals and other biologically active compounds. J. Appl. Phycol. 1995, 7, 3–15. [Google Scholar] [CrossRef]
  7. Glazer, A.N. Phycobiliproteins—A family of valuable, widely used fluorophores. J. Appl. Phycol. 1994, 6, 105–112. [Google Scholar] [CrossRef]
  8. Hu, L.; Huang, B.; Zuo, M.; Guo, R.-Y.; Wei, H. Preparation of the phycoerythrin subunit liposome in a photodynamic experiment on liver cancer cells. Acta Pharmacol. Sin. 2008, 29, 1539–1546. [Google Scholar] [CrossRef] [Green Version]
  9. Deng, R.; Chow, T.J. Hypolipidemic, antioxidant, and antiinflammatory activities of microalgae Spirulina: Hypolipidemic, antioxidant, and anti-inflammatory activities of microalgae Spirulina. Cardiovasc. Ther. 2010, 28, e33–e45. [Google Scholar] [CrossRef] [Green Version]
  10. Ibáñez-González, M.J.; Mazzuca-Sobczuk, T.; Redondo-Miranda, R.M.; Molina Grima, E.; Cooney, C.L. A novel vortex flow reactor for the purification of B-phycoerythrin from Porphyridium cruentum. Chem. Eng. Res. Des. 2016, 111, 24–33. [Google Scholar] [CrossRef]
  11. Roy, S.; Llewellyn, C.A.; Egeland, E.S.; Johnsen, G. Phytoplankton Pigments: Characterization, Chemotaxonomy and Applications in Oceanography; Cambridge University Press: Cambridge, UK, 2011. [Google Scholar]
  12. Chaloub, R.M.; Motta, N.M.S.; de Araujo, S.P.; de Aguiar, P.F.; da Silva, A.F. Combined effects of irradiance, temperature and nitrate concentration on phycoerythrin content in the microalga Rhodomonas sp. (Cryptophyceae). Algal. Res. 2015, 8, 89–94. [Google Scholar] [CrossRef]
  13. Glazer, A.N. Light harvesting by phycobilisomes. Annu. Rev. Biophys. 1985, 14, 47–77. [Google Scholar] [CrossRef] [PubMed]
  14. Xie, J.; Chen, S.; Wen, Z. Effects of light intensity on the production of phycoerythrin and polyunsaturated fatty acid by microalga Rhodomonas salina. Algal. Res. 2021, 58, 102397. [Google Scholar] [CrossRef]
  15. Chang, W.; Jiang, T.; Wan, Z.; Zhang, J.-P.; Yang, Z.-X.; Liang, D.-C. Crystal Structure of R-phycoerythrin from Polysiphonia urceolata at 2.8 Å Resolution. J. Mol. Biol. 1996, 262, 721–722. [Google Scholar] [CrossRef] [PubMed]
  16. Gantt, E.; Edwards, M.R.; Provasoli, L. Chloroplast Structure of the Cryptophyceae. Int. J. Cell Biol. 1971, 48, 280–290. [Google Scholar] [CrossRef] [Green Version]
  17. Vesk, M.; Dwarte, D.; Fowler, S.; Hiller, R.G. Freeze fracture immunocytochemistry of light-harvesting pigment complexes in a cryptophyte. Protoplasma 1992, 170, 166–176. [Google Scholar] [CrossRef]
  18. Kumar, G.; Shekh, A.; Jakhu, S.; Sharma, Y.; Kapoor, R.; Sharma, T.R. Bioengineering of microalgae: Recent advances, perspectives, and regulatory challenges for industrial application. Front. Bioeng. Biotechnol. 2020, 8, 914. [Google Scholar] [CrossRef]
  19. Huang, X.; Zang, X.; Wu, F.; Jin, Y.; Wang, H.; Liu, C.; Ding, Y.; He, B.; Xiao, D.; Song, X.; et al. Transcriptome sequencing of Gracilariopsis lemaneiformis to analyze the genes related to optically active phycoerythrin synthesis. PLoS ONE 2017, 12, e0170855. [Google Scholar] [CrossRef]
  20. Gargouch, N.; Karkouch, I.; Elleuch, J.; Elkahoui, S.; Michaud, P.; Abdelkafi, S.; Laroche, C.; Fendri, I. Enhanced B-phycoerythrin production by the red microalga Porphyridium marinum: A powerful agent in industrial applications. Int. J. Biol. Macromol. 2018, 120, 2106–2114. [Google Scholar] [CrossRef]
  21. Lawrenz, E.; Richardson, T.L. Differential effects of changes in spectral irradiance on photoacclimation, primary productivity and growth in Rhodomonas salina (Cryptophyceae) and Skeletonema costatum (Bacillariophyceae) in simulated blackwater environments. J. Phycol. 2017, 53, 1241–1254. [Google Scholar] [CrossRef]
  22. Bartual, A.; Lubián, L.M.; Gálvez, J.A.; Niell, F.X. Effect of irradiance on growth, photosynthesis, pigment content and nutrient consumption in dense cultures of Rhodomonas salina (Wislouch) (Cryptophyceae). Ciencias Marinas 2002, 28, 381–392. [Google Scholar] [CrossRef] [Green Version]
  23. Silva, A.F.; Lourenço, S.O.; Chaloub, R.M. Effects of nitrogen starvation on the photosynthetic physiology of a tropical marine microalga Rhodomonas sp. (Cryptophyceae). Aquat. Bot. 2009, 4, 291–297. [Google Scholar] [CrossRef]
  24. Latsos, C.; van Houcke, J.; Blommaert, L.; Verbeeke, G.P.; Kromkamp, J.; Timmermans, K.R. Effect of light quality and quantity on productivity and phycoerythrin concentration in the cryptophyte Rhodomonas sp. J. Appl. Phycol. 2021, 33, 729–741. [Google Scholar] [CrossRef]
  25. Wilk, K.E.; Harrop, S.J.; Jankova, L.; Edler, D.; Keenan, G.; Sharples, F.; Hiller, R.G.; Curmi, P.M.G. Evolution of a light-harvesting protein by addition of new subunits and rearrangement of conserved elements: Crystal structure of a cryptophyte phycoerythrin at 1.63-Å resolution. Proc. Natl. Acad. Sci. USA 1999, 96, 8901–8906. [Google Scholar] [CrossRef] [PubMed] [Green Version]
  26. Kronfel, C.M.; Biswas, A.; Frick, J.P.; Gutu, A.; Blensdorf, T.; Karty, J.A.; Kehoe, D.M.; Schluchter, W.M. The roles of the chaperone-like protein CpeZ and the phycoerythrobilin lyase CpeY in phycoerythrin biogenesis. Biochim. Biophys. Acta 2019, 1860, 549–561. [Google Scholar] [CrossRef]
  27. Guillard, R.R.L. Culture of Phytoplankton for Feeding Marine Invertebrates. In Culture of Marine Invertebrate Animals; Smith, W.L., Chanley, M.H., Eds.; Springer: Boston, MA, USA, 1975; pp. 29–60. [Google Scholar]
  28. Soanen, N.; Da Silva, E.; Gardarin, C.; Michaud, P.; Laroche, C. Improvement of exopolysaccharide production by Porphyridium marinum. Bioresour. Technol. 2016, 213, 231–238. [Google Scholar] [CrossRef]
  29. Chtourou, H.; Dahmen, I.; Hassairi, I.; Abdelkafi, S.; Sayadi, S.; Dhouib, A. Dunaliella sp. a wild algal strain isolated from the Sfax-Tunisia solar evaporating salt-ponds, a high potential for biofuel production purposes. J. Biobased Mater. Bioenergy 2014, 8, 27–34. [Google Scholar] [CrossRef]
  30. Fendri, I.; Chaari, A.; Dhouib, A.; Abdelkafi, S.; Sayadi, S.; Dhouib, A. Isolation, identification and characterization of a new lipolytic Pseudomonas sp., strain AHD-1, from Tunisian soil. Environ. Technol. 2010, 31, 87–95. [Google Scholar] [CrossRef]
  31. Miladi, R.; Manghisi, A.; Armeli Mincante, S.; Genovese, G.; Abdelkafi, S.; Morabito, M. A DNA barcoding survey of Ulva (Chlorophyta) in Tunisia and Italy reveals the presence of the overlooked alien Ulva ohnoi. Crypt. Algol. 2018, 39, 85–107. [Google Scholar] [CrossRef]
  32. Allen, M.M. Simple conditions for growth of unicellular blue-green algae on plates. J. Phycol. 1968, 4, 1–4. [Google Scholar] [CrossRef]
  33. Ben Mohamed, J.; Elleuch, J.; Drira, M.; Esteban, M.Á.; Michaud, P.; Abdelkafi, S.; Fendri, I. Characterization and biotechnological potential of two native marine microalgae isolated from the Tunisian coast. Appl. Sci. 2021, 11, 5295. [Google Scholar] [CrossRef]
  34. Lawrenz, E.; Fedewa, E.J.; Richardson, T.L. Extraction protocols for the quantification of phycobilins in aqueous phytoplankton extracts. J. Appl. Phycol. 2011, 23, 865–871. [Google Scholar] [CrossRef]
  35. Elleuch, J.; Hadj Kacem, F.; Ben Amor, F.; Hadrich, B.; Michaud, P.; Fendri, I.; Abdelkafi, S. Extracellular neutral protease from Arthrospira platensis: Production, optimization and partial characterization. Int. J. Biol. Macro. 2021, 167, 1491–1498. [Google Scholar] [CrossRef] [PubMed]
  36. Elleuch, J.; Ben Amor, F.; Chaaben, Z.; Frikha, F.; Michaud, P.; Fendri, I.; Abdelkafi, S. Zinc biosorption by Dunaliella sp. AL-1: Mechanism and effects on cell metabolism. Sci. Total Environ. 2021, 773, 145024. [Google Scholar] [CrossRef]
  37. Meng, L.; Feldman, L. A rapid TRIzol-based two-step method for DNA-free RNA extraction from Arabidopsis siliques and dry seeds. Biotechnol. J. 2010, 5, 183–186. [Google Scholar] [CrossRef]
  38. Elleuch, J.; Zribi, R.Z.; Ben Fguira, I.; Lacroix, M.N.; Suissi, J.; Chandre, F.; Tounsi, S.; Jaoua, S. Effects of the P20 protein from Bacillus thuringiensis israelensis on insecticidal crystal protein Cry4Ba. Int. J. Biol. Macro. 2015, 79, 174–179. [Google Scholar] [CrossRef]
  39. Elleuch, J.; Ben Amor, F.; Barkallah, M.; Haj Salah, J.; Smith, K.F.; Aleya, L.; Fendri, I.; Abdelkafi, S. q-PCR-based assay for the toxic dinoflagellate Karenia selliformis monitoring along the Tunisian coasts. Environ. Sci. Pollut. Res. 2021, 28, 57486–57498. [Google Scholar] [CrossRef]
  40. Toldrà, A.; Andree, K.B.; Fernández-Tejedor, M.; Salah, J.H.; Smith, K.F.; Aleya, L.; Fendri, I.; Abdelkafi, S. Dual quantitative PCR assay for identification and enumeration of Karlodinium veneficum and Karlodinium armiger combined with a simple and rapid DNA extraction method. J. Appl. Phycol. 2018, 28, 57486–57498. [Google Scholar] [CrossRef]
  41. Barkallah, M.; Elleuch, J.; Smith, K.F.; Chaari, S.; Ben Neila, I.; Fendri, I.; Michaud, P.; Abdelkafi, S. Development and application of a real-time PCR assay for the sensitive detection of diarrheic toxin producer Prorocentrum lima. J. Microbiol. Methods 2020, 178, 106081. [Google Scholar] [CrossRef]
  42. Elleuch, J.; Hmani, R.; Drira, M.; Chaari, S.; Ben Neila, I.; Fendri, I.; Michaud, P.; Abdelkafi, S. Potential of three local marine microalgae from Tunisian coasts for cadmium, lead and chromium removals. Sci. Total Environ. 2021, 799, 149464. [Google Scholar] [CrossRef]
  43. Livak, K.J.; Schmittgen, T.D. Analysis of relative gene expression data using real-time quantitative PCR and the 2−ΔΔCT method. Methods 2001, 25, 402–408. [Google Scholar] [CrossRef] [PubMed]
  44. Marraskuranto, E.; Raharjo, T.J.; Kasiamdari, R.S.; Nuringtyas, T.R. Influence of salinity on growth and phycoerythrin production of Rhodomonas salina. Squalen. Bull. Mar. Fish. Postharvest Biotechnol. 2018, 13, 109. [Google Scholar] [CrossRef] [Green Version]
  45. Latsos, C.; Bakratsas, G.; Moerdijk, T.; Verbeeke, G.P.; Kromkamp, J.; Timmermans, K.R. Effect of salinity and pH on growth, phycoerythrin, and non-volatile umami taste active compound concentration of Rhodomonas salina using a D-optimal design approach. J. Appl. Phycol. 2021, 33, 3591–3602. [Google Scholar] [CrossRef]
  46. Oostlander, P.C.; van Houcke, J.; Wijffels, R.H.; Barbosa, M.J. Optimization of Rhodomonas sp. under continuous cultivation for industrial applications in aquaculture. Algal Res. 2020, 47, 101889. [Google Scholar] [CrossRef]
  47. Reed, J.L.; Motes, D.; Muller, L.; Perez, C.; Hennessey, K. Got calcium? The effects of varying concentrations of calcium on algal growth. J. Introd. Biol. Investig. 2017, 7, 2. [Google Scholar]
  48. Bezy, R.P.; Wiltbank, L.; Kehoe, D.M. Light-dependent attenuation of phycoerythrin gene expression reveals convergent evolution of green light sensing in cyanobacteria. Proc. Natl. Acad. Sci. USA 2011, 108, 18542–18547. [Google Scholar] [CrossRef] [Green Version]
  49. Bryant, D. The Molecular Biology of Cyanobacteria; Kluwer Academic Publishers: Alphen aan den Rijn, The Netherlands, 1994. [Google Scholar]
  50. Stern, D.; Witman, G. The Chlamydomonas Sourcebook, 2nd ed.; Academic Press: Amsterdam, Boston, 2009. [Google Scholar]
  51. He, B.; Hou, L.; Dong, M.; Shi, J.; Huang, X.; Ding, Y.; Cong, X.; Zhang, F.; Zhang, X.; Zang, X. Transcriptome analysis in Haematococcus pluvialis: Astaxanthin induction by high light with acetate and Fe2+. Int. J. Mol. Sci. 2018, 19, 175. [Google Scholar] [CrossRef] [Green Version]
  52. Talarico, L.; Cortese, A. Response of Audouinella saviana Woelkerling cultures to monochromatic light. Hydrobiologia 1993, 260261, 477–484. [Google Scholar] [CrossRef]
  53. Franklin, L.; Kräbs, G.; Kuhlenkamp, R. Blue light and UV-A radiation control the synthesis of mycosporine-like amino acids in Chondrus Crispus (Florideophyceae). J. Phycol. 2001, 3, 257–270. [Google Scholar] [CrossRef] [Green Version]
  54. Godínez-Ortega, J.L.; Snoeijs, P.; Robledo, D.; Freile-Pelegrin, Y.; Pedersén, M. Growth and pigment composition in the red alga Halymenia floresii cultured under different light qualities. J. Appl. Phycol. 2008, 3, 253–260. [Google Scholar] [CrossRef]
  55. Thien, V.Y.; Rodrigues, K.F.; Voo, C.L.Y.; Wong, C.; Yong, W. Comparative transcriptome profiling of Kappaphycus alvarezii (Rhodophyta, Solieriaceae) in response to light of different wavelengths and carbon dioxide enrichment. Plants 2021, 10, 1236. [Google Scholar] [CrossRef] [PubMed]
Figure 1. Screening of the most suitable culture media for Rhodomonas sp. growth. (Data are means ± SE).
Biomolecules 12 00885 g001
Figure 2. PE production capacity by Rhodomonas sp. strain. (A) Comparison of modified F/2 and Pm medium; (B) time-course using modified F/2. (Data are means ± SE. Columns labeled with different low case letters (a, b) indicate statistically significant differences (p < 0.05, ANOVA, Duncan multiple range tests)).
Biomolecules 12 00885 g002
Figure 3. Response surface plots for PE production (A-F) and biomass accumulation (G-L) as a function of the different studied variables: (A) metal solution and CaCl2 concentration; (B) CaCl2 concentration and pH; (C) light intensity and CaCl2 concentration; (D) pH and metal solution; (E) metal solution and light intensity; (F) light intensity and pH; (G) metal solution and CaCl2 concentration; (H) CaCl2 concentration and pH; (I) light intensity and CaCl2 concentration; (J) pH and metal solution; (K) metal solution and light intensity; (L) light intensity and pH.
Biomolecules 12 00885 g003
Figure 4. cpeB gene expression levels for Rhodomonas sp. using different culture conditions.
Biomolecules 12 00885 g004
Table 1. List of primers used.
Gene
Abbreviation
DescriptionPrimer Sequence 1
α-tubα-tubulinF: 5′-AGATCACGAACGCCACCTTC-3′
R: 5′-GATGGTGCGCTTCGTCTTGA -3′
cpeBphycoerythrin beta chainF: 5′-GGTGGTGCAGATCTACAAGC-3′
R: 5′-CATGCAGCCATACGACGGTT-3′
18SRibosomal RNA 18 SF: 5′-AACCTGGTTGATCCTGCCAGT-3′
R: 5′-TGATCCTTCTGCAGGTTCACCTAC-3′
1 F = forward; R = reverse.
Table 2. Plackett–Burman experimental design for the evaluation of 13 independent variables on PE production.
Coded FactorsFactorsLow Level (−1)High Level (+1)
X1NaCl (g/L)1737
X2MgCl2 (g/L)29
X3CaCl2 (g/L)02
X4KNO3 (g/L)02
X5KH2PO4 (g/L)00.12
X6NaHCO3 (g/L)00.1
X7MgSO4 (g/L)15.5
X8NaNO3 (g/L)0.51.5
X9NaH2PO4 (g/L)0.51.5
X10Metal Solution (mL/L)0.51.5
X11Vitamin Solution (mL/L)01
X12Light intensity (µmol/m2/s)27110
X13pH59
Table 3. Variables and experimental levels for optimizing culture conditions.
Coded FactorsFactors−10+1
X1CaCl2 (g/L)0.251.1252
X2Metal solution (mL/L)0.511.5
X3pH579
X4Light intensity (µmol/m2/s)4392141
* −1, 0 and 1 correspond to the minimum, medium and maximum of the input variable range, respectively.
Table 4. Analysis of variance for the phycoerythrin response.
Source of VariationDFSeq SSAdj SSAdj MSF-Valuep-Value
Main Effects133129.083129.08240.6986.950.000
Residual Error26900.06900.0634.618
Lack of fit6868.05868.05144.67590.390.000
Pure error2032.0132.011.601
Total394029.14
Table 5. Effect of different operational variables on PE production.
TermsCoefficientp-Value
Constant4.5650.000
NaCl−2.6120.009 *
MgCl2−2.0260.039 *
CaCl24.2240.000 **
KNO32.3130.020 *
KH2PO4−0.4860.606
NaHCO31.5350.111
MgSO41.6680.085
NaNO3−0.6370.500
NaH2PO4−1.6930.080
Metal solution−3.4300.001 **
Vitamin solution−0.8770.355
Light intensity3.3960.001 **
pH−3.3760.001 **
* Significant at level 95%, ** Significant at level 99%.
Table 6. Analysis of variance for phycoerythrin production response.
Source of VariationSum SquaresDegrees of FreedomMean SquareRatioSignificance (%)
Regression3.4357140.95975.0189**
Residual2.1034110.1912
Lack of fit2.0855100.208611.676722.8%
Error0.017910.0179
Total5.539125
** Significant at 99%.
Table 7. Analysis of variance for biomass production response.
Source of VariationSum of SquaresDegrees of FreedomMean SquareRatioSignificance (%)
Regression3.27605E + 0005142.34003E + 00044.3819**
Residual6.40829E + 0004125.34024E + 0003
Lack of fit5.33538E + 0004105.33538E + 00030.994659.8%
Error1.07291E + 000425.36458E + 0003
Total3.91688E + 000526
** Significant at 99%.
Table 8. Statistical analysis of the coefficients for PE production.
FactorCoefficientF. InflationEcart-Typet.exp.Significance. %
X00.8115 0.30922.62*
X10.25651.000.12622.036.5%
X2−0.06991.000.1262−0.5559.6%
X30.03671.000.12620.2977.3%
X40.74681.000.12625.92***
X1 20.33671.480.20931.6113.3%
X2 20.03581.480.20930.1786.2%
X3 2−0.25791.480.2093−1.2324.3%
X4 20.46251.480.20932.21*
X1X20.04451.000.21860.2083.6%
X1X3−0.16051.000.2186−0.7348.4%
X2X3−0.35781.000.2186−1.6412.7%
X1X40.78451.000.21863.59**
X2X40.12851.000.21860.5957.4%
*** Significant at 99.9%, ** Significant at 99%, * Significant at 95%.
Table 9. Statistical analysis of the coefficients for PE production response.
FactorCoefficientF. InflationEcart-Typet.exp.Significance (%)
X0283.33333 42.191016.72***
X167.708331.0021.095503.21**
X21.041671.0021.095500.0596.0%
X36.291671.0021.095500.3076.7%
X4120.875001.0021.095505.73***
X1 2−62.479171.2531.64325−1.976.9%
X2 2−34.354171.2531.64325−1.0930.0%
X3 2−79.729171.2531.64325−2.52*
X4 2−39.104171.2531.64325−1.2423.9%
X1X221.875001.0036.538480.6056.7%
X1X3−15.625001.0036.53848−0.4367.9%
X2X3−28.125001.0036.53848−0.7746.2%
X1X496.875001.0036.538482.65*
X2X453.125001.0036.538481.4516.9%
*** Significant at 99.9%, ** Significant at 99%, * Significant at 95%.
Publisher’s Note: MDPI stays neutral with regard to jurisdictional claims in published maps and institutional affiliations.

