
Optimization and Characterization of a Novel Exopolysaccharide from Bacillus haynesii CamB6 for Food Applications

 ,
, 
 , , , ,
Abstract
:1. Introduction
2. Materials and Methods
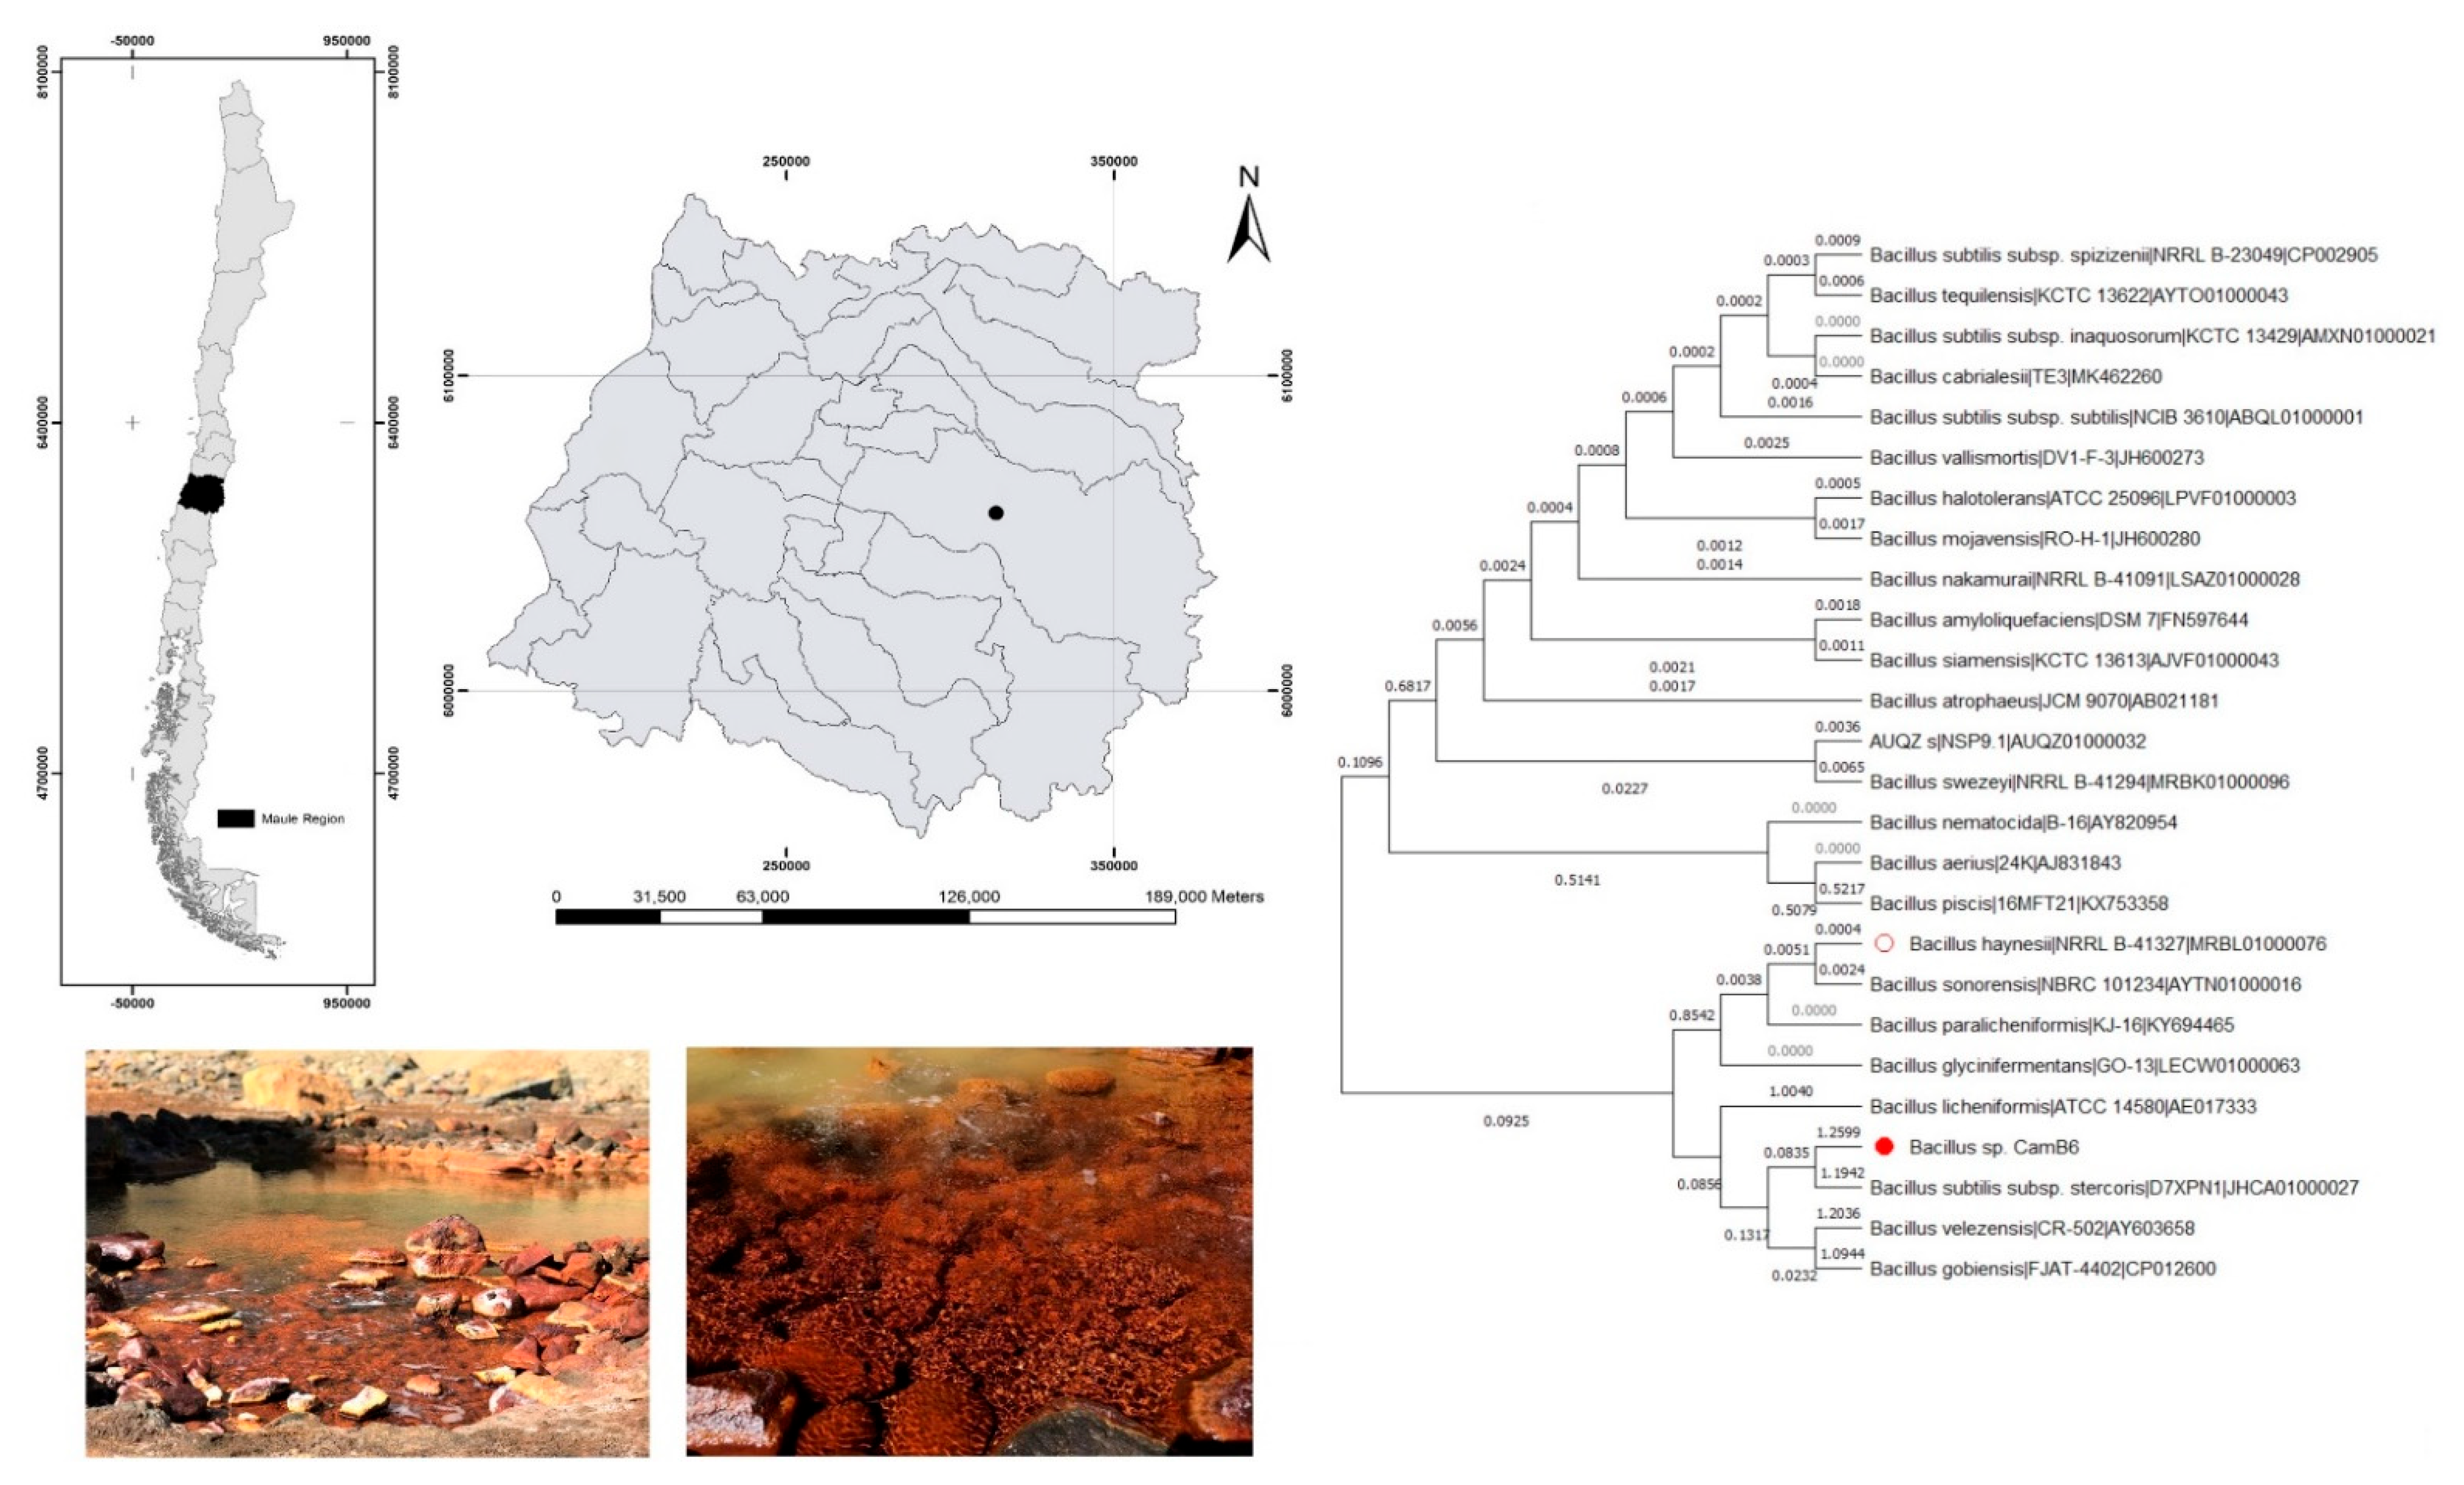
2.1. Sampling and Water Analysis
2.2. Isolation and Taxonomic Identification of the Bacteria
2.3. Recovery, Purification of EPS, and One Factor at a Time (OFAT) Optimization
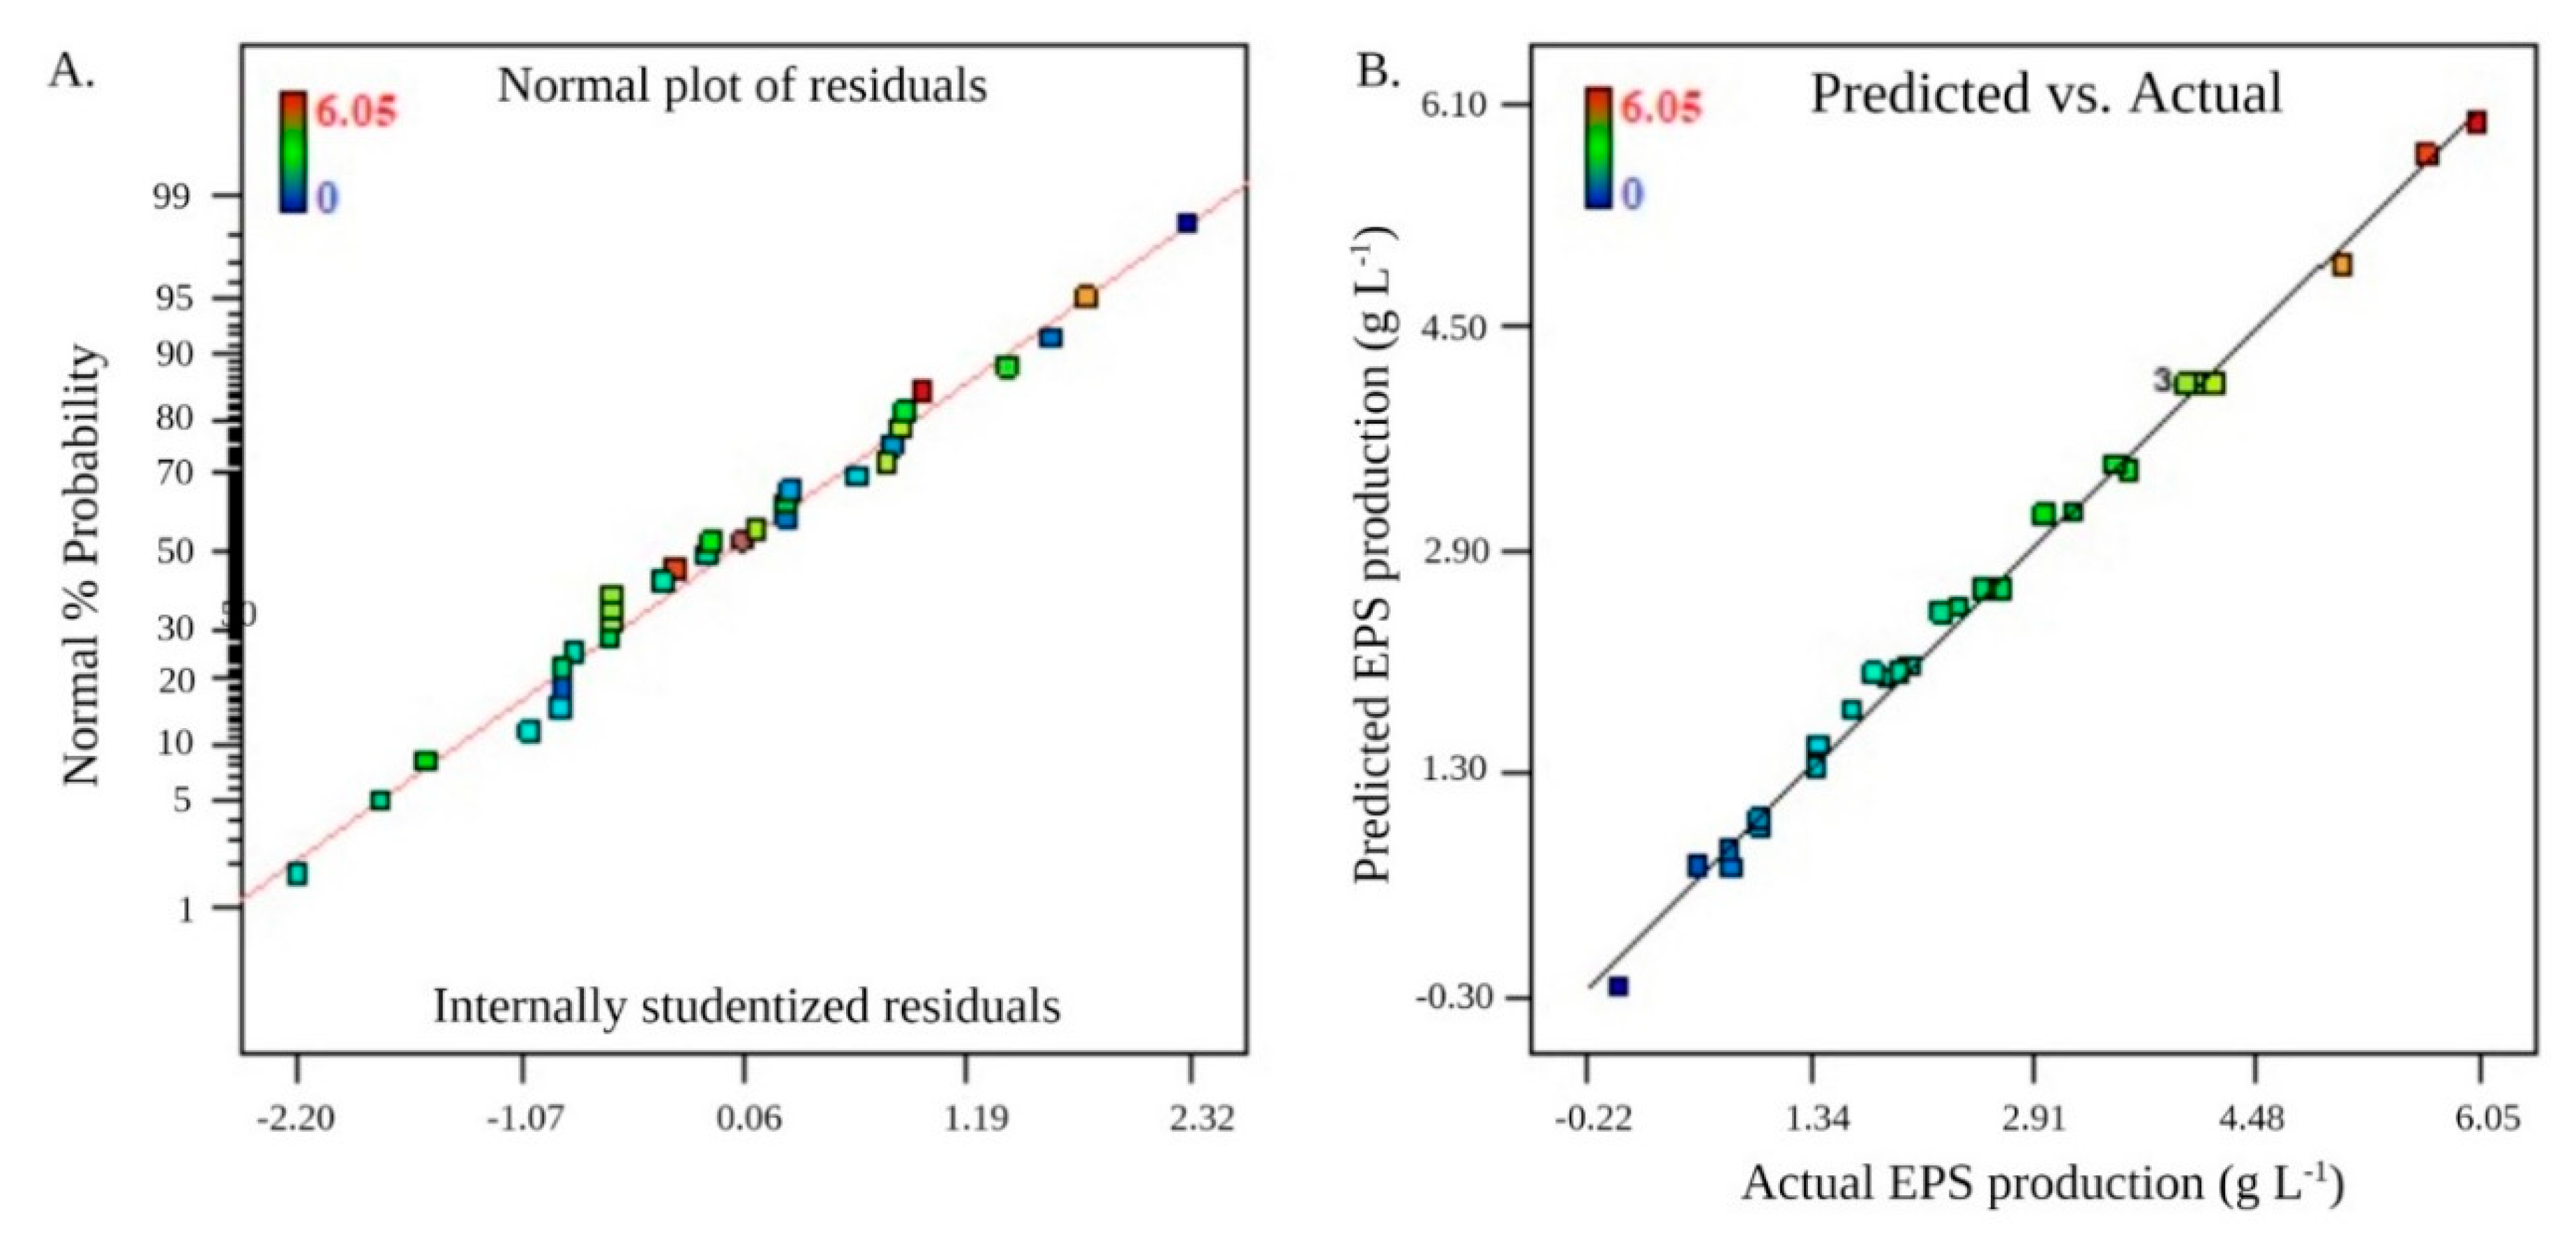
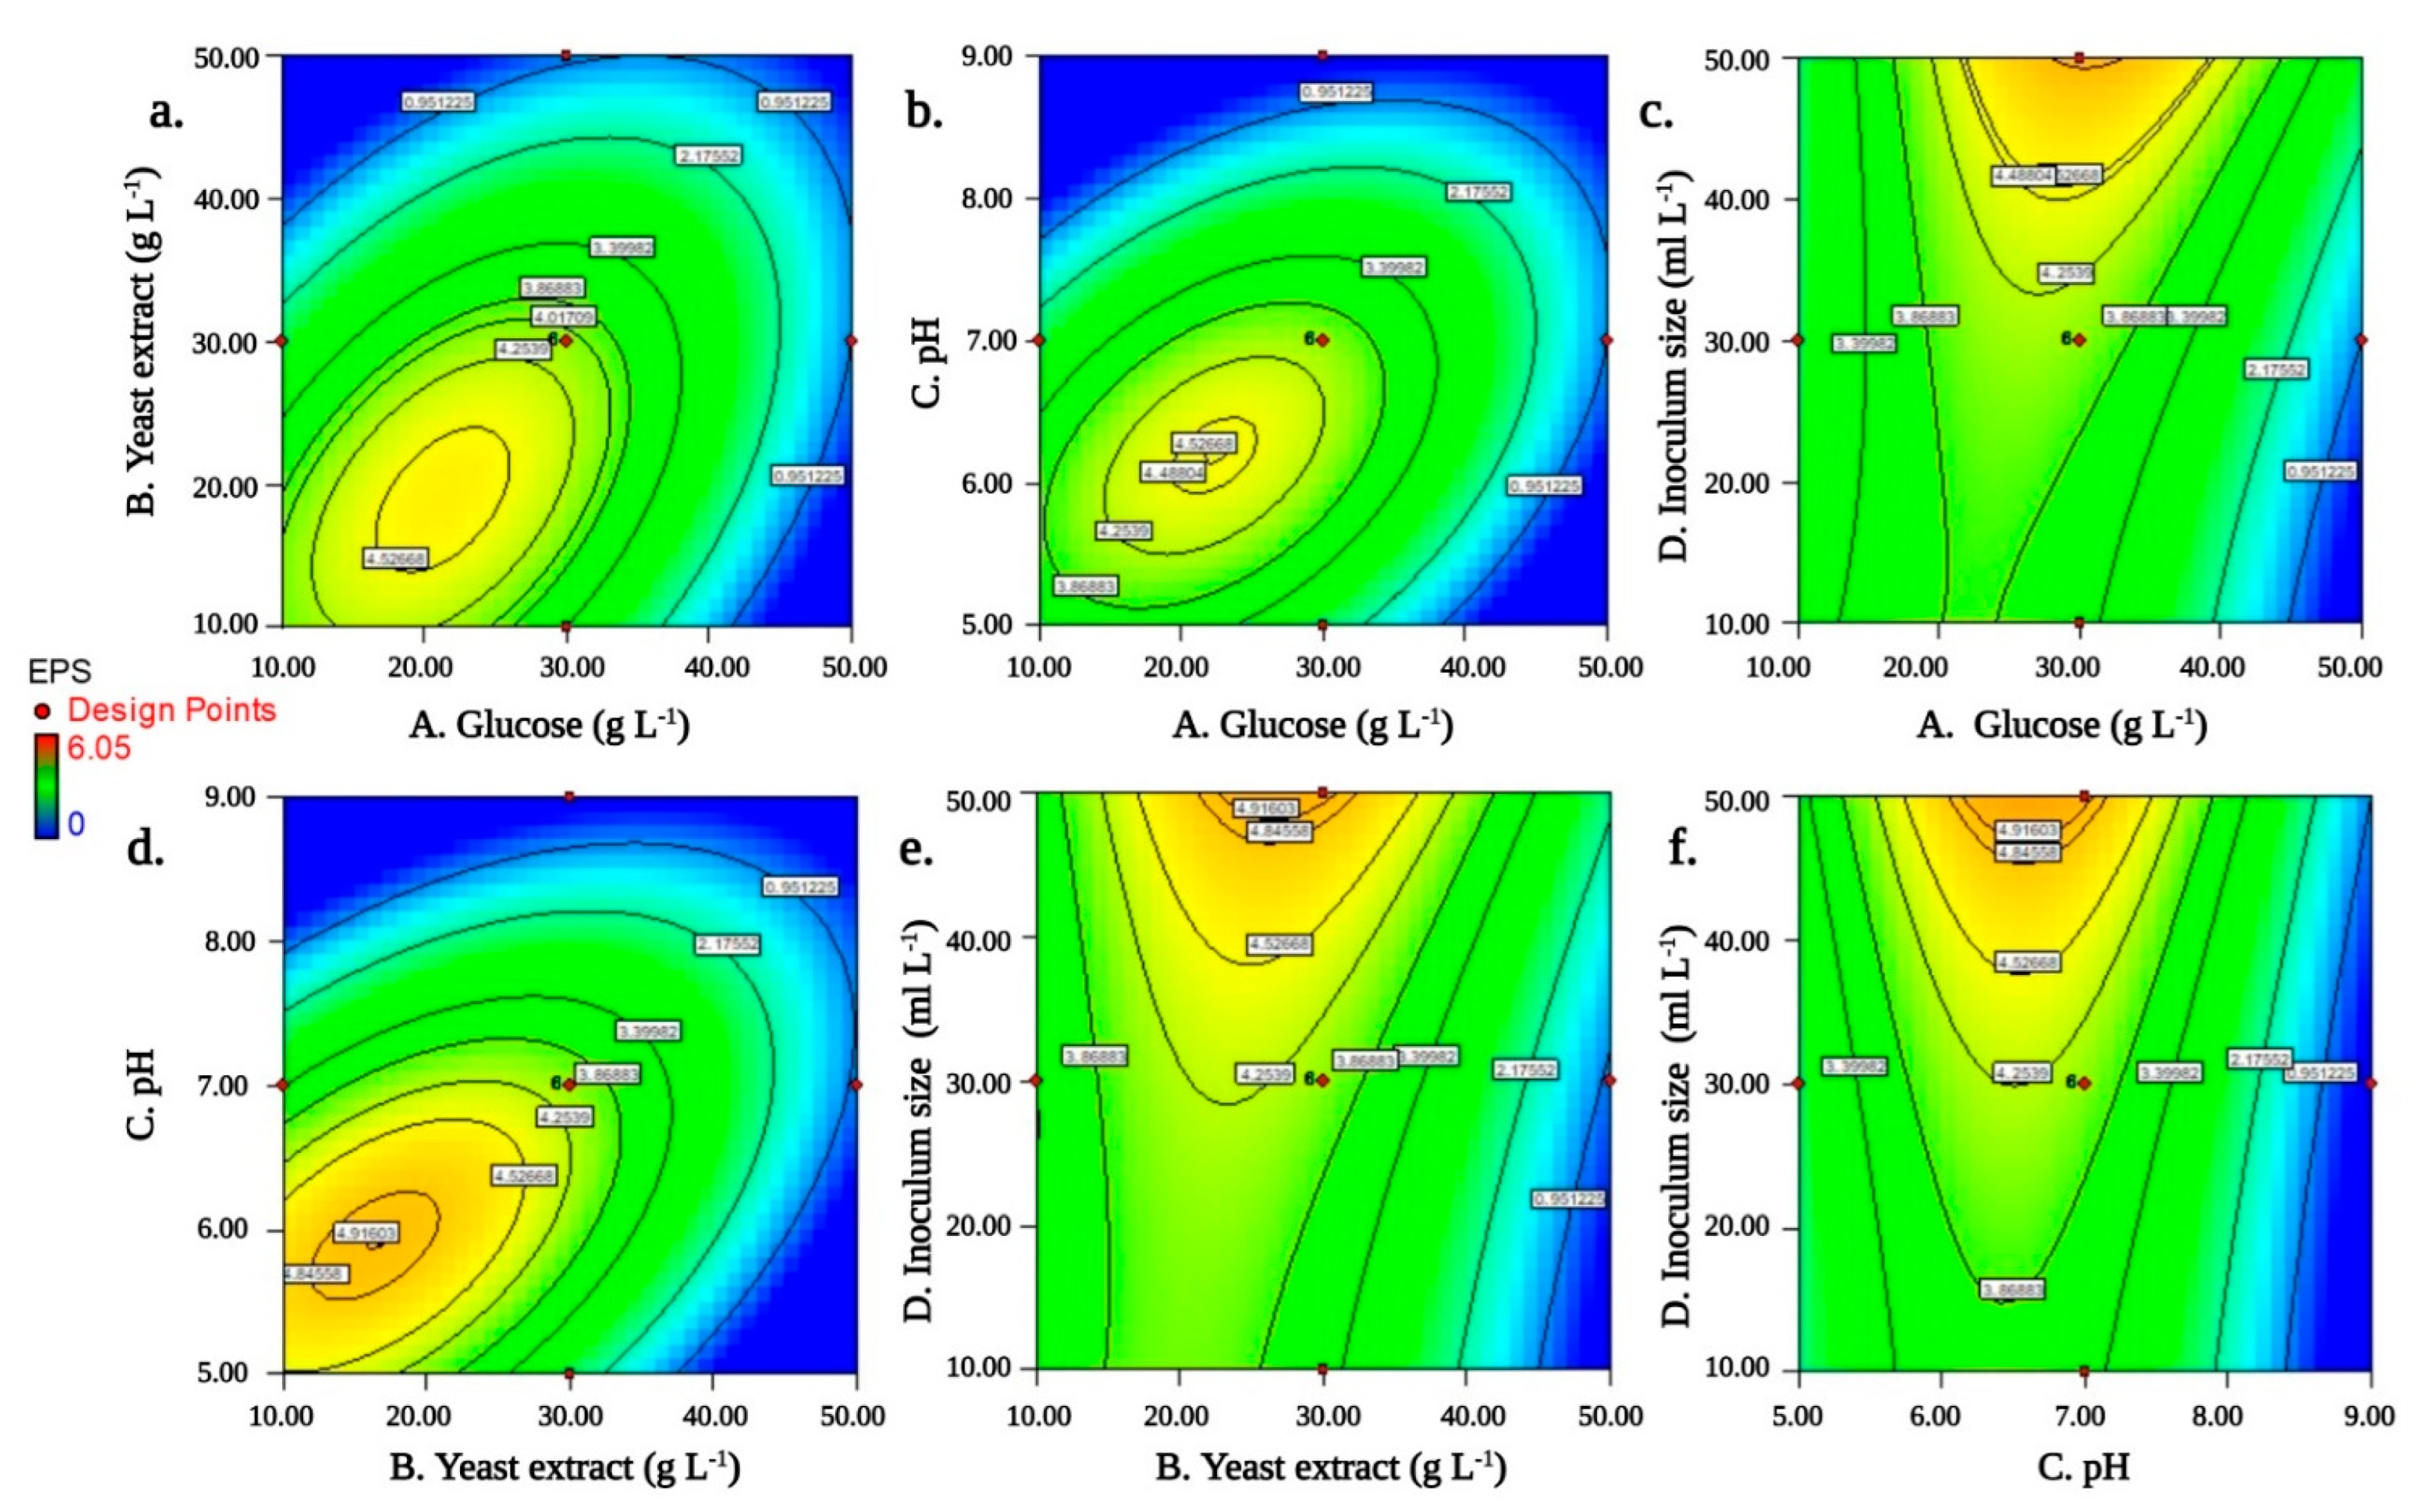
2.4. Response Surface Methodology (RSM) Optimization and Its Validation
2.5. Physicochemical Characterization of the EPS
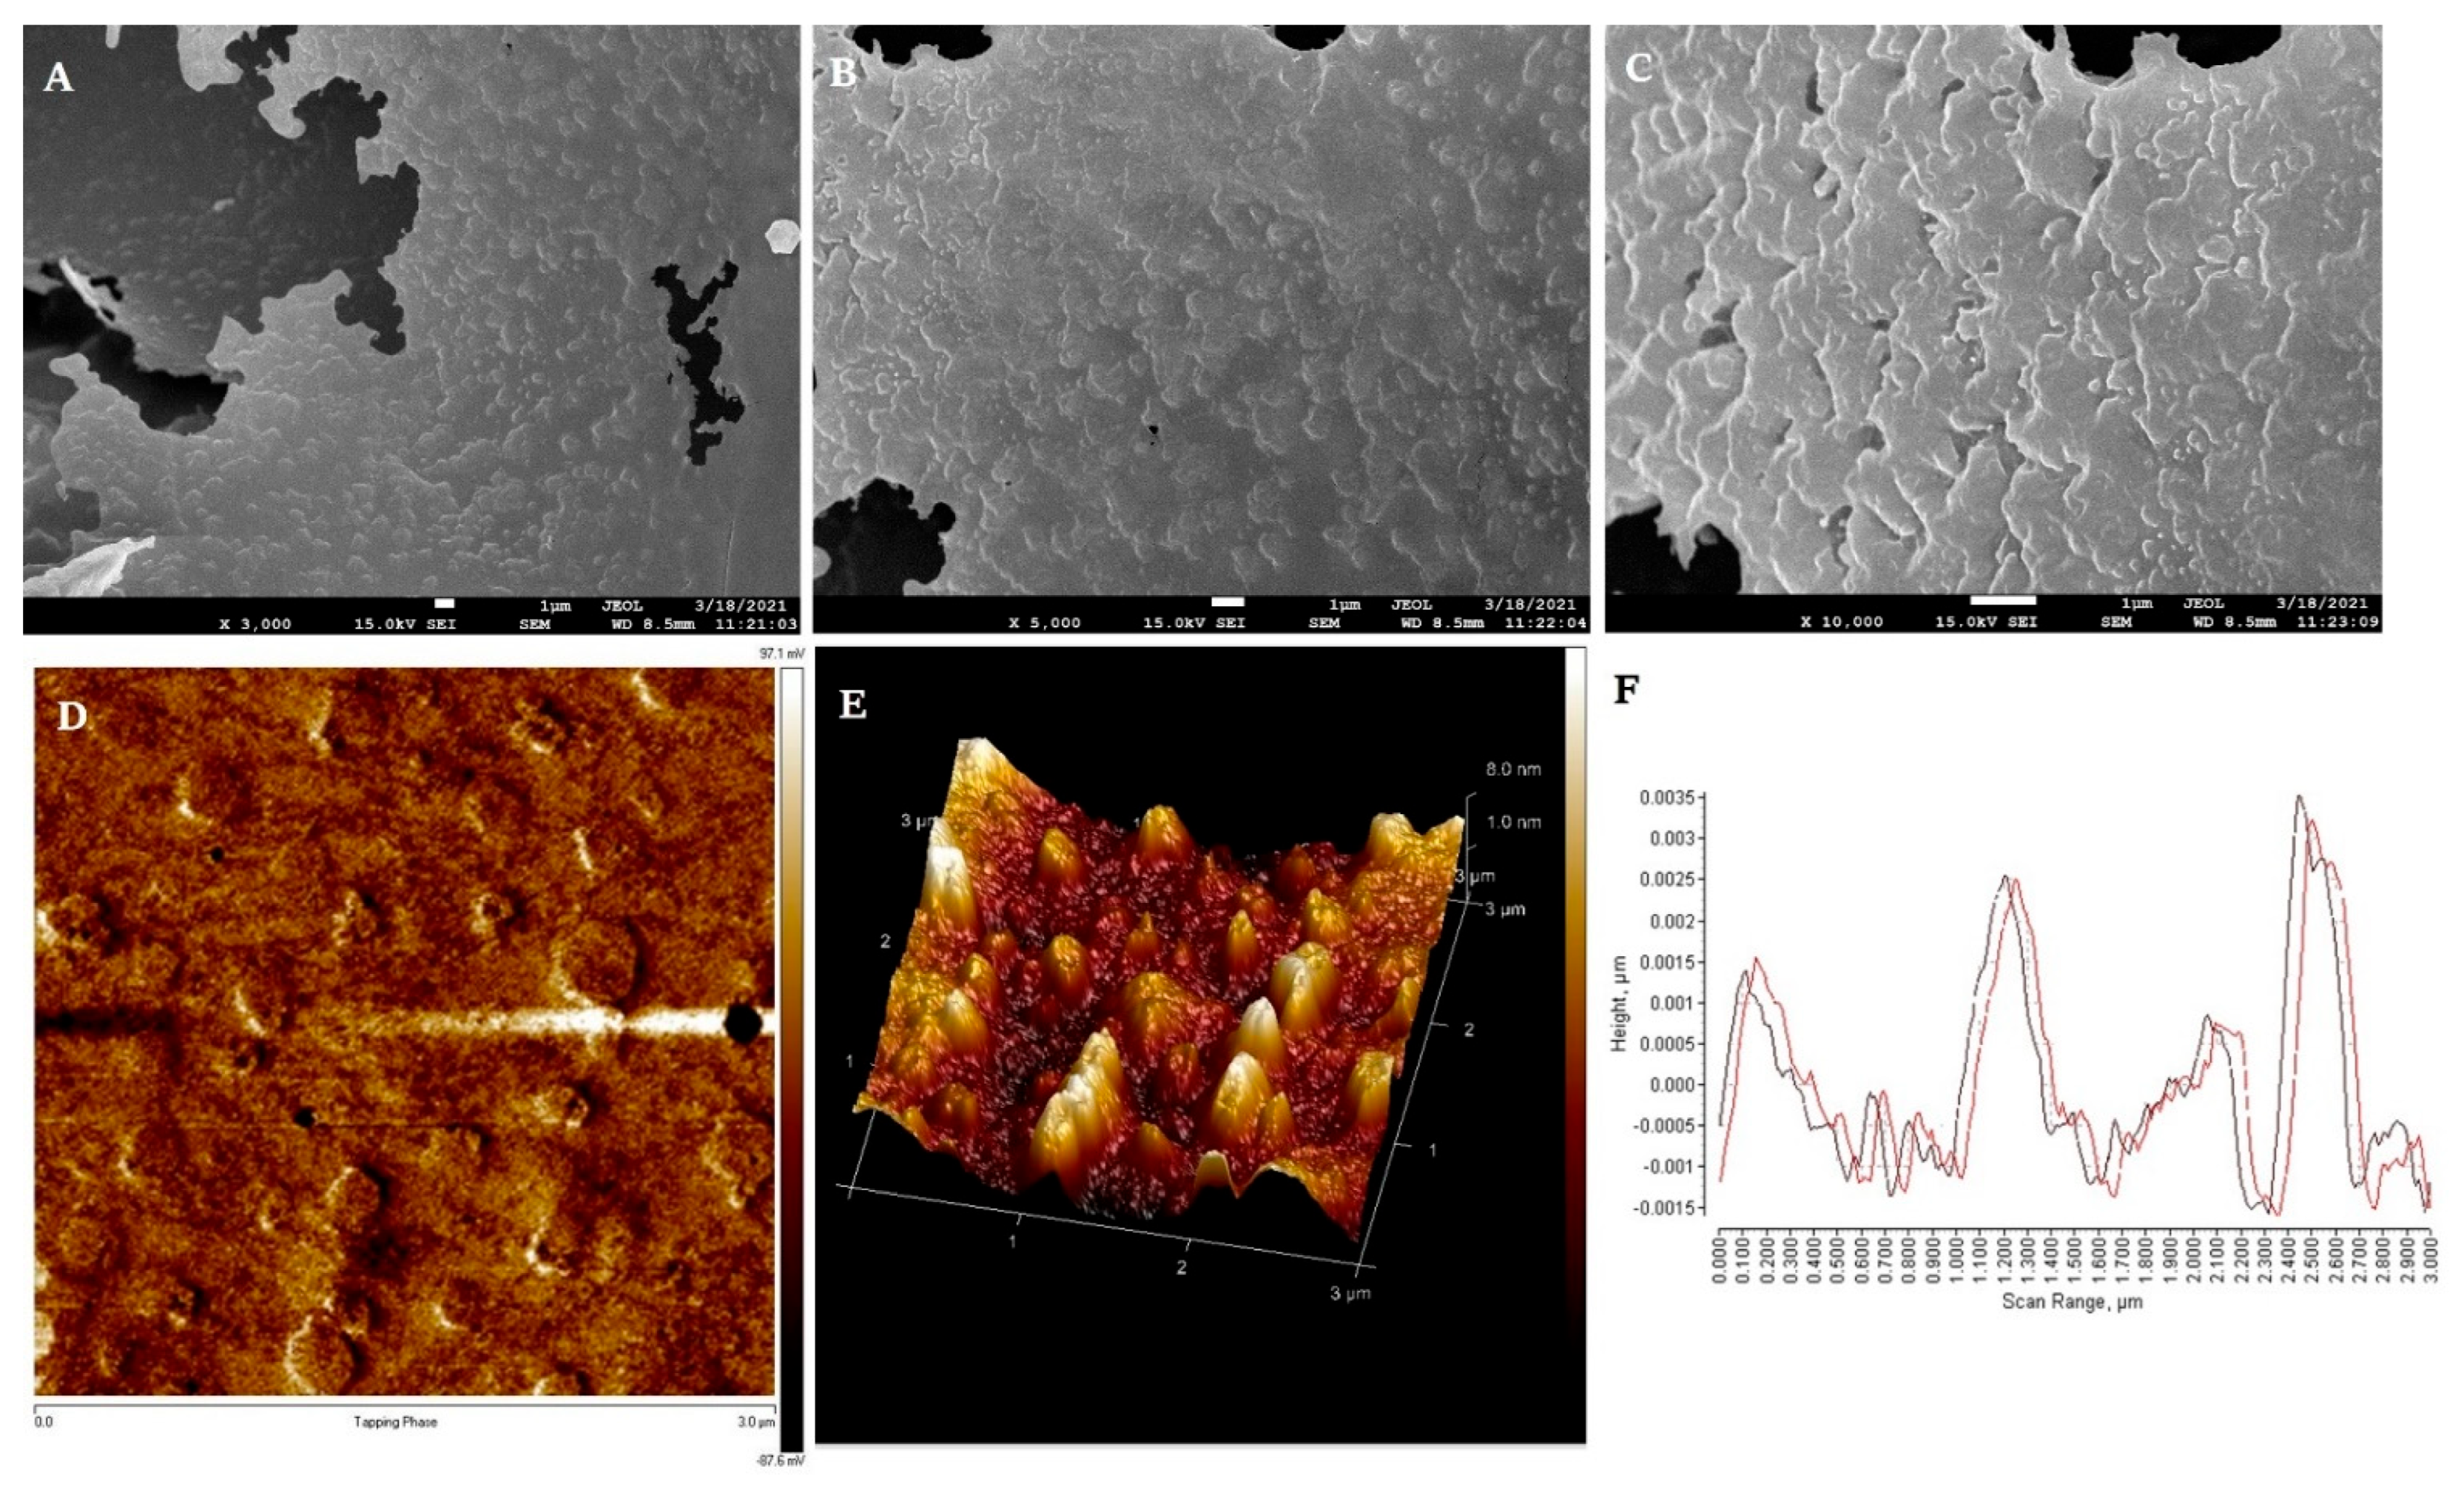
2.5.1. Morphological Analysis (AFM and SEM)
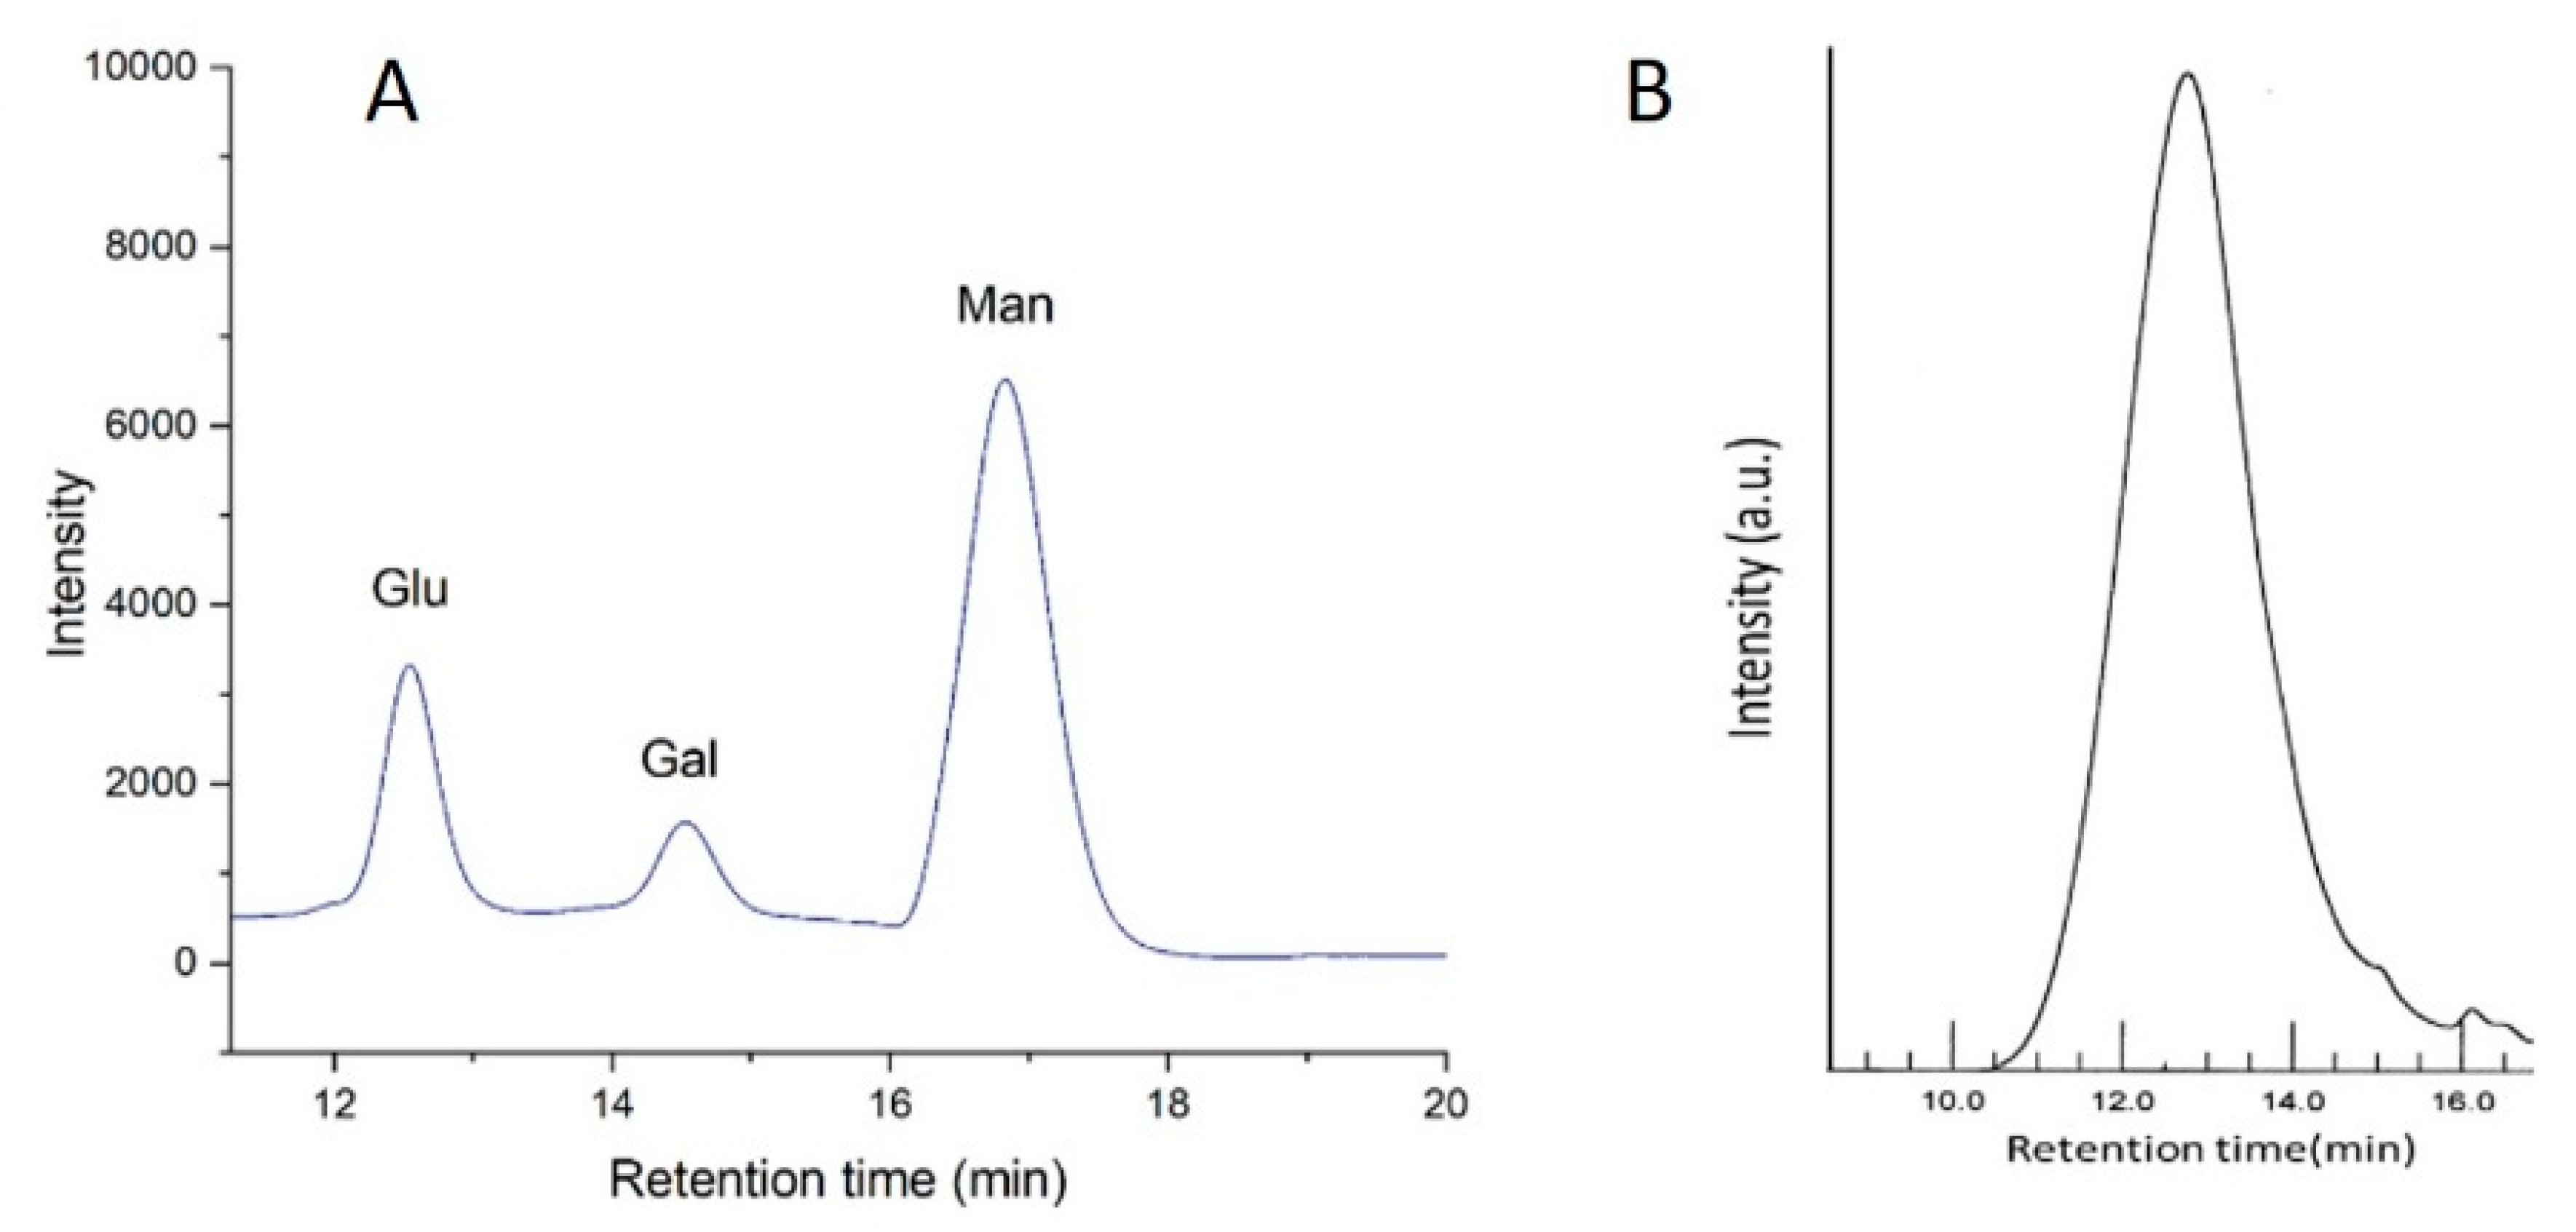
2.5.2. Monosaccharide Composition Analysis and Molecular Weight
2.5.3. Structural Analysis
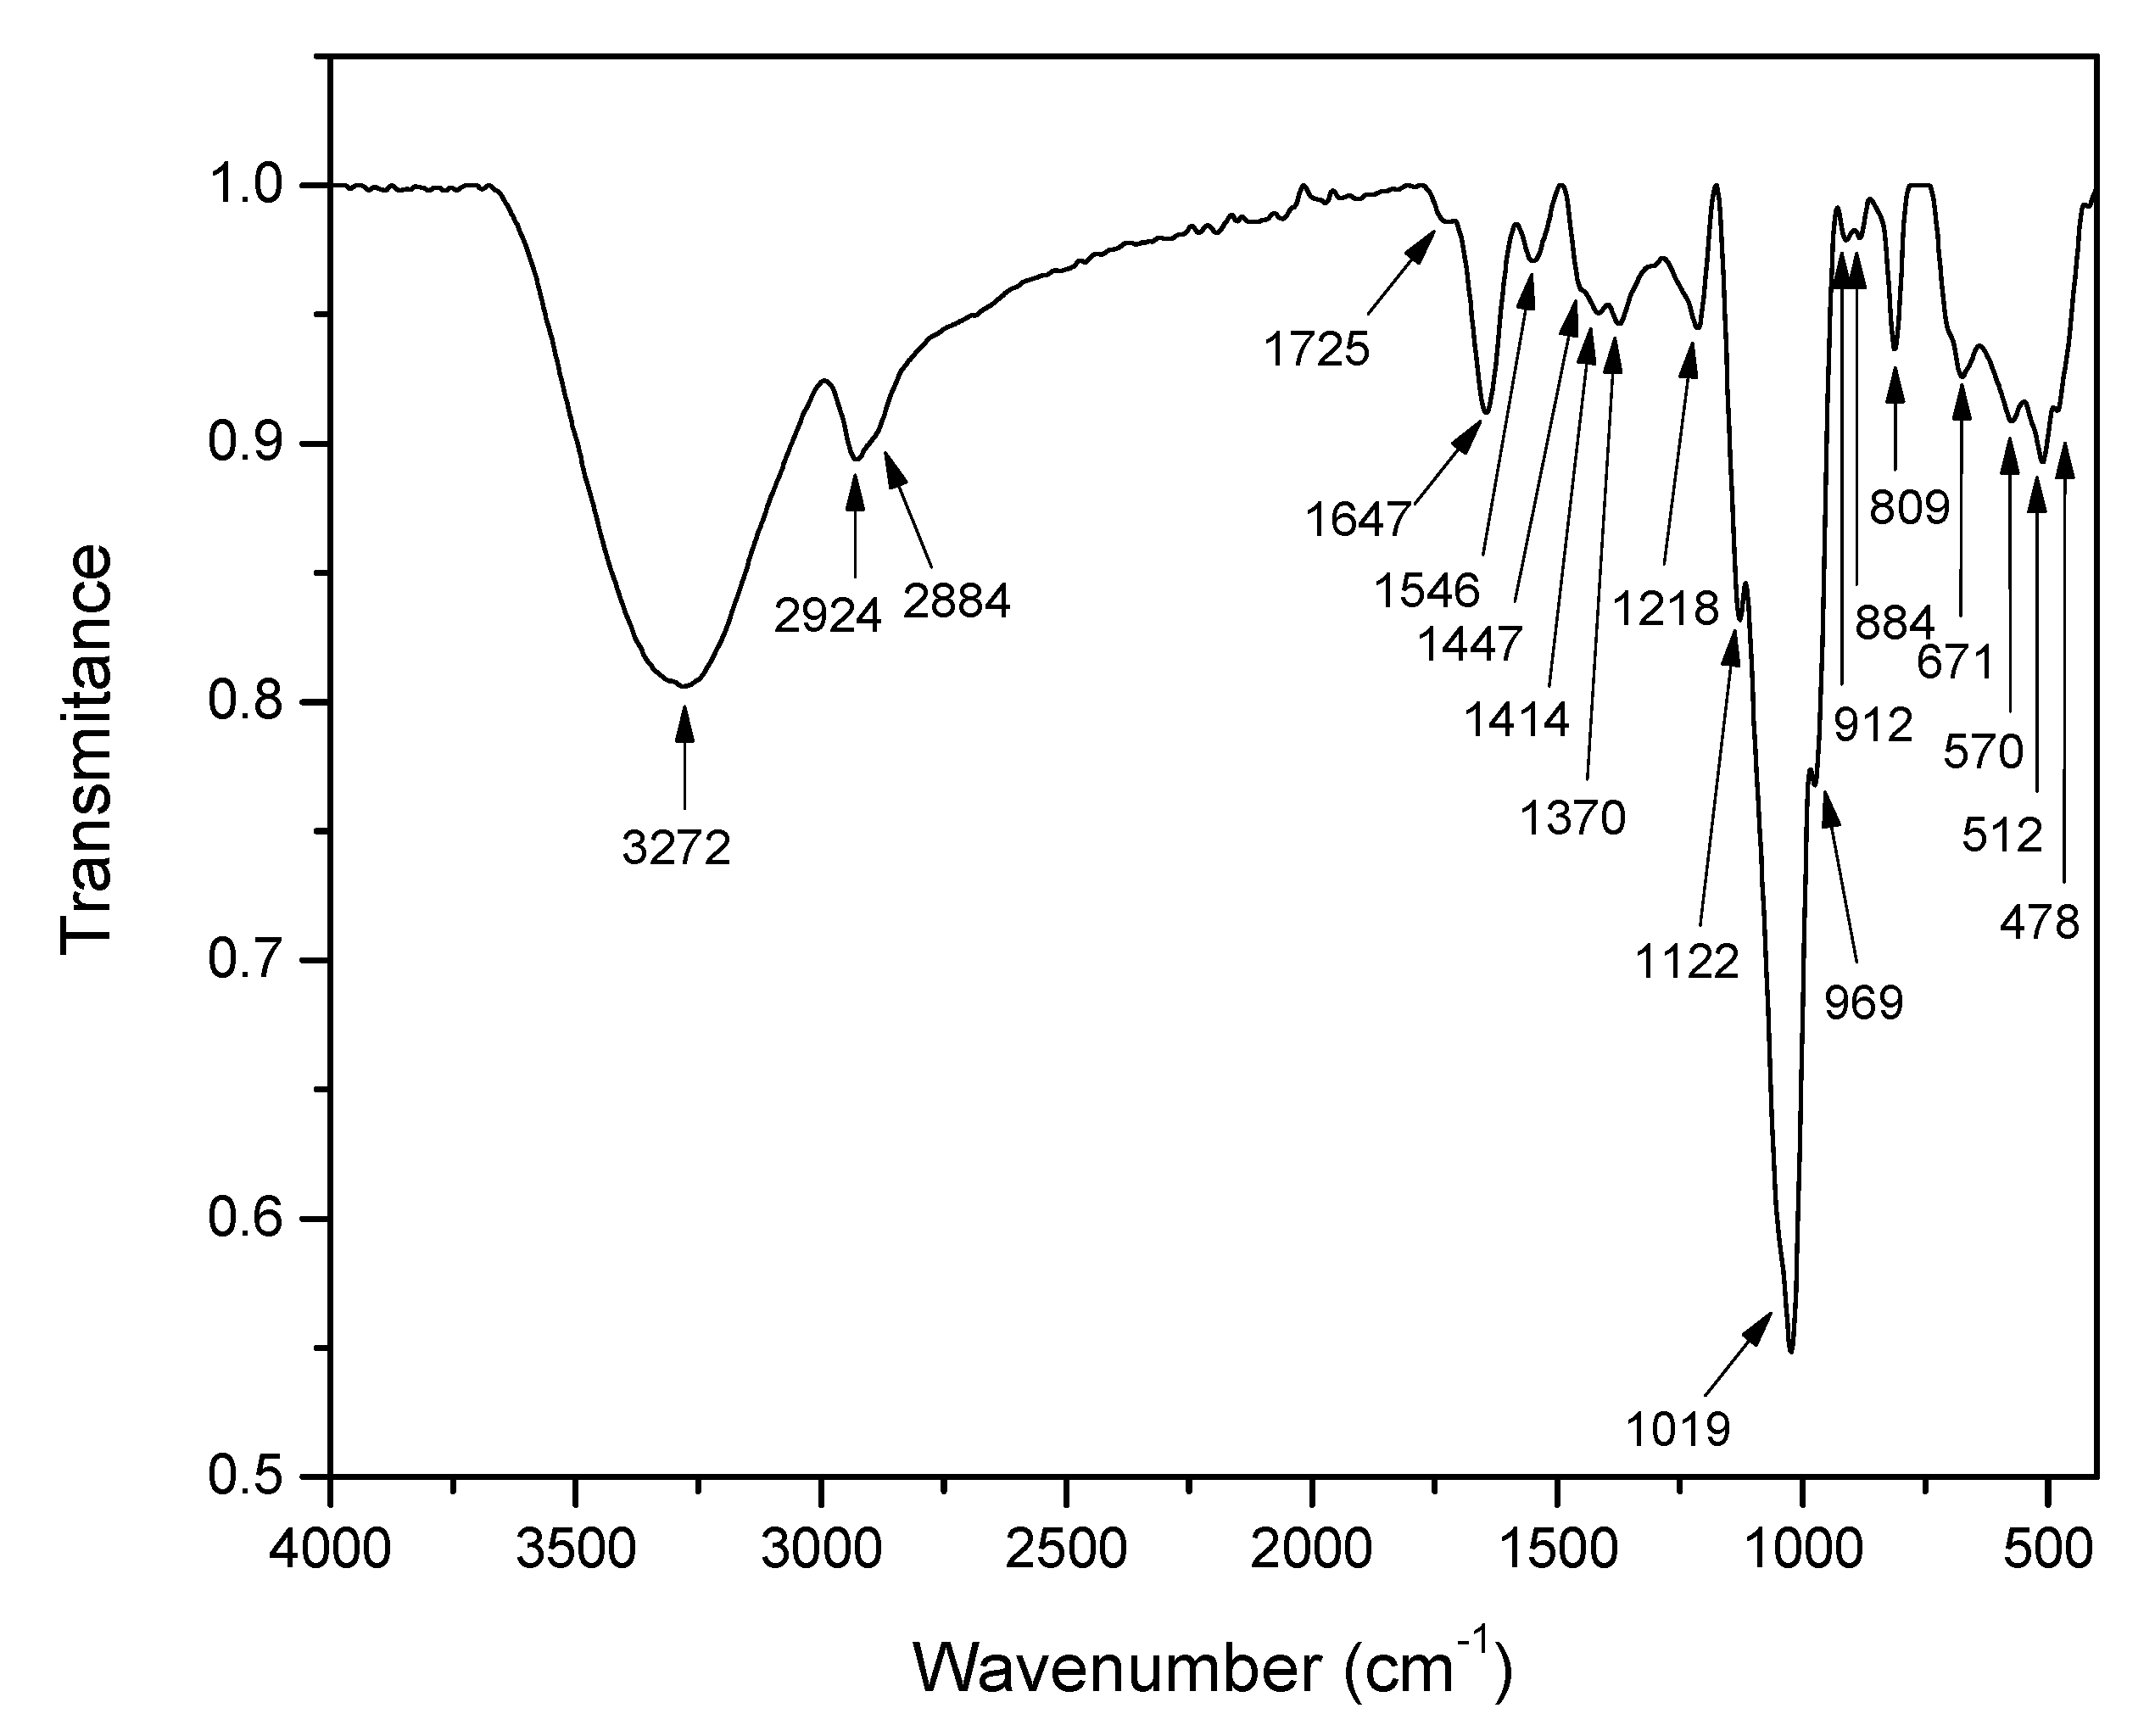
Infrared Spectroscopy
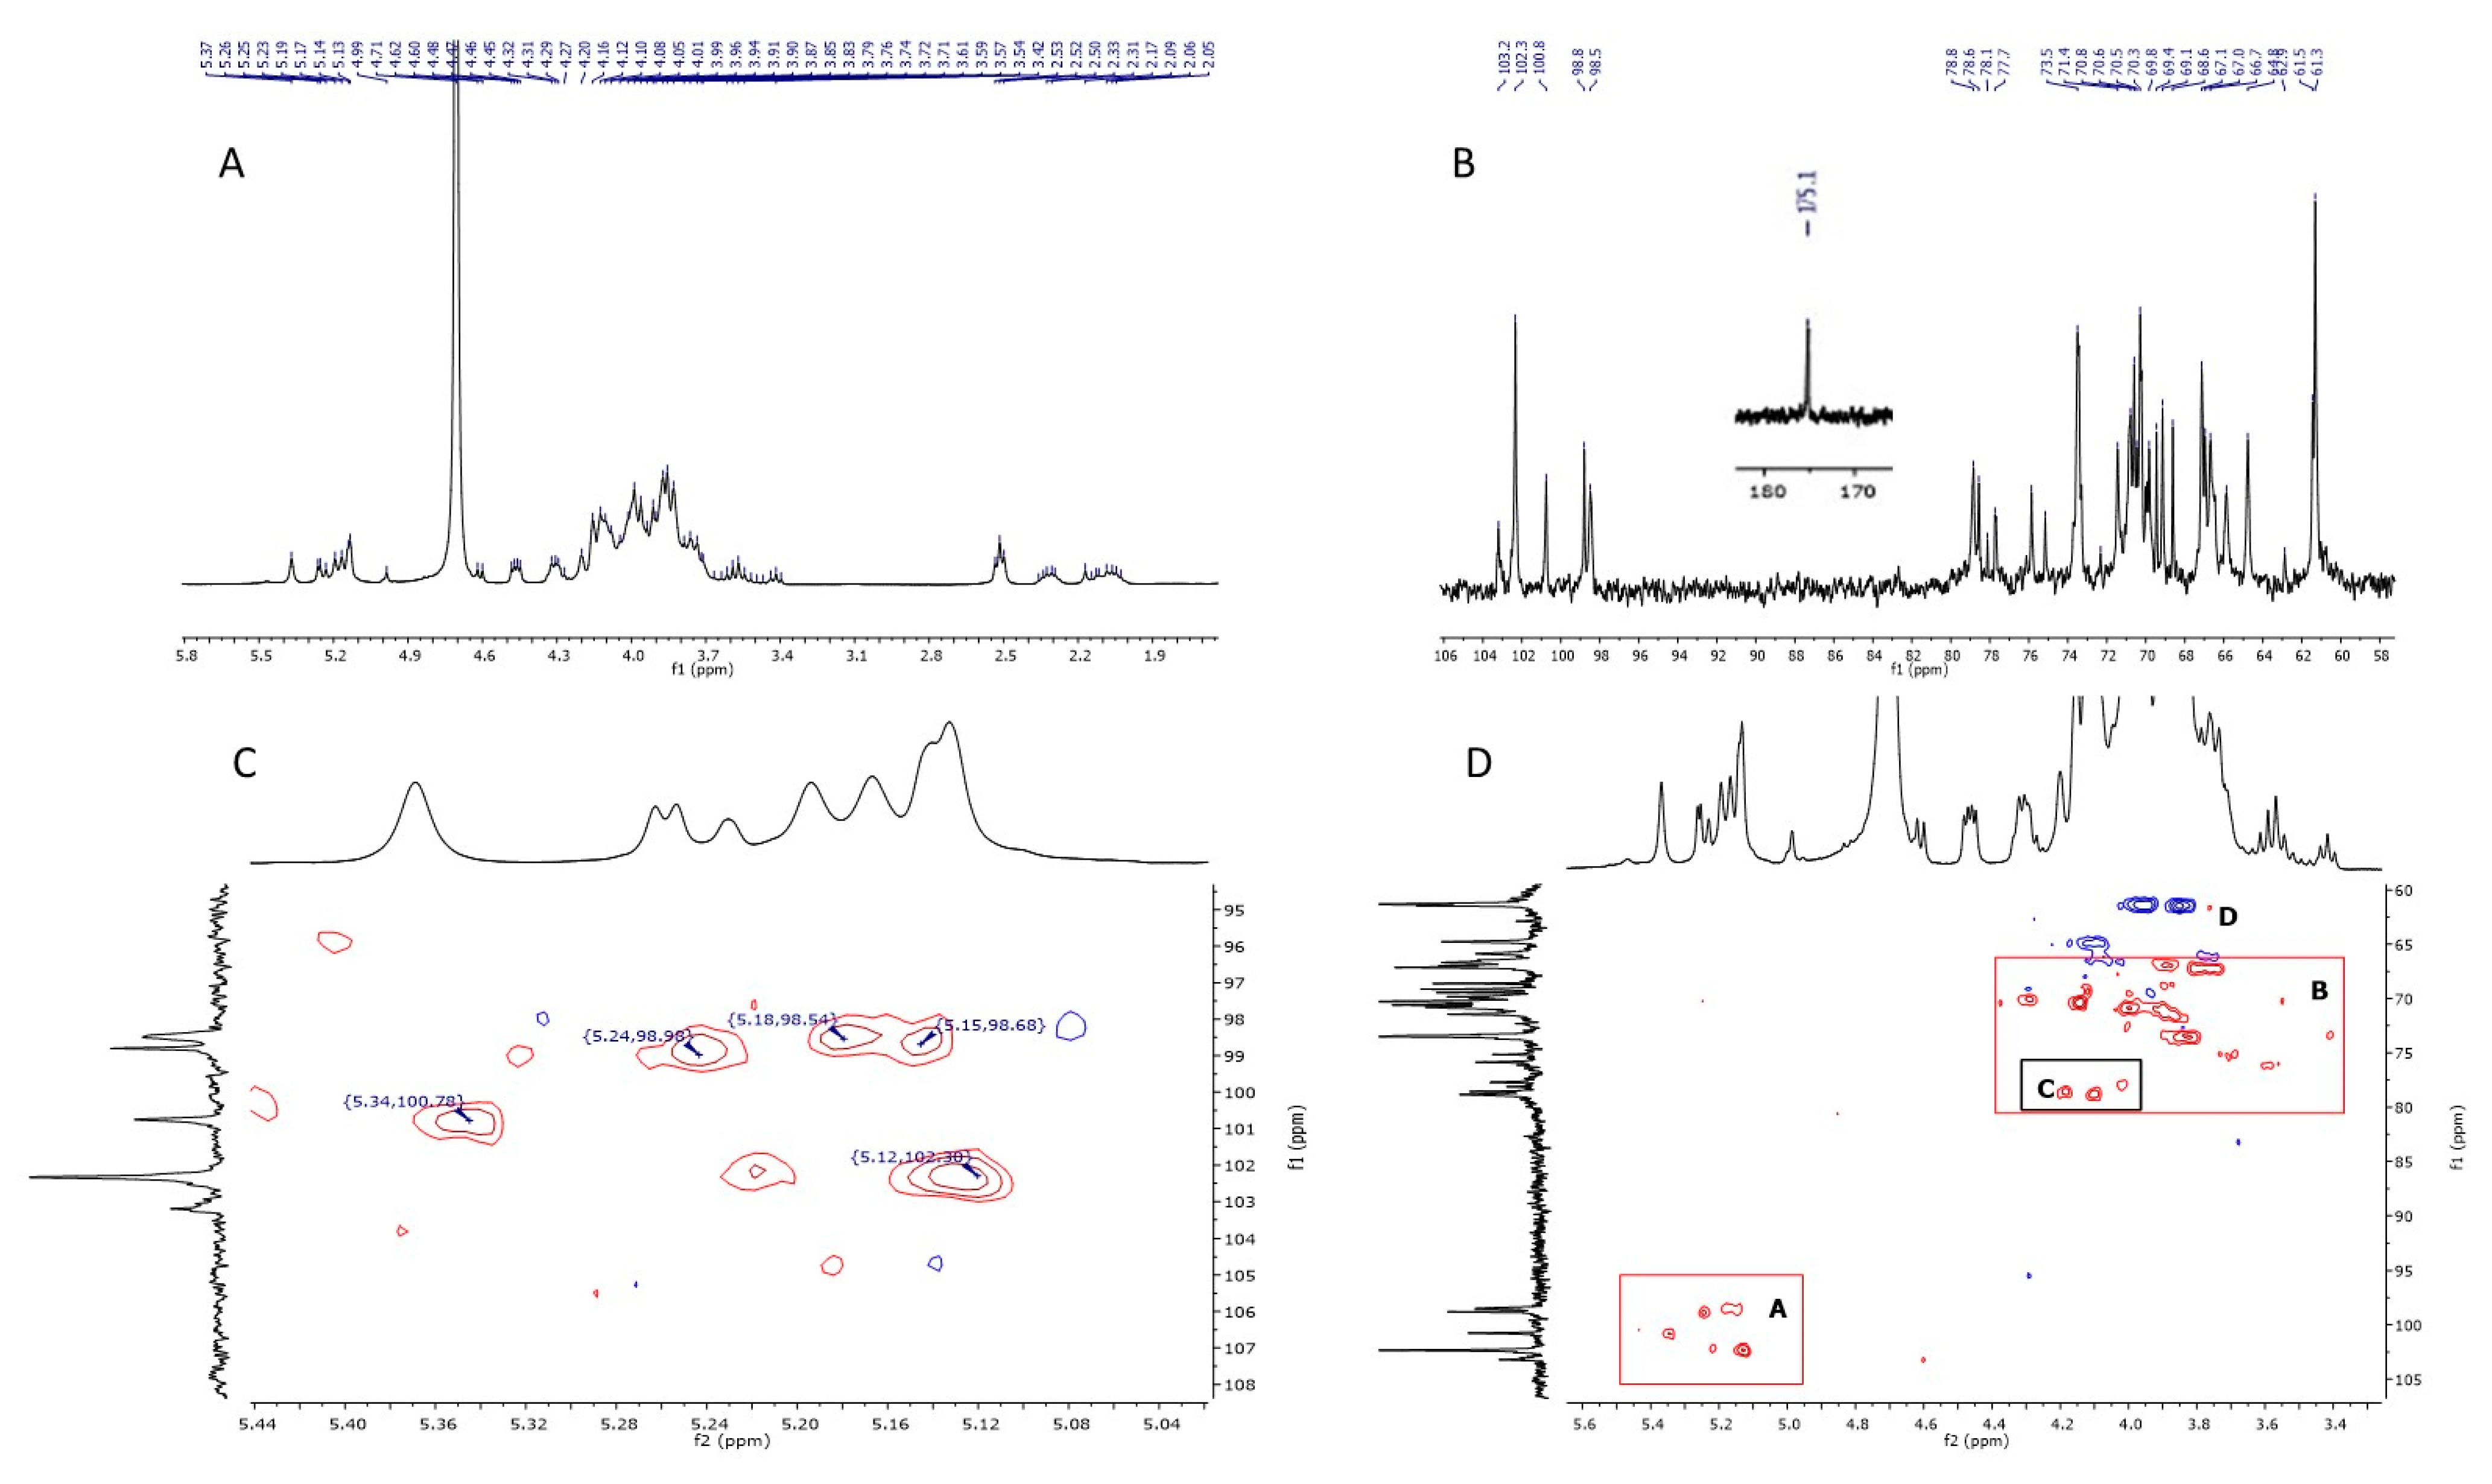
1D and 2D NMR Analysis
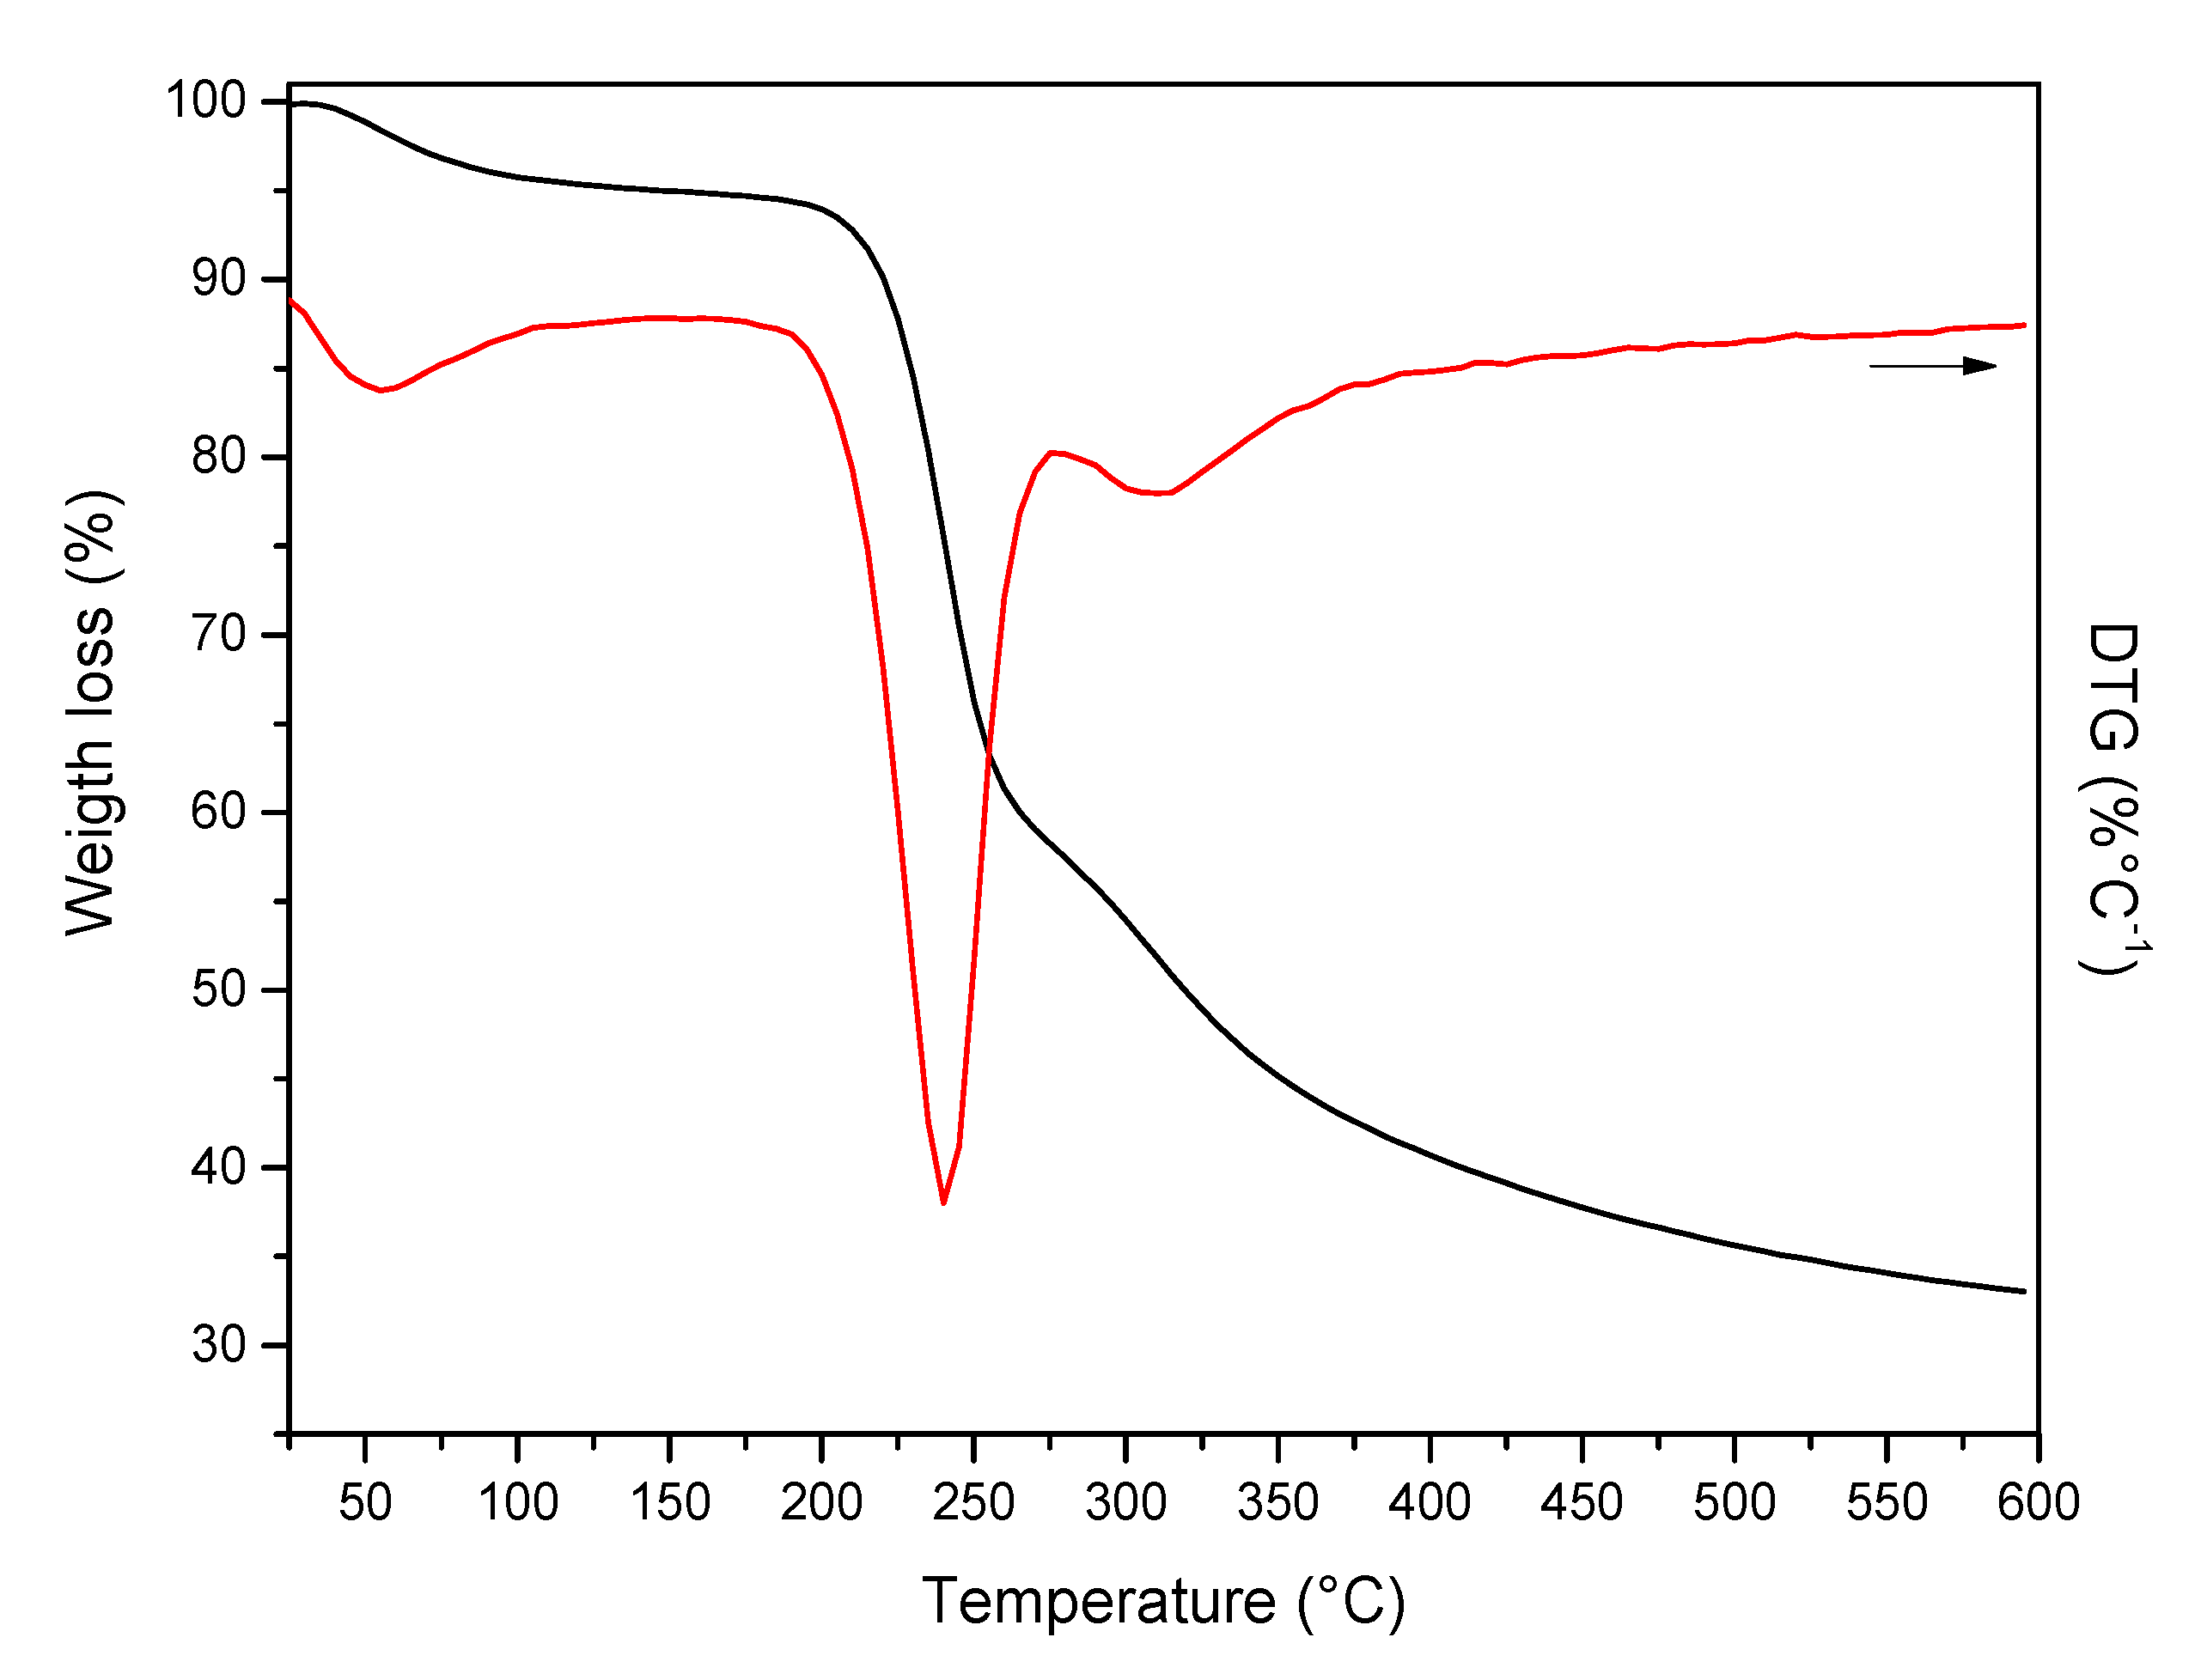
2.5.4. Thermogravimetric Analysis
2.6. Functional Properties of the EPS
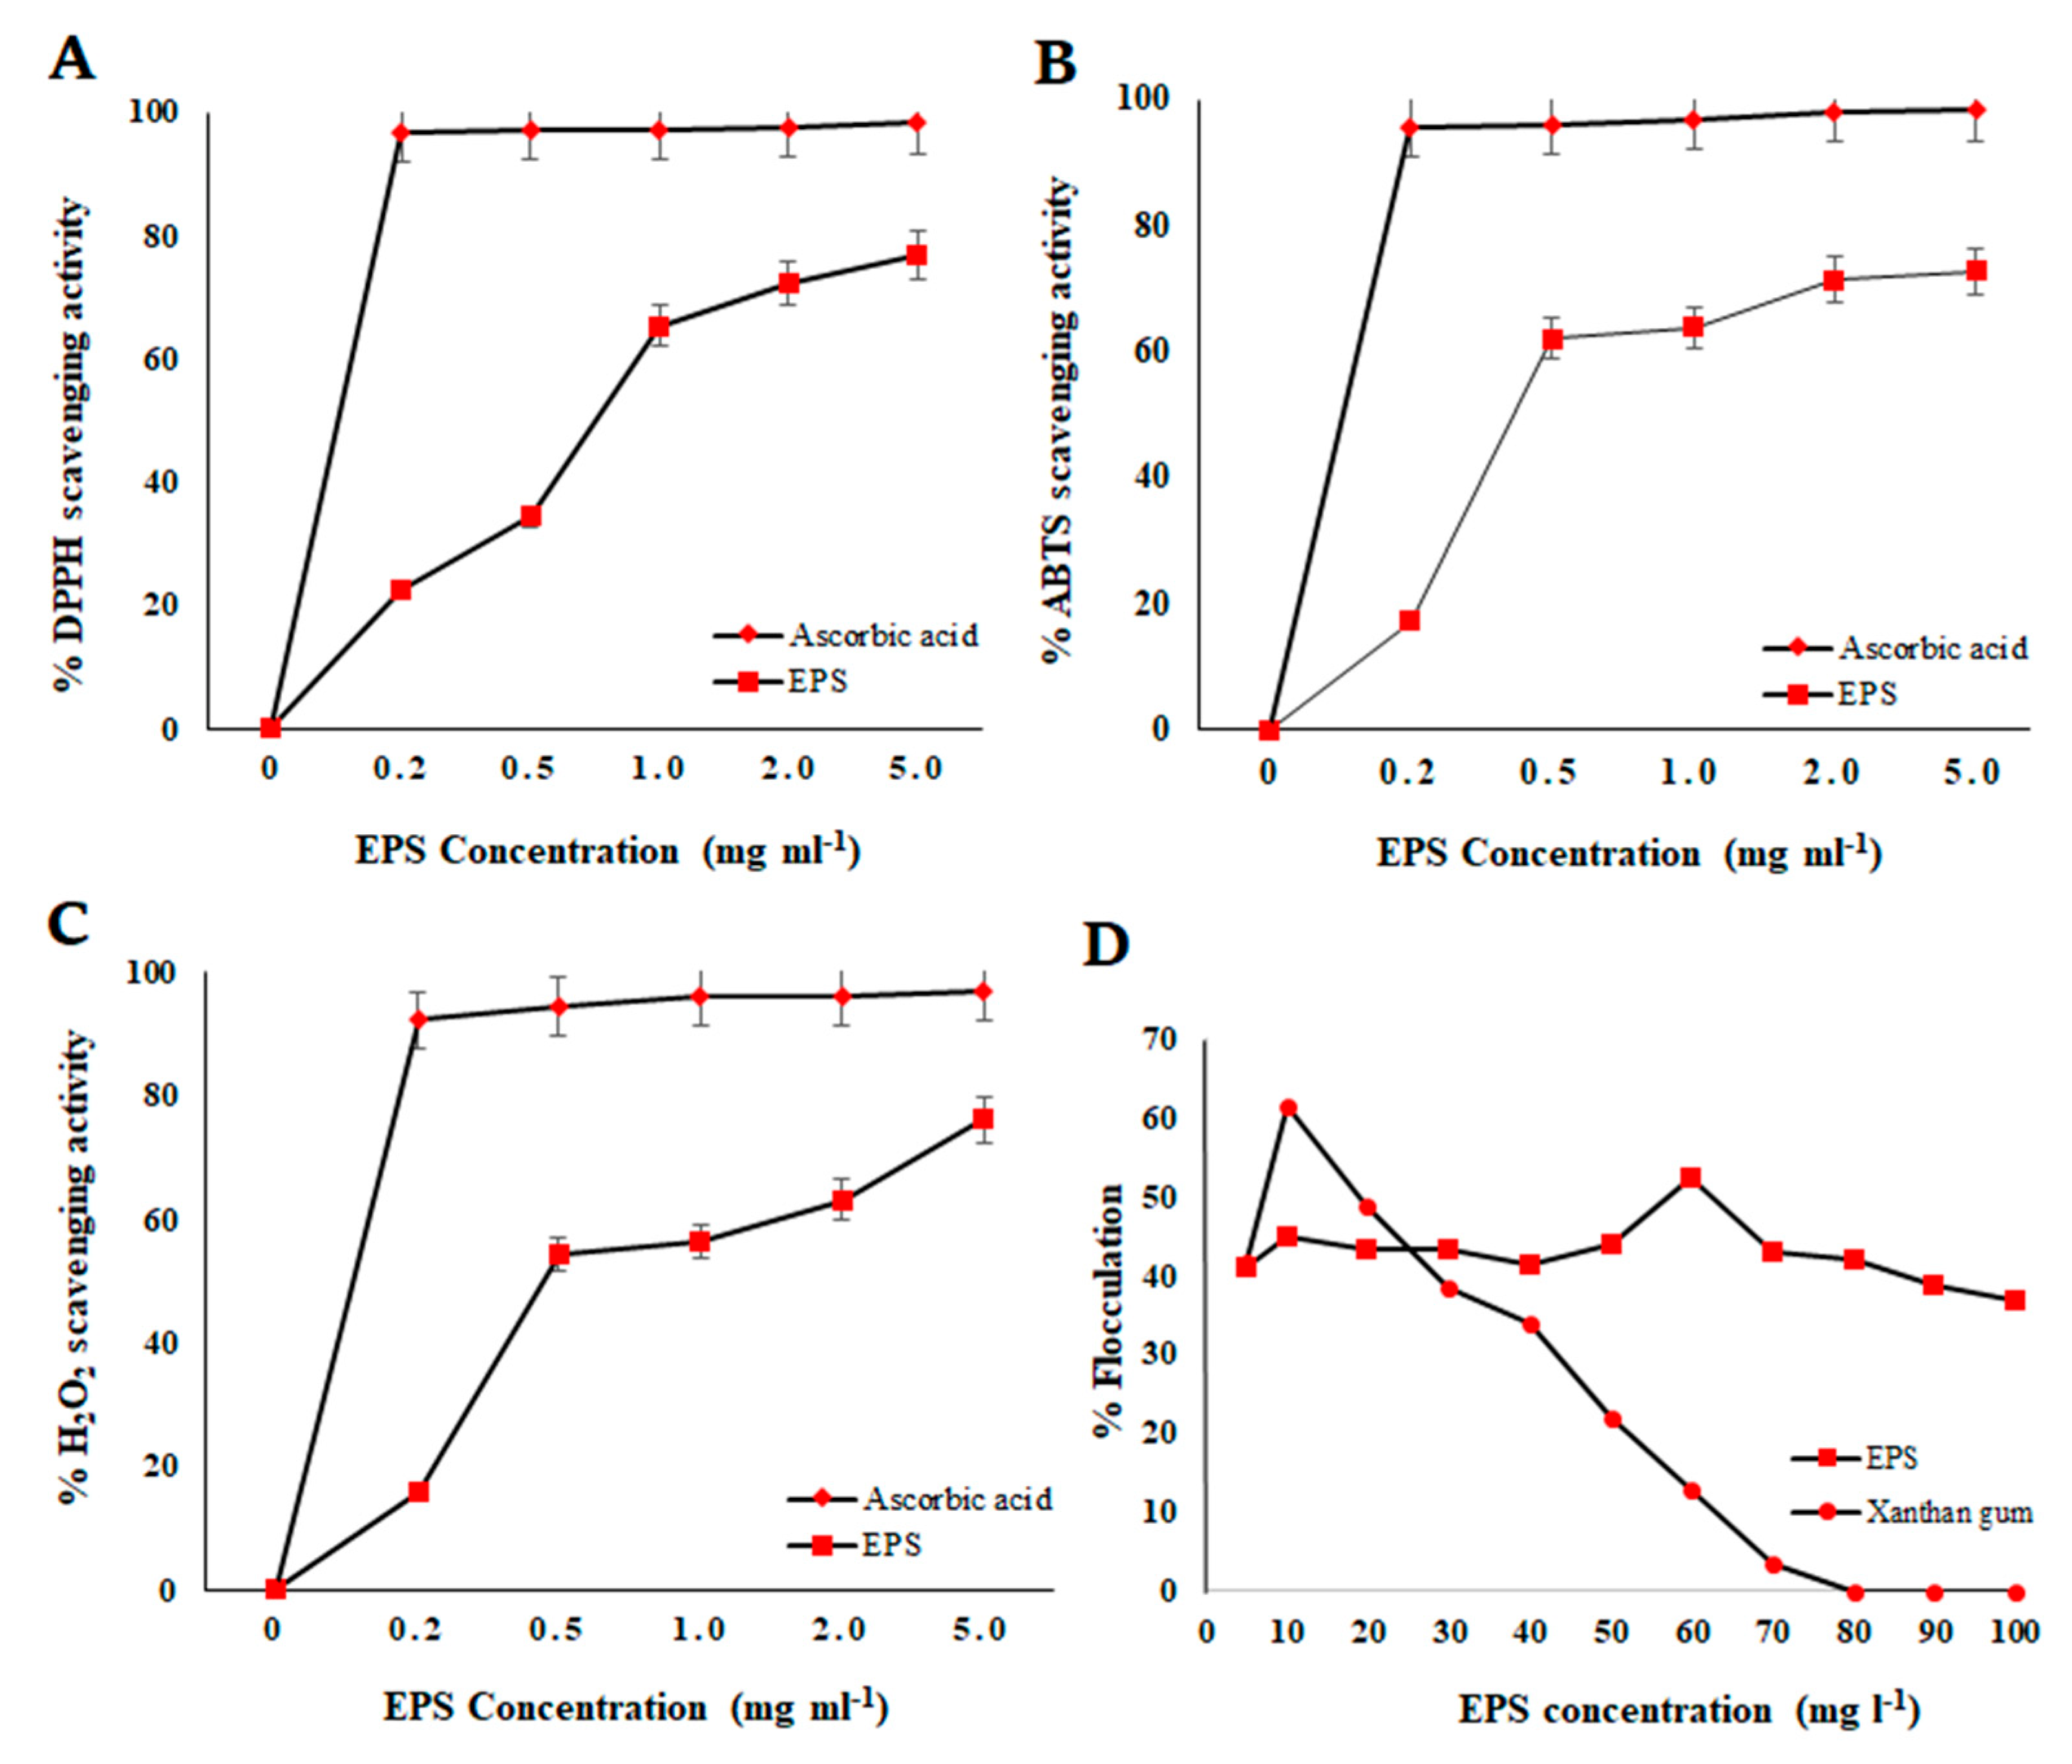
2.6.1. In Vitro Antioxidant Activity Determination
2.6.2. Emulsifying Activity Study
2.6.3. Flocculation Activity Study
2.6.4. Water-Holding and Oil-Holding Capacity Determination
3. Results
3.1. Sampling and Water Analysis
3.2. Isolation and Taxonomic Identification of EPS-Producing Thermophilic Bacteria
3.3. Recovery, Purification of EPS, and OFAT Optimization
3.4. RSM Optimization and Its Validation
3.5. Physicochemical Characterization of the EPS
3.5.1. Morphological Analysis (AFM and SEM)
3.5.2. Monosaccharide Composition Analysis and Molecular Weight
3.5.3. Structural Analysis
Infrared Spectroscopy
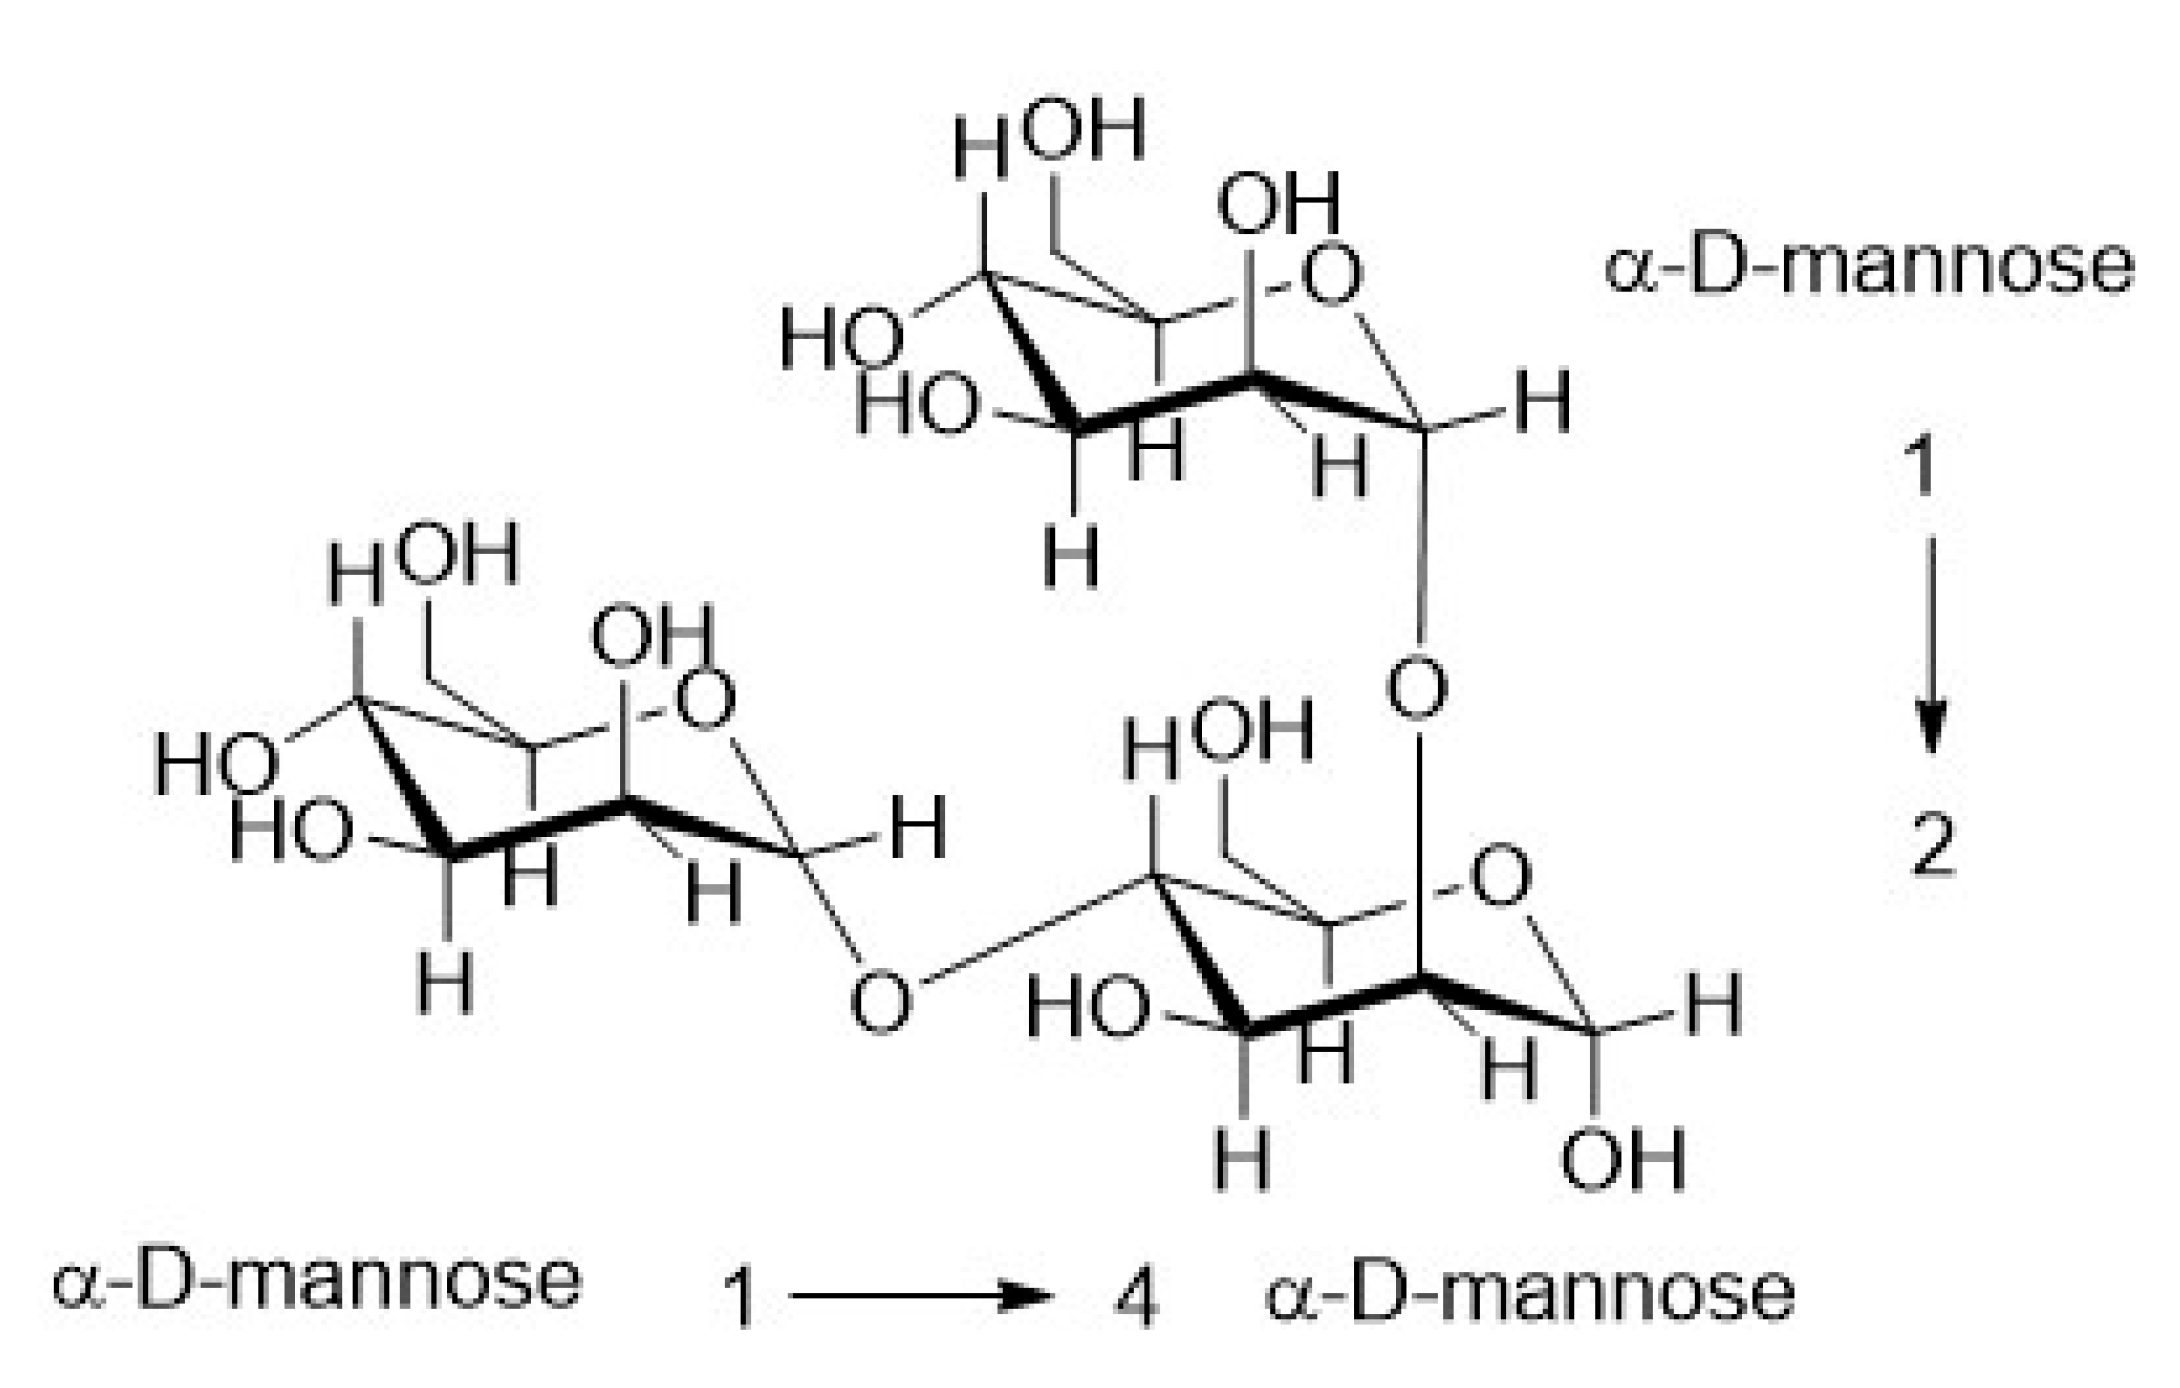
1D and 2D NMR Analysis
3.5.4. Thermogravimetric Analysis
3.6. Functional Properties of the EPS
3.6.1. In Vitro Antioxidant Activity Determination
3.6.2. Emulsifying Activity Study
3.6.3. Flocculation Activity Study
3.7. Water-Holding and Oil-Holding Capacity Determination
4. Discussion
5. Conclusions
Supplementary Materials
Author Contributions
Funding
Institutional Review Board Statement
Informed Consent Statement
Data Availability Statement
Acknowledgments
Conflicts of Interest
References
- Faustino, M.; Veiga, M.; Sousa, P.; Costa, E.M.; Silva, S.; Pintado, M. Agro-food byproducts as a new source of natural food additives. Molecules 2019, 24, 1056. [Google Scholar] [CrossRef] [PubMed] [Green Version]
- Prete, R.; Alam, M.K.; Perpetuini, G.; Perla, C.; Pittia, P.; Corsetti, A. Lactic acid bacteria exopolysaccharides producers: A sustainable tool for functional foods. Foods 2021, 10, 1653. [Google Scholar] [CrossRef] [PubMed]
- Korcz, E.; Varga, L. Exopolysaccharides from lactic acid bacteria: Techno-functional application in the food industry. Trends Food Sci. Technol. 2021, 110, 375–384. [Google Scholar] [CrossRef]
- Wang, J.; Salem, D.R.; Sani, R.K. Extremophilic exopolysaccharides: A review and new perspectives on engineering strategies and applications. Carbohydr. Polym. 2019, 205, 8–26. [Google Scholar] [CrossRef] [PubMed]
- Freitas, F.; Alves, V.D.; Reis, M.A. Advances in bacterial exopolysaccharides: From production to biotechnological applications. Trends Biotechnol. 2011, 29, 388–398. [Google Scholar] [CrossRef]
- Wierzchos, J.; Casero, M.C.; Artieda, O.; Ascaso, C. Endolithic microbial habitats as refuges for life in polyextreme environment of the Atacama Desert. Curr. Opin. Microbiol. 2018, 43, 124–131. [Google Scholar] [CrossRef]
- Orellana, R.; Macaya, C.; Bravo, G.; Dorochesi, F.; Cumsille, A.; Valencia, R.; Rojas, C.; Seeger, M. Living at the frontiers of life: Extremophiles in Chile and their potential for bioremediation. Front. Microbiol. 2018, 9, 2309. [Google Scholar] [CrossRef]
- Filippidou, S.; Junier, T.; Wunderlin, T.; Kooli, W.M.; Palmieri, I.; Al-Dourobi, A.; Molina, V.; Lienhard, R.; Spangenberg, J.E.; Johnson, S.L.; et al. Adaptive strategies in a poly-extreme environment: Differentiation of vegetative cells in Serratia ureilytica and resistance to extreme conditions. Front. Microbiol. 2019, 10, 102. [Google Scholar] [CrossRef]
- Nichols, C.M.; Guezennec, J.; Bowman, J.P. Bacterial exopolysaccharides from extreme marine environments with special consideration of the southern ocean, sea ice, and deep-sea hydrothermal vents: A review. Mar. Biotechnol. 2005, 7, 253–271. [Google Scholar] [CrossRef] [Green Version]
- Kambourova, M.; Radchenkova, N.; Tomova, I.; Bojadjieva, I. Thermophiles as a promising source of exopolysaccharides with interesting properties. In Biotechnology of Extremophiles: Grand Challenges in Biology and Biotechnology; Rampelotto, P., Ed.; Springer: Cham, Switzerland; New York, NY, USA, 2016; Volume 1, pp. 117–139. [Google Scholar] [CrossRef]
- Zhang, L.; Liu, C.; Li, D.; Zhao, Y.; Zhang, X.; Zeng, X.; Yang, Z.; Li, S. Antioxidant activity of an exopolysaccharide isolated from Lactobacillus plantarum C88. Int. J. Biol. Macromol. 2013, 54, 270–275. [Google Scholar] [CrossRef]
- Gan, L.; Li, X.; Wang, H.; Peng, B.; Tian, Y. Structural characterization and functional evaluation of a novel exopolysaccharide from the moderate halophile Gracilibacillus sp. SCU50. Int. J. Biol. Macromol. 2020, 154, 1140–1148. [Google Scholar] [CrossRef]
- Banerjee, A.; Rudra, S.G.; Mazumder, K.; Nigam, V.; Bandopadhyay, R. Structural and functional properties of exopolysaccharide excreted by a novel Bacillus anthracis (Strain PFAB2) of hot spring origin. Indian J. Microbiol. 2018, 58, 39–50. [Google Scholar] [CrossRef]
- Kalita, D.; Joshi, S.R. Study on bioremediation of Lead by exopolysaccharide producing metallophilic bacterium isolated from extreme habitat. Biotechnol. Rep. 2017, 16, 48–57. [Google Scholar] [CrossRef]
- Van Haver, L.; Nayar, S. Polyelectrolyte flocculants in harvesting microalgal biomass for food and feed applications. Algal Res. 2017, 24, 167–180. [Google Scholar] [CrossRef]
- Saleem, M.; Malik, S.; Mehwish, H.M.; Ali, M.W.; Hussain, N.; Khurshid, M.; Rajoka, M.S.R.; Chen, Y. Isolation and functional characterization of exopolysaccharide produced by Lactobacillus plantarum S123 isolated from traditional Chinese cheese. Arch. Microbiol. 2021, 203, 3061–3070. [Google Scholar] [CrossRef]
- Lobo, R.E.; Gómez, M.I.; de Valdez, G.F.; Torino, M.I. Physicochemical and antioxidant properties of a gastroprotective exopolysaccharide produced by Streptococcus thermophilus CRL1190. Food Hydrocoll. 2019, 96, 625–633. [Google Scholar] [CrossRef]
- INN-Chile. Calidad del Agua—Muestreo—Parte 2: Guía Sobre Técnicas de Muestreo; Norma Chilena Oficial NCh 411/2.Of96; Instituto Nacional de Normalización: Santiago, Chile, 1999; 16p. [Google Scholar]
- INN-Chile. Calidad del Agua—Muestreo—Parte 3: Guía Sobre Preservación y Manejo de las Muestras; Norma Chilena Oficial NCh 411/3.Of96; Instituto Nacional de Normalización: Santiago, Chile, 1999; 40p. [Google Scholar]
- INN-Chile. Calidad del Agua—Muestreo—Parte 10: Guía Para el Muestreo de Aguas Residuales; NCh 411/10 Of 97; Instituto Nacional de Normalización: Santiago, Chile, 1999. [Google Scholar]
- Fierro, P.; Tapia, J.; Bertrán, C.; Acuña, C.; Vargas-Chacoff, L. Assessment of Heavy Metal Contamination in Two Edible Fish Species and Water from North Patagonia Estuary. Appl. Sci. 2021, 11, 2492. [Google Scholar] [CrossRef]
- Marín-Sanhueza, C.; Echeverría-Vega, A.; Gómez, A.; Cabrera-Barjas, G.; Romero, R.; Banerjee, A. Stress Dependent Biofilm Formation and Bioactive Melanin Pigment Production by a Thermophilic Bacillus Species from Chilean Hot Spring. Polymers 2022, 14, 680. [Google Scholar] [CrossRef]
- Tamura, K.; Nei, M. Estimation of the number of nucleotide substitutions in the control region of mitochondrial DNA in humans and chimpanzees. Mol. Biol. Evol. 1993, 10, 512–526. [Google Scholar] [CrossRef]
- Kumar, S.; Stecher, G.; Tamura, K. MEGA7: Molecular evolutionary genetics analysis version 7.0 for bigger datasets. Mol. Biol. Evol. 2016, 33, 1870–1874. [Google Scholar] [CrossRef] [Green Version]
- Rimada, P.S.; Abraham, A.G. Comparative study of different methodologies to determine the exopolysaccharide produced by kefir grains in milk and whey. Le Lait 2003, 83, 79–87. [Google Scholar] [CrossRef] [Green Version]
- Prasanna, P.H.; Grandison, A.S. Bifidobacteria in milk products: An overview of physiological and biochemical properties, exopolysaccharide production, selection criteria of milk products and health benefits. Food Res. Int. 2014, 55, 247–262. [Google Scholar] [CrossRef]
- Khani, M.; Bahrami, A.; Ghafari, M.D. Optimization of operating parameters for anti-corrosive biopolymer production by Chryseobacterium Indologenes MUT 2 using central composite design methodology. J. Taiwan. Inst. Chem. Eng. 2015, 59, 165–172. [Google Scholar] [CrossRef]
- Breig, S.J.M.; Luti, K.J.K. Response surface methodology: A review on its applications and challenges in microbial cultures. Mater. Today Proc. 2021, 42, 2277–2284. [Google Scholar] [CrossRef]
- Wang, Y.; Li, C.; Liu, P.; Ahmed, Z.; Xiao, P.; Bai, X. Physical characterization of exopolysaccharide produced by Lactobacillus plantarum KF5 isolated from Tibet Kefir. Carbohydr. Polym. 2010, 82, 895–903. [Google Scholar] [CrossRef]
- Shimada, K.; Fujikawa, K.; Yahara, K.; Nakamura, T. Antioxidative properties of xanthin on autoxidation of soybean oil in cyclodextrin emulsion. J. Agric. Food Chem. 1992, 40, 945–948. [Google Scholar] [CrossRef]
- Nitha, B.; De, S.; Adhikari, S.K.; Devasagayam, T.P.A.; Janardhanan, K.K. Evaluation of free radical scavenging activity of morel mushroom, Morchella esculenta mycelia: A potential source of therapeutically useful antioxidants. Pharm. Biol. 2010, 48, 453–460. [Google Scholar] [CrossRef]
- Ruch, R.J.; Cheng, S.J.; Klauning, J.E. Prevention of cytotoxicity and inhibition of intercellular communication by antioxidant catechins isolated from Chinese green tea. Carcinogenesis 1989, 10, 1003–1008. [Google Scholar] [CrossRef]
- Cooper, D.G.; Goldenberg, B.G. Surface-active agents from two Bacillus species. Appl. Environ. Microbiol. 1987, 53, 224–229. [Google Scholar] [CrossRef] [Green Version]
- Kanmani, P.; Satish kumar, R.; Yuvaraj, N.; Paari, K.A.; Pattukumar, V.; Arul, V. Optimization of media components for enhanced production of Streptococcus phocae PI80 And Its Bacteriocin Using Response Surface Methodology. Braz. J. Microbiol. 2011, 42, 716–720. [Google Scholar] [CrossRef] [Green Version]
- Pu, L.; Zeng, Y.J.; Xu, P.; Li, F.Z.; Zong, M.H.; Yang, J.G.; Lou, W.Y. Using a novel polysaccharide BM2 produced by Bacillus megaterium strain PL8 as an efficient bioflocculant for wastewater treatment. Int. J. Biol. Macromol. 2020, 1, 374–384. [Google Scholar] [CrossRef] [PubMed]
- Kumari, S.; Annamareddy, S.H.K.; Abanti, S.; Rath, P.K. Physicochemical properties and characterization of chitosan synthesized from fish scales, crab and shrimp shells. Int. J. Biol. Macromol. 2017, 104, 1697–1705. [Google Scholar] [CrossRef] [PubMed]
- Wang, J.C.; Kinsella, J.E. Functional properties of novel proteins: Alfalfa leaf protein. J. Food Sci. 1976, 41, 286–292. [Google Scholar] [CrossRef]
- Dunlap, C.A.; Schisler, D.A.; Perry, E.B.; Connor, N.; Cohan, F.M.; Rooney, A.P. Bacillus swezeyi sp. nov. and Bacillus haynesii sp. nov., isolated from desert soil. Int. J. Syst. Evol. Microbiol. 2017, 67, 2720–2725. [Google Scholar] [CrossRef]
- Banerjee, A.; Das, D.; Rudra, S.G.; Mazumder, K.; Andler, R.; Bandopadhyay, R. Characterization of exopolysaccharide produced by Pseudomonas sp. PFAB4 for synthesis of EPS-coated AgNPs with antimicrobial properties. J. Polym. Environ. 2020, 28, 242–256. [Google Scholar] [CrossRef]
- Ahmed, Z.; Wang, Y.; Anjum, N.; Ahmad, A.; Khan, S.T. Characterization of exopolysaccharide produced by Lactobacillus kefiranofaciens ZW3 isolated from Tibet kefir–Part II. Food Hydrocoll. 2013, 30, 343–350. [Google Scholar] [CrossRef]
- Chen, Z.; Shi, J.; Yang, X.; Liu, Y.; Nan, B.; Wang, Z. Isolation of exopolysaccharide-producing bacteria and yeasts from Tibetan kefir and characterisation of the exopolysaccharides. Int. J. Dairy Technol. 2016, 69, 410–417. [Google Scholar] [CrossRef]
- Sabando, C.; Ide, W.; Rodríguez-Díaz, M.; Cabrera-Barjas, G.; Castaño, J.; Bouza, R.; Müller, N.; Gutiérrez, C.; Barral, L.; Rojas, J.; et al. Novel hydrocolloid film based on pectin, starch and Gunnera tinctoria and Ugni molinae plant extracts for wound dressing applications. Curr. Top. Med. Chem. 2020, 20, 280–292. [Google Scholar] [CrossRef]
- Cabrera-Barjas, G.; González, C.; Nesic, A.; Marrugo, K.P.; Gómez, O.; Delattre, C.; Valdes, O.; Yin, H.; Bravo, G.; Cea, J. Utilization of Marine Waste to Obtain β-Chitin Nanofibers and Films from Giant Humboldt Squid Dosidicus gigas. Mar. Drugs 2021, 19, 184. [Google Scholar] [CrossRef]
- Wang, L.; Zhang, H.; Yang, L.; Liang, X.; Zhang, F.; Linhardt, R.J. Structural characterization and bioactivity of exopolysaccharide synthesized by Geobacillus sp. TS3–9 isolated from radioactive radon hot spring. Adv. Biotechnol. Microbiol. 2017, 4, 555634. [Google Scholar] [CrossRef]
- Synytsya, A.; Novak, M. Structural analysis of glucans. Ann. Transl. Med. 2014, 2, 17–31. [Google Scholar] [CrossRef]
- Chen, Y.; Mao, W.; Tao, H.; Zhu, W.; Qi, X.; Chen, Y.; Li, N. Structural characterization and antioxidant properties of an exopolysaccharide produced by the mangrove endophytic fungus Aspergillus sp. Y16. Bioresour. Technol. 2011, 102, 8179–8184. [Google Scholar] [CrossRef]
- Šandula, J.; Kogan, G.; Kačuráková, M.; Machová, E. Microbial (1→3)-β-d-glucans, their preparation, physico-chemical characterization and immunomodulatory activity. Carbohydr. Polym. 1999, 38, 247–253. [Google Scholar] [CrossRef]
- Bystrický, P.; Dobrota, D.; Račay, P.; Bystrický, S. NMR characteristics of a-D-Man-(1–2)-D-Man and a-D-Man- (1–3)-D-Man mannobioses related to Candida albicans yeast mannan structures. Chem. Pap. 2017, 71, 2485–2493. [Google Scholar] [CrossRef]
- Speciale, I.; Notaro, A.; Garcia-Vello, P.; Di Lorenzo, F.; Armiento, S.; Molinaro, A.; De Castro, C. Liquid-state NMR spectroscopy for complex carbohydrate structural analysis: A hitchhiker’s guide. Carbohydr. Polym. 2022, 277, 118885. [Google Scholar] [CrossRef]
- Carbonero, E.R.; Cordeiro, L.M.; Mellinger, C.G.; Sassaki, G.L.; Stocker-Wörgötter, E.; Gorin, P.A.; Iacomini, M. Galactomannans with novel structures from the lichen Roccella decipiens Darb. Carbohydr. Res. 2005, 340, 1699–1705. [Google Scholar] [CrossRef]
- Bubb, W.A. NMR spectroscopy in the study of carbohydrates: Characterizing the structural complexity. Concepts Magn. Reson. Part A Educ. J. 2003, 19, 1–19. [Google Scholar] [CrossRef]
- Zhang, Q.; Campos, M.; Larama, G.; Acuña, J.J.; Valenzuela, B.; Solis, F.; Zamorano, P.; Araya, R.; Sadowsky, M.J.; Jorquera, M.A. Composition and predicted functions of the bacterial community in spouting pool sediments from the El Tatio Geyser field in Chile. Arch. Microbiol. 2021, 203, 389–397. [Google Scholar] [CrossRef]
- Mackenzie, R.; Pedrós-Alió, C.; Díez, B. Bacterial composition of microbial mats in hot springs in Northern Patagonia: Variations with seasons and temperature. Extremophiles 2013, 17, 123–136. [Google Scholar] [CrossRef]
- Lavergne, C.; Aguilar-Muñoz, P.; Calle, N.; Thalasso, F.; Astorga-España, M.S.; Sepulveda-Jauregui, A.; Martinez-Cruz, K.; Gandois, L.; Mansilla, A.; Chamy, R.; et al. Temperature differently affected methanogenic pathways and microbial communities in sub-Antarctic freshwater ecosystems. Environ. Int. 2021, 154, 106575. [Google Scholar] [CrossRef]
- Maturana-Martínez, C.; Fernández, C.; González, H.E.; Galand, P.E. Different Active Microbial Communities in Two Contrasted Subantarctic Fjords. Front. Microbiol. 2021, 12, 1592. [Google Scholar] [CrossRef]
- Cordell, D.; Unsworth, M.J.; Díaz, D. Imaging the Laguna del Maule Volcanic Field, central Chile using magnetotellurics: Evidence for crustal melt regions laterally-offset from surface vents and lava flows. Earth Planet. Sci. Lett. 2018, 488, 168–180. [Google Scholar] [CrossRef]
- Taran, Y.; Kalacheva, E. Acid sulfate-chloride volcanic waters; Formation and potential for monitoring of volcanic activity. J. Volcanol. Geotherm. Res. 2020, 405, 107036. [Google Scholar] [CrossRef]
- Van Soest, M.C.; Evans, W.C.; Mariner, R.H.; Schmidt, M.E. Chloride in Hot Springs of the Cascade Volcanic arc-the Source Puzzle. Lawrence Berkeley National Laboratory. 2003; LBNL Report #: LBNL-55553 Ext. Abs. Available online: https://escholarship.org/uc/item/3h8798dg (accessed on 15 February 2022).
- Lahsen, A. Chilean geothermal resources and their possible utilization. Geothermics 1988, 17, 401–410. [Google Scholar] [CrossRef]
- Alcamán-Arias, M.E.; Pedrós-Alió, C.; Tamames, J.; Fernández, C.; Pérez-Pantoja, D.; Vásquez, M.; Díez, B. Diurnal changes in active carbon and nitrogen pathways along the temperature gradient in Porcelana hot spring microbial mat. Front. Microbiol. 2018, 9, 2353. [Google Scholar] [CrossRef] [Green Version]
- Kambourova, M. Thermostable enzymes and polysaccharides produced by thermophilic bacteria isolated from Bulgarian hot springs. Eng. Life Sci. 2018, 18, 758–767. [Google Scholar] [CrossRef] [Green Version]
- Kambourova, M.; Mandeva, R.; Dimova, D.; Poli, A.; Nicolaus, B.; Tommonaro, G. Production and characterization of a microbial glucan, synthesized by Geobacillus tepidamans V264 isolated from Bulgarian hot spring. Carbohydr. Polym. 2009, 77, 338–343. [Google Scholar] [CrossRef]
- Razack, S.A.; Velayutham, V.; Thangavelu, V. Medium optimization and in vitro antioxidant activity of exopolysaccharide produced by Bacillus subtilis. Korean J. Chem. Eng. 2014, 31, 296–303. [Google Scholar] [CrossRef]
- Vidhyalakshmi, R.; Valli, N.C.; Kumar, G.N.; Sunkar, S. Bacillus circulans exopolysaccharide: Production, characterization and bioactivities. Int. J. Biol. Macromol. 2016, 87, 405–414. [Google Scholar] [CrossRef]
- Moghannem, S.A.; Farag, M.; Shehab, A.M.; Azab, M.S. Exopolysaccharide production from Bacillus velezensis KY471306 using statistical experimental design. Braz. J. Microbiol. 2018, 49, 452–462. [Google Scholar] [CrossRef]
- Farag, M.M.; Moghannem, S.A.; Shehabeldine, A.M.; Azab, M.S. Antitumor effect of exopolysaccharide produced by Bacillus mycoides. Microb. Pathog. 2020, 140, 103947. [Google Scholar] [CrossRef] [PubMed]
- Feng, F.; Zhou, Q.; Yang, Y.; Zhao, F.; Du, R.; Han, Y.; Zhou, Z. Characterization of highly branched dextran produced by Leuconostoc citreum B-2 from pineapple fermented product. Int. J. Biol. Macromol. 2018, 113, 45–50. [Google Scholar] [CrossRef] [PubMed]
- Kanamarlapudi, S.L.R.K.; Muddada, S. Characterization of exopolysaccharide produced by Streptococcus thermophilus CC30. BioMed Res. Int. 2017, 2017, 4201809. [Google Scholar] [CrossRef] [PubMed] [Green Version]
- Sajna, K.V.; Sukumaran, R.K.; Gottumukkala, L.D.; Jayamurthy, H.; Dhar, K.S.; Pandey, A. Studies on structural and physical characteristics of a novel exopolysaccharide from Pseudozyma sp. NII 08165. Int. J. Biol. Macromol. 2013, 59, 84–89. [Google Scholar] [CrossRef]
- Schiano Moriello, V.; Lama, L.; Poli, A.; Gugliandolo, C.; Maugeri, T.L.; Gambacorta, A.; Nicolaus, B. Production of exopolysaccharides from a thermophilic microorganism isolated from a marine hot spring in flegrean areas. J. Ind. Microbiol. Biotechnol. 2003, 30, 95–101. [Google Scholar] [CrossRef]
- Petrova, P.; Arsov, A.; Ivanov, I.; Tsigoriyna, L.; Petrov, K. New Exopolysaccharides Produced by Bacillus licheniformis 24 Display Substrate-Dependent Content and Antioxidant Activity. Microorganisms 2021, 9, 2127. [Google Scholar] [CrossRef]
- Liu, T.; Zhou, K.; Yin, S.; Liu, S.; Zhu, Y.; Yang, Y.; Wang, C. Purification and characterization of an exopolysaccharide produced by Lactobacillus plantarum HY isolated from home-made Sichuan Pickle. Int. J. Biol. Macromol. 2019, 134, 516–526. [Google Scholar] [CrossRef]
- Spanò, A.; Gugliandolo, C.; Lentini, V.; Maugeri, T.L.; Anzelmo, G.; Poli, A.; Nicolaus, B. A novel EPS-producing strain of Bacillus licheniformis isolated from a shallow vent off Panarea Island (Italy). Curr. Microbiol. 2013, 67, 21–29. [Google Scholar] [CrossRef]
- Jamir, K.; Badithi, N.; Venumadhav, K.; Seshagirirao, K. Characterization and comparative studies of galactomannans from Bauhinia vahlii, Delonix elata, and Peltophorum pterocarpum. Int. J. Biol. Macromol. 2019, 134, 498–506. [Google Scholar] [CrossRef]
- Marshall, V.M.; Rawson, H.L. Effects of exopolysaccharide-producing strains of thermophilic lactic acid bacteria on the texture of stirred yoghurt. Int. J. Food Sci. Technol. 1999, 34, 137–143. [Google Scholar] [CrossRef]
- Nicolaus, B.; Kambourova, M.; Oner, E.T. Exopolysaccharides from extremophiles: From fundamentals to biotechnology. Environ. Technol. 2010, 31, 1145–1158. [Google Scholar] [CrossRef]
- Su, Y.; Li, L. Structural Characterization and Antioxidant Activity of polysaccharide from four Auriculariales. Carbohydr. Polym. 2019, 229, 115407. [Google Scholar] [CrossRef]
- Luang-In, V.; Deeseenthum, S. Exopolysaccharide-producing isolates from Thai milk kefir and their antioxidant activities. LWT 2016, 73, 592–601. [Google Scholar] [CrossRef]
- Gangalla, R.; Sampath, G.; Beduru, S.; Sarika, K.; Govindarajan, R.K.; Ameen, F.; Alwakeel, S.; Thampu, R.K. Optimization and characterization of exopolysaccharide produced by Bacillus aerophilus rk1 and its in vitro antioxidant activities. J. King Saud Univ. Sci. 2021, 33, 101470. [Google Scholar] [CrossRef]
- Kavitake, D.; Balyan, S.; Devi, P.B.; Shetty, P.H. Evaluation of oil-in-water (O/W) emulsifying properties of galactan exopolysaccharide from Weissella confusa KR780676. J. Food Sci. Technol. 2020, 57, 1579–1585. [Google Scholar] [CrossRef]
- Leyva-Porras, C.; Román-Aguirre, M.; Cruz-Alcantar, P.; Pérez-Urizar, J.T.; dora-Leos, M.Z. Application of antioxidants as an alternative improving of shelf life in foods. Polysaccharides 2021, 2, 594–607. [Google Scholar] [CrossRef]
- Gongi, W.; Gomez Pinchetti, J.L.; Cordeiro, N.; Ouada, H.B. Extracellular Polymeric Substances Produced by the Thermophilic Cyanobacterium Gloeocapsa gelatinosa: Characterization and Assessment of Their Antioxidant and Metal-Chelating Activities. Mar. Drugs 2022, 20, 227. [Google Scholar] [CrossRef]
- Song, B.; Zhu, W.; Song, R.; Yan, F.; Wang, Y. Exopolysaccharide from Bacillus vallismortis WF4 as an emulsifier for antifungal and antipruritic peppermint oil emulsion. Int. J. Biol. Macromol. 2018, 126, 1014–1022. [Google Scholar] [CrossRef]
- Bibi, A.; Xiong, Y.; Rajoka, M.S.R.; Mehwish, H.M.; Radicetti, E.; Umair, M.; Shoukat, M.; Khan, M.K.I.; Aadil, R.M. Recent Advances in the Production of Exopolysaccharide (EPS) from Lactobacillus spp. and Its Application in the Food Industry: A Review. Sustainability 2021, 13, 12429. [Google Scholar] [CrossRef]
- Roselet, F.; Vandamme, D.; Roselet, M.; Muylaert, K.; Abreu, P.C. Screening of commercial natural and synthetic cationic polymers for flocculation of freshwater and marine microalgae and effects of molecular weight and charge density. Algal Res. 2015, 10, 183–188. [Google Scholar] [CrossRef]
- Okaiyeto, K.; Nwodo, U.U.; Mabinya, L.V.; Okoh, A.I. Characterization of a bioflocculant produced by a consortium of Halomonas sp. Okoh and Micrococcus sp. Leo. Int. J. Environ. Res. Public Health 2013, 10, 5097–5110. [Google Scholar] [CrossRef] [Green Version]
- Mathivanan, K.; Chandirika, J.U.; Vinothkanna, A.; Govindarajan, R.K.; Meng, D.; Yin, H. Characterization and biotechnological functional activities of exopolysaccharides produced by Lysinibacillus fusiformis KMNTT-10. J. Polym. Environ. 2021, 29, 1742–1751. [Google Scholar] [CrossRef]
- Verstrepen, K.J.; Klis, F.M. Flocculation, adhesion and biofilm formation in yeasts. Mol. Microbiol. 2006, 60, 5–15. [Google Scholar] [CrossRef]
- Gupta, B.S.; Ako, J.E. Application of guar gum as a flocculant aid in food processing and potable water treatment. Eur. Food Res. Technol. 2005, 221, 746–751. [Google Scholar] [CrossRef]
- Venugopal, V. Marine Polysaccharides: Food Applications; CRC Press: Boca Raton, FL, USA, 2016. [Google Scholar]
- Insulkar, P.; Kerkar, S.; Lele, S.S. Purification and structural-functional characterization of an exopolysaccharide from Bacillus licheniformis PASS26 with in-vitro antitumor and wound healing activities. Int. J. Biol. Macromol. 2018, 120, 1441–1450. [Google Scholar] [CrossRef]
- Trabelsi, I.; Ktari, N.; Triki, M.; Bkhairia, I.; Slima, S.B.; Aydi, S.S.; Aydi, S.; Abdeslam, A.; Salah, R.B. Physicochemical, techno-functional, and antioxidant properties of a novel bacterial exopolysaccharide in cooked beef sausage. Int. J. Biol. Macromol. 2018, 111, 11–18. [Google Scholar] [CrossRef]
- Levine, H.; Slade, L. Influence of hydrocolloids in low-moisture foods—A food polymer science approach. In Gums and Stabilisers for the Food Industry 12; Royal Society of Chemistry: London, UK, 2004; pp. 423–436. [Google Scholar] [CrossRef]
- Devi, P.B.; Kavitake, D.; Shetty, P.H. Physico-chemical characterization of galactan exopolysaccharide produced by Weissella confusa KR780676. Int. J. Biol. Macromol. 2016, 93, 822–828. [Google Scholar] [CrossRef] [PubMed]
- Mohanasrinivasan, V.; Mishra, M.; Paliwal, J.S.; Singh, S.K.; Selvarajan, E.; Suganthi, V.; Subathra Devi, C. Studies on heavy metal removal efficiency and antibacterial activity of chitosan prepared from shrimp shell waste. 3 Biotech 2014, 4, 167–175. [Google Scholar] [CrossRef] [PubMed] [Green Version]
- Petravić-Tominac, V.; Zechner-Krpan, V.; Berković, K.; Galović, P.; Herceg, Z.; Srečec, S.; Špoljarić, I. Rheological properties, water-holding and oil-binding capacities of particulate β-glucans isolated from spent brewer’s yeast by three different procedures. Food Technol. Biotechnol. 2011, 49, 56–64. [Google Scholar]


| Std | Run | Point Type | Glucose (g L−1) | Yeast Extract (g L−1) | pH | Inoculum Size (mL L−1) | EPS (g L−1) | |
|---|---|---|---|---|---|---|---|---|
| Actual | Predicted | |||||||
| 27 | 1 | Center | 30 (0) | 30 (0) | 7 (0) | 30 (0) | 4 | 4.08 |
| 12 | 2 | Fact | 40 (+1) | 40 (+1) | 6 (−1) | 40 (+1) | 1.98 | 2.01 |
| 4 | 3 | Fact | 40 (+1) | 40 (+1) | 6 (−1) | 20 (−1) | 0.79 | 0.63 |
| 6 | 4 | Fact | 40 (+1) | 20 (−1) | 8 (+1) | 20 (−1) | 0.78 | 0.75 |
| 13 | 5 | Fact | 20 (−1) | 20 (−1) | 8 (+1) | 40 (+1) | 1.8 | 2.01 |
| 7 | 6 | Fact | 20 (−1) | 40 (+1) | 8 (+1) | 20 (−1) | 0.56 | 0.64 |
| 20 | 7 | Axial | 30 (0) | 50 (+2) | 7 (0) | 30 (0) | 1 | 0.97 |
| 14 | 8 | Fact | 40 (+1) | 20 (−1) | 8 (+1) | 40 (+1) | 1.65 | 1.75 |
| 16 | 9 | Fact | 40 (+1) | 40 (+1) | 8 (+1) | 40 (+1) | 3 | 3.15 |
| 28 | 10 | Center | 30 (0) | 30 (0) | 7 (0) | 30 (0) | 4.19 | 4.08 |
| 30 | 11 | Center | 30 (0) | 30 (0) | 7 (0) | 30 (0) | 4 | 4.8 |
| 19 | 12 | Axial | 30 (0) | 10 (−2) | 7 (0) | 30 (0) | 3.6 | 3.46 |
| 2 | 13 | Fact | 40 (+1) | 20 (−1) | 6 (−1) | 20 (−1) | 2.28 | 2.45 |
| 18 | 14 | Axial | 50 (+2) | 30 (0) | 7 (0) | 30 (0) | 1 | 0.92 |
| 8 | 15 | Fact | 40 (+1) | 40 (+1) | 8 (+1) | 20 (−1) | 1.41 | 1.49 |
| 21 | 16 | Axial | 30 (0) | 30 (0) | 5 (−2) | 30 (0) | 2.56 | 2.62 |
| 10 | 17 | Fact | 40 (+1) | 20 (−1) | 6 (−1) | 40 (+1) | 3.2 | 3.17 |
| 17 | 18 | Axial | 10 (−2) | 30 (0) | 7 (0) | 30 (0) | 2.7 | 2.61 |
| 1 | 19 | Fact | 20 (−1) | 20 (−1) | 6 (−1) | 20 (−1) | 6.05 | 5.98 |
| 25 | 20 | Center | 30 (0) | 30 (0) | 7 (0) | 30 (0) | 4.2 | 4.08 |
| 26 | 21 | Center | 30 (0) | 30 (0) | 7 (0) | 30 (0) | 4.1 | 4.08 |
| 5 | 22 | Fact | 20 (−1) | 20 (−1) | 8 (+1) | 20 (−1) | 1.9 | 1.98 |
| 3 | 23 | Fact | 20 (−1) | 40 (+1) | 6 (−1) | 20 (−1) | 2.05 | 2.06 |
| 9 | 24 | Fact | 20 (−1) | 20 (−1) | 6 (−1) | 40 (+1) | 5.69 | 5.72 |
| 15 | 25 | Fact | 20 (−1) | 40 (+1) | 8 (+1) | 40 (+1) | 1.4 | 1.34 |
| 29 | 26 | Center | 30 (0) | 30 (0) | 7 (0) | 30 (0) | 4 | 4.08 |
| 23 | 27 | Axial | 30 (0) | 30 (0) | 7 (0) | 10 (−2) | 3.5 | 3.51 |
| 24 | 28 | Axial | 30 (0) | 30 (0) | 7 (0) | 50 (+2) | 5.1 | 4.91 |
| 22 | 29 | Axial | 30 (0) | 30 (0) | 9 (+2) | 30 (0) | 0 | −0.22 |
| 11 | 30 | Fact | 20 (−1) | 40 (+1) | 6 (−1) | 40 (+1) | 2.4 | 2.48 |
| Source | Sum of Squares | Degree of Freedom | Mean Square | F-Value | p-Value (Prob > F) |
|---|---|---|---|---|---|
| Model | 70.99278 | 14 | 5.07091286 | 225.6301761 | <0.0001 *** |
| A-glucose | 4.3010667 | 1 | 4.30106667 | 191.3758837 | <0.0001 *** |
| B-yeast extract | 9.3250667 | 1 | 9.32506667 | 414.9186731 | <0.0001 *** |
| C-pH | 12.126817 | 1 | 12.1268167 | 539.5824888 | <0.0001 *** |
| D-inoculum size | 3.0104167 | 1 | 3.01041667 | 133.9484353 | <0.0001 *** |
| AB | 4.305625 | 1 | 4.305625 | 191.5787067 | <0.0001 *** |
| AC | 5.1984 | 1 | 5.1984 | 231.3027142 | <0.0001 *** |
| AD | 0.9216 | 1 | 0.9216 | 41.00657537 | <0.0001 *** |
| BC | 6.5536 | 1 | 6.5536 | 291.6023137 | <0.0001 *** |
| BD | 0.4356 | 1 | 0.4356 | 19.38201414 | 0.0005 ** |
| CD | 0.075625 | 1 | 0.075625 | 3.36493301 | 0.0865 ** |
| A^2 | 9.1806298 | 1 | 9.18062976 | 408.4919556 | <0.0001 *** |
| B^2 | 5.957344 | 1 | 5.95734405 | 265.0719159 | <0.0001 *** |
| C^2 | 14.260144 | 1 | 14.260144 | 634.5048521 | <0.0001 *** |
| D^2 | 0.0316298 | 1 | 0.03162976 | 1.407365685 | 0.2539 |
| Lack of Fit | 0.2910333 | 10 | 0.02910333 | 3.157685353 | 0.1081 |
| Residual | 0.3371167 | 15 | 0.02247444 | ||
| Pure Error | 0.0460833 | 5 | 0.00921667 | ||
| Cor Total | 71.329897 | 29 | |||
| Std. Dev. | 0.1499148 | ||||
| Mean | 2.6963333 | ||||
| C.V. % | 5.5599502 | ||||
| PRESS | 1.742712 | ||||
| R-Squared | 0.9952738 | ||||
| Adj R-Squared | 0.9908627 | ||||
| Pred R-Squared | 0.9755682 | ||||
| Adeq Precision | 58.298716 |
| Vegetable Oils | Emulsification Index (E24) | ||
|---|---|---|---|
| CamB6 EPS | Synthetic Surfactant Tween 20 | EPS Biopolymer Xanthan Gum | |
| Coconut | 62.73 ± 0.97 | 48.18 ± 0.78 | 58.33 ± 0.71 |
| Corn | 69.09 ± 0.25 | 46.36 ± 1.42 | 51.67 ± 0.82 |
| Canola | 64.55 ± 1.20 | 45.00 ± 0.00 | 51.67 ± 0.82 |
| Avocado | 69.09 ± 0.25 | 50.91 ± 0.49 | 56.36 ± 3.00 |
| Sunflower | 62.73 ± 0.65 | 43.33 ± 1.35 | 60.00 ± 0.00 |
| Olive | 65.45 ± 2.20 | 50.91 ± 0.45 | 80.00 ± 0.00 |
| Sesame | 75.45 ± 1.16 | 64.55 ± 1.20 | 80.00 ± 0.00 |
Publisher’s Note: MDPI stays neutral with regard to jurisdictional claims in published maps and institutional affiliations. |
© 2022 by the authors. Licensee MDPI, Basel, Switzerland. This article is an open access article distributed under the terms and conditions of the Creative Commons Attribution (CC BY) license (https://creativecommons.org/licenses/by/4.0/).
Share and Cite
Banerjee, A.; Mohammed Breig, S.J.; Gómez, A.; Sánchez-Arévalo, I.; González-Faune, P.; Sarkar, S.; Bandopadhyay, R.; Vuree, S.; Cornejo, J.; Tapia, J.; et al. Optimization and Characterization of a Novel Exopolysaccharide from Bacillus haynesii CamB6 for Food Applications. Biomolecules 2022, 12, 834. https://doi.org/10.3390/biom12060834
Banerjee A, Mohammed Breig SJ, Gómez A, Sánchez-Arévalo I, González-Faune P, Sarkar S, Bandopadhyay R, Vuree S, Cornejo J, Tapia J, et al. Optimization and Characterization of a Novel Exopolysaccharide from Bacillus haynesii CamB6 for Food Applications. Biomolecules. 2022; 12(6):834. https://doi.org/10.3390/biom12060834
Chicago/Turabian StyleBanerjee, Aparna, Sura Jasem Mohammed Breig, Aleydis Gómez, Ignacio Sánchez-Arévalo, Patricio González-Faune, Shrabana Sarkar, Rajib Bandopadhyay, Sugunakar Vuree, Jorge Cornejo, Jaime Tapia, and et al. 2022. "Optimization and Characterization of a Novel Exopolysaccharide from Bacillus haynesii CamB6 for Food Applications" Biomolecules 12, no. 6: 834. https://doi.org/10.3390/biom12060834