Differential Expression of ADP/ATP Carriers as a Biomarker of Metabolic Remodeling and Survival in Kidney Cancers

 , , , , , and
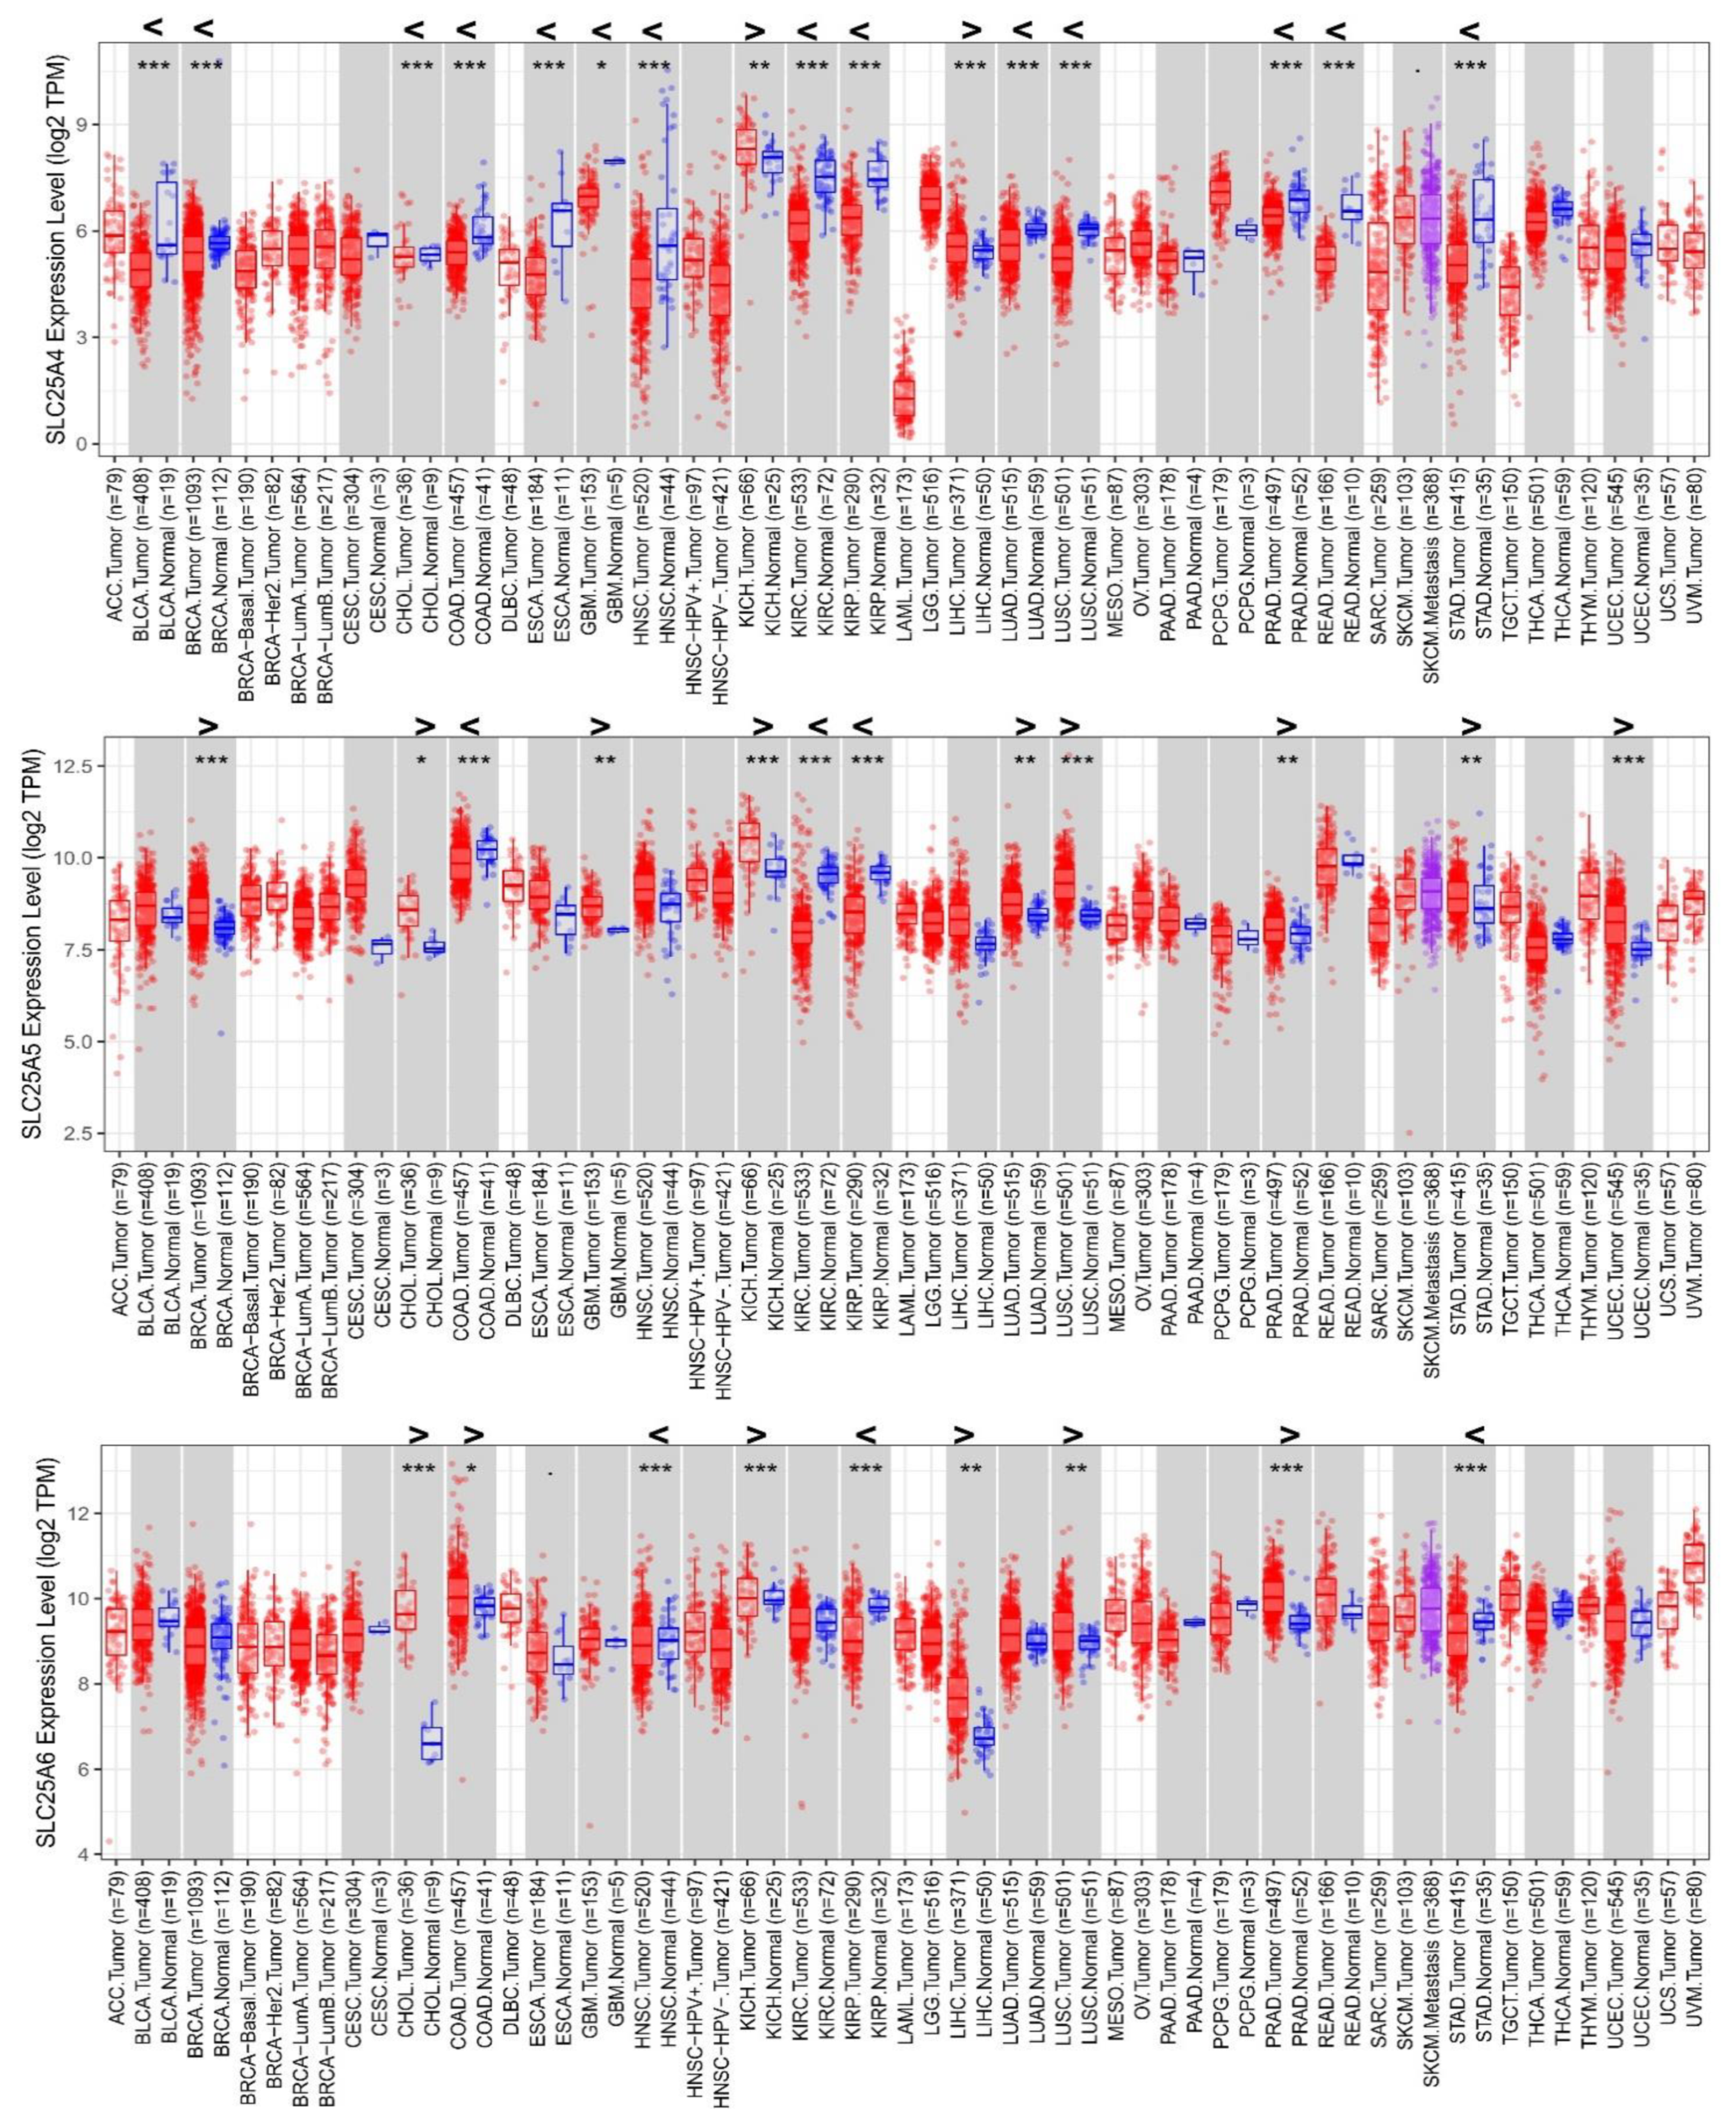
Abstract
:1. Introduction
2. Materials and Methods
2.1. Cell Culture
2.2. RNA Quantification in Tissues from TCGA Database
2.3. RNA Extraction and qRT-PCR of the Investigated Kidney Cell Lines Grown in Complete Medium or Starved (Serum-Free) Conditions
2.4. Protein Extraction
2.5. Immunoblotting Assays
2.6. Caspase-9 Analysis
3. Results
3.1. Differential Expression of AACs in Cancer/Normal Tissues from TCGA Analyses
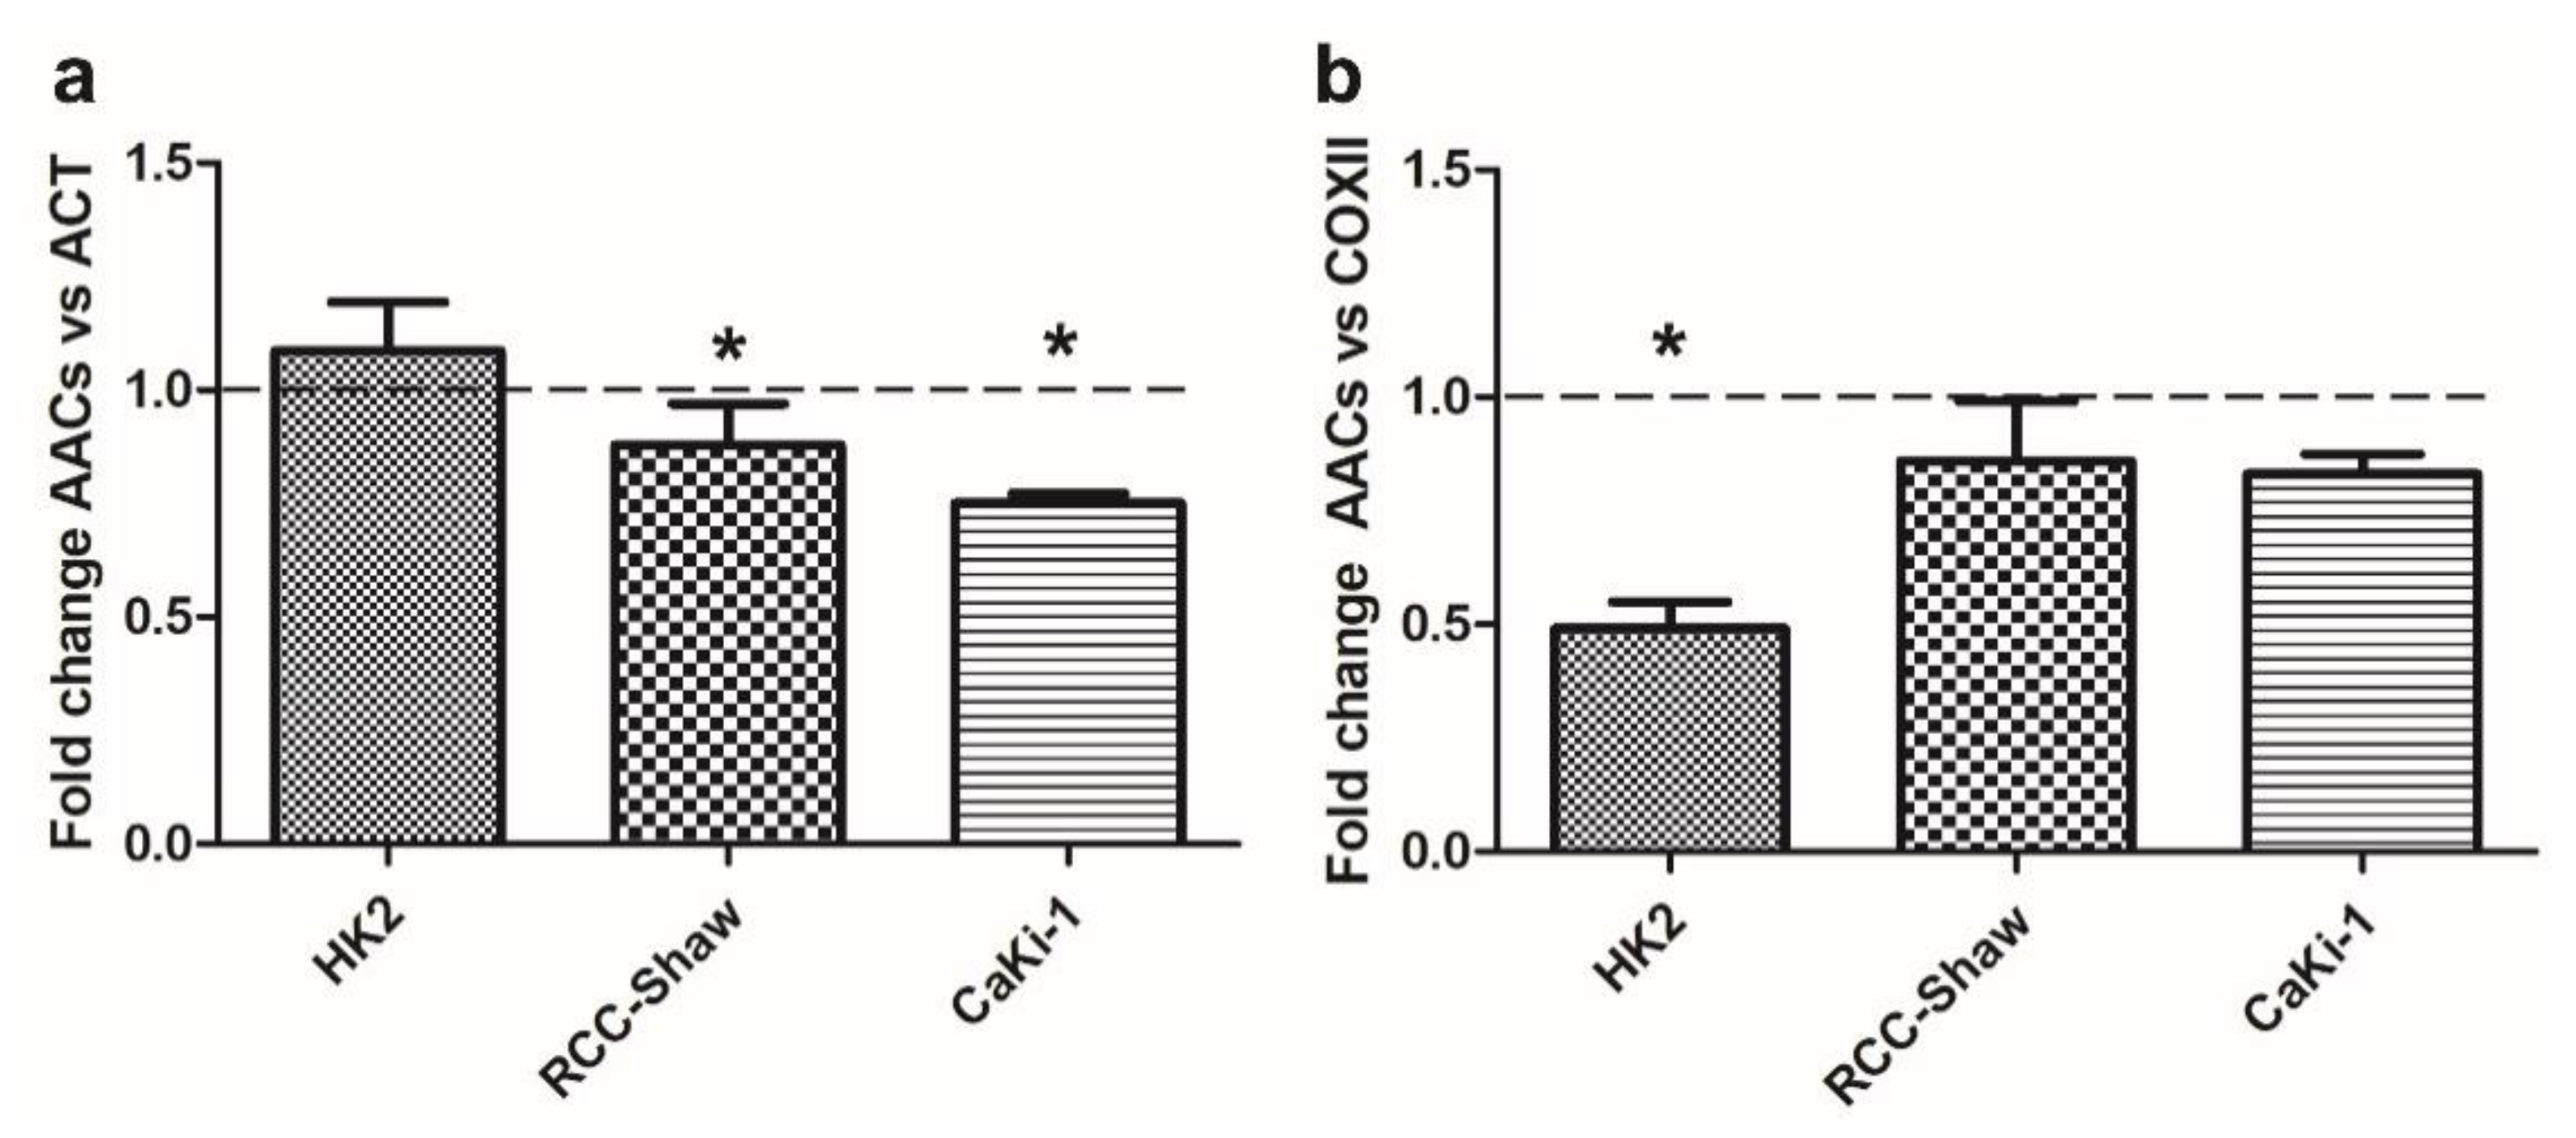
3.2. Differential Expression of AACs in Kidney Cell Lines in Response to Serum Deprivation
3.3. AAC Protein Expression in Non-Cancer and Cancer Kidney Cells
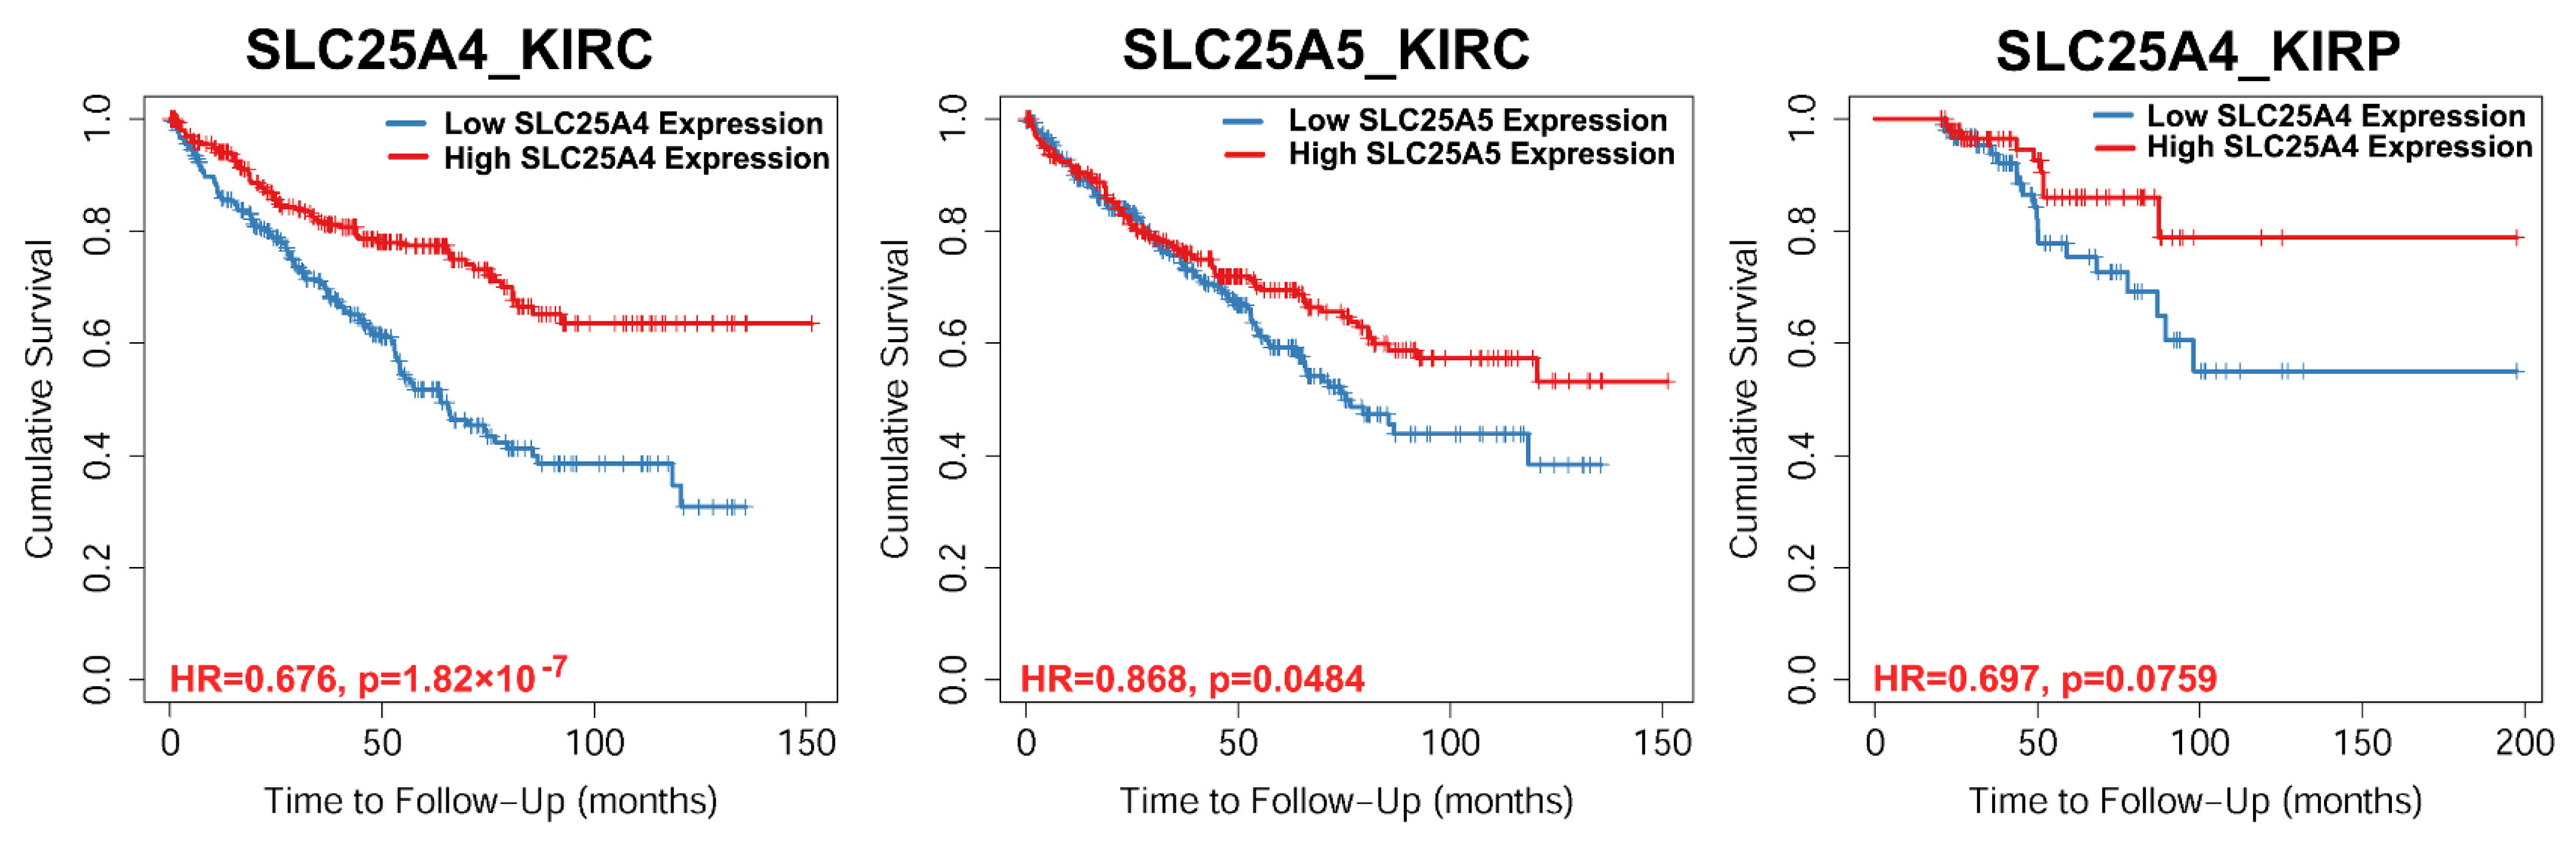
3.4. Survival Rate
3.5. In Vitro Caspase-9 Activation in the Investigated Cell Lines
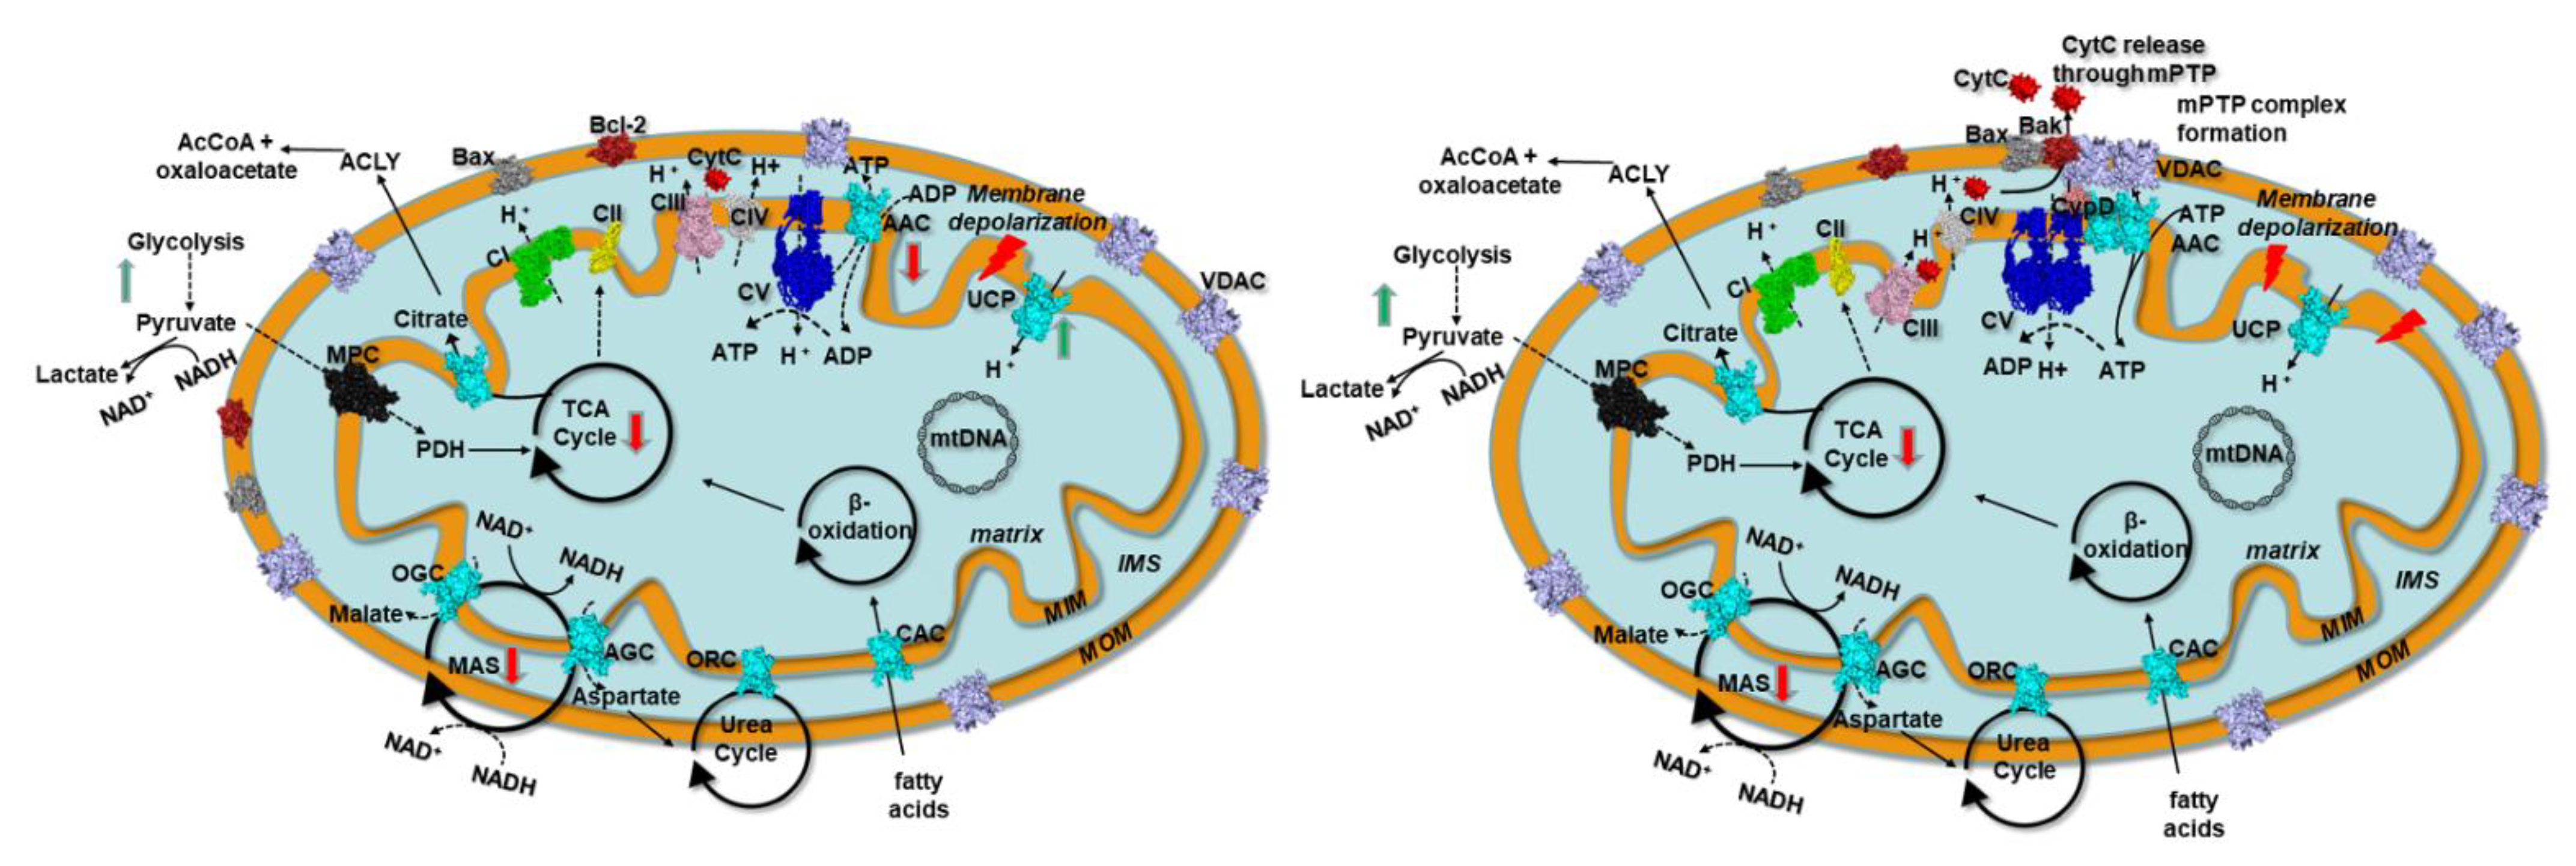
4. Discussion
Supplementary Materials
Author Contributions
Funding
Institutional Review Board Statement
Informed Consent Statement
Data Availability Statement
Acknowledgments
Conflicts of Interest
References
- Wong, R.S.Y. Apoptosis in cancer: From pathogenesis to treatment. J. Exp. Clin. Cancer Res. 2011, 30, 87. [Google Scholar] [CrossRef] [Green Version]
- Fulda, S.; Debatin, K.M. Extrinsic versus intrinsic apoptosis pathways in anticancer chemotherapy. Oncogene 2006, 25, 4798–4811. [Google Scholar] [CrossRef] [Green Version]
- Klingenberg, M. The ADP and ATP transport in mitochondria and its carrier. Biochim. Biophys. Acta 2008, 1778, 1978–2021. [Google Scholar] [CrossRef] [Green Version]
- Todisco, S.; Di Noia, M.A.; Onofrio, A.; Parisi, G.; Punzi, G.; Redavid, G.; De Grassi, A.; Pierri, C.L. Identification of new highly selective inhibitors of the human ADP/ATP carriers by molecular docking and in vitro transport assays. Biochem. Pharmacol. 2016, 100, 112–132. [Google Scholar] [CrossRef]
- Halestrap, A.P.; McStay, G.P.; Clarke, S.J. The permeability transition pore complex: Another view. Biochimie 2002, 84, 153–166. [Google Scholar] [CrossRef]
- Zamzami, N.; Kroemer, G. The mitochondrion in apoptosis: How Pandora’s box opens. Nat. Rev. Mol. Cell. Biol. 2001, 2, 67–71. [Google Scholar] [CrossRef]
- Fulda, S.; Galluzzi, L.; Kroemer, G. Targeting mitochondria for cancer therapy. Nat. Rev. Drug Discov. 2010, 9, 447–464. [Google Scholar] [CrossRef]
- Stepien, G.; Torroni, A.; Chung, A.B.; Hodge, J.A.; Wallace, D.C. Differential expression of adenine nucleotide translocator isoforms in mammalian tissues and during muscle cell differentiation. J. Biol. Chem. 1992, 267, 14592–14597. [Google Scholar]
- Palmieri, F.; Pierri, C.L. Mitochondrial metabolite transport. Essays Biochem. 2010, 47, 37–52. [Google Scholar] [CrossRef]
- Palmieri, F. The mitochondrial transporter family SLC25: Identification, properties and physiopathology. Mol. Asp. Med. 2013, 34, 465–484. [Google Scholar] [CrossRef]
- Krämer, R.; Klingenberg, M. Reconstitution of adenine nucleotide transport with purified ADP, ATP-carrier protein. FEBS Lett. 1977, 82, 363–367. [Google Scholar] [CrossRef] [Green Version]
- Pebay-Peyroula, E.; Dahout-Gonzalez, C.; Kahn, R.; Trézéguet, V.; Lauquin, G.J.-M.; Brandolin, G. Structure of mitochondrial ADP/ATP carrier in complex with carboxyatractyloside. Nature 2003, 426, 39–44. [Google Scholar] [CrossRef] [PubMed]
- Klingenberg, M. Transport viewed as a catalytic process. Biochimie 2007, 89, 1042–1048. [Google Scholar] [CrossRef] [PubMed]
- Klingenberg, M. Transport catalysis. Biochim. Biophys. Acta 2006, 1757, 1229–1236. [Google Scholar] [CrossRef] [Green Version]
- Ruprecht, J.J.; King, M.S.; Zögg, T.; Aleksandrova, A.A.; Pardon, E.; Crichton, P.G.; Steyaert, J.; Kunji, E.R.S. The molecular mechanism of transport by the mitochondrial ADP/ATP carrier. Cell 2019, 176, 435–447.e15. [Google Scholar] [CrossRef] [Green Version]
- Pierri, C.L.; Palmieri, F.; De Grassi, A. Single-nucleotide evolution quantifies the importance of each site along the structure of mitochondrial carriers. Cell Mol. Life Sci. 2014, 71, 349–364. [Google Scholar] [CrossRef]
- Vignais, P.V.; Duee, E.D.; Vignais, P.M.; Huet, J. Effects of atractyligenin and its structural analogues on oxidative phosphorylation and on the translocation of adenine nucleotides in mitochondria. Biochim. Biophys. Acta 1966, 118, 465–483. [Google Scholar] [CrossRef]
- Turgut, M.; Alhan, C.C.; Gürgöze, M.; Kurt, A.; Doğan, Y.; Tekatli, M.; Akpolat, N.; Aygün, A.D. Carboxyatractyloside poisoning in humans. Ann. Trop. Paediatr. 2005, 25, 125–134. [Google Scholar] [CrossRef]
- Stewart, M.J.; Steenkamp, V. The biochemistry and toxicity of atractyloside: A review. Ther. Drug Monit. 2000, 22, 641–649. [Google Scholar] [CrossRef]
- Street, P.; Daniele, C.; Dahamna, S.; Firuzi, O.; Sekfali, N.; Saso, L.; Mazzanti, G. Review section biochemistry and toxicology of the diterpenoid glycoside Atractyloside atractylis gummifera L. poisoning: An ethnopharmacological review. J. Ethnopharmacol. 1998, 36, 2–7. [Google Scholar]
- Choi, Y.; Lee, H.W.; Lee, J.; Jeon, Y.H. The combination of ANT2 shRNA and hNIS radioiodine gene therapy increases CTL cytotoxic activity through the phenotypic modulation of cancer cells: Combination treatment with ANT2 shRNA and I-131. BMC Cancer 2013, 13, 143. [Google Scholar] [CrossRef] [PubMed] [Green Version]
- Jang, J.Y.; Jeon, Y.K.; Lee, C.E.; Kim, C.W. ANT2 suppression by shRNA may be able to exert anticancer effects in HCC further by restoring SOCS1 expression. Int. J. Oncol. 2013, 42, 574–582. [Google Scholar] [CrossRef] [PubMed] [Green Version]
- Park, D.; Chiu, J.; Perrone, G.G.; Dilda, P.J.; Hogg, P.J. The tumour metabolism inhibitors GSAO and PENAO react with cysteines 57 and 257 of mitochondrial adenine nucleotide translocase. Cancer Cell Int. 2012, 12, 11. [Google Scholar] [CrossRef] [Green Version]
- Le Bras, M.; Borgne-Sanchez, A.; Touat, Z.; El Dein, O.S.; Deniaud, A.; Maillier, E.; Lecellier, G.; Rebouillat, D.; Lemaire, C.; Kroemer, G.; et al. Chemosensitization by knockdown of adenine nucleotide translocase-2. Cancer Res. 2006, 66, 9143–9152. [Google Scholar] [CrossRef] [Green Version]
- Chevrollier, A.; Loiseau, D.; Gautier, F.; Malthièry, Y.; Stepien, G. ANT2 expression under hypoxic conditions produces opposite cell-cycle behavior in 143B and HepG2 cancer cells. Mol. Carcinog. 2005, 42, 1–8. [Google Scholar] [CrossRef]
- Muscella, A.; Vetrugno, C.; Biagioni, F.; Calabriso, N.; Calierno, M.T.; Fornai, F.; De Pascali, S.A.; Marsigliante, S.; Fanizzi, F.P. Antitumour and antiangiogenic activities of [Pt(O,O′-acac)(γ-acac)(DMS)] in a xenograft model of human renal cell carcinoma. Br. J. Pharmacol. 2016, 173, 2633–2644. [Google Scholar] [CrossRef] [Green Version]
- Caratozzolo, M.F.; Valletti, A.; Gigante, M.; Aiello, I.; Mastropasqua, F.; Marzano, F.; Ditonno, P.; Carrieri, G.; Simonnet, H.; D’Erchia, A.M.; et al. TRIM8 anti-proliferative action against chemo-resistant renal cell carcinoma. Oncotarget 2014, 5, 7446–7457. [Google Scholar] [CrossRef]
- Zhuge, J.; Cederbaum, A.I. Serum deprivation-induced HepG2 cell death is potentiated by CYP2E1. Free Radic. Biol. Med. 2006, 40, 63–74. [Google Scholar] [CrossRef]
- Li, T.; Fu, J.; Zeng, Z.; Cohen, D.; Li, J.; Chen, Q.; Li, B.; Liu, X.S. TIMER2.0 for analysis of tumor-infiltrating immune cells. Nucleic Acids Res. 2020, 48, W509–W514. [Google Scholar] [CrossRef]
- Lee, H.J.; Palm, J.; Grimes, S.M.; Ji, H.P. The Cancer Genome Atlas Clinical Explorer: A web and mobile interface for identifying clinical-genomic driver associations. Genome Med. 2015, 7, 112. [Google Scholar] [CrossRef] [Green Version]
- Ali, H.; Du, Z.; Li, X.; Yang, Q.; Zhang, Y.C.; Wu, M.; Li, Y.; Zhang, G. Identification of suitable reference genes for gene expression studies using quantitative polymerase chain reaction in lung cancer in vitro. Mol. Med. Rep. 2015, 11, 3767–3773. [Google Scholar] [CrossRef] [PubMed] [Green Version]
- Volpicella, M.; Fanizza, I.; Leoni, C.; Gadaleta, A.; Nigro, D.; Gattulli, B.; Mangini, G.; Blanco, A.; Ceci, L.R. Identification and characterization of the sucrose synthase 2 gene (Sus2) in durum wheat. Front. Plant Sci. 2016, 7, 266. [Google Scholar] [CrossRef] [Green Version]
- Guerra, L.; Favia, M.; Castellani, S.; Barbuti, G.; Montemurro, P.; Diana, A.; Santostasi, T.; Polizzi, A.M.; Mariggiò, M.A.; Reshkin, S.J.; et al. Antibiotic therapy affects functional behaviour in cystic fibrosis blood mononuclear cells. Eur. Respir. J. 2015, 46, 558–561. [Google Scholar] [CrossRef] [Green Version]
- Xu, W.; Jing, L.; Wang, Q.; Lin, C.C.; Chen, X.; Diao, J.; Liu, Y.; Sun, X. Bax-PGAM5L-Drp1 complex is required for intrinsic apoptosis execution. Oncotarget 2015, 6, 30017–30034. [Google Scholar] [CrossRef] [Green Version]
- Morris, A.J.; Taylor, M.F.; Morris, I.D. Leydig cell apoptosis in response to ethane dimethanesulphonate after both in vivo and in vitro treatment. J. Androl. 1997, 18, 274–280. [Google Scholar] [CrossRef]
- Brauchle, E.; Thude, S.; Brucker, S.Y.; Schenke-Layland, K. Cell death stages in single apoptotic and necrotic cells monitored by Raman microspectroscopy. Sci. Rep. 2014, 4, 4698. [Google Scholar] [CrossRef] [Green Version]
- Druškovič, M.; Šuput, D.; Milisav, I. Overexpression of caspase-9 triggers its activation and apoptosis in vitro. Croat. Med. J. 2006, 47, 832. [Google Scholar]
- Saikumar, P.; Mikhailova, M.; Pandeswara, S. Regulation of caspase-9 activity by differential binding to the apoptosome complex. Front. Biosci. 2007, 12, 3343–3354. [Google Scholar] [CrossRef] [PubMed] [Green Version]
- Giorgio, V.; Von Stockum, S.; Antoniel, M.; Fabbro, A.; Fogolari, F.; Forte, M.; Glick, G.D.; Petronilli, V.; Zoratti, M.; Szabó, I.; et al. Dimers of mitochondrial ATP synthase form the permeability transition pore. Proc. Natl. Acad. Sci. USA 2013, 110, 5887–5892. [Google Scholar] [CrossRef] [PubMed] [Green Version]
- Carroll, J.; He, J.; Ding, S.; Fearnley, I.M.; Walker, J.E. Persistence of the permeability transition pore in human mitochondria devoid of an assembled ATP synthase. Proc. Natl. Acad. Sci. USA 2019, 116, 12816–12821. [Google Scholar] [CrossRef] [PubMed] [Green Version]
- Karch, J.; Molkentin, J.D. Identifying the components of the elusive mitochondrial permeability transition pore. Proc. Natl. Acad. Sci. USA 2014, 111, 10396–10397. [Google Scholar] [CrossRef] [PubMed] [Green Version]
- Shoshan-Barmatz, V.; Shteinfer-Kuzmine, A.; Verma, A. VDAC1 at the intersection of cell metabolism, apoptosis, and diseases. Biomolecules 2020, 10, 1485. [Google Scholar] [CrossRef]
- Alavian, K.N.; Beutner, G.; Lazrove, E.; Sacchetti, S.; Park, H.A.; Licznerski, P.; Li, H.; Nabili, P.; Hockensmith, K.; Graham, M.; et al. An uncoupling channel within the c-subunit ring of the F1FO ATP synthase is the mitochondrial permeability transition pore. Proc. Natl. Acad. Sci. USA 2014, 111, 10580–10585. [Google Scholar] [CrossRef] [PubMed] [Green Version]
- Briston, T.; Roberts, M.; Lewis, S.; Powney, B.; Staddon, J.M.; Szabadkai, G.; Duchen, M.R. Mitochondrial permeability transition pore: Sensitivity to opening and mechanistic dependence on substrate availability. Sci. Rep. 2017, 7, 10492. [Google Scholar] [CrossRef] [PubMed]
- Park, D.H.; Jung, B.K.; Lee, Y.S.; Jang, J.Y.; Kim, M.K.; Lee, J.K.; Park, H.; Seo, J.; Kim, C.W. Evaluation of in vivo antitumor effects of ANT2 shRNA delivered using PEI and ultrasound with microbubbles. Gene Ther. 2015, 22, 325–332. [Google Scholar] [CrossRef] [PubMed]
- Gavaldà-Navarro, A.; Domingo, P.; Viñas, O.; Mampel, T. Expression of human and mouse adenine nucleotide translocase (ANT) isoform genes in adipogenesis. Int. J. Biochem. Cell Biol. 2015, 64, 34–44. [Google Scholar] [CrossRef]
- Chevrollier, A.; Loiseau, D.; Reynier, P.; Stepien, G. Adenine nucleotide translocase 2 is a key mitochondrial protein in cancer metabolism. Biochim. Biophys. Acta 2011, 1807, 562–567. [Google Scholar] [CrossRef] [Green Version]
- White, E.S.Z.; Pennant, N.M.; Carter, J.R.; Hawsawi, O.; Odero-Marah, V.; Hinton, C.V. Serum deprivation initiates adaptation and survival to oxidative stress in prostate cancer cells. Sci. Rep. 2020, 10, 12505. [Google Scholar] [CrossRef]
- Buono, R.; Longo, V.D. Starvation, Stress Resistance, and Cancer. Trends Endocrinol. Metab. 2018, 29, 271–280. [Google Scholar] [CrossRef]
- Novoa-Herran, S.; Umaña-Perez, A.; Canals, F.; Sanchez-Gomez, M. Serum depletion induces changes in protein expression in the trophoblast-derived cell line HTR-8/SVneo. Cell. Mol. Biol. Lett. 2016, 21, 1–19. [Google Scholar] [CrossRef] [Green Version]
- Boya, P.; Reggiori, F.; Codogno, P. Emerging regulation and functions of autophagy. Nat. Cell Biol. 2013, 15, 713–720. [Google Scholar] [CrossRef] [PubMed]
- Golpour, M.; Akhavan Niaki, H.; Khorasani, H.R.; Hajian, A.; Mehrasa, R.; Mostafazadeh, A. Human fibroblast switches to anaerobic metabolic pathway in response to serum starvation: A mimic of warburg effect. Int. J. Mol. Cell. Med. 2014, 3, 74–80. [Google Scholar] [PubMed]
- Zheng, N.; Wang, K.; He, J.; Qiu, Y.; Xie, G.; Su, M.; Jia, W.; Li, H. Effects of ADMA on gene expression and metabolism in serum-starved LoVo cells. Sci. Rep. 2016, 6, 25892. [Google Scholar] [CrossRef] [Green Version]
- Zhao, L.; Tang, M.; Bode, A.M.; Liao, W.; Cao, Y. ANTs and cancer: Emerging pathogenesis, mechanisms, and perspectives. BBA Reviews Cancer 2020, 1875, 188485. [Google Scholar] [CrossRef]
- Song, S.; Hwang, E. A Rise in ATP, ROS, and mitochondrial content upon glucose withdrawal correlates with a dysregulated mitochondria turnover mediated by the activation of the protein deacetylase SIRT1. Cells 2018, 8, 11. [Google Scholar] [CrossRef] [Green Version]
- Wang, J.; Wu, Q.; Qiu, J. Accumulation of fructose 1,6-bisphosphate protects clear cell renal cell carcinoma from oxidative stress. Lab. Investig. 2019, 99, 898–908. [Google Scholar] [CrossRef] [PubMed]
- Shi, L.; An, S.; Liu, Y.; Liu, J.; Wang, F. PCK1 regulates glycolysis and tumor progression in clear cell renal cell carcinoma through LDHA. Onco. Targets. Ther. 2020, 13, 2613–2627. [Google Scholar] [CrossRef] [Green Version]
- Lin, C.S.; Lee, H.T.; Lee, M.H.; Pan, S.C.; Ke, C.Y.; Chiu, A.W.H.; Wei, Y.H. Role of mitochondrial DNA copy number alteration in human renal cell carcinoma. Int. J. Mol. Sci. 2016, 17, 814. [Google Scholar] [CrossRef]
- Nilsson, H.; Lindgren, D.; Mandahl Forsberg, A.; Mulder, H.; Axelson, H.; Johansson, M.E. Primary clear cell renal carcinoma cells display minimal mitochondrial respiratory capacity resulting in pronounced sensitivity to glycolytic inhibition by 3-Bromopyruvate. Cell Death Dis. 2015, 6, e1585. [Google Scholar] [CrossRef]
- Meierhofer, D.; Mayr, J.A.; Foetschl, U.; Berger, A.; Fink, K.; Schmeller, N.; Hacker, G.W.; Hauser-Kronberger, C.; Kofler, B.; Sperl, W. Decrease of mitochondrial DNA content and energy metabolism in renal cell carcinoma. Carcinogenesis 2004, 25, 1005–1010. [Google Scholar] [CrossRef] [Green Version]
- Warburg, O.; Wind, F.; Negelein, E. The metabolism of tumors in the body. J. Gen. Physiol. 1927, 8, 519–530. [Google Scholar] [CrossRef] [PubMed] [Green Version]
- Amoedo, N.D.; Punzi, G.; Obre, E.; Lacombe, D.; De Grassi, A.; Pierri, C.L.; Rossignol, R. AGC1/2, the mitochondrial aspartate-glutamate carriers. Biochim. Biophys Acta 2016, 1863, 2394–2412. [Google Scholar] [CrossRef] [PubMed]
- Amoedo, N.D.; Dard, L.; Sarlak, S.; Mahfouf, W.; Blanchard, W.; Rousseau, B.; Izotte, J.; Claverol, S.; Lacombe, D.; Rezvani, H.R.; et al. Targeting human lung adenocarcinoma with a suppressor of mitochondrial superoxide production. Antioxid. Redox Signal. 2020. [Google Scholar] [CrossRef]
- Fu, Y.; Liu, S.; Yin, S.; Niu, W.; Xiong, W.; Tan, M.; Li, G.; Zhou, M. The reverse Warburg effect is likely to be an Achilles’ heel of cancer that can be exploited for cancer therapy. Oncotarget 2017, 8, 57813. [Google Scholar] [CrossRef] [Green Version]
- Liberti, M.V.; Locasale, J.W. The Warburg Effect: How Does it Benefit Cancer Cells? Trends Biochem. Sci. 2016, 41, 211–218. [Google Scholar] [CrossRef] [Green Version]
- Zheng, J. Energy metabolism of cancer: Glycolysis versus oxidative phosphorylation (review). Oncol. Lett. 2012, 4, 1151–1157. [Google Scholar] [CrossRef] [Green Version]
- Ibsen, K.H. The Crabtree Effect” A Review. Cancer Res. 1961, 21, 829–841. [Google Scholar]
- DeBerardinis, R.J.; Chandel, N.S. We need to talk about the Warburg effect. Nat. Metab. 2020. [Google Scholar] [CrossRef]
- Infantino, V.; Pierri, C.L.; Iacobazzi, V. Metabolic routes in inflammation: The citrate pathway and its potential as therapeutic target. Curr. Med. Chem. 2019, 26. [Google Scholar] [CrossRef]
- Nohara, K.; Tateishi, Y.; Suzuki, T.; Okamura, K.; Murai, H.; Takumi, S.; Maekawa, F.; Nishimura, N.; Kobori, M.; Ito, T. Late-onset increases in oxidative stress and other tumorigenic activities and tumors with a Ha-ras mutation in the liver of adult male C3H mice gestationally exposed to arsenic. Toxicol. Sci. 2012, 129, 293–304. [Google Scholar] [CrossRef] [Green Version]
- Prensner, J.R.; Chinnaiyan, A.M. Metabolism unhinged: IDH mutations in cancer. Nat. Med. 2011, 17, 291–293. [Google Scholar] [CrossRef] [PubMed]
- Catalina-Rodriguez, O.; Kolukula, V.K.; Tomita, Y.; Preet, A.; Palmieri, F.; Wellstein, A.; Byers, S.; Giaccia, A.J.; Glasgow, E.; Albanese, C.; et al. The mitochondrial citrate transporter, CIC, is essential for mitochondrial homeostasis. Oncotarget 2012, 3, 1220–1235. [Google Scholar] [CrossRef] [PubMed] [Green Version]
- Chinopoulos, C.; Seyfried, T.N. Mitochondrial substrate-level phosphorylation as energy source for glioblastoma: Review and hypothesis. ASN Neuro 2018. [Google Scholar] [CrossRef] [PubMed]
- Palmieri, E.M.M.; Spera, I.; Menga, A.; Infantino, V.; Porcelli, V.; Iacobazzi, V.; Pierri, C.L.L.; Hooper, D.C.C.; Palmieri, F.; Castegna, A. Acetylation of human mitochondrial citrate carrier modulates mitochondrial citrate/malate exchange activity to sustain NADPH production during macrophage activation. Biochim. Biophys. Acta 2015, 1847, 729–738. [Google Scholar] [CrossRef] [Green Version]
- Davis, C.F.; Ricketts, C.J.; Wang, M.; Yang, L.; Cherniack, A.D.; Shen, H.; Buhay, C.; Kang, H.; Kim, S.C.; Fahey, C.C.; et al. The somatic genomic landscape of chromophobe renal cell carcinoma. Cancer Cell 2014, 26, 319–330. [Google Scholar] [CrossRef] [Green Version]
- Gasparre, G.; Rossignol, R.; Sonveaux, P. Mitochondria in cancer. Biochim. Biophys. Acta Bioenerg. 2017. [Google Scholar] [CrossRef]
- Shiratori, R.; Furuichi, K.; Yamaguchi, M.; Miyazaki, N.; Aoki, H.; Chibana, H.; Ito, K.; Aoki, S. Glycolytic suppression dramatically changes the intracellular metabolic profile of multiple cancer cell lines in a mitochondrial metabolism-dependent manner. Sci. Rep. 2019, 9, 18699. [Google Scholar] [CrossRef] [Green Version]
- Carracedo, A.; Cantley, L.C.; Pandolfi, P.P. Cancer metabolism: Fatty acid oxidation in the limelight. Nat. Rev. Cancer 2013, 13, 227–232. [Google Scholar] [CrossRef]
- Liu, Q.; Luo, Q.; Halim, A.; Song, G. Targeting lipid metabolism of cancer cells: A promising therapeutic strategy for cancer. Cancer Lett. 2017, 401, 39–45. [Google Scholar] [CrossRef]
- Porporato, P.E.; Filigheddu, N.; Pedro, J.M.B.S.; Kroemer, G.; Galluzzi, L. Mitochondrial metabolism and cancer. Cell Res. 2018, 28, 265–280. [Google Scholar] [CrossRef]
- Schuetz, A.N.; Yin-Goen, Q.; Amin, M.B.; Moreno, C.S.; Cohen, C.; Hornsby, C.D.; Yang, W.L.; Petros, J.A.; Issa, M.M.; Pattaras, J.G.; et al. Molecular classification of renal tumors by gene expession profiling. J. Mol. Diagn. 2005, 7, 206–218. [Google Scholar] [CrossRef] [Green Version]
- Yamada, Y.; Nakamura, K.; Furukawa, R.; Kawamura, E.; Moriwaki, T.; Matsumoto, K.; Okuda, K.; Shindo, M.; Harashima, H. Mitochondrial delivery of bongkrekic acid using a MITO-Porter prevents the induction of apoptosis in human HeLa cells. J. Pharm. Sci. 2013, 102, 1008–1015. [Google Scholar] [CrossRef] [PubMed]
- Gottesman, M.M.; Fojo, T.; Bates, S.E. Multidrug resistance in cancer: Role of ATP-dependent transporters. Nat. Rev. Cancer 2002, 2, 48–58. [Google Scholar] [CrossRef] [PubMed] [Green Version]
- Maldonado, E.N.; DeHart, D.N.; Patnaik, J.; Klatt, S.C.; Gooz, M.B.; Lemasters, J.J. ATP/ADP turnover and import of glycolytic ATP into mitochondria in cancer cells is independent of the adenine nucleotide translocator. J. Biol. Chem. 2016, 291, 19642–19650. [Google Scholar] [CrossRef] [Green Version]
- Ruas, J.S.; Siqueira-Santos, E.S.; Amigo, I.; Rodrigues-Silva, E.; Kowaltowski, A.J.; Castilho, R.F. Underestimation of the maximal capacity of the mitochondrial electron transport system in oligomycin-treated cells. PLoS ONE 2016, 11, e0150967. [Google Scholar] [CrossRef] [Green Version]
- Sinha, S.; Dwivedi, N.; Tao, S.; Jamadar, A.; Kakade, V.R.; Neil, M.O.; Weiss, R.H.; Enders, J.; Calvet, J.P.; Thomas, S.M.; et al. Targeting the vasopressin type-2 receptor for renal cell carcinoma therapy. Oncogene 2020, 39, 1231–1245. [Google Scholar] [CrossRef]
- Bradley, J.R.; Wang, J.; Pacey, S.; Warren, A.Y.; Pober, J.S.; Al-Lamki, R.S. Tumor necrosis factor receptor-2 signaling pathways promote survival of cancer stem-like CD133 + cells in clear cell renal carcinoma. FASEB BioAdv. 2020, 2, 126–144. [Google Scholar] [CrossRef] [Green Version]
- Al-Lamki, R.S.; Wang, J.; Yang, J.; Burrows, N.; Maxwell, P.H.; Eisen, T.; Warren, A.Y.; Vanharanta, S.; Pacey, S.; Vandenabeele, P.; et al. Tumor necrosis factor receptor 2-signaling in CD133-expressing cells in renal clear cell carcinoma. Oncotarget 2016, 7, 24111–24124. [Google Scholar] [CrossRef] [Green Version]
- Chari, R.V.J. Targeted cancer therapy: Conferring specificity to cytotoxic drugs. Acc. Chem. Res. 2008, 41, 98–107. [Google Scholar] [CrossRef]


Publisher’s Note: MDPI stays neutral with regard to jurisdictional claims in published maps and institutional affiliations. |
© 2020 by the authors. Licensee MDPI, Basel, Switzerland. This article is an open access article distributed under the terms and conditions of the Creative Commons Attribution (CC BY) license (http://creativecommons.org/licenses/by/4.0/).
Share and Cite
Trisolini, L.; Laera, L.; Favia, M.; Muscella, A.; Castegna, A.; Pesce, V.; Guerra, L.; De Grassi, A.; Volpicella, M.; Pierri, C.L. Differential Expression of ADP/ATP Carriers as a Biomarker of Metabolic Remodeling and Survival in Kidney Cancers. Biomolecules 2021, 11, 38. https://doi.org/10.3390/biom11010038
Trisolini L, Laera L, Favia M, Muscella A, Castegna A, Pesce V, Guerra L, De Grassi A, Volpicella M, Pierri CL. Differential Expression of ADP/ATP Carriers as a Biomarker of Metabolic Remodeling and Survival in Kidney Cancers. Biomolecules. 2021; 11(1):38. https://doi.org/10.3390/biom11010038
Chicago/Turabian StyleTrisolini, Lucia, Luna Laera, Maria Favia, Antonella Muscella, Alessandra Castegna, Vito Pesce, Lorenzo Guerra, Anna De Grassi, Mariateresa Volpicella, and Ciro Leonardo Pierri. 2021. "Differential Expression of ADP/ATP Carriers as a Biomarker of Metabolic Remodeling and Survival in Kidney Cancers" Biomolecules 11, no. 1: 38. https://doi.org/10.3390/biom11010038