Article

Validation of miR-1228-3p as Housekeeping for MicroRNA Analysis in Liquid Biopsies from Colorectal Cancer Patients

by
Saray Duran-Sanchon
1,
Elena Vila-Navarro
1,
Maria Marcuello
1,
Juan José Lozano
2,
Jenifer Muñoz
1,
Joaquín Cubiella
3,
Maria Soledad Diez
4,
Luis Bujanda
5,
Angel Lanas
6,
Rodrigo Jover
7,
Vicent Hernández
8,
Enrique Quintero
9,
Marta Herreros-Villanueva
10,
Ana Carmen Martín
10,
Rosa Pérez-Palacios
10,
Rocio Arroyo
10,
Antoni Castells
1 and
Meritxell Gironella
1,*
1
Gastrointestinal & Pancreatic Oncology Group, Centro de Investigación Biomédica en Red de Enfermedades Hepáticas y Digestivas (CIBEREHD) /Hospital Clínic of Barcelona/Institut d’Investigacions Biomèdiques August Pi i Sunyer (IDIBAPS), University of Barcelona, 08036 Barcelona, Catalonia, Spain
2
Bioinformatics Platform, CIBEREHD, 08036 Barcelona, Catalonia, Spain
3
Department of Gastroenterology, Complexo Hospitalario Universitario de Ourense, Instituto de Investigación Sanitaria Galicia Sur, CIBEREHD, 32005 Ourense, Spain
4
Department of Gastroenterology, Hospital Universitario de Burgos, 09006 Burgos, Spain
5
Department of Gastroenterology, Hospital Donostia/Instituto Biodonostia, Centro de Investigación Biomédica en Red de Enfermedades Hepáticas y Digestivas (CIBEREHD). Universidad del País Vasco UPV/EHU, 20014 San Sebastián, Spain
6
Department of Gastroenterology, Hospital Clínico Universitario, IIS Aragón, University of Zaragoza, CIBEREHD, 50009 Zaragoza, Spain
7
Gastroenterology Unit, Hospital General Universitario de Alicante, 03010 Alicante, Spain
8
Department of Gastroenterology, Complexo Hospitalario Universitario de Vigo, 36214 Vigo, Spain
9
Department of Gastroenterology, Hospital Universitario de Canarias, Universidad de La Laguna, Instituto Universitario de Tecnologías Biomédicas (ITB) & Centro de Investigación Biomédica de Canarias (CIBICAN), 38320 San Cristobal de La Laguna, Tenerife, Spain
10
Advanced Marker Discovery (AMADIX), Acera de Recoletos 2, 47004 Valladolid, Spain
*
Author to whom correspondence should be addressed.
Biomolecules 2020, 10(1), 16; https://doi.org/10.3390/biom10010016
Submission received: 12 November 2019 / Revised: 16 December 2019 / Accepted: 18 December 2019 / Published: 20 December 2019
(This article belongs to the Special Issue microRNA Biomarkers in Clinical Study)

Abstract

:
Background: Circulating microRNA (miRNA) analysis is a growing research field. However, it usually requires an endogenous control or housekeeping (HK) in order to normalize expression of specific miRNAs throughout different samples. Unfortunately, no adequate HK for circulating miRNA analysis is still known in the colorectal cancer (CRC) context whereas several have been suggested. Hence, our aims were to validate the previously suggested miR-1228-3p as HK for CRC studies, to compare its suitability with the widely used miR-16-5p, and to evaluate the influence of hemolysis on both miRNAs. Methods: We analyzed by quantitative reverse-transcription polymerase chain reaction (qRT-PCR) the expression of miR-1228-3p, miR-16-5p and the spike-in cel-miR-39 in a set of 297 plasmas (92 CRC, 101 advanced adenomas -AA-, and 100 controls) and 213 serum samples (59 CRC, 74 AA and 80 controls). We also analyzed both miRNAs depending on the hemolysis degree in 7 plasmas and 31 serums. Results: Levels of miR-1228-3p and miR-16-5p did not show significant differences between groups although miR-16-5p exhibited more variability in plasma and serum samples. Importantly, the combination of cel-miR-39 and miR-1228-3p was the most stable one. Moreover, we observed that miR-16-5p was significantly influenced by hemolysis in contrast with miR-1228-3p that exhibited no correlation with this confounding factor in both biofluids. Conclusion: MiR-1228-3p has been validated as an adequate endogenous control for circulating miRNA analysis in CRC and AA liquid biopsies.

1. Introduction

MicroRNAs (miRNAs) are small endogenous non-coding RNAs that regulate thousands of mRNAs at posttranscriptional level [1]. Over the last few years, miRNA expression studies have increased due to its relevant function in different biological and pathological processes [2,3]. In fact, they play relevant roles in cancer as tumor suppressors or oncogenes [4]. Moreover, they are found circulating in different body fluids such as plasma, serum or urine; making them potential non-invasive biomarkers, as well as the base for new treatment therapies [5,6,7].
Colorectal cancer (CRC) is one of the cancers with highest incidence worldwide that could benefit from non-invasive biomarkers, such as circulating miRNAs, for their early detection due to it follows a stepwise development starting with a benign precursor lesion called advanced adenoma (AA) in which early molecular changes are observed [8,9,10].
Indeed, quantification of miRNA levels can be performed by different techniques [11,12] being quantitative reverse-transcription polymerase chain reaction (qRT-PCR) one of the most commonly used due to its high sensitivity and specificity [13]. The data obtained with qRT-PCR requires a normalization process in order to reduce the potential technical bias, which can be caused by pre-analytical or technical factors arising from miRNA extraction to the amplification process. However, a universally accepted housekeeping (HK) suitable for all kind of samples and conditions does not exist, and there is still no standard normalization method for plasma/serum miRNA analysis in CRC. These facts result in lack of consistency in some findings from similar studies about the same disease [14,15].
In addition, an important interfering factor working with miRNAs in biofluids such as plasma or serum is the presence of hemolysis that can affect expression levels of some miRNAs [16,17] and, therefore, this has to be taken into account when choosing a HK miRNA for these analyses.
Furthermore, a reliable HK miRNA has to be abundant enough in the sample of interest and stable between groups. Thus, each kind of sample and disease should have its appropriate HK miRNA since miRNA expression patterns differ among different samples and diseases [18]. Recently, miR-1228-3p has been suggested as a potential HK for plasma samples in different cancers, including CRC [19,20].
Therefore, the aim of our study was to confirm whether miR-1228-3p could be an adequate endogenous control for circulating miRNA expression analysis in plasma and serum in large cohorts of CRC patients, as well as whether it could be also suitable when analyzing samples coming from patients with pre-neoplastic lesions (AA). We also compared these results with those obtained with miR-16-5p, one of the most commonly used HK in this context despite having various inherent limitations. Finally, we also evaluated the influence of the degree of hemolysis in the expression of both HK candidates.

2. Patients and Methods

2.1. Patients

Plasma set: plasmas from 297 individuals (96 CRC, 101 AA and 100 controls) from 8 different Spanish hospitals were analyzed. The clinico-pathological status of participants from the plasma set is shown in Table 1.
Serum set: serums from 213 individuals (59 CRC, 74 AA and 80 controls) provided by the Hospital Clinicof Barcelona were also analyzed. Table 2 shows clinicopathological status of participants from the serum set.
None of patients included in this study had received chemo- or radiotherapy before sample collection. The study was approved by the Institutional Ethics Committees of each hospital and written informed consent was obtained from all participants in accordance with the Declaration of Helsinki.

2.2. Samples

Peripheral blood from participants was drawn before colonoscopy either in 10 mL BD Vacutainer® K2EDTA tubes (Becton Dickinson, NJ, USA) or in 10 mL BD Vacutainer® Plus plastic serum tubes (Becton Dickinson). Plasma was obtained after double centrifugation. Serum was obtained by one centrifugation after incubation for 30 min at room temperature to form the clot. Plasma and serum samples were stored at −80 °C until RNA extraction.

2.3. Hemolysis Assessment

Hemolysis degree of plasma and serum samples was measured by spectrophotometer at optical density of 414 nm (OD414nm). We considered non-hemolytic samples those with OD414nm below or equal to 0.25, the rest of samples were discarded. For assessment of hemolysis influence on HK miRNA expression, 7 plasma and 31 serum samples were chosen (3 and 14, respectively, were regarded as hemolytic for showing an OD414nm > 0.25).

2.4. RNA Extraction

Total RNA, including small RNAs, was isolated from 500 µL of plasma or serum by using mirVana™ PARIS™ kit (Thermo Fisher Scientific, Inc., Waltham, Massachusetts, USA) according to the manufacturer’s protocol. Previous to RNA extraction, 5 µL of cel-miR-39 at 5 nM was added as spike-in exogenous control. Final elution volume was 30 µL. RNA was kept at −80 °C until miRNA expression analysis was done.

2.5. miRNA Expression Analysis

miRNA expression was assessed by qRT-PCR using TaqMan® MicroRNA assays (Thermo Fisher Scientific, Inc.). Briefly, RNA was retrotranscribed by using TaqMan® MicroRNA reverse transcription kit (Thermo Fisher Scientific, Inc.). After that, quantitative PCR was performed in a Viia7® Real Time PCR system (Thermo Fisher Scientific, Inc.) according to the manufacturer’s protocol.
Cel-miR-39 expression was used to normalize differences in extraction efficiency. Each point was assessed in triplicate.

2.6. Statistical Analysis

Samples with missing cycle threshold (Ct) value in at least one of the analyzed miRNAs were removed. Interquartile range (IQR) and standard deviation (SD) were calculated for each HK miRNA to evaluate the variability. Samples that had a Ct value of Ct ± (IQR × 1.5) were considered as outliers and were discarded for the expression analysis. Student’s t-test was performed to evaluate miRNA expression differences between groups (CRC vs Control; AA vs Control; CRC vs AA). Regarding influence of hemolysis, we compared miRNA expression between hemolytic and non-hemolytic samples. Existence of correlation between miRNA expression (miR-1228-3p or miR-16-5p) and hemolysis was assessed by Pearson correlation analysis. p-value ≤ 0.05 was regarded as significant. All statistical analysis and graphics were performed by IBM® SPSS Statistics® 23 software (New York, NY, USA).

3. Results

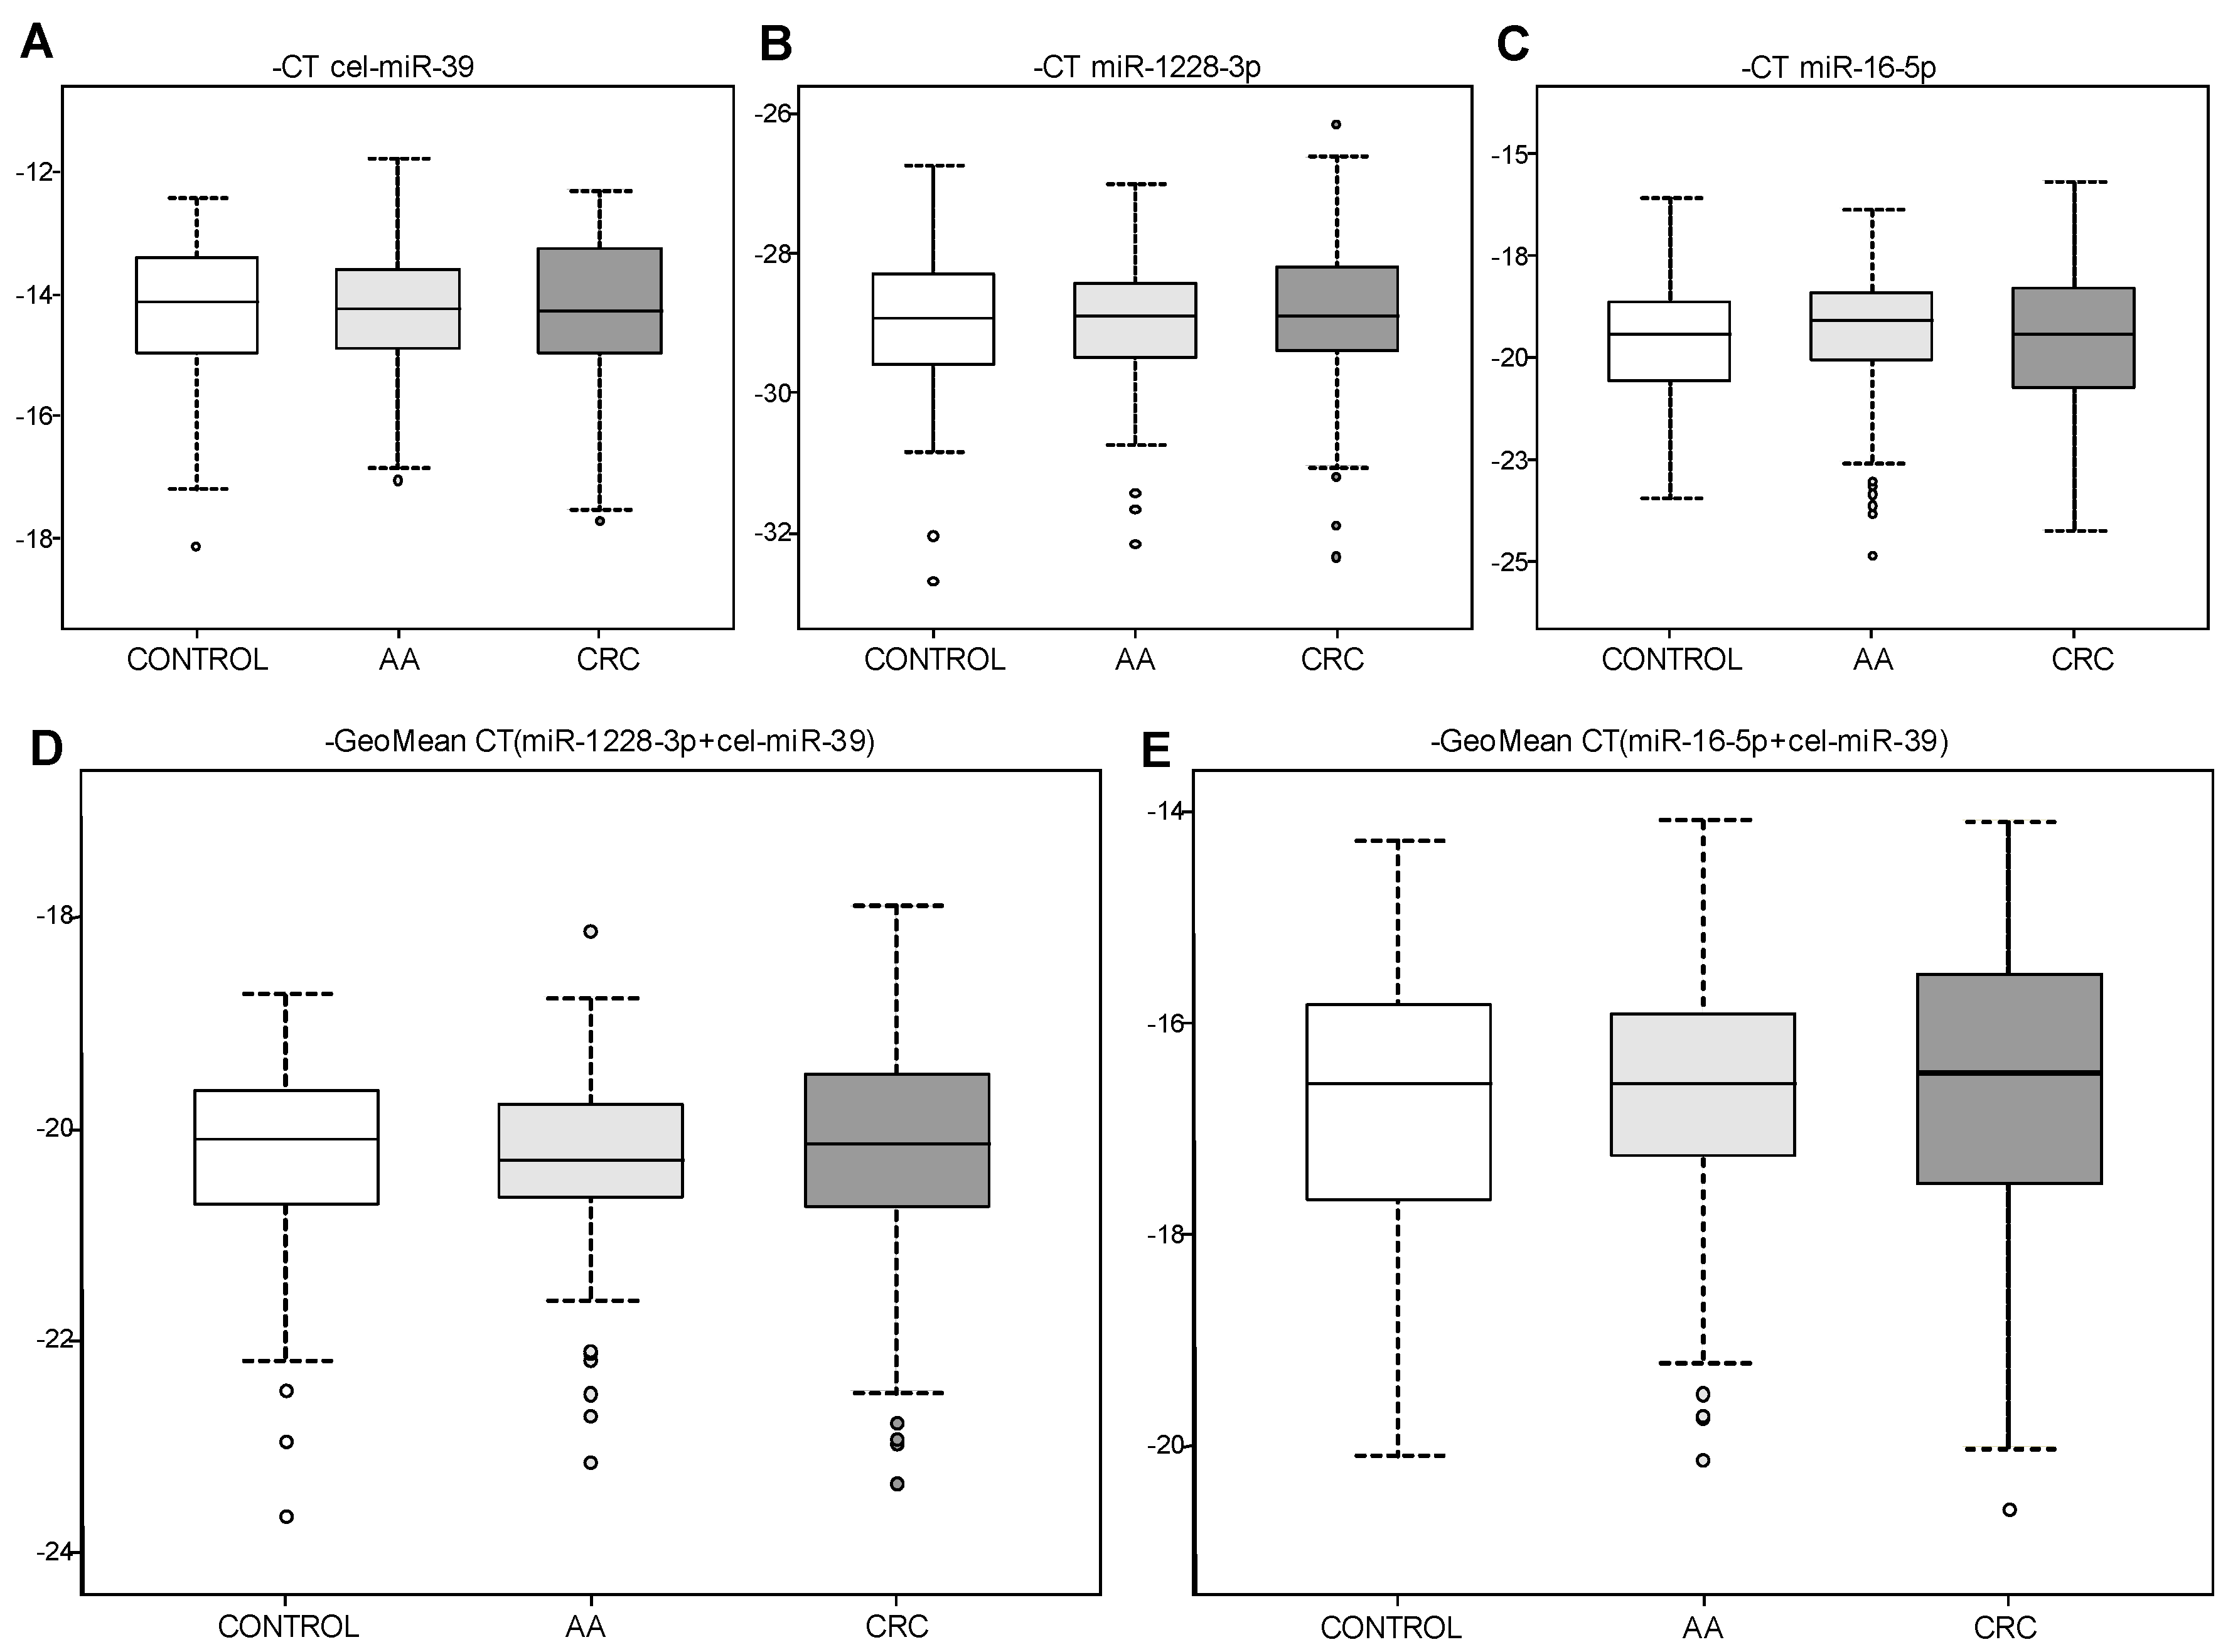
3.1. Expression Levels of Housekeeping (HK) miRNA Candidates in Plasma Samples

Ten plasma samples were excluded from the subsequent analysis because they showed no Ct value in at least one of the analyzed miRNAs. Thus, 287 plasma samples (90 CRC, 99 AA and 98 controls) were finally analyzed. Cel-miR-39 expression results exhibited a mean Ct of 14.24 and standard deviation (SD) of 1.11 (Figure 1A). Both HK miRNA candidates assessed, miR-1228-3p and miR-16-5p, showed reliable Ct levels. More specifically, miR-1228-3p had a mean Ct of 28.93 with SD = 1.01 (Figure 1B) and miR-16-5p showed a mean Ct of 19.49 with SD = 1.62 (Figure 1C). MiR-1228-3p appeared among a 6.54 Ct range [26.16–32.70] and miR-16-5p among a 9.18 Ct range [15.68–24.85]. Accordingly, miR-1228-3p exhibited an IQR of 1.16 whereas miR-16-5p exhibited an IQR of 2.02, suggesting that the first was less variable between samples. Finally, statistical analysis did not show significant differences between analyzed groups (CRC, AA and controls) in any miRNA although miR-16-5p presented more variability than miR-1228-3p.
A subsequent analysis was performed using cel-miR-39 in combination with each HK miRNA candidate to evaluate if it could improve the normalizing method. The geometric mean (GeoMean) of cel-miR-39 and miR-1228-3p was 20.28 (SD = 0.91) and the IQR was 1.05 indicating this combination was very stable between samples. For cel-miR-39 and miR-16-5p GeoMean was 16.65 (SD = 1.19) and IQR of 1.54 indicating that this combination was more stable than using miR-16-5p alone but less stable than combining miR-1228-3p and cel-miR-39. Statistical analysis did not show significant differences in any of the combinations between groups (Figure 1D,E). Table 3 summarizes the parameters obtained for each normalization method.

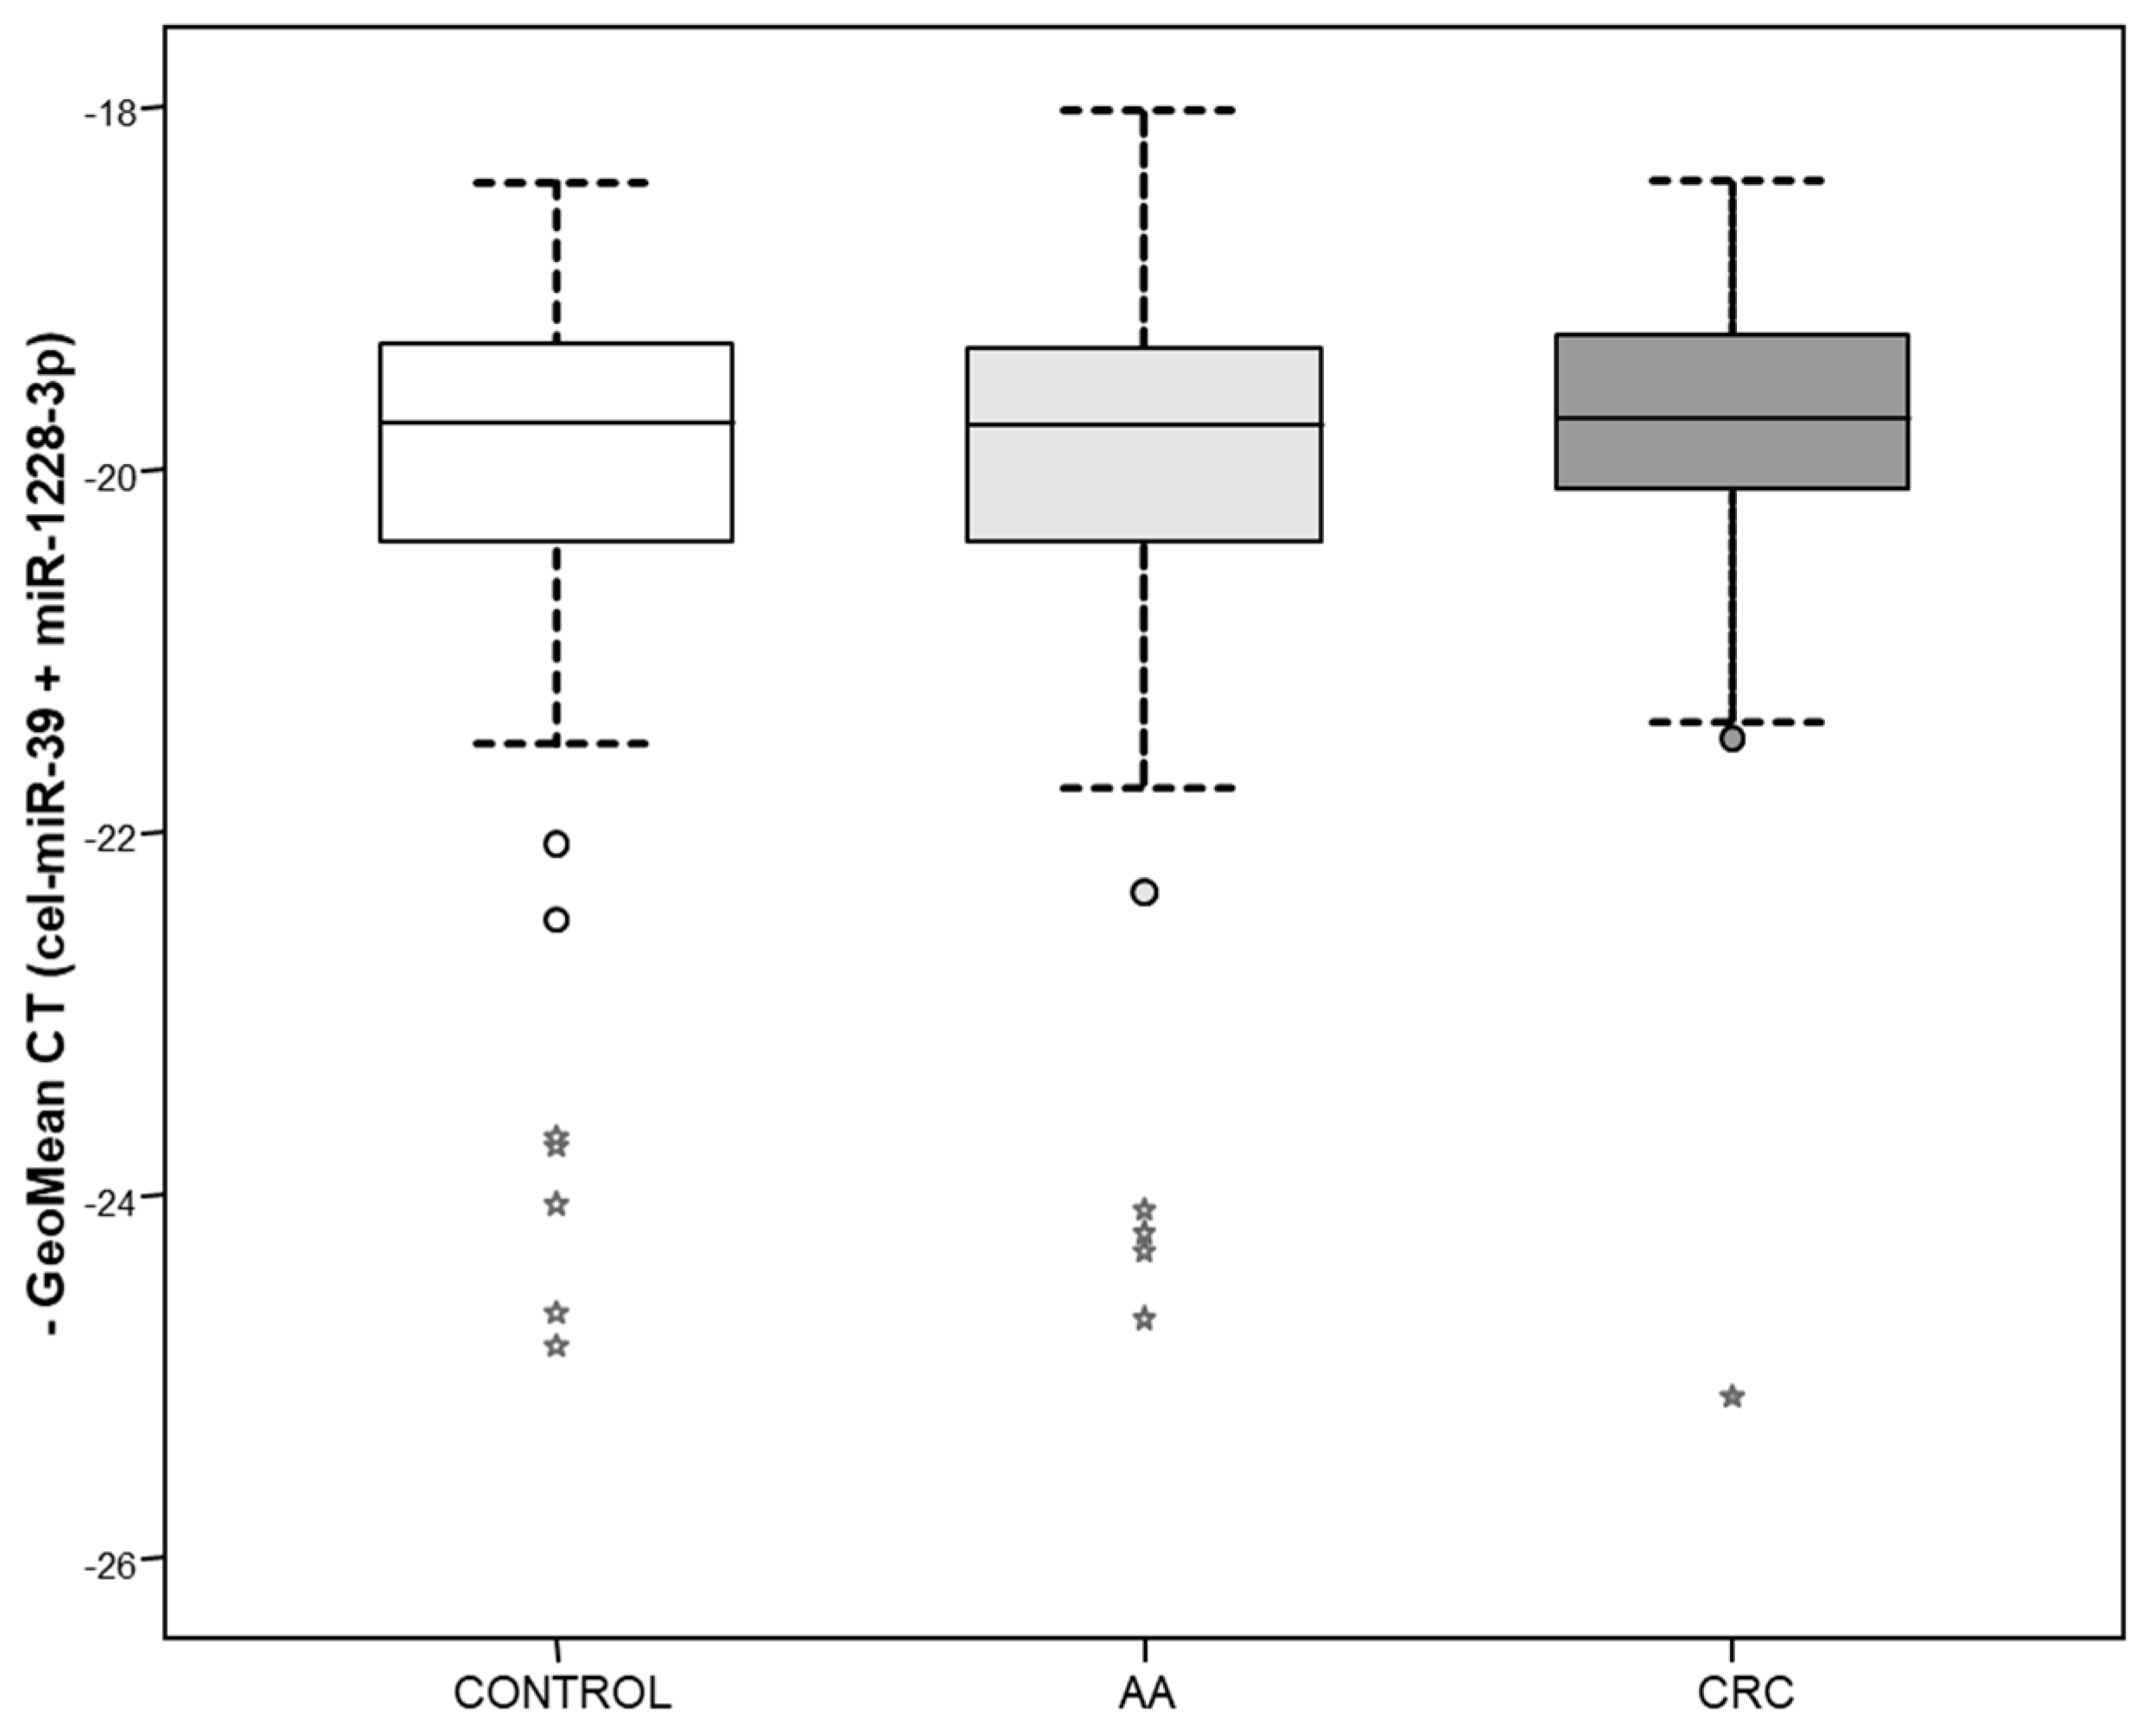
3.2. Assessment of miR-1228-3p and cel-miR-39 Combination as Normalization Method in Serum Samples

In order to confirm that the proposed normalization method could also be used in serum samples, we analyzed expression of miR-1228-3p and the spiked-in cel-miR-39 in a large serum set (n = 213). Expression levels of cel-miR-39 showed similar pattern than plasma samples being mean Ct of 14.41 (SD = 1.08). MiR-1228-3p also showed similar Ct values than plasma with a mean Ct of 27.70 (SD = 1.65 and IQR = 1.44). As expected, no significant differences were observed between groups for these 2 miRNAs. The combination of both showed GeoMean = 19.97, SD = 1.23 and IQR = 1.03. Accordingly, it did not show significant differences between groups (Figure 2). Thus, results in serum were similar to those obtained in plasma indicating that the combination of miR-1228-3p and cel-miR-39 could also be a good strategy to normalize miRNA expression in serum samples.

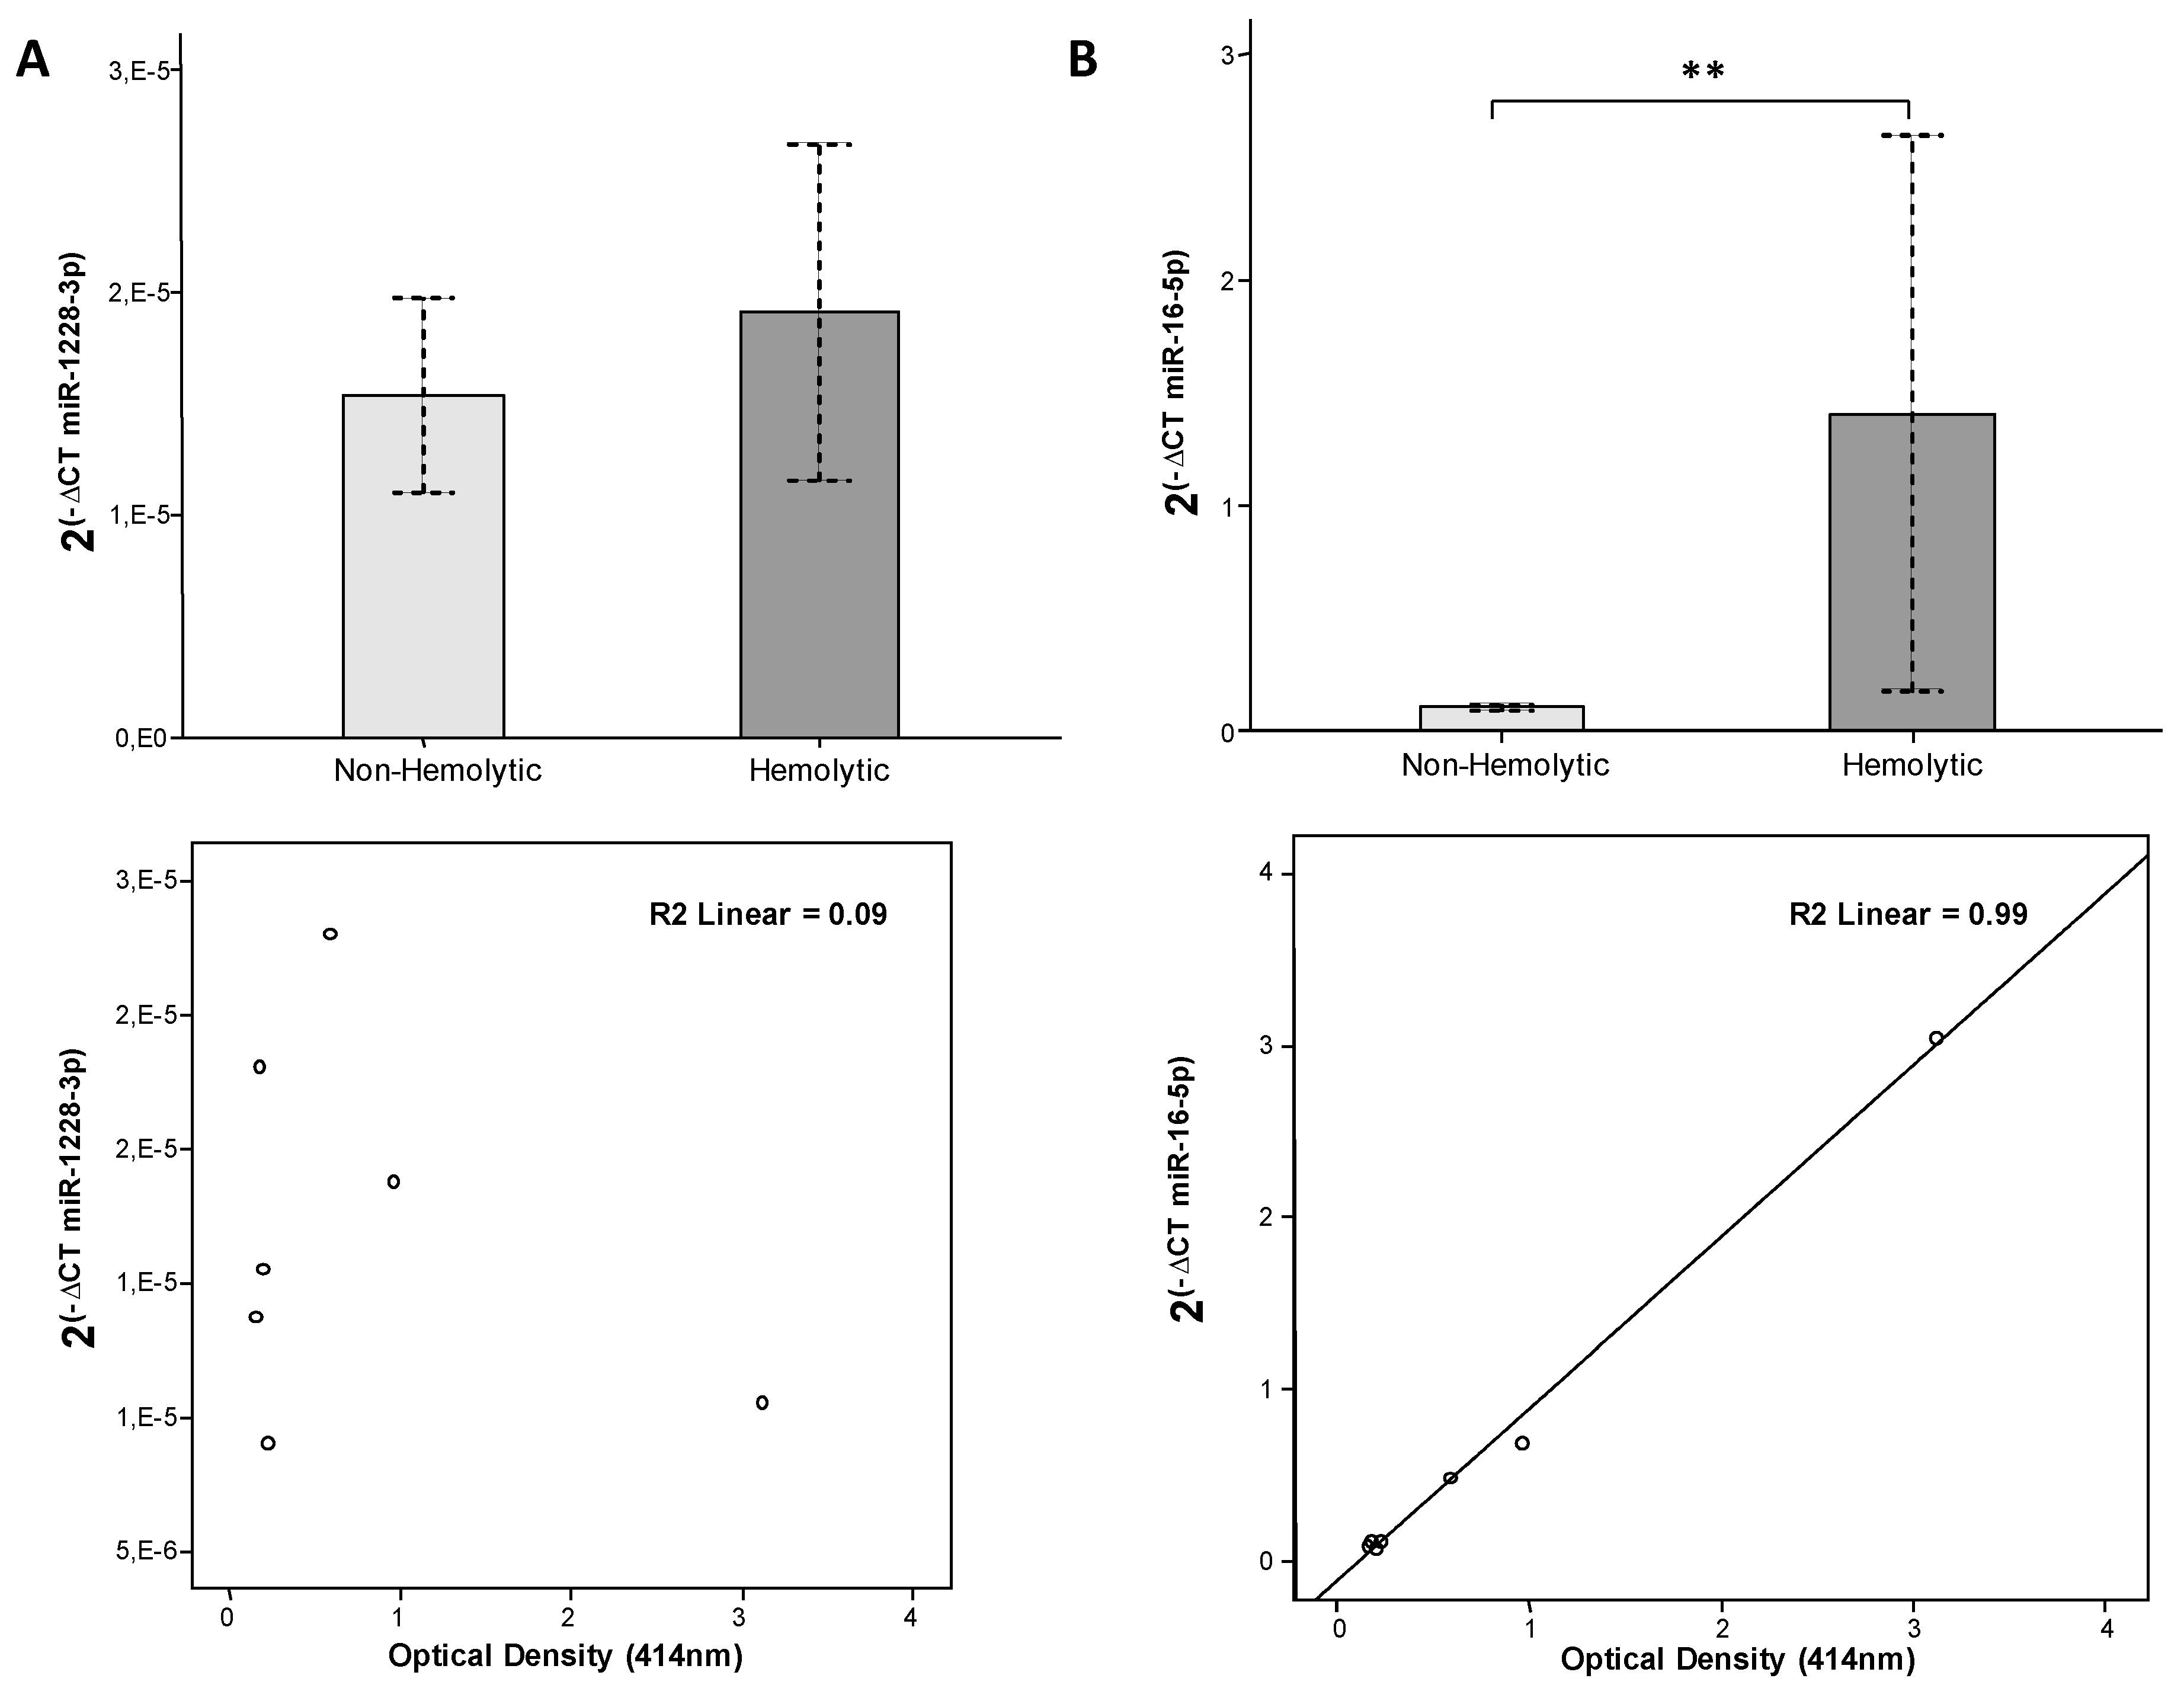
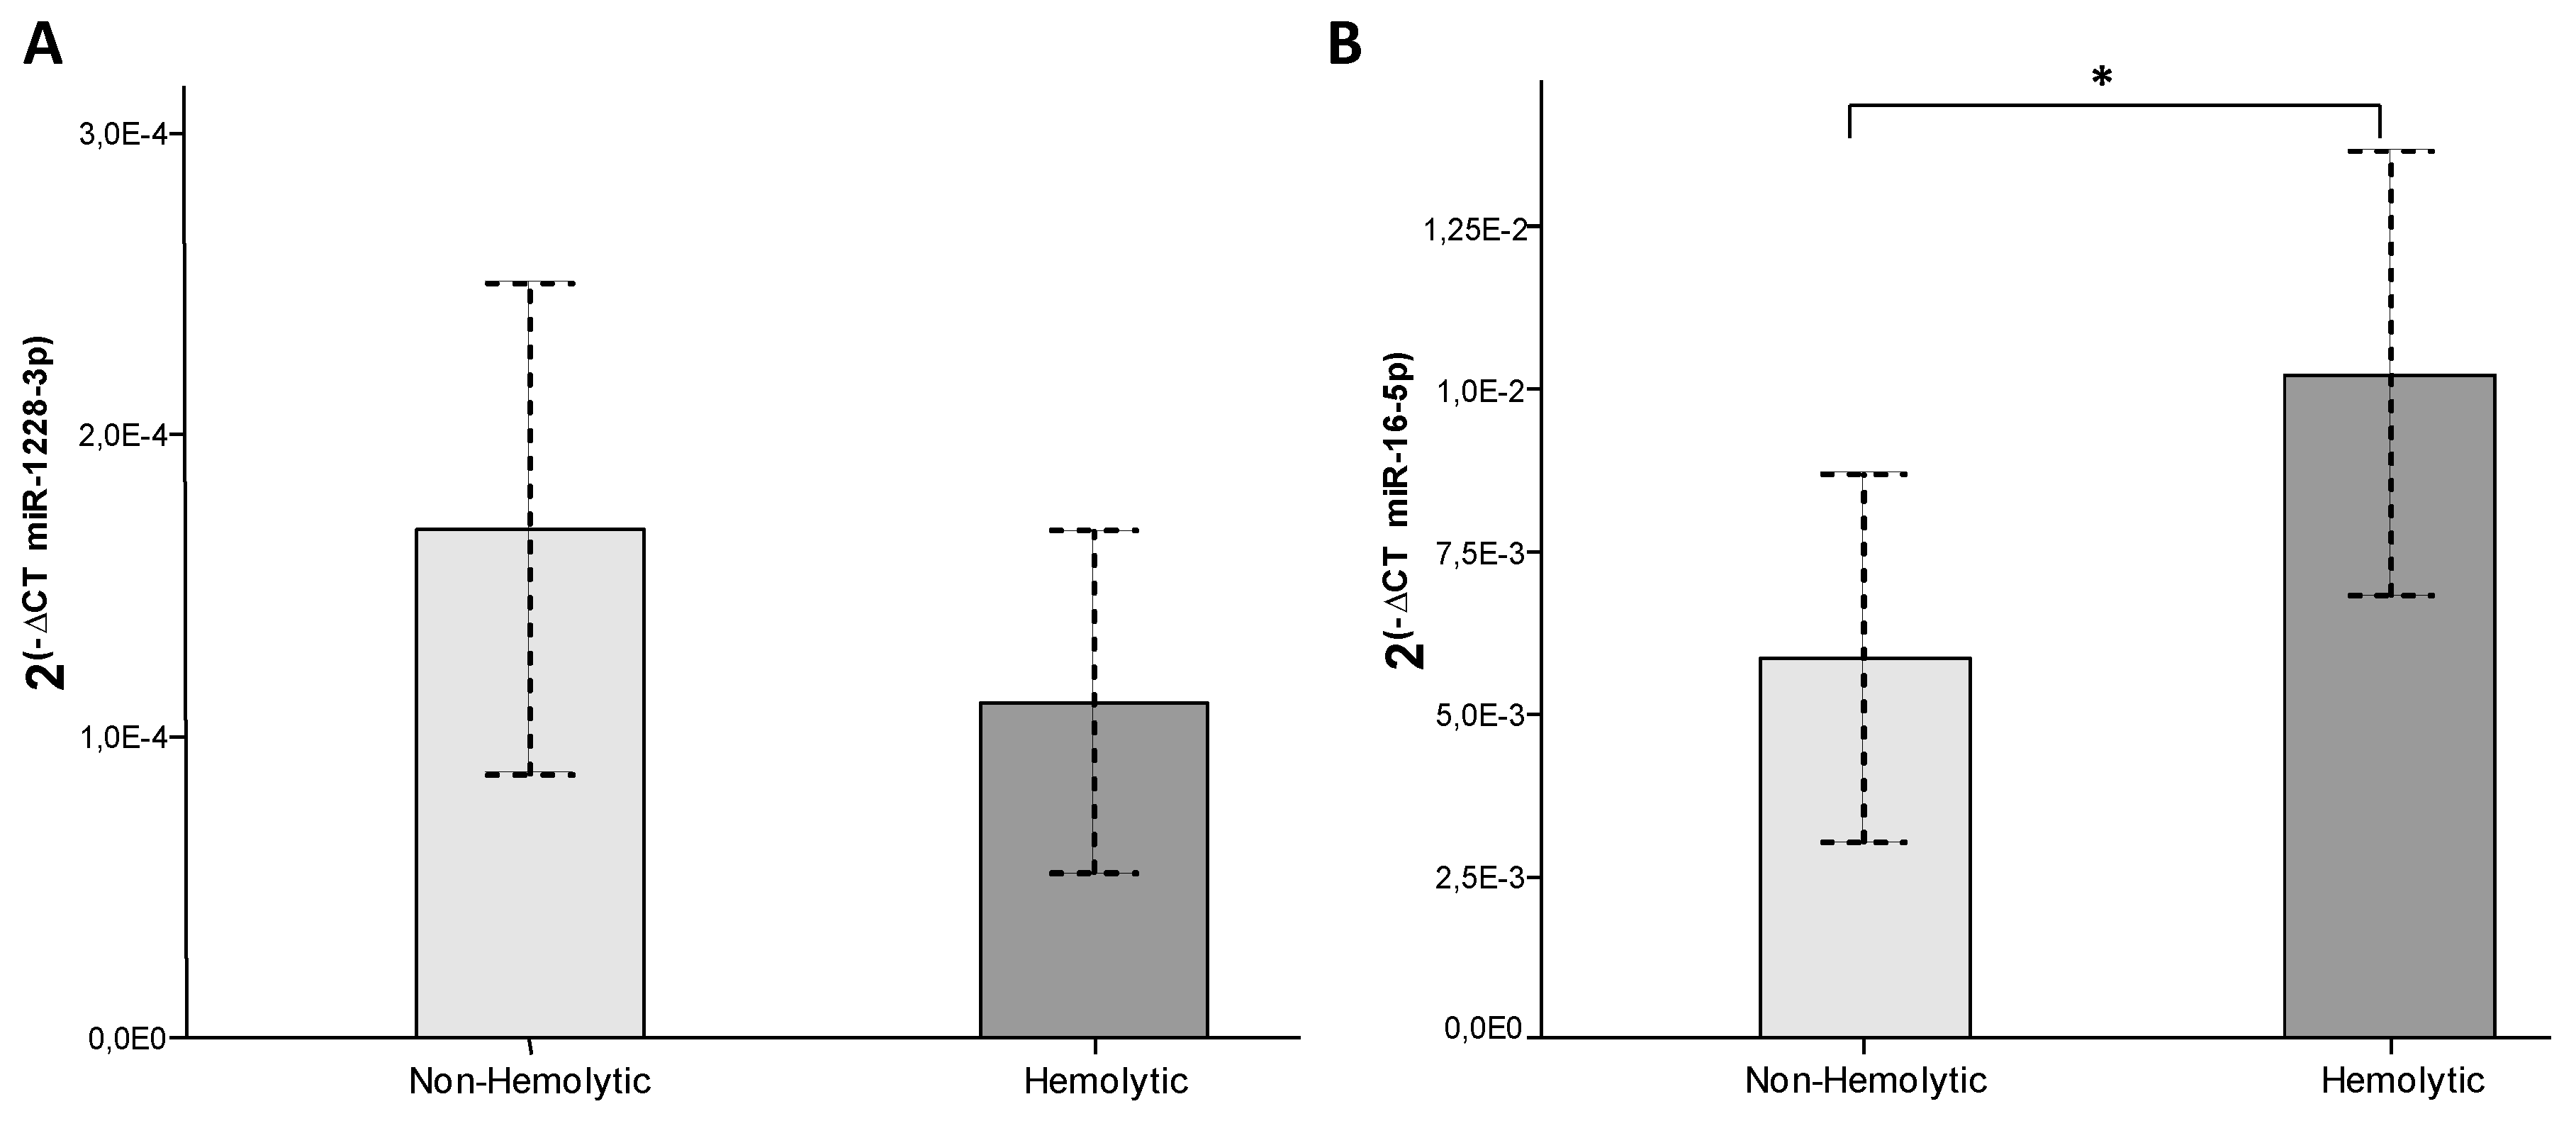
3.3. Assessment of Hemolysis Interference on HK miRNA Expression

In order to know if miR-16-5p and miR-1228-3p expression was affected by hemolysis and which of them had more variability due to this factor we compared their levels in plasma (n = 7) and serum (n = 31) samples with different degrees of hemolysis. Results showed that miR-1228-3p levels in plasma were not significantly affected by hemolysis (Figure 3A). On the contrary, miR-16-5p levels exhibited high correlation with hemolysis (R2 = 0.99; p-value < 0.001) and were significantly higher in hemolytic plasma samples than in non-hemolytic ones (Figure 3B).
Similarly, the same tendency was observed in serum samples. MiR-1228-3p showed no significant differences between hemolytic and non-hemolytic serum samples while miR-16-5p increased significantly in the hemolytic ones (Figure 4). Thus, miR-16-5p and not miR-1228-3p expression levels can be influenced by hemolysis present in samples and can introduce bias if used to normalize other miRNAs expression. Therefore, a part from being the most stable normalizing method, the combination of cel-miR-39 and miR-1228-3p is not influenced by hemolysis.

4. Discussion

Over the last few years, miRNA studies have increased and pointed out these molecules as excellent biomarkers for different pathologies [21]. Importantly, miRNAs have especially been found altered in different cancers [22,23]. These molecules could have an important role helping clinicians to detect cancer at early stages as well as guide treatment response and surveillance [24]. Furthermore, miRNAs were also found in circulating body fluids making them potential non-invasive biomarker candidates [25]. However, there are several pre-analytical and analytical factors that can interfere with circulating miRNA measurements [26,27]. As a consequence, standardization of the analytical method is still lacking, thus producing discrepancies in the results obtained by different methods. This fact represents a drawback to develop new non-invasive biomarkers based on miRNAs and makes obtaining reliable results difficult. Quantitative reverse-transcription PCR (qRT-PCR) is the most commonly used technique to quantify miRNA expression [28]. However, Ct values have to be normalized with one or several reference genes or HKs to obtain reliable results; thus enabling to reduce the bias due to differences between samples in miRNA extraction efficiency, reverse-transcription and amplification. In fact, the use of inadequate HK can generate misleading results [29,30]. Unfortunately, there are still not enough studies validating potential HK miRNAs to be used in qRT-PCR analysis of circulating miRNAs in CRC.
The main aim of our study was to validate a previously suggested HK miRNA candidate for circulating miRNA studies in CRC patients, in a large set of plasma samples, and compare it with one of the most commonly used HK miRNAs in this setting such as miR-16-5p. Secondly, we wanted to also confirm the suitability of miR-1228-3p as HK miRNA in serum samples. We found in the literature that Hu J et al. described that miR-1228-3p seemed to be stable in plasma samples from different kind of tumors, including CRC [19]. After that, Danese, E. et al. confirmed the stability of this miRNA in plasma, exosomes and tissue from 20 CRC patients [20]. However, validation in a large cohort of patients also including patients with pre-neoplastic lesions such as advanced adenomas (AA), provided confirmation of its suitability in serum samples and assessment of the influence of one of the most confounding factors in this setting (i.e., hemolysis), were still lacking.
Therefore, we analyzed circulating levels of miR-1228-3p and miR-16-5p in two large cohorts of CRC patients (also containing patients with AA), one consisting of plasma and the other of serum samples. Then, we compared their levels in hemolytic samples with non-hemolytic ones to assess the influence of this common phenomenon on the aforementioned HK candidates. Our results showed that both miR-16-5p and miR-1228-3p were found with consistent expression in all analyzed plasma samples and no significant differences were detected between CRC, AA or control patients. However, miR-1228-3p showed less variability between samples than miR-16-5p as indicated by the corresponding IQR and SD. Moreover, taking into account that normalizing only with an endogenous control any possible bias due to differences in miRNA extraction and technical efficiency is not considered [31], we also added a non-human exogenous control, cel-miR-39, before RNA extraction. We then considered to combine both exogenous and endogenous controls and calculated the geometric mean of cel-miR-39 and each one of the endogenous controls assessed. Both combinations (cel-miR-39 + miR-16-5p or cel-miR-39 + miR-1228-3p) were more stable than using the respective endogenous control alone, but the combination with miR-1228-3p was the most stable.
In addition, we validated the stability of the proposed HK combination cel-miR-39 + miR-1228-3p in a large serum set of CRC and AA patients, and healthy individuals. As expected, it also showed very low variability among all serum samples and no differences between groups.
Furthermore, bearing in mind that presence of hemolysis can affect some plasma and serum miRNA levels due to miRNA contamination coming from blood cells [16,17], it is extremely important that our HK miRNA that we will use to normalize results is not influenced by this factor, otherwise some bias could be introduced resulting in inaccurate results and conclusions. Indeed, there are some studies that found miR-16-5p among the top 10 miRNAs expressed in erythrocytes [32,33]. Consistently, we observed that hemolysis had a significant influence on miR-16-5p levels in plasma and serum samples, thus adding another drawback to the use of this miRNA as HK in this setting. Conversely, miR-1228-3p did not show any relation with the hemolysis degree and no significant difference was found between hemolytic and non-hemolytic samples.
Finally, an ideal HK miRNA to be used in CRC studies should not be involved in cancer biology. However, for the widely used HK miRNA miR-16-5p there are lots of reports demonstrating its deregulation and implication in cancer processes, including CRC, regulating onco/tumor suppressor genes and having an important role in cell growth in cancer [34,35,36]. By contrast, no relation with colon cancer processes has been found for miR-1228-3p that has been only related with the regulation of some metabolic pathways and organ morphology [19].
In conclusion, we suggest that the combination of an exogenous control (for instance, cel-miR-39) and the endogenous control miR-1228-3p could be a good strategy to normalize miRNA expression analysis obtained by qRT-PCR in plasma and serum from CRC or AA patients.

Author Contributions

Conceptualization, M.G.; methodology, S.D.-S. and M.G.; software, J.J.L.; validation, S.D.-S. and M.G.; formal analysis, S.D.-S. and J.J.L.; investigation, S.D.-S., E.V.-N., M.M., J.M.; resources, J.C., M.S.D., L.B., A.L., R.J., V.H., E.Q., M.H.-V., A.C.M., R.P.-P., R.A., A.C.; data curation, S.D.-S.; writing—original draft preparation, S.D.-S.; writing—review and editing, M.G. and A.C.; visualization, S.D.-S. and M.G.; supervision, M.G.; project administration, M.G. and M.H.-V.; funding acquisition, M.G. and A.C. All authors have read and agreed to the published version of the manuscript.

Funding

We acknowledge the funding from Advanced Marker Discovery (AMADIX) and grants support from Fundación Científica de la Asociación Española contra el Cáncer (GCB13131592CAST), Ministerio de Economía y Competitividad (RTC-2015-3850-1 and SAF2014-54453-R) and Instituto de Salud Carlos III (PI17/01003, co-funded by FEDER-European Union). CIBEREHD is funded by the Instituto de Salud Carlos III. We are grateful to the support of CERCA Programme and SGR 653 from Generalitat de Catalunya. This work was developed at the Centro Esther Koplowitz, Barcelona, Spain.

Acknowledgments

We are sincerely grateful to the patients for their participation and to the CRC screening program and endoscopy nurses from the Hospital Clinic of Barcelona for their collaboration. We are indebted to the IDIBAPS Biobank, integrated in the Spanish National Biobank Network.

Conflicts of Interest

M.H.-V., A.C.M., R.P.-P., R.A. are Amadix employees. Rest of the authors declares no conflict of interest.

Abbreviations

AAadvanced adenomas
CRCcolorectal cancer
miRNAmicroRNA
qRT-PCRreal-time quantitative reverse transcription PCR
HKhousekeeping
ODoptical density
IQRinterquartile range
SDstandard deviation
CTcycle threshold
Geomeangeometric mean

References

  1. Bartel, D.P. MicroRNAs. Cell 2004, 116, 281–297. [Google Scholar] [CrossRef] [Green Version]
  2. Bartel, D.P. MicroRNAs: Target Recognition and Regulatory Functions. Cell 2009, 136, 215–233. [Google Scholar] [CrossRef] [PubMed] [Green Version]
  3. Bushati, N.; Cohen, S.M. microRNA Functions. Annu. Rev. Cell Dev. Biol. 2007, 23, 175–205. [Google Scholar] [CrossRef] [PubMed]
  4. Esquela-Kerscher, A.; Slack, F.J. Oncomirs—microRNAs with a role in cancer. Nat. Rev. Cancer 2006, 6, 259–269. [Google Scholar] [CrossRef] [PubMed]
  5. Cho, W.C.S. MicroRNAs: Potential biomarkers for cancer diagnosis, prognosis and targets for therapy. Int. J. Biochem. Cell Biol. 2010, 42, 1273–1281. [Google Scholar] [CrossRef]
  6. Kosaka, N.; Iguchi, H.; Ochiya, T. Circulating microRNA in body fluid: A new potential biomarker for cancer diagnosis and prognosis. Cancer Sci. 2010, 101, 2087–2092. [Google Scholar] [CrossRef]
  7. Mitchell, P.S.; Parkin, R.K.; Kroh, E.M.; Fritz, B.R.; Wyman, S.K.; Pogosova-Agadjanyan, E.L.; Peterson, A.; Noteboom, J.; O’Briant, K.C.; Allen, A.; et al. Circulating microRNAs as stable blood-based markers for cancer detection. Proc. Natl. Acad. Sci. 2008, 105, 10513–10518. [Google Scholar] [CrossRef] [Green Version]
  8. Lauby-Secretan, B.; Vilahur, N.; Bianchini, F.; Guha, N.; Straif, K. The IARC Perspective on Colorectal Cancer Screening. N. Engl. J. Med. 2018, 378, 1734–1740. [Google Scholar] [CrossRef]
  9. Arnold, M.; Sierra, M.S.; Laversanne, M.; Soerjomataram, I.; Jemal, A.; Bray, F. Global patterns and trends in colorectal cancer incidence and mortality. Gut 2017, 66, 683–691. [Google Scholar] [CrossRef] [Green Version]
  10. Inadomi, J.M. Colorectal cancer screening: Which test is best? JAMA Oncol. 2016, 2, 1001–1003. [Google Scholar] [CrossRef]
  11. Li, N.; Ma, J.; Guarnera, M.A.; Fang, H.; Cai, L.; Jiang, F. Digital PCR quantification of miRNAs in sputum for diagnosis of lung cancer. J. Cancer Res. Clin. Oncol. 2014, 140, 145–150. [Google Scholar] [CrossRef] [PubMed] [Green Version]
  12. Pritchard, C.C.; Cheng, H.H.; Tewari, M. MicroRNA profiling: Approaches and considerations. Nat. Rev. Genet. 2012, 13, 358–369. [Google Scholar] [CrossRef] [PubMed]
  13. Benes, V.; Castoldi, M. Expression profiling of microRNA using real-time quantitative PCR, how to use it and what is available. Methods 2010, 50, 244–249. [Google Scholar] [CrossRef] [PubMed]
  14. Rice, J.; Roberts, H.; Rai, S.N.; Galandiuk, S. Housekeeping genes for studies of plasma microRNA: A need for more precise standardization. Surgery 2015, 158, 1345–1351. [Google Scholar] [CrossRef] [PubMed]
  15. Song, J.; Bai, Z.; Han, W.; Zhang, J.; Meng, H.; Bi, J.; Ma, X.; Han, S.; Zhang, Z. Identification of Suitable Reference Genes for qPCR Analysis of Serum microRNA in Gastric Cancer Patients. Dig. Dis. Sci. 2012, 57, 897–904. [Google Scholar] [CrossRef]
  16. Kirschner, M.B.; Kao, S.C.; Edelman, J.J.; Armstrong, N.J.; Vallely, M.P.; van Zandwijk, N.; Reid, G. Haemolysis during Sample Preparation Alters microRNA Content of Plasma. PLoS ONE 2011, 6, e24145. [Google Scholar] [CrossRef]
  17. Kirschner, M.B.; Edelman, J.J.B.; Kao, S.C.-H.; Vallely, M.P.; Van Zandwijk, N.; Reid, G. The Impact of Hemolysis on Cell-Free microRNA Biomarkers. Front. Genet. 2013, 4, 94. [Google Scholar] [CrossRef] [Green Version]
  18. Shen, Y.; Tian, F.; Chen, Z.; Li, R.; Ge, Q.; Lu, Z. Amplification-based method for microRNA detection. Biosens. Bioelectron. 2015, 71, 322–331. [Google Scholar] [CrossRef]
  19. Hu, J.; Wang, Z.; Liao, B.-Y.; Yu, L.; Gao, X.; Lu, S.; Wang, S.; Dai, Z.; Zhang, X.; Chen, Q.; et al. Human miR-1228 as a stable endogenous control for the quantification of circulating microRNAs in cancer patients. Int. J. Cancer 2014, 135, 1187–1194. [Google Scholar] [CrossRef]
  20. Danese, E.; Minicozzi, A.M.; Benati, M.; Paviati, E.; Lima-Oliveira, G.; Gusella, M.; Pasini, F.; Salvagno, G.L.; Montagnana, M.; Lippi, G. Reference miRNAs for colorectal cancer: Analysis and verification of current data. Sci. Rep. 2017, 7, 8413. [Google Scholar] [CrossRef]
  21. Xu, L.; Qi, X.; Duan, S.; Xie, Y.; Ren, X.; Chen, G.; Yang, X.; Han, L.; Dong, Q. MicroRNAs: Potential biomarkers for disease diagnosis. Biomed. Mater. Eng. 2014, 24, 3917–3925. [Google Scholar] [CrossRef] [PubMed] [Green Version]
  22. Vila-Navarro, E.; Vila-Casadesús, M.; Moreira, L.; Duran-Sanchon, S.; Sinha, R.; Ginés, À.; Fernández-Esparrach, G.; Miquel, R.; Cuatrecasas, M.; Castells, A.; et al. MicroRNAs for Detection of Pancreatic Neoplasia. Ann. Surg. 2017, 265, 1226–1234. [Google Scholar] [CrossRef] [PubMed] [Green Version]
  23. Tsai, M.-M.; Wang, C.-S.; Tsai, C.-Y.; Huang, H.W.; Chi, H.C.; Lin, Y.H.; Lu, P.H.; Lin, K.H. Potential Diagnostic, Prognostic and Therapeutic Targets of MicroRNAs in Human Gastric Cancer. Int. J. Mol. Sci. 2016, 17, 945. [Google Scholar] [CrossRef] [PubMed]
  24. Hollis, M. MicroRNAs potential utility in colon cancer: Early detection, prognosis, and chemosensitivity. World J. Gastroenterol. 2015, 21, 8284. [Google Scholar] [CrossRef]
  25. Yörüker, E.E.; Holdenrieder, S.; Gezer, U. Blood-based biomarkers for diagnosis, prognosis and treatment of colorectal cancer. Clin. Chim. Acta 2016, 455, 26–32. [Google Scholar] [CrossRef]
  26. Brunet-Vega, A.; Pericay, C.; Quílez, M.E.; Ramírez-Lázaro, M.J.; Calvet, X.; Lario, S. Variability in microRNA recovery from plasma: Comparison of five commercial kits. Anal. Biochem. 2015, 488, 28–35. [Google Scholar] [CrossRef]
  27. Sourvinou, I.S.; Markou, A.; Lianidou, E.S. Quantification of Circulating miRNAs in Plasma. J. Mol. Diagn. 2013, 15, 827–834. [Google Scholar] [CrossRef]
  28. Kroh, E.M.; Parkin, R.K.; Mitchell, P.S.; Tewari, M. Analysis of circulating microRNA biomarkers in plasma and serum using quantitative reverse transcription-PCR (qRT-PCR). Methods 2010, 50, 298–301. [Google Scholar] [CrossRef] [Green Version]
  29. Gutierrez, L.; Mauriat, M.; Gunin, S.; Pelloux, J.; Lefebvre, J.F.; Louvet, R.; Rusterucci, C.; Moritz, T.; Guerineau, F.; Bellini, C.; et al. The lack of a systematic validation of reference genes: A serious pitfall undervalued in reverse transcription-polymerase chain reaction (RT-PCR) analysis in plants. Plant. Biotechnol. J. 2008, 6, 609–618. [Google Scholar] [CrossRef] [Green Version]
  30. Schwarzenbach, H.; Silva, A.M.; da Calin, G.; Pantel, K. Data Normalization Strategies for MicroRNA Quantification. Clin. Chem. 2015, 61, 1333–1342. [Google Scholar] [CrossRef]
  31. Zeka, F.; Mestdagh, P.; Vandesompele, J. RT-qPCR-Based Quantification of Small Non-Coding RNAs. In Methods in molecular biology; Rederstorff, M., Ed.; Humana Press: New York, NY, USA, 2015; Volume 1296, pp. 85–102. [Google Scholar]
  32. Chen, S.-Y.; Wang, Y.; Telen, M.J.; Chi, J.T. The Genomic Analysis of Erythrocyte microRNA Expression in Sickle Cell Diseases. PLoS ONE 2008, 3, e2360. [Google Scholar] [CrossRef] [PubMed]
  33. Merkerova, M.; Belickova, M.; Bruchova, H. Differential expression of microRNAs in hematopoietic cell lineages. Eur. J. Haematol. 2008, 81, 304–310. [Google Scholar] [CrossRef] [PubMed]
  34. Cui, J. MiR-16 family as potential diagnostic biomarkers for cancer: A systematic review and meta-analysis. Int. J. Clin. Exp. Med. 2015, 8, 1703–1714. [Google Scholar] [PubMed]
  35. Zhang, J.; Song, Y.; Zhang, C.; Zhi, X.; Fu, H.; Ma, Y.; Chen, Y.; Pan, F.; Wang, K.; Ni, J.; et al. Circulating MiR-16-5p and MiR-19b-3p as Two Novel Potential Biomarkers to Indicate Progression of Gastric Cancer. Theranostics 2015, 5, 733–745. [Google Scholar] [CrossRef] [Green Version]
  36. You, C.; Liang, H.; Sun, W.; Li, J.; Liu, Y.; Fan, Q.; Zhang, H.; Yue, X.; Li, J.; Chen, X.; et al. Deregulation of the miR-16-KRAS axis promotes colorectal cancer. Sci. Rep. 2016, 6, 37459. [Google Scholar] [CrossRef] [Green Version]
Figure 1. Expression levels of candidate endogenous control miRNAs in plasma samples from a CRC cohort by quantitative reverse-transcription polymerase chain reaction (qRT-PCR). Minus Ct of spike-in (A) cel-miR-39, candidate endogenous controls (B) miR-1228-3p and (C) miR-16-5p are depicted as box-plots. Minus geometrical mean Ct of each endogenous control with cel-miR-39 are also shown (D and E). There is no significant difference in the expression levels of cel-miR-39, miR-1228-3p and miR-16-5p between control individuals (control; white box; n = 98), individuals with advanced adenomas (AA; light grey box; n = 99) and colorectal cancer patients (CRC; dark grey box; n = 90).
Biomolecules 10 00016 g001
Figure 2. Combination of cel-miR-39 and miR-1228-3p qRT-PCR values in serum samples from a second CRC cohort. Minus geometrical mean Ct is represented as box-plot. There is no significant difference in these values levels between control individuals (control; white box; n = 80), individuals with advanced adenomas (AA; light grey box; n = 74) and colorectal cancer patients (CRC; dark grey box; n = 59).
Biomolecules 10 00016 g002
Figure 3. Influence of hemolysis in miR-1228-3p and miR-16-5p plasma levels. qRT-PCR data are represented as 2(−CT) normalized by cel-miR-39 for (A) miR-1228-3p and (B) miR-16-5p. Correlation between expression of these miRNAs and optical density (OD) measured at 414 nm are also shown. Hemolytic plasma samples (n = 3) regarded as OD414nm > 0.25; non-hemolytic plasma samples (n = 4) regarded as OD414nm ≤ 0.25. p-value ≤ 0.01 is depicted as **.
Biomolecules 10 00016 g003
Figure 4. Influence of hemolysis in (A) miR-1228-3p and (B) miR-16-5p serum levels. qRT-PCR data are represented as 2(−CT) normalized by cel-miR-39. Hemolytic serum samples (n = 14) regarded as OD414nm > 0.25; non-hemolytic serum samples (n = 17) regarded as OD414nm ≤ 0.25. p-value ≤ 0.05 is depicted as *.
Biomolecules 10 00016 g004
Table 1. Clinicopathological characteristics of patients included in the plasma set. Tumor stage was classified according to staging system of American Joint Committee on Cancer (AJCC), and location according to proximal or distal classification. Adenomas characteristics are explained as dysplasia grade, villous component and size of the largest one. (SD: standard deviation; CRC: colorectal cancer; AA: advanced adenoma; control; healthy volunteers).
TotalCRCAAControl
Number29796101100
Mean Age (SD)65 (11.5)73 (10.6)63 (9.4)60 (11.1)
Gender
Male174507351
Female123462849
CRC Features
TNM Stage
I 20
II 23
III 34
IV 14
Unkown 5
Location
Proximal 37
Distal 59
AA Features
Mean Size (mm) (SD) 20 (11.8)
N AA Mean (SD) 3 (3.4)
N AA ≥ 10 mm 93
High-grade dysplasia 38
Villous Component 41
Unkown 5
Table 2. Clinicopathological characteristics of patients included in the serum set. Tumor stage was classified according to staging system of American Joint Committee on Cancer (AJCC), and location according to proximal or distal classification. Adenomas characteristics are explained as dysplasia grade, villous component and size of the largest one. (SD: standard deviation; CRC: colorectal cancer; AA: advanced adenoma; control: healthy volunteers).
TotalCRCAAControl
Number213597480
Mean Age(SD)62 (5,5)62 (5,4)62 (5,6)62 (5,6)
Gender
Male150445155
Female63152325
CRC Features
TNM Stage
I 30
II 13
III 14
IV 2
Location
Proximal 18
Distal 41
AA Features
Mean size (mm) (SD) 14 (7,2)
N AA Mean (SD) 3 (1,8)
N AA ≥ 10 mm 63
High-grade dysplasia 26
Villous component 27
Table 3. Summary results of different housekeeping (HK) expression in plasma and serum samples from two CRC cohorts by qRT-PCR. (IQR, interquartile range; SD, standard deviation).
Plasma (n = 287)Mean Ct Range Ct (Ctmin − Ctmax)IQRSD
miR-1228-3p28.96.5 (26.2–32.7)1.161.0
miR-16-5p19.59.2 (15.7–24.9)2.021.6
Cel-miR-39 + miR-1228-3p20.35.8 (17.9–23.7)1.050.9
Cel-miR-39 + miR-16-5p16.76.5 (14.1–20.6)1.541.2
Serum (n = 213)
miR-1228-3p27.711.3 (24.7–36.1)1.441.65
Cel-miR-39 + miR-1228-3p20.07.1 (18.0–25.1)1.031.23

