

Rodent Models of Diabetic Retinopathy as a Useful Research Tool to Study Neurovascular Cross-Talk

 , ,
, ,
Abstract
:Simple Summary
Abstract
1. Introduction
1.1. Diabetic Retinopathy—The Ocular Complication of Diabetes Mellitus
1.2. The Pathophysiology of the Neurovascular Unit (NVU) in DR
2. Animal Models Used in DR Research
2.1. Selected Genetic Models
2.1.1. Rat Models
2.1.2. Mouse Models
2.2. Selected Chemically Induced Models
2.2.1. STZ
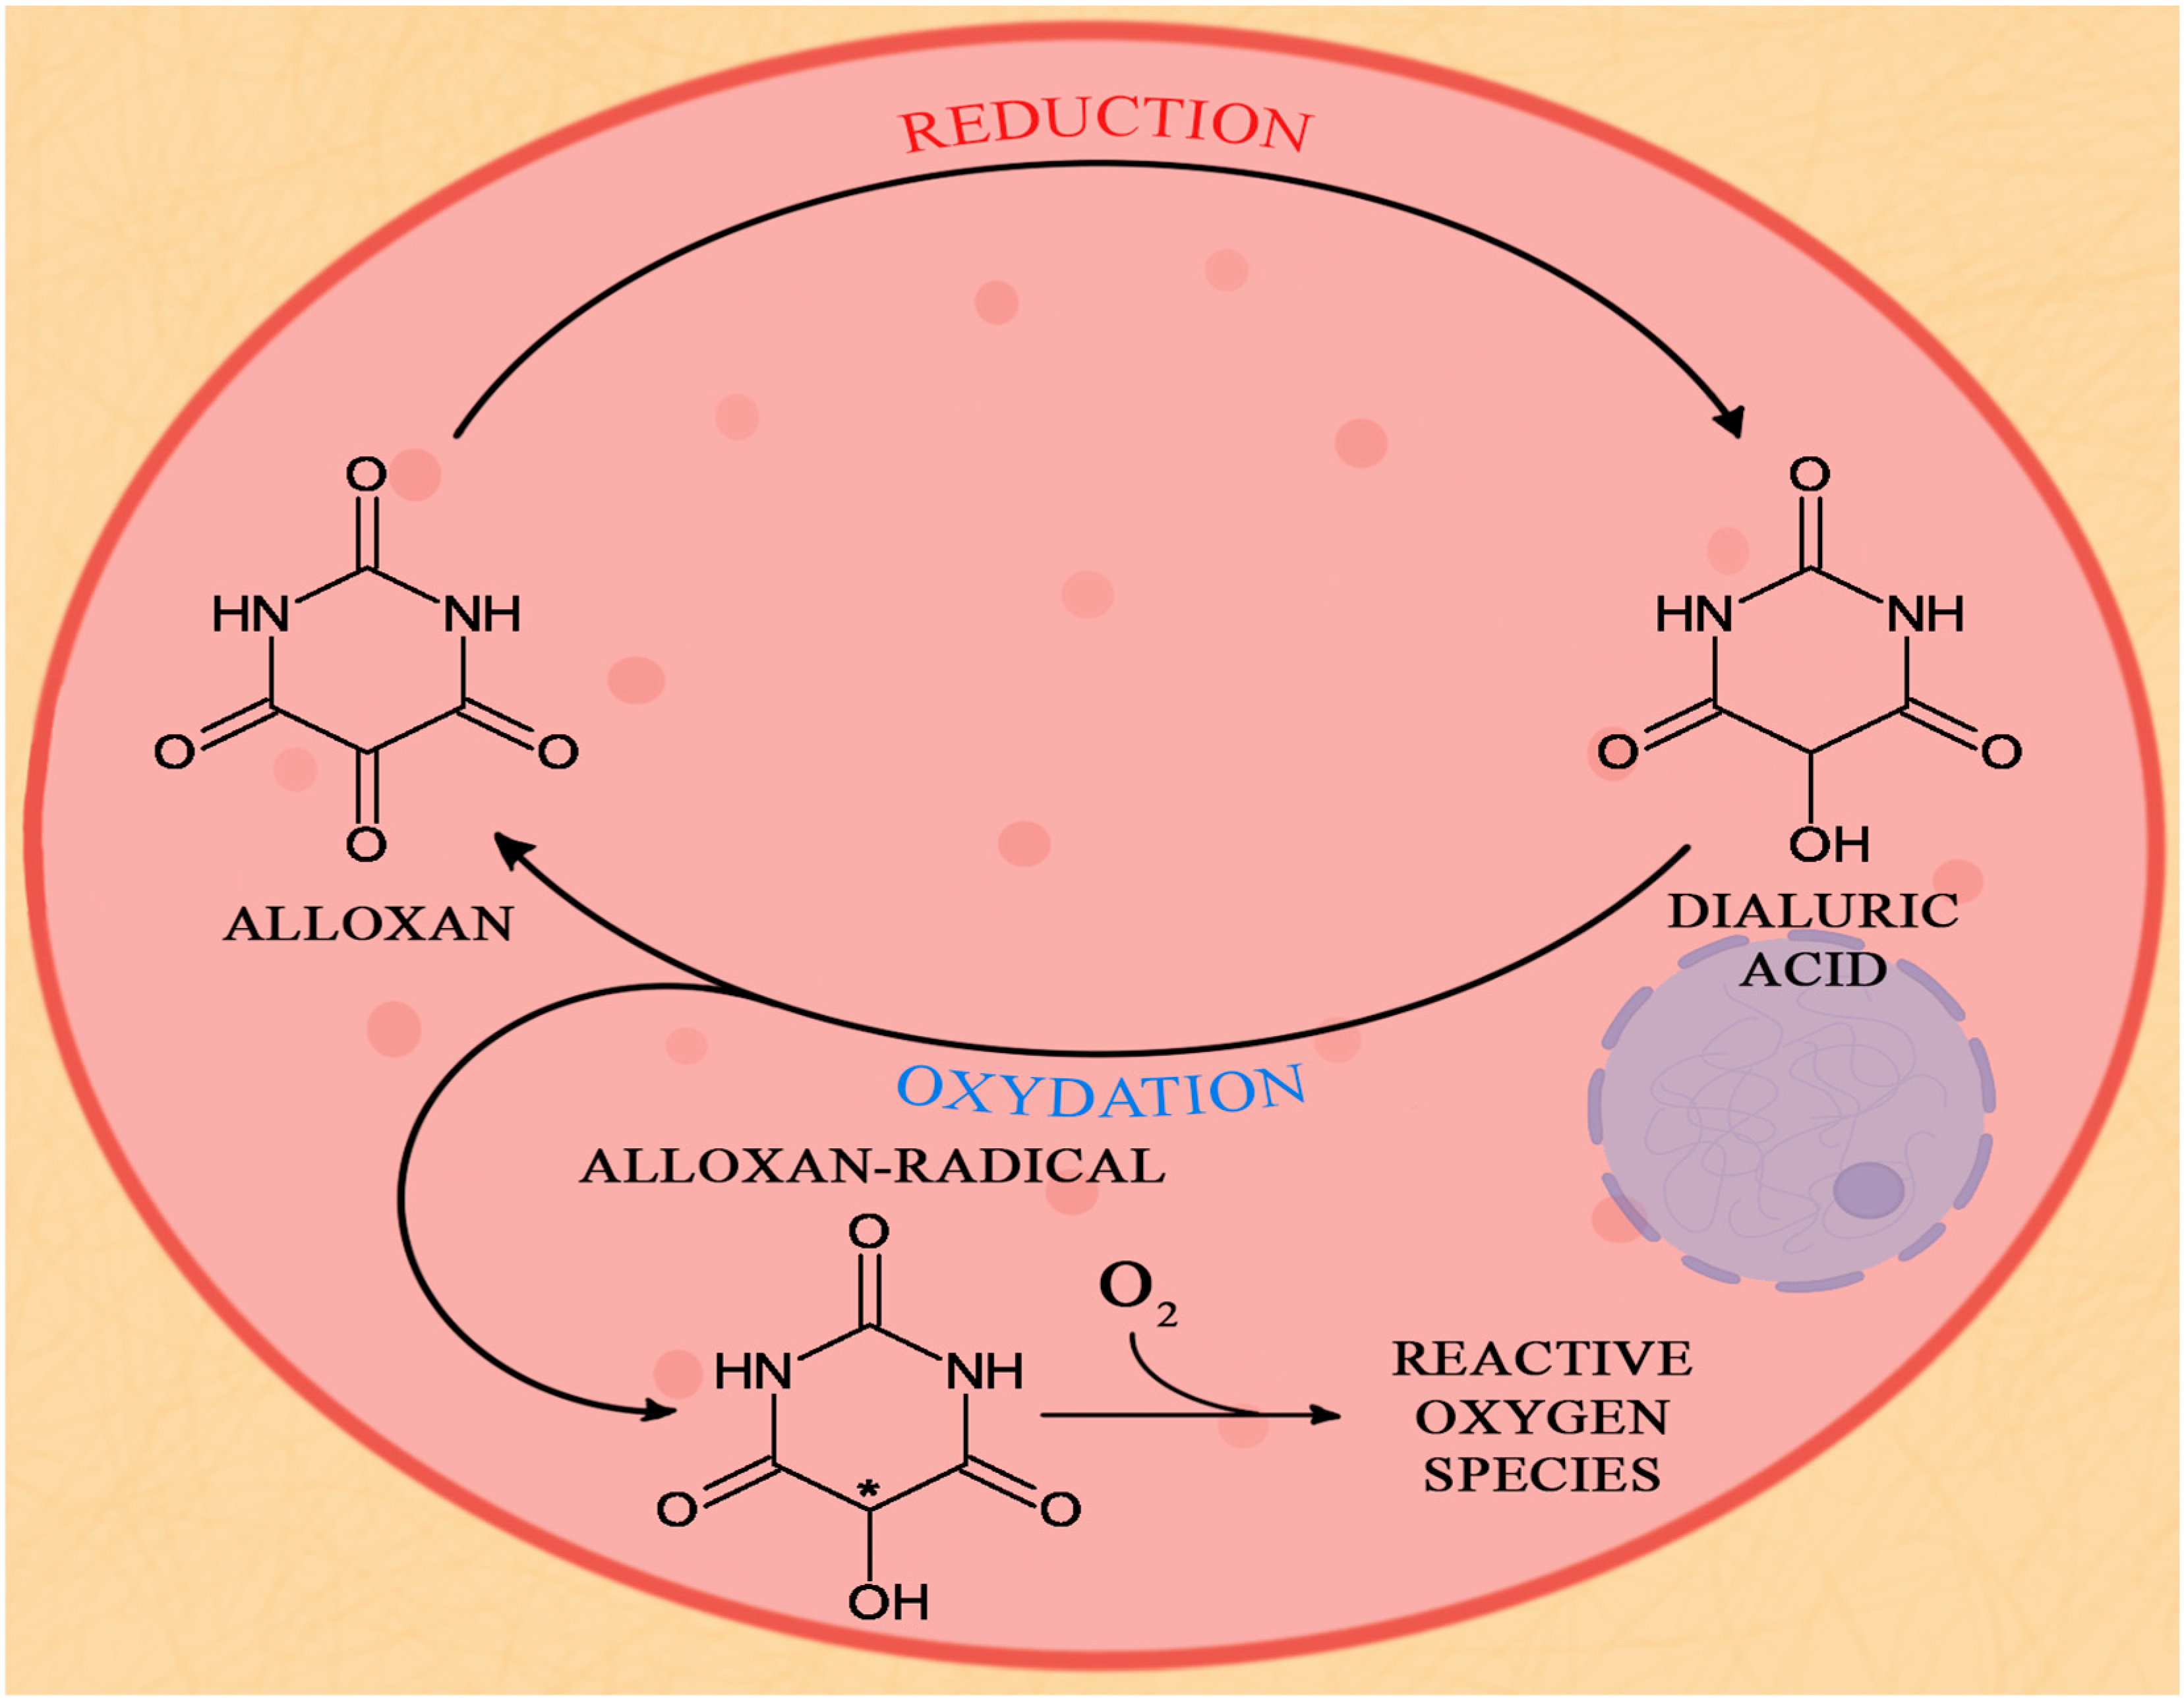
2.2.2. Alloxan
3. Conclusions
Author Contributions
Funding
Institutional Review Board Statement
Informed Consent Statement
Data Availability Statement
Conflicts of Interest
References
- Adelson, J.D.; A Bourne, R.R.; Svitil Briant, P.; Flaxman, S.R.; B Taylor, H.R.; Jonas, J.B.; Aberhe Abdoli, A.; Aberhe Abrha, W.; Abualhasan, A.; Girum Abu-Gharbieh, E.; et al. Causes of Blindness and Vision Impairment in 2020 and Trends over 30 Years, and Prevalence of Avoidable Blindness in Relation to VISION 2020: The Right to Sight: An Analysis for the Global Burden of Disease Study. Lancet Glob. Health 2021, 9, e144–e160. [Google Scholar] [CrossRef]
- Lee, R.; Wong, T.Y.; Sabanayagam, C. Epidemiology of Diabetic Retinopathy, Diabetic Macular Edema and Related Vision Loss. Eye Vis. 2015, 2, 17. [Google Scholar] [CrossRef] [PubMed]
- Salamanca, O.; Geary, A.; Suárez, N.; Benavent, S.; Gonzalez, M. Implementation of a Diabetic Retinopathy Referral Network, Peru. Bull. World Health Organ. 2018, 96, 674–681. [Google Scholar] [CrossRef] [PubMed]
- Lorenzi, M.; Gerhardinger, C. Early Cellular and Molecular Changes Induced by Diabetes in the Retina. Diabetologia 2001, 44, 791–804. [Google Scholar] [CrossRef] [PubMed]
- Harris, M.I.; Klein, R.; Welborn, T.A.; Knuiman, M.W. Onset of NIDDM Occurs at Least 4-7 Yr before Clinical Diagnosis. Diabetes Care 1992, 15, 815–819. [Google Scholar] [CrossRef]
- Solomon, S.D.; Chew, E.; Duh, E.J.; Sobrin, L.; Sun, J.K.; VanderBeek, B.L.; Wykoff, C.C.; Gardner, T.W. Diabetic Retinopathy: A Position Statement by the American Diabetes Association. Diabetes Care 2017, 40, 412–418. [Google Scholar] [CrossRef]
- International Council of Ophthalmology. Available online: https://icoph.org/downloads/ICOGuidelinesforDiabeticEyeCare (accessed on 31 January 2023).
- Pfister, F.; Przybyt, E.; Harmsen, M.C.; Hammes, H.P. Pericytes in the Eye. Pflugers Arch. Eur. J. Physiol. 2013, 465, 789–796. [Google Scholar] [CrossRef]
- Beltramo, E.; Porta, M. Pericyte Loss in Diabetic Retinopathy: Mechanisms and Consequences. Curr. Med. Chem. 2013, 20, 3218–3225. [Google Scholar] [CrossRef]
- Ivanova, E.; Kovacs-Oller, T.; Sagdullaev, B.T. Neurobiology of Disease Vascular Pericyte Impairment and Connexin43 Gap Junction Deficit Contribute to Vasomotor Decline in Diabetic Retinopathy. J. Neurosci. 2017, 37, 7580–7594. [Google Scholar] [CrossRef]
- Kovács-Öller, T.; Ivanova, E.; Szarka, G.; Tengölics, Á.J.; Völgyi, B.; Sagdullaev, B.T. Imatinib Sets Pericyte Mosaic in the Retina. Int. J. Mol. Sci. Artic. 2020, 21, 2522. [Google Scholar] [CrossRef]
- Kiseleva, T.N.; Chudin, A.V.; Khoroshilova-Maslova, I.P.; Shchipanova, A.I.; Maibogin, A.M.; Zaitsev, M.S. Morphological Changes in the Retina Under Conditions of Experimental In Vivo Regional Ischemia/Reperfusion. Bull. Exp. Biol. Med. 2019, 167, 287–292. [Google Scholar] [CrossRef]
- Simó, R.; Stitt, A.W.; Gardner, T.W. Neurodegeneration in Diabetic Retinopathy: Does It Really Matter? Diabetologia 2018, 16, 1902–1912. [Google Scholar] [CrossRef]
- Barber, A.J.; Gardner, T.W.; Abcouwer, S.F. The Significance of Vascular and Neural Apoptosis to the Pathology of Diabetic Retinopathy. Investig. Ophthalmol. Vis. Sci. 2011, 52, 1156–1163. [Google Scholar] [CrossRef]
- Vujosevic, S.; Midena, E. Clinical Study Retinal Layers Changes in Human Preclinical and Early Clinical Diabetic Retinopathy Support Early Retinal Neuronal and Müller Cells Alterations. J. Diabetes Res. 2013, 2013, 905058. [Google Scholar] [CrossRef]
- Kan, E.; Alici, Ö.; Kan, E.K.; Ayar, A. Effects of Alpha-Lipoic Acid on Retinal Ganglion Cells, Retinal Thicknesses, and VEGF Production in an Experimental Model of Diabetes. Int. Ophthalmol. 2017, 37, 1269–1278. [Google Scholar] [CrossRef]
- Fresta, C.G.; Fidilio, A.; Caruso, G.; Caraci, F.; Giblin, F.J.; Leggio, G.M.; Salomone, S.; Drago, F.; Bucolo, C. A New Human Blood-Retinal Barrier Model Based on Endothelial Cells, Pericytes, and Astrocytes. Int. J. Mol. Sci. 2020, 21, 1636. [Google Scholar] [CrossRef]
- Catalani, E.; Cervia, D. Diabetic Retinopathy: A Matter of Retinal Ganglion Cell Homeostasis. Neural Regen. Res. 2020, 15, 1253–1254. [Google Scholar] [CrossRef]
- Potilinski, M.C.; Lorenc, V.; Perisset, S.; Gallo, J.E. Molecular Sciences Mechanisms behind Retinal Ganglion Cell Loss in Diabetes and Therapeutic Approach. Int. J. Mol. Sci. 2020, 21, 2351. [Google Scholar] [CrossRef]
- Simão, S.; Costa, M.Â.; Sun, J.K.; Cunha-Vaz, J.; Simó, R. Development of a Normative Database for Multifocal Electroretinography in the Context of a Multicenter Clinical Trial. Ophthalmic Res. 2017, 57, 107–117. [Google Scholar] [CrossRef]
- Li, Q.; Zemel, E.; Miller, B.; Perlman, I. Early Retinal Damage in Experimental Diabetes: Electroretinographical and Morphological Observations. Exp. Eye Res. 2002, 74, 615–625. [Google Scholar] [CrossRef] [PubMed]
- Bringmann, A.; Wiedemann, P. Müller Glial Cells in Retinal Disease. Ophthalmologica 2012, 227, 1–19. [Google Scholar] [CrossRef] [PubMed]
- Gao, H.; A, L.; Huang, X.; Chen, X.; Xu, H. Müller Glia-Mediated Retinal Regeneration. Mol. Neurobiol. 2021, 58, 2342–2361. [Google Scholar] [CrossRef] [PubMed]
- Paisley, C.E.; Kay, J.N. Seeing Stars: Development and Function of Retinal Astrocytes. Dev. Biol. 2021, 478, 144–154. [Google Scholar] [CrossRef] [PubMed]
- Xia, Y.; Luo, Q.; Chen, J.; Huang, C.; Jahangir, A.; Pan, T.; Wei, X.; Liu, W.; Chen, Z. Retinal Astrocytes and Microglia Activation in Diabetic Retinopathy Rhesus Monkey Models. Curr. Eye Res. 2021, 47, 297–303. [Google Scholar] [CrossRef] [PubMed]
- Klaassen, I.; Van Noorden, C.J.F.; Schlingemann, R.O. Molecular Basis of the Inner Blood-Retinal Barrier and Its Breakdown in Diabetic Macular Edema and Other Pathological Conditions. Prog. Retin. Eye Res. 2013, 34, 19–48. [Google Scholar] [CrossRef]
- Tien, T.; Muto, T.; Barrette, K.; Challyandra, L.; Roy, S. Downregulation of Connexin 43 Promotes Vascular Cell Loss and Excess Permeability Associated with the Development of Vascular Lesions in the Diabetic Retina. Mol. Vis. 2014, 20, 741. [Google Scholar]
- Chronopoulos, A.; Tang, A.; Beglova, E.; Trackman, P.C.; Roy, S. High Glucose Increases Lysyl Oxidase Expression and Activity in Retinal Endothelial Cells: Mechanism for Compromised Extracellular Matrix Barrier Function. Diabetes 2010, 59, 3159–3166. [Google Scholar] [CrossRef]
- Kong, Y.; Naggert, J.K.; Nishina, P.M. The Impact of Adherens and Tight Junctions on Physiological Function and Pathological Changes in the Retina. Adv. Exp. Med. Biol. 2018, 1074, 545–551. [Google Scholar] [CrossRef]
- Huber, G.; Heynen, S.; Imsand, C.; vom Hagen, F.; Muehlfriedel, R.; Tanimoto, N.; Feng, Y.; Hammes, H.P.; Grimm, C.; Peichl, L.; et al. Novel Rodent Models for Macular Research. PLoS ONE 2010, 5, e13403. [Google Scholar] [CrossRef]
- Al-Awar, A.; Kupai, K.; Veszelka, M.; Szucs, G.; Attieh, Z.; Murlasits, Z.; Török, S.; Pósa, A.; Varga, C. Experimental Diabetes Mellitus in Different Animal Models. J. Diabetes Res. 2016, 2016, 9051426. [Google Scholar] [CrossRef]
- Bortell, R.; Yang, C. The BB Rat as a Model of Human Type 1 Diabetes. Anim. Model. Diabetes Res. 2012, 933, 31–44. [Google Scholar] [CrossRef]
- Lai, A.K.W.; Lo, A.C.Y. Animal Models of Diabetic Retinopathy: Summary and Comparison. J. Diabetes Res. 2013, 2013, 106594. [Google Scholar] [CrossRef]
- Srinivasan, K.; Ramarao, P. Animal Models in Type 2 Diabetes Research: An Overview—PubMed. Indian J. Med. Res. 2007, 125, 451–472. [Google Scholar]
- Goto, Y.; Kakizaki, M.; Masaki, N. Spontaneous Diabetes Produced by Selective Breeding of Normal Wistar Rats. Proc. Jpn. Acad. 1975, 51, 80–85. [Google Scholar] [CrossRef]
- Östenson, C.G.; Efendic, S. Islet Gene Expression and Function in Type 2 Diabetes; Studies in the Goto-Kakizaki Rat and Humans. Diabetes, Obes. Metab. 2007, 9, 180–186. [Google Scholar] [CrossRef]
- Sakaguchi, Y.; Inaba, M.; Tsuda, M.; Quan, G.K.; Omae, M.; Ando, Y.; Uchida, K.; Okazaki, K.; Ikehara, S. The Wistar Bonn Kobori Rat, a Unique Animal Model for Autoimmune Pancreatitis with Extrapancreatic Exocrinopathy. Clin. Exp. Immunol. 2008, 152, 12. [Google Scholar] [CrossRef]
- Moran, T.H. Unraveling the Obesity of OLETF Rats. Physiol. Behav. 2008, 94, 71–78. [Google Scholar] [CrossRef]
- Bi, S.; Moran, T.H. Obesity in the Otsuka Long Evans Tokushima Fatty Rat: Mechanisms and Discoveries. Front. Nutr. 2016, 3, 21. [Google Scholar] [CrossRef]
- Kobayashi, K.; Sasase, T.; Ishii, Y.; Katsuda, Y.; Miyajima, K.; Yamada, T.; Ohta, T. The Sphingosine-1-Phosphate Receptor Modulator, FTY720, Prevents the Incidence of Diabetes in Spontaneously Diabetic Torii Rats. Clin. Exp. Pharmacol. Physiol. 2021, 48, 869–876. [Google Scholar] [CrossRef]
- Yoon, J.W.; Jun, H.S. Viruses in Type 1 Diabetes: Brief Review. ILAR J. 2004, 45, 343–348. [Google Scholar] [CrossRef]
- Li, C.R.; Sun, S.G. VEGF Expression and Cell Apoptosis in NOD Mouse Retina. Int. J. Ophthalmol. 2010, 3, 227. [Google Scholar] [CrossRef]
- Lee, S.; Harris, N.R. Losartan and Ozagrel Reverse Retinal Arteriolar Constriction in Non-Obese Diabetic Mice. Microcirculation 2008, 15, 379–387. [Google Scholar] [CrossRef] [PubMed]
- Hu, P.; McKenzie, J.A.; Buettmann, E.G.; Migotsky, N.; Gardner, M.J.; Silva, M.J. Type 1 Diabetic Akita Mice Have Low Bone Mass and Impaired Fracture Healing. Bone 2021, 147, 115906. [Google Scholar] [CrossRef] [PubMed]
- Melmed, S.; Polonsky, K.S.; Larsen, R.; Kronenberg, H.M. Williams Textbook of Endocrinology, 13th ed.; Elsevier: London, UK, 2016. [Google Scholar]
- King, A.; Austin, A. Animal Models of Type 1 and Type 2 Diabetes Mellitus. In Animal Models for the Study of Human Disease: Second Edition; Elsevier Inc.: London, UK, 2017; pp. 245–265. ISBN 9780124158948. [Google Scholar]
- Suriano, F.; Vieira-Silva, S.; Falony, G.; Roumain, M.; Paquot, A.; Pelicaen, R.; Régnier, M.; Delzenne, N.M.; Raes, J.; Muccioli, G.G.; et al. Novel Insights into the Genetically Obese (Ob/Ob) and Diabetic (Db/Db) Mice: Two Sides of the Same Coin. Microbiome 2021, 9, 147. [Google Scholar] [CrossRef]
- Yang, Q.; Xu, Y.; Xie, P.; Cheng, H.; Song, Q.; Su, T.; Yuan, S.; Liu, Q. Retinal Neurodegeneration in Db/Db Mice at the Early Period of Diabetes. J. Ophthalmol. 2015, 2015, 757412. [Google Scholar] [CrossRef]
- Lenzen, S. The Mechanisms of Alloxan- and Streptozotocin-Induced Diabetes. Diabetologia 2008, 51, 216–226. [Google Scholar] [CrossRef]
- Wu, J.; Yan, L.J. Streptozotocin-Induced Type 1 Diabetes in Rodents as a Model for Studying Mitochondrial Mechanisms of Diabetic β Cell Glucotoxicity. Diabetes Metab. Syndr. Obes. Targets Ther. 2015, 8, 181–188. [Google Scholar] [CrossRef]
- Rodrigues, B.; Poucheret, P.; Battell, M.L.; McNeill, J.H. Streptozotocin-Induced Diabetes: Induction, Mechanism(s), and Dose Dependency. In Experimental Models of Diabetes; Routledge: Boca Raton, FL, USA; New York, NY, USA, 2018; p. 18. ISBN 9780203756386. [Google Scholar]
- Kohzaki, K.; Vingrys, A.J.; Armitage, J.A.; Bui, B.V. Electroretinography in Streptozotocin Diabetic Rats Following Acute Intraocular Pressure Elevation. Graefe. Arch. Clin. Exp. Ophthalmol. 2013, 251, 529–535. [Google Scholar] [CrossRef]
- Cruz, A.B.; Amatuzio, D.S.; Grande, F.; Hay, L.J. Effect of Intra-Arterial Insulin on Tissue Cholesterol and Fatty Acids in Alloxan-Diabetic Dogs. Circ. Res. 1961, 9, 39–43. [Google Scholar] [CrossRef]
- Pociot, F.; Lernmark, Å. Genetic Risk Factors for Type 1 Diabetes. Lancet 2016, 387, 2331–2339. [Google Scholar] [CrossRef]
- Wallis, R.H.; Wang, K.; Marandi, L.; Hsieh, E.; Ning, T.; Chao, G.Y.C.; Sarmiento, J.; Paterson, A.D.; Poussier, P. Type 1 Diabetes in the BB Rat: A Polygenic Disease. Diabetes 2009, 58, 1007–1017. [Google Scholar] [CrossRef]
- Fuks, A.; Ono, S.J.; Colle, E.; Guttmann, R. A Single Dose of the MHC-Linked Susceptibility Determinant Associated with the RT1u Haplotype Is Permissive for Insulin-Dependent Diabetes Mellitus in the BB Rat. Exp. Clin. Immunogenet. 1990, 7, 162–169. [Google Scholar]
- Colle, E. Genetic Susceptibility to the Development of Spontaneous Insulin-Dependent Diabetes Mellitus in the Rat. Clin. Immunol. Immunopathol. 1990, 57, 1–9. [Google Scholar] [CrossRef]
- Bahr, J.; Follak, N.; Klöting, N.; Wilke, B.; Haertel, B.; Klöting, I. Iddm1 and Iddm2 Homozygous WOK4BB Rats Develop Lymphopenia, but No Hyperglycemia like the BB/OK Rats. Exp. Clin. Endocrinol. Diabetes 2011, 119, 395–400. [Google Scholar] [CrossRef]
- Hillman, N.; Cox, S.; Noble, A.R.; Gallagher, P.J. Increased Numbers of Caveolae in Retinal Endothelium and Pericytes in Hypertensive Diabetic Rats. Eye 2001, 15, 319–325. [Google Scholar] [CrossRef]
- Greenwood, M.D.; Ressler, M.J.; Audette, J.L.; Laturnus, D.I.; Chhoun, R.; Teiken, J.M.; Carlson, E.C. Significant Retinal Capillary Basement Membrane Thickening in Hyperglycemic and Normoglycemic Diabetic-Prone (DP) BB Wistar Rats. Ultrastruct. Pathol. 2011, 35, 97–105. [Google Scholar] [CrossRef]
- Sima, A.A.F.; Garcia-Salinas, R.; Basu, P.K. The BB Wistar Rat: An Experimental Model for the Study of Diabetic Retinopathy. Metabolism 1983, 32, 136–140. [Google Scholar] [CrossRef]
- Robinson, W.G.; McCaleb, M.L.; Feld, L.G.; Michaelis, O.E.; And, N.L.; Mercandetti, M. Degenerated Intramural Pericytes (‘Ghost Cells’) in the Retinal Capillaries of Diabetic Rats. Curr. Eye Res. 1991, 10, 339–350. [Google Scholar] [CrossRef]
- Fitzgerald, M.E.C.; Caldwell, R.B. Lectin-Ferritin Binding on Spontaneously Diabetic and Control Rat Retinal Microvasculature. Curr. Eye Res. 1989, 8, 271–283. [Google Scholar] [CrossRef]
- Phillips, M.S.; Liu, Q.; Hammond, H.A.; Dugan, V.; Hey, P.J.; Caskey, C.T.; Hess, J.F. Leptin Receptor Missense Mutation in the Fatty Zucker Rat. Nat. Genet. 1996, 13, 18–19. [Google Scholar] [CrossRef]
- Shimabukuro, M.; Higa, M.; Zhou, Y.-T.; Wang, M.-Y.; Newgard, C.B.; Unger, R.H. Lipoapoptosis in Beta-Cells of Obese Prediabeticfa/Fa Rats. J. Biol. Chem. 1998, 273, 32487–32490. [Google Scholar] [CrossRef] [PubMed]
- Shimabukuro, M.; Zhou, Y.T.; Levi, M.; Unger, R.H. Fatty Acid-Induced β Cell Apoptosis: A Link between Obesity and Diabetes. Proc. Natl. Acad. Sci. USA 1998, 95, 2498–2502. [Google Scholar] [CrossRef] [PubMed]
- Olivares, A.M.; Althoff, K.; Chen, G.F.; Wu, S.; Morrisson, M.A.; DeAngelis, M.M.; Haider, N. Animal Models of Diabetic Retinopathy. Curr. Diabetes Rep. 2017, 17, 93. [Google Scholar] [CrossRef] [PubMed]
- Pandey, S.; Dvorakova, M.C. Future Perspective of Diabetic Animal Models. Endocr. Metab. Immune Disord.—Drug Targets 2019, 20, 25–38. [Google Scholar] [CrossRef]
- Wachal, Z.; Szilágyi, A.; Takács, B.; Mónika Szabó, A.; Priksz, D.; Bombicz, M.; Szilvássy, J.; Juhász, B.; Szilvássy, Z.; Varga, B. Improved Survival and Retinal Function of Aging ZDF Rats in Long-Term, Uncontrolled Diabetes by BGP-15 Treatment. Front. Pharmacol. 2021, 12, 650207. [Google Scholar] [CrossRef]
- Danis, R.P.; Yang, Y. Microvascular Retinopathy in the Zucker Diabetic Fatty Rat. Investig. Ophthalmol. Vis. Sci. 1993, 34, 2367–2371. [Google Scholar]
- Yang, Y.S.; Danis, R.P.; Peterson, R.G.; Dolan, P.L.; Wu, Y.Q. Acarbose Partially Inhibits Microvascular Retinopathy in the Zucker Diabetic Fatty Rat (ZDF/GmiTM-Fa). J. Ocul. Pharmacol. Ther. 2009, 16, 471–479. [Google Scholar] [CrossRef]
- Behl, Y.; Krothapalli, P.; Desta, T.; Roy, S.; Graves, D.T. FOXO1 Plays an Important Role in Enhanced Microvascular Cell Apoptosis and Microvascular Cell Loss in Type 1 and Type 2 Diabetic Rats. Diabetes 2009, 58, 917–925. [Google Scholar] [CrossRef]
- Wohlfart, P.; Lin, J.; Dietrich, N.; Kannt, A.; Elvert, R.; Herling, A.W.; Hammes, H.P. Expression Patterning Reveals Retinal Inflammation as a Minor Factor in Experimental Retinopathy of ZDF Rats. Acta Diabetol. 2014, 51, 553–558. [Google Scholar] [CrossRef]
- Kowluru, R.A.; Mishra, M.; Kowluru, A.; Kumar, B. Hyperlipidemia and the Development of Diabetic Retinopathy: Comparison between Type 1 and Type 2 Animal Models. Metabolism 2016, 65, 1570–1581. [Google Scholar] [CrossRef]
- Fernandez-Bueno, I.; Jones, R.; Soriano-Romaní, L.; Líopez-García, A.; Galvin, O.; Cheetham, S.; Diebold, Y. Histologic Characterization of Retina Neuroglia Modifications in Diabetic Zucker Diabetic Fatty Rats. Investig. Ophthalmol. Vis. Sci. 2017, 58, 4925–4933. [Google Scholar] [CrossRef]
- Szabó, K.; Énzsöly, A.; Dékány, B.; Szabó, A.; Hajdú, R.I.; Radovits, T.; Mátyás, C.; Oláh, A.; Laurik, L.K.; Somfai, G.M.; et al. Histological Evaluation of Diabetic Neurodegeneration in the Retina of Zucker Diabetic Fatty (ZDF) Rats. Sci. Rep. 2017, 7, 8891. [Google Scholar] [CrossRef]
- Movassat, J.; Saulnier, C.; Serradas, P.; Portha, B. Impaired Development of Pancreatic Beta-Cell Mass Is a Primary Event during the Progression to Diabetes in the GK Rat. Diabetologia 1997, 40, 916–925. [Google Scholar] [CrossRef]
- Picarel-Blanchot, F.; Berthelier, C.; Bailbé, D.; Portha, B. Impaired Insulin Secretion and Excessive Hepatic Glucose Production Are Both Early Events in the Diabetic GK Rat. Am. J. Physiol. Metab. 1996, 271, 755–762. [Google Scholar] [CrossRef]
- Miyamoto, K.; Ogura, Y.; Nishiwaki, H.; Matsuda, N.; Yoshihito, H.; Kato, S.; Ishida, H.; Seino, Y. Evaluation of Retinal Microcirculatory Alterations in the Goto—Kakizaki Rat: A Spontaneous Model of Non-Insulin-Dependent Diabetes. Investig. Ophthalmol. Vis. Sci. 1996, 37, 898–905. [Google Scholar]
- Carmo, A.; Cunha-Vaz, J.G.; Carvalho, A.P.; Lopes, M.C. Nitric Oxide Synthase Activity in Retinas from Non-Insulin-Dependent Diabetic Goto-Kakizaki Rats: Correlation with Blood–Retinal Barrier Permeability. Nitric Oxide 2000, 4, 590–596. [Google Scholar] [CrossRef]
- Fan, Y.; Liu, K.; Wang, Q.; Ruan, Y.; Ye, W.; Zhang, Y. Exendin-4 Alleviates Retinal Vascular Leakage by Protecting the Blood–Retinal Barrier and Reducing Retinal Vascular Permeability in Diabetic Goto-Kakizaki Rats. Exp. Eye Res. 2014, 127, 104–116. [Google Scholar] [CrossRef]
- Hachana, S.; Pouliot, M.; Couture, R.; Vaucher, E. Diabetes-Induced Inflammation and Vascular Alterations in the Goto–Kakizaki Rat Retina. Curr. Eye Res. 2020, 45, 965–974. [Google Scholar] [CrossRef]
- Gong, C.Y.; Lu, B.; Sheng, Y.C.; Yu, Z.Y.; Zhou, J.Y.; Ji, L.L. The Development of Diabetic Retinopathy in Goto-Kakizaki Rat and the Expression of Angiogenesis-Related Signals. Chin. J. Physiol. 2016, 59, 100–108. [Google Scholar] [CrossRef]
- Omri, S.; Behar-Cohen, F.; De Kozak, Y.; Sennlaub, F.; Mafra Verissimo, L.; Jonet, L.; Savoldelli, M.; Omri, B.; Crisanti, P. Microglia/Macrophages Migrate through Retinal Epithelium Barrier by a Transcellular Route in Diabetic Retinopathy: Role of PKCζ in the Goto Kakizaki Rat Model. Am. J. Pathol. 2011, 179, 942–953. [Google Scholar] [CrossRef]
- Tsuji, N.; Matsuura, T.; Ozaki, K.; Sano, T.; Narama, I. Diabetic Retinopathy and Choroidal Angiopathy in Diabetic Rats (WBN/Kob). Exp. Anim. 2009, 58, 481–487. [Google Scholar] [CrossRef] [PubMed]
- Kiyosawa, I.; Aoki, M.; Imamura, T.; Nagasawa, T.; Ito, T.; Sibata, N.; Naito, J.; Saito, T.R.; Takahashi, K.W. Age-Related Changes in the Retina of WBN/Kob Rats-a Pathological Study. Exp. Anim. 1995, 43, 651–661. [Google Scholar] [CrossRef] [PubMed]
- Mori, Y.; Yokoyama, J.; Nishimura, M.; Oka, H.; Mochio, S.; Ikeda, Y. Development of Diabetic Complications in a New Diabetic Strain of Rat (WBN/Kob). Pancreas 1992, 7, 569–577. [Google Scholar] [CrossRef] [PubMed]
- Yang, J.H.; Kwak, H.W.; Kim, T.G.; Han, J.; Moon, S.W.; Yu, S.Y. Retinal Neurodegeneration in Type II Diabetic Otsuka Long-Evans Tokushima Fatty Rats. Investig. Ophthalmol. Vis. Sci. 2013, 54, 3844–3851. [Google Scholar] [CrossRef] [PubMed]
- Baek, S.M.; Kim, K.; Kim, S.; Son, Y.; Hong, H.S.; Yu, S.Y. SP Prevents T2DM Complications by Immunomodulation. Sci. Rep. 2020, 10, 16753. [Google Scholar] [CrossRef]
- Jin, C.J.; Yu, S.H.; Wang, X.M.; Woo, S.J.; Park, H.J.; Lee, H.C.; Choi, S.H.; Kim, K.M.; Kim, J.H.; Park, K.S.; et al. The Effect of Lithospermic Acid, an Antioxidant, on Development of Diabetic Retinopathy in Spontaneously Obese Diabetic Rats. PLoS ONE 2014, 9, e98232. [Google Scholar] [CrossRef]
- Lu, Z.Y.; Bhutto, I.A.; Amemiya, T. Retinal Changes in Otsuka Long-Evans Tokushima Fatty Rats (Spontaneously Diabetic Rat)—Possibility of a New Experimental Model for Diabetic Retinopathy. Jpn. J. Ophthalmol. 2003, 47, 28–35. [Google Scholar] [CrossRef]
- Segawa, Y.; Shirao, Y.; Yamagishi, S.I.; Higashide, T.; Kobayashi, M.; Katsuno, K.; Iyobe, A.; Harada, H.; Sato, F.; Miyata, H.; et al. Upregulation of Retinal Vascular Endothelial Growth Factor MRNAs in Spontaneously Diabetic Rats without Ophthalmoscopic Retinopathy. Ophthalmic Res. 1998, 30, 333–339. [Google Scholar] [CrossRef]
- Matsuura, T.; Yamagishi, S.; Kodama, Y.; Shibata, R.; Ueda, S.; Narama, I. Otsuka Long-Evans Tokushima Fatty (OLETF) Rat Is Not a Suitable Animal Model for the Study of Angiopathic Diabetic Retinopathy—PubMed. Int. J. Tissue React. 2005, 27, 59–62. [Google Scholar]
- Hotta, N.; Nakamura, J.; Sakakibara, F.; Hamada, Y.; Kara, T.; Mori, K.; Nakashima, E.; Sasaki, H.; Kasama, N.; Inukai, S.; et al. Electroretinogram in Sucrose-Fed Diabetic Rats Treated with an Aldose Reductase Inhibitor or an Anticoagulant. Am. J. Physiol. Endocrinol. Metab. 1997, 273, E965–E971. [Google Scholar] [CrossRef]
- Sasase, T. Pathophysiological Characteristics of Diabetic Ocular Complications in Spontaneously Diabetic Torii Rat. J. Ophthalmol. 2010, 2010, 615641. [Google Scholar] [CrossRef]
- Kakehashi, A.; Saito, Y.; Mori, K.; Sugi, N.; Ono, R.; Yamagami, H.; Shinohara, M.; Tamemoto, H.; Ishikawa, S.E.; Kawakami, M.; et al. Characteristics of Diabetic Retinopathy in SDT Rats. Diabetes Metab. Res. Rev. 2006, 22, 455–461. [Google Scholar] [CrossRef]
- Okuno, T.; Oku, H.; Sugiyama, T.; Ikeda, T. Electroretinographic Study of Spontaneously Diabetic Torii Rats. Doc. Ophthalmol. 2008, 117, 191–196. [Google Scholar] [CrossRef]
- Singal, D.P.; Blajchman, M.A. Histocompatibility (HL-A) Antigens, Lymphocytotoxic Antibodies and Tissue Antibodies in Patients with Diabetes Mellitus. Diabetes 1973, 22, 429–432. [Google Scholar] [CrossRef]
- Nerup, J.; Platz, P.; Andersen, O.O.; Christy, M.; Lyngsøe, J.; Poulsen, J.E.; Ryder, L.P.; Thomsen, M.; Nielsen, L.S.; Svejgaard, A. HL-A Antigens and Diabetes Mellitus. Lancet 1974, 2, 864–866. [Google Scholar] [CrossRef]
- Noble, J.A.; Erlich, H.A. Genetics of Type 1 Diabetes. Cold Spring Harb. Perspect. Med. 2012, 2, a007732. [Google Scholar] [CrossRef] [PubMed]
- von Herrath, M.; Filippi, C.; Coppieters, K. How Viral Infections Enhance or Prevent Type 1 Diabetes-from Mouse to Man. J. Med. Virol. 2011, 83, 1672. [Google Scholar] [CrossRef]
- Makino, S.; Kunimoto, K.; Muraoka, Y.; Mizushima, Y.; Katagiri, K.; Tochino, Y. Breeding of a Non-Obese, Diabetic Strain of Mice. Jikken Dobutsu. 1980, 29, 1–13. [Google Scholar] [CrossRef]
- Mugisho, O.O.; Rupenthal, I.D.; Squirrell, D.M.; Bould, S.J.; Danesh-Meyer, H.V.; Zhang, J.; Green, C.R.; Acosta, M.L. Intravitreal Pro-Inflammatory Cytokines in Non-Obese Diabetic Mice: Modelling Signs of Diabetic Retinopathy. PLoS ONE 2018, 13, e0202156. [Google Scholar] [CrossRef]
- Mugisho, O.O.; Green, C.R.; Squirrell, D.M.; Bould, S.; Danesh-Meyer, H.V.; Zhang, J.; Acosta, M.L.; Rupenthal, I.D. Connexin43 Hemichannel Block Protects against the Development of Diabetic Retinopathy Signs in a Mouse Model of the Disease. J. Mol. Med. 2019, 97, 215–229. [Google Scholar] [CrossRef]
- Shaw, S.G.; Boden, J.P.; Biecker, E.; Reichen, J.; Rothen, B. Endothelin Antagonism Prevents Diabetic Retinopathy in NOD Mice: A Potential Role of the Angiogenic Factor Adrenomedullin. Exp. Biol. Med. 2017, 231, 1101–1105. [Google Scholar] [CrossRef]
- Zorrilla-Zubilete, M.A.; Yeste, A.; Quintana, F.J.; Toiber, D.; Mostoslavsky, R.; Silberman, D.M. Epigenetic Control of Early Neurodegenerative Events in Diabetic Retinopathy by the Histone Deacetylase SIRT6. J. Neurochem. 2018, 144, 128–138. [Google Scholar] [CrossRef] [PubMed]
- Silberman, D.M.; Ross, K.; Sande, P.H.; Kubota, S.; Ramaswamy, S.; Apte, R.S.; Mostoslavsky, R. SIRT6 Is Required for Normal Retinal Function. PLoS ONE 2014, 9, e98831. [Google Scholar] [CrossRef] [PubMed]
- Wright, W.S.; Singh Yadav, A.; McElhatten, R.M.; Harris, N.R. Retinal Blood Flow Abnormalities following Six Months of Hyperglycemia in the Ins2(Akita) Mouse. Exp. Eye Res. 2012, 98, 9–15. [Google Scholar] [CrossRef] [PubMed]
- Han, Z.; Guo, J.; Conley, S.M.; Naash, M.I. Retinal Angiogenesis in the Ins2Akita Mouse Model of Diabetic Retinopathy. Investig. Ophthalmol. Vis. Sci. 2013, 54, 574–584. [Google Scholar] [CrossRef]
- Araújo, R.S.; Silva, M.S.; Santos, D.F.; Silva, G.A. Dysregulation of Trophic Factors Contributes to Diabetic Retinopathy in the Ins2Akita Mouse. Exp. Eye Res. 2020, 194, 108027. [Google Scholar] [CrossRef]
- Gastinger, M.J.; Kunselman, A.R.; Conboy, E.E.; Bronson, S.K.; Barber, A.J. Dendrite Remodeling and Other Abnormalities in the Retinal Ganglion Cells of Ins2Akita Diabetic Mice. Investig. Ophthalmol. Vis. Sci. 2008, 49, 2635–2642. [Google Scholar] [CrossRef]
- Kitada, M.; Ogura, Y.; Koya, D. Rodent Models of Diabetic Nephropathy: Their Utility and Limitations. Int. J. Nephrol. Renovasc. Dis. 2016, 9, 279–290. [Google Scholar] [CrossRef]
- Ning, X.; Baoyu, Q.; Yuzhen, L.; Shuli, S.; Reed, E.; Li, Q.Q. Neuro-Optic Cell Apoptosis and Microangiopathy in KKAY Mouse Retina. Int. J. Mol. Med. 2004, 13, 87–92. [Google Scholar] [CrossRef]
- Cheng, Y.; Yu, X.; Zhang, J.; Chang, Y.; Xue, M.; Li, X.; Lu, Y.; Li, T.; Meng, Z.; Su, L.; et al. Pancreatic Kallikrein Protects against Diabetic Retinopathy in KK Cg-A y /J and High-Fat Diet/Streptozotocin-Induced Mouse Models of Type 2 Diabetes. Diabetologia 2019, 62, 1074–1086. [Google Scholar] [CrossRef]
- Takahashi, E.; Okumura, A.; Unoki-Kubota, H.; Hirano, H.; Kasuga, M.; Kaburagi, Y. Differential Proteome Analysis of Serum Proteins Associated with the Development of Type 2 Diabetes Mellitus in the KK-A(y) Mouse Model Using the ITRAQ Technique. J. Proteomics 2013, 84, 40–51. [Google Scholar] [CrossRef]
- Midena, E.; Segato, T.; Radin, S.; Di Giorgio, G.; Meneghini, F.; Piermarocchi, S.; Belloni, A.S. Studies on the Retina of the Diabetic Db/Db Mouse. Ophthalmic Res. 1989, 21, 106–111. [Google Scholar] [CrossRef]
- Tadayoni, R.; Paques, M.; Gaudric, A.; Vicaut, E. Erythrocyte and Leukocyte Dynamics in the Retinal Capillaries of Diabetic Mice. Exp. Eye Res. 2003, 77, 497–504. [Google Scholar] [CrossRef]
- Cheung, A.K.H.; Fung, M.K.L.; Lo, A.C.Y.; Lam, T.T.L.; Kwok, F.S.; Chung, S.S.M.; Chung, S.K. Aldose Reductase Deficiency Prevents Diabetes-Induced Blood-Retinal Barrier Breakdown, Apoptosis, and Glial Reactivation in the Retina of Db/Db Mice. Diabetes 2005, 54, 3119–3125. [Google Scholar] [CrossRef]
- Tang, L.; Zhang, Y.; Jiang, Y.; Willard, L.; Ortiz, E.; Wark, L.; Medeiros, D.; Lin, D. Dietary Wolfberry Ameliorates Retinal Structure Abnormalities in Db/Db Mice at the Early Stage of Diabetes. Exp. Biol. Med. 2011, 236, 1051–1063. [Google Scholar] [CrossRef]
- Bogdanov, P.; Corraliza, L.; Villena, J.A.; Carvalho, A.R.; Garcia-Arumí, J.; Ramos, D.; Ruberte, J.; Simó, R.; Hernández, C. The Db/Db Mouse: A Useful Model for the Study of Diabetic Retinal Neurodegeneration. PLoS ONE 2014, 9, e97302. [Google Scholar] [CrossRef]
- Vancura, P.; Oebel, L.; Spohn, S.; Frederiksen, U.; Schäfer, K.; Sticht, C.; Spessert, R. Evidence for a Dysfunction and Disease-Promoting Role of the Circadian Clock in the Diabetic Retina. Exp. Eye Res. 2021, 211, 108751. [Google Scholar] [CrossRef]
- Schein, P.S.; Cooney, D.A.; Vernon, M.L. The Use of Nicotinamide to Modify the Toxicity of Streptozotocin Diabetes without Loss of Antitumor Activity. Cancer Res. 1967, 27, 2324–2332. [Google Scholar]
- Muranaka, K.; Yanagi, Y.; Tamaki, Y.; Usui, T.; Kubota, N.; Iriyama, A.; Terauchi, Y.; Kadowaki, T.; Araie, M. Effects of Peroxisome Proliferator-Activated Receptor γ and Its Ligand on Blood–Retinal Barrier in a Streptozotocin-Induced Diabetic Model. Investig. Ophthalmol. Vis. Sci. 2006, 47, 4547–4552. [Google Scholar] [CrossRef]
- Wei, M.; Ong, L.; Smith, M.T.; Ross, F.B.; Schmid, K.; Hoey, A.J.; Burstow, D.; Brown, L. The Streptozotocin-Diabetic Rat as a Model of the Chronic Complications of Human Diabetes. Heart. Lung Circ. 2003, 12, 44–50. [Google Scholar] [CrossRef]
- Saadane, A.; Lessieur, E.M.; Du, Y.; Liu, H.; Kern, T.S. Successful Induction of Diabetes in Mice Demonstrates No Gender Difference in Development of Early Diabetic Retinopathy. PLoS ONE 2020, 15, e0238727. [Google Scholar] [CrossRef] [PubMed]
- Liu, G.; Chen, L.; Cai, Q.; Wu, H.; Chen, Z.; Zhang, X.; Lu, P. Streptozotocin-Induced Diabetic Mice Exhibit Reduced Experimental Choroidal Neovascularization but Not Corneal Neovascularization. Mol. Med. Rep. 2018, 18, 4388–4398. [Google Scholar] [CrossRef] [PubMed]
- Rojas, D.R.; Tegeder, I.; Kuner, R.; Agarwal, N. Hypoxia-Inducible Factor 1α Protects Peripheral Sensory Neurons from Diabetic Peripheral Neuropathy by Suppressing Accumulation of Reactive Oxygen Species. J. Mol. Med. 2018, 96, 1395–1405. [Google Scholar] [CrossRef]
- Rojas, D.R.; Kuner, R.; Agarwal, N. Metabolomic Signature of Type 1 Diabetes-Induced Sensory Loss and Nerve Damage in Diabetic Neuropathy. J. Mol. Med. 2019, 97, 845–854. [Google Scholar] [CrossRef] [PubMed]
- Robinson, R.; Srinivasan, M.; Shanmugam, A.; Ward, A.; Ganapathy, V.; Bloom, J.; Sharma, A.; Sharma, S. Interleukin-6 Trans-Signaling Inhibition Prevents Oxidative Stress in a Mouse Model of Early Diabetic Retinopathy. Redox Biol. 2020, 34, 101574. [Google Scholar] [CrossRef]
- Cui, R.Z.; Wang, L.; Qiao, S.N.; Wang, Y.C.; Wang, X.; Yuan, F.; Weng, S.J.; Yang, X.L.; Zhong, Y.M. ON-Type Retinal Ganglion Cells Are Preferentially Affected in STZ-Induced Diabetic Mice. Investig. Ophthalmol. Vis. Sci. 2019, 60, 1644–1656. [Google Scholar] [CrossRef]
- Li, W.; Yao, M.; Wang, R.; Shi, Y.; Hou, L.; Hou, Z.; Lian, K.; Zhang, N.; Wang, Y.; Li, W.; et al. Profile of Cardiac Lipid Metabolism in STZ-Induced Diabetic Mice. Lipids Health Dis. 2018, 17, 231. [Google Scholar] [CrossRef]
- Yuan, Y.; Chen, Y.; Peng, T.; Li, L.; Zhu, W.; Liu, F.; Liu, S.; An, X.; Luo, R.; Cheng, J.; et al. Mitochondrial ROS-Induced Lysosomal Dysfunction Impairs Autophagic Flux and Contributes to M1 Macrophage Polarization in a Diabetic Condition. Clin. Sci. 2019, 133, 1759–1777. [Google Scholar] [CrossRef]
- Przygodzki, T.; Kassassir, H.; Talar, M.; Siewiera, K.; Watala, C. Effects of Three-Month Streptozotocin-Induced Diabetes in Mice on Blood Platelet Reactivity, COX-1 Expression and Adhesion Potential. Int. J. Exp. Pathol. 2019, 100, 48. [Google Scholar] [CrossRef]
- Zhou, W.; Ye, S. Rapamycin Improves Insulin Resistance and Hepatic Steatosis in Type 2 Diabetes Rats through Activation of Autophagy. Cell Biol. Int. 2018, 42, 1282–1291. [Google Scholar] [CrossRef]
- Wang-Fischer, Y.; Garyantes, T. Improving the Reliability and Utility of Streptozotocin-Induced Rat Diabetic Model. J. Diabetes Res. 2018, 2018, 8054073. [Google Scholar] [CrossRef]
- D’Amico, A.G.; Maugeri, G.; Rasà, D.M.; Bucolo, C.; Saccone, S.; Federico, C.; Cavallaro, S.; D’Agata, V. Modulation of IL-1β and VEGF Expression in Rat Diabetic Retinopathy after PACAP Administration. Peptides 2017, 97, 64–69. [Google Scholar] [CrossRef]
- Huang, C.; Zhu, H.J.; Li, H.; Li, Q.X.; Li, F.M.; Cheng, L.; Liu, Y.G. P38-MAPK Pathway Is Activated in Retinopathy of Microvascular Disease of STZ-Induced Diabetic Rat Model. Eur. Rev. Med. Pharmacol. Sci. 2018, 22, 5789–5796. [Google Scholar] [CrossRef]
- Fathalipour, M.; Eghtedari, M.; Borges, F.; Silva, T.; Moosavi, F.; Firuzi, O.; Mirkhani, H. Caffeic Acid Alkyl Amide Derivatives Ameliorate Oxidative Stress and Modulate ERK1/2 and AKT Signaling Pathways in a Rat Model of Diabetic Retinopathy. Chem. Biodivers. 2019, 16, e1900405. [Google Scholar] [CrossRef]
- Naderi, A.; Zahed, R.; Aghajanpour, L.; Amoli, F.A.; Lashay, A. Long Term Features of Diabetic Retinopathy in Streptozotocin-Induced Diabetic Wistar Rats. Exp. Eye Res. 2019, 184, 213–220. [Google Scholar] [CrossRef]
- Qin, Y.; Xu, G.; Wang, W. Dendritic Abnormalities in Retinal Ganglion Cells of Three-Month Diabetic Rats. Curr. Eye Res. 2006, 31, 967–974. [Google Scholar] [CrossRef]
- Aghanoori, M.R.; Smith, D.R.; Shariati-Ievari, S.; Ajisebutu, A.; Nguyen, A.; Desmond, F.; Jesus, C.H.A.; Zhou, X.; Calcutt, N.A.; Aliani, M.; et al. Insulin-Like Growth Factor-1 Activates AMPK to Augment Mitochondrial Function and Correct Neuronal Metabolism in Sensory Neurons in Type 1 Diabetes. Mol. Metab. 2019, 20, 165. [Google Scholar] [CrossRef]
- Karganov, M.Y.; Alchinova, I.B.; Tinkov, A.A.; Medvedeva, Y.S.; Lebedeva, M.A.; Ajsuvakova, O.P.; Polyakova, M.V.; Skalnaya, M.G.; Burtseva, T.I.; Notova, S.V.; et al. Streptozotocin (STZ)-Induced Diabetes Affects Tissue Trace Element Content in Rats in a Dose-Dependent Manner. Biol. Trace Elem. Res. 2020, 198, 567–574. [Google Scholar] [CrossRef]
- Othman, M.S.; Hafez, M.M.; Abdel Moneim, A.E. The Potential Role of Zinc Oxide Nanoparticles in MicroRNAs Dysregulation in STZ-Induced Type 2 Diabetes in Rats. Biol. Trace Elem. Res. 2020, 197, 606–618. [Google Scholar] [CrossRef]
- Vines, K.; Li, R.; Geetha, T.; Broderick, T.L.; Carroll, C.C.; Babu, J.R. Nerve Growth Factor Receptor TrkA Signaling in Streptozotocin-Induced Type 1 Diabetes Rat Brain. Biochem. Biophys. Res. Commun. 2019, 514, 1285–1289. [Google Scholar] [CrossRef]
- Francelin, C.; Geniseli, I.; Nagib, P.; Gameiro, J.; Savino, W.; Verinaud, L. Semaphorin-3A-Related Reduction of Thymocyte Migration in Chemically Induced Diabetic Mice. Neuroimmunomodulation 2020, 27, 28–37. [Google Scholar] [CrossRef] [PubMed]
- Ramakrishnan, A.M.; Kumar, P.; Chatterjee, S.; Sankaranarayanan, K. Differential Expression of CRAC Channel in Alloxan Induced Diabetic BALB/c Mice. Immunopharmacol. Immunotoxicol. 2020, 42, 48–55. [Google Scholar] [CrossRef] [PubMed]
- Min, A.Y.; Yoo, J.M.; Sok, D.E.; Kim, M.R. Mulberry Fruit Prevents Diabetes and Diabetic Dementia by Regulation of Blood Glucose through Upregulation of Antioxidative Activities and CREB/BDNF Pathway in Alloxan-Induced Diabetic Mice. Oxid. Med. Cell Longev. 2020, 2020, 1298691. [Google Scholar] [CrossRef] [PubMed]
- Lee, H.; Lim, Y. Gamma-Tocopherol Ameliorates Hyperglycemia-Induced Hepatic Inflammation Associated with NLRP3 Inflammasome in Alloxan-Induced Diabetic Mice. Nutr. Res. Pract. 2019, 13, 377–383. [Google Scholar] [CrossRef]
- Mohammad, H.M.F.; Sami, M.M.; Makary, S.; Toraih, E.A.; Mohamed, A.O.; El-Ghaiesh, S.H. Neuroprotective Effect of Levetiracetam in Mouse Diabetic Retinopathy: Effect on Glucose Transporter-1 and GAP43 Expression. Life Sci. 2019, 232, 116588. [Google Scholar] [CrossRef] [PubMed]
- Dra, L.A.; Sellami, S.; Rais, H.; Aziz, F.; Aghraz, A.; Bekkouche, K.; Markouk, M.; Larhsini, M. Antidiabetic Potential of Caralluma Europaea against Alloxan-Induced Diabetes in Mice. Saudi J. Biol. Sci. 2019, 26, 1178. [Google Scholar] [CrossRef]
- Ahiskali, I.; Pinar, C.L.; Kiki, M.; Mammadov, R.; Ozbek Bilgin, A.; Hacimuftuoglu, A.; Cankaya, M.; Keskin Cimen, F.; Altuner, D. Effect of Taxifolin on Development of Retinopathy in Alloxan-Induced Diabetic Rats. Cutan. Ocul. Toxicol. 2019, 38, 227–232. [Google Scholar] [CrossRef]
- Icel, E.; Icel, A.; Uçak, T.; Karakurt, Y.; Elpeze, B.; Keskin Çimen, F.; Süleyman, H. The Effects of Lycopene on Alloxan Induced Diabetic Optic Neuropathy. Cutan. Ocul. Toxicol. 2019, 38, 88–92. [Google Scholar] [CrossRef]
- Ganesan, D.; Albert, A.; Paul, E.; Ananthapadmanabhan, K.; Andiappan, R.; Sadasivam, S.G. Rutin Ameliorates Metabolic Acidosis and Fibrosis in Alloxan Induced Diabetic Nephropathy and Cardiomyopathy in Experimental Rats. Mol. Cell Biochem. 2020, 471, 41–50. [Google Scholar] [CrossRef]
- Dandare, S.U.; Ezeonwumelu, I.J.; Shinkafi, T.S.; Magaji, U.F.; Adio, A.A.I.; Ahmad, K. L-Alanine Supplementation Improves Blood Glucose Level and Biochemical Indices in Alloxan-Induced Diabetic Rats. J. Food Biochem. 2021, 45, e13590. [Google Scholar] [CrossRef]
- Titova, A.A.; Mavlikeev, M.O.; Kaligin, M.S.; Suleymanova, D.M.; Chekmaryeva, I.A.; Kiyasov, A.P.; Deev, R.V. Early Ultra- and Microstructural Alterations in Rat Pancreas in Alloxan-Induced Diabetes Mellitus. Ultrastruct. Pathol. 2020, 44, 61–70. [Google Scholar] [CrossRef]
- Danilova, I.; Medvedeva, S.; Shmakova, S.; Chereshneva, M.; Sarapultsev, A.; Sarapultsev, P. Pathological Changes in the Cellular Structures of Retina and Choroidea in the Early Stages of Alloxan-Induced Diabetes. World J. Diabetes 2018, 9, 251. [Google Scholar] [CrossRef]
- Wilson, G.L.; Hartig, P.C.; Patton, N.J.; LeDoux, S.P. Mechanisms of Nitrosourea-Induced Beta-Cell Damage. Activation of Poly (ADP-Ribose) Synthetase and Cellular Distribution. Diabetes 1988, 37, 213–216. [Google Scholar] [CrossRef]
- Wilson, G.L.; Leiter, E.H. Streptozotocin Interactions with Pancreatic Beta Cells and the Induction of Insulin-Dependent Diabetes. Curr. Top. Microbiol. Immunol. 1990, 156, 27–54. [Google Scholar] [CrossRef]
- Armann, B.; Hanson, M.S.; Hatch, E.; Steffen, A.; Fernandez, L.A. Quantification of Basal and Stimulated ROS Levels as Predictors of Islet Potency and Function. Am. J. Transplant. 2007, 7, 38–47. [Google Scholar] [CrossRef]
- Coskun, O.; Kanter, M.; Korkmaz, A.; Oter, S. Quercetin, a Flavonoid Antioxidant, Prevents and Protects Streptozotocin-Induced Oxidative Stress and β-Cell Damage in Rat Pancreas. Pharmacol. Res. 2005, 51, 117–123. [Google Scholar] [CrossRef]
- Munday, R. Dialuric Acid Autoxidation. Effects of Transition Metals on the Reaction Rate and on the Generation of “Active Oxygen” Species. Biochem. Pharmacol. 1988, 37, 409–413. [Google Scholar] [CrossRef]
- Sohn, E.H.; Van Dijk, H.W.; Jiao, C.; Kok, P.H.B.; Jeong, W.; Demirkaya, N.; Garmager, A.; Wit, F.; Kucukevcilioglu, M.; Van Velthoven, M.E.J.; et al. Retinal Neurodegeneration May Precede Microvascular Changes Characteristic of Diabetic Retinopathy in Diabetes Mellitus. Proc. Natl. Acad. Sci. USA 2016, 113, E2655–E2664. [Google Scholar] [CrossRef]
- Yang, Y.; Mao, D.; Chen, X.; Zhao, L.; Tian, Q.; Liu, C.; Zhou, B.L.S. Decrease in Retinal Neuronal Cells in Streptozotocin-Induced Diabetic Mice. Mol. Vis. 2012, 18, 1420. [Google Scholar]
- Feit-Leichman, R.A.; Kinouchi, R.; Takeda, M.; Fan, Z.; Mohr, S.; Kern, T.S.; Chen, D.F. Vascular Damage in a Mouse Model of Diabetic Retinopathy: Relation to Neuronal and Glial Changes. Investig. Ophthalmol. Vis. Sci. 2005, 46, 4281–4287. [Google Scholar] [CrossRef]
- Howell, S.J.; Mekhail, M.N.; Azem, R.; Ward, N.L.; Kern, T.S. Degeneration of Retinal Ganglion Cells in Diabetic Dogs and Mice: Relationship to Glycemic Control and Retinal Capillary Degeneration. Mol. Vis. 2013, 19, 1421. [Google Scholar]
- Kumar, S.; Zhuo, L. Longitudinal in Vivo Imaging of Retinal Gliosis in a Diabetic Mouse Model. Exp. Eye Res. 2010, 91, 530–536. [Google Scholar] [CrossRef] [PubMed]
- Sasaki, M.; Ozawa, Y.; Kurihara, T.; Kubota, S.; Yuki, K.; Noda, K.; Kobayashi, S.; Ishida, S.; Tsubota, K. Neurodegenerative Influence of Oxidative Stress in the Retina of a Murine Model of Diabetes. Diabetologia 2010, 53, 971–979. [Google Scholar] [CrossRef] [PubMed]
- Zheng, L.; Du, Y.; Miller, C.; Gubitosi-Klug, R.A.; Kern, T.S.; Ball, S.; Berkowitz, B.A. Critical Role of Inducible Nitric Oxide Synthase in Degeneration of Retinal Capillaries in Mice with Streptozotocin-Induced Diabetes. Diabetologia 2007, 50, 1987–1996. [Google Scholar] [CrossRef] [PubMed]
- Joussen, A.M.; Poulaki, V.; Le, M.L.; Koizumi, K.; Esser, C.; Janicki, H.; Schraermeyer, U.; Kociok, N.; Fauser, S.; Kirchhof, B.; et al. A Central Role for Inflammation in the Pathogenesis of Diabetic Retinopathy. FASEB J. 2004, 18, 1450–1452. [Google Scholar] [CrossRef]
- Kuiper, E.J.; Van Zijderveld, R.; Roestenberg, P.; Lyons, K.M.; Goldschmeding, R.; Klaassen, I.; Van Noorden, C.J.F.; Schlingemann, R.O. Connective Tissue Growth Factor Is Necessary for Retinal Capillary Basal Lamina Thickening in Diabetic Mice. J. Histochem. Cytochem. 2008, 56, 792. [Google Scholar] [CrossRef]
- Seo, E.J.; Choi, J.A.; Koh, J.Y.; Yoon, Y.H. Aflibercept Ameliorates Retinal Pericyte Loss and Restores Perfusion in Streptozotocin-Induced Diabetic Mice. BMJ Open Diabetes Res. Care 2020, 8, e001278. [Google Scholar] [CrossRef]
- Gastinger, M.J.; Singh, R.S.J.; Barber, A.J. Loss of Cholinergic and Dopaminergic Amacrine Cells in Streptozotocin-Diabetic Rat and Ins2Akita-Diabetic Mouse Retinas. Investig. Ophthalmol. Vis. Sci. 2006, 47, 3143–3150. [Google Scholar] [CrossRef]
- Kohzaki, K.; Vingrys, A.J.; Bui, B.V. Early Inner Retinal Dysfunction in Streptozotocin-Induced Diabetic Rats. Investig. Ophthalmol. Vis. Sci. 2008, 49, 3595–3604. [Google Scholar] [CrossRef]
- Ighodaro, O.M.; Adeosun, A.M.; Akinloye, O.A. Alloxan-Induced Diabetes, a Common Model for Evaluating the Glycemic-Control Potential of Therapeutic Compounds and Plants Extracts in Experimental Studies. Medicina 2017, 53, 365–374. [Google Scholar] [CrossRef]
- Malaisse, W.J.; Doherty, M.; Ladrière, L.; Malaisse-Lagae, F. Pancreatic Uptake of [2-(14)C] Alloxan. Int. J. Mol. Med. 2001, 7, 311–315. [Google Scholar] [CrossRef]
- Elsner, M.; Hashimoto, H.; Nilsson, T. Cisternal Maturation and Vesicle Transport: Join the Band Wagon! (Review). Mol. Membr. Biol. 2003, 20, 221–229. [Google Scholar] [CrossRef]
- Elsner, M.; Tiedge, M.; Lenzen, S. Mechanism Underlying Resistance of Human Pancreatic Beta Cells against Toxicity of Streptozotocin and Alloxan. Diabetologia 2003, 46, 1713–1714. [Google Scholar] [CrossRef]
- Goldner, M.G.; Gomori, G. Studies on the Mechanism of Alloxan Diabetes. Endocrinology 1944, 35, 241–248. [Google Scholar] [CrossRef]
- Federiuk, I.F.; Casey, H.M.; Quinn, M.J.; Wood, M.D.; Ward, K.W. Induction of Type-1 Diabetes Mellitus in Laboratory Rats by Use of Alloxan: Route of Administration, Pitfalls, and Insulin Treatment. Comp. Med. 2004, 54, 252–257. [Google Scholar]
- Dunn, J.S.; McLetchie, N.G. Experimental Alloxan Diabetes in the Rat. Lancet 1943. Lancet 1943, 242, 384–387. [Google Scholar] [CrossRef]
- Jörns, A.; Munday, R.; Tiedge, M.; Lenzen, S. Comparative Toxicity of Alloxan, N-Alkylalloxans and Ninhydrin to Isolated Pancreatic Islets In Vitro. J. Endocrinol. 1997, 155, 283–293. [Google Scholar] [CrossRef]
- Lazarow, A.; Patterson, J.W. The Mechanism of Cysteine and Glutathione Protection against Alloxan Diabetes. Science 1948, 108, 308–309. [Google Scholar] [CrossRef]
- Sen, P.B.; Bhattacharya, G. Reversal of the Diabetogenic Action of Alloxan by Sulfhydryl Compounds. Science 1952, 115, 41–43. [Google Scholar] [CrossRef]
- Lenzen, S.; Panten, U. Alloxan: History and Mechanism of Action. Diabetologia 1988, 31, 337–342. [Google Scholar] [CrossRef]
- Jain, D.K.; Arya, R.K. Anomalies in Alloxan-Induced Diabetic Model: It Is Better to Standardize It First. Indian J. Pharmacol. 2011, 43, 91. [Google Scholar] [CrossRef] [PubMed]
- Gaucher, D.; Chiappore, J.A.; Pâques, M.; Simonutti, M.; Boitard, C.; Sahel, J.A.; Massin, P.; Picaud, S. Microglial Changes Occur without Neural Cell Death in Diabetic Retinopathy. Vis. Res. 2007, 47, 612–623. [Google Scholar] [CrossRef] [PubMed]
- Kowluru, R.A.; Tang, J.; Kern, T.S. Abnormalities of Retinal Metabolism in Diabetes and Experimental Galactosemia. VII. Effect of Long-Term Administration of Antioxidants on the Development of Retinopathy. Diabetes 2001, 50, 1938–1942. [Google Scholar] [CrossRef]
- Helfenstein, T.; Fonseca, F.A.; Ihara, S.S.; Bottós, J.M.; Moreira, F.T.; Pott, H.; Farah, M.E.; Martins, M.C.; Izar, M.C. Impaired Glucose Tolerance plus Hyperlipidaemia Induced by Diet Promotes Retina Microaneurysms in New Zealand Rabbits. Int. J. Exp. Pathol. 2011, 92, 40–49. [Google Scholar] [CrossRef] [PubMed]
- Millán, I.; Desco, M.D.C.; Torres-Cuevas, I.; Pérez, S.; Pulido, I.; Mena-Mollá, S.; Mataix, J.; Asensi, M.; Ortega, Á.L. Pterostilbene Prevents Early Diabetic Retinopathy Alterations in a Rabbit Experimental Model. Nutrients 2019, 12, 82. [Google Scholar] [CrossRef] [PubMed]
- Kador, P.F.; Blessing, K.; Randazzo, J.; Makita, J.; Wyman, M. Evaluation of the Vascular Targeting Agent Combretastatin A-4 Prodrug on Retinal Neovascularization in the Galactose-Fed Dog. J. Ocul. Pharmacol. Ther. 2007, 23, 132–142. [Google Scholar] [CrossRef]
- Kador, P.F.; Takahashi, Y.; Akagi, Y.; Blessing, K.; Randazzo, J.; Wyman, M. Age-Dependent Retinal Capillary Pericyte Degeneration in Galactose-Fed Dogs. J. Ocul. Pharmacol. Ther. 2007, 23, 63–69. [Google Scholar] [CrossRef]
- Freedman, S.F.; Hatchell, D.L. Enhanced Superoxide Radical Production by Stimulated Polymorphonuclear Leukocytes in a Cat Model of Diabetes. Exp. Eye Res. 1992, 55, 767–773. [Google Scholar] [CrossRef]
- Kleinwort, K.J.H.; Amann, B.; Hauck, S.M.; Hirmer, S.; Blutke, A.; Renner, S.; Uhl, P.B.; Lutterberg, K.; Sekundo, W.; Wolf, E.; et al. Retinopathy with Central Oedema in an INS C94Y Transgenic Pig Model of Long-Term Diabetes. Diabetologia 2017, 60, 1541–1549. [Google Scholar] [CrossRef]
- Renner, S.; Blutke, A.; Clauss, S.; Deeg, C.A.; Kemter, E.; Merkus, D.; Wanke, R.; Wolf, E. Porcine Models for Studying Complications and Organ Crosstalk in Diabetes Mellitus. Cell Tissue Res. 2020, 380, 341–378. [Google Scholar] [CrossRef]
- Kim, S.Y.; Johnson, M.A.; McLeod, D.S.; Alexander, T.; Otsuji, T.; Steidl, S.M.; Hansen, B.C.; Lutty, G.A. Retinopathy in Monkeys with Spontaneous Type 2 Diabetes. Investig. Ophthalmol. Vis. Sci. 2004, 45, 4543–4553. [Google Scholar] [CrossRef]
- Johnson, M.A.; Lutty, G.A.; McLeod, D.S.; Otsuji, T.; Flower, R.W.; Sandagar, G.; Alexander, T.; Steidl, S.M.; Hansen, B.C. Ocular Structure and Function in an Aged Monkey with Spontaneous Diabetes Mellitus. Exp. Eye Res. 2005, 80, 37–42. [Google Scholar] [CrossRef]


| Classification of DR | Features |
|---|---|
| No retinopathy | no microvascular lesion |
| Mild nonproliferative diabetic retinopathy (NPDR) | microaneurysms only |
| Moderate NPDR | Microaneurysms retinal haemorrhages hard exudates |
| Severe NPDR | more than 20 haemorrhages in each of the four quadrants, intraretinal microvascular abnormalities (IRMA) in one quadrant venous and arterial changes venous beading in two quadrants |
| Proliferative diabetic retinopathy (PDR) | neovascularization of optic disc or retina preretinal haemorrhage vitreous haemorrhage |
| Model Type Depending on the Induction Mechanism | Model | Type of Diabetes Mellitus | Features | References |
|---|---|---|---|---|
| Genetic Models | Rats Models | |||
| Biobreeding (BB) rats | 1 | the diabetes-prone (BBDP) rats —diabetes develops spontaneously; the diabetes-resistant (BBDR) rats—trigger required to develop diabetes; lymphopenia, hyperglycaemia, hypoinsulinemia, ketonuria, weight loss | [31,32] | |
| Zucker diabetic fatty (ZDF) rats | 2 | leptin receptor mutation hyperphagia, obesity, hyperinsulinemia, hyperlipidaemia | [33,34] | |
| Goto–Kakizaki (GK) rats | 2 | congenital impaired glucose tolerance, hyperglycaemia, insulin resistance, starfish-shaped isles | [35,36] | |
| Wistar Bonn/Kobori (WBN/Kob) rats | 2 | diabetes develops spontaneously, only males develop diabetes hyperglycaemia, glycosuria, hipoinsulinaemia and glucose intolerance; fibrosis of the pancreatic ducts and blood vessels → degeneration of the pancreatic islets | [37] | |
| Otsuka Long-Evans Tokushima fatty (OLETF) rats | 2 | a cholecystokinin (CCK)1 receptor knockout model, late onset hyperglycaemia, polyuria, polydipsia and mild obesity | [38,39] | |
| Nonobese spontaneously diabetic Torii (SDT) rats | 2 | males are more sensitive, hyperglycaemia and hipoinsulinaemia | [40] | |
| Mice Models | ||||
| Nonobese diabetic (NOD) mice | 1 | diabetes develops spontaneously, females are more sensitive, Langerhans islets inflammation; intraperitoneal injection of IL-1β and TNFα, stimulates the development of this model | [41,42,43] | |
| Akita mice | 1 | spontaneous mutation in an allele of the insulin 2 gene (abnormal processing of the proinsulin peptide), hyperglycaemia, hyperinsulinemia, polydipsia and the polyuria | [31,44] | |
| The Japanese Kuo Kondo (KK) mice | 2 | severe insulin resistance and hyperinsulinemia, slight obesity, Langerhans islet hypertrophy | [45,46] | |
| The db/db (Leprdb) mice | 2 | mutation of the leptin receptor obesity, hyperglycaemia, atrophy of pancreatic β-cells, hypothermic, hormone growth deficiency | [47,48] | |
| Chemically Induced Models | Streptozotocin (STZ): High single dose STZ Multiple low-dose STZ | 1 and 2 | STZ blocks insulin secretion (glucotoxicity, DNA alkylation, ROS production), rats are more sensitive than mice are, female mice are more resistant than males are. STZ diabetes can be reversed by applying insulin therapy | [49,50,51] |
| Alloxan | 1 and 2 | carcinogenic and cytotoxic substance partial degradation of β-cells in Langerhans islets’ selective impairment of glucokinase and ROS production | [52,53] | |
| Chemically Induced Model | Dose | Way of Application | Strain | Level of Hyperglycaemia | Reference |
|---|---|---|---|---|---|
| Streptozotocin | Mice | ||||
| 10 mg/kg BW 1 for 5 days | IP 2 | BALB/c or C57BL/6 mice—male (4–5 weeks old) | >200 mg/dL * 438 ± 70 mg/dL (fed with high-fat diet) after 6 weeks; >600 mg/dL (fed with low-fat diet) after 6 weeks † | [17] †, [126] * | |
| 55 mg/kg BW for 5 days 75 mg/kg BW for 5 days | IP | C57BL/6J mice (10–12 weeks old) male female | 547 ± 65.9 mg/dL (male) 237 ± 86.3 mg/dL (female) | [125] | |
| 60 mg/kg/BW for 5 days | IP | SNS-HIF1α−/− or HIF1αfl/fl mice (7–9 weeks old) C57BL6/j mice—male (7–8 weeks old) | 380–500 mg/dL after 2 weeks * 300–400 mg/dL after 4 weeks † | [127] * [128] * [129] † | |
| 85 mg/kg BW for 3 days | IP | hy1-YFP-H transgenic mice (maintained under the C57BL/6J background)—male and female (6–7 weeks old) | 343 ± 14.04 mg/dL after 4 weeks | [130] | |
| single dose—150 mg/kg BW | IP | C57BL/6 mice—male (6–8 weeks old) BALB/c mice—male (6–8 weeks old) | 26.61 ± 1.14 mmol/L → 478.98 ± 25.2 mg/dL * ≥16.7 mmol/L → 300.6 mg/dL † | [131] *, [132] † | |
| single dose—200 mg/kg BW | IP | C57BL6 mice (8–12 weeks old)—male | 28.9 mmol/L → 520.2 mg/dL | [133] | |
| Rats | |||||
| single dose—30 mg/kg BW | IP | Sprague-Dawley rats—male (6 weeks old) | 20.39 ± 1.72 mmol/L → 367 ± 31 mg/dL after 1 week | [134] | |
| single dose or double dose—50–65 mg/kg BW | IV 3 | Sprague-Dawley rats—male (6–23 weeks old) | 50 mg/kg (double dose) → 428 ± 18 mg/dL (6–11 weeks old) 65 mg/kg (single dose) → 465 ± 26 mg/dL (6–11 weeks old) or 464 ± 23 mg/dL (12–17 weeks old) or 444 ± 6 mg/dL (18–23 weeks old) | [135] | |
| single dose—60 mg/kg BW | IP | Sprague-Dawley rats (2–3 months old) | 25.2 ± 3.1 mmol/L → 453.6 ± 55.8 mg/dL after 4 weeks *; 265 ± 12 mg/dL after 4 weeks † 465 ± 17 mg/dL after 3 days ‡ | [136] *, [137] †, [138] ‡, [139] * | |
| single dose—65 mg/kg BW | IP | Sprague-Dawley rats—male | 23.2 ± 0.7 mmol/L → 417.6 ± 12.6 mg/dL after 12 weeks | [140] | |
| single dose—90 mg/kg BW | IP | Sprague-Dawley rats—male | 38.9 ± 2.1 mmol/L → 700 ± 37.8 mg/dL after 20 weeks | [141] | |
| 45 mg/kg BW 55 mg/kg BW | IP | Wistar rats—male (2 months old) | 25.6 ± 8.2 mmol/L → 460 ± 147.6 30.1 ± 7.7 mmol/L → 541.8 ± 138.6 after 4 weeks | [142] | |
| single dose—55 mg/kg BW | IP | Wistar rats (8 weeks old) | 25.1 ± 3.1 mmol/L → 451.8 ± 55.8 after 4 weeks | [139] | |
| single dose—60 mg/kg BW | IP | Wistar rats (10–12 weeks old) | 300 mg/dL after 10 days | [143] | |
| single dose—60 mg/kg BW | IV | Wistar rats—male (8 weeks old) | 426 ± 31 mg/dL | [144] | |
| Alloxan | Mice | ||||
| single dose—150 mg/kg BW | IP | BALB/c mice—female (6–8 weeks old) | >250 mg/dL after 1 day | [136] | |
| single dose—180 mg/kg BW | IP | BALB/c mice—male (6–8 weeks old) | >220 mg/dL after 2 days | [145] | |
| single dose—186.9 mg/kg BW | IP | BALB/c mice—male (6–8 weeks old) | >200 mg/dL after 12 h >260 mg/dL after 1 day | [146] | |
| single dose—50 mg/kg BW | IV | ICR mice (known as Swiss CD-1 mice)—male (5 weeks old) | >500 mg/dL after 6 weeks | [147] | |
| single dose—150 mg/kg BW | IP | ICR mice—male (4 weeks old) | 465.45 ± 15.60 mg/dL after 2 weeks | [148] | |
| single dose—180 mg/kg BW | IP | Swiss albino mice—male | ≥250 mg/dL | [149] | |
| single dose—200 mg/kg BW | IP | Swiss albino mice (8 weeks old) | 262 ± 4.80 mg/dL | [150] | |
| Rats | |||||
| 120 mg/kg BW for 3 days | IP | Wistar rats—male | 290 ± 5 mg/dL * 284.83 ± 6.96 † after 3 days | [151] *, [152] † | |
| single dose—150 mg/kg BW | IP | Wistar rats—male | 212 ± 2.41 mg/dL after 4 days; 274 ± 2.82 mg/dL after 1 week; 418 ± 3.53 mg/dL after 2 weeks; 465 ± 3 mg/dL after 4 weeks * >500 mg/dL after1 week † | [153] *, [154] † | |
| single dose—180 mg/kg BW | IP | Wistar rats—male | - | [155] | |
| single dose—300 mg/kg BW | IP | Wistar rats (16 weeks old)—male | 25.98 ± 1.84 mmol/L → 467.84 ± 33.12 mg/dL after 4 weeks; 32.60 ± 0.80 mmol/L → 586.68 ± 14.4 mg/dL after 8 weeks | [156] | |
Disclaimer/Publisher’s Note: The statements, opinions and data contained in all publications are solely those of the individual author(s) and contributor(s) and not of MDPI and/or the editor(s). MDPI and/or the editor(s) disclaim responsibility for any injury to people or property resulting from any ideas, methods, instructions or products referred to in the content. |
© 2023 by the authors. Licensee MDPI, Basel, Switzerland. This article is an open access article distributed under the terms and conditions of the Creative Commons Attribution (CC BY) license (https://creativecommons.org/licenses/by/4.0/).
Share and Cite
Polewik, K.; Kosek, M.; Jamrozik, D.; Matuszek, I.; Smędowski, A.; Lewin-Kowalik, J.; Pietrucha-Dutczak, M. Rodent Models of Diabetic Retinopathy as a Useful Research Tool to Study Neurovascular Cross-Talk. Biology 2023, 12, 262. https://doi.org/10.3390/biology12020262
Polewik K, Kosek M, Jamrozik D, Matuszek I, Smędowski A, Lewin-Kowalik J, Pietrucha-Dutczak M. Rodent Models of Diabetic Retinopathy as a Useful Research Tool to Study Neurovascular Cross-Talk. Biology. 2023; 12(2):262. https://doi.org/10.3390/biology12020262
Chicago/Turabian StylePolewik, Karolina, Maciej Kosek, Daniel Jamrozik, Iwona Matuszek, Adrian Smędowski, Joanna Lewin-Kowalik, and Marita Pietrucha-Dutczak. 2023. "Rodent Models of Diabetic Retinopathy as a Useful Research Tool to Study Neurovascular Cross-Talk" Biology 12, no. 2: 262. https://doi.org/10.3390/biology12020262