1. Introduction
Oil and gas deposits in sea bottom sediments have a strong impact on the formation of microbiomes, especially on bacteria capable of oxidizing methane and other hydrocarbons [
1,
2,
3,
4,
5]. Communities of microorganisms found in such areas have specific functions and are rigidly structured both in depth and in distance from the seep [
3,
6,
7,
8,
9]. The high ecological plasticity and biodiversity of hydrocarbon-oxidizing bacteria make them able to switch to the consumption of methane and other hydrocarbons, depending on the environmental conditions [
8,
9,
10,
11,
12,
13,
14,
15]. However, oil and gas deposits are different types due to their geological characteristics, and, depending on this, have different effects on the formation of the microbial community. Gas-hydrates are relatively new types of hydrocarbon deposits that presumably contain large volumes of gas [
6,
16,
17]. They are formed under the conditions of a combination of low temperature and high pressure in marine bottom sediments with high concentrations of natural gas in the sedimentary environment and on the bottom surface. There have been few reports of the phyla of non-culturable microorganisms found only in areas where gas hydrates have been found [
18,
19]. The use of bioindication methods allows for comprehensively assessing the total impact of simultaneous processes taking place in the areas of gas flows at the bottom of an ocean.
The main methods in the field of bioindication at present are the detection of functional genes involved in the biodegradation of hydrocarbons and the description of properties of bioindicator species [
13,
19,
20,
21,
22,
23,
24]. Due to the plasticity of bioindicator methods, we assume that they can be used not only for the detection of oil and gas deposits but also for more detailed descriptions of such deposits, for example, for the identification of traditional and gas-hydrate deposits, without direct access to the surface of gas hydrates [
18,
19].
Comparison of the range of applications of different approaches to bioindication will allow us to identify the most promising bioindication methods for the assessment of the distribution of functional genes and taxonomic or physiological characteristics of bioindicator microorganisms [
25,
26].
The processes of bacterial oxidation of hydrocarbons directly in oil and gas reservoirs are significantly different from the processes occurring outside the deposit. The main feature of the environmental conditions in the area of oil and gas occurrence is the anaerobic environment. We made an assumption that the ability of bacteria to oxidize oil under anaerobic conditions may be a significant bioindicator feature [
27,
28].
Thus, the purpose of this study was to determine the possibility of identifying not only an oil and gas deposit but also its type (traditional or gas hydrate) by comparing various bioindicator approaches (molecular–genetic, cultural). As the first step, the distribution of the most commonly used genes responsible for the biodegradation of hydrocarbons (
alkBB,
masD and
bssA) and markers for the synthesis and oxidation of methane (
pmoA and
mcrA) that are associated with them in the carbon cycle were assessed [
21,
22,
29,
30,
31]. In the second stage, an analysis of the distribution of bioindicator species of microorganisms depending on the type of deposit was carried out. In the third stage, the ability for anaerobic oxidation was studied in oil-oxidizing strains isolated from areas with different types of oil and gas deposits [
32,
33]. This study enabled us to estimate the methods and possible volumes of the anaerobic oxidation of hydrocarbons, which occurs in bottom sediments in areas of gas fields. Comparative analysis of all stages allowed us to describe the possible methods of bioindication of different types of deposits.
2. Materials and Methods
2.1. Study Area
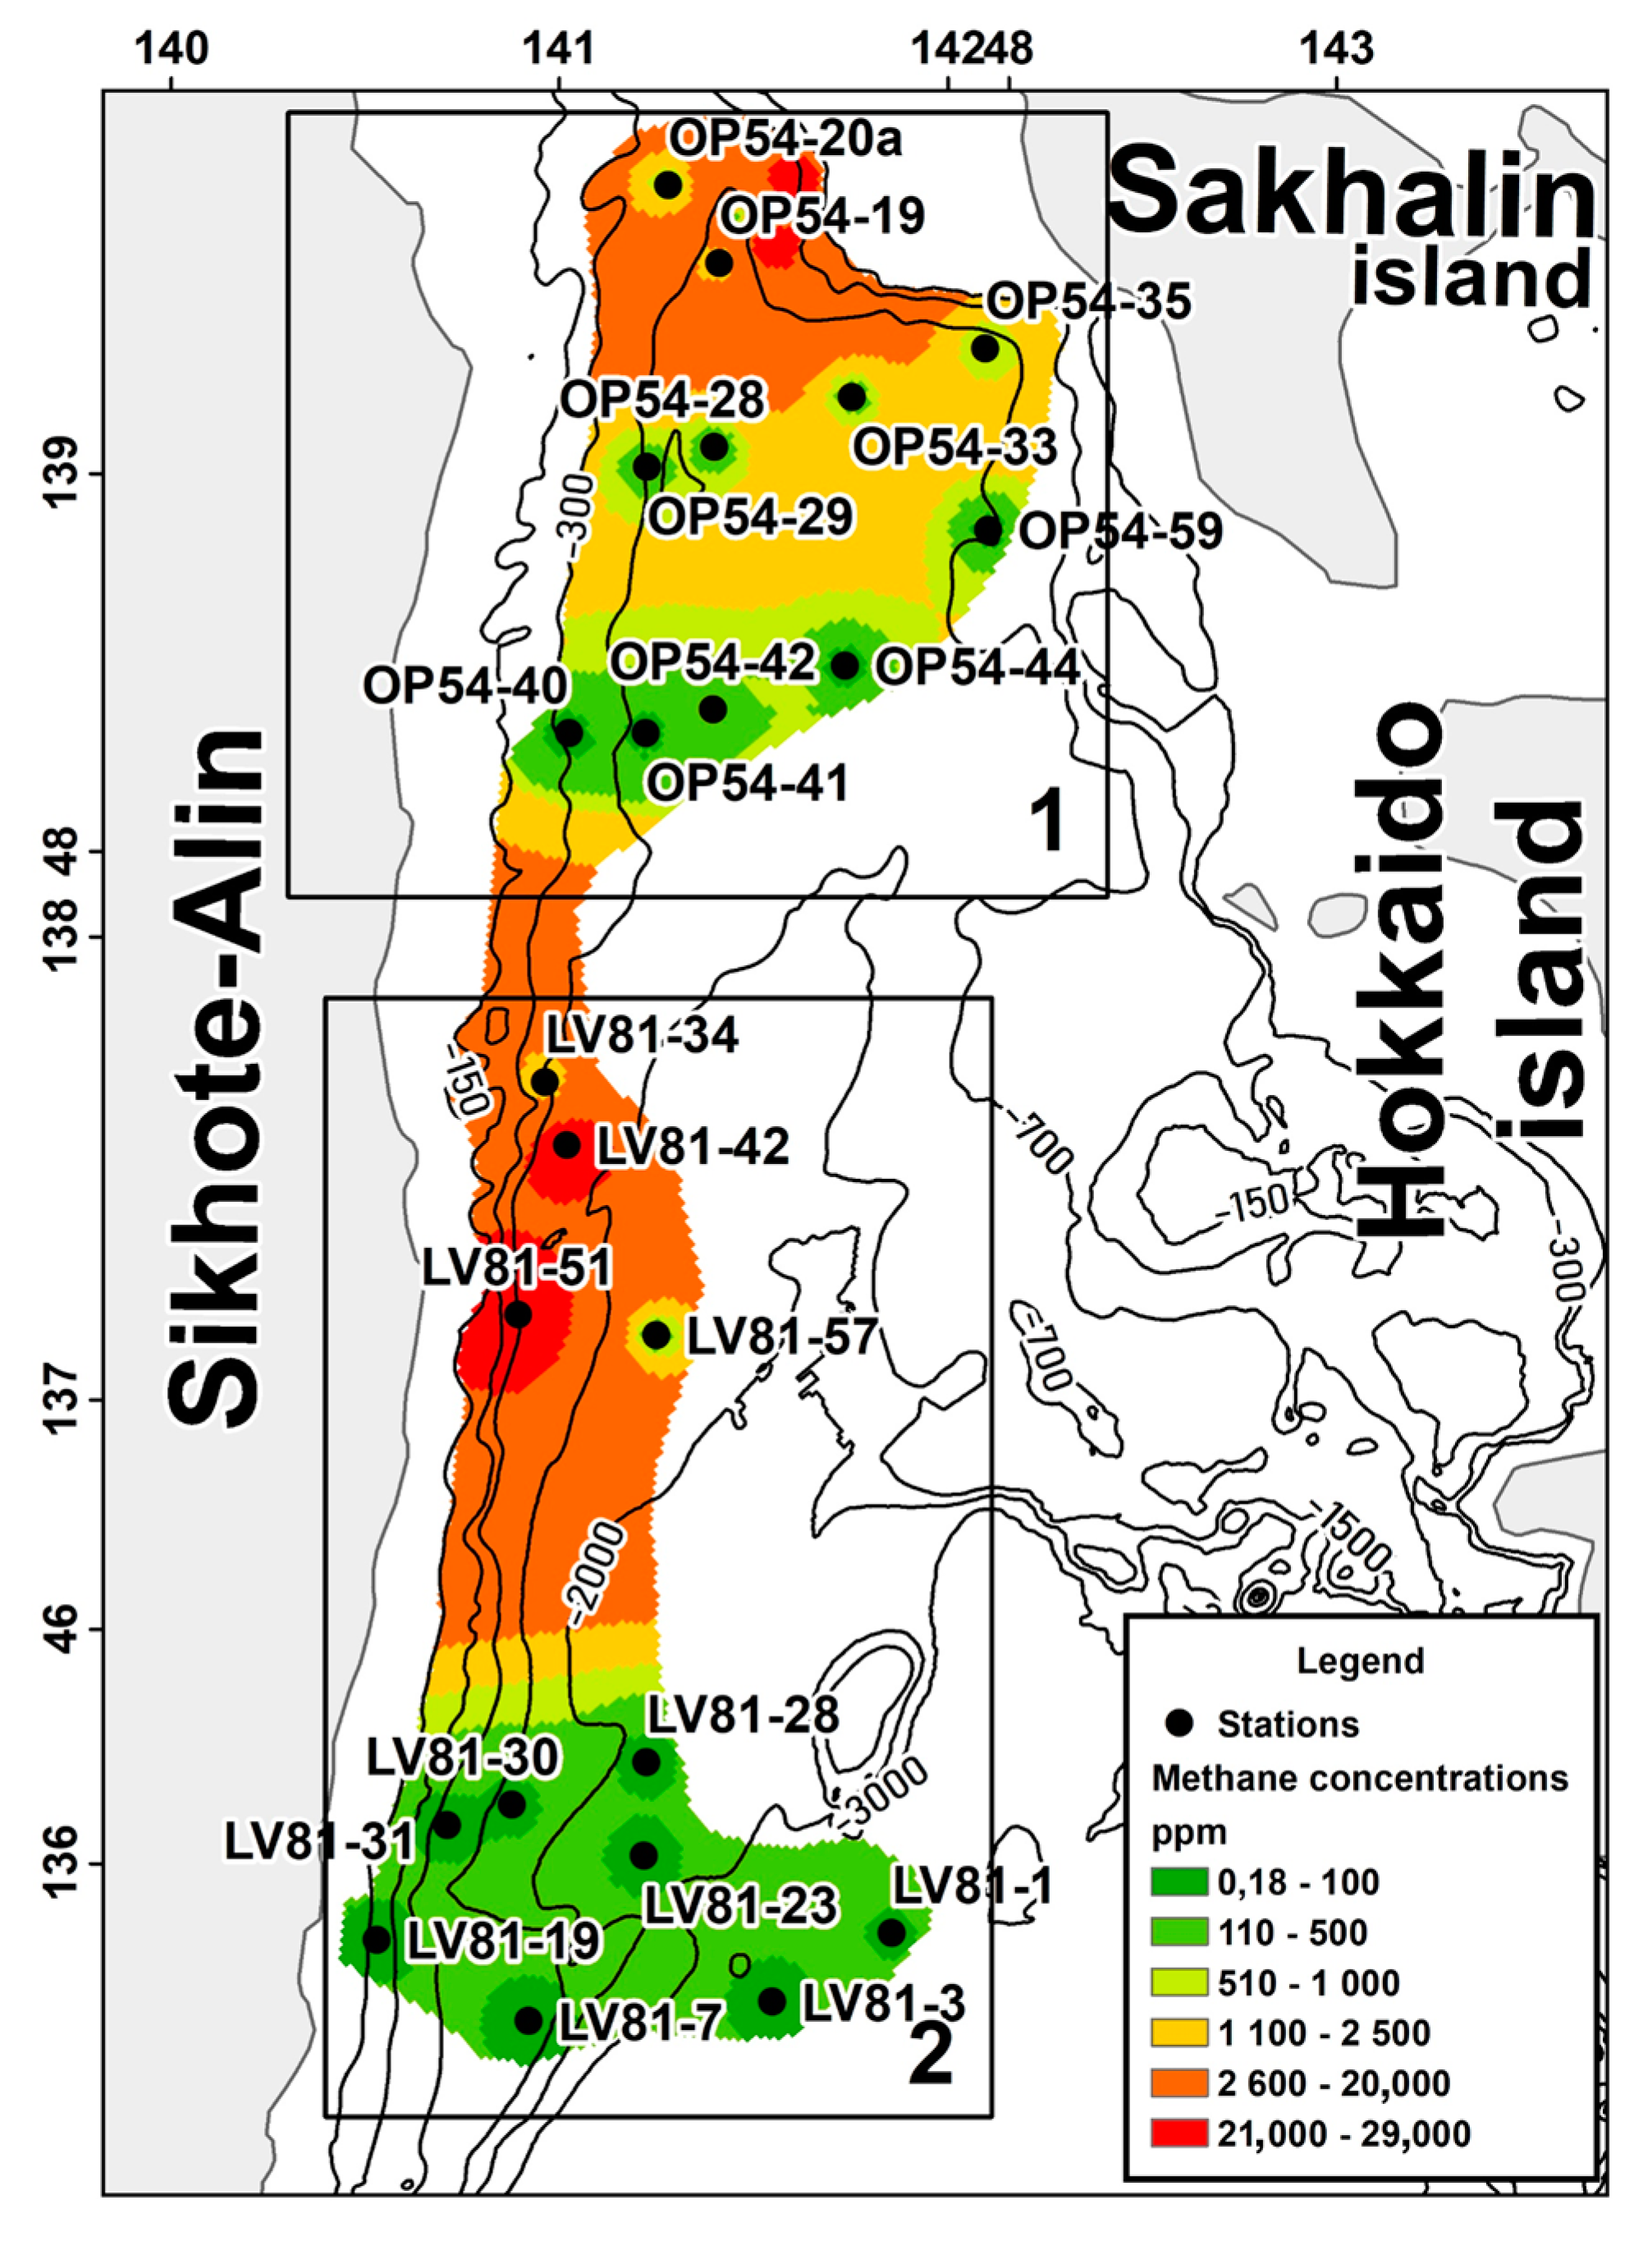
The study area is located in the northern part of the Sea of Japan and includes two zones. The first one is characterized by the presence of gas hydrates within the south-western slope of Sakhalin Island. Gas hydrates were found near stations OP54-20a and OP54-19 near Sakhalin Isl. The second zone is located closer to the Central Basin of the Sea of Japan (the region of the northern closure of the Central Basin) (
Figure 1).
The average concentration of methane in the non-gas-hydrate area is significantly higher than the same indicator in the gas-hydrate area. In addition, the non-gas-hydrate region is deeper than the gas-hydrate region.
Stations where gas hydrates were directly detected were not included in the study. An analysis of the methane content was performed on a two-channel gas chromatograph “Crystallux-4000M” (CJSC “Meta-Khrom”, Yoshkar-Ola, Russia) equipped with a flame ionization detector, with ionization flux and thermal conductivity sensors and a sensitivity level of 10−6%.
2.2. Sample Selection
Core samples were obtained by shallow drilling using a stainless steel gravity sampler with an internal diameter of 130 mm and a length of 600 cm (
Table 1).
We used samples from the upper part of the restored layer of sea bottom sediments in the northern part of the Sea of Japan, taken during cruises OP54 of the R/V “Akademik A.I. Oparin” (2017) and LV81 of the R/V “Akademik M. A. Lavrentiev” (2018) to study the distribution of microorganisms in bottom sediments associated with gas discharge.
2.3. Stage 1 of the Study. Detection of Functional Genes in Marine Sediments
2.3.1. DNA Isolation
A modified method proposed by Marmur [
34] was applied to isolate total DNA from bottom sediments and obtained strains. A total of 1 g of sea bottom sediment was ground in a sterile mortar for 5 min to free the cells from the core. Next, the sediment was placed in 1 mL of TE buffer (10 mM Tris pH 8.0, 1 mM EDTA). A 20% SDS solution was added to the suspension to a final concentration of 1–2% and thoroughly mixed for 5 min in a vortex. This suspension was incubated for 30 min at a temperature of 37 °C in a thermostat. After incubation, equal volumes of a mixture of phenol and chloroform were added to each tube, thoroughly mixed in a vortex, and centrifuged for 10 min at 15,000 rpm. The upper phase was transferred to a new test tube, and an equal volume of a mixture of phenol and chloroform at a ratio of 1:1 was again added, mixed, and centrifuged for 10 min at 15,000 rpm. The upper phase was transferred to a new tube, extracted with an equal volume of chloroform, and centrifuged for 10 min at 15,000rpm. Next, 5M NaCl and 3 volumes of chilled 96% ethanol were added, thoroughly mixed, and placed in a freezer at −40 °C for at least 2 h. The sample was then centrifuged again for 15 min at 15,000 rpm. The excess alcohol was removed, and the DNA precipitate was air-dried.
2.3.2. PCR
The determination of the presence of functional genes is presented in
Table 2 (Amplifier Dtprime-5, DNA Technology Moscow, Russia). The results were analyzed using the software supplied with the instrument RealTime_PCR v7.9 (Moscow, Russia).
2.4. Stage 2 of the Study: Diversity of Cultivated Bioindicator Hydrocarbon-Oxidizing Microorganisms
Our aim was to detect biodegradative functional genes:
1-monooxygenase (
alkBB) gene, which is a key catabolic gene of alkane degradation [
28];
The mechanism of anaerobic alkane activation is the addition of alkanes to fumarate by (1-methylalkyl) succinate synthase (
mas). Here, we studied the
masD gene in the catalytic subunit of the enzyme [
20,
35];
The
bssA gene, coding for benzylsuccinate synthase, the key enzyme of anaerobic toluene degradation [
30];
Methanotrophs oxidize methane using methane monooxygenase (MMO) enzymes, and the subunit gene of the most common MMO
pmoA was selected [
22];
Methanogenic microorganism gene, coding metagenomic methyl-coenzyme M reductase alpha subunit (
mcrA) [
31].
2.4.1. Culture Methods
To create accumulative cultures of oil-oxidizing microorganisms, 3 media were used (
Table S1).
As the only carbon source, ESPO crude oil was used at a ratio of 4%.
A total of 1 g of bottom sediments was added to each medium and cultivated at 25 °C for 30 days. Pure cultures were isolated using standard microbiological methods (depleting stroke method and Drygalski method).
At least 1 g of bottom sediments was added to the selective medium and cultured at a temperature of 20 °C for 3 weeks. Pure cultures were isolated using the streak plate method.
2.4.2. Identification of the Researched Isolates
The isolation of total DNA from samples of the bottom sediments and chromosomal DNA of pure cultures was carried out using the modified Marmur method [
34]. The identification was carried out by sequencing a highly conservative 16S rDNA site with the Sanger method using the BigDye v3.1 kit on the ABI 3130xl genetic analyzer (ThermoFisher Scientific, Waltham, MA, USA); sequencing was carried out by the company Syntol LLC, Moscow, Russia. Universal bacterial primers 11F (5′ AGTTTGATCATGGCTCAG 3′) and 1100R (5′ GGGTTGCGCTCGTTG3′) were used for sequencing [
36]. The obtained sequences were identified up to individual operational taxonomic units (OTUs) at a similarity level of 98%.
Determination of the level of hydrocarbon biodegradation was conducted using the fluorometric method.
2.4.3. Phylogenetic Analysis
Phylogenetic analysis was performed by searching for homologous sequences in the International Data Bank (GenBank) using the BLAST program [
37] (
http://www.ncbi.nlm.nih.gov/blast (accessed on 6 July 2022)). The resulting sequences were checked for the presence of chimeras using the Pintail 1.1 program (
http://www.bioinformatics-toolkit.org/Web-Pintail/ (accessed on 8 June 2022)). Sequence editing was performed using the BioEdit editor; sequence alignment was performed using the algorithm of the CLUSTAL W program (
http://www.genebee.msu.su/clustal (accessed on 6 July 2022)). Phylogenetic trees were built using the Robust Phylogenetic analysis software package presented on the website
http://www.phylogeny.fr/ (accessed on 10 July 2022) [
38].
Stage 3 of the study. The ability of cultivated microorganisms to utilize hydrocarbons under aerobic and anaerobic conditions.
The microorganisms isolated at the previous stage of the study were cultivated on modified Voroshilova–Dianova medium under aerobic and anaerobic conditions at a temperature of 25 °C for a week. Anaerobic conditions were created by replacing the atmosphere with nitrogen.
2.4.4. Analysis of Hydrocarbon Biodegradation
Analysis of the degree of hydrocarbon biodegradation was carried out using fluorometric analysis. This method is based on the extraction of hydrocarbons with hexane from the sample and the measurement of the fluorescence intensity of the extract on the Fluorat-02-Panorama liquid analyzer according to a standardized method, which is based on the extraction of petroleum products with hexane and purification of the extract if necessary, which is followed by measurement of the fluorescence intensity of the extract. The cultivation of the studied strains was carried out in liquid Voroshilova–Dianova medium, containing oil hydrocarbons making up no more than 1% of the total volume of the medium. Nitrogen-purged Hungate tubes were used to create anaerobic conditions.
The media inoculated with microorganisms were cultivated under aerobic and anaerobic conditions for 14 days at a temperature of 25 °C. Then, the oil products were extracted with hexane. The measurement was carried out in the short-wavelength region (270–290 nm), and fluorescence was recorded in the region 300–330 nm, which made it possible to reduce the dependence of the analytical signal on the composition of the hydrocarbon mixture.
2.4.5. Statistical Analysis
The nucleotide sequences of the 16S rRNA gene fragments of the isolated strains of oil-oxidizing bacteria were registered in the GenBank database. The diversity of the isolated strains was determined using the Shannon and Simpson indices [
11].
Microsoft Office Excel 2007 spreadsheets were used for calculations and systematization of the data obtained during the cruise. The data obtained immediately after processing were entered into the ArcGIS 10.4 geoinformation application, using the Geostatistical Analyst module, for interpretation. Statistical analyses and data visualizations were created using R Version 3.3.1 (
https://cran.r-project.org/bin/windows/base/old/3.1.1/ (accessed on 12 September 2022)).
3. Results
3.1. Distribution of Functional Bioindicator Genes in Bottom Sediments of Gas-Hydrate Area and Non-Gas-Hydrate Area of the Sea of Japan
3.1.1. Gas-Hydrate Area
At four stations out of 12, bioindicator genes of methanotrophic and methanogenic prokaryotes were found. Stations were located in the central part of the area at depths from 600 to 1100 m.
mcrA genes were recorded at one of the deepest stations in the gas-hydrate region (1094 m). Bioindicator genes of the methane cycle were found at stations with methane concentrations closest to the average, except for the maximum value in the gas-hydrate region (about 100 ppm). At station OP54-59,
pmoA was detected at a station with a minimum methane concentration of 0.002 ppm. At the stations located near the gas-hydrate discovery region,
mcrA and
pmoA were not recorded (
Figure 2A,B).
In the gas-hydrate region, at eight stations out of 12, functional genes responsible for the degradation of hydrocarbons were recorded. The
masD gene was encountered with the highest frequency (five stations out of eight). At three stations, two bioindicator genes were detected, and at one station, all three functional genes under study were detected. One gene was found at four stations (
masD at three stations,
bssA at one station) (
Figure 2B).
According to the detection of bioindicator genes, the gas-hydrate region can be divided into three parts (
Figure 2B).
Stations OP54-19, 20a, and 35 are located near Sakhalin Island near the location where gas hydrates were found. They are equally represented by the masD and bssA genes. At the same time, bssA was registered at the station with the highest content of methane in the gas-hydrate region.
Stations OP54-29, 33, and 59 are located in the center of the gas-hydrate region. alkBB genes were recorded only at these stations.
Stations OP54-40, 41, and 42 are located at depths from 700 to 1100 m. The masD gene was detected at all stations. At these stations, the methane content was observed to be below the average for the gas-hydrate region.
3.1.2. Non-Gas-Hydrate Area
In the study of bioindicator genes involved in the methane cycle in the non-gas-hydrate region, pmoA was found at eight stations out of 12. These stations were located at different depths and had a wide range of methane concentrations, including the maximum. The mcrA gene was recorded at four stations. Two of them were located at depths of 300 to 700 m and had the highest methane concentrations. The other two stations at which mcrA were found were in the deepest part of the test site.
In the non-gas-hydrate area, at eight out of 11 stations, bioindicator functional genes involved in the oxidation of hydrocarbons were recorded. In this area, alkBB was encountered with the highest frequency at five stations out of 11. The masD gene was encountered at two stations, as was bssA. At stations with the highest methane contents in the area, alkBB was detected, and other studied functional genes masD and bssA were detected at stations with methane contents slightly exceeding the background values.
The features of the non-gas-hydrate region were the predominance of alkBB and the detection of only one bioindicator gene responsible for the utilization of hydrocarbons at the station. In the non-gas-hydrate region, only at one station, LV81-28, the alkBB and bssA genes were detected.
3.1.3. Comparison of Gas-Hydrate and Non-Gas-Hydrate Regions
In the gas-hydrate region, the bioindicator genes of the methane cycle were recorded less frequently than in the non-gas-hydrate region. In both studied zones, the bioindicator gene of methanogenic prokaryotes was found in areas with the greatest depth, regardless of the methane content in the bottom sediments. In the gas-hydrate region, the bioindicator gene of methanotrophic bacteria was found at stations with the average and lowest methane contents in the region as well as in the non-gas-hydrate region, regardless of the methane content at the station.
The genes for the anaerobic oxidation of linear hydrocarbons predominated in the gas-hydrate region, and vice versa, in the non-gas-hydrate region, genes for aerobic oxidation of hydrocarbons predominated. The detection of pmoA in both areas occurred at the same stations and near the stations at which alkBB was recorded. Thus, the detection of genes responsible for the aerobic (non-gas-hydrate region) and anaerobic (gas-hydrate region) degradation of hydrocarbons (alkBB and masD) had the greatest bioindicator value for different regions.
3.2. Taxonomic Diversity of Hydrocarbon-Oxidizing Bacteria Isolated from the Upper Part of the Oxidized Layer of Bottom Sediments in the Areas of Presence and Absence of Gas Hydrates in the Northern Part of the Sea of Japan
3.2.1. Gas-Hydrate Area
In the gas-hydrate region, 37 strains were isolated from the surface layer of bottom sediments at eight stations out of 12. The predominant species in this area are representatives of the genera
Pseudomonas,
Stenotrophomonas and
Psychrobacter (11, 7, and 7 strains, respectively). Eight strains were unique to their area. Of these, four belonged to the widest known genus of hydrocarbon-degrading bacteria,
Rhodococcus. The remaining four strains were assigned to
Nesterenkonia lutea, Peribacillus simplex, Promicromonospora xylanilytica and
Nocardioides dokdonensis.
Rhodococcus ssp. was isolated near the location where gas hydrates were found, as were other unique strains (
Figure S1).
3.2.2. Non-Gas-Hydrate Area
From the surface layer of the bottom sediments of eight stations out of 12 in the non-gas-hydrate area, 17 strains of hydrocarbon-oxidizing bacteria were isolated. At station OP54-57, five strains were isolated; at other stations, from one to three strains were isolated, the largest number of which belonged to the genus
Psychrobacter (five strains). The representatives of
Stenotrophomonas and
Pseudomonas belonged to four and three strains, respectively. The following strains were unique for this region:
Robertmurraya kyonggiensis,
Curtobacterium oceanosedimentum,
Brevibacillus nitrificans and
Micrococcus sp. (
Figure S2).
3.2.3. Comparison of Gas-Hydrate and Non-Gas-Hydrate Regions
The largest number of common species for the two study areas belongs to the phylum Gammaproteobacteria. The gas-hydrate region is characterized by a significantly large number of isolates. Thus, 37 of 54 strains were isolated in the gas-hydrate region (nine genera), and 17 strains (eight genera) were isolated in the non-gas-hydrate region. Representatives of the genera Bacillus, Pseudomonas, Stenotrophomonas, and Psychrobacter were found in both study areas. In the gas-hydrate region, the following were unique: Rhodococcus, Nesterenkonia, Promicromonospora, Nocardioides and Peribacillus. In the non-gas-hydrate region Brevibacillus, Micrococcus, Curtobacterium and Robertmurraya were unique.
Representatives of the genus
Pseudomonas occurred with the greatest frequency in the gas-hydrate region. In the non-gas-hydrate region, there was no clear predominance of one genus;
Pseudomonas,
Stenotrophomonas and
Psychrobacter were found in the greatest numbers. The gas-hydrate region is characterized by a significantly large number of isolates (
Figure 3).
All strains belonging to the phylum Actinomycetota were unique for the gas-hydrate region. At the same time, representatives of the Nocardiaceae family were found only in the gas-hydrate region. The family is represented by five strains:
Nocardioides (1),
Rhodococcus (4), which are assigned to two genera. At the same time, the frequency of the occurrence of species unique to this region in the gas-hydrate and non-gas-hydrate regions is comparable (21.62 and 25.33%, accordingly) (
Figure 4).
The Shannon and Simpson indices were calculated (
Table 3) to assess biodiversity and dominance. The analysis of the indices obtained shows that the Shannon genera diversity index in the gas-hydrate region was slightly lower than that in the non-gas-hydrate region. The Simpson index in the gas-hydrate region was slightly higher than in the non-gas-hydrate region. At the level of genera, the studied areas were characterized by insignificant microbial diversity.
The Jaccard coefficient was calculated to assess the similarity and difference in the taxonomic composition of the isolated strains between the studied areas. When comparing the number of species in gas-hydrate and non-gas-hydrate regions, the Jaccard similarity coefficient is quite low (0.17), which indicates a large difference in the taxonomic composition at the level of cultivated species.
3.3. Description of the Ability of the Studied Strains to Biodegrade Oil Hydrocarbons under Aerobic and Anaerobic Conditions
3.3.1. Gas-Hydrate Area
The largest number of strains isolated in the gas-hydrate region had the ability to utilize hydrocarbons under both aerobic and anaerobic conditions. Only 14 out of 37 strains did not have this property. These strains belonged to the genera Rhodococcus, Stenotrophomonas, Psychrobacter, Pseudomonas, Nocardioides dokdonensis POI OP54-35/al26-1, and Nesterenkonia lutea POI OP54-19/165. The largest number of strains incapable of utilizing hydrocarbons under anaerobic conditions belonged to the genus Psychrobacter (three out of seven strains). All representatives of the genus Bacillus possessed the ability to utilize oil hydrocarbons both in the presence and absence of oxygen.
The degree of the biodegradation of hydrocarbons by strains capable of this activity only under aerobic conditions varied in the range 51.98 to 97.38% of the initial concentration of hydrocarbons. For strains capable of oxidizing hydrocarbons both in the presence and absence of oxygen under aerobic conditions, the same indicator ranged from 56.07 to 88.22% of the initial concentration of hydrocarbons. The degree of the degradation of hydrocarbons under anaerobic conditions was significantly higher than the same indicators in aerobic conditions (from 80.95 to 92.22% of the initial concentration of hydrocarbons) (
Table S2).
Among the strains capable of only aerobic degradation of hydrocarbons, representatives of the genus Psychrobacter were the most active, while Stenotrophomonas strains were the least active.
In addition, only in Psychrobacter strains, similar indicators of the intensity of hydrocarbon degradation under aerobic conditions were observed in strains capable of only aerobic oil degradation and strains capable of both aerobic and anaerobic oil degradation.
In all other strains tested, carbohydrate consumption under anaerobic conditions was significantly higher than under aerobic conditions. The difference between the aerobic and anaerobic utilization of oil was more than 10%. In representatives of the genus Stenotrophomonas, this difference was the smallest.
Representatives of the genus
Rhodococcus have a wide scatter of data on the degradation of hydrocarbons under aerobic conditions and very little under anaerobic conditions (
Figure 5).
3.3.2. Non-Gas-Hydrate Area
Only three out of 17 strains, Psychrobacter pacificensis POI LV81-57/al 379 (2), Stenotrophomonas rhizophila strain POI LV81-28/173-3(3), and Curtobacterium oceanosedimentum strain POI LV81-23/149-3(2), isolated in the non-gas-hydrate area, did not have the ability for anaerobic oil degradation. The degree of oil biodegradation by these strains ranged from 75.56 to 86.33% of the initial amount of hydrocarbons.
Strains capable of utilizing oil under aerobic and anaerobic conditions in the presence of oxygen demonstrated a lower ability to degrade oil than strains capable of utilizing oil only under aerobic conditions (from 53.17 to 69.33% of the initial amount of hydrocarbons). At the same time, under oxygen-free conditions, the same indicator for the tested strains was quite high from 85.06 to 100% (out of the limits of determination) of the initial amount of hydrocarbons. The maximum degree of biodegradation was observed in the strain
Stenotrophomonas maltophilia POI LV81-57/379-1 (
Table S3).
Unfortunately, most of the genera had only one representative in the sample of strains isolated from the bottom sediments of the non-gas-hydrate region, which made it difficult to assess the properties of the genus.
As well as in the gas-hydrate region, the difference between anaerobic and anaerobic oil consumption by strains was about 10%. In contrast to the gas-hydrate region, this indicator in representatives of the genus Stenotrophomonas was significantly higher and corresponded to other studied strains.
Representatives of the genus
Pseudomonas isolated in the non-gas-hydrate region utilized hydrocarbons more slowly under both aerobic and anaerobic conditions. The decrease in indicators was about 5 to 8%. For representatives of the
Psychrobacter and
Stenotrophomonas genera, the values of the degree of hydrocarbon degradation for strains isolated from the gas-hydrate and non-gas-hydrate regions were close (
Figure 6).
3.3.3. Comparison of Gas-Hydrate and Non-Gas-Hydrate Regions
In the non-gas-hydrate region, strains capable of utilizing oil only with the presence of oxygen accounted for 17.6% of the total number of strains isolated in the region. In the gas-hydrate area, the same figure was significantly higher at 37.8%.
In both study areas, some representatives of the genera Stenotrophomonas and Psychrobacter did not have the ability to utilize oil hydrocarbons under anaerobic conditions. Only in the gas-hydrate region, strains belonging to the genera Pseudomonas, Rhodococcus, Nesterenkonia and Pseudomonas did not have the same property. In the non-gas-hydrate area, Curtobacterium, Rhodococcus and Nesterenkonia were unique in their area of discovery.
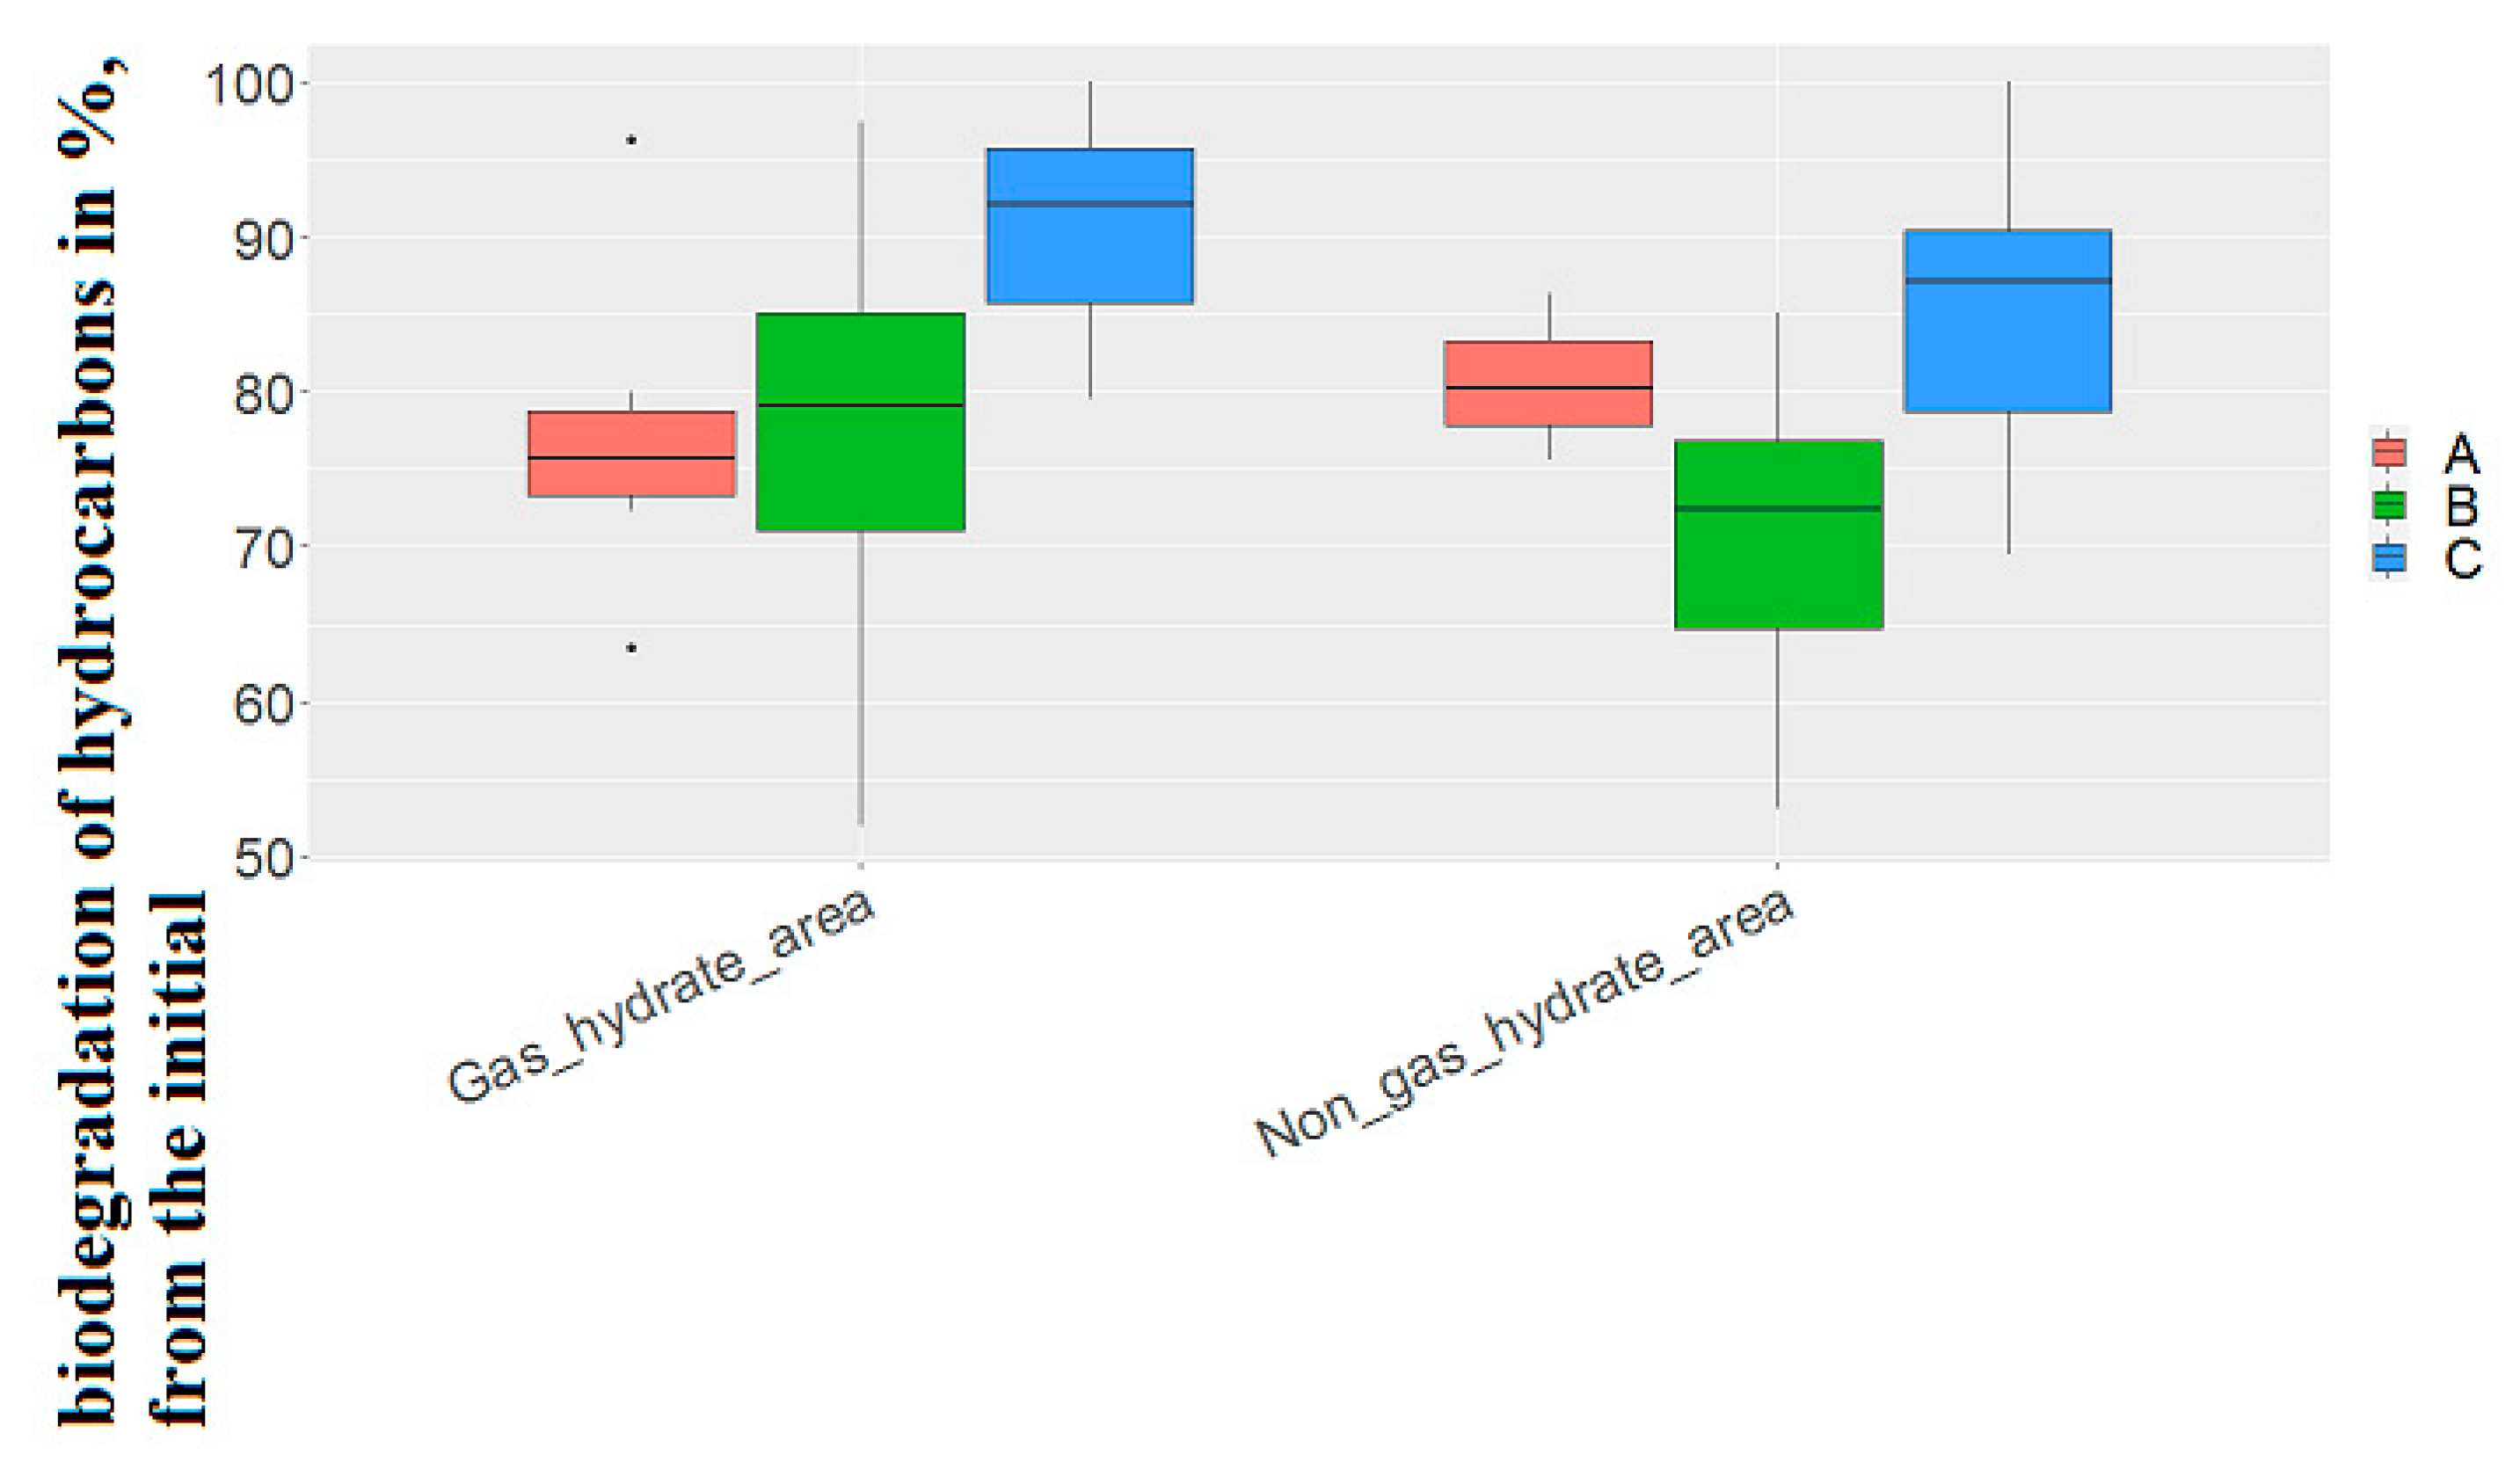
On average, strains capable of utilizing hydrocarbons under both aerobic and anaerobic conditions in the gas-hydrate region had higher values of the degree of hydrocarbon biodegradation (77.22 ± 8.93 and 99.87 ± 6.05 in the gas-hydrate region, 70.1 ± 10.42 and 85.1 ± 8.6% of the initial concentration of hydrocarbons, respectively), and strains capable of oxidizing oil only under aerobic conditions, conversely, had lower values in the non-gas-hydrate region (76.8 ± 9.93-in the gas-hydrate region, 80.7 ± 5.4% of the initial concentration of hydrocarbons, respectively) (
Figure 7).The difference between these values when calculating Student’s t coefficient did not show significant differences.
Given the significant difference between the frequency of detection of strains capable of only aerobic degradation of hydrocarbons in gas-hydrate and non-gas-hydrate area(in more than 20%), this feature is of geomicrobiological significance in identifying the type of gas deposit.
However, this part of the study revealed new properties of some of the tested strains.
Until the present study, there had been no published information on the ability of microorganisms of the genera
Stenotrophomonas,
Psychrobacter,
Micrococcus and
Peribacillus to oxidize oil hydrocarbons under aerobic and anaerobic conditions. For the other genera tested in this study,
Rhodococcus, Pseudomonas and
Bacillus, such an ability has already been described [
13,
23,
39,
40].
All representatives of the genus Bacillus tested by us had the ability to utilize oil, both under aerobic and anaerobic conditions. At the same time, in two strains, the degree of biodegradation of hydrocarbons under aerobic and anaerobic conditions did not have significant differences: in Bacillus sp. (in Bacteria) POI OP54-44/45-3(3), 87.82 ± 3.45 and 89.23 ± 2.72% of the initial concentration, respectively; Bacillus sp. (in Bacteria) POI LV81-19/135-3, 85.06 ± 2.59 and 83.58 ± 3.09% of the initial concentration, respectively. This genus also includes a single strain of Bacillus sp. (in Bacteria) POI OP54-28/198-6, in which the loss of hydrocarbons in the cultivation medium under aerobic conditions was higher than in anaerobic conditions (88.22 ± 2.72 and 80.95 ± 2.41%, of the initial concentration, respectively).
4. Discussion
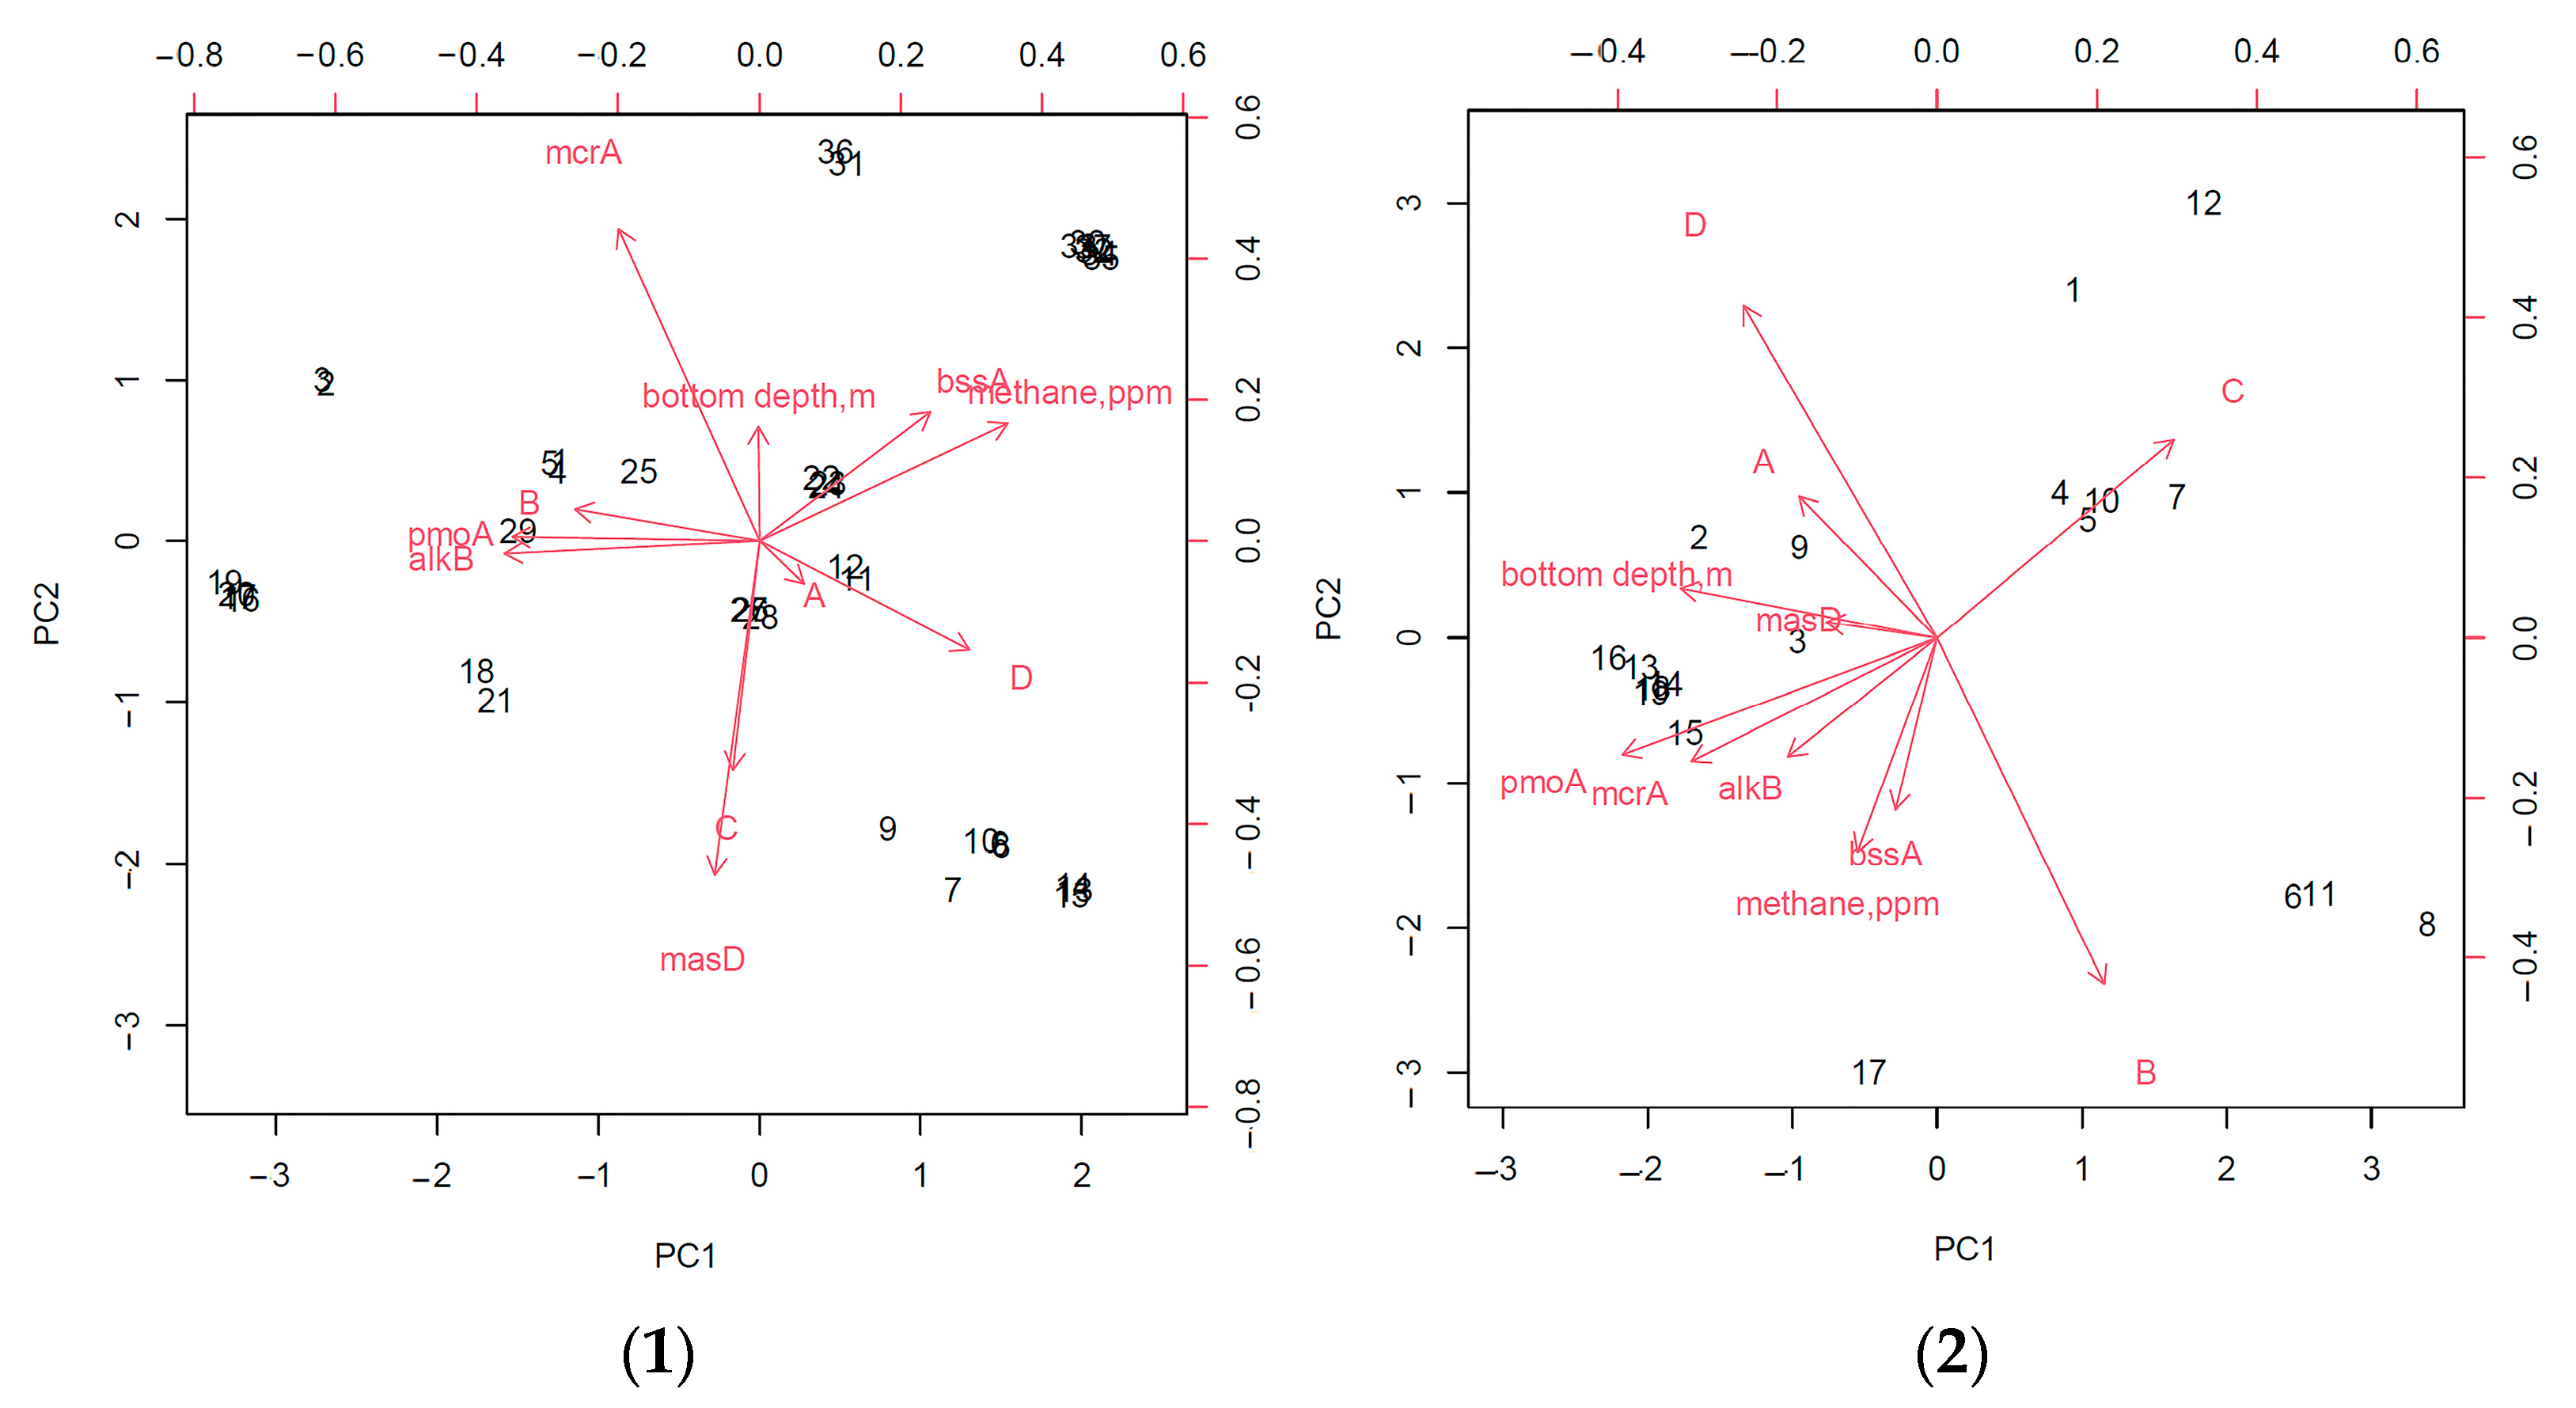
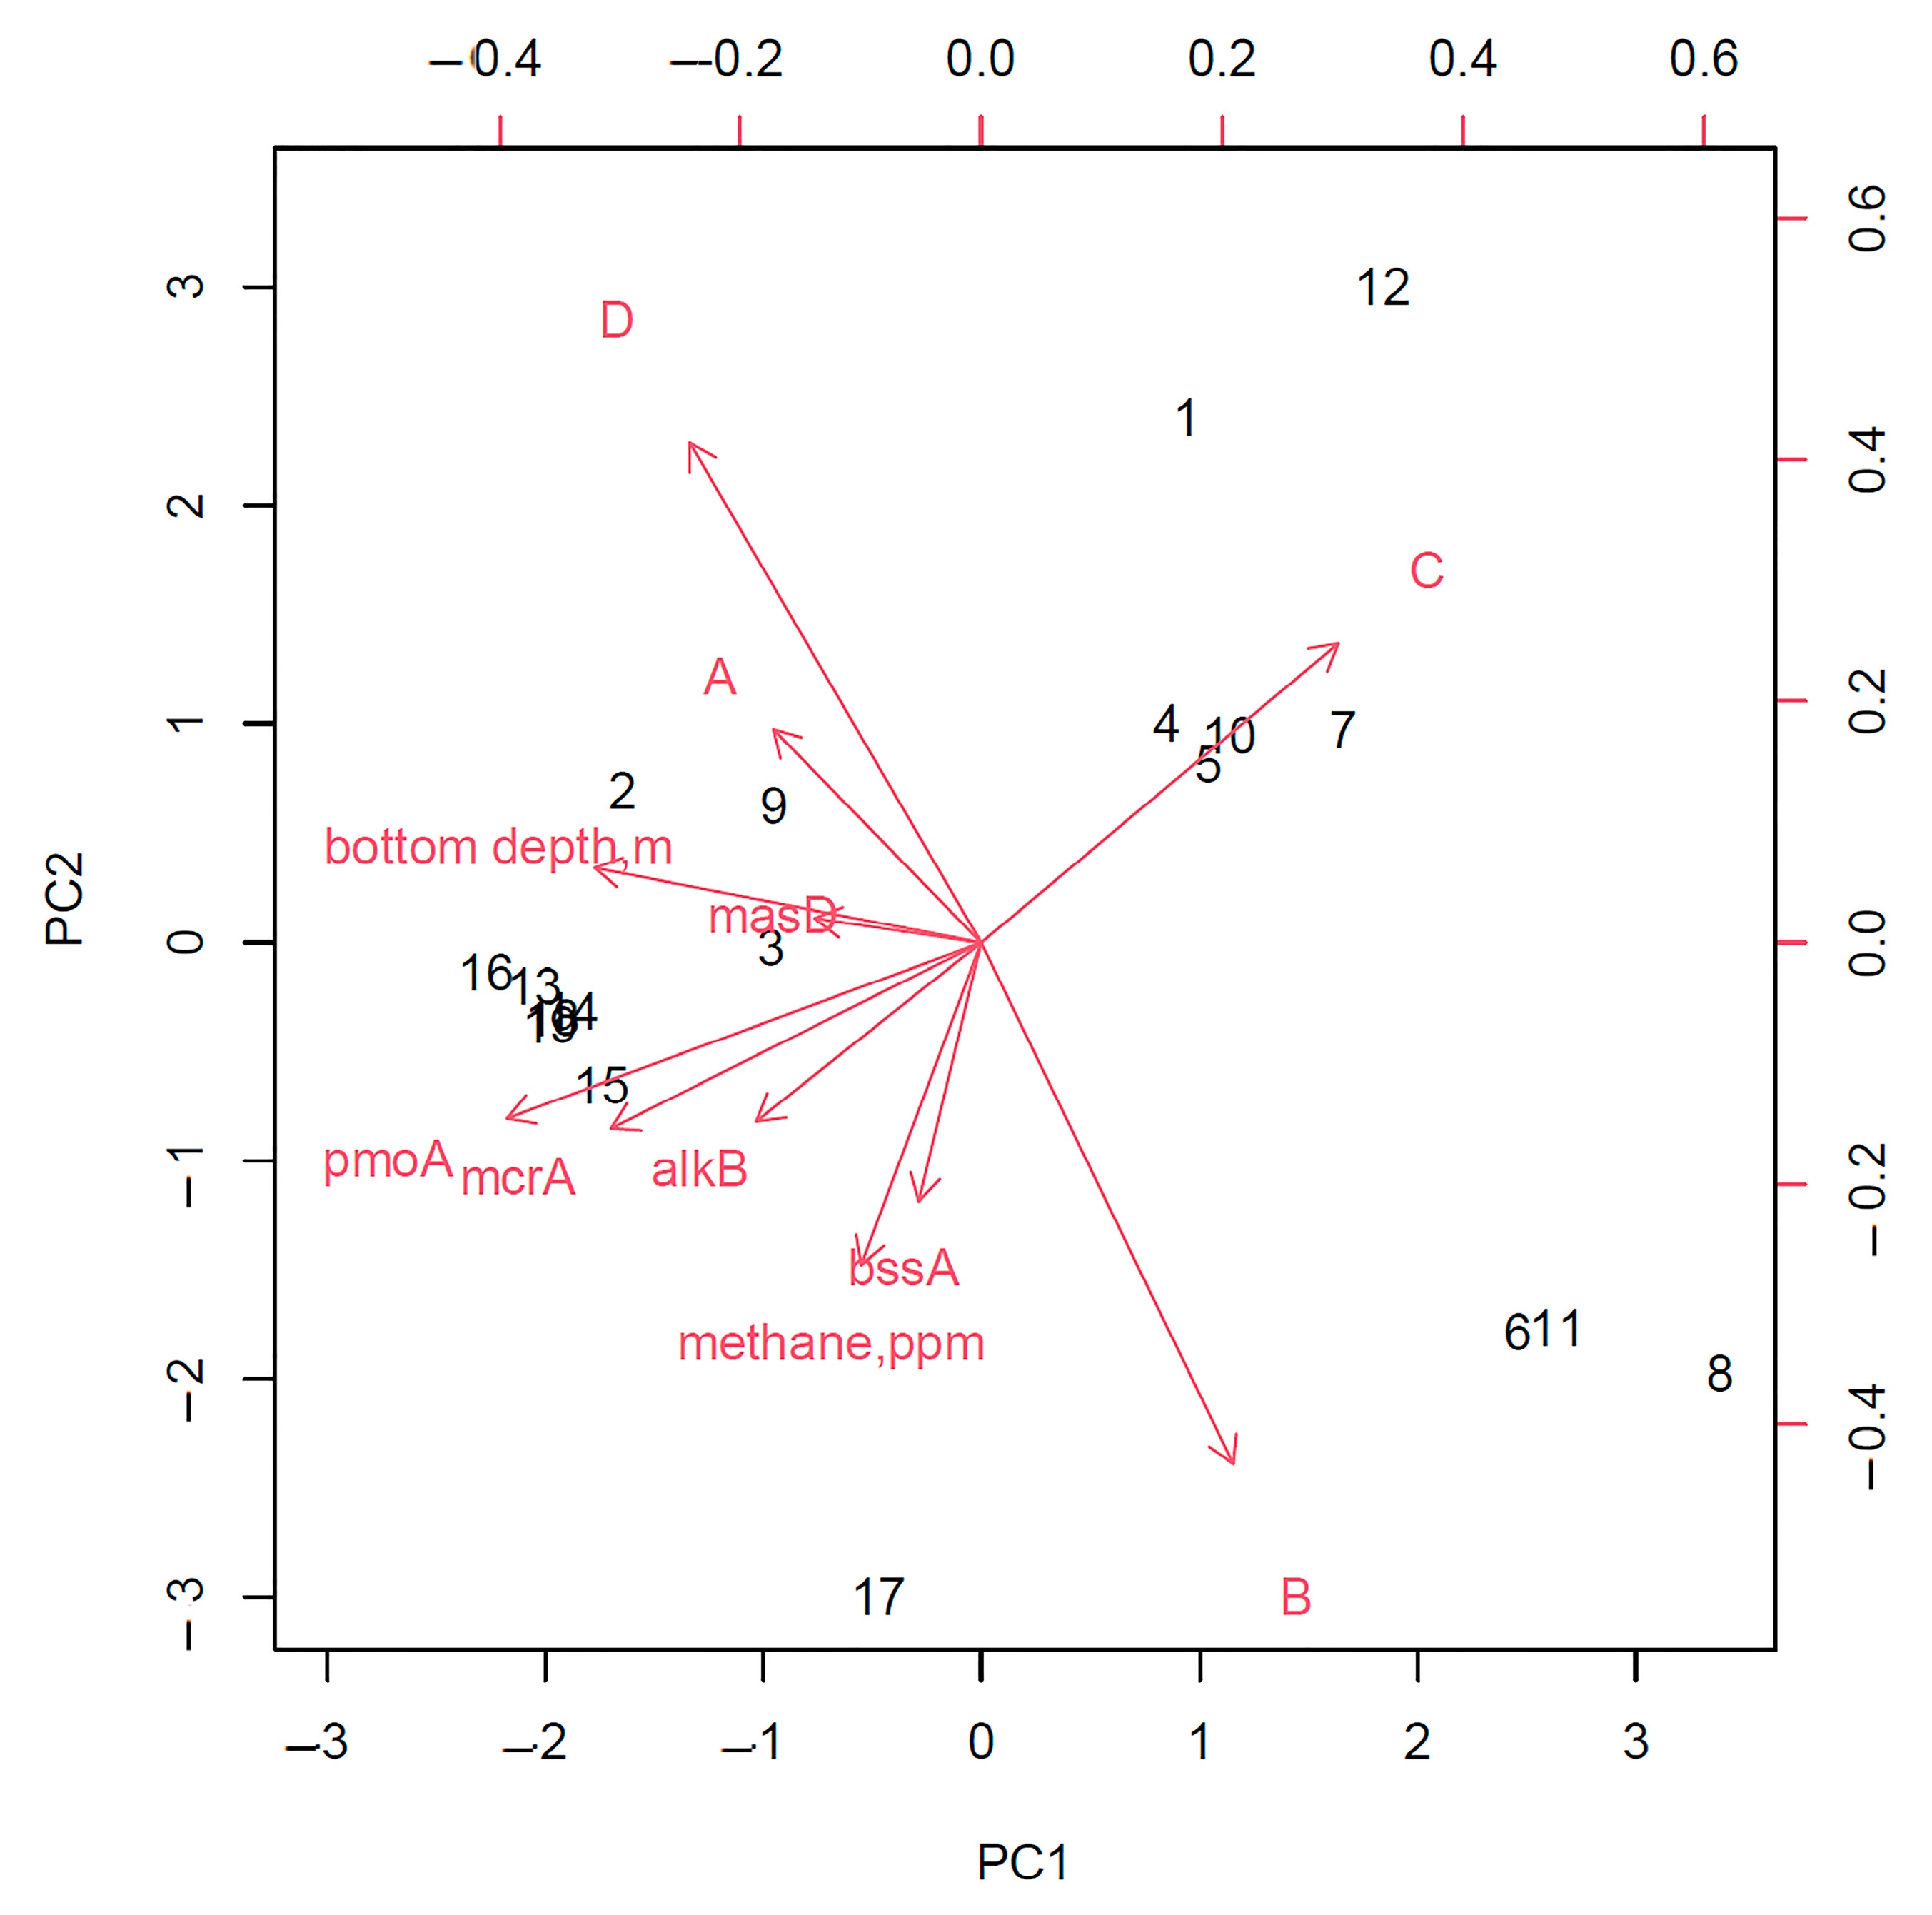
An assessment of the relationship between the analyzed geomicrobiological indicators in the gas-hydrate region showed that the depth of the sampling station, as well as the detection of the bioindicator gene mcrA, made the lowest contribution to the characterization of the region.
An analysis of the principal components of the entire study area without dividing it into zones showed that the frequency of the detection of strains capable of only aerobic degradation of hydrocarbons and the presence of the gene for the anaerobic destruction of linear hydrocarbons,
masD, are most closely related to the area where gas hydrates were found (
Figure 8). In addition, this analysis made revealed a strong relationship between the detection of
pmoA and
alkBB genes, which can be explained by the fact that in areas of fluid discharge in gas fields, methane is often accompanied by heavier linear hydrocarbons [
17,
41]. In addition, the detection of the
bssA gene was correlated with an increase in the intensity of the anaerobic oxidation of hydrocarbons (
Figure 9).
The bacterial community of cultivated hydrocarbon-oxidizing bacteria in bottom sediments, according to the analysis of 16S rRNA, is formed by three phyla—Pseudomonadota (Gammaproteobacteria), Bacillota and Actinomycetota—which is confirmed by the literature data. The largest number of common species for the two study areas belongs to the phylum Pseudomonadota, class Gammaproteobacteria. It was shown that representatives of the genera Pseudomonas, Psychrobacter and Stenotrophomonas dominated in the studied samples of bottom sediments. It was established that representatives of the genus Pseudomonas (29.72%, or 11 out of 37 strains) predominated in the gas-hydrate region, and Psychrobacter (29.4%, or 5 out of 17 strains) dominated in the non-gas-hydrate region. Representatives of the genera Bacillus, Pseudomonas, Stenotrophomonas and Psychrobacter were found in all areas of the study. In addition, the bioindicative properties of some phyla were of greater importance. The confinement of representatives of the Nocardiaceae family of the phylum Actinomycetota to the areas where gas hydrates were found was revealed.
The analysis of the distribution of the studied strains to aerobic and anaerobic destruction and strains capable of only aerobic utilization did not reveal significantly different intensity degrees of biodegradation depending on the type of deposit.
As shown, ability to degradation of carbonaceous air under aerobic and/or anaerobic conditions depends on the genus of the studied strain, since all representatives of the genus Bacillus have the ability to utilize hydrocarbons both under aerobic and anaerobic conditions. In addition, there is a difference in the consumption of hydrocarbons in anaerobic conditions. Anaerobic degradation prevails to a greater extent in representatives of the genera Pseudomonas and Rhodococcus and to a lesser extent in Stenotrophomonas and Bacillus. The last genus belongs to the only strain in our study in which the ability for aerobic degradation dominated over anaerobic degradation by 7.27% (Bacillus sp. (in Bacteria) POI OP54-28/198-6).
5. Conclusions
In conclusion, the bioindicator signs we used made it possible to conduct geomi-crobiological mapping of the study area and show significant differences in the gas-hydrate and non-gas-hydrate areas. The differences primarily consisted of the detection of the anaerobic degradation gene and hydrocarbons, the presence of bioindicator species Rhodococcus sp., and the frequency of the detection of hydrocarbon-oxidizing bacteria capable of only the aerobic degradation of hydrocarbons.
Geomicrobiological indicators have previously been used only to describe the possible presence of an oil and gas reservoir. We propose to use them to describe the type of deposit, which significantly expands the possibility of using geomicrobiological exploration both for research and industrial purposes. Due to the fact that this comparison was carried out for the first time, the mechanisms of the processes that teach the differences between the gas-hydrate and non-gas-hydrate regions require further in-depth study.
The second important result was shown that the ability of hydrocarbon-oxidizing microorganisms to anaerobically utilize hydrocarbons has been greatly underestimated by previous studies. For the first time, we have revealed this ability for 38 out of 55 strains belonging to the genera
Stenotrophomonas,
Psychrobacter,
Micrococcus and
Peribacillus. The evaluation of the rate of utilization of oil hydrocarbons under anaerobic conditions by cultured methods made it possible to identify a large contribution of microorganisms to this process, which was not taken into account using standard biomarker genes. The anaerobic oxidation of hydrocarbon scan likely move not only through the well-known fumarate respiration pathway but also through other pathways: for example, with the help of a peroxide shunt. This mechanism allows for increasing the adaptive mechanisms of bacteria and enables aerobic microorganisms to exist under anaerobic conditions, which has been proven by the example of
Rhodococcus both in our studies and in the literature [
42]. An indirect confirmation of the widespread use of this mechanism is the predominance of the rate of hydrocarbon utilization under anaerobic conditions over aerobic conditions in the same strain, which is described in the literature [
33].
Previous studies of aerobic and anaerobic oxidation of hydrocarbons have not been carried out in depth and only in individual model strains. Therefore, the relationship between the physiological and biochemical characteristics bacteria and the ability to utilize hydrocarbons under aerobic and anaerobic conditions is difficult to establish and requires further in-depth research. At the same time, the ecological role of this phenomenon is determined to be very large. That is why this work highlights the need for deeper study of the geomicrobiological processes of the aerobic and anaerobic oxidation of hydrocarbons in sea bottom sediments.
Supplementary Materials
The following supporting information can be downloaded at:
https://www.mdpi.com/article/10.3390/biology11121802/s1, Figure S1: Phylogenetic tree built on the basis of sequence analysis of 16S rRNA gene fragments of bacteria isolated from bottom sediments of the northern part of the Sea of Japan (gas-hydrate area). Scale bar length: 1 substitution per 100 nucleotides. Evolutionary distances were computed according to maximum-likelihood phylogenetic tree based on 16S rRNA gene. The reliability of each branch was evaluated by bootstrap analysis based on 1000 replications. Figure S2: Phylogenetic tree built on the basis of sequence analysis of 16S rRNA gene fragments of bacteria isolated from bottom sediments of the northern part of the Sea of Japan (non-gas-hydrate area). Scale bar length: 1 substitution per 100 nucleotides. Evolutionary distances were computed according to maximum-likelihood phylogenetic tree based on the 16S rRNA gene. The reliability of each branch was evaluated by bootstrap analysis based on 1000 replications. Table S1: Composition of media used. Table S2: Degree of biodegradation of hydrocarbons by strains isolated from bottom sediments of gas-hydrate area under aerobic and anaerobic conditions. Table S3: Degree of biodegradation of hydrocarbons by strains isolated from bottom sediments of non-gas-hydrate area under aerobic and anaerobic conditions.
Author Contributions
A.L.P.—Idea and writing plan, concept, methodology, approval of the final version of the manuscript; A.I.E.—methodology, conceptualization, correction of the text of the manuscript, validation; R.B.S.—writing conclusions, approval of the final version; N.S.S.—editing and validation of the manuscript; A.A.L.—drawing illustrations and analysis of the literature data; R.A.G.—proofreading of the manuscript, translation of the text collection. All authors have read and agreed to the published version of the manuscript.
Funding
This work was supported by the Ministry of Science and Higher Education, Russian Federation (grant 13.1902.21.0012).
Institutional Review Board Statement
Not applicable.
Informed Consent Statement
Not applicable.
Data Availability Statement
Not applicable.
Acknowledgments
All of the authors would like to acknowledge the financial support for this research project and the collaboration between all the authors. A.L.P. would like to thank Andrei O. Kholmogorov for his help in translating the article.
Conflicts of Interest
The authors declare no conflict of interest.
References
- Köster, M.; Meyer-Reil, L.A. Characterization of carbon and microbial biomass pools in shallow water coastal sediments of the southern Baltic Sea (Nordrügensche Bodden). Mar. Ecol. Prog. Ser. 2001, 214, 25–41. [Google Scholar] [CrossRef] [Green Version]
- Kirkpatrick, J.B.; Walsh, E.A.; D’Hondt, S. Microbial selection and survival in subseafloor sediment. Front. Microbiol. 2019, 10, 1–15. [Google Scholar] [CrossRef] [Green Version]
- Belyaev, S.S.; Lein, A.Y.; Ivanov, M.V. The role of methane-forming and sulfate-reducing bacteria in the processes of destruction of organic matter. Geochemistry 1981, 3, 437–445. [Google Scholar]
- Lein, A.Y.; Ivanov, M.V. Biogeochemical Cycle of Methane in the Ocean; Institude of Microbiology named after S.N. Vinogradsky RAS: Moscow, Russia, 2009; 576p, ISBN 978-5-02-036074-7. [Google Scholar]
- Di Gregorio, S.; Siracusa, G.; Becarelli, S.; Mariotti, L.; Gentini, A.; Lorenzi, R. Isolation and characterization of a hydrocarbonoclastic bacterial enrichment from total petroleum hydrocarbon contaminated sediments: Potential candidates for bioaugmentation in bio-based processes. Environ. Sci. Pollut. Res. Int. 2016, 23, 10587–10594. [Google Scholar] [CrossRef]
- Ehrlich, H.L.; Newman, D.K.; Kappler, A. Ehrlich’s Geomicrobiology; CRC Press: Boca Raton, FL, USA, 2015; 649p. [Google Scholar]
- Rozanova, E.P.; Borzenkov, I.A.; Tarasov, A.L.; Suntsova, L.A.; Dong, C.L.; Belyaev, S.S.; Ivanov, M.V. Microbiological processes in a high-temperature oil field. Microbiology 2001, 70, 102–110. [Google Scholar] [CrossRef]
- Kniemeyer, O.; Musat, F.; Sievert, S.M.; Knittel, K.; Wilkes, H.; Blumenberg, M.; Michaelis, W.; Classen, A.; Bolm, C.; Joye, S.B. Anaerobic oxidation of short–chain hydrocarbons by marine sulphate—reducing bacteria. Nature 2007, 449, 898–901. [Google Scholar] [CrossRef]
- Callaghan, A.V.; Wawrik, B.; NíChadhain, S.M.; Young, L.Y.; Zylstra, G.J. Anaerobic alkane-degrading strain AK-01 contains two alkylsuccinate synthase genes. Biochem. Biophys. Res. Commun. 2018, 366, 142–148. [Google Scholar] [CrossRef]
- Bagwell, C.E.; Formolo, M.; Ye, Q.; Yeager, C.M.; Lyons, T.W.; Zhang, C.L. Direct analysis of sulfate reducing bacterial communities in gas hydrate–impacted marine sediments by PCR–DGGE. J. Basic Microbiol. 2009, 49, 87–92. [Google Scholar] [CrossRef]
- Morris, E.K.; Caruso, T.; Buscot, F.; Fischer, M.; Hancock, C.; Maier, T.S.; Meiners, T.; Müller, C.; Obermaier, E.; Prati, D.; et al. Choosing and using diversity indices: Insights for ecological applications from the German Biodiversity Exploratories. Ecol. Evol. 2014, 4, 3514–3524. [Google Scholar] [CrossRef] [Green Version]
- Ciobanu, M.C.; Burgaud, G.; Dufresne, A.; Breuker, A.; Rédou, V.; Ben Maamar, S.; Gaboyer, O.; Vandenabeele–Trambouze, J.S.; Lipp, A.; Schippers, P.; et al. Microorganisms persist at record depths in the subseafloor of the Canterbury Basin. ISME J. 2014, 8, 1370–1380. [Google Scholar] [CrossRef] [Green Version]
- Li, C.H.; Ye, C.; Hou, X.P.; Chen, M.H.; Zheng, X.Y.; Cai, X.Y. Isolation and characterization of polycyclic aromatic hydrocarbon-degrading bacteria with tolerance to hypoxic environments. J. Environ. Sci. Health A Tox Hazard Subst. Environ. Eng. 2017, 52, 581–589. [Google Scholar] [CrossRef]
- Tratsiak, K.; Prudnikova, T.; Drienovska, I.; Damborsky, J.; Brynda, J.; Pachl, P.; Kuty, M.; Chaloupkova, R.; Rezacova, P.; Kuta Smatanova, I. Crystal structure of the cold-adapted haloalkane dehalogenase DpcA from Psychrobacter cryohalolentis K5. Acta Crystallogr. F Struct. Biol. Commun. 2019, 75 Pt 5, 324–331. [Google Scholar] [CrossRef]
- Garrido-Sanz, D.; Redondo-Nieto, M.; Martín, M.; Rivilla, R. Comparative Genomics of the Rhodococcus Genus Shows Wide Distribution of Biodegradation Traits. Microorganisms 2020, 8, 774. [Google Scholar] [CrossRef]
- Obzhirov, A.I.; Telegin, Y.A.; Boloban, A.V. Flows of methane and gas hydrates in the Sea of Okhotsk. Underw. Res. Robot. 2015, 19, 56–63. [Google Scholar]
- Jin, Y.K.; Shoji, H.; Obzhirov, A.; Baranov, B. (Eds.) Operation Report of Sakhalin Slope Gas-hydrate Project 2012; Akademik, R.V.; Lavrentyev, M.A. Cruise 59; Korea Polar Research Institute: Incheon, Korea, 2013; 163p. [Google Scholar]
- Lanoil, B.D.; Sassen, R.; La Duc, M.T.; Sweet, S.T.; Nealson, K.H. Bacteria and Archaea physically associated with Gulf of Mexico gas hydrates. Appl. Environ. Microbiol. 2001, 67, 5143–5153. [Google Scholar] [CrossRef] [Green Version]
- Case, D.H.; Pasulka, A.L.; Marlow, J.J.; Grupe, B.M.; Levin, L.A.; Orphan, V.J. Methane seep carbonates host distinct, diverse, and dynamic microbial assemblages. Mbio 2015, 6, e01348-15. [Google Scholar] [CrossRef] [Green Version]
- Kotlar, H.K.; Lewin, A.; Johansen, J.; Throne-Holst, M.; Haverkamp, T.; Markussen, S.; Winnberg, A.; Ringrose, P.; Aakvik, T.; Ryeng, E.; et al. High coverage sequencing of DNA from microorganisms living in an oil reservoir 2.5 kilometres subsurface. Environ. Microbiol. Rep. 2011, 3, 674–681. [Google Scholar] [CrossRef]
- Gittel, A.; Donhauser, J.; Røy, H.; Girguis, P.R.; Jørgensen, B.B.; Kjeldsen, K.U. Ubiquitous presence and novel diversity of anaerobic alkane degraders in cold marine sediments. Front. Microbiol. 2015, 6, 1414. [Google Scholar] [CrossRef] [Green Version]
- Kravchenko, I.K.; Kizilova, A.K.; Bykova, S.A.; Men’ko, E.V.; Gal’chenko, V.F. Molecular analysis of enrichment crops with high affinity to methane isolated from soils of forest biocenosis and agrocenoses. Microbiology 2010, 79, 114–122. [Google Scholar] [CrossRef]
- Cason, E.D.; Vermeulen, J.G.; Müller, W.J.; van Heerden, E.; Valverde, A. Aerobic and anaerobic enrichment cultures highlight the pivotal role of facultative anaerobes in soil hydrocarbon degradation. J. Environ. Sci. Health A Tox Hazard Subst. Environ. Eng. 2019, 54, 408–415. [Google Scholar] [CrossRef]
- Domingues, P.M.; Oliveira, V.; Serafim, L.S.; Gomes, N.C.M.; Cunha, Â. Biosurfactant Production in Sub-Oxic Conditions Detected in Hydrocarbon-Degrading Isolates from Marine and Estuarine Sediments. Int. J. Environ. Res. Public Health 2020, 17, 1746. [Google Scholar] [CrossRef] [Green Version]
- Peng, C.; Wan, X.; Zhang, J.; Zhang, B.; Wang, S.; Ma, T.; Bian, Y.; Wang, W. Bacterial diversity and competitors for degradation of hazardous oil refining waste under selective pressures of temperature and oxygen. J. Hazard Mater. 2022, 427, 128201. [Google Scholar] [CrossRef]
- Hassanshahian, M.; Ahmadinejad, M.; Tebyanian, H.; Kariminik, A. Isolation and characterization of alkane degrading bacteria from petroleum reservoir waste water in Iran (Kerman and Tehran provenances). Mar. Pollut. Bull. 2013, 73, 300–305. [Google Scholar] [CrossRef]
- Chayabutra, C.; Ju, L.K. Degradation of n-hexadecane and its metabolites by Pseudomonas aeruginosa under microaerobic and anaerobic denitrifying conditions. Appl. Environ. Microbiol. 2000, 66, 493–498. [Google Scholar] [CrossRef] [Green Version]
- Tourova, T.; Sokolova, D.S.; Semenova, E.M.; Poltaraus, A.B.; Nazina, T.N. Diversity of the alkB Genes of n–Alkane Biodegradation in Thermophilic Hydrocarbon–Oxidizing Bacteria of the Genera Geobacillus, Parageobacillus, and Aeribacillus. Microbiology 2018, 87, 301–307. [Google Scholar] [CrossRef]
- Li, C.H.; Zhou, H.W.; Wong, Y.S.; Tam, N.F. Vertical distribution and anaerobic biodegradation of polycyclic aromatic hydrocarbons in mangrove sediments in Hong Kong, South China. Sci. Total Environ. 2009, 407, 5772–5779. [Google Scholar] [CrossRef]
- Winderl, C.; Schaefer, S.; Lueders, T. Detection of anaerobic toluene and hydrocarbon degraders in contaminated aquifers using benzylsuccinate synthase (bssA) genes as a functional marker. Environ. Microbiol. 2007, 9, 1035–1046. [Google Scholar] [CrossRef]
- Springer, E.; Sachs, M.S.; Woese, C.R.; Boone, D.R. Partial gene sequences for the A subunit of methyl-coenzyme Mreductase (mcrI) as a phylogenetic tool for the family Methano-sarcinaceae. Int. J. Syst. Bacteriol. 1995, 45, 554–559. [Google Scholar] [CrossRef] [Green Version]
- Amouric, A.; Quéméneur, M.; Grossi, V.; Liebgott, P.P.; Auria, R.; Casalot, L. Identification of different alkane hydroxylase systems in Rhodococcus ruber strain SP2B, an hexane–degrading actinomycetes. J. Appl. Microbiol. 2010, 108, 1903–1916. [Google Scholar] [CrossRef]
- Sazykin, I.; Makarenko, M.; Khmelevtsova, L.; Seliverstova, E.; Rakin, A.; Sazykina, M. Cyclohexane, naphthalene, and diesel fuel increase oxidative stress, CYP153, sodA, and recA gene expression in Rhodococcus erythropolis. MicrobiologyOpen 2019, 8, e855. [Google Scholar] [CrossRef] [Green Version]
- Marmur, J. A procedure for the isolation of deoxyribonucleic acid from microorganisms. J. Mol. Biol. 1961, 3, 208–218. [Google Scholar] [CrossRef]
- Bian, X.Y.; Maurice Mbadinga, S.; Liu, Y.F.; Yang, S.Z.; Liu, J.F.; Ye, R.Q.; Ye, J.-D.; Gu, B.; Mu, B.Z. Insights into the anaerobic biodegradation pathway of n–alkanes in oil reservoirs by detection of signature metabolites. Sci. Rep. 2015, 5, 9801. [Google Scholar] [CrossRef] [PubMed] [Green Version]
- Seki, T.; Matsumoto, A.; Ōmura, S.; Takahashi, Y. Distribution and isolation of strains belonging to the order Solirubrobacterales. J. Antibiot. 2015, 68, 763–766. [Google Scholar] [CrossRef] [PubMed]
- Altschul, S.F.; Madden, T.L.; Schäffer, A.A.; Zhang, J.; Zhang, Z.; Miller, W.; Lipman, D.J. Gapped BLAST and PSI–BLAST: A new generation of protein database search programs. Nucleic Acids Res. 1997, 25, 3389–3402. [Google Scholar] [CrossRef] [PubMed] [Green Version]
- Letunic, I.; Bork, P. Interactive Tree Of Life (iTOL) v5: An online tool for phylogenetic tree display and annotation. Nucleic Acids Res. 2021, 49, W293–W296. [Google Scholar] [CrossRef]
- Tribelli, P.M.; Rossi, L.; Ricardi, M.M. Gomez-Lozano M, Molin S, RaigerIustman LJ, Lopez NI. Microaerophilic alkane degradation in Pseudomonas extremaustralis: A transcriptomic and physiological approach. J. Ind. Microbiol. Biotechnol. 2018, 45, 15–23. [Google Scholar] [CrossRef]
- Verma, V.; Aggarwal, R.K. A comparative analysis of similarity measures akin to the Jaccard index in collaborative recommendations: Empirical and theoretical perspective. Soc. Netw. Anal. Min. 2020, 10, 43. [Google Scholar] [CrossRef]
- Xiao, Y.; Jiang, R.; Wu, X.; Zhong, Q.; Li, Y.; Wang, H. Comparative Genomic Analysis of Stenotrophomonas maltophilia Strain W18 Reveals Its Adaptative Genomic Features for Degrading Polycyclic Aromatic Hydrocarbons. Microbiol. Spectr. 2021, 9, e0142021. [Google Scholar] [CrossRef]
- Fan, J.; Jia, Y.; Xu, D.; Ye, Z.; Zhou, J.; Huang, J.; Fu, Y.; Shen, C. Anaerobic condition induces a viable but nonculturable state of the PCB-degrading Bacteria Rhodococcus biphenylivorans TG9. Sci. Total Environ. 2021, 764, 142849. [Google Scholar] [CrossRef]
| Publisher’s Note: MDPI stays neutral with regard to jurisdictional claims in published maps and institutional affiliations. |
© 2022 by the authors. Licensee MDPI, Basel, Switzerland. This article is an open access article distributed under the terms and conditions of the Creative Commons Attribution (CC BY) license (https://creativecommons.org/licenses/by/4.0/).

 ,
, 


