Article

Analysis of Physiological and Transcriptomic Differences between a Premature Senescence Mutant (GSm) and Its Wild-Type in Common Wheat (Triticum aestivum L.)

State Key Laboratory of Sustainable Dryland Agriculture, College of Agriculture, Shanxi Agricultural University, Jinzhong 030801, China
*
Author to whom correspondence should be addressed.
Biology 2022, 11(6), 904; https://doi.org/10.3390/biology11060904
Submission received: 27 April 2022 / Revised: 9 June 2022 / Accepted: 10 June 2022 / Published: 12 June 2022
(This article belongs to the Collection Abiotic Stress Tolerance in Cereals)

Abstract

:

Simple Summary

Early leaf senescence is an important agronomic trait that affects crop yield and quality. To understand the molecular mechanism of early leaf senescence, a wheat (Triticum aestivum L.) premature leaf senescence mutant (GSm) and its wild type were employed in this study. We compared the physiological characteristics and transcriptome of wheat leaves between the wild type (WT) and the mutant at two-time points. Physiological characteristics and differentially expressed gene (DEG) analysis revealed many genes and metabolic pathways that were closely related to senescence. These results will not only support further gene cloning and functional analysis of GSm, but also facilitate the study of leaf senescence in wheat.

Abstract

Premature leaf senescence has a profound influence on crop yield and quality. Here, a stable premature senescence mutant (GSm) was obtained from the common wheat (Triticum aestivum L.) cultivar Chang 6878 by mutagenesis with ethyl methanesulfonate. The differences between the GSm mutant and its wild-type (WT) were analyzed in terms of yield characteristics, photosynthetic fluorescence indices, and senescence-related physiological parameters. RNA sequencing was used to reveal gene expression differences between GSm and WT. The results showed that the yield of GSm was considerably lower than that of WT. The net photosynthetic rate, transpiration rate, maximum quantum yield, non-photochemical quenching coefficient, photosynthetic electron transport rate, soluble protein, peroxidase activity, and catalase activity all remarkably decreased in flag leaves of GSm, whereas malondialdehyde content distinctively increased compared with those of WT. The analysis of differentially expressed genes indicated blockade of chlorophyll and carotenoid biosynthesis, accelerated degradation of chlorophyll, and diminished photosynthetic capacity in mutant leaves; brassinolide might facilitate chlorophyll breakdown and consequently accelerate leaf senescence. NAC genes positively regulated the senescence process. Compared with NAC genes, expression of WRKY and MYB genes was induced earlier in the mutant possibly due to increased levels of reactive oxygen species and plant hormones (e.g., brassinolide, salicylic acid, and jasmonic acid), thereby accelerating leaf senescence. Furthermore, the antioxidant system played a role in minimizing oxidative damage in the mutant. These results provides novel insight into the molecular mechanisms of premature leaf senescence in crops.

1. Introduction

Common wheat (Triticum aestivum L.) is one of the world’s major cereal crops and it provides ~20% of global calorie consumption (https://www.fao.org/faostat/en/#data accessed on 29 November 2021). The global wheat consumption has grown to ~700 million tons year–1 over the past four years [1]. Grain yield of common wheat depends primarily on the accumulation of photosynthetic products in functional leaves during the grain-filling stage. Therefore, prolonging leaf stay-green and photosynthesis duration is pivotal to achieve high wheat yield [2].
Plant premature senescence refers to the phenomenon that plants undergo physiological decline in advance in the normal functional period, which is usually caused by external environmental stress or self-gene mutation [3,4]. Usually accompanied by the change of leaf color, the stability of photosynthetic pigments decreases, the photosynthetic rate decreases, the transportation capacity of leaves decreases, the content and activity of various reactive oxygen species scavengers decrease, and eventually the plants die prematurely [5]. The leaves are a vital organ for crop photosynthesis, so that premature leaf senescence not only determines crop yield but also influences crop quality [6,7]. Progression of senescence is followed by an increase in the degradation of RNA, protein, lipid and DNA degradation to be recycled into the sink organ [8]. About 80% of nitrogen contained in the grain is provided by the salvaging of chloroplast proteins during the senescence process [9]. Delaying senescence and increasing the length of photosynthetic activity have been reported to increase grain yield, while increasing the rate of amino acid remobilization to degrade proteins in accelerated senescence can increase the grain protein content [10]. Understanding the cause of premature leaf senescence is crucial to elucidate the molecular mechanisms of plant senescence and source/sink relations.
Many premature senescence mutants have been found in crops, yet the causes of premature senescence are variable. The most common type of plant premature senescence arises from mutations in genes related to chlorophyll metabolism. For example, elevations in NYC1, SGR, PPH, and PAO gene expression levels lead to earlier leaf senescence in Arabidopsis thaliana [11]. Additionally, gene silencing of CHLI and CHLD results in a premature senescence mutant in pea (Pisum sativum L), which exhibits a yellow leaf phenotype and diminished magnesium chelatase activity [12]. Owing to CHLI gene mutation, the plant leaves of a tobacco (Nicotiana tabacum L.) premature senescence mutant present a golden yellow color [13]. Furthermore, a corn (Zea mays L.) yellow-green leaf mutant, ygl-1, shows premature senescence because of decreased chlorophyll and carotenoid content [14].
The second type of plant premature senescence is attributed to gene mutations induced by abnormal development of chloroplasts. An example is barley (Hordeum vulgare L.) plastome mutant, cytoplasmic line 2 (CL2), in which the seedling phenotype is changed from light green to albino color at emergence as a result of abnormal chloroplast development [15]. Moreover, the mgd1 mutant of A. thaliana shows premature senescence due to mutation in the MGD1 gene of lipid monogalactosyldiacylglycerol (MGD) synthase, which catalyzes biosynthesis of MGD, a major structural component of the photosynthetic membrane in chloroplasts [16]. In another A. thaliana mutant, pca, both the cotyledons and leaves are light-yellow or white in color owing to abnormal chloroplast development [17].
The third type of plant premature senescence is triggered by mutations in protease genes. For example, a transposon insertion leads to alternative splicing errors in two pre2 alleles (encoding phytochrome-dependent late-flowering protein PHL) of the corn mutant pre2, causing deletion of multiple glutamines near the C-terminus of mature transcripts and consequently premature senescence of plants [18]. A single nucleotide deletion in the open reading frame of pectate lyase contributes to premature leaf senescence in the ospse1 mutant of rice (Oryza sativa L.) [19]. Because the pho2 protein encoded by pho2 is abnormal in the A. thaliana mutant pho2, substantial accumulation of phosphorus occurs in the shoots, resulting a spotted and yellowing phenotype [20].
The fourth type of plant premature senescence is due to mutations in genes related to hormone equilibrium. For example, exogenous application of jasmonic acid (JA) leads to earlier senescence in attached and detached leaves of wild-type (WT) A. thaliana, but fails to induce premature senescence in plants of the JA-insensitive mutant coi1; this suggests that JA signaling is required for JA to facilitate leaf senescence [21]. Endogenous levels of abscisic acid (ABA) in the rice premature senescence mutant psl85 increase considerably in the late stage of aging, indicating that psl85 takes part in ABA-induced leaf senescence [22]. Compared with WT, the tobacco leaf senescence mutant yl1 shows higher mones [23]. An auxin-auxotrophic mutant of tobacco, IVA3, shows premature death [24].
The fifth type of plant premature senescence is caused by transcription factor mutations. Some senescence-related transcription factors are reported to participate in the regulation of plant hormone levels and then influence leaf senescence. For example, a novel WRKY-type leaf senescence promoter, TaWRKY42-B, has been identified in common wheat. TaWRKY42-B interacts with AtLOX3 and its orthologous TaLOX (TraesCS4B02G295200) to facilitate JA biosynthesis and thereby accelerate initiation of leaf senescence [25]. WRKY57 plays a major role in JA-induced leaf senescence [26], while WRKY45 regulates leaf senescence by modulating GA signaling pathway [27]. ABF2/3/4 and ABI5 accelerate chlorophyll degradation and leaf senescence through promoting ABA biosynthesis [28]. Plant premature senescence can also be caused by environmental induction [29,30], reactive oxygen species (ROS) damage [31], carbohydrate biosynthesis blockade [32], and energy metabolism blockade [33,34].
In recent years, along with the development of high-throughput sequencing technology, transcriptome sequencing (RNA-seq) has emerged as a powerful tool to study complex biological processes at the molecular level and identify candidate genes involved in specific biological functions. There is no exception for premature senescence in plants, such as the mechanisms of leaf color formation in an anthurium (Anthurium andraeanum Linden cv. ‘Sonate’) mutant [35], the mechanisms of yellow leaf mutation in crape myrtle (Lagerstroemia indica L.) [36], and the gene regulatory networks of premature leaf senescence in corn [37], rice [38], and wheat [39,40].
In an earlier study, we used ethyl methane sulfonate (EMS) to treat the common wheat cultivar Chang 6878 and found a premature-senescence homozygous mutant in M3. Senescence was initiated in first leaf of the mutant in the three-leaf stage; subsequently, in the three-leaf-one-leaflet stage, the first leaf turned yellow except for its leaf base, whereas the second leaf started yellowing and senescence at its leaf tip, showing an overall trend of growing with senescence. Accordingly, the mutant was designated Growing with Senescence mutant (GSm). To understand the cause of premature senescence in the mutant, we first measured associated physiological parameters in GSm and WT. Then, we carried out RNA-seq analysis of flag leaves in GSm and WT for two stages after leaf full expansion (2 d, S1; 9 d, S2). The aim of this study was to unravel the cause of premature senescence in the GSm mutant at the transcriptomic level.

2. Materials and Methods

2.1. Experimental Material Preparation and Agronomic Analysis

In 2013, we used EMS to mutagenize the common wheat cultivar Chang 6878. The mutagenized material was continuously planted in the experimental base of the Wheat Research Institute, Shanxi Academy of Agricultural Sciences (Linfen, Shanxi Province, China) during 2013–2017. A mutant with a stable mutant phenotype, designated GSm, was formed after multiple generations of self-crossing. From 2017 to 2021, the mutant GSm and WT were planted in the wheat experimental field (37°25′ N, 112°25′ E) in the College of Agriculture, Shanxi Agricultural University (Jinzhong, Shanxi Province, China). During this period, the obtained genetically stable homozygous GSm and WT were used to observe their phenotypic differences throughout the whole growth period in 2019. Ten mutant and WT plants with uniform growth were selected at random after maturity to investigate agronomic traits such as plant height, thousand-grain weight, and seed setting rate. The mean trait values of the 10 selected plants were used for data analysis.

2.2. Measurement of Photosynthetic Performance

GSm and WT plants (nine each) with uniform growth were selected at random after wheat flag leaves were fully unfolded. The plants were marked for subsequent measurements of chlorophyll content and photosynthetic fluorescence characteristics from the day of leaf full expansion to maturity at 3 d intervals. The relative chlorophyll content (SPAD value) was measured on flag leaves using a chlorophyll meter (SPAD-502; Minolta, Osaka, Japan). Pn and Tr were measured at 9:00–11:00 using a handheld photosynthesis system (CI-340; CID, Beijing, China). Fv/Fm, NPQ, and ETR were measured in the middle part of the leaf using a portable modulated chlorophyll fluorometer (MINI-PAM; Walz, Effeltrich, Germany) after dark treatment (20 min) with a dark treatment clip.

2.3. Analysis of Senescence-Related Physiological Parameters

After full expansion of wheat flag leaves, GSm and WT plants (50 each) with uniform growth were selected at random and marked for subsequent sampling. Flag leaf of main spike were sampled at 3 d intervals from the day of full leaf expansion to maturity. MDA content was analyzed with 5% thiobarbituric acid [41,42], and soluble protein content was determined using Coomassie brilliant blue [43]. CAT activity was assayed by UV absorption spectroscopy [44] and POD activity was determined with guaiacol as the substrate [45].

2.4. RNA Extraction, Library Construction, and Sequencing

WT and GSm seeds were sown in Shanxi (China) on 4 October 2020. The flag leaves of WT and GSm were collected at 2 d after full expansion of flag leaves, denoted as WS1 and MS1, respectively. The flag leaves of WT and GSm were collected again at 9 d after full expansion of flag leaves, denoted as WS2 and MS2, respectively. A total of 12 samples from three biological replicates of WT and GSm were used to construct cDNA libraries. All samples were immediately frozen in liquid nitrogen and stored at −80 °C until RNA extraction. Total RNA was extracted using Trizol reagent (Invitrogen Life Technologies, Shanghai, China) and then treated with RNase-free DNase I (TaKaRa, Dalian, China). RNA purity and integrity were checked prior to cDNA library construction. The cDNA library construction and Illumina sequencing of the 12 RNA samples were completed by Shanghai Majorbio Co., Ltd. (Shanghai, China).

2.5. Bioinformatics Analysis of RNA-Seq Data

The raw reads were cleaned by removing adapter and low-quality sequences. The clean reads were mapped to a cDNA database from the wheat variety Chinese Spring (IWGSC_RefSeq_v1.1). The gene length and sequencing depth were normalized by TPM (Transcripts Per Million reads). Differences in RNA transcript levels were analyzed using DESeq2 and edgeR. p-adjusted < 0.05 and |log2(fold-change)| ≥ 1 were set as the threshold for identifying DEGs. GO enrichment analysis of DEGs was performed using the GO database (http://www.geneontology.org accessed on 16 April 2022). KEGG pathway enrichment analysis was performed on DEGs using the KEGG database (http://www.genome.jp/kegg/ accessed on 16 April 2022). All raw reading sequences were uploaded in NCBI’s sequence read archive (SRA) under the accession number PRJNA823852.

2.6. Quantitative Reverse-Transcription PCR

To verify the accuracy of the transcriptome data, we randomly selected multiple DEGs for expression analysis by qRT-PCR. According to the instructions of RNAiso Plus (9108) extraction reagent (TaKaRa), the total RNA of leaves of different periods and varieties was extracted. Select RNA of good quality extracted as template, and perform reverse transcription according to the instructions of PrimeScript™ RT reagent Kit with gDNA Eraser (Perfect Real Time) (RR047) reverse transcription kit (TaKaRa). qRT-PCR was performed in a 96-well fluorescence quantitative PCR machine CFX96 (BIO-RAD, Hercules, CA, USA) according to the instructions of TB Green® Premix Ex Taq ™ II (Tli RNaseH Plus) (RR820) fluorescence quantitative kit (TaKaRa). The reaction system was 10 μL of TB Green Premix Ex Taq II, 0.4 μL of ROX, 0.4 μL each of pre- and post-quantitative primers (10 μM), 7.8 μL of ddH2O, and 1 μL of template cDNA. The reaction program was: 95 °C, 3 min; 95 °C, 20 s, 60 °C, 20 s, 72 °C, 20 s, 40 cycles, the fluorescence signal was collected after each cycle, and then entered the melting curve stage, 60 °C, 5 s, start at 65 °C, increase to 95 °C in steps of 0.5 °C, and hold each temperature for 5 s. Supplementary Table S7 lists the specific primer sequences, with Actin as the internal reference.

3. Results

3.1. Manifestations of the Premature Senescence Mutant (GSm)

The GSm mutant was acquired from the common wheat cultivar Chang 6878 by EMS mutagenesis. Leaf yellowing and senescence were initiated at the tip of the first leaf in GSm during the three-leaf stage. Then, the first leaf turned yellow in most part of it (except for leaf base), while yellowing and senescence were initiated at the tip of the second leaf during the three-leaf-one-leaflet stage. After that, the first leaf turned completely yellow, the second leaf also turned yellow in most part of it (except for leaf base), while senescence was initiated at the tip of the third leaf in the four-leaf stage. The leaf senescence occurred in a progressive manner. Along with the growth of the plants, completely fully unfolded leaves started yellowing after the jointing stage. The yellowing was initiated in flag leaves from the heading stage, and all leaves turned yellowish green in the early grain-filling stage. Compared with WT, F1 plants had no difference in the seedling stage and their basal leaves gradually turned yellow from the jointing stage. The rate of senescence in F1 plants was distinctively lower than that of the GSm mutant, yet greater than that of WT (Figure 1).
Then, we measured plant agronomic traits in the GSm mutant and WT. Except for number of sterile spikelets, flag leaf length, and penultimate leaf length, all other agronomic trait values significantly decreased in GSm than in WT. Among these, yield per plant of GSm decreased most prominently, accounting for only 18.11% of WT. The second largest decrease occurred in main spike grain weight of GSm, which accounted for 25.94% of WT, and its thousand-grain weight accounted for 48.97% of WT. The results suggest that yield was seriously influenced by premature senescence in the GSm mutant (Table 1).

3.2. Differences in Physiological Traits between the Premature Senescence Mutant (GSm) and Its Wild-Type

We analyzed chlorophyll content and photosynthetic fluorescence characteristics in flag leaves of WT and the GSm mutant from leaf full expansion to senescence and death. All SPAD values of WT were higher than those of GSm (Figure 2A). The analysis of senescence characteristic parameters indicated that senescence was initiated in fully unfolded flag leaves of GSm at 2.84 d, which was much earlier than 39.13 d in WT. Similarly, leaf senescence ended in GSm at 24.13 d, while this occurred in WT at 54.67 d (Table 2). Among the photosynthetic fluorescence indices of WT, the net photosynthetic rate (Pn), transpiration rate (Tr), efficiency of primary conversion of light energy of photosystem II (Fv/Fm), and non-photochemical quenching coefficient (NPQ) were all remarkably higher than those of GSm throughout the whole measurement period, except for the apparent photosynthetic electron transport rate (ETR; Figure 2B–F).
We also measured malondialdehyde (MDA) content, soluble protein content, peroxidase (POD) activity, and catalase (CAT) activity in flag leaves of WT and the GSm mutant during the senescence stage. MDA content in the flag leaves showed an overall upward trend in the wake of leaf senescence, and the increase was faster in GSm than in WT (Figure 3A). Conversely, soluble protein content displayed an overall downward trend, with considerably higher values for GSm compared with WT in the early stage of leaf full expansion; however, in the late stage, the rate of decrease was much faster in GSm than that in WT (Figure 3B). POD and CAT activity showed similar trends, both of which decreased faster in GSm compared with that in WT; yet, there was little change in CAT activity of WT, which decreased only in the late stage (Figure 3C,D).

3.3. RNA Sequencing Analysis and Identificaiton of Differentially Expressed Genes

A total of 12 sample libraries were constructed and sequenced, yielding 166.88 Gb of clean data (>11.79 Gb per sample). The GC content of raw reads in different libraries ranged between 50.79–54.88%, and the percentage of Q30 bases was >94.53% (Supplementary Table S1). The results indicate a high sequencing quality, so that the obtained data can be used for subsequent analysis of gene expression profiles and metabolic pathways.
We identified differentially expressed genes (DEGs) in GSm and WT during two different stages (Table 3). The flag leaves of GSm presented no senescence phenotype at 2 d after full expansion (S1 stage), but there were 7030 DEGs (5010 upregulated and 2020 downregulated) identified in WS1_vs_MS1. Then, a distinctive senescence phenotype was observed in the flag leaves of GSm at 9 d after full expansion (S2 stage), with 18,246 DEGs (10,801 upregulated and 7445 downregulated) identified in WS2_vs_MS2; meanwhile, there were 15,180 DEGs in MS1_vs_MS2 and 11,744 DEGs in WS1_vs_WS2.
Furthermore, the Venn diagram shows that based on the group comparisons of MS1_VS_WS1 and MS2_VS_WS2, there were 3771 and 14,987 unique DEGs in the S1 and S2 stages, respectively, with 3259 DEGs overlapped between the two libraries (Figure 4). This result suggests that distinctive response mechanisms were adopted in flag leaves of the mutant and WT during the two stages. Then, we randomly selected six genes from the DEGs and quantified their expression in different stages using quantitative reverse-transcription PCR (qRT-PCR). The qRT-PCR data showed that the six genes indeed differentially expressed, which was in agreement with the results of transcriptomic analysis (Supplementary Figure S1). The PCA of the different samples shows that there are differences between groups and little difference within groups (Supplementary Figure S2). Thus, the genome-wide transcriptomic analysis of wheat flag leaves was reliable.

3.4. GO Enrichment and KEGG Pathway Analysis of Differentially Expressed Genes

The Gene Ontology (GO) enrichment analysis of DEGs was carried out using the GO database (Table 4). For MS2_VS_WS2 and MS1_VS_MS2, the DEGs were enriched in GO terms of biological process, cellular component, and molecular function categories, mainly involving chlorophyll degradation (magnesium chelatase activity, xanthophyll biosynthetic process), photosynthesis (chloroplast thylakoid membrane protein complex, photosystem II oxygen evolving complex, assembly photosystem I reaction center), and respiration (fructose metabolic process, fructosyltransferase activity, fructose 1,6-bisphosphate 1-phosphatase activity, malate transmembrane transporter activity). For WS1_VS_WS2 and MS1_VS_WS1, the significantly enriched GO terms of DEGs were related to sugar metabolism (maltose metabolic process, fructosyltransferase activity, oligosaccharyltransferase complex) and amino acid metabolism (aromatic amino acid transmembrane transporter activity, S-adenosylhomocysteine metabolic process, S-adenosylhomocysteine metabolic process, asparaginase activity).
To identify the major pathways contributing to premature senescence, we analyzed the top five metabolic pathways obtained by different group comparisons using gene annotations in the Kyoto Encyclopedia of Genes and Genomes (KEGG) database (Table 5). The major enriched pathways of DEGs in the two groups of MS2_VS_WS2 and MS1_VS_MS2 were roughly the same and primarily related to chlorophyll degradation (porphyrin and chlorophyll metabolism, carotenoid biosynthesis), photosynthesis (photosynthesis-antenna proteins, carbon fixation in photosynthetic organisms), and respiration (glyoxylate and dicarboxylate metabolism, starch and sucrose metabolism). The DEGs in MS1_VS_WS1 were mainly enriched in the pathways related to protein processing and biosynthesis of different sugars (protein processing in endoplasmic reticulum, endocytosis, amino sugar and nucleotide sugar metabolism, N-glycan biosynthesis, various types of N-glycan biosynthesis). The DEGs in WS1_VS_WS2 were significantly enriched in the following pathways, glycerophospholipid metabolism; MAPK signaling pathway—plant; and glycine, serine and threonine metabolism.

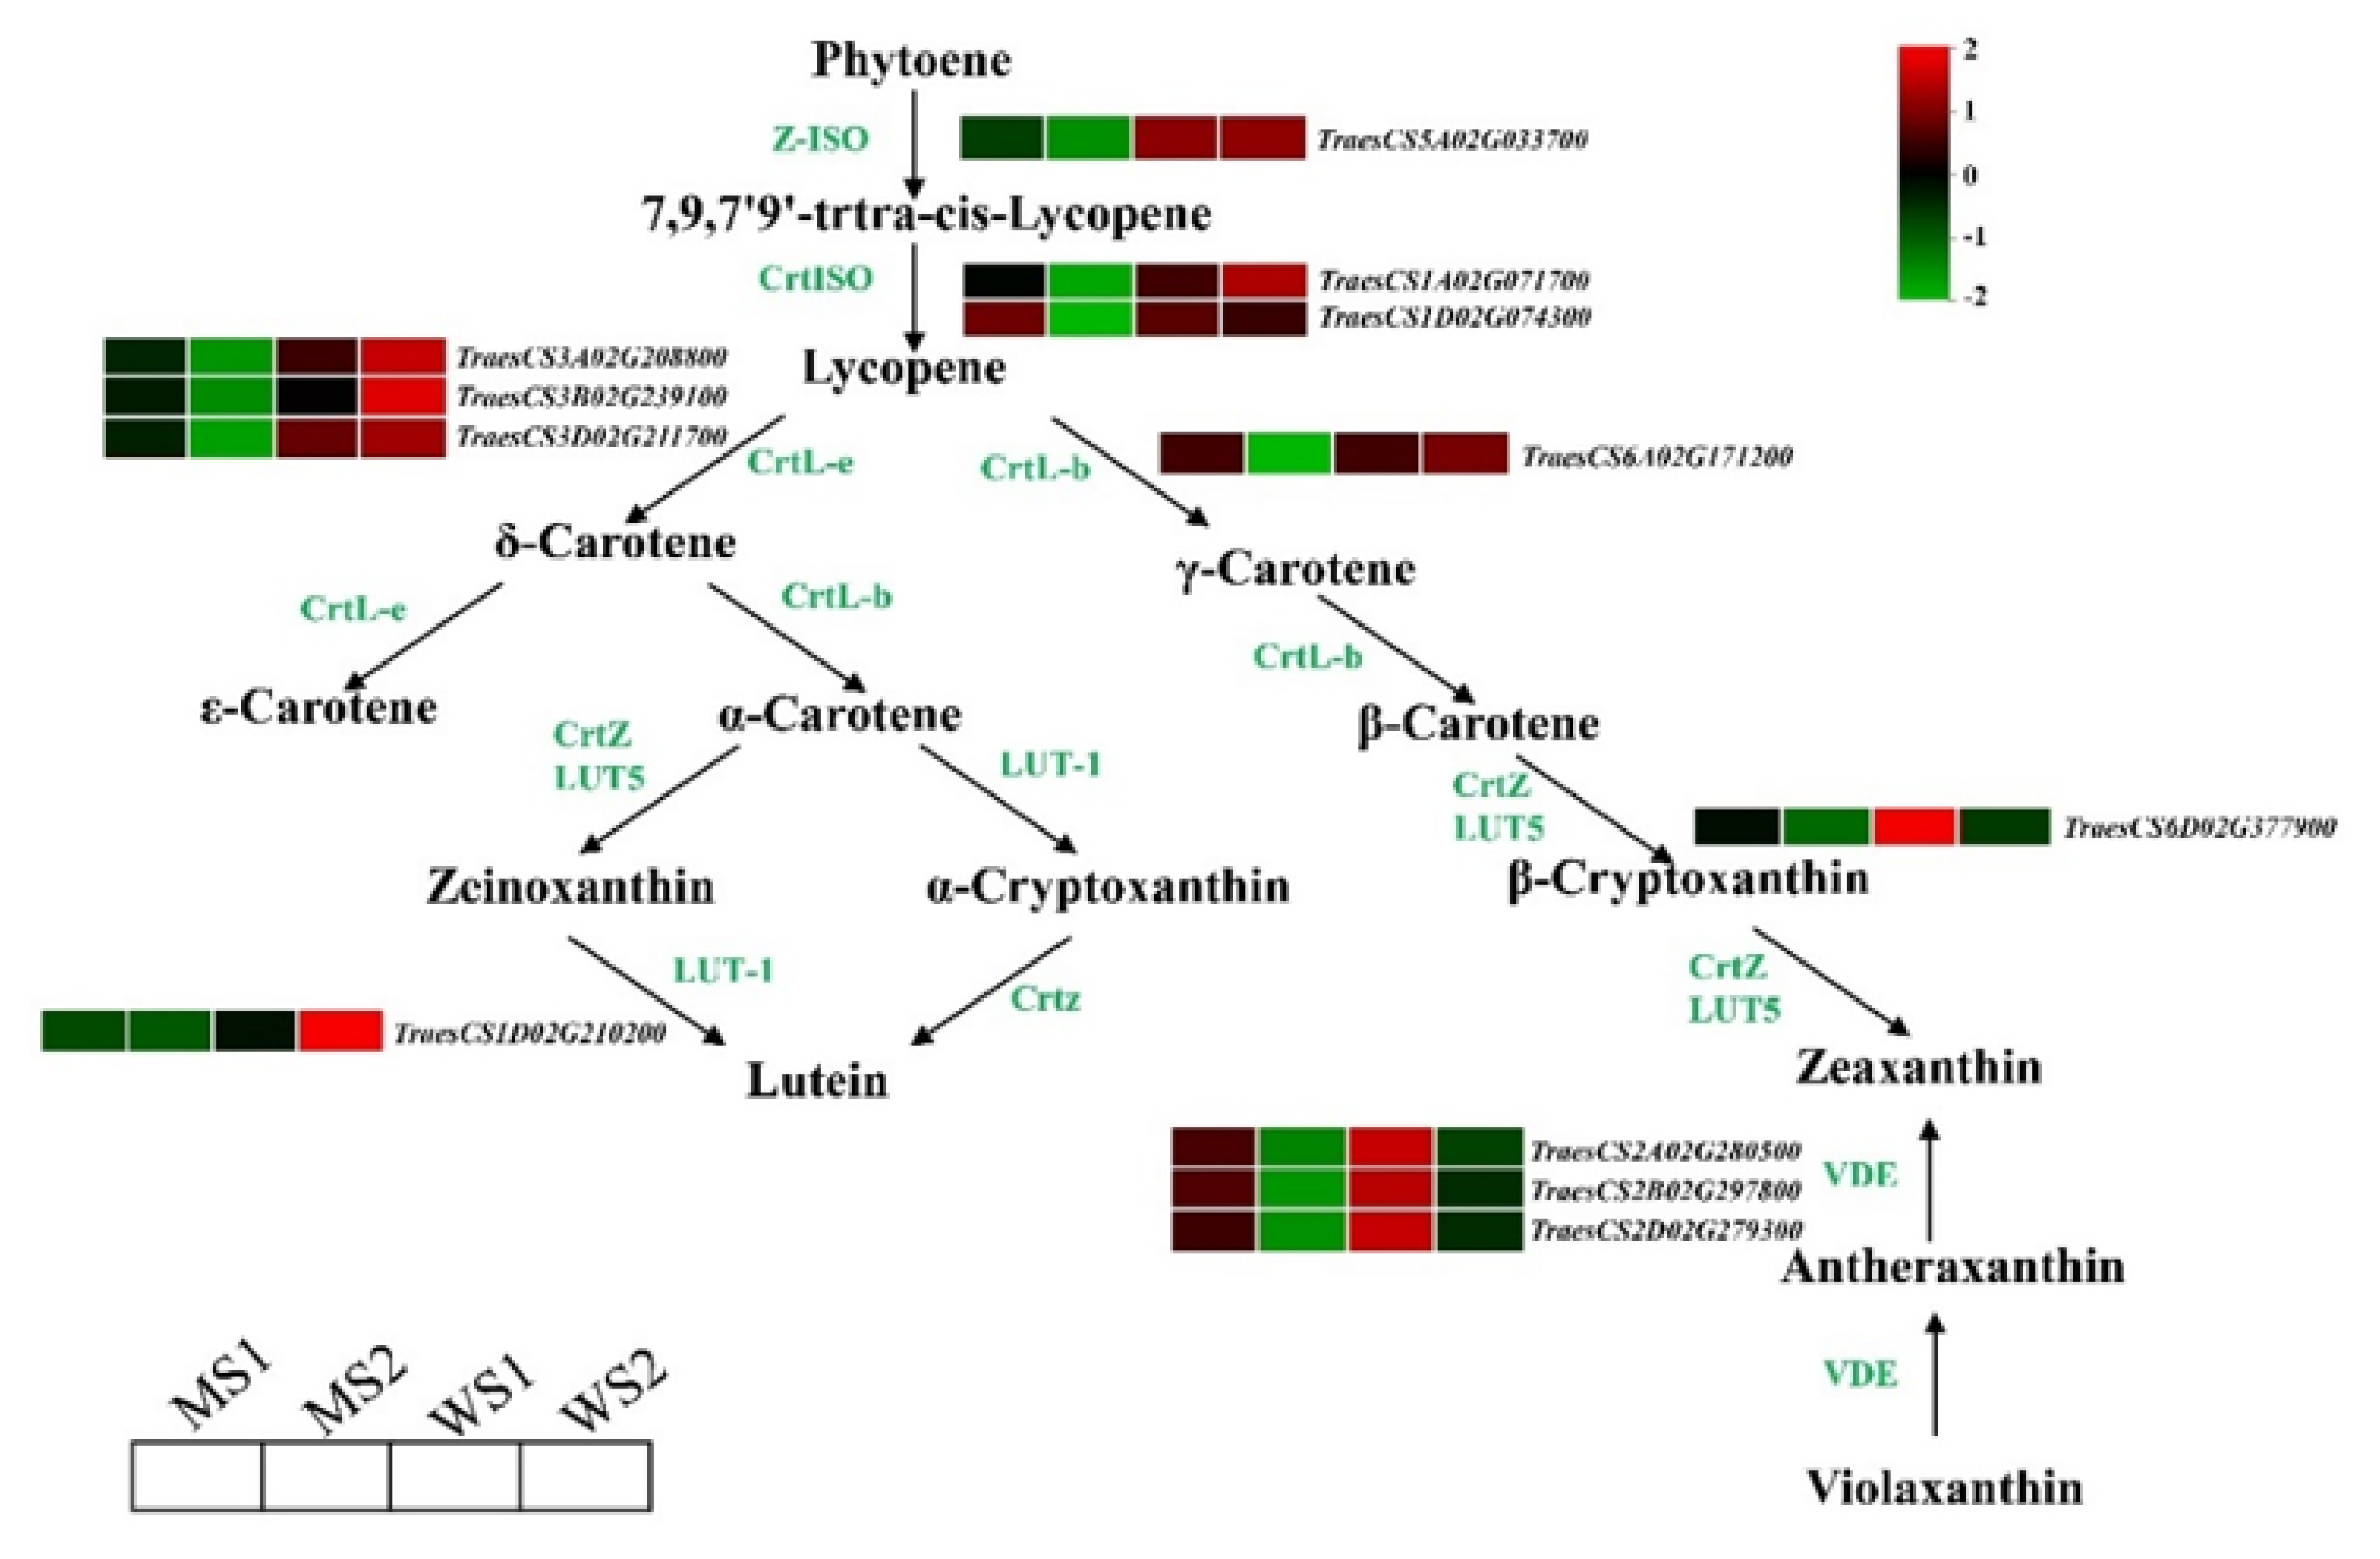
3.5. Differentially Expressed Genes Involved in Chlorophyll and Carotenoid Biosynthesis and Photosynthesis

To identify key genes associated with color formation of yellow leaves in the mutant and WT, we particularly compared their DEGs involved in chlorophyll metabolism and carotenoid biosynthesis pathways. We found that expression levels of 50 genes in chlorophyll biosynthesis pathway were downregulated in mutant leaves of the senescence stage (MS2; q < 0.05, fold-change > 2). However, there was a remarkable upregulation of DEGs that encode chlorophyll degradation-related enzymes, including three pheophytin oxygenase (PAO) genes and four NYC1-like (NOL) genes (Figure 5). An overall expression analysis revealed that compared with WT, most genes related to chlorophyll biosynthesis were expressed at lower levels in the mutant; however, there were no distinctive differences in expression levels of genes related to chlorophyll degradation in the MS1 stage compared with those of WS1 and WS2 (Supplementary Table S2). We also compared the DEGs involved in carotenoid biosynthesis and found a total of 12 genes in the entire metabolic pathway for lutein and zeaxanthin biosynthesis, whose expression levels were downregulated in the MS2 stage (Figure 6). An overall expression analysis indicated that compared with WT, expression levels of most genes related to carotenoid biosynthesis were also lower in the mutant in the two respective stages (Supplementary Table S3). With regard to photosynthetic antenna protein, the analysis results indicated that 77 genes were substantially downregulated in the MS2 stage, most of which showed lower expression levels in the mutant than in WT (Supplementary Table S4).

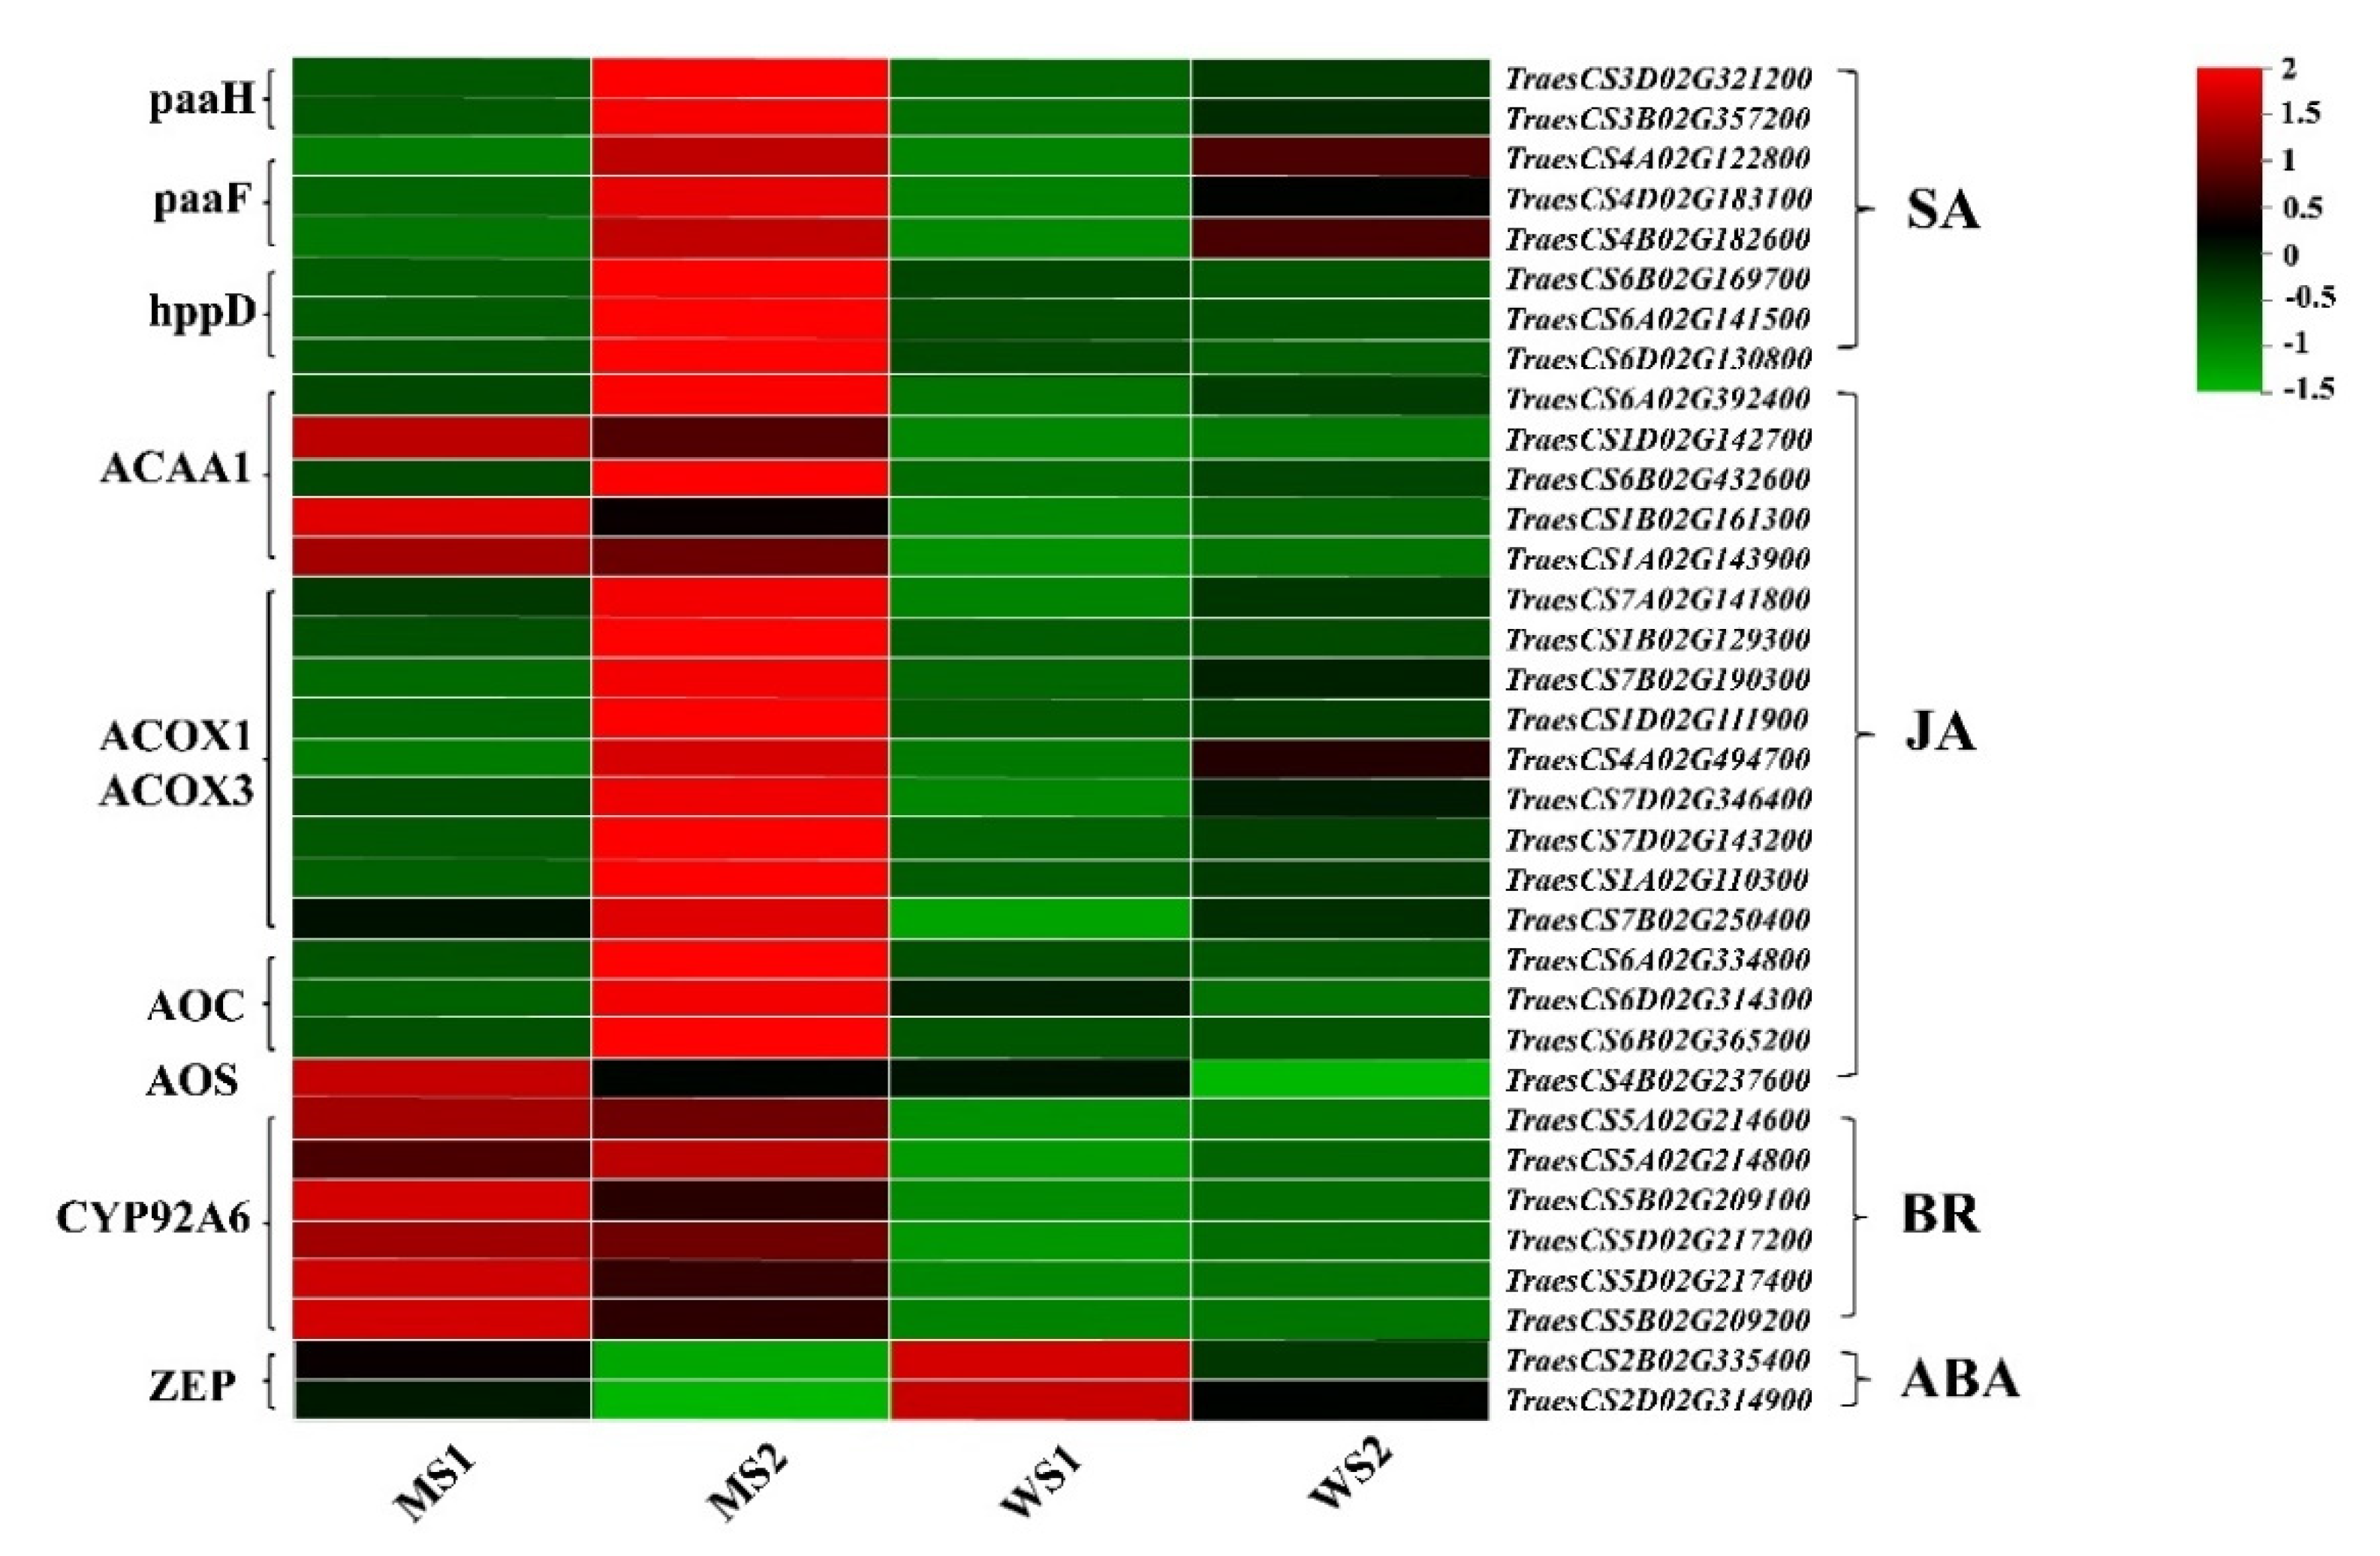
3.6. Differentially Expressed Genes Related to Antioxidative Metabolism and Protein Processing, Transportation

Antioxidative metabolism and cyanide-resistant respiration are critical to eliminate ROS accumulation and alleviate cellular damage during regulation of leaf senescence. The antioxidation-related DEGs identified in this study were mainly related to SOD, CAT, POD, and glutathione S-transferases (GSTs). Among them, two SOD-related genes, TraesCS2A02G121200 and TraesCS2D02G123300, showed the highest expression levels compared with other related genes, and their expression levels were distinctively higher in the mutant than in WT. With regard to CAT, most genes in the mutant were expressed at higher levels in the senescence stage (MS2) than in the non-senescence stages (MS1, WS1, and WS2). As for GSTs and POD, some genes exhibited the same expression patterns, with considerably higher expression levels in the mutant compared with those of WT. Another portion of the genes related to GSTs and POD were expressed at higher level in the senescence stage than in the non-senescence stages, similar to the results for CAT-related genes. Only a few genes were highly expressed in WT (Supplementary Table S5). Analyzed the DEGs of the 5 main enriched pathways in the MS1_VS_WS1 stage and found that there were 93 DEGs in total, of which 81 were down-regulated and only 12 were up-regulated, indicating that protein processing and transport were enhanced in the mutant at this stage. This may result in higher protein levels in the mutant than in the wild type.

3.7. Differentially Expressed Genes Associated with Hormone Signaling

We analyzed hormone biosynthesis-related DEGs between the mutant and WT, finding that these genes mainly participated in the biosynthesis of salicylic acid (SA), JA, and brassinolides (BR). Most of the DEGs displayed different increases in their transcript abundances in GSm during leaf senescence, especially in the MS2 stage. Expression levels of SA- and JA-related biosynthetic genes were all higher in the MS2 stage than in the MS1, WS1, and WS2 stages. Additionally, 10 ACAA1- and BR-related biosynthetic genes (e.g., TraesCS5A02G214600, TraesCS5A02G214800, TraesCS5B02G209100, TraesCS5D02G217200, TraesCS5D02G217400, and TraesCS5B02G209200) were expressed at higher levels in the mutant compared with those in WT. In the case of ABA, we found that the DEGs encoding zeaxanthin epoxidase were markedly downregulated in the MS2 stage (Figure 7). However, no major changes occurred in the transcript abundance of CK- and GA-related DEGs between the two materials (Supplementary Table S6).

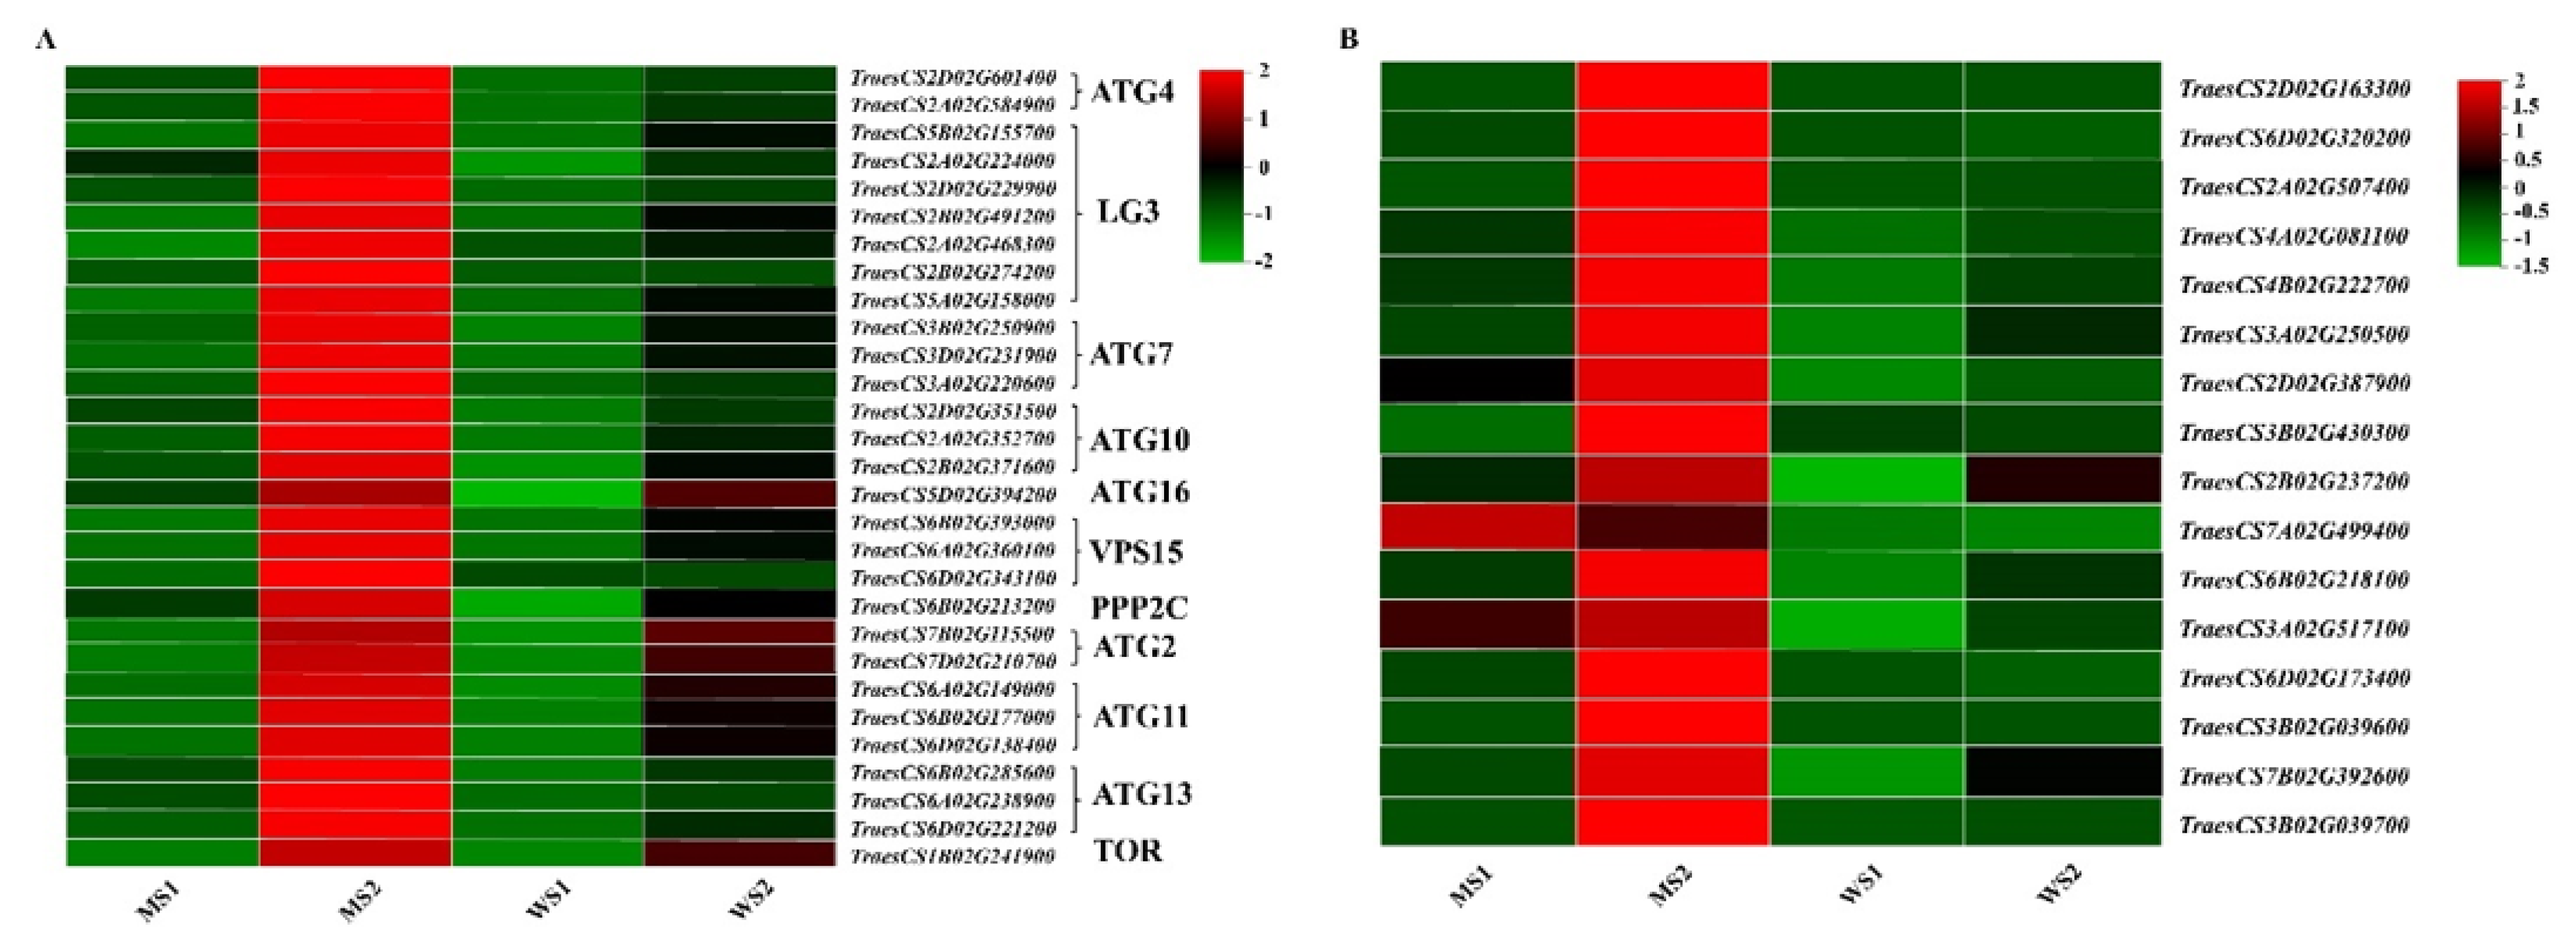
3.8. Differentially Expressed Genes Participating in Autophagy and Hydrolysis of Senescent Leaves

Autophagy plays an essential role in maintaining normal life activities of cells. A total of 29 DEGs encoding autophagy-related proteins (e.g., ATG4, LC3, ATG7, ATG10, and ATG16) were detected. Their transcription in the leaves of GSm was considerably promoted in the MS2 stage (Figure 8A). In addition, there were 16 DEGs mainly participating in hydrolysis and autophagy; these genes showed the same expression patterns, with expression levels being elevated in the GSm mutant during leaf senescence (Figure 8B). These results show that autophagy- and hydrolysis-related genes might play an indispensable regulatory role in macromolecular hydrolysis and cell apoptosis in the GSm mutant during leaf senescence.

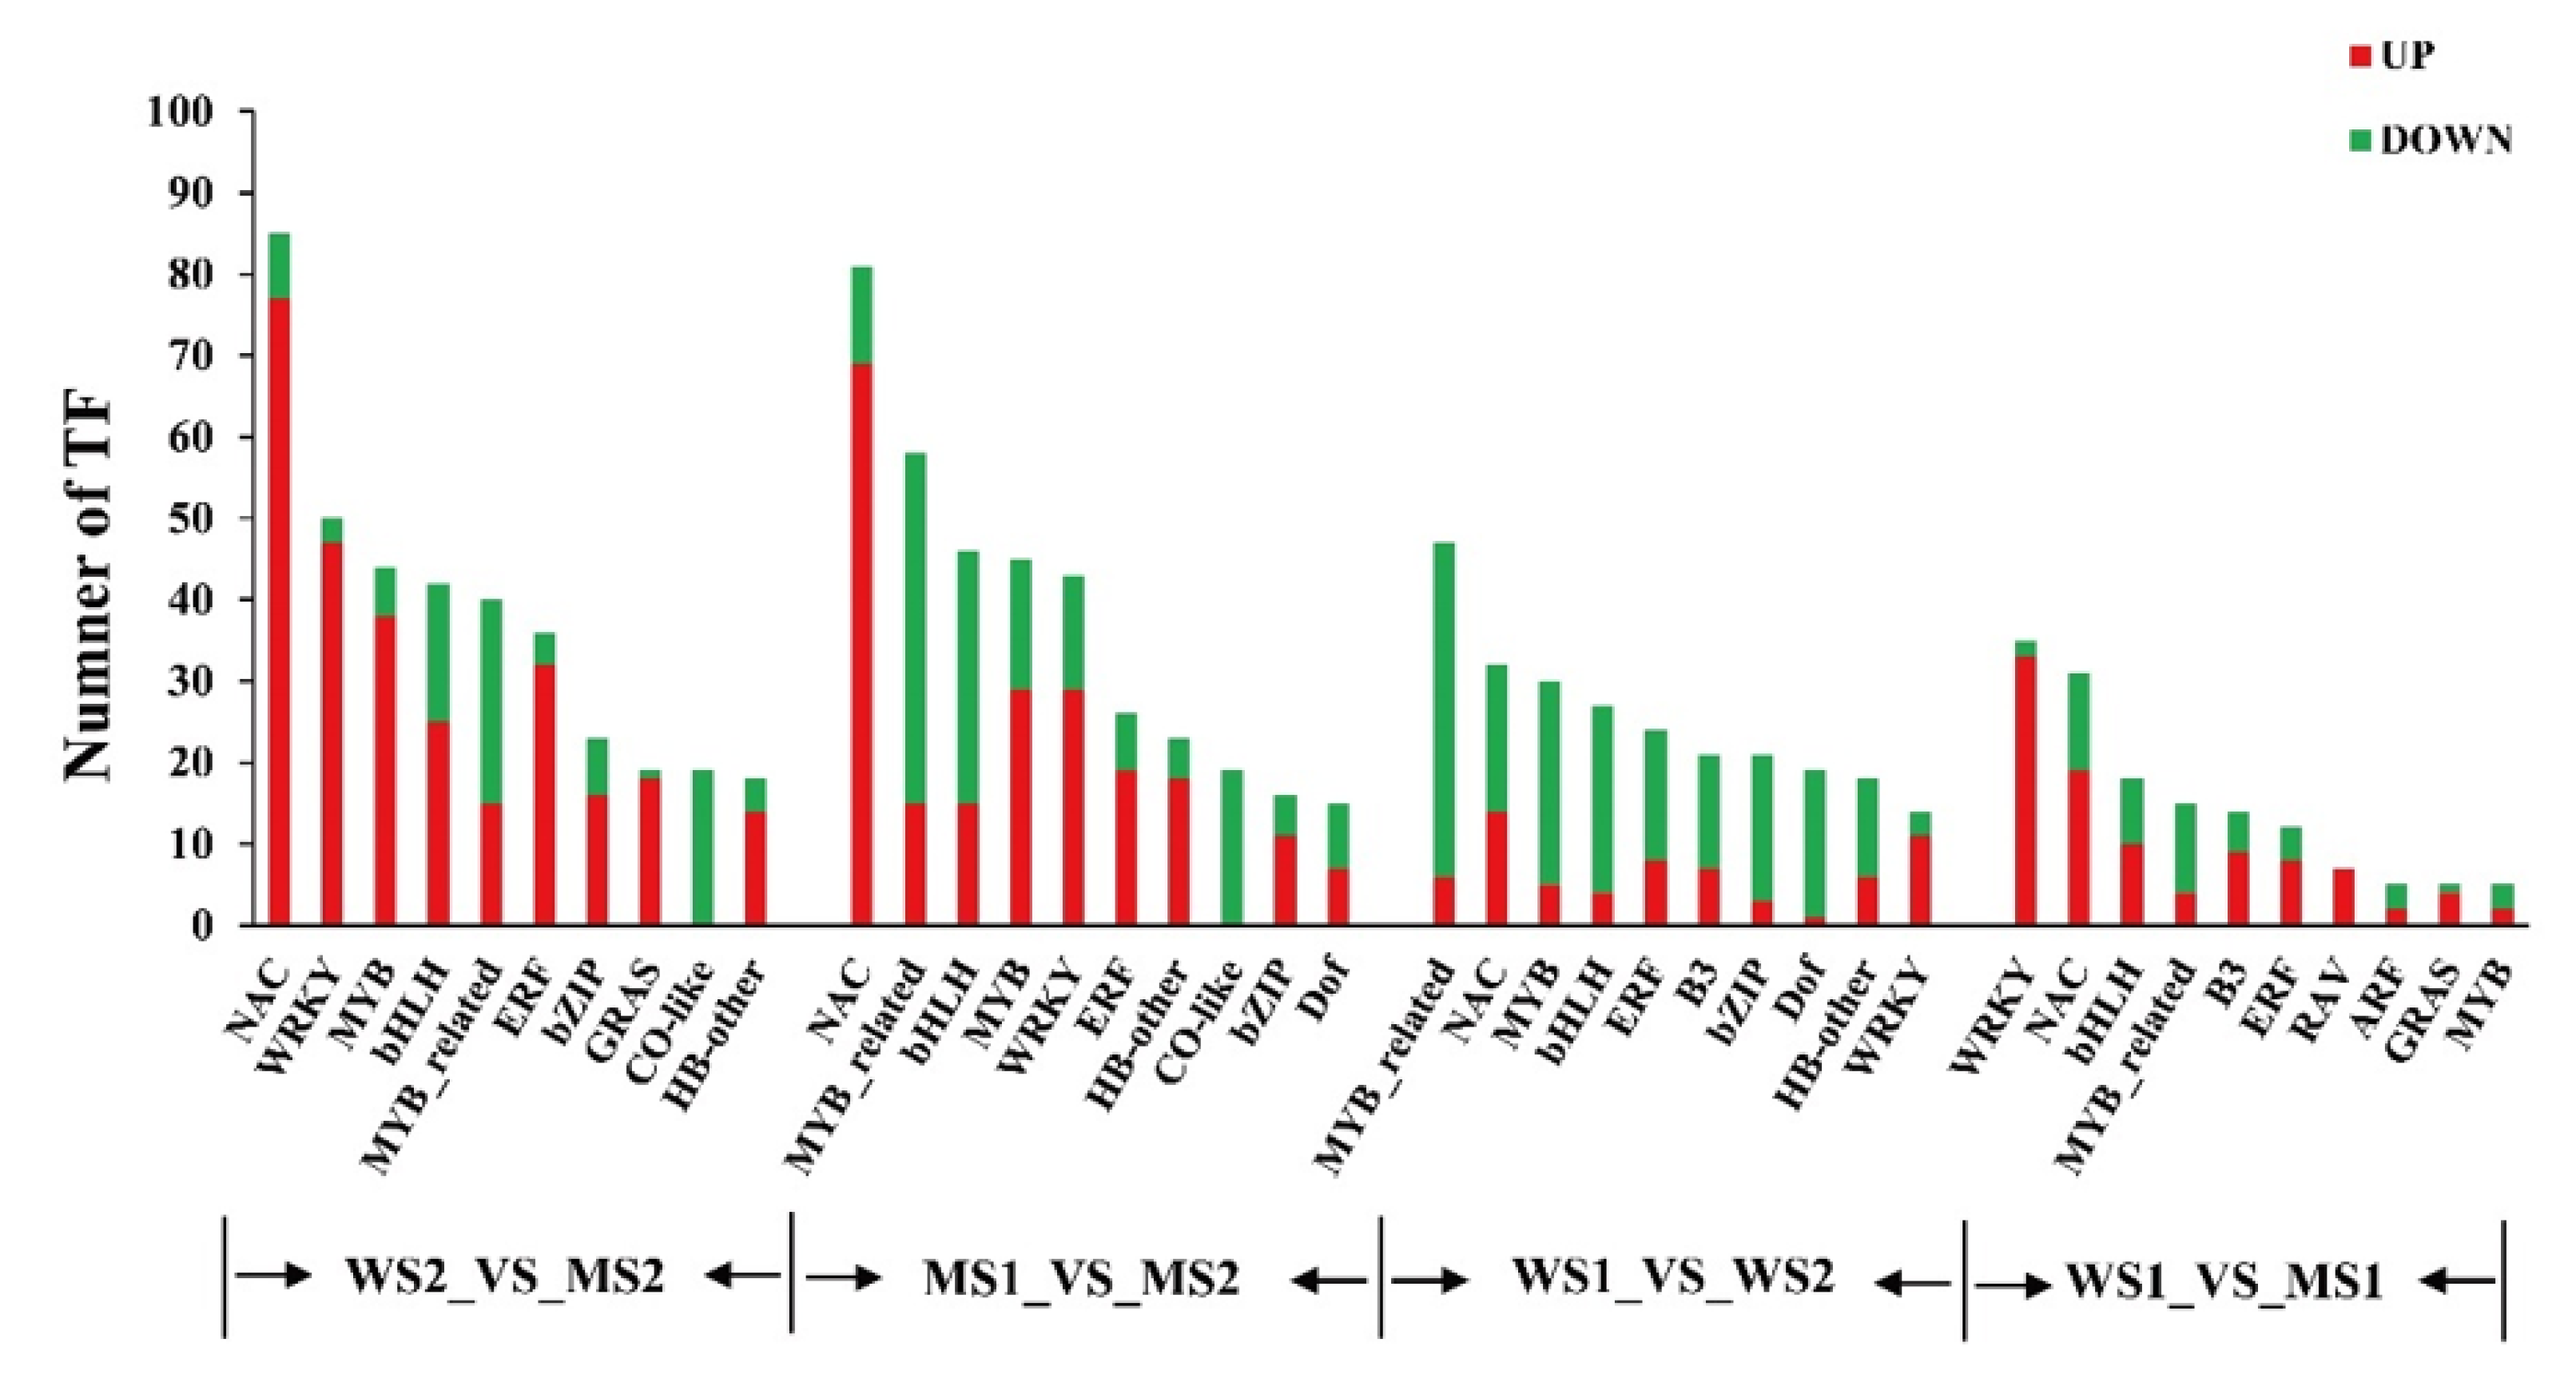
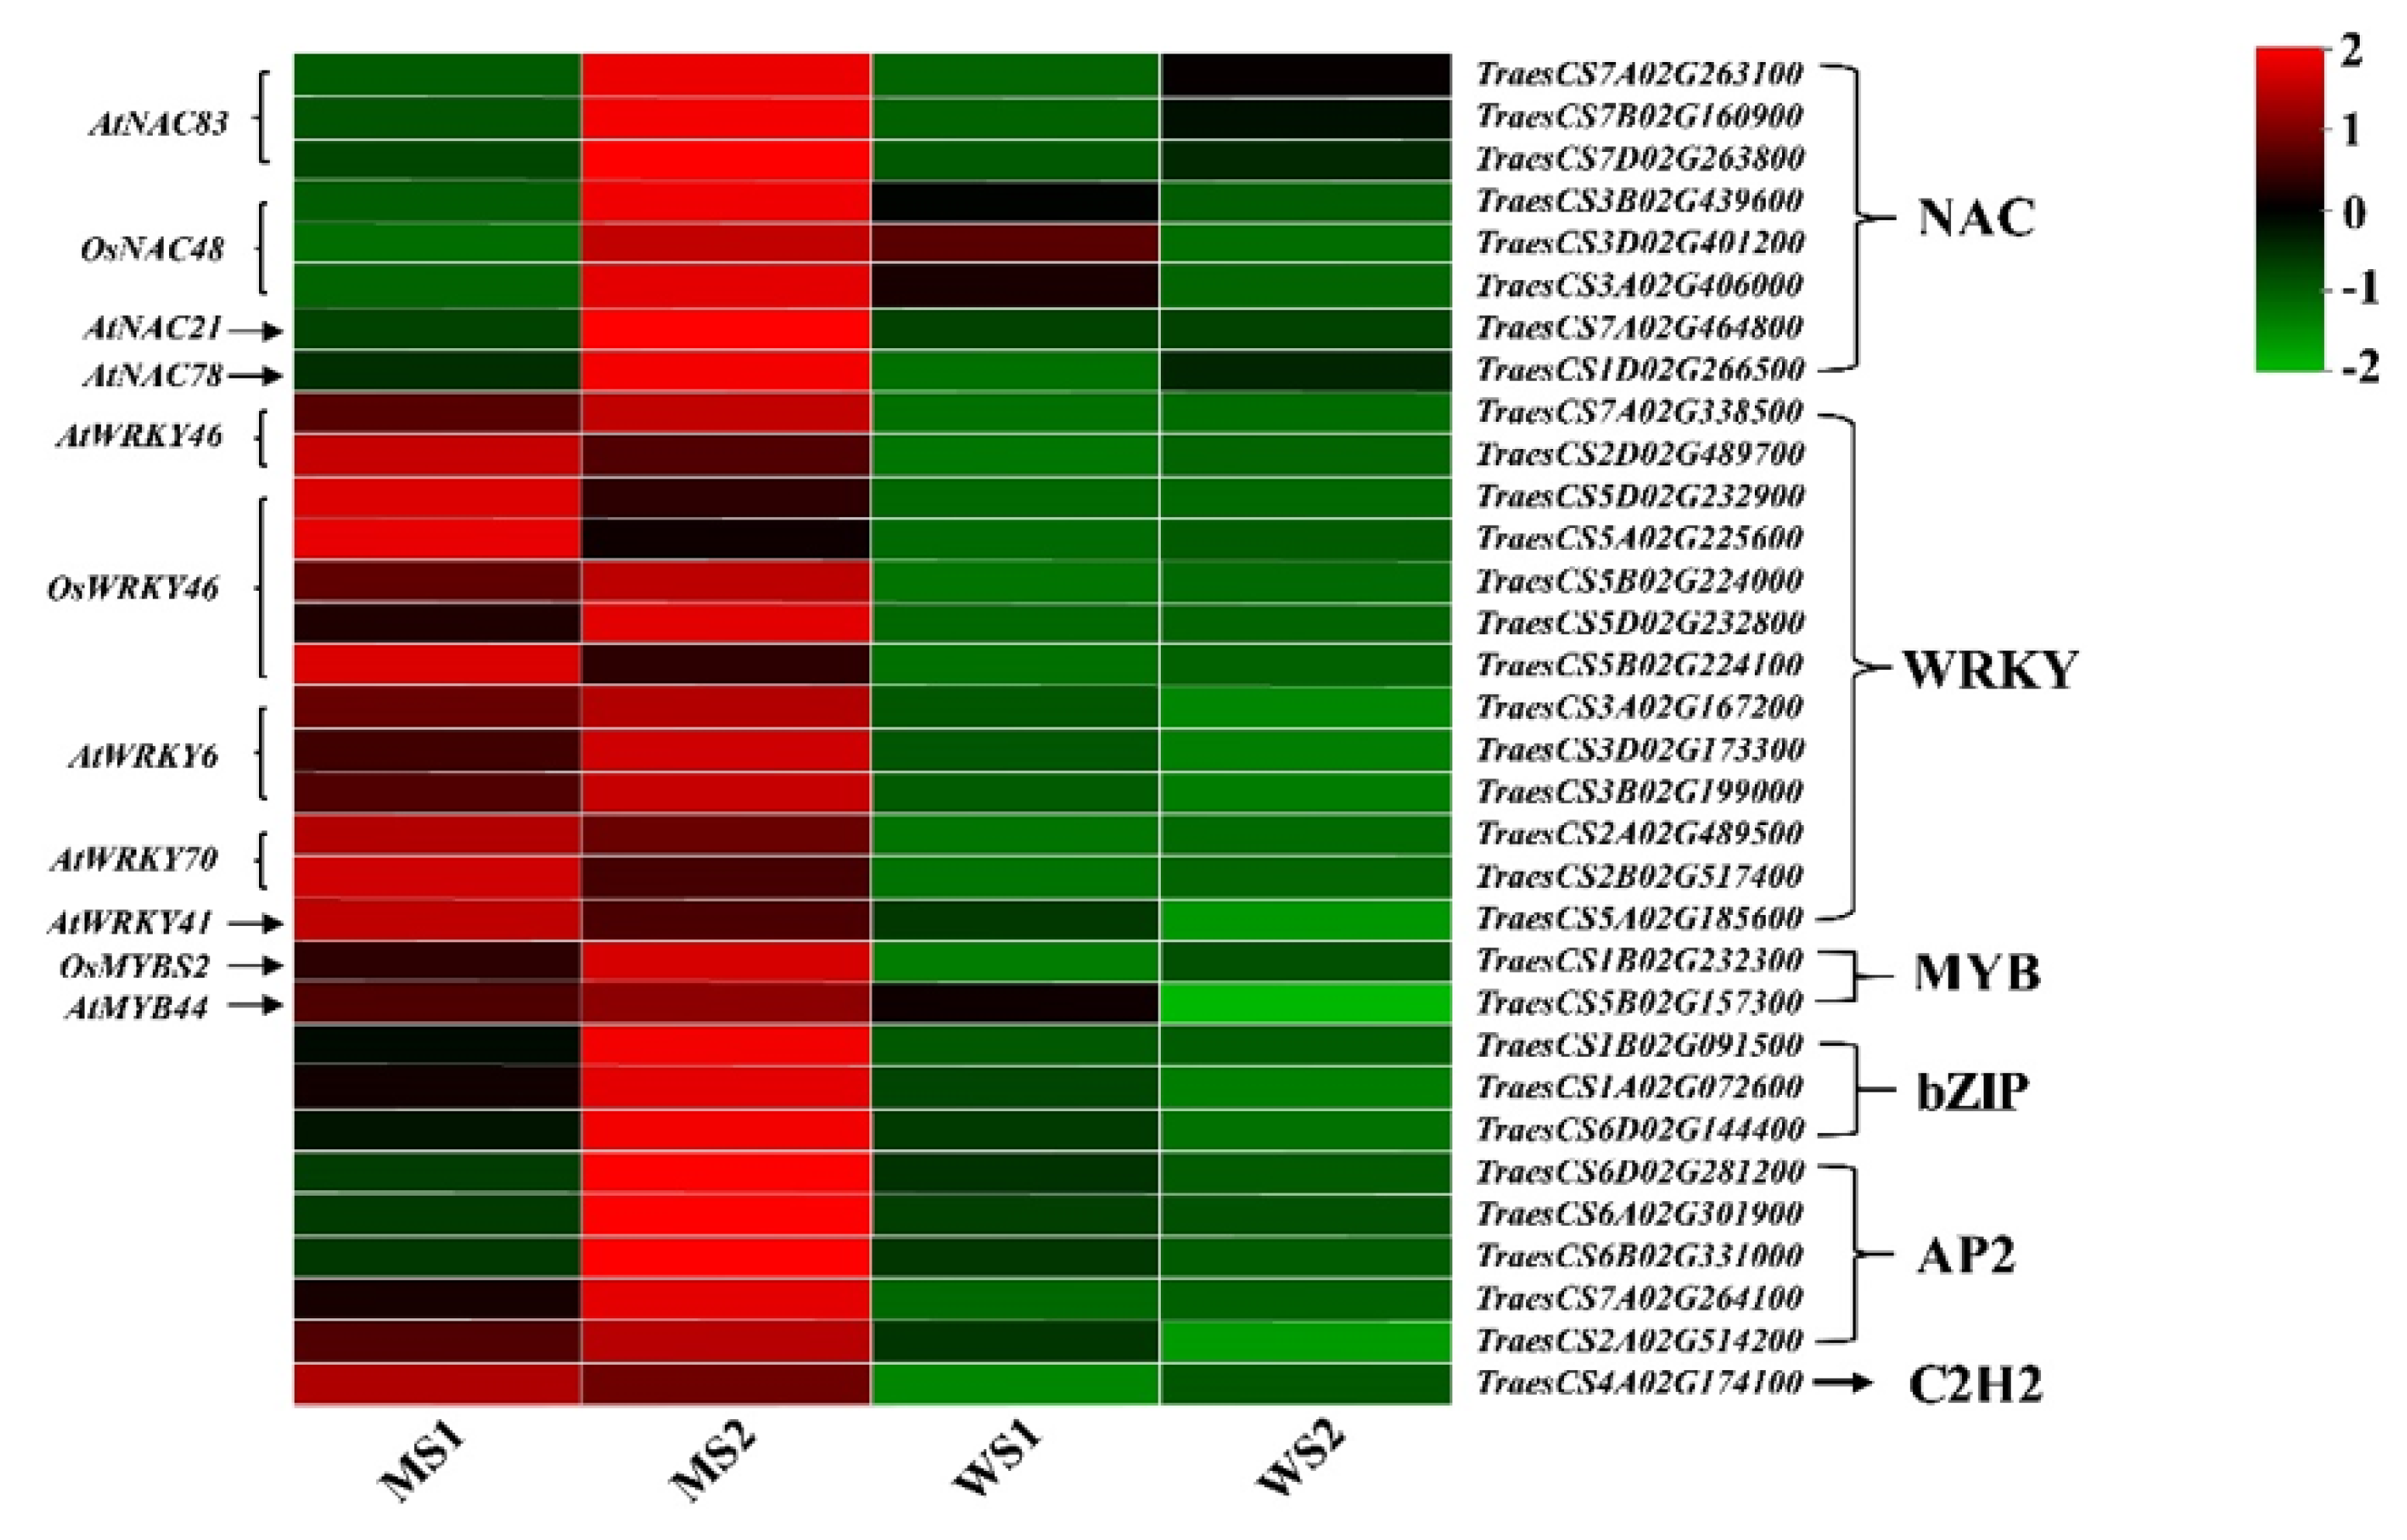
3.9. Transcription Factor Family Members in Differentially Expressed Genes

We detected 358, 520, 181, and 494 transcription factors that were differentially expressed in the group comparisons of WS1_VS_WS2, MS2_VS_WS2, MS1_VS_WS1, and MS1_VS_MS2, respectively. The number of differentially expressed transcription factors was relatively high in the group comparisons containing MS2 stage, indicating that more transcription factors took part in the regulation of leaf senescence (Table 6). Then, we identified the top 10 differentially expressed transcription factors in the four group comparisons. The numbers of upregulated genes were more than those of downregulated genes for most transcription factors in the senescence stage (MS1_VS_MS2 and MS2_VS_WS2). Of these, the numbers of upregulated NAC genes were the highest, 77 and 69, which were much higher than the numbers of upregulated genes before senescence, 14 and 19 (WS1_VS_WS2 and MS1_VS_WS1). The second largest class was WRKY and MYB, followed by ERF, all of which had a considerably higher number of upregulated genes after senescence than before senescence. The Co-like family genes were all downregulated in the senescence stage (Figure 9). We identified the transcription factors with relatively high transcript abundance, most of which belonged to the NAC, WRKY, MYB, and AP2 families. These genes showed much higher expression levels in senescent leaves of the mutant (MS2) compared with those of non-senescent mutant (MS1) and WT (WS1 and WS2) leaves. Moreover, WRKY and MYB expression levels were both higher in the mutant than in WT. Furthermore, despite the total number of C2H2 genes in the four groups was not high, their transcript abundances in the mutant were higher compared with those of WT. Thus, these transcription factors played a significant role in premature leaf senescence of the GSm mutant (Figure 10).

4. Discussion

4.1. Agronomic, Yield, and Physiological Traits Are Distinctively Different between the Common Wheat Premature Senescence Mutant and Its Wild-Type

Using mutagenesis techniques to obtain stable mutant materials is essential for wheat breeders to explore the physiological mechanisms of wheat growth and development, and to cultivate new cultivars with high and stable yield and strong stress resistance. Here, we used EMS to mutate the common wheat cultivar Chang 6878 and then acquired the premature senescence mutant GSm with a stable phenotype after multiple generations of selection. Compared with WT, the chlorophyll content in flag leaves of GSm decreased substantially throughout the whole growth period, whereas the photosynthetic fluorescence-related indices (Pn, Tr, Fv/Fm, NPQ, and ETR) all decreased distinctively after full expansion of flag leaves. In contrast, MDA content increased faster in GSm than in WT. Soluble protein content in GSm was also distinctively higher than that of WT in the early stage of leaf full expansion, but a remarkable decrease occurred in the late stage. Both POD and CAT activity showed a faster decrease in the mutant than in WT. Furthermore, agronomic traits, such as effective tillering, plant height, Panicle length, number of grains per panicle per spike, number of fruiting spikelets, Main spike grain weight, yield per plant, and thousand-grain weight, all prominently decreased in the mutant compared with WT. The results corroborate previous studies reported by Li et al. [38] and Zhang et al. [40], indicating that premature senescence indeed has a profound influence on common wheat yield.

4.2. Photosynthesis-Related Genes Are Differentially Expressed in the Leaves of Common Wheat Premature Senescence Mutant and Its Wild-Type

Premature senescence of leaves is closely linked to chlorophyll metabolism and carotenoid metabolism. In a wheat premature senescence mutant, Ygm, expression levels of eight genes encoding magnesium chelatase H subunit and protochlorophyllide oxidoreductase in the chlorophyll metabolic pathway are downregulated, whereas two genes encoding β-carotene hydroxylase in the carotenoid biosynthetic pathway are upregulated [39]. In addition, a rice pale-green leaf mutant, pgl10, shows remarkably decreased content chlorophyll (chlorophyll a and b) and carotenoid, with expression of chlorophyll biosynthesis-related genes being lowered; bioinformatic analysis indicates that PGL10 encodes protochlorophyllide oxidoreductase B [46]. Moreover, virus-induced gene silencing of CHLI and CHLD genes produces a yellow leaf phenotype in pea, which exhibits diminished chlorophyll accumulation and considerably decreased photosynthetic protein levels [12]. The rice OsCHLH gene encodes the largest subunit of magnesium chelatase, a key enzyme in the chlorophyll branch of the tetrapyrrole biosynthesis pathway. Abnormal chloroplast development and low chlorophyll content have been found in a rice T-DNA insertion mutant, OsCHLH [47].
Levulinate, an inhibitor of 5-aminolevulinate dehydratase, can be used to inhibit the biosynthesis of pyrrole-derived tetrapyrrole chlorophyll. Expression levels of nuclear genes involved in carotenoid biosynthesis (i.e., geranylgeranyl diphosphate synthase, phytoene synthase, and phytoene desaturase) are downregulated in levulinate-treated seedlings. Likewise, transcript abundances of nuclear genes encoding chloroplast proteins (i.e., Lhcb1, PsbO, and RcbS) are severely decreased in levulinate-treated samples [48]. Map-based cloning of a rice premature senescence mutant, eas1, reveals that the nuclear gene EAS1 encodes PaO [49]. TaPAO expression level is upregulated and Fv/Fm is lowered distinctively in the wheat mutant m68 [40]. In the present study, we compared the DEGs involved in chlorophyll metabolism and carotenoid biosynthesis pathways between the premature senescence mutant GSm and WT of common wheat. We found that compared with WT, expression levels of genes related to the biosynthesis of chlorophyll, lutein, zeaxanthin, and photosynthesis-antenna proteins in the mutant were all substantially downregulated in the S1 and S2 stages; conversely, the DEGs encoding chlorophyll degradation-related enzymes (PAO and NOL) were upregulated remarkably in the MS2 stage. The results suggest blockade of chlorophyll and carotenoid biosynthesis in the GSm mutant, which caused a decrease in its photosynthetic capacity and hence accelerated chlorophyll degradation in the late stage of leaf senescence. Further, we compared the chlorophyll synthesis-related genes in the leaf senescence process of common wheat (Supplementary Figure S3) that was analyzed during the natural senescence process of common wheat variety Jinmai39 in our lab (unpublished data) and premature senescence mutant Ygm [39] with the GSm mutants. It was found that except for HEML and HEMC, rest of the chlorophyll synthesis-related genes were significantly down-regulated in GSm mutant, while only a few genes in common wheat and Ygm were down-regulated. These results indicated that although the plants are all senescent, the chlorophyll synthesis-related genes regulated by the senescence process were significantly different in GSm mutant. Therefore, GSm mutant specifically inhibited the chlorophyll synthesis and accelerated chlorophyll degradation that influence premature senescence in wheat.

4.3. Antioxidant System-Related Genes Are Differentially Expressed between the Common Wheat Premature Senescence Mutant and Its Wild-Type

ROS are generated in cells as an inevitable result of aerobic metabolism [50]. The generation and elimination of ROS in plant cells are in equilibrium under normal conditions owing to activation of antioxidant enzymes. However, ROS may accumulate in degenerated tissues, with antioxidant enzyme activity gradually lost during senescence [51,52]. Two rice premature senescence mutants, PLS2 and psls1, show considerably diminished CAT activity, enhanced H2O2 accumulation, and increased dead cells [53,54]. A premature senescence and death 128 mutant (psd128) isolated from the rice IR64 mutant library exhibits markedly decreased soluble protein content and increased MDA content [33,46]. Through comparing near-isogenic lines of wheat with premature and normal senescence, a study has found that the enzyme activity of the antioxidant system, such as superoxide dismutase (SOD), CAT, ascorbate peroxidase, and glutathione reductase, is distinctively inhibited, and the redox system is destructed, which may lead to premature leaf senescence [55].
Similar to the previous studies, we found that compared with WT, MDA content increased faster and soluble protein content decreased faster in the flag leaves of the common wheat premature senescence mutant GSm. Additionally, POD and CAT activity displayed similar trends, both decreasing faster in the mutant than in WT. Further, transcriptomic analysis revealed that antioxidation-related DEGs were primarily associated with biosynthesis of SOD, CAT, POD, and GSTs. In particular, two related genes encoding SOD1 (TraesCS2A02G121200 and TraesCS2D02G123300) and other related genes were expressed at considerably higher levels in the mutant compared with WT. Expression levels of most genes related to CAT in the mutant were higher in the senescence stage (MS2) than in the non-senescence stages (MS1, WS1, and WS2). This also suggests that premature senescence in the mutant results in substantial H2O2 production, thereby triggering expression of CAT-related genes. As for GSTs and POD, the same expression patterns were observed in some genes, whose expression levels were distinctively higher in the mutant compared with WT. Accordingly, the GSm mutant may generate more ROS in the early stage of leaf senescence, so that multiple antioxidant enzymes work together to minimize ROS-induced oxidative damage.

4.4. Plant Hormones and Autophagy Play an Essential Regulatory Role in Leaf Senescence

Many studies indicate that Salicylic acid, Jasmonic acid, Brassinolide, abscisic acid, ethylene, and Strigolactones facilitate the senescence process, whereas IAA, GA, and cytokinins (CKs) play a role in delaying senescence in plants. Approximately 60% of SA biosynthesis and signaling genes are upregulated in senescent leaves of A. thaliana [56]. Teosinte Branched/Cycloidea/PCF4 (TCP) transcription factors play a bifunctional role in integrating JA signal into plant senescence process. Activation of tcp and tcp20 inhibits biosynthesis of lipoxygenase 2, which reduces JA accumulation and ultimately inhibits plant senescence [57]. In contrast, tcp4 activates lipoxygenase 2 biosynthesis, leading to an elevation in JA levels, which in turn accelerates plant senescence [58]. Additionally, a mutant unsusceptible to exogenous, treatment shows decreased senescence-associated gene transcript levels, so that its senescence is delayed [59]. Conversely, BRI1-EMS-suppressor 1 (BES1) is shown to accelerate plant senescence because of an upregulation in the BR response pathway [60]. Furthermore, the underlying mechanisms by which ABA induces and accelerates plant senescence have been reported in many studies. Exogenous application of ABA can increase the accumulation of H2O2 in plant cells [61]. ABA can also induce expression of antioxidant enzymes such as SOD and CAT to participate in plant senescence [62]. Meanwhile, ABA-inducible receptor kinase (RPK1) gene shows upregulated expression in A. thaliana during the senescence process [63].
In the present study, we analyzed hormone biosynthesis-related DEGs between the common wheat premature senescence mutant GSm and its WT. Most of the DEGs were found to show different increases in their transcript abundances in the mutant during leaf senescence. This result indicates an enhancement of hormone signaling pathway in senescent leaves of GSm, especially during the MS2 stage. Additionally, the biosynthetic genes related to SA and JA all had higher expression levels in the MS2 stage than in the MS1, WS1, and WS2 stages. However, there were no major changes in transcript abundances of CK- and GA-related DEGs between the two materials, suggesting that the signaling pathways corresponding to CK and GA may play a minor regulatory role in leaf senescence. The genes related to ABA biosynthesis were downregulated in the mutant, possibly because ABA mainly plays its role in the late senescence stage. All the six biosynthetic genes related to BR showed higher expression levels in the mutant compared with those of WT. SA was reported to be significantly increased in Arabidopsis, mainly during senescence with higher chlorophyll degradation, suggesting that SA is involved in regulating senescence [64]. Studies have shown that JA production is downregulated early in aging, and later integrates signals from external and internal factors, ultimately leading to the onset of aging [25]. It has been reported BR can accelerate the degradation of chlorophyll [65], but no studies have shown that it plays a role in the early stage of senescence. Therefore, our data suggested that genes from SA, JA and BR signaling pathways might be affected by GSm mutant which accelerates premature senescence in wheat.
Autophagy plays a vital role in cell development and differentiation, maintenance of normal cell life activities, resistance to senescence, and defense against abiotic stress and pathogen invasion [31,32]. Previously, four DEGs encoding autophagy-related proteins (i.e., 3, 8A, 8B, and 8C) were detected in a rice premature senescence mutant, ospls1. Their transcription was considerably promoted in the leaves of the ospls1 mutant during the grain filling stage [33]. Here, we identified a total of 29 DEGs associated with autophagy in senescent leaves, including genes encoding autophagy-related proteins ATG4, LC3, ATG7, ATG10, and ATG16. Expression levels of these DEGs in the GSm mutant were elevated during leaf senescence. Hydrolysis-related genes had the same expression patterns as autophagy-related genes; their expression levels were markedly upregulated in senescent leaves of the mutant. These results suggest that autophagy-related proteins and proteasomes may play an integral role in regulating macromolecular hydrolysis and cell apoptosis in the GSm mutant during leaf senescence.

4.5. Transcription Factors Play a Vital Role in Senescence Regulation in Common Wheat

Transcription factors are proteins that activate or repress gene expression through binding to cis-regulatory elements in gene promoters. Transcription factors play a crucial role in plant leaf senescence [38,66]. Senescence-related gene regulatory networks in A. thaliana, rice, and wheat reveal the vital role of transcription factor families NAC and WRKY [67,68,69,70]. The senescence regulatory network in wheat contains differentially expressed transcription factors and is mainly enriched for NAC (61), MYB-associated (43), WRKY (27), and AP2/EREBP (16) genes. We found that the number of differentially expressed transcription factors also increased sequentially with the progression of leaf senescence, which indicates that more transcription factors participate in senescence regulation in common wheat. The upregulated genes in the senescence stage were mainly identified as NAC, WRKY, and MYB.
The rice OsNAP gene can directly induce expression of genes involved in chlorophyll degradation, and OsNAP-overexpressing plants present a premature senescence phenotype [71]. In addition, NAC83 gene expression can be induced by ABA, drought, low temperature, and high salt stress, while expression differences occur in different citrus species. Grapefruit (Citrus maxima [Burm] Merr.) CmNAC83, trifoliate orange (Poncirus trifoliata [L.] Raf) PtNAC83, and lemon (Citrus limon [L.] Burm. f.) ClNAC83 are members of the NAC gene family, all of which perform essential functions in the abiotic stress response of citrus [72]. TaNACA expression in wheat flag leaves increases with the procession of leaf senescence, and heterologous overexpression of TaNACA into A. thaliana causes evident premature leaf senescence. ZmNAC48 participates in plant drought stress response in corn. Moreover, ZmNAC48-overexpressing A. thaliana has improved drought tolerance, reduced water loss rate, enhanced stomatal closure, and increased plant survival rate [73]. Xu, Huang, and Ning et al. showed that wheat TaNAC29, TaNAC2D, and TaNAC4 genes all positively regulate plant leaf senescence [74,75,76]. Furthermore, high expression of GhNAC78 occurs in cotton (Gossypium hirsutum) leaves during the senescence process; so, this gene may be involved in the regulation of leaf senescence [77]. In the present study, we observed high expression of NAC83, NAC48, and NAC78 genes in MS2, suggesting that the GSm mutant may be under positive regulation by these genes in the S2 stage, leading to accelerated leaf senescence.
BcWRKY46 from Brassica campestris ssp. chinensis Makino reportedly performs crucial functions in tobacco in response to ABA and abiotic stress [78]. WRKY46 expression is rapidly induced by drought, salt, and oxidative stress in A. thaliana, and it modulates a group of genes involved in cellular osmoprotection and redox homeostasis under dehydration stress [79]. A. thaliana WRKY46 expression is also induced specifically by SA [80]. Additionally, MtWRKY76 expression is induced rapidly by abiotic stress in alfalfa (Medicago truncatula L.); overexpression of MtWRKY76 distinctively enhances salt and drought tolerance in transgenic alfalfa plants and triggers abiotic stress-inducible genes [81]. The sunflower (Helianthus annuus L.) transcription factor HaWRKY76 confers tolerance to dehydration and waterlogging in transgenic A. thaliana plants without causing yield loss [82]. WRKY6 regulates many senescence-related genes, including senescence-induced receptor-like gene kinase and pathogenesis-related genes [83]. OsWRKY6 is a positive transcriptional regulator of plant defense in rice [84] and A. thaliana [85]. AtWRKY70 from A. thaliana performs its functions downstream of defense-related ROS intermediates and SA [86,87]. A. thaliana transcription factors WRKY46, WRKY54, and WRKY70 participate in brassinosteroid-regulated plant growth and drought responses [88]. Expression of HbWRKY41 in rubber (Hevea brasiliensis Muell. Arg.) is upregulated by cold, drought, and salt stress, and its expression increases continuously under cold or salt stress; thus, HbWRKY41 may be a major regulator of leaf senescence and abiotic stress [89]. Furthermore, the MYB transcription factor OsMYBS1 reportedly takes part in glucose and hormonal regulation [90,91]. We found that WRKY46, WRKY76, WRKY6, WRKY70, and WRKY41, together with MYBS2 and MYB44, all showed high expression in the S1 and S2 stages; these genes were all induced to express in the mutant earlier than NAC genes. The WRKY and MYB gene expression is likely to be triggered by higher levels of ROS and plant hormones (e.g., BR, SA, and JA) in the GSm mutant, thereby accelerating leaf senescence. Overall, transcription factors play a crucial role in the premature senescence of mutants, especially WRKY and MYB. However, these transcription factors are specific to the GSm mutant or involve in the natural leaf senescence process that needs to be further investigated.

5. Conclusions

This study found that compared with the WT of common wheat, leaf senescence was accelerated and grain yield was decreased substantially in a premature senescence mutant, GSm. GSm and WT showed distinctive differences in their transcriptome profiles. Different genes related to premature leaf senescence were identified, showing blockade of chlorophyll and carotenoid biosynthesis, accelerated chlorophyll degradation, and diminished photosynthetic capacity in mutant leaves. In addition, the antioxidant system played a role to minimize oxidative damage in the mutant. There was an upregulation of SA, JA, and BR biosynthesis-related genes in the senescence stage. In particular, BR-related genes were most prominently upregulated in the mutant during the non-senescence stage, indicating that this hormone may increase chlorophyll breakdown and thereby accelerate leaf senescence. NAC83, NAC48, and NAC78 positively regulated leaf senescence. Compared with the NAC genes, WRKY46, WRKY76, WRKY6, WRKY70, and WRKY41, as well as MYBS2 and MYB44 were induced to express earlier in the mutant. The WRKY and MYB gene expression was possibly triggered by increased levels of ROS and plant hormones (e.g., BR, SA, and JA) in the mutant, which in turn accelerated leaf senescence. Taken together, the results shed light on the molecular mechanisms of premature leaf senescence in common wheat.

Supplementary Materials

The following supporting information can be downloaded at: https://www.mdpi.com/article/10.3390/biology11060904/s1, Figure S1: Some important differentially expressed genes verified using qRT-PCR. The error bars represent the SD of the means (n = 3); Figure S2: PCA of the different samples; Figure S3: chlorophyll metabolic pathway of common wheat (Green indicates down-regulated expression and red indicates up-regulated expression). RNA-seq was done in the flag leaf of Common wheat variety Jinmai 39 and leave samples were collected at 0 d, 26 d and 30 d after flowering; Table S1: Quality and Mapping reads of RNA-Seq; Table S2: List of Chlorophyll-related DEGs identified in WT and GSm; Table S3: List of carotenoid synthesis related DEGs identified in WT and GSm; Table S4: List of photosynthesis related DEGs identified in WT and GSm; Table S5: List of enzyme activity-related DEGs identified in WT and GSm; Table S6: List of cytokinin and gibberellin-related DEGs identified in WT and GSm; Table S7: Primers for quantitative real-time polymerase chain reaction.

Author Contributions

J.L. and D.S. designed the experiment. J.L. performed the experiment. D.S. provide advice on experimental protocols. J.L., L.S., X.J., K.Z., H.H., W.Z., F.G. and X.T. analyzed the data. J.L. wrote the manuscript. The manuscript was grammatically revised and polished by M.A.I., Y.S., D.S., S.W., D.S. and N.L. coordinated the project. All authors have read and agreed to the published version of the manuscript.

Funding

This research was sponsored by the State Key Laboratory of Sustainable Dryland Agriculture, Shanxi Agricultural University (No. 202002-2); the National Natural Science Foundation of China (31671607); Shanxi Agricultural University Academic Recovery Special Project (2020xshf02) and Supported by Scientific and Technologial Innovation Programs of Higher Education Institutions in Shanxi (2021L124).

Institutional Review Board Statement

Not applicable.

Informed Consent Statement

Not applicable.

Data Availability Statement

The data presented in this study are openly available in NCBI (https://www.ncbi.nlm.nih.gov/bioproject/, reference number PRJNA823852, accessed on 19 April 2022).

Conflicts of Interest

The authors declare no conflict of interest.

References

  1. Sultana, N.; Islam, S.; Juhasz, A.; Ma, W. Wheat leaf senescence and its regulatory gene network. Crop J. 2021, 9, 703–717. [Google Scholar] [CrossRef]
  2. Wu, X.-Y.; Kuai, B.-K.; Jia, J.-Z.; Jing, H.-C. Regulation of Leaf Senescence and Crop Genetic ImprovementF. J. Integr. Plant Biol. 2012, 54, 936–952. [Google Scholar] [CrossRef] [PubMed]
  3. Jibran, R.; Hunter, D.A.; Dijkwel, P.P. Hormonal regulation of leaf senescence through integration of developmental and stress signals. Plant Mol. Biol. 2013, 82, 547–561. [Google Scholar] [CrossRef] [PubMed]
  4. Thomas, H.; Howarth, C.J. Five ways to stay green. J. Exp. Bot. 2000, 51, 329–337. [Google Scholar] [CrossRef]
  5. Sang, X.-C.; Fang, L.-K.; Vanichpakorn, Y.; Ling, Y.-H.; Du, P.; Zhao, F.-M.; Yang, Z.-L.; He, G.-H. Physiological character and molecular mapping of leaf-color mutant wyv1 in rice (Oryza sativa L.). Genes Genomics. 2010, 32, 123–128. [Google Scholar] [CrossRef]
  6. Distelfeld, A.; Avni, R.; Fischer, A. Senescence, nutrient remobilization, and yield in wheat and barley. J. Exp. Bot. 2014, 65, 3783–3798. [Google Scholar] [CrossRef]
  7. Gregersen, P.L.; Culetic, A.; Boschian, L.; Krupinska, K. Plant senescence and crop productivity. Plant Mol. Biol. 2013, 82, 603–622. [Google Scholar] [CrossRef]
  8. Ischebeck, T.; Zbierzak, A.M.; Kanwischer, M.; Dörmann, P. A Salvage Pathway for Phytol Metabolism in Arabidopsis. J. Biol. Chem. 2006, 281, 2470–2477. [Google Scholar] [CrossRef]
  9. Girondé, A.; Etienne, P.; Trouverie, J.; Bouchereau, A.; Le Cahérec, F.; Leport, L.; Orsel, M.; Niogret, M.-F.; Nesi, N.; Carole, D.; et al. The contrasting N management of two oilseed rape genotypes reveals the mechanisms of proteolysis associated with leaf N remobilization and the respective contributions of leaves and stems to N storage and remobilization during seed filling. BMC Plant Biol. 2015, 15, 59. [Google Scholar] [CrossRef]
  10. Uauy, C.; Brevis, J.C.; Dubcovsky, J. The high grain protein content gene Gpc-B1 accelerates senescence and has pleiotropic effects on protein content in wheat. J. Exp. Bot. 2006, 57, 2785–2794. [Google Scholar] [CrossRef]
  11. Yang, J.; Worley, E.; Udvardi, M. A NAP-AAO3 regulatory module promotes chlorophyll degradation via ABA biosynthesis in Arabidopsis leaves. Plant Cell 2014, 26, 4862–4874. [Google Scholar] [CrossRef] [PubMed]
  12. Luo, T.; Luo, S.; Araújo, W.L.; Schlicke, H.; Rothbart, M.; Yu, J.; Fan, T.; Fernie, A.R.; Grimm, B.; Luo, M. Virus-induced gene silencing of pea CHLI and CHLD affects tetrapyrrole biosynthesis, chloroplast development and the primary metabolic network. Plant Physiol. Biochem. 2013, 65, 17–26. [Google Scholar] [CrossRef] [PubMed]
  13. Shimura, H.; Pantaleo, V.; Ishihara, T.; Myojo, N.; Inaba, J.-I.; Sueda, K.; Burgyan, J.; Masuta, C. A Viral Satellite RNA Induces Yellow Symptoms on Tobacco By Targeting a Gene Involved in Chlorophyll Biosynthesis Using the RNA Silencing Machinery. PLoS Pathog. 2011, 7, e1002021. [Google Scholar] [CrossRef] [PubMed]
  14. Guan, H.; Xu, X.; He, C.; Liu, C.; Liu, Q.; Dong, R.; Liu, T.; Wang, L. Fine Mapping and Candidate Gene Analysis of the Leaf-Color Gene ygl-1 in Maize. PLoS ONE. 2016, 11, e0153962. [Google Scholar] [CrossRef] [PubMed]
  15. Prina, A.R.; Arias, M.C.; Lainez, V.; Landau, A.; Maldonado, S. A cytoplasmically inherited mutant controlling early chloroplast development in barley seedlings. Theor. Appl. Genet. 2003, 107, 1410–1418. [Google Scholar] [CrossRef]
  16. Jarvis, P.; Dörmann, P.; Peto, C.A.; Lutes, J.; Benning, C.; Chory, J. Galactolipid deficiency and abnormal chloroplast development in the Arabidopsis MGD synthase 1 mutant. Proc. Natl. Acad. Sci. USA 2000, 97, 8175–8179. [Google Scholar] [CrossRef]
  17. Holding, D.R.; Springer, P.S.; Coomber, S.A. The Chloroplast and Leaf Developmental Mutant, pale cress, Exhibits Light-conditional Severity and Symptoms Characteristic of its ABA Deficiency. Ann. Bot. 2000, 86, 953–962. [Google Scholar] [CrossRef]
  18. Gupta, R.; Jiao, S.; Zhao, S.; Meeley, R.B.; Williams, R.W.; Taramino, G.; Feng, D.; Li, G.; Liu, J.; Allen, S.M.; et al. The maize premature senesence2 encodes for PHYTOCHROME-DEPENDENT LATE-FLOWERING and its expression modulation improves agronomic traits under abiotic stresses. Plant Direct. 2020, 4, e00295. [Google Scholar] [CrossRef]
  19. Wu, H.-B.; Wang, B.; Chen, Y.; Liu, Y.-G.; Chen, L. Characterization and fine mapping of the rice premature senescence mutant ospse1. Theor. Appl. Genet. 2013, 126, 1897–1907. [Google Scholar] [CrossRef]
  20. Aung, K.; Lin, S.-I.; Wu, C.-C.; Huang, Y.-T.; Su, C.-L.; Chiou, T.-J. pho2, a Phosphate Overaccumulator, Is Caused by a Nonsense Mutation in a MicroRNA399 Target Gene. Plant Physiol. 2006, 141, 1000–1011. [Google Scholar] [CrossRef]
  21. Kong, Z.; Li, M.; Yang, W.; Xu, W.; Xue, Y. A novel nuclear-localized CCCH-type zinc finger protein, OsDOS, is involved in delaying leaf senescence in rice. Plant Physiol. 2006, 141, 1376–1388. [Google Scholar] [CrossRef] [PubMed]
  22. He, Y.; Zhang, Z.; Li, L.; Tang, S.; Wu, J.-L. Genetic and Physio-Biochemical Characterization of a Novel Premature Senescence Leaf Mutant in Rice (Oryza sativa L.). Int. J. Mol. Sci. 2018, 19, 2339. [Google Scholar] [CrossRef] [PubMed]
  23. Gao, X.; Wu, X.; Liu, G.; Zhang, Z.; Chao, J.; Li, Z.; Guo, Y.; Sun, Y. Characterization and Mapping of a Novel Premature Leaf Senescence Mutant in Common Tobacco (Nicotiana tabacum L.). Plants 2019, 8, 415. [Google Scholar] [CrossRef]
  24. Fracheboud, Y.; King, P.J. An auxin-auxotrophic mutant of Nicotiana plumbaginifolia. Mol. Gen. Genet. MGG 1991, 227, 397–400. [Google Scholar] [CrossRef] [PubMed]
  25. Zhao, M.-M.; Zhang, X.-W.; Liu, Y.-W.; Li, K.; Tan, Q.; Zhou, S.; Wang, G.; Zhou, C.-J. A WRKY transcription factor, TaWRKY42-B, facilitates initiation of leaf senescence by promoting jasmonic acid biosynthesis. BMC Plant Biol. 2020, 20, 444. [Google Scholar] [CrossRef]
  26. Jiang, Y.; Liang, G.; Yang, S.; Yu, D. Arabidopsis WRKY57 Functions as a Node of Convergence for Jasmonic Acid- and Auxin-Mediated Signaling in Jasmonic Acid-Induced Leaf Senescence. Plant Cell 2014, 26, 230–245. [Google Scholar] [CrossRef]
  27. Chen, L.; Xiang, S.; Chen, Y.; Li, D.; Yu, D. Arabidopsis WRKY45 Interacts with the DELLA Protein RGL1 to Positively Regulate Age-Triggered Leaf Senescence. Mol. Plant 2017, 10, 1174–1189. [Google Scholar] [CrossRef]
  28. Gao, S.; Gao, J.; Zhu, X.; Song, Y.; Li, Z.; Ren, G.; Zhou, X.; Kuai, B. ABF2, ABF3, and ABF4 Promote ABA-Mediated Chlorophyll Degradation and Leaf Senescence by Transcriptional Activation of Chlorophyll Catabolic Genes and Senescence-Associated Genes in Arabidopsis. Mol. Plant 2016, 9, 1272–1285. [Google Scholar] [CrossRef]
  29. Markwell, J.; Osterman, J. Occurrence of Temperature-Sensitive Phenotypic Plasticity in Chlorophyll-Deficient Mutants of Arabidopsis thaliana. Plant Physiol. 1992, 98, 392–394. [Google Scholar] [CrossRef]
  30. Pasini, L.; Bruschini, S.; Bertoli, A.; Mazza, R.; Fracheboud, Y.; Marocco, A. Photosynthetic performance of cold-sensitive mutants of maize at low temperature. Physiol. Plant. 2005, 124, 362–370. [Google Scholar] [CrossRef]
  31. Wu, A.; Allu, A.D.; Garapati, P.; Siddiqui, H.; Dortay, H.; Zanor, M.-I.; Asensi-Fabado, M.A.; Munné-Bosch, S.; Antonio, C.; Tohge, T.; et al. JUNGBRUNNEN1, a reactive oxygen species-responsive NAC transcription factor, regulates longevity in Arabidopsis. Plant Cell 2012, 24, 482–506. [Google Scholar] [CrossRef] [PubMed]
  32. Huang, J.; Yan, M.; Zhu, X.; Zhang, T.; Shen, W.; Yu, P.; Wang, Y.; Sang, X.; Yu, G.; Zhao, B.; et al. Gene mapping of starch accumulation and premature leaf senescence in the ossac3 mutant of rice. Euphytica 2018, 214, 177. [Google Scholar] [CrossRef]
  33. Huang, Q.N.; Shi, Y.F.; Zhang, X.B.; Song, L.X.; Feng, B.H.; Wang, H.M.; Xu, X.; Li, X.H.; Guo, D.; Wu, J.L. Single base substitution in OsCDC48 is responsible for premature senescence and death phenotype in rice. J. Integr. Plant Biol. 2016, 58, 12–28. [Google Scholar] [CrossRef] [PubMed]
  34. Yang, X.; Gong, P.; Li, K.; Huang, F.; Cheng, F.; Pan, G. A single cytosine deletion in the OsPLS1 gene encoding vacuolar-type H+-ATPase subunit A1 leads to premature leaf senescence and seed dormancy in rice. J. Exp. Bot. 2016, 67, 2761–2776. [Google Scholar] [CrossRef]
  35. Yang, Y.; Chen, X.; Xu, B.; Li, Y.; Ma, Y.; Wang, G. Phenotype and transcriptome analysis reveals chloroplast development and pigment biosynthesis together influenced the leaf color formation in mutants of Anthurium andraeanum ‘Sonate’. Front. Plant Sci. 2015, 6, 139–154. [Google Scholar] [CrossRef] [PubMed]
  36. Li, Y.; Zhang, Z.; Wang, P.; Wang, S.A.; Ma, L.; Li, L.; Yang, R.; Ma, Y.; Wang, Q. Comprehensive transcriptome analysis discovers novel candidate genes related to leaf color in a Lagerstroemia indica yellow leaf mutant. Genes Genom. 2015, 37, 851–863. [Google Scholar] [CrossRef]
  37. Chai, M.; Guo, Z.; Shi, X.; Li, Y.; Tang, J.; Zhang, Z. Dissecting the Regulatory Network of Leaf Premature Senescence in Maize (Zea mays L.) Using Transcriptome Analysis of ZmELS5 Mutant. Genes 2019, 10, 944. [Google Scholar] [CrossRef]
  38. Li, Z.; Pan, X.; Guo, X.; Fan, K.; Lin, W. Physiological and Transcriptome Analyses of Early Leaf Senescence for ospls1 Mutant Rice (Oryza sativa L.) during the Grain-Filling Stage. Int. J. Mol. Sci. 2019, 20, 1098. [Google Scholar] [CrossRef]
  39. Wu, H.; Shi, N.; An, X.; Liu, C.; Fu, H.; Cao, L.; Feng, Y.; Sun, D.; Zhang, L. Candidate Genes for Yellow Leaf Color in Common Wheat (Triticum aestivum L.) and Major Related Metabolic Pathways according to Transcriptome Profiling. Int. J. Mol. Sci. 2018, 19, 1594. [Google Scholar] [CrossRef]
  40. Zhang, Q.; Xia, C.; Zhang, L.; Dong, C.; Liu, X.; Kong, X. Transcriptome Analysis of a Premature Leaf Senescence Mutant of Common Wheat (Triticum aestivum L.). Int. J. Mol. Sci. 2018, 19, 782. [Google Scholar] [CrossRef]
  41. Li, F.; Zhang, X.; Song, B.; Li, J.; Shang, Z.; Guan, J. Combined effects of 1-MCP and MAP on the fruit quality of pear (Pyrus bretschneideri Reld cv. Laiyang) during cold storage. Sci. Hortic. 2013, 164, 544–551. [Google Scholar] [CrossRef]
  42. Saher, S.; Piqueras, A.; Hellin, E.; Olmos, E. Hyperhydricity in micropropagated carnation shoots: The role of oxidative stress. Physiol. Plant. 2004, 120, 152–161. [Google Scholar] [CrossRef] [PubMed]
  43. Bradford, M.M. A rapid and sensitive method for the quantitation of microgram quantities of protein utilizing the principle of protein-dye binding. Anal. Biochem. 1976, 72, 248–254. [Google Scholar] [CrossRef]
  44. Zhang, R.; Liu, R.; Zong, W. Bisphenol S Interacts with Catalase and Induces Oxidative Stress in Mouse Liver and Renal Cells. J. Agric. Food Chem. 2016, 64, 6630–6640. [Google Scholar] [CrossRef] [PubMed]
  45. Kochba, J.; Lavee, S.; Spiegel-Roy, P. Differences in peroxidase activity and isoenzymes in embryogenic ane non-embryogenic ‘Shamouti’ orange ovular callus lines1. Plant Cell Physiol. 1977, 18, 463–467. [Google Scholar] [CrossRef]
  46. Yang, Y.-L.; Xu, J.; Rao, Y.-C.; Zeng, Y.-J.; Liu, H.-J.; Zheng, T.-T.; Zhang, G.-H.; Hu, J.; Guo, L.-B.; Qian, Q.; et al. Cloning and functional analysis of pale-green leaf (PGL10) in rice (Oryza sativa L.). Plant Growth Regul. 2016, 78, 69–77. [Google Scholar] [CrossRef]
  47. Jung, K.-H.; Hur, J.; Ryu, C.-H.; Choi, Y.; Chung, Y.-Y.; Miyao, A.; Hirochika, H.; An, G. Characterization of a Rice Chlorophyll-Deficient Mutant Using the T-DNA Gene-Trap System. Plant Cell Physiol. 2003, 44, 463–472. [Google Scholar] [CrossRef]
  48. Pattanayak, G.K.; Tripathy, B.C. Modulation of biosynthesis of photosynthetic pigments and light-harvesting complex in wild-type and gun5 mutant of Arabidopsis thaliana during impaired chloroplast development. Protoplasma 2016, 253, 747–752. [Google Scholar] [CrossRef]
  49. Xie, Q.; Liang, Y.; Zhang, J.; Zheng, H.; Dong, G.; Qian, Q.; Zuo, J. Involvement of a Putative Bipartite Transit Peptide in Targeting Rice Pheophorbide a Oxygenase into Chloroplasts for Chlorophyll Degradation during Leaf Senescence. J. Genet. Genom. 2016, 43, 145–154. [Google Scholar] [CrossRef]
  50. Waszczak, C.; Carmody, M.; Kangasjärvi, J. Reactive Oxygen Species in Plant Signaling. Annu. Rev. Plant Biol. 2018, 69, 209–236. [Google Scholar] [CrossRef]
  51. Chyzhykova, O.A.; Palladina, T.O. The role of amino acids and sugars in supporting of osmotic homeostasis in maize seedlings under salinization conditions and treatment with synthetic growth regulators. Ukr. Kyi Biokhimichnyi Zhurnal 2006, 78, 124–129. [Google Scholar]
  52. Foyer, C.H.; Noctor, G. Stress-triggered redox signalling: What’s in pROSpect? Plant Cell Environ. 2016, 39, 951–964. [Google Scholar] [CrossRef]
  53. Huang, Y.-M.; Zhu, S.-S.; Zhao, Z.-C.; Pu, Z.-G.; Liu, T.-Z.; Luo, S.; Zhang, X. Gene Mapping and Cloning of a Premature Leaf Senescence Mutant psls1 in Rice. Acta Agron. Sin. 2017, 43, 51–62. [Google Scholar] [CrossRef]
  54. Zhang, T.; Sun, Y.-Y.; Zheng, J.-M.; Cheng, Z.-J.; Jiang, K.-F.; Yang, L.; Cao, Y.-J.; You, S.-M.; Wan, J.-M.; Zheng, J.-K. Genetic Analysis and Fine Mapping of a Premature Leaf Senescence Mutant in Rice (Orzya sativa L.). Acta Agron. Sin. 2014, 40, 2070. [Google Scholar] [CrossRef]
  55. Li, H.; Wang, G.; Liu, S.; An, Q.; Zheng, Q.; Li, B.; Li, Z. Comparative changes in the antioxidant system in the flag leaf of early and normally senescing near-isogenic lines of wheat (Triticum aestivum L.). Plant Cell Rep. 2014, 33, 1109–1120. [Google Scholar] [CrossRef]
  56. Qiu, K.; Li, Z.; Yang, Z.; Chen, J.; Wu, S.; Zhu, X.; Gao, S.; Gao, J.; Ren, G.; Kuai, B.; et al. EIN3 and ORE1 Accelerate Degreening during Ethylene-Mediated Leaf Senescence by Directly Activating Chlorophyll Catabolic Genes in Arabidopsis. PLoS Genet. 2015, 11, e1005399. [Google Scholar] [CrossRef]
  57. Pauwels, L.; Morreel, K.; De Witte, E.; Lammertyn, F.; Van Montagu, M.; Boerjan, W.; Inzé, D.; Goossens, A. Mapping methyl jasmonate-mediated transcriptional reprogramming of metabolism and cell cycle progression in cultured Arabidopsis cells. Proc. Natl. Acad. Sci. USA 2008, 105, 1380–1385. [Google Scholar] [CrossRef]
  58. Schommer, C.; Palatnik, J.F.; Aggarwal, P.; Chételat, A.; Cubas, P.; Farmer, E.E.; Nath, U.; Weigel, D. Control of jasmonate biosynthesis and senescence by miR319 targets. PLoS Biol. 2008, 6, e230. [Google Scholar] [CrossRef]
  59. He, K.; Gou, X.; Yuan, T.; Lin, H.; Asami, T.; Yoshida, S.; Russell, S.D.; Li, J. BAK1 and BKK1 regulate brassinosteroid-dependent growth and brassinosteroid-independent cell-death pathways. Curr. Biol. 2007, 17, 1109–1115. [Google Scholar] [CrossRef]
  60. Yin, Y.; Wang, Z.-Y.; Mora-Garcia, S.; Li, J.; Yoshida, S.; Asami, T.; Chory, J. BES1 Accumulates in the Nucleus in Response to Brassinosteroids to Regulate Gene Expression and Promote Stem Elongation. Cell 2002, 109, 181–191. [Google Scholar] [CrossRef]
  61. Hung, K.T.; Kao, C.H. Hydrogen peroxide is necessary for abscisic acid-induced senescence of rice leaves. J. Plant Physiol. 2004, 161, 1347–1357. [Google Scholar] [CrossRef] [PubMed]
  62. van der Graaff, E.; Schwacke, R.; Schneider, A.; Desimone, M.; Flügge, U.I.; Kunze, R. Transcription analysis of arabidopsis membrane transporters and hormone pathways during developmental and induced leaf senescence. Plant Physiol. 2006, 141, 776–792. [Google Scholar] [CrossRef] [PubMed]
  63. Stoddart, J.L.; Thomas, H. Leaf Senescence. In Nucleic Acids and Proteins in Plants I: Structure, Biochemistry and Physiology of Proteins; Boulter, D., Parthier, B., Eds.; Springer: Berlin/Heidelberg, Germany, 1982; pp. 592–636. [Google Scholar]
  64. Breeze, E.; Harrison, E.; McHattie, S.; Hughes, L.K.; Hickman, R.; Hill, C.; Kiddle, S.J.; Kim, Y.-S.; Penfold, C.A.; Jenkins, D.J.; et al. High-Resolution Temporal Profiling of Transcripts during Arabidopsis Leaf Senescence Reveals a Distinct Chronology of Processes and Regulation[C][W][OA]. Plant Cell 2011, 23, 873–894. [Google Scholar] [CrossRef] [PubMed]
  65. Sağlam-Çağ, S. The Effect of Epibrassinolide on Senescence in Wheat Leaves. Biotechnol. Biotechnol. Equip. 2007, 21, 63–65. [Google Scholar] [CrossRef]
  66. Lin, M.; Pang, C.; Fan, S.; Song, M.; Wei, H.; Yu, S. Global analysis of the Gossypium hirsutum L. Transcriptome during leaf senescence by RNA-Seq. BMC Plant Biol. 2015, 15, 43. [Google Scholar] [CrossRef] [PubMed]
  67. Borrill, P.; Harrington, S.A.; Simmonds, J.; Uauy, C. Identification of Transcription Factors Regulating Senescence in Wheat through Gene Regulatory Network Modelling. Plant Physiol. 2019, 180, 1740–1755. [Google Scholar] [CrossRef] [PubMed]
  68. Schippers, J.H.M.; Schmidt, R.; Wagstaff, C.; Jing, H.-C. Living to Die and Dying to Live: The Survival Strategy behind Leaf Senescence. Plant Physiol. 2015, 169, 914–930. [Google Scholar] [CrossRef]
  69. Schippers, J.H.M. Transcriptional networks in leaf senescence. Curr. Opin. Plant Biol. 2015, 27, 77–83. [Google Scholar] [CrossRef]
  70. Bresson, J.; Bieker, S.; Riester, L.; Doll, J.; Zentgraf, U. A guideline for leaf senescence analyses: From quantification to physiological and molecular investigations. J. Exp. Bot. 2018, 69, 769–786. [Google Scholar] [CrossRef]
  71. Liang, C.; Wang, Y.; Zhu, Y.; Tang, J.; Hu, B.; Liu, L.; Ou, S.; Wu, H.; Sun, X.; Chu, J.; et al. OsNAP connects abscisic acid and leaf senescence by fine-tuning abscisic acid biosynthesis and directly targeting senescence-associated genes in rice. Proc. Natl. Acad. Sci. USA 2014, 111, 10013–10018. [Google Scholar] [CrossRef]
  72. Guo, W.F.; Liu, D.C.; Yang, L.; Zhuang, X.; Zhang, J.J.; Wang, S.S.; Liu, Y. Cloning and Expression Analysis of New Stress-resistant NAC83 Gene from Citrus. Acta Hortic. Sin. 2015, 42, 445–454. [Google Scholar]
  73. Mao, Y.; Xu, J.; Wang, Q.; Li, G.; Tang, X.; Liu, T.; Feng, X.; Wu, F.; Li, M.; Xie, W.; et al. A natural antisense transcript acts as a negative regulator for the maize drought stress response gene ZmNAC48. J. Exp. Bot. 2021, 72, 2790–2806. [Google Scholar] [CrossRef] [PubMed]
  74. Xu, Z.; Wang, C.; Xue, F.; Zhang, H.; Ji, W. Wheat NAC transcription factor TaNAC29 is involved in response to salt stress. Plant Physiol. Biochem. 2015, 96, 356–363. [Google Scholar] [CrossRef]
  75. Huang, Q.; Wang, Y. Overexpression of TaNAC2D Displays Opposite Responses to Abiotic Stresses between Seedling and Mature Stage of Transgenic Arabidopsis. Front. Plant Sci. 2016, 7, 1754. [Google Scholar] [CrossRef] [PubMed]
  76. Xia, N.; Zhang, G.; Liu, X.-Y.; Deng, L.; Cai, G.-L.; Zhang, Y.; Wang, X.-J.; Zhao, J.; Huang, L.-L.; Kang, Z.-S. Characterization of a novel wheat NAC transcription factor gene involved in defense response against stripe rust pathogen infection and abiotic stresses. Mol. Biol. Rep. 2010, 37, 3703–3712. [Google Scholar] [CrossRef] [PubMed]
  77. Zhao, F.; Fan, S.; Song, M.; Pang, C.; Guo, Y.; Li, L.; Wei, H.; Yu, S. Characterization and Function Analysis of GhNAC78,a Transcription Factor Gene in Upland Cotton(Gossypium hirsutum L.). Cotton Sci. 2014, 140, 270–273. [Google Scholar]
  78. Wang, F.; Hou, X.; Tang, J.; Wang, Z.; Wang, S.; Jiang, F.; Li, Y. A novel cold-inducible gene from Pak-choi (Brassica campestris ssp. chinensis), BcWRKY46, enhances the cold, salt and dehydration stress tolerance in transgenic tobacco. Mol. Biol. Rep. 2012, 39, 4553–4564. [Google Scholar] [CrossRef]
  79. Ding, Z.J.; Yan, J.Y.; Xu, X.Y.; Yu, D.Q.; Li, G.X.; Zhang, S.Q.; Zheng, S.J. Transcription factor WRKY46 regulates osmotic stress responses and stomatal movement independently in Arabidopsis. Plant J. 2014, 79, 13–27. [Google Scholar] [CrossRef]
  80. Hu, Y.; Dong, Q.; Yu, D. Arabidopsis WRKY46 coordinates with WRKY70 and WRKY53 in basal resistance against pathogen Pseudomonas syringae. Plant Sci. 2012, 185–186, 288–297. [Google Scholar] [CrossRef]
  81. Liu, L.; Zhang, Z.; Dong, J.; Wang, T. Overexpression of MtWRKY76 increases both salt and drought tolerance in Medicago truncatula. Environ. Exp. Bot. 2016, 123, 50–58. [Google Scholar] [CrossRef]
  82. Raineri, J.; Ribichich, K.F.; Chan, R.L. The sunflower transcription factor HaWRKY76 confers drought and flood tolerance to Arabidopsis thaliana plants without yield penalty. Plant Cell Rep. 2015, 34, 2065–2080. [Google Scholar] [CrossRef]
  83. Robatzek, S.; Somssich, I.E. Targets of AtWRKY6 regulation during plant senescence and pathogen defense. Genes Dev. 2002, 16, 1139–1149. [Google Scholar] [CrossRef] [PubMed]
  84. Hwang, S.-H.; Yie, S.W.; Hwang, D.-J. Heterologous expression of OsWRKY6 gene in Arabidopsis activates the expression of defense related genes and enhances resistance to pathogens. Plant Sci. 2011, 181, 316–323. [Google Scholar] [CrossRef] [PubMed]
  85. Robatzek, S.; Somssich, I.E. A new member of the Arabidopsis WRKY transcription factor family, AtWRKY6, is associated with both senescence- and defence-related processes. Plant J. 2001, 28, 123–133. [Google Scholar] [CrossRef] [PubMed]
  86. Knoth, C.; Ringler, J.; Dangl, J.L.; Eulgem, T. Arabidopsis WRKY70 is required for full RPP4-mediated disease resistance and basal defense against Hyaloperonospora parasitica. Mol. Plant-Microbe Interact. 2007, 20, 120–128. [Google Scholar] [CrossRef] [PubMed]
  87. Li, J.; Brader, G.; Kariola, T.; Palva, E.T. WRKY70 modulates the selection of signaling pathways in plant defense. Plant J. 2006, 46, 477–491. [Google Scholar] [CrossRef] [PubMed]
  88. Chen, J.; Nolan, T.M.; Ye, H.; Zhang, M.; Tong, H.; Xin, P.; Chu, J.; Chu, C.; Li, Z.; Yin, Y. Arabidopsis WRKY46, WRKY54, and WRKY70 Transcription Factors Are Involved in Brassinosteroid-Regulated Plant Growth and Drought Responses. Plant Cell 2017, 29, 1425–1439. [Google Scholar] [CrossRef] [PubMed]
  89. Liu, H.; Wei, Y.; Deng, Z.; Dai, L.; Yang, H.; Dejun, L.I. Cloning and Expression Analysis of a WRKY Transcription Factor Gene HbWRKY41 in Hevea brasiliensis. Acta Agric. Boreali-Sin. 2017, 32, 91–96. [Google Scholar]
  90. Chen, Y.-S.; David Ho, T.-H.; Liu, L.; Lee Ding, H.; Lee, C.-H.; Chen, Y.-R.; Lin, S.-Y.; Lu, C.-A.; Yu, S.-M. Sugar starvation-regulated MYBS2 and 14-3-3 protein interactions enhance plant growth, stress tolerance, and grain weight in rice. Proc. Natl. Acad. Sci. USA 2019, 116, 21925–21935. [Google Scholar] [CrossRef]
  91. Chen, Y.-S.; Chao, Y.-C.; Tseng, T.-W.; Huang, C.-K.; Lo, P.-C.; Lu, C.-A. Two MYB-related transcription factors play opposite roles in sugar signaling in Arabidopsis. Plant Mol. Biol. 2017, 93, 299–311. [Google Scholar] [CrossRef]
Figure 1. Phenotypes of wild-type (Chang6878) and mutant (GSm) wheat at (A) seedling of Chang6878, and GSm (B) mid-grouting stage (flag leaf) of Chang6878, hybrid F1 and GSm, (C) flowering stage of Chang6878, and GSm, and (D) mid-grouting stage of Chang6878, hybrid F1, and GSm.
Biology 11 00904 g001
Figure 2. Photosynthetic fluorescence indices of flag leaf samples from the wheat premature senescence mutant (GSm) and its wild-type (WT). (A) Chlorophyll content; (B) Net photosynthetic rate, Pn; (C) Transpiration rate, Tr; (D) efficiency of primary conversion of light energy of photosystem II, Fv/Fm; (E) Non-photochemical quenching coefficient, NPQ; (F) Photosynthetic electron transport rate, ETR. Vertical bars represent standard errors with three independent biological replicates.
Biology 11 00904 g002
Figure 3. Senescence related physiological traits of GSm mutant and wild type. (A) Malondialdehyde content (B) soluble protein content (C) peroxidase activity (D) catalase activity. The vertical bar represents the standard error with three independent biological repetitions.
Biology 11 00904 g003
Figure 4. Venn diagram of DEG numbers in four samples.
Biology 11 00904 g004
Figure 5. Chlorophyll metabolic pathway. Genes are shown in different colors. Relative gene expression levels are indicated by a color gradient from low (green) to high (red). Squares are arranged from left to right: MS1 (early senescence stage of mutant), MS2 (late senescence stage of mutant), WS1 (early senescence stage of wild-type), and WS2 (late senescence stage of wild-type). Numbers in the scale bar represent normalized transcripts per kilobase million (TPM) values of genes.
Biology 11 00904 g005
Figure 6. Carotenoid synthesis pathway.Genes are shown in different colors. Relative gene expression levels are indicated by a color gradient from low (green) to high (red). Squares are arranged from left to right: MS1 (early senescence stage of mutant), MS2 (late senescence stage of mutant), WS1 (early senescence stage of wild-type), and WS2 (late senescence stage of wild-type). Numbers in the scale bar represent normalized transcripts per kilobase million (TPM) values of genes.
Biology 11 00904 g006
Figure 7. Expression profile clustering of genes involved in different hormone pathways. The expression ratio is standardized based on normalized transcripts per kilobase million (TPM) values, where each vertical column represents the mean of three samples (MS1, MS2, WS1 and WS2), and each horizontal row represents a sample single gene.
Biology 11 00904 g007
Figure 8. Expression profile clustering of autophagy related genes. The expression ratio is standardized based on normalized transcripts per kilobase million (TPM) values, where each vertical column represents the mean of three samples (MS1, MS2, WS1 and WS2), and each horizontal row represents a sample single gene.
Biology 11 00904 g008
Figure 9. Statistics of the number of different transcription factors involved in the activity of sequence specific DNA binding transcription factors under the comparison of four groups.
Biology 11 00904 g009
Figure 10. Expression profile clustering of transcription factor related genes. The expression ratio is standardized based on normalized transcripts per kilobase million (TPM) values, where each vertical column represents the mean of three samples (MS1, MS2, WS1 and WS2), and each horizontal row represents a sample single gene.
Biology 11 00904 g010
Table 1. The main agronomic traits of the WT and mutant.
Agronomic TraitsWild TypeMutant
Effective tiller/plant6.4 ± 1.962.60 ± 0.49 *
Plant height (cm)62.12 ± 3.349.40 ± 2.87 *
NO. of upper sterile spikelets0 ± 00.20 ± 0.4
NO. of lower sterile spikelets0 ± 01.60 ± 0.49 *
Panicle length (cm)14.56 ± 0.299.78 ± 0.72 *
NO.of grains per panicle100.40 ± 9.0233.80 ± 2.79 *
NO. of fruiting spikelets23.40 ± 0.4916.60 ± 0.80 *
Main spike grain weight (g)2.93 ± 0.550.76 ± 0.23 *
Grain yield per plant (g)13.75 ± 4.402.49 ± 0.73 *
1000-grainweight (g)30.16 ± 0.5314.77 ± 0.33 *
Flag leaf length (cm)15.75 ± 1.8916.06 ± 1.28
Flag leaf width (cm)1.5 ± 0.161.32 ± 0.12 *
Second leaf length (cm)20.66 ± 2.6420.44 ± 1.30
Second leaf width (cm)1.38 ± 0.111.22 ± 0.07 *
Dates are the mean ± standard deviation of three repetition. * is significant difference compare with wild type (p < 0.05).
Table 2. Aging characteristic parameters of wild type and mutant.
VarirtyCurve ParametersCharacteristic
kabMRSTMRS/dTs/dTo/d
GSm63.0470.1047−0.14043.2616.072.8424.13
Chang687857.7811.82 × 10−6−0.26185.5650.4839.1354.67
Table 3. DEGs identified from five different comparisons. DEGs: differentially expressed genes.
DEG-SetTotal DEGUp-RegulatedDown-Regulated
WS2_VS_MS218,24610,8017445
MS1_VS_MS215,18082466934
WS1_VS_MS1703050102020
WS1_VS_WS211,74451456599
Table 4. Main enrichment pathways of DEG in 4 groups, refer to go database.
Sample PairClassAnnotationGO IDp-Value
WS1_VS_WS2Biological processmaltose metabolic processGO:00000231.19 × 107
tertiary alcohol metabolic processGO:19026443.1 × 10−7
Cellular componentplastoglobuleGO:00102875.92 × 10−7
cytoskeletonGO:00058561.13 × 10−6
Molecular functionaromatic amino acid transmembrane transporter activityGO:00151731.19 × 10−7
fructosyltransferase activityGO:00507382.78 × 10−7
MS2_VS_WS2Biological processphotosystem II oxygen evolving complex assemblyGO:00102704.55 × 10−8
xanthophyll biosynthetic processGO:00161231.5 × 10−7
Cellular componentcell surfaceGO:00099866.12 × 10−8
chloroplast thylakoid membrane protein complexGO:00988079.89 × 10−8
Molecular functionmagnesium chelatase activityGO:00168514.55 × 10−8
malate transmembrane transporter activityGO:00151404.55 × 10−8
MS1_VS_WS1Biological processS-adenosylhomocysteine metabolic processGO:00464984.58 × 10−8
S-adenosylhomocysteine catabolic processGO:00195104.58 × 10−8
Cellular componentCOPI-coated vesicle membraneGO:00306637.61 × 10−8
oligosaccharyltransferase complexGO:00082501.63 × 10−7
Molecular functionasparaginase activityGO:00040677.61 × 10−8
protein disulfide isomerase activityGO:00037563.15 × 10−7
MS1_VS_MS2Biological processxanthophyll metabolic processGO:00161221.45 × 10−7
fructose metabolic processGO:00060002.16 × 10−7
Cellular componentchloroplast thylakoid membrane protein complexGO:00988071.62 × 10−7
photosystem I reaction centerGO:00095381.66 × 10−7
Molecular functionfructosyltransferase activityGO:00507387.88 × 10−8
fructose 1,6-bisphosphate 1-phosphatase activityGO:00421321.62 × 10−7
Table 5. Main enrichment pathways of DEG in 4 groups, refer to KEGG database.
Sample PairPathwayKo IDp-Value
WS1_VS_WS2Starch and sucrose metabolismmap005008.02 × 10−11
Glycerophospholipid metabolismmap005645.49 × 10−11
Carotenoid biosynthesismap009061.9 × 10−10
MAPK signaling pathway—plantmap040161.12 × 10−8
Glycine, serine and threonine metabolismmap002606.23 × 10−8
MS2_VS_WS2Photosynthesis—antenna proteinsmap001969.69 × 10−45
Porphyrin and chlorophyll metabolismmap008604.92 × 10−24
Glyoxylate and dicarboxylate metabolismmap006302.83 × 10−14
Carbon fixation in photosynthetic organismsmap007108.26 × 10−14
Carotenoid biosynthesismap009063.22 × 10−11
MS1_VS_WS1Protein processing in endoplasmic reticulummap041413.25 × 10−25
Endocytosismap041448.51 × 10−14
Amino sugar and nucleotide sugar metabolismmap005202 × 10−13
N-Glycan biosynthesismap005103.3 × 10−11
Various types of N-glycan biosynthesismap005131.09 × 10−10
MS1_VS_MS2Photosynthesis—antenna proteinsmap001962.23 × 10−44
Carbon fixation in photosynthetic organismsmap007101.9 × 10−25
Starch and sucrose metabolismmap005003.75 × 10−25
Glyoxylate and dicarboxylate metabolismmap006303.15 × 10−20
Porphyrin and chlorophyll metabolismmap008605.48 × 10−19
Table 6. Transcription factor statistics of 4 groups.
Sample
Pair
UP TF NumberDOWN TF NumberALL TF
Number
WS1_VS_WS296262358
MS2_VS_WS2358162520
MS1_VS_WS111170181
MS1_VS_MS2256238494
Publisher’s Note: MDPI stays neutral with regard to jurisdictional claims in published maps and institutional affiliations.

