
First Responders to Hyperosmotic Stress in Murine Astrocytes: Connexin 43 Gap Junctions Are Subject to an Immediate Ultrastructural Reorganization


Abstract
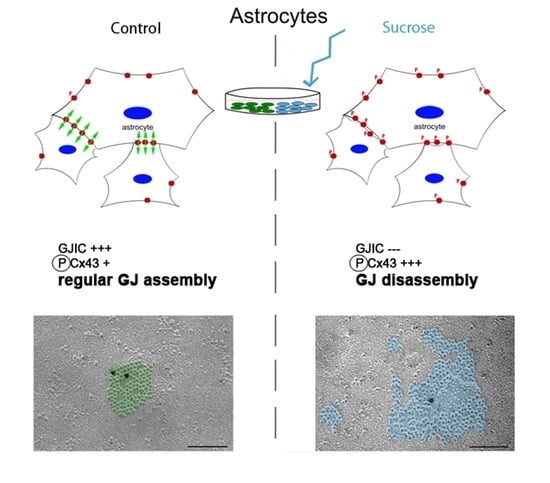
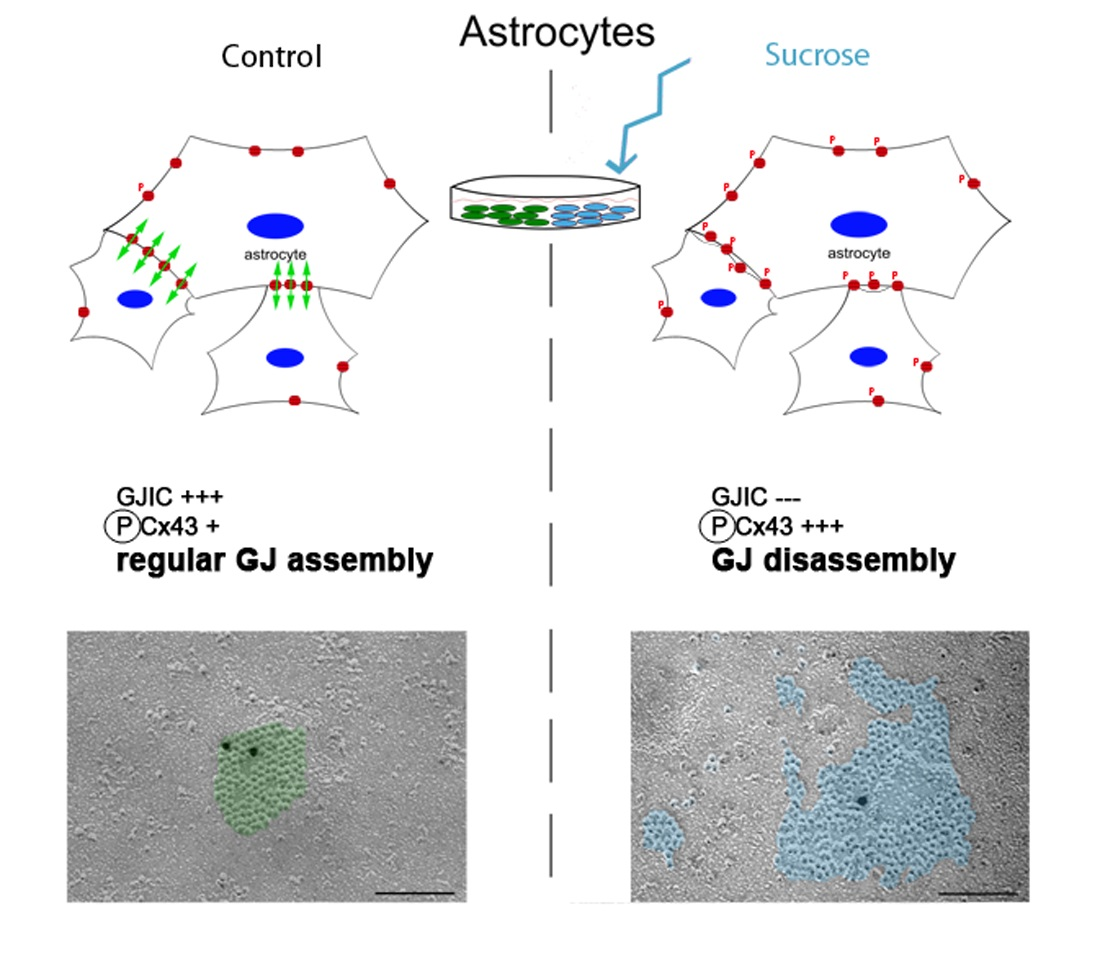
:Simple Summary
Abstract
1. Introduction
2. Materials and Methods
2.1. Culture of Primary Astrocytes and Determination of Microglia Concentration
2.2. Induction of Osmotic Stress
2.3. RNA Isolation, cDNA Synthesis and Quantitative Real-Time PCR
2.4. Cell Lysis and Immunoblotting
2.5. Immunocytochemical Staining
2.6. Scrape Loading/Dye Transfer Assay
2.7. Freeze Fracture and Immunolabeling
2.8. Statistics
3. Results
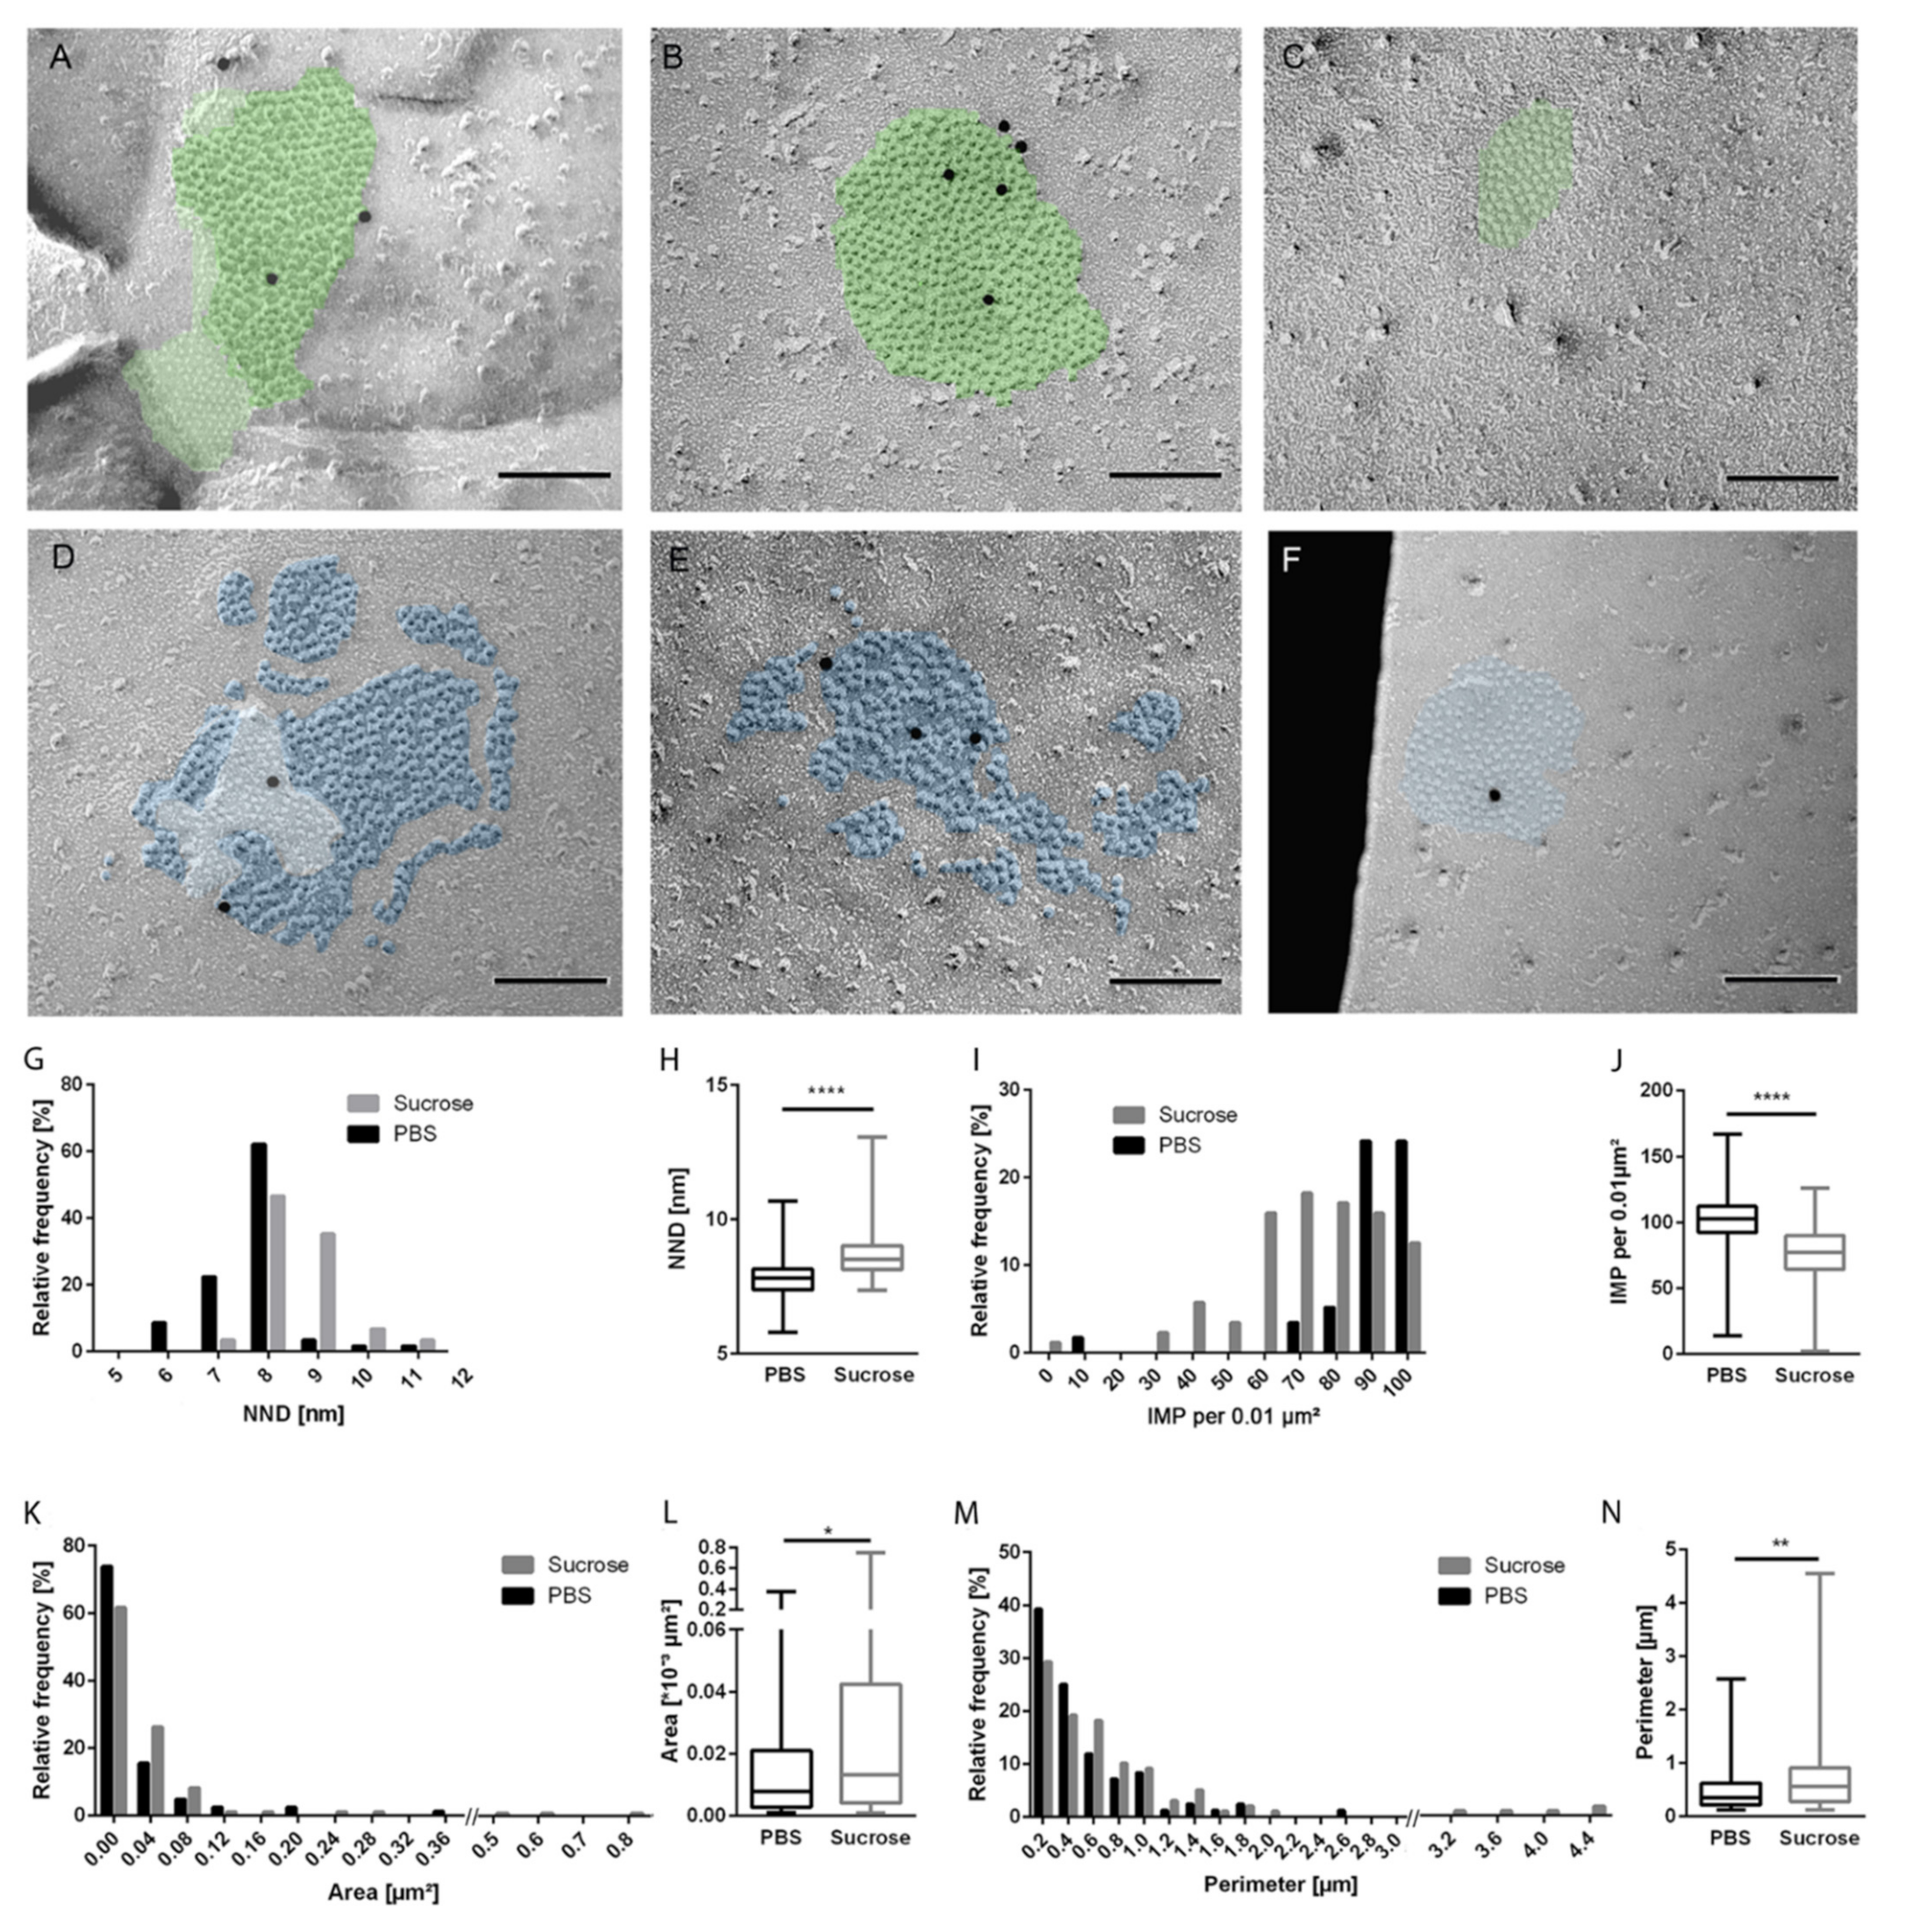
3.1. Influence of Short-Time Hyperosmolarity on the Ultrastructure of Cx43 Gap Junctions
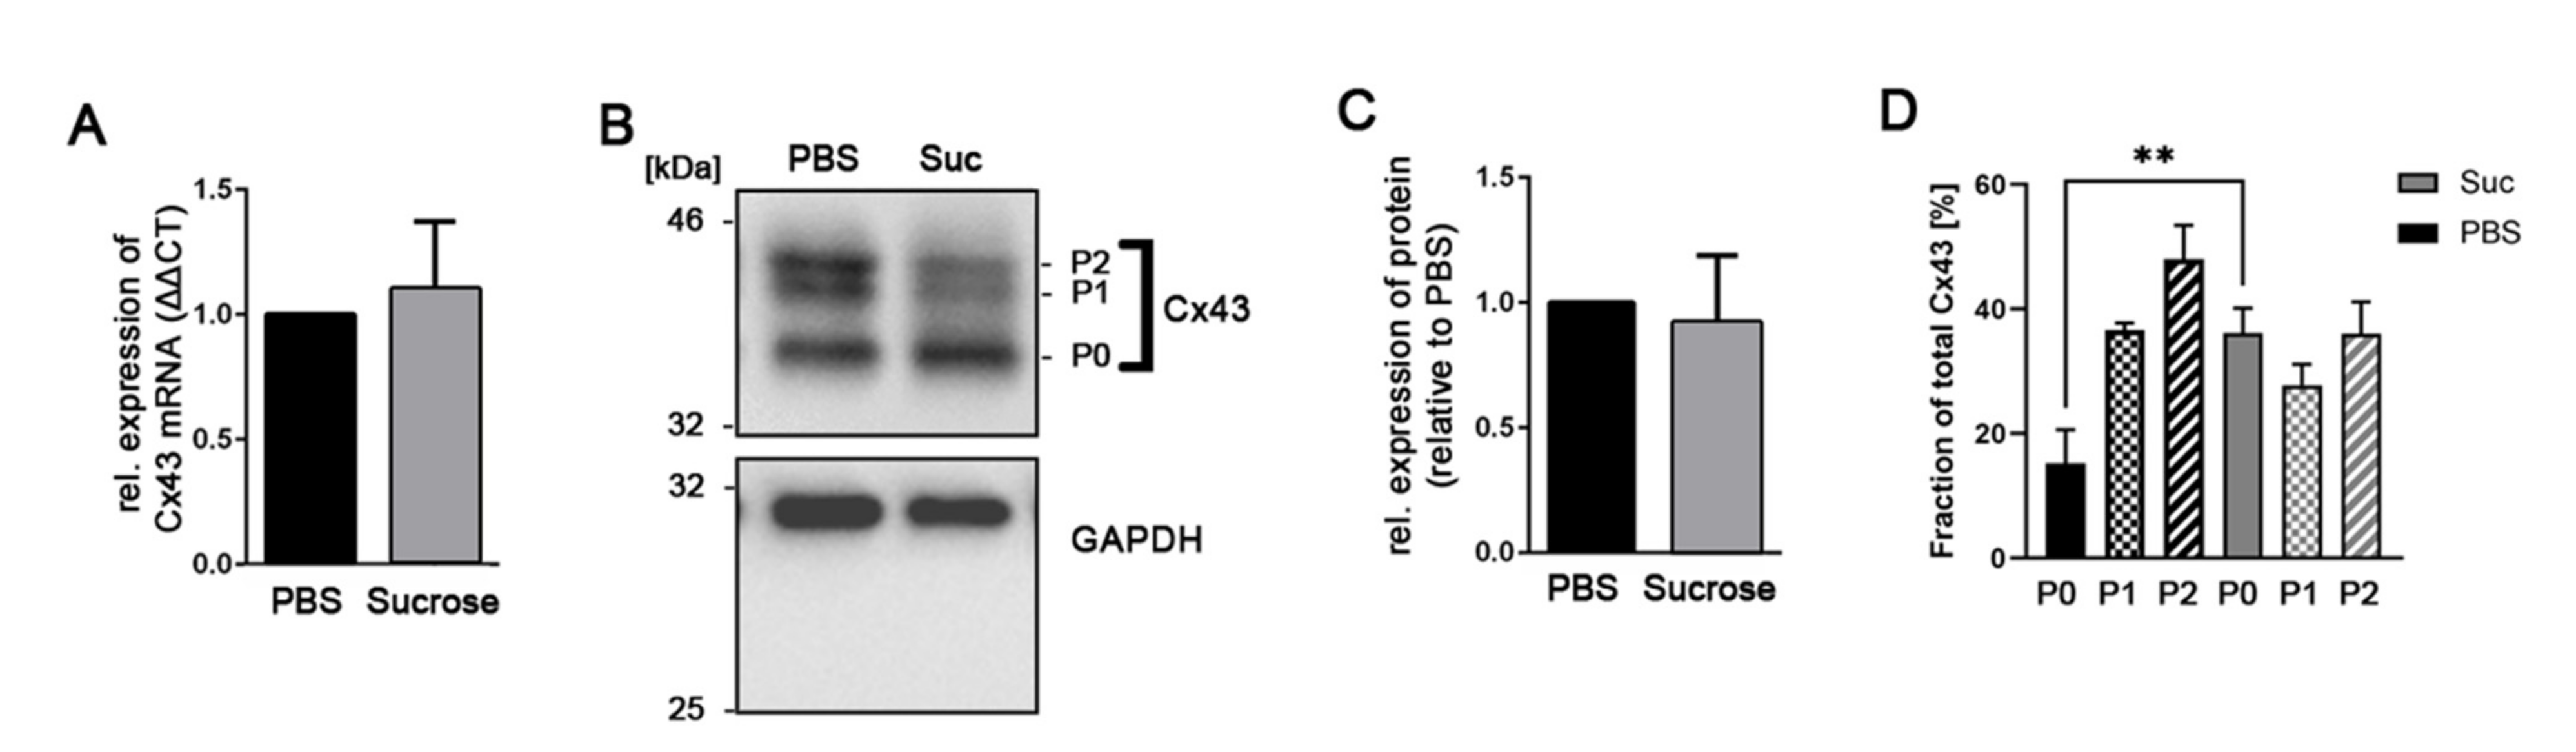
3.2. Influence of Short-Time Hyperosmolarity on the Gap Junction Protein Cx43 Expression
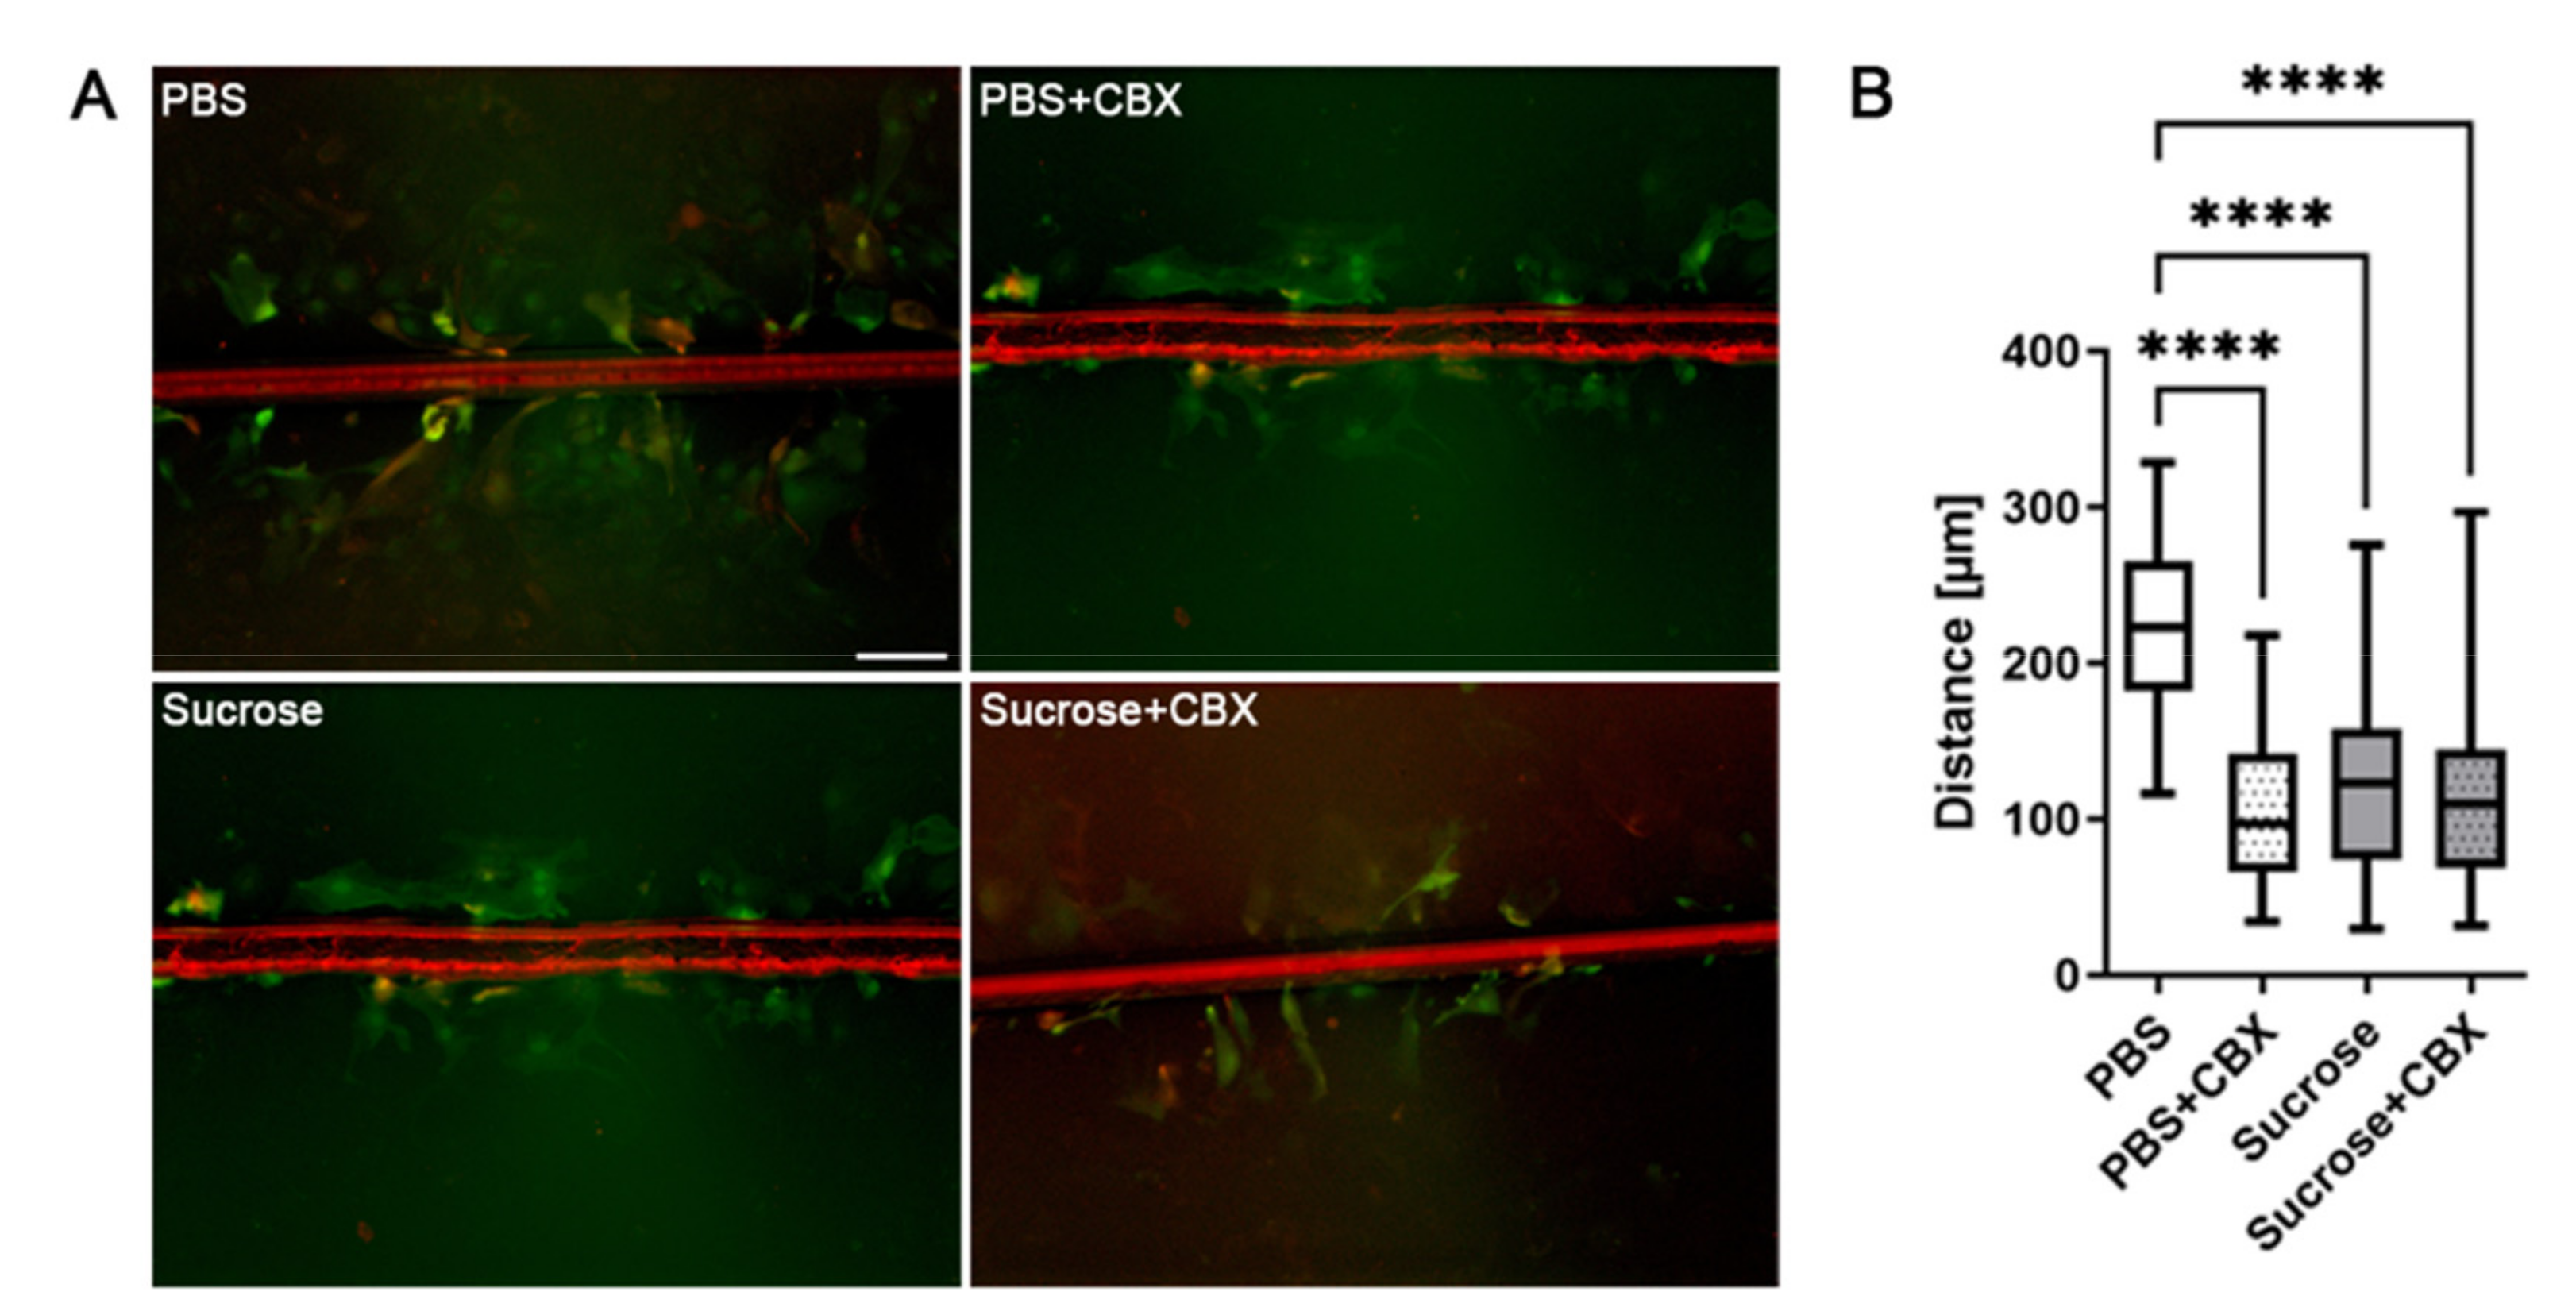
3.3. Short-Time Hyperosmolarity Inhibits Gap Junction Communication
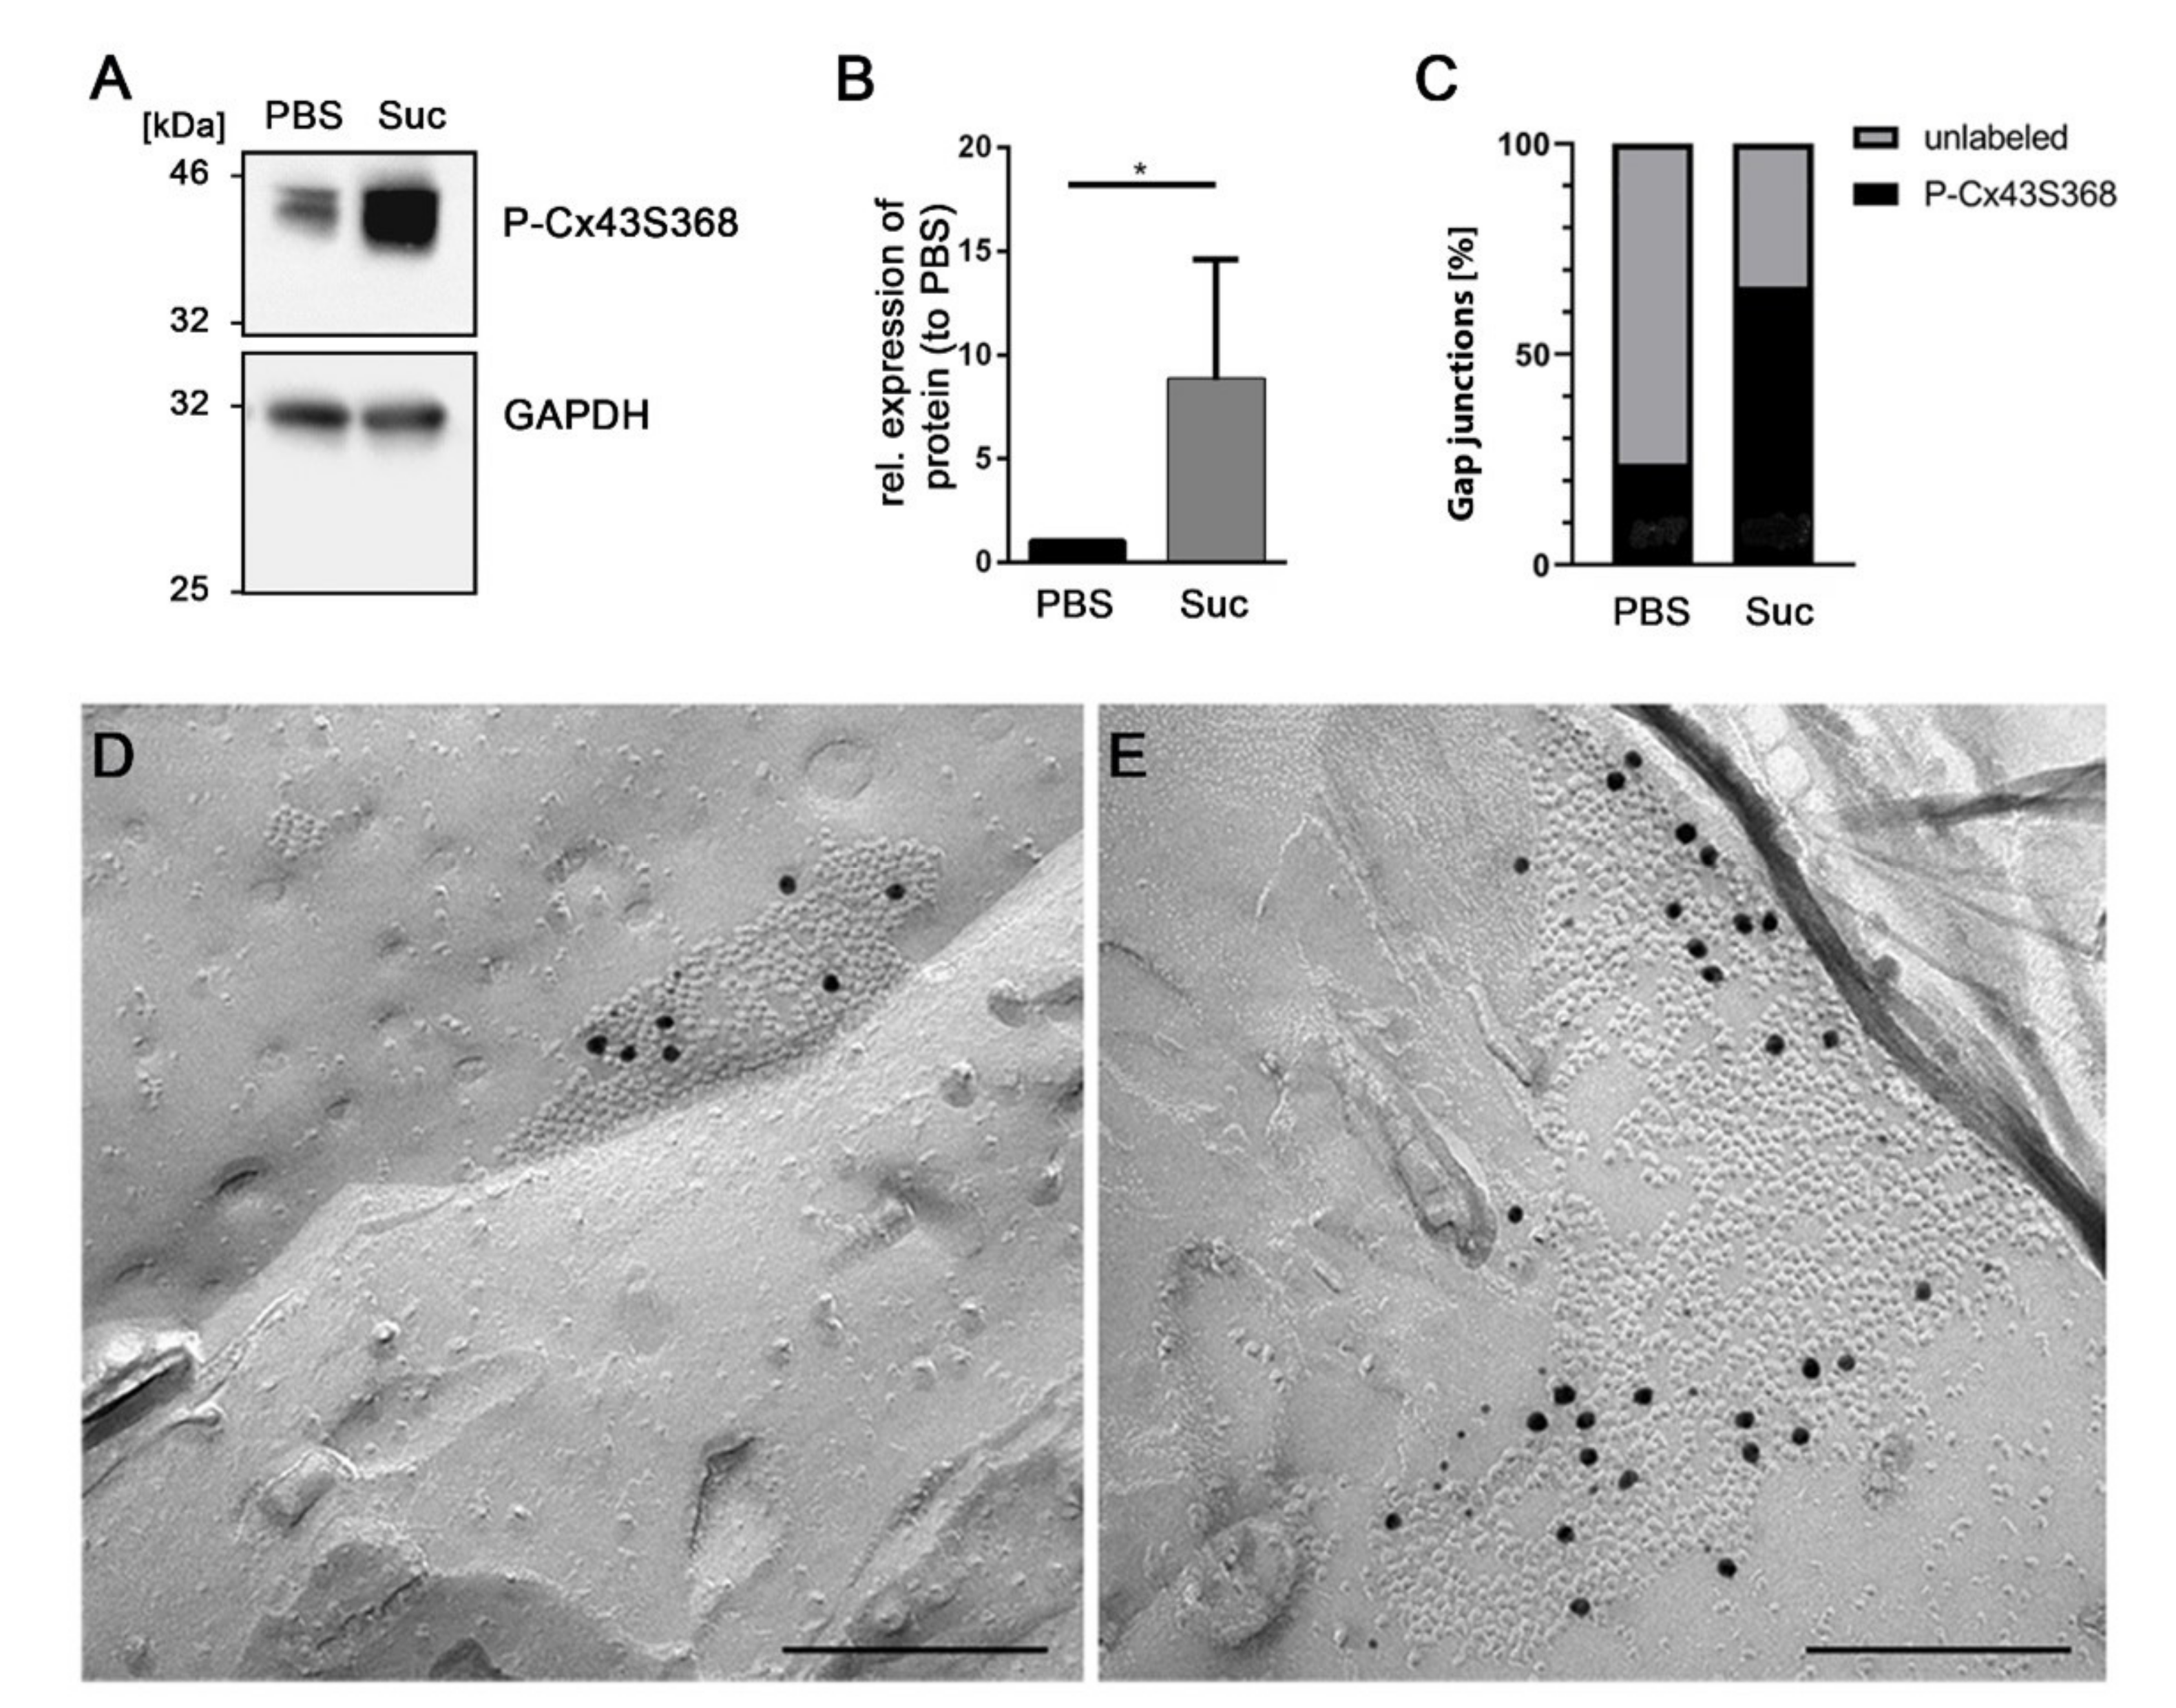
3.4. Influence of Short-Time Hyperosmolarity on the Specific Phosphorylation of Cx43 at S368
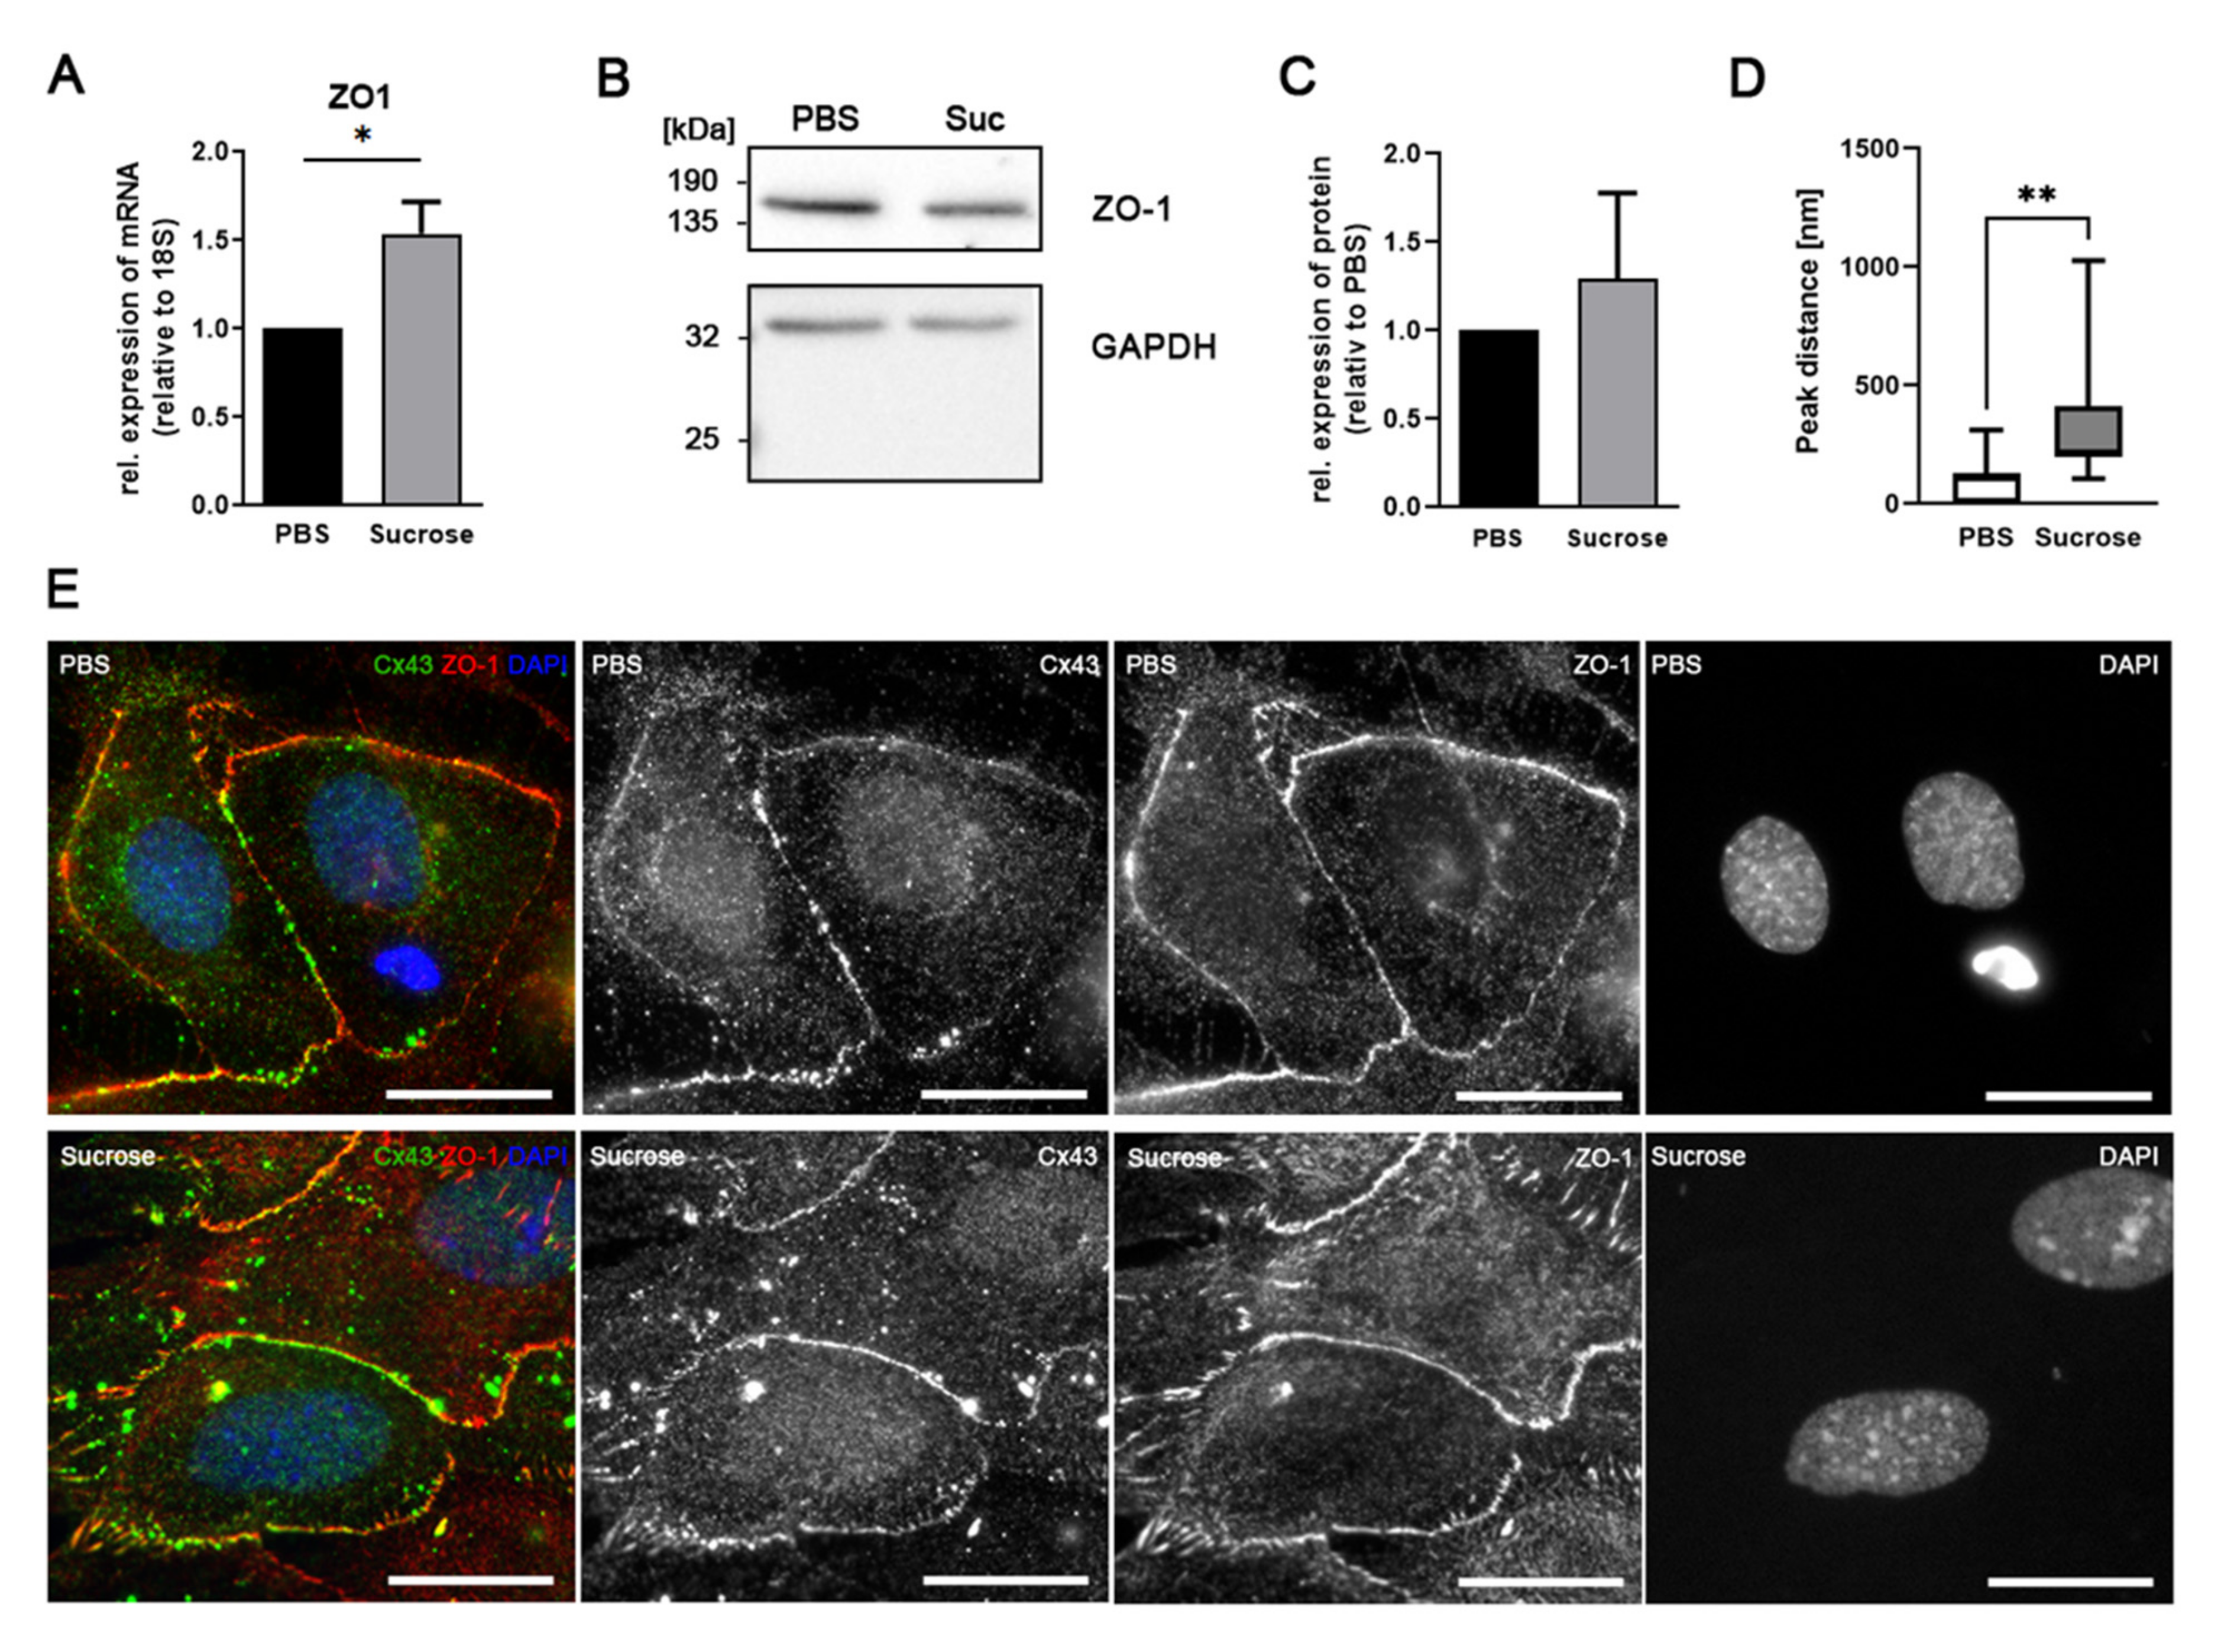
3.5. Influence of Short-Time Hyperosmolarity on Associated Proteins
4. Discussion
5. Conclusions
Supplementary Materials
Author Contributions
Funding
Institutional Review Board Statement
Informed Consent Statement
Data Availability Statement
Acknowledgments
Conflicts of Interest
References
- Bellot-Saez, A.; Kékesi, O.; Morley, J.W.; Buskila, Y. Astrocytic modulation of neuronal excitability through K+ spatial buffering. Neurosci. Biobehav. Rev. 2017, 77, 87–97. [Google Scholar] [CrossRef] [PubMed]
- Goodenough, D.A.; Paul, D.L. Gap junctions. Cold Spring Harb. Perspect. Biol. 2009, 1, a002576. [Google Scholar] [CrossRef] [PubMed]
- Nagy, J.I.; Rash, J.E. Astrocyte and oligodendrocyte connexins of the glial syncytium in relation to astrocyte anatomical domains and spatial buffering. Cell Commun. Adhes. 2003, 10, 401–406. [Google Scholar] [CrossRef] [PubMed] [Green Version]
- Nagy, J.I.; Dermietzel, R. Gap Junctions and Connexins in the Mammalian Central Nervous System. In Advances in Molecular and Cell Biology; Elsevier: Amsterdam, The Netherlands, 2000; Volume 30, pp. 323–396. [Google Scholar]
- De Bock, M.; Leybaert, L.; Giaume, C. Connexin Channels at the Glio-Vascular Interface: Gatekeepers of the Brain. Neurochem. Res. 2017, 42, 2519–2536. [Google Scholar] [CrossRef] [PubMed]
- Simard, M.; Arcuino, G.; Takano, T.; Liu, Q.S.; Nedergaard, M. Signaling at the gliovascular interface. J. Neurosci. 2003, 23, 9254–9262. [Google Scholar] [CrossRef]
- Chew, S.S.; Johnson, C.S.; Green, C.R.; Danesh-Meyer, H.V. Role of connexin43 in central nervous system injury. Exp. Neurol. 2010, 225, 250–261. [Google Scholar] [CrossRef] [PubMed]
- Liang, Z.; Wang, X.; Hao, Y.; Qiu, L.; Lou, Y.; Zhang, Y.; Ma, D.; Feng, J. The Multifaceted Role of Astrocyte Connexin 43 in Ischemic Stroke Through Forming Hemichannels and Gap Junctions. Front. Neurol. 2020, 11, 703. [Google Scholar] [CrossRef]
- Cotrina, M.L.; Gao, Q.; Lin, J.H.; Nedergaard, M. Expression and function of astrocytic gap junctions in aging. Brain Res. 2001, 901, 55–61. [Google Scholar] [CrossRef]
- Solan, J.L.; Lampe, P.D. Spatio-temporal regulation of connexin43 phosphorylation and gap junction dynamics. Biochim. Biophys. Acta Biomembr. 2018, 1860, 83–90. [Google Scholar] [CrossRef]
- Solan, J.L.; Lampe, P.D. Connexin43 phosphorylation: Structural changes and biological effects. Biochem. J. 2009, 419, 261–272. [Google Scholar] [CrossRef] [Green Version]
- Zvalova, D.; Cordier, J.; Mesnil, M.; Junier, M.P.; Chneiweiss, H. p38/SAPK2 controls gap junction closure in astrocytes. Glia 2004, 46, 323–333. [Google Scholar] [CrossRef]
- Dunn, C.A.; Lampe, P.D. Injury-triggered Akt phosphorylation of Cx43: A ZO-1-driven molecular switch that regulates gap junction size. J. Cell Sci. 2014, 127, 455–464. [Google Scholar] [CrossRef] [PubMed] [Green Version]
- Musil, L.S.; Goodenough, D.A. Biochemical analysis of connexin43 intracellular transport, phosphorylation, and assembly into gap junctional plaques. J. Cell Biol. 1991, 115, 1357–1374. [Google Scholar] [CrossRef] [Green Version]
- Cooper, C.D.; Solan, J.L.; Dolejsi, M.K.; Lampe, P.D. Analysis of connexin phosphorylation sites. Methods 2000, 20, 196–204. [Google Scholar] [CrossRef] [PubMed]
- Giepmans, B.N. Gap junctions and connexin-interacting proteins. Cardiovasc. Res. 2004, 62, 233–245. [Google Scholar] [CrossRef] [PubMed] [Green Version]
- Warn-Cramer, B.J.; Lau, A.F. Regulation of gap junctions by tyrosine protein kinases. Biochim. Biophys. Acta 2004, 1662, 81–95. [Google Scholar] [CrossRef] [PubMed] [Green Version]
- Sorgen, P.L.; Trease, A.J.; Spagnol, G.; Delmar, M.; Nielsen, M.S. Protein–Protein Interactions with Connexin 43: Regulation and Function. Int. J. Mol. Sci. 2018, 19, 1428. [Google Scholar] [CrossRef] [Green Version]
- Beckmann, A.; Grissmer, A.; Wolf, S.; Recktenwald, J.; Meier, C. Oxygen-Glucose Deprivation in Mouse Astrocytes is Associated with Ultrastructural Changes in Connexin 43 Gap Junctions. Neuroscience 2019, 397, 67–79. [Google Scholar] [CrossRef] [PubMed]
- Peracchia, C. Gap junctions. Structural changes after uncoupling procedures. J. Cell Biol. 1977, 72, 628–641. [Google Scholar] [CrossRef] [Green Version]
- Beckmann, A.; Schubert, M.; Hainz, N.; Haase, A.; Martin, U.; Tschernig, T.; Meier, C. Ultrastructural demonstration of Cx43 gap junctions in induced pluripotent stem cells from human cord blood. Histochem. Cell Biol. 2016, 146, 529–537. [Google Scholar] [CrossRef] [PubMed]
- Pfaffl, M.W. A new mathematical model for relative quantification in real-time RT-PCR. Nucleic Acids Res. 2001, 29, e45. [Google Scholar] [CrossRef] [PubMed]
- Chu, M.; Novak, S.M.; Cover, C.; Wang, A.A.; Chinyere, I.R.; Juneman, E.B.; Zarnescu, D.C.; Wong, P.K.; Gregorio, C.C. Increased Cardiac Arrhythmogenesis Associated with Gap Junction Remodeling with Upregulation of RNA-Binding Protein FXR1. Circulation 2018, 137, 605–618. [Google Scholar] [CrossRef] [PubMed]
- Ye, J.; Coulouris, G.; Zaretskaya, I.; Cutcutache, I.; Rozen, S.; Madden, T.L. Primer-BLAST: A tool to design target-specific primers for polymerase chain reaction. BMC Bioinform. 2012, 13, 134. [Google Scholar] [CrossRef] [PubMed] [Green Version]
- Fischer, A.U.; Müller, N.I.C.; Deller, T.; Del Turco, D.; Fisch, J.O.; Griesemer, D.; Kattler, K.; Maraslioglu, A.; Roemer, V.; Xu-Friedman, M.A.; et al. GABA is a modulator, rather than a classical transmitter, in the medial nucleus of the trapezoid body-lateral superior olive sound localization circuit. J. Physiol. 2019, 597, 2269–2295. [Google Scholar] [CrossRef] [PubMed] [Green Version]
- el-Fouly, M.H.; Trosko, J.E.; Chang, C.C. Scrape-loading and dye transfer. A rapid and simple technique to study gap junctional intercellular communication. Exp. Cell Res. 1987, 168, 422–430. [Google Scholar] [CrossRef]
- Babica, P.; Sovadinová, I.; Upham, B.L. Scrape Loading/Dye Transfer Assay. In Gap Junction Protocols; Vinken, M., Johnstone, S.R., Eds.; Springer: New York, NY, USA, 2016; pp. 133–144. [Google Scholar] [CrossRef]
- Schneider, C.A.; Rasband, W.S.; Eliceiri, K.W. NIH Image to ImageJ: 25 years of image analysis. Nat. Methods 2012, 9, 671–675. [Google Scholar] [CrossRef] [PubMed]
- Begandt, D.; Bintig, W.; Oberheide, K.; Schlie, S.; Ngezahayo, A. Dipyridamole increases gap junction coupling in bovine GM-7373 aortic endothelial cells by a cAMP-protein kinase A dependent pathway. J. Bioenerg. Biomembr. 2010, 42, 79–84. [Google Scholar] [CrossRef]
- Rash, J.E.; Duffy, H.S.; Dudek, F.E.; Bilhartz, B.L.; Whalen, L.R.; Yasumura, T. Grid-mapped freeze-fracture analysis of gap junctions in gray and white matter of adult rat central nervous system, with evidence for a "panglial syncytium" that is not coupled to neurons. J. Comp. Neurol. 1997, 388, 265–292. [Google Scholar] [CrossRef]
- Rash, J.E.; Yasumura, T. Direct immunogold labeling of connexins and aquaporin-4 in freeze-fracture replicas of liver, brain, and spinal cord: Factors limiting quantitative analysis. Cell Tissue Res. 1999, 296, 307–321. [Google Scholar] [CrossRef]
- Fujimoto, K. SDS-digested freeze-fracture replica labeling electron microscopy to study the two-dimensional distribution of integral membrane proteins and phospholipids in biomembranes: Practical procedure, interpretation and application. Histochem. Cell Biol. 1997, 107, 87–96. [Google Scholar] [CrossRef]
- Rash, J.E.; Davidson, K.G.; Yasumura, T.; Furman, C.S. Freeze-fracture and immunogold analysis of aquaporin-4 (AQP4) square arrays, with models of AQP4 lattice assembly. Neuroscience 2004, 129, 915–934. [Google Scholar] [CrossRef] [PubMed] [Green Version]
- Rash, J.E.; Yasumura, T.; Hudson, C.S.; Agre, P.; Nielsen, S. Direct immunogold labeling of aquaporin-4 in square arrays of astrocyte and ependymocyte plasma membranes in rat brain and spinal cord. Proc. Natl. Acad. Sci. USA 1998, 95, 11981–11986. [Google Scholar] [CrossRef] [PubMed] [Green Version]
- Mao, Y. Nearest Neighbor Distances Calculation with ImageJ. Available online: https://icme.hpc.msstate.edu/mediawiki/index.php/Nearest_Neighbor_Distances_Calculation_with_ImageJ.html (accessed on 5 October 2021).
- Fujimoto, K. Freeze-fracture replica electron microscopy combined with SDS digestion for cytochemical labeling of integral membrane proteins. Application to the immunogold labeling of intercellular junctional complexes. J. Cell Sci. 1995, 108, 3443–3449. [Google Scholar] [CrossRef] [PubMed]
- Recktenwald, J.C. Hyperosmolare Sucrose-Lösung induziert Ultrastrukturelle Veränderungen in Astrozytären Gap Junctions. Ph.D. Thesis, Universität des Saarlandes, Homburg/Saar, Germany, 2020. [Google Scholar]
- Solan, J.L.; Lampe, P.D. Specific Cx43 phosphorylation events regulate gap junction turnover in vivo. FEBS Lett. 2014, 588, 1423–1429. [Google Scholar] [CrossRef] [PubMed] [Green Version]
- Rhett, J.M.; Jourdan, J.; Gourdie, R.G. Connexin 43 connexon to gap junction transition is regulated by zonula occludens-1. Mol. Biol. Cell 2011, 22, 1516–1528. [Google Scholar] [CrossRef] [PubMed]
- Rose, C.R.; Ransom, B.R. Gap junctions equalize intracellular Na+ concentration in astrocytes. Glia 1997, 20, 299–307. [Google Scholar] [CrossRef]
- Ma, B.; Buckalew, R.; Du, Y.; Kiyoshi, C.M.; Alford, C.C.; Wang, W.; McTigue, D.M.; Enyeart, J.J.; Terman, D.; Zhou, M. Gap junction coupling confers isopotentiality on astrocyte syncytium. Glia 2016, 64, 214–226. [Google Scholar] [CrossRef] [Green Version]
- Freitas-Andrade, M.; She, J.; Bechberger, J.; Naus, C.C.; Sin, W.C. Acute connexin43 temporal and spatial expression in response to ischemic stroke. J. Cell Commun. Signal. 2018, 12, 193–204. [Google Scholar] [CrossRef] [PubMed] [Green Version]
- Wasielewski, B.; Jensen, A.; Roth-Harer, A.; Dermietzel, R.; Meier, C. Neuroglial activation and Cx43 expression are reduced upon transplantation of human umbilical cord blood cells after perinatal hypoxic-ischemic injury. Brain Res. 2012, 1487, 39–53. [Google Scholar] [CrossRef] [PubMed]
- Chu, H.; Huang, C.; Gao, Z.; Dong, J.; Tang, Y.; Dong, Q. Reduction of Ischemic Brain Edema by Combined use of Paeoniflorin and Astragaloside IV via Down-Regulating Connexin 43. Phytother. Res. PTR 2017, 31, 1410–1418. [Google Scholar] [CrossRef] [PubMed]
- Wu, Z.; Xu, H.; He, Y.; Yang, G.; Liao, C.; Gao, W.; Liang, M.; He, X. Antisense oligodeoxynucleotides targeting connexin43 reduce cerebral astrocytosis and edema in a rat model of traumatic brain injury. Neurol. Res. 2013, 35, 255–262. [Google Scholar] [CrossRef]
- Aasen, T.; Mesnil, M.; Naus, C.C.; Lampe, P.D.; Laird, D.W. Gap junctions and cancer: Communicating for 50 years. Nat. Rev. Cancer 2016, 16, 775–788. [Google Scholar] [CrossRef] [PubMed] [Green Version]
- Batra, N.; Burra, S.; Siller-Jackson, A.J.; Gu, S.; Xia, X.; Weber, G.F.; DeSimone, D.; Bonewald, L.F.; Lafer, E.M.; Sprague, E.; et al. Mechanical stress-activated integrin α5β1 induces opening of connexin 43 hemichannels. Proc. Natl. Acad. Sci. USA 2012, 109, 3359–3364. [Google Scholar] [CrossRef] [PubMed] [Green Version]
- Epifantseva, I.; Shaw, R.M. Intracellular trafficking pathways of Cx43 gap junction channels. Biochim. Biophys. Acta Biomembr. 2018, 1860, 40–47. [Google Scholar] [CrossRef] [PubMed]
- Leithe, E.; Mesnil, M.; Aasen, T. The connexin 43 C-terminus: A tail of many tales. Biochim. Biophys. Acta Biomembr. 2018, 1860, 48–64. [Google Scholar] [CrossRef]
- Nagy, J.I.; Rash, J.E. Connexins and gap junctions of astrocytes and oligodendrocytes in the CNS. Brain Res. Rev. 2000, 32, 29–44. [Google Scholar] [CrossRef]
- Peracchia, C.; Peracchia, L.L. Gap junction dynamics: Reversible effects of divalent cations. J. Cell Biol. 1980, 87, 708–718. [Google Scholar] [CrossRef]
- Jiang, J.; Hoagland, D.; Palatinus, J.A.; He, H.; Iyyathurai, J.; Jourdan, L.J.; Bultynck, G.; Wang, Z.; Zhang, Z.; Schey, K.; et al. Interaction of α Carboxyl Terminus 1 Peptide with the Connexin 43 Carboxyl Terminus Preserves Left Ventricular Function after Ischemia-Reperfusion Injury. J. Am. Heart Assoc. 2019, 8, e012385. [Google Scholar] [CrossRef] [PubMed]
- Richards, T.S.; Dunn, C.A.; Carter, W.G.; Usui, M.L.; Olerud, J.E.; Lampe, P.D. Protein kinase C spatially and temporally regulates gap junctional communication during human wound repair via phosphorylation of connexin43 on serine368. J. Cell Biol. 2004, 167, 555–562. [Google Scholar] [CrossRef] [PubMed] [Green Version]
- Fiori, M.; Reuss, L.; Cuello, L.; Altenberg, G. Functional analysis and regulation of purified connexin hemichannels. Front. Physiol. 2014, 5, 71. [Google Scholar] [CrossRef] [Green Version]
- Muto, T.; Tien, T.; Kim, D.; Sarthy, V.P.; Roy, S. High glucose alters Cx43 expression and gap junction intercellular communication in retinal Muller cells: Promotes Muller cell and pericyte apoptosis. Investig. Ophthalmol. Vis. Sci. 2014, 55, 4327–4337. [Google Scholar] [CrossRef] [PubMed]
- Bellot-Saez, A.; Stevenson, R.; Kékesi, O.; Samokhina, E.; Ben-Abu, Y.; Morley, J.W.; Buskila, Y. Neuromodulation of Astrocytic K+ Clearance. Int. J. Mol. Sci. 2021, 22, 2520. [Google Scholar] [CrossRef] [PubMed]
- Stephan, J.; Eitelmann, S.; Zhou, M. Approaches to study gap junctional coupling. Front. Cell. Neurosci. 2021, 15, 640406. [Google Scholar] [CrossRef] [PubMed]
- Ho, S.N. Intracellular water homeostasis and the mammalian cellular osmotic stress response. J. Cell. Physiol. 2006, 206, 9–15. [Google Scholar] [CrossRef]
- Itoh, M.; Nagafuchi, A.; Yenemura, S.; Kitani-Yasuda, T.; Tsukita, S.; Tsukita, S.S.N. The 220-kD protein colocalizing with cadherins in non-epithelial cells is identical to ZO-I, a tight juction associated protein in epithelial cells: cDNA cloning and immunoelectron microskopy. J. Cell Biol. 1993, 121, 491–502. [Google Scholar] [CrossRef] [PubMed] [Green Version]
- Jesaitis, L.A.; Goodenough, D.A. Molecular characterization and Tissue Distribution of ZO-2, a tight junction protein homologous to ZO-1 and the drosophila Discs-large tumor suppressor protein. J. Cell Biol. 1994, 124, 849–961. [Google Scholar] [CrossRef] [PubMed] [Green Version]
- Thevenin, A.F.; Margraf, R.A.; Fisher, C.G.; Kells-Andrews, R.M.; Falk, M.M. Phosphorylation regulates connexin43/ZO-1 binding and release, an important step in gap junction turnover. Mol. Biol. Cell 2017, 28, 3595–3608. [Google Scholar] [CrossRef] [PubMed] [Green Version]


| Product | Sequence (5′–3′) | Product Size [bp] | Reference |
|---|---|---|---|
| 18S RNA | fwd AAACGGCTACCACATCCAAG | 155 | [21] |
| rev CCTCCAATGGATCCTCGTTA | |||
| Cx43 | fwd CTCCAAGGAGTTCCACCACT | 123 | [23] |
| rev TGGAGTAGGCTTGGACCTTG | |||
| ZO–1 | fwd GAGATGTTTATGCGGACGGT | 146 | [24] |
| rev AGCTGTTTCCTCCATTGCTG |
| Name | Species | Manufacturer | Order Number | Dilutions | ||
|---|---|---|---|---|---|---|
| ICC | IB | FRIL | ||||
| CD68 | rat | Abcam | ab53444 | 1:1000 | - | - |
| Cx43 | rabbit | Abcam | ab11370 | 1:100 | 1:6000 | 1:75 |
| Cx43 | mouse | Thermo Fisher Scientific | 13–8300 | - | - | 1:50 |
| GAPDH | mouse | Merck | MAB374 | - | 1:2000 | - |
| GFAP | mouse | Merck | MAB360 | 1:100 | - | - |
| panCx43 | rabbit | Sigma | C6219 | - | 1:8000 | - |
| P–Cx43S368 | rabbit | LS Bio (Seattle, WA, USA) | LS–C380672 | - | - | 1:100 |
| P–Cx43S368 | rabbit | Thermo Fisher Scientific | 48-3000 | - | 1:500 | 1:100 |
| ZO–1 | goat | Abcam | ab190085 | - | 1:1000 | - |
| ZO–1 | mouse | Thermo Fisher Scientific | 33–99100 | 1:100 | - | - |
Publisher’s Note: MDPI stays neutral with regard to jurisdictional claims in published maps and institutional affiliations. |
© 2021 by the authors. Licensee MDPI, Basel, Switzerland. This article is an open access article distributed under the terms and conditions of the Creative Commons Attribution (CC BY) license (https://creativecommons.org/licenses/by/4.0/).
Share and Cite
Beckmann, A.; Recktenwald, J.; Ferdinand, A.; Grißmer, A.; Meier, C. First Responders to Hyperosmotic Stress in Murine Astrocytes: Connexin 43 Gap Junctions Are Subject to an Immediate Ultrastructural Reorganization. Biology 2021, 10, 1307. https://doi.org/10.3390/biology10121307
Beckmann A, Recktenwald J, Ferdinand A, Grißmer A, Meier C. First Responders to Hyperosmotic Stress in Murine Astrocytes: Connexin 43 Gap Junctions Are Subject to an Immediate Ultrastructural Reorganization. Biology. 2021; 10(12):1307. https://doi.org/10.3390/biology10121307
Chicago/Turabian StyleBeckmann, Anja, Johanna Recktenwald, Alice Ferdinand, Alexander Grißmer, and Carola Meier. 2021. "First Responders to Hyperosmotic Stress in Murine Astrocytes: Connexin 43 Gap Junctions Are Subject to an Immediate Ultrastructural Reorganization" Biology 10, no. 12: 1307. https://doi.org/10.3390/biology10121307