Article

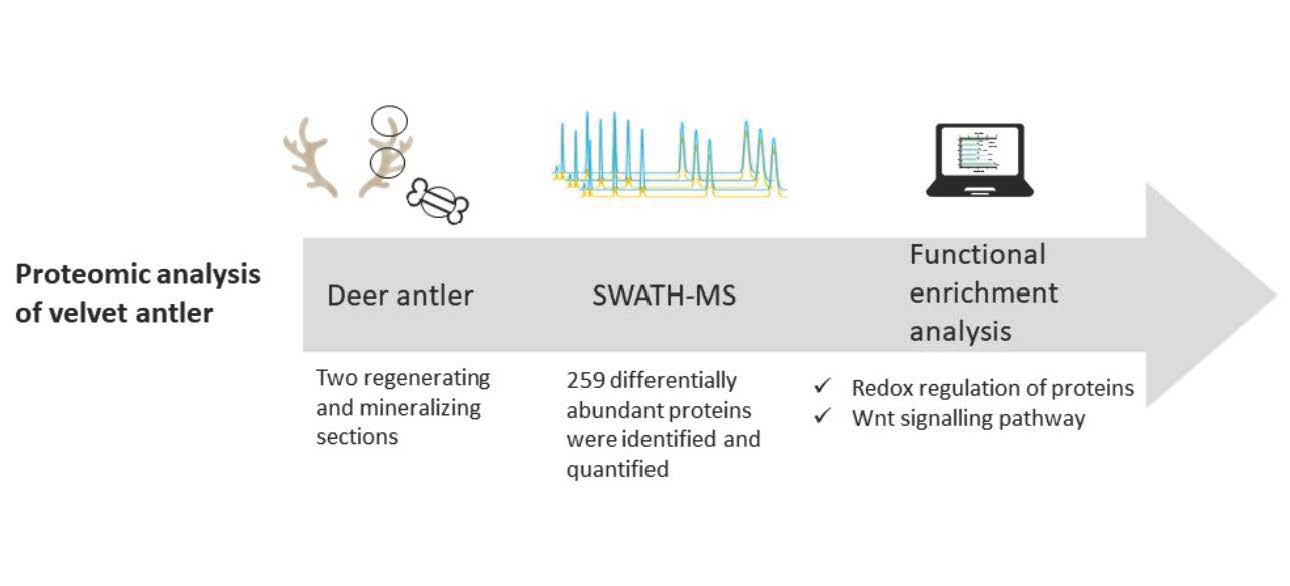
SWATH-MS Quantitative Proteomic Analysis of Deer Antler from Two Regenerating and Mineralizing Sections

by
María López-Pedrouso
1,
José M. Lorenzo
2,3,
Tomás Landete-Castillejos
4,
Louis Chonco
4,
Francisco Javier Pérez-Barbería
4,
Andrés García
4,
María-Pilar López-Garrido
5 and
Daniel Franco
2,*
1
Department of Zoology, Genetics and Physical Anthropology, University of Santiago de Compostela, 15872 Santiago de Compostela, Spain
2
Centro Tecnológico de la Carne de Galicia, Rúa Galicia Nº 4, Parque Tecnológico de Galicia, San Cibrao das Viñas, 32900 Ourense, Spain
3
Área de Tecnología de los Alimentos, Facultad de Ciencias de Ourense, Universidad de Vigo, 32004 Ourense, Spain
4
Instituto de Investigación en Recursos Cinegéticos (IREC) y Sec. Recursos Cinegéticos IDR, Universidad de Castilla-La Mancha (UCLM), 02071 Albacete, Spain
5
Laboratorio de Genética Médica, Instituto de Investigación en Discapacidades Neurológicas (IDINE), Facultad de Medicina, Universidad de Castilla-La Mancha (UCLM), 02071 Albacete, Spain
*
Author to whom correspondence should be addressed.
Biology 2021, 10(7), 679; https://doi.org/10.3390/biology10070679
Submission received: 20 June 2021 / Revised: 13 July 2021 / Accepted: 14 July 2021 / Published: 17 July 2021

Abstract

:

Simple Summary

Deer antler is a unique and astonishing case of annual regeneration in mammalians. Several studies have pointed out the potential for use of velvet antler extract as a nutraceutical supplement, among others, because of its anti-cancer activity. The study of antler regeneration and growth allow us to identify the main proteins and regulatory pathways involved in cell differentiation and regeneration. For this purpose, two sections of antlers (tips and middle sections) using ribs as controls were analyzed from a proteomic point of view. A total of 259 proteins mainly associated with antioxidant mechanisms and Wnt signalling pathways could be responsible for deer antler regeneration and these proteins may be linked to human health benefits. Further studies should be focused on discovering which proteins from velvet antler extracts are associated with these beneficial effects.

Abstract

Antlers are the only organ in the mammalian body that regenerates each year. They can reach growth rates of 1–3 cm/day in length and create more than 20 cm2/day of skin in the antler tips (their growth centers). Previous proteomic studies regarding antlers have focused on antler growth centers (tips) compared to the standard bone to detect the proteins involved in tissue growth. However, proteins of cell differentiation and regeneration will be more accurately detected considering more growing tissues. Thus, we set out to compare proteins expressed in antler tips (the highest metabolism rate and cell differentiation) vs. middle sections (moderate cell growth involving bone calcification), using ribs as controls. Samples were obtained in mid-June with antlers’ phenology corresponding to the middle of their growth period. Quantitative proteomic analysis identified 259 differentially abundant proteins mainly associated with antioxidant metabolic mechanisms, protein formation and Wnt signalling pathway, meanwhile, the mid antler section was linked to blood proteins. The high metabolic rate and subsequent risk of oxidative stress also seem to have resulted in strong antioxidant mechanisms. These results suggest that redox regulation of proteins is a key factor in the model of deer antler regeneration.

Graphical Abstract

1. Introduction

Deer antlers are bony cranial appendages which are renewed each year. In the case of red deer, the antlers grow in about 3.5 months in red deer [1]. They constitute the only case of full regeneration in mammalian organisms, and they show an enormous growth rate in the tips, growing up to 1–3 cm/day in length, and creating more than 20 cm2/day of skin [2,3]. Indeed, a recent study has shown that antlers have evolved a speed of growth faster than cancer based on the high expression of proto-oncogenes [4]. As a result, the study postulated that several tumor genes (e.g., TP53) could be suppressed to control the high risk of developing cancer. In this sense, several studies have found in vitro and in vivo anti-cancer effects of deer antler velvet extract in human tumors such as glioblastoma [5], prostate [6,7], colon [8] and breast [9]. Velvet antler has been used as traditional medicine for over 2000 years and it is recognized in the pharmacopoeias of China, Korea and Japan. Furthermore, it has been claimed as a nutraceutical supplement in New Zealand, the USA and Canada [10]. In this sense, it has been reported that polypeptides and proteins are the main bioactive components of the deer antler velvet [11], suggesting that the anti-cancer activity of velvet antler extract is mainly due to their proteins or peptides. Furthermore, the peptide extracts from the antler growth center have protective effects against oxidative stress. Thus, some studies found that differentially expressed proteins are involved in the regulation of several pathways such as oxidative phosphorylation, ribosome or extracellular matrix interaction [12], whereas others found a tetrapeptide (YNVK) that exhibited strong antioxidant activity [13].
Recently, proteomic analysis has been used to examine which proteins may be responsible for the fast growth and regenerative capacity of velvet antler [11,12,14,15]. The regenerative capacity of the antlers comes from the pedicle periosteum (PP) and the resident cells. Antler regeneration involves a process from dormant to potentiated active state due to stem cells [14]. Additionally, plasma membrane proteins are of key importance to different cellular processes. The proteome of plasma membrane proteins of stem cells in the PP compared to control cells from the skull (facial periosteal cells) showed differences in external stimuli, signal transduction, membrane transport, regulation of tissue regeneration and protein modification processes [16]. Similarly, a quantitative proteomic analysis of antlerogenic periosteal cells compared with the facial periosteal cells from yearling deer was performed. Overexpressed extracellular proteins in antlerogenic periosteal cells were found and these proteins are involved in cell proliferation, angiogenesis and neurogenesis. The comparison of extracellular and intracellular proteomes suggested secreted proteins that might regulate antler formation and regeneration, such as SFRP4 and LUM [11]. Beyond this, two different antler systems harvested from red deer and sika deer were analyzed. More abundant proteins were found in sika deer than red deer and these proteins are involved in oxidative phosphorylation, ribosome, extracellular matrix interaction and the PI3K-Akt pathway. For a better understanding, several antler sections with different growth rates should be compared. Thus, the proteomes in several sections of the antler assessed stem cells under different stages of activation [17]: dormant pedicle periosteum at the base of the antler, the antler growth center in the tip and mid sections of the antler beam periosteum. The authors found the greatest number of unique proteins (87) in the growth center of antler tips which could be associated with the activation of antler stem cells.
Despite being a fast-growing tissue, studies about velvet antlers are rather scarce. Most proteomic and transcriptomic studies have examined the growth center (tip) compared with the antler base or even the bones of the skull. These studies compare two confounding factors: fast growth in the tip, but also a differentiating center, with antler base or skull bone which is not very active. This study aims to compare the proteome of two sections of the antler with different metabolism rates, using deer ribs as controls: the antler tip (growth center), which has a highest metabolism and differentiating tissue, and the middle section of the antler, which also has a high metabolism, but due to its intensely mineralizing section and differentiated bone.

2. Materials and Methods

2.1. Sample Collection of the Deer Antler

In this study, we examined deer antlers from wild individuals in a stage of growth phenotypically corresponding to the mid-growth period. Within each antler, we examined the proteome of the antler tip (growth center) as compared with that of the middle sections (corresponding to intensely mineralizing antler bone). As a control, we examined the ribs of the same individuals.
We used samples from six adult males, selected from a larger group that were hunted to reduce population density (for game management purposes) in a deer private game state in Ciudad Real (Spain) according to existing legal regulations. The slaughter of the hunted animals was regulated by the Regional Hunting Law of Castilla la Mancha [18]. Of the animals hunted, the six selected had antlers in the phenotypical aspect of being in the middle of their growth period (approximately 60 days of growth), based on antler velvet grading of Deer Industry New Zealand (https://www.pggwrightson.co.nz/-/media/Corporate/Documents/Velvet/Velvet-DINZ-Grading-Guidelines.pdf?la=en, accessed on 15 July 2021). Immediately after death, antlers were cut off using a mechanical saw and stored frozen at −20 °C. No blood or skin were removed because, depending on the protocol to extract the blood, different amounts could remain, increasing the variability of results. The antlers were sampled in two sections: (1) the tip (considered as the 2.5 cm top section of the main beam) and a section of 5 cm in the middle of the antler. The same process was conducted for middle sections of floating ribs of 5 cm. Each sample was lyophilized, homogenized by trituration in an ultracentrifuge mill (Retsch ZM-100) and the triturate was lyophilized again and stored in plastic containers at −20 °C for later analysis.

2.2. Protein Extraction and Tryptic Digestion

The deer antler powder (50 mg) was dissolved in RIPA buffer (200 mmol/L Tris/HCl-pH 7.4, 130 mmol/L NaCl, 10%-v/v glycerol, 0.1%-v/v SDS, 1%-v/v Triton X-100, 10 mmol/L MgCl2) and anti-proteases and anti-phosphatases (Sigma-Aldrich, St. Louis, MO, USA). A homogenization was prepared using TissueLyser II (Qiagen, Tokyo, Japan) and then centrifuged at 14,000× g (4 °C, 20 min). An RC-DC kit (Biorad Lab., Hercules, CA, USA) was employed to assess the protein concentration according to its instructions. A total amount of 100 μg was loaded on 10% SDS-PAGE to concentrate the proteins in a gel single band. Thus, the band was excised into pieces and washed with Milli-Q water, followed by 50 mM ammonium bicarbonate in 50% methanol. The dehydration of gel material was carried out with a vacuum centrifuge. Afterwards, the protein sample was reduced by 10 mM DTT and 50 mM ammonium bicarbonate solution at 60 °C for 30 min followed by the alkylation by 55 mM iodoacetamide and 50 mM ammonium bicarbonate solution at room temperature for 30 min in darkness. Finally, digestion by 20 ng/μL trypsin (Promega, Madison, WI, USA) in 20 mM ammonium bicarbonate incubating at 37 °C was used on the final solution. The resulting peptides were dissolved in 0.1% formic acid and stored at −20 °C for later analysis.

2.3. Protein Identification and Reference Spectral Library Building

A composite sample for the two groups was prepared to mix 4 μg of protein from each sample. The resulting solution was then assessed by analysis by shotgun data-dependent acquisition (DDA) employing micro-LC system Ekspert nLC425 (Eksigen, Dublin, CA, USA) using a YCM-TriartC18 column (150 mm × 0.3 mm i.d., 12 nm pore size, 3 μm particle size) (YMC CO., Kyoto, Japan). The solvents were: solvent A (water, 0.1% formic acid) and solvent B (ACN, 0.1% formic acid). The gradient consisted of 5–95% B for 30 min, 5 min at 90% B and finally other 5 min at 5% B for column equilibration, for a total time of 40 min using a flow rate of 5 μL/min. The detection was carried out by a hybrid quadrupole-TOF mass spectrometer, model Triple TOF 6600 (SCIEX, Framingham, MA, USA) operating with a data-dependent acquisition system in positive ion mode. The working parameters were 250 ms survey scan from 400 to 1250 m/z followed by MS/MS experiments from 100 to 1500 m/z (25 ms acquisition time) for a total cycle time of 2.8 s. The fragmented precursors were added to the dynamic exclusion list for 15 s, any ion with charge +1 was excluded from the MS/MS analysis. The comparison of mass spectral data and databases was performed by ProteinPilot software v.5.0.1. (SCIEX, Framingham, MA, USA). The used database was the Uniprot Swiss-Prot database for Cervus elaphus hippelaphus (European red deer) using a false discovery rate (FDR) below 0.01 for peptides and proteins and a confidence score above 99%.

2.4. Protein Quantification by SWATH-MS

SWATH-MS (sequential window acquisition of all theoretical mass spectra) acquisition was performed using the data-independent acquisition (DIA) method. Six samples of both groups of deer antler (tip and middle section) and six from ribs with two technical replicates were assessed. An amount of 4 μg of protein was analyzed by LC under the above conditions. Regarding the MS/MS analysis, an acquisition time of 50 ms in a total cycle time of 6.3 s was performed. A cycle consisted of the acquisition of 65 scans per SWATH window of variable width (1 m/z overlap) covering the 400–1250 m/z mass range. The spectral alignment and targeted data extraction were performed by PeakView v.2.2. (SCIEX, Framingham, MA, USA) matching the reference spectral library. The DIA files considered were an extraction window of 5 min (a width of 30 ppm) using the settings: ten peptides/protein, seven fragments/peptide, excluded shared and modified peptides and FDR below 0.01. The final quantification was measured by adding the quantitative outputs from the peaks for fragments.
Two comparisons were performed to identify differentially abundant proteins (DAPs) using paired Student’s t-test and considering only p-values above 0.05 and fold change of 1.5 as the cut-off: (1) A comparison between the tip and middle section of deer antler (fastest-growing section vs. mineralizing one) and; (2) middle section of the antler vs. ribs (fast mineralization vs. standard bone metabolism). To evaluate the relationship among the three locations, a factorial analysis of the common DAP (p < 0.05) in the three tissues was carried out. Principal component analysis (PCA) was used as the method for extraction, and it was performed on the correlation matrix. A varimax rotation was carried out to minimize the number of variables that influence each factor, and thus, to facilitate the interpretation and discussion of the results. A KMO value of 0.767 was obtained. XLSTAT 2018.5.52745 software (Addinsoft, NY, USA) was used.
Gene Ontology (GO) and KEGG (Kyoto Encyclopaedia of Genes and Genomes) analyses of differentially abundant proteins were performed using the enrichment analysis tool, FunRich (Functional Enrichment analysis tool, http://www.funrich.org, accessed on 15 May 2021) [19].

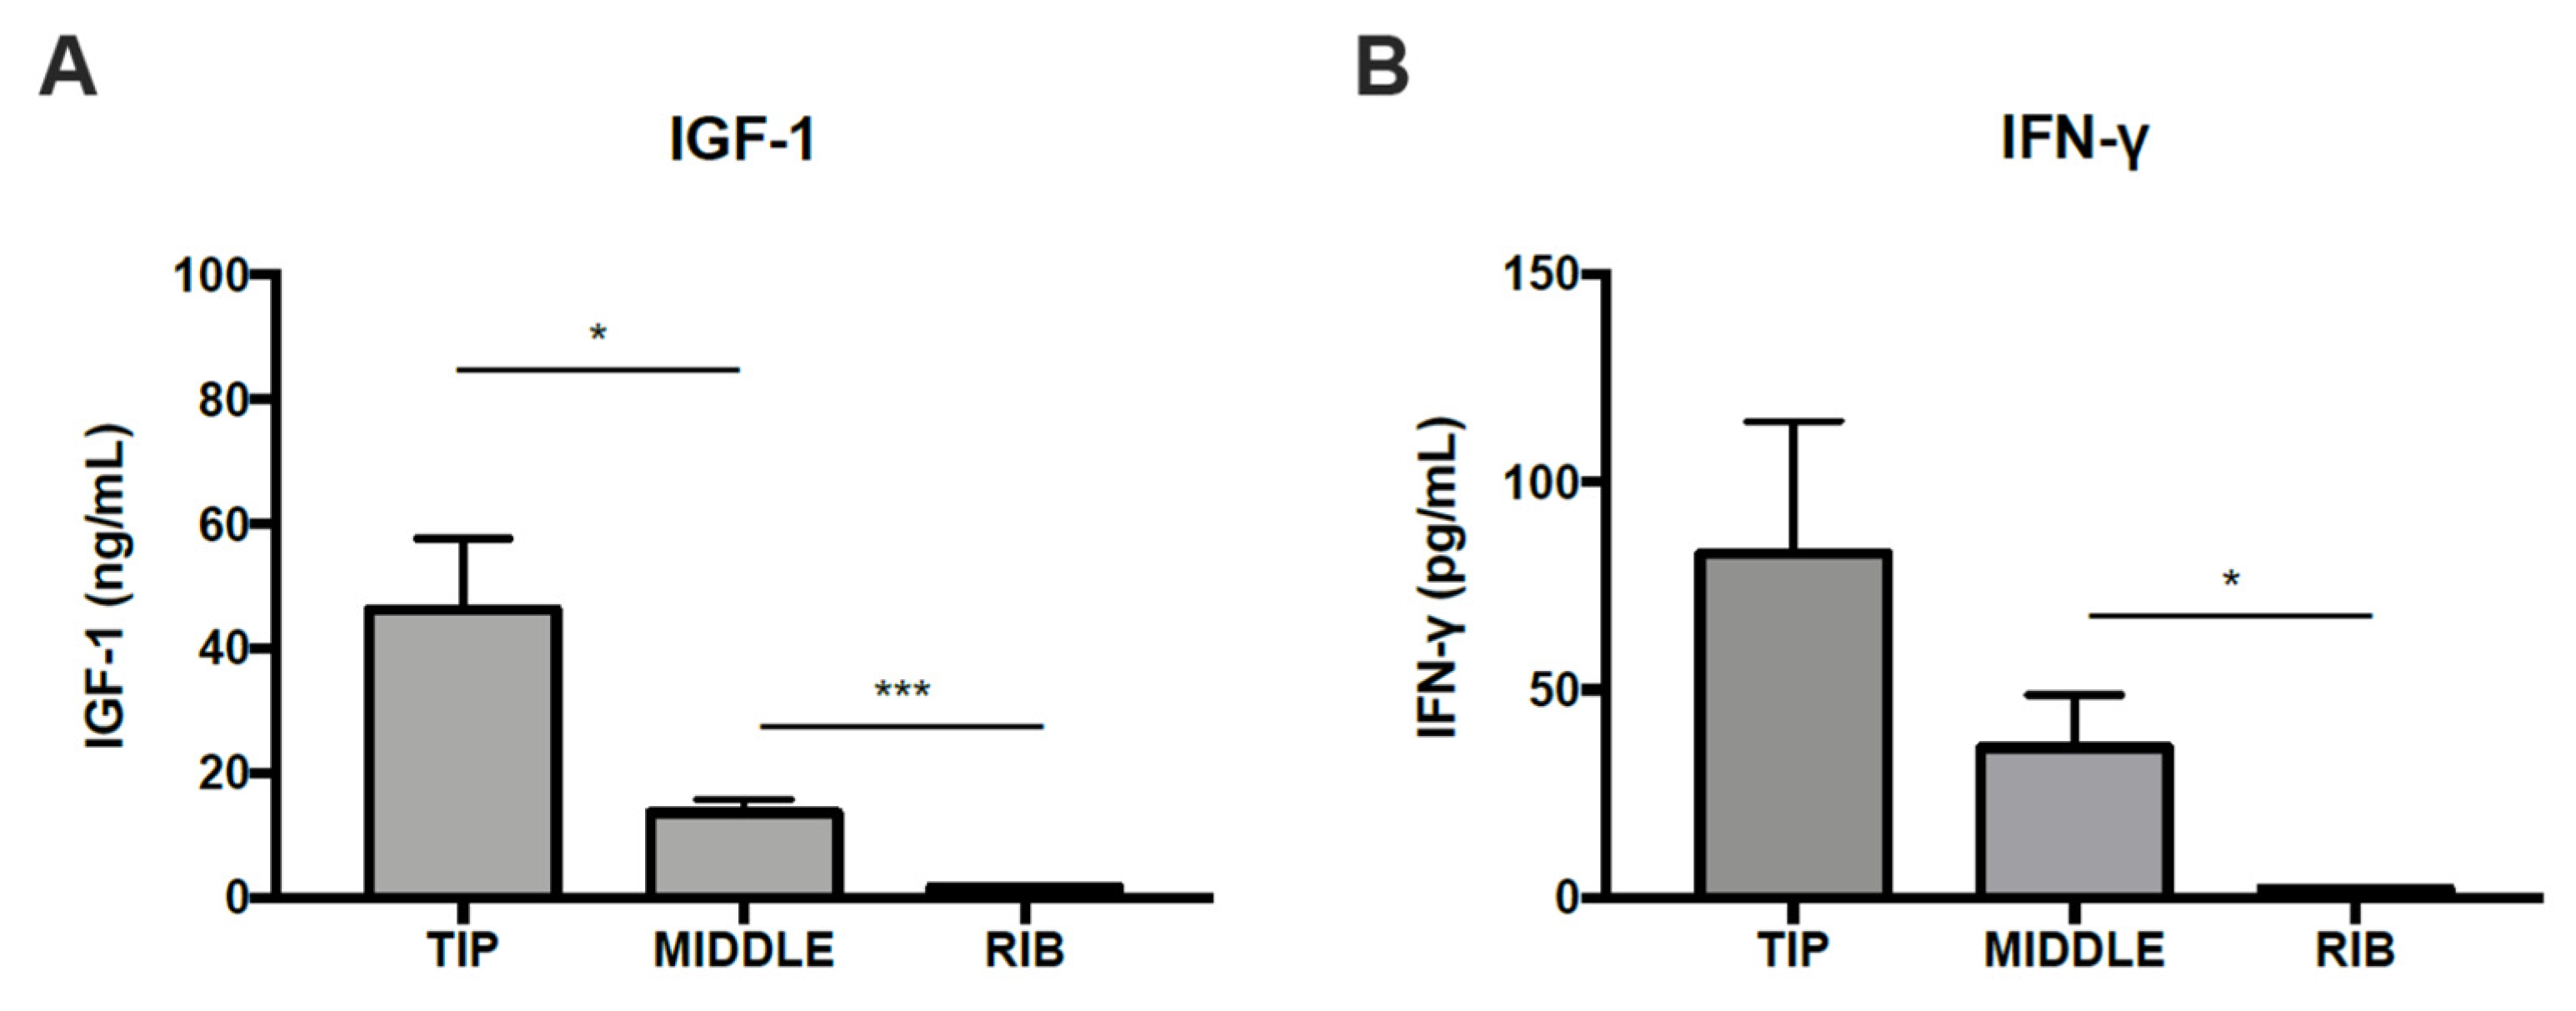
2.5. ELISA Procedure for IGF-1 and IFN-γ Determination

Deer antler velvet powder (1 g) was weighed and soaked with 10 mL distilled water. The liquid mixture was incubated at 4 °C overnight with continuous stirring and then centrifuged at 2700× g for 20 min. The supernatant was freeze-dried and dissolved into 2 mL phosphate buffered saline (PBS, Lonza BioWhittaker). Samples were frozen at −80 °C and to carry out any further assay, samples were thawed, passed through a 0.22 μm filter (PES membrane, MERCKMILLIPORE, Molsheim, France) and centrifuged at 5600× g for 3 min. According to the manufacturer’s recommendations, deer IGF-1 ELISA kit (Catalog Number. CSBE12644, CUSABIO) and deer IFN-γ (Catalog No: EK11988, SAB) were performed.

3. Results

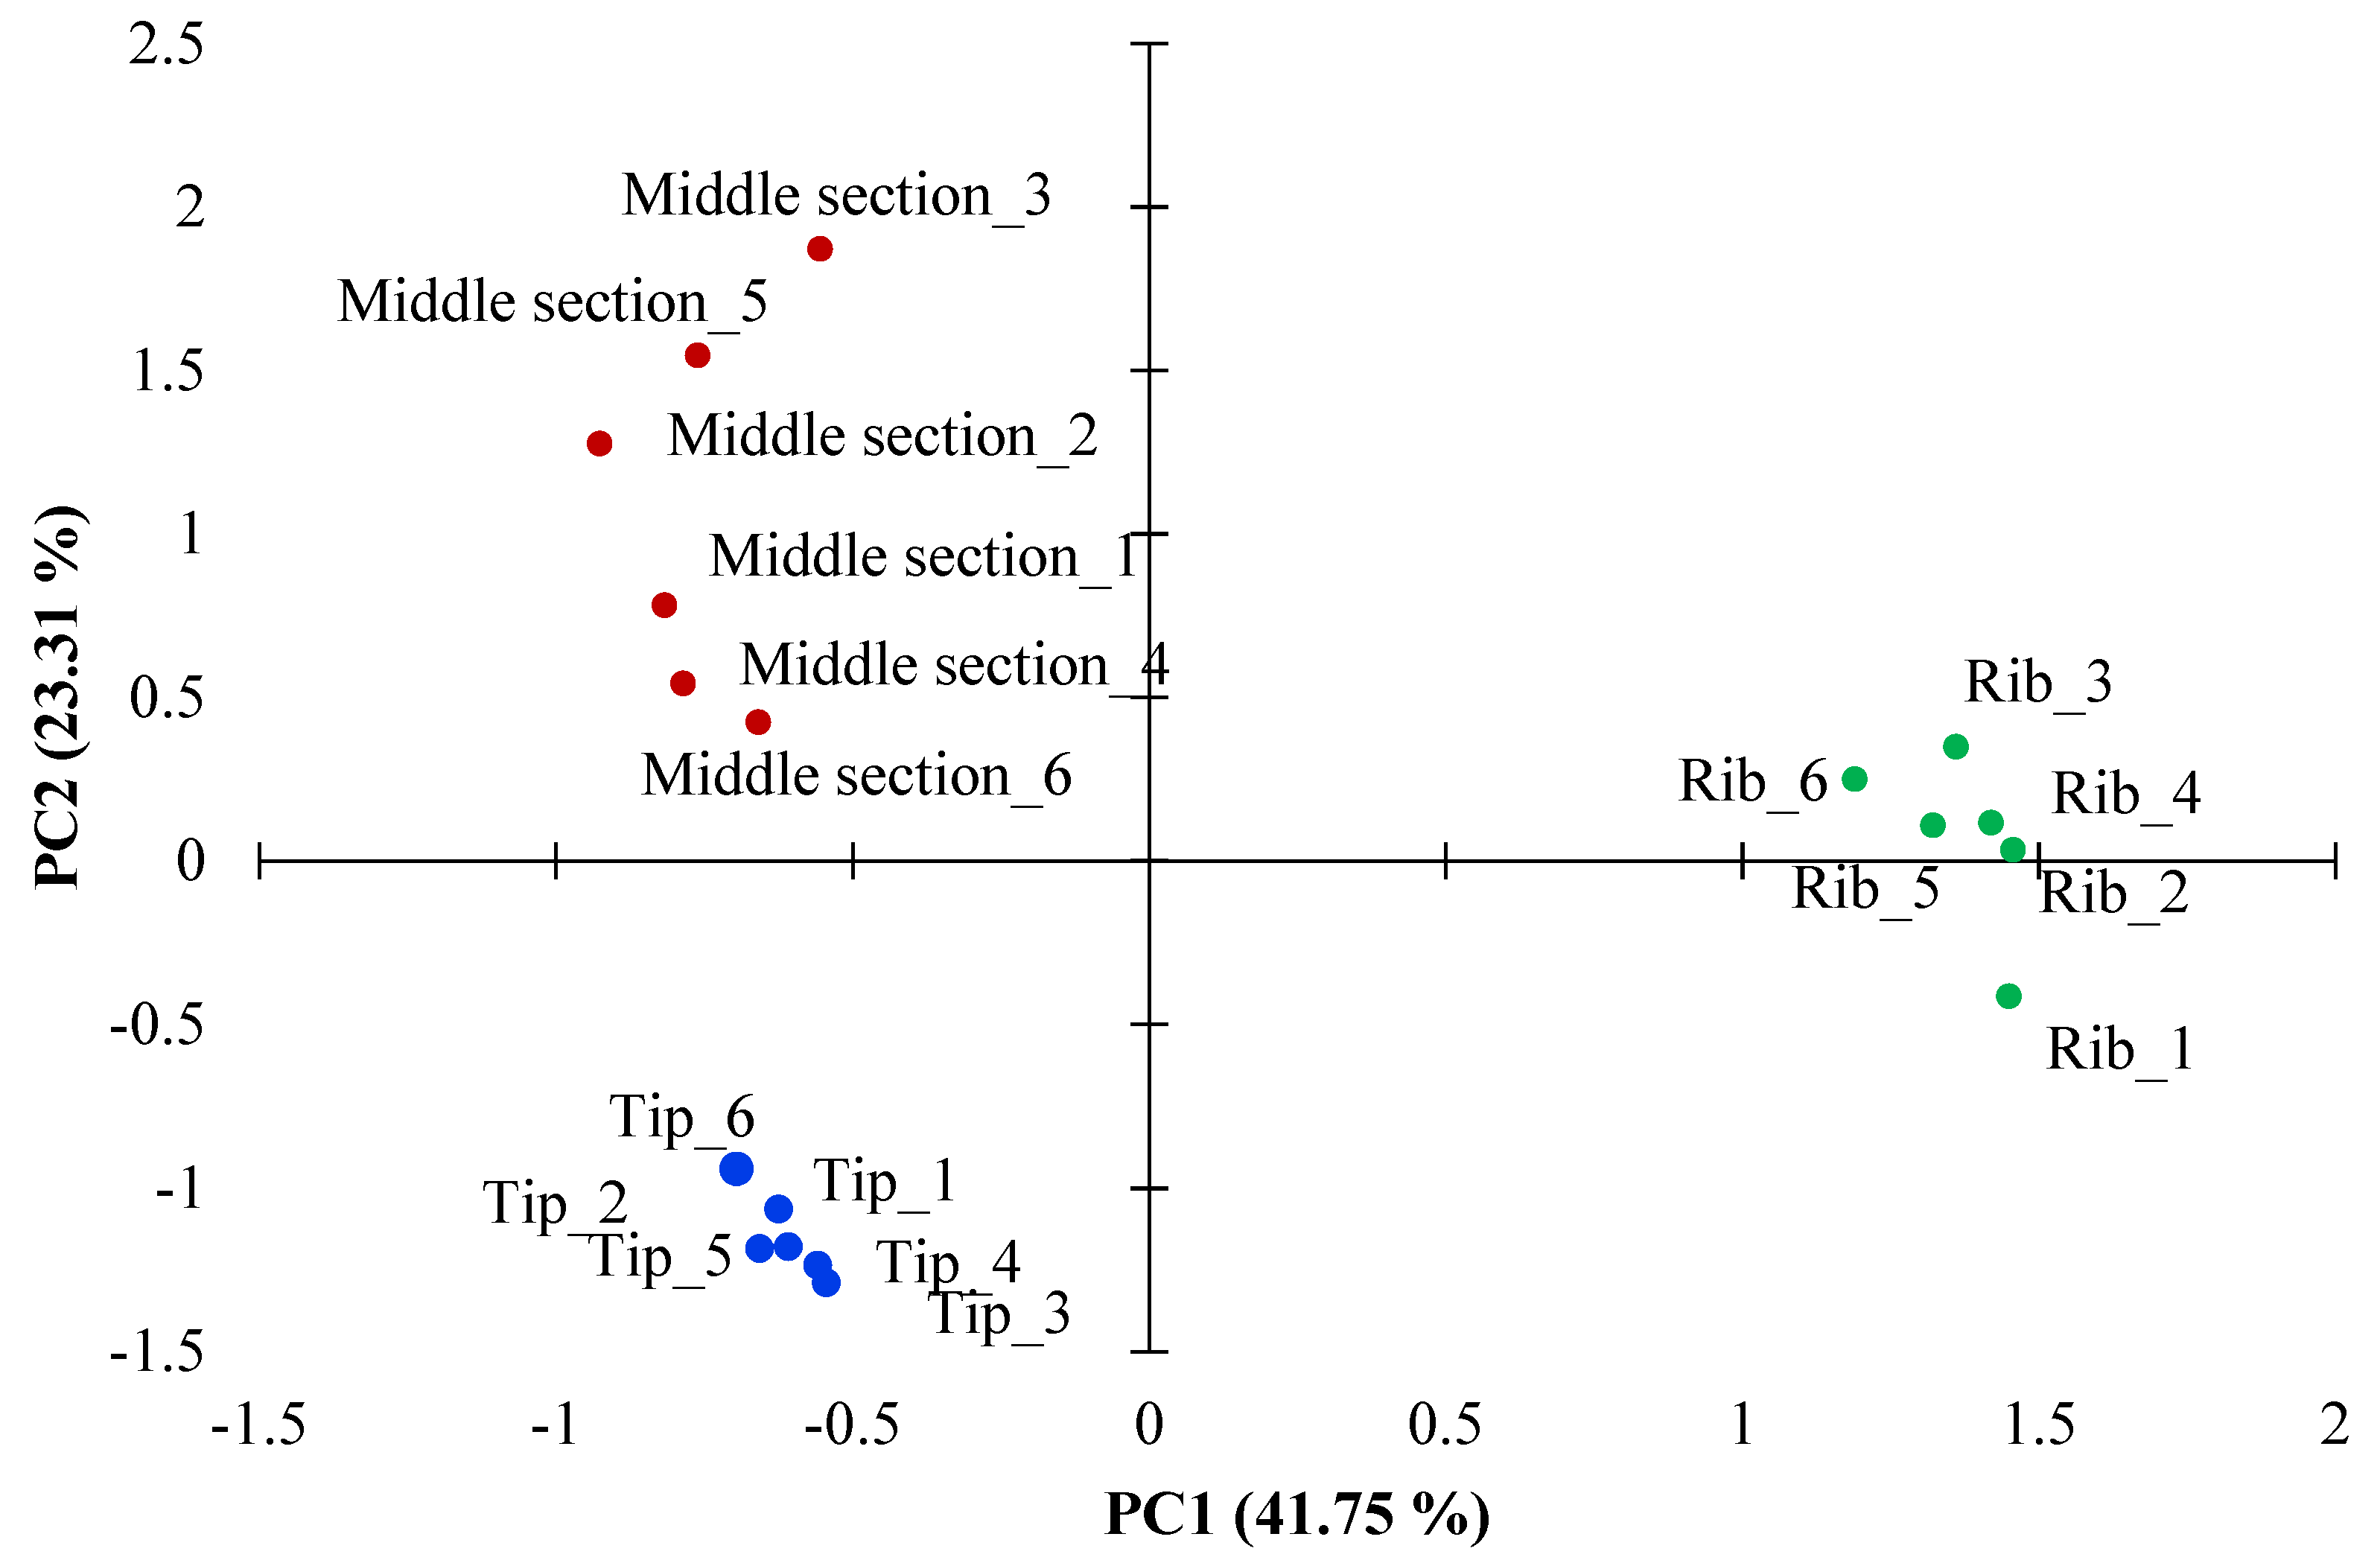
3.1. Comparisons of Deer Proteomes Tip vs. Middle Antler, and Middle Antler vs. Ribs

In this study, 259 proteins were identified and quantified by SWATH-MS from two comparisons: tip and middle sections of deer antler velvet (Table 1) and, the middle antler section and the ribs (Table 2). The antler proteins from the tip and middle section and those from ribs were analyzed by PCA. According to PCA results, there were two components explaining 65.06% of the total variance. The two principal components can distinguish between the two sections of deer antler and the ribs. The first principal component (PC1) explained the higher percentage of variance (41.75%). The second principal component (PC2) accounted for 23.31% of the total variability indicated differences between middle section and tip of antler samples. The PCA figure shows that tip samples are more clustered, showing greater homogeneity than those that belong to the middle section resulting in more dispersal from the center of the cluster (Figure 1).

3.1.1. Comparison Tip vs. Middle Antler

From the total proteins identified and quantified as DAP by SWATH-MS, those that exhibit a 1.5-fold between the two groups and a Student’s t-test with 5% statistical significance (p < 0.05) were considered as differentially abundant. In the comparison within the antler between the growth center (tip) and mineralizing section (middle), 34 proteins were overabundant in the tip (color blue) with 17 unidentified proteins (data not shown) and 44 proteins were overabundant in the middle section (color red) with 6 unidentified deer antler proteins (Table 1). The high number of unidentified proteins in both antler sections demonstrates the lack of knowledge of the proteomic profile of this tissue, especially in the tip section where 32.7% of the total DAPs were unidentified. In a previous study by our group on deer meat (longisimus thoracis et lumborum), the number of unidentified proteins, employing the same database, was lower [20], suggesting that the major constraint could be in the tissue of deer antler. This fact indicates that antler is not studied enough in terms of protein profile. In the middle section, the most abundant proteins (>105) were hemoglobin subunit alpha, adult beta-globin 1, adult beta-globin 2, apolipoprotein A-II, alpha-1B-glycoprotein, serotransferrin, lactotransferrin and several unidentified proteins.

3.1.2. Comparison Middle Section of Antler vs. Rib

In the comparison between the mineralizing section of the antler (middle section) and the ribs, 30 proteins were overabundant in the middle section (color red) with 6 unidentified proteins (data not shown), and 58 proteins were overabundant in the ribs (color green) with 26 unidentified deer antler proteins (data not shown) (Table 2). Among the majority of overexpressed proteins in the rib, the most abundant was the collagen alpha-2(I) chain (CO1Aa) with a fold change of 49, corresponding to gene COL1A2.
There is a set of proteins related to oxidative stress (chaperones, heat shock proteins and other types) overexpressed in the ribs compared to the mineralizing section of the antler. CAH3, glutathione S-transferase Mu 1, F10A1, protein disulfide-isomerase A4, SODC, glutathione S-transferase P, peroxiredoxin-6 and EF1G are the most relevant.

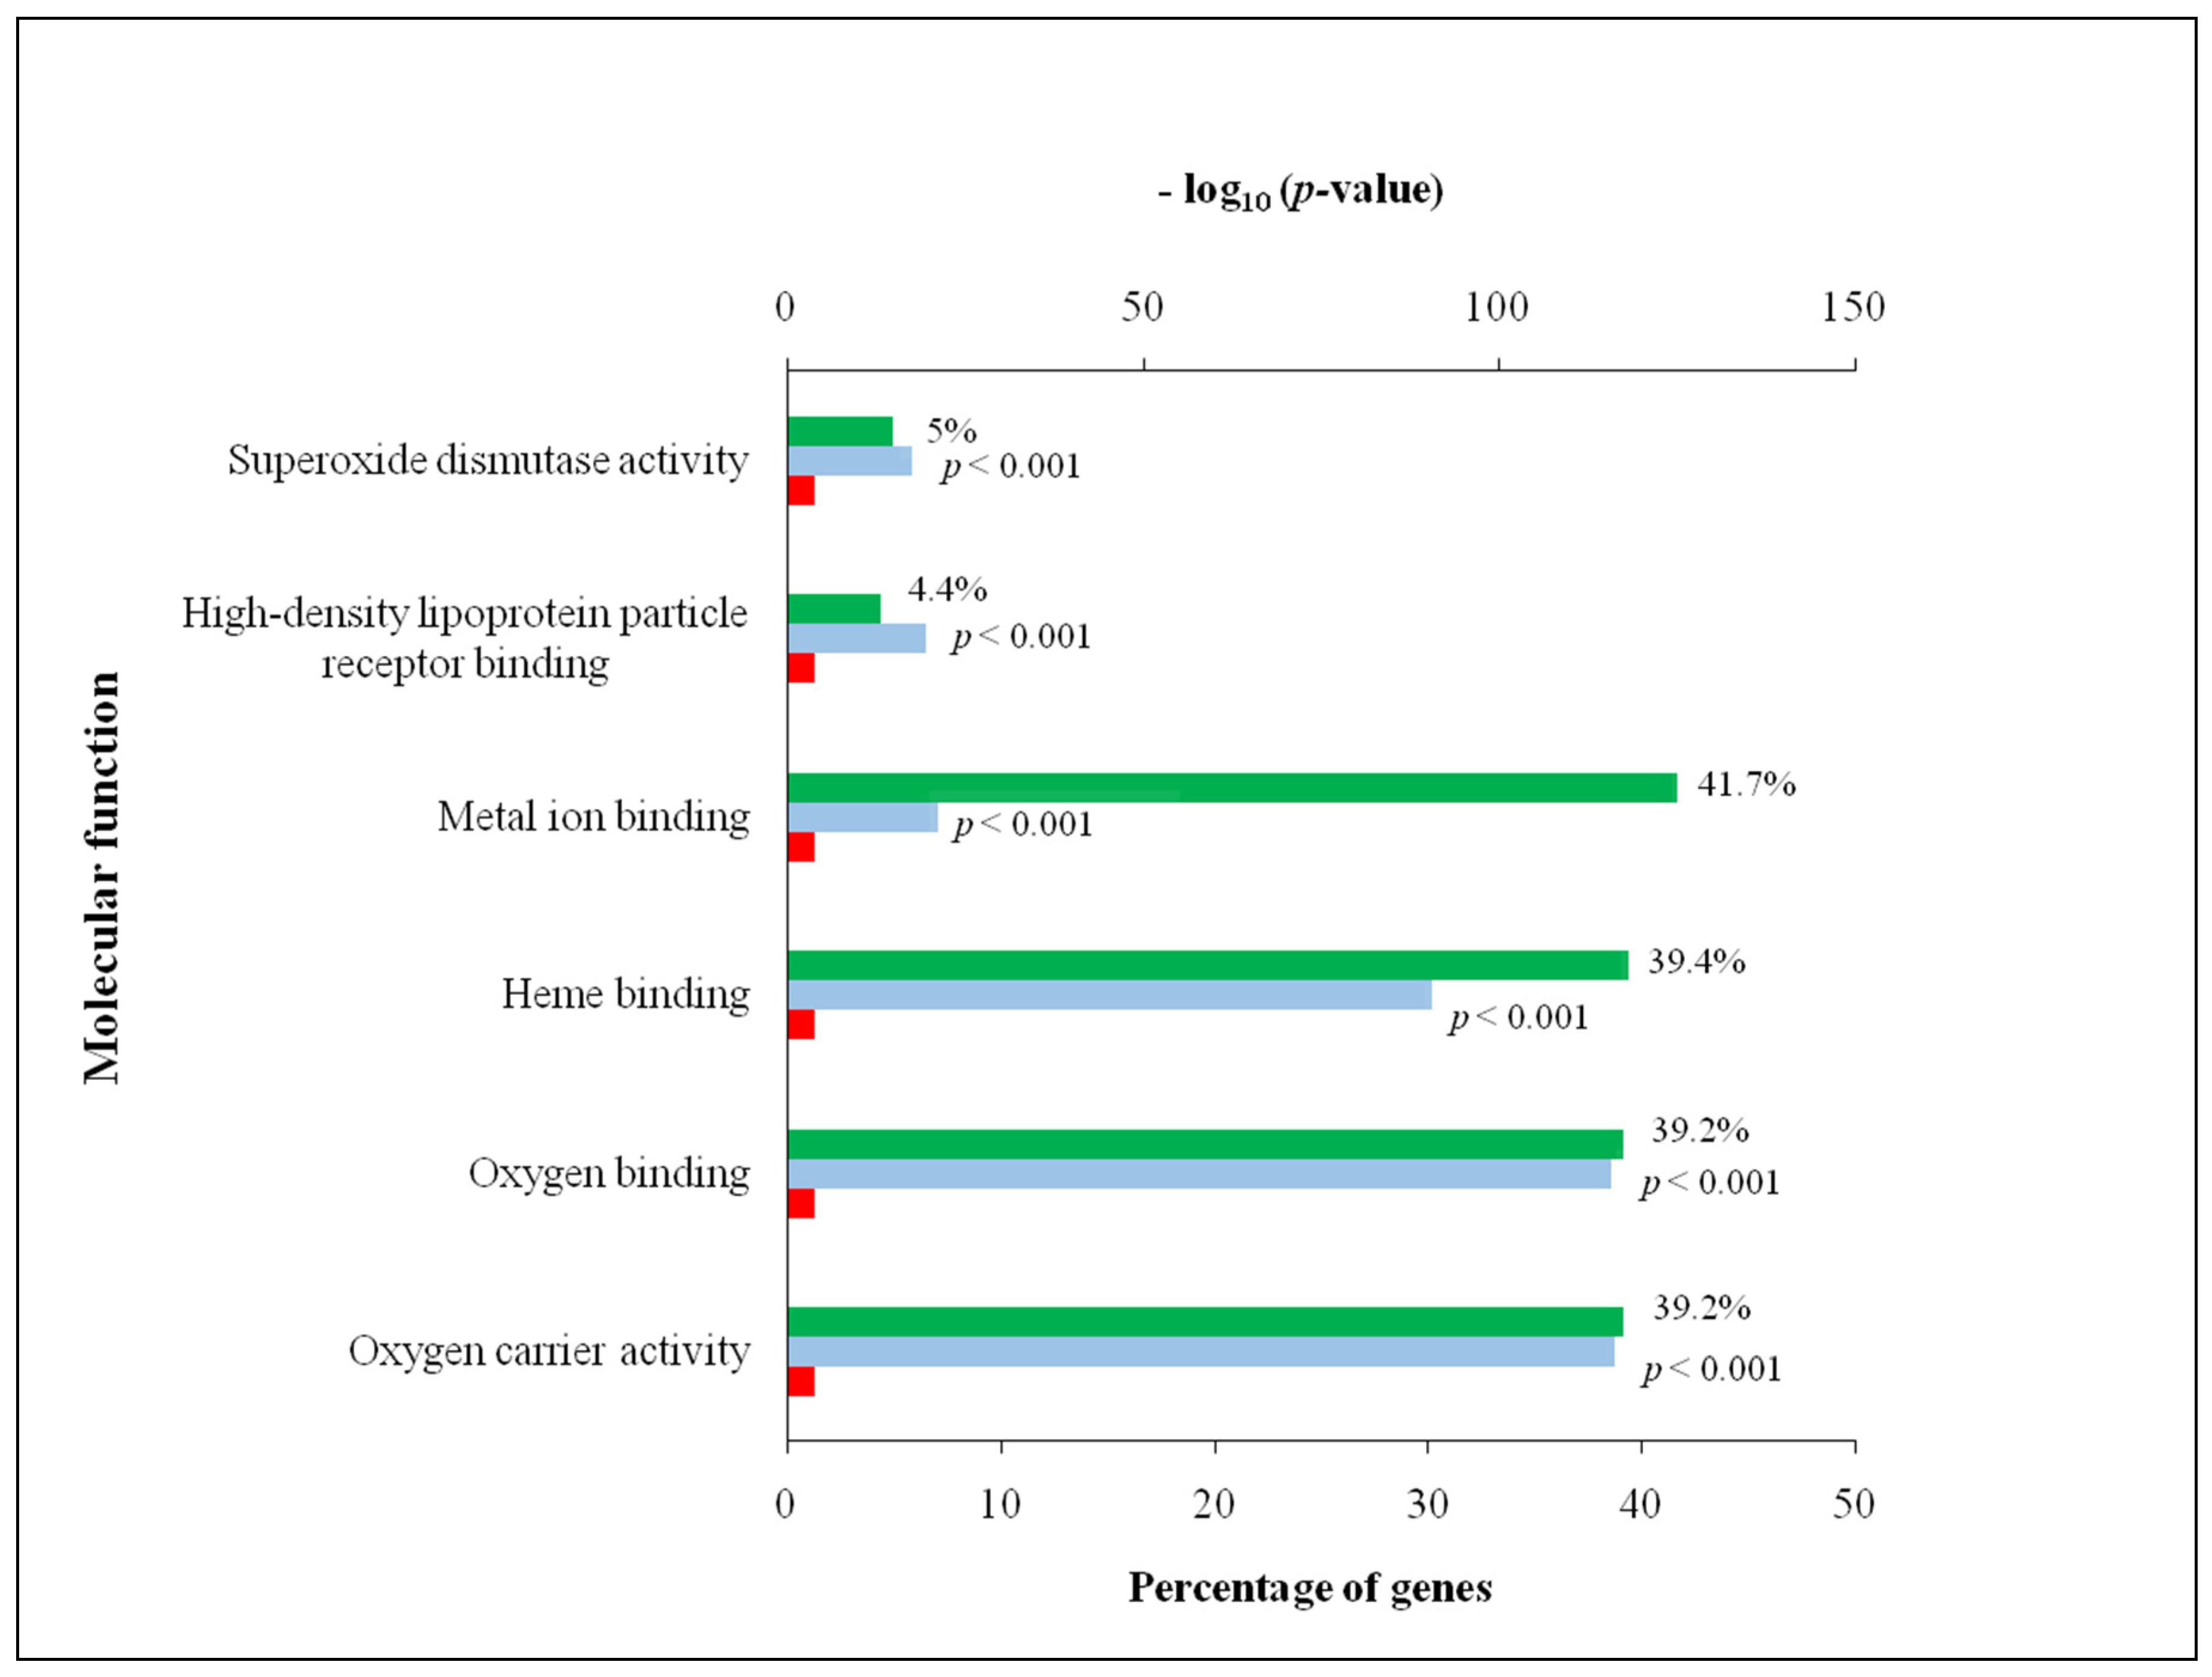
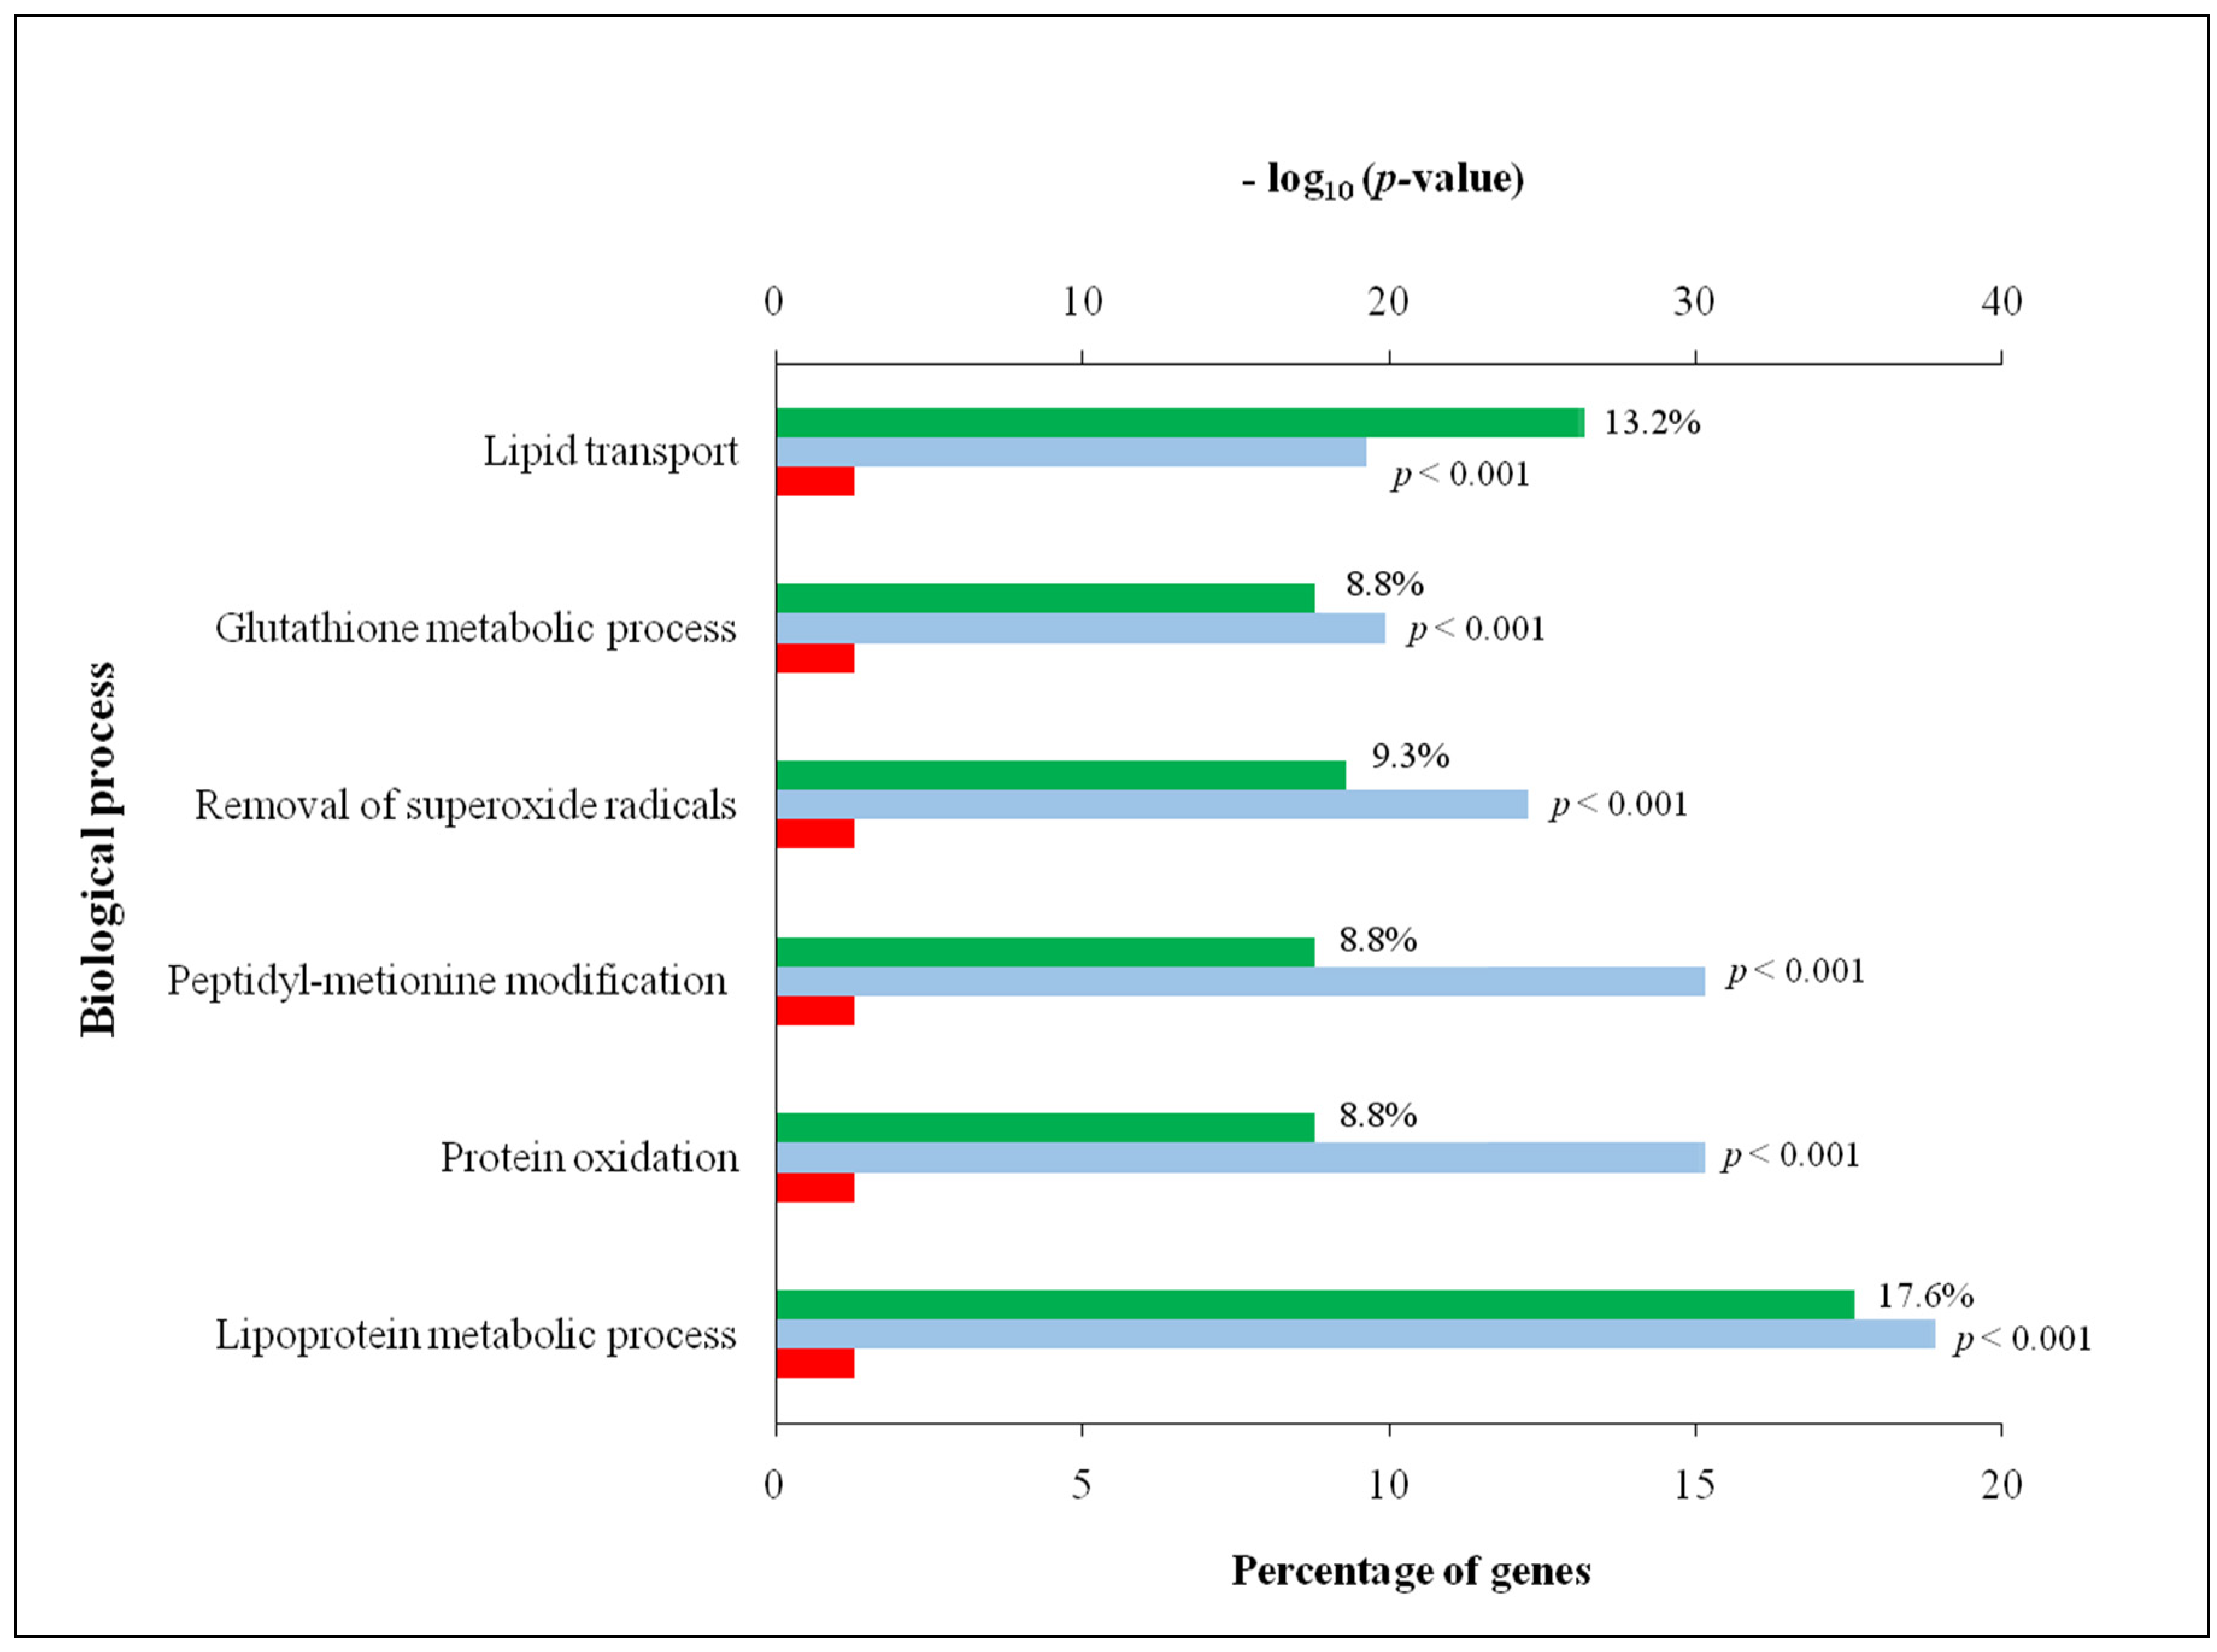
3.2. Comprehensive Analysis of Deer Antler Proteome

Deer antler contains several proteins with distinctive functions as can be concluded from Figure 2. The functional enrichment analysis for GO was performed using FunRich from DAPs between the tip and middle section. Biological process and molecular function were considered to carry out GO analysis of annotated proteins. Regarding biological processes, the more abundant categories were the lipoprotein metabolic process (GO:0042157), protein oxidation (GO:0018158), peptidyl methionine modification (GO:0018206), removal of superoxide radicals (GO:0019430), glutathione metabolic process (GO:0006749) and lipid transport (GO:0006869).

4. Discussion

4.1. Comparisons of Deer Proteomes Tip vs. Middle Antler, and Middle Antler vs. Ribs

The differences in the cluster mean distances of the samples between the middle and tip section showed by PCA analysis can be explained based on two reasons. Firstly, the tip growth center is a clearly defined unit, consisting of the five tissue layers: RM = reserve mesenchyme, PC = precartilage, TZ = transition zone, CA = cartilage and MC = mineralized cartilage [21,22]. The abundance of these proteins and gene expression were related to cartilage development and fast growth, and mineralization, together with those common to the organ’s development process [22]. On the other hand, the increase in the heterogeneity in the cluster of the samples from the middle section might be due to differences in the growth stage and the different sizes of the antlers.

4.1.1. Comparison Tip vs. Middle Antler

The most predominant proteins identified in the middle section are related to blood physiology, which is not surprising as mineralizing antler has the highest proportion of filling osteons formed by blood vessels bringing proteins, minerals and glucose to supply the energy needed for bone formation. In the case of transferrins (serotransferrin and lactotransferrin), hemoglobin and adult beta-globin 1 and 2, they are related to iron ion binding. Blood physiological processes are also the least abundant but still overexpressed in the mineralizing section such as complement C3, heparin cofactor 2 (HEP2), hemopexin, antithrombin-III (ANT3), among others. Some of these proteins may be present because they play other roles. Such is the case of serotransferrins, which are responsible for iron transport from absorption sites and Fe-heme degradation to those of storage and utilization. The Fe+2 released into the bloodstream is oxidized to Fe+3 by plasma ferroxidases for their incorporation into serotransferrin. Thus, iron is distributed among cells and used as a cofactor in many enzymatic reactions. One of them, highly important in the tissues of high metabolic rate, is to form part of catalase, one of the main antioxidant enzymes in control of oxidative stress [23,24,25]. Moreover, this protein might also have a role in stimulating cell proliferation [26]. In the case of lactotransferrin, a glycoprotein that also can link to iron, several biological activities were also described: iron homeostasis, anti-microbial and immunomodulatory effects and anti-tumor activity [27].
Apolipoprotein A-II is the second most abundant apolipoprotein in the high-density lipoproteins (HDL), but its function is still unclear. However, its function could be related to afamin, which is overexpressed in the middle section. Little is known about the physiological function of afamin apart from the fact that is a carrier of vitamin E. A rather recent study has shown that afamin is co-expressed (thus, expected to have a similar DAP level) in a ratio of 1:1 with proteins of the Wnt signalling pathway, particularly Wnt-3 [28]. The same study showed a somewhat lower co-expression of apolipoprotein. The Wnt proteins consist of a large family of glycoproteins which mainly control embryonic development and adult homeostasis. The Wnt signalling pathway is related to embryonic or organ development, and therefore, its genes are also highly expressed in antler development [3,9,29]. The proteins of the Wnt pathway are lipoproteins, and afamin and apolipoprotein A-II seem to play a role in helping to dissolve and carrying lipoproteins highly important in antler development signalling by Wnt3 and other Wnt proteins. The apolipoprotein A-II and serotransferrin are related to the regulation of IGF transport and uptake by insulin-like growth factor binding proteins (IGFBPs), whose family of growth factors are involved in antler development [30].
Alpha-1B-glycoprotein, another DAP, is a glycoprotein from plasma whose function is not clear. Indeed, it was reported that it might be a novel member of the immunoglobulin superfamily involved in cell recognition/regulation [31]. In humans, this protein has been related to several diseases. For instance, bladder cancer has been identified in all tumor-bearing patient samples but not in samples obtained from non-tumor-bearing individuals [32].
Another of the main DAPs was alkaline phosphate with a fold change of 4.00 (Table 1). This is the most important protein for incorporating Ca2+ from the bloodstream into the mineralizing bone, and it is abundantly found in the antler mineralizing tissue until it is fully mature when it disappears [33].
In the case of deer antler tip, the most DAPs were endoplasmin, 60 S acidic ribosomal protein P0, Y-box-binding protein 1 and Hsc70-interacting protein. Among them, the endoplasmin and Hsc70-interacting proteins are molecular chaperones involved in unfolded protein binding. The overabundance of such proteins in the antler growth center could be associated with the fast-growing of this tissue synthesizing a large number of proteins. These molecular chaperones ensure folding of the newly synthesized proteins in the cell into their tridimensional structure. In this sense, 60 S acidic ribosomal protein P0 and Y-box-binding protein 1 are also related to protein formation, through ribosome activity [34]. Similar functions of protein synthesis seem to have other ribosomal proteins with high content in the antler tip, such as ribosome-associated molecular chaperone SSB1, 60 S acidic ribosomal protein P2 (RLA2), 60 S acidic ribosomal protein P1 (RLA1) or heterogeneous nuclear ribonucleoprotein K (HNRPK) [35].
The DAPs with antioxidant capacity are particularly interesting. It would be expected that the expression of antioxidant proteins is increased in fast-growing tissues. Although both (antler and mineralizing part) have high metabolic rates, this seems to be higher in the tip, according to IGF-1 and IFN-γ levels (Figure 3). In the comparison of mineralizing antler vs. rib, a higher content of antioxidant molecules in the antler could be assumed. However, the results seem to be much more complex. The antioxidant proteins peroxiredoxin-2, carbonic anhydrase (CAH3), glutathione transferase, Cu/Zn superoxide dismutase (SODC), and peroxiredoxin-6 were more abundant in the mineralizing part of the antler, meanwhile, glutathione S-transferase P was more abundant in the tip.

4.1.2. Comparison Middle Section of Antler vs. Rib

The collagen alpha-2(I) chain is an important part of the bone organic extracellular matrix [36], suggesting a high content in the proteome of mature and full-grown bone (rib) compared to the forming bone (mineralizing section) with their osteons still only partly filled. Surprisingly, the collagen alpha-1(I) chain corresponding to gene COL1A1 was more abundant in the mineralizing section of the antler (3 times more expressed in antler than in rib as shown in Table 2). Remarkably, both genes COL1A1 and COL1A2 were overexpressed by a factor of 10 or 20 in the mineralizing section of the antler as compared to the rib of the same animal [29,37]. The seemingly contradictory results indicate gene expression is related to the rate of protein production, whereas the proteome is related to the abundance of protein. Accordingly, the mature bone may have lower rates of gene expression COL1A2 in the rib. However, the bone organic matrix may have a much greater amount of its related protein, CO1Aa. In the case of COL1A1, despite the high overexpression of the gene, the amount of protein may be only 3 times greater than its content in mature bone. It would be part of the scaffold which osteons are filling [38], thus being proportionately greater in growing antlers than in fully mature bone.
One of the most surprising results was that the second most abundant protein (12-fold overexpression) in the deer ribs, that is the fatty acid-binding protein (FABP4), found in adipocytes with the function of fatty acid-binding, but also inflammatory response. Although it suggests that yellow bone marrow might be found in ribs, the more likely reason relates deer ribs with osteoporotic bones. The antler grows at such speed that the deer suffer an annual cycle of osteoporosis to deliver skeleton proteins and minerals to the growing antler [29,39,40]. Borsy et al. assessed [39] the gene expression of deer ribs (one of the most prominent bones suffering such osteoporosis) and bones of human patients searching for an osteoporosis model. Several new genes, including FABP4, were found in common between deer cyclic and human pathological osteoporosis. FABP4 is more expressed in both types of osteoporosis. In addition, several studies have found that FABP4 is present in mouse embryos in adipocyte-like cells in non-fat tissues, including cartilage primordia and vertebrae [41]. This fatty-acid binding protein may bind proteins of the Wnt signalling pathway in connection with lipoproteins [28]. In the case of the deer rib (compared to the middle antler section), the need to bind Wnt would be related to intense bone remodeling caused by annual osteoporosis.
The set of antioxidant proteins (glutathione S-transferase Mu 1, F10A1, protein disulfide-isomerase A4, SODC, glutathione S-transferase P, Peroxiredoxin-6, EF1G) overexpressed in the ribs compared to the mineralizing section of the antler are linked to oxidative stress. This important biological process is connected to the production of ROS and strongly associated with high metabolic rate and the ability of the organism to counteract them [23]. Although deer ribs are in a stage of high bone resorption to support antler growth, known as cyclic osteoporosis [29], its metabolism rate should be lower than one of the mineralizing parts (middle section of antler) suggesting a greater content in ribs. Another protein that should be expected to be higher in mid parts of the antler than in ribs is cellular retinoic acid-binding protein 2 related to limb morphogenesis. Further studies on the cellular metabolic pathways in deer antler vs. osteoporotic bones are required to understand these complex interactions.
On the other hand, several proteins are overexpressed in the mineralizing parts of the antler as compared to ribs. Several are related to Ca2+ transport or fixation into the mineralizing antler, such as albumin (5-fold greater in mid antler), plasminogen (involved in tissue remodeling, similar overexpression), amiloride-sensitive amine oxidase, hemopexin (which also has functions in remodeling of blood vessels).
The most abundant proteins in the mineralizing antler are related to blood physiology, largely due to blood vessels occupying most of the filling osteons. Among these proteins, heparin cofactor 2 (HEP2), complement C3, antithrombin-III (ANT3), hemoglobin subunit alpha, apolipoprotein A-I, hemopexin, fibrinogen alpha chain and heparin cofactor 2 (HEP2) were found. A few of them have other important functions that are expected in the tissue of high metabolic rate, such as the antler. In this sense, creatine kinase B-type is involved in binding ATP, probably from the bloodstream into velvet antler cells, and serotransferrin (TRFE) is linked to cell proliferation. Particularly interesting functions among DAP proteins in the tip vs. mid sections may relate to the anti-cancer activity mentioned earlier; recently, Chonco et al. [5] reported properties against glioblastoma in an extract from the tip, but not from the middle parts of the antler. However, it remains to be elucidated which protein or peptide is responsible for this important activity.

4.2. Comprehensive Analysis of Deer Antler Proteome

The lipoprotein metabolic processes shown by GO analysis may indeed point to the fact that antler growth is mostly related to the Wnt signalling pathway [3,28,29,37]. These functions are included in the protein metabolic process. Indeed, the skeletal growth factor is closely related to the bone matrix that stimulates proliferation and protein synthesis in bone cells. The regulation of bone formation depends on several growth factors such as IGF-1 and others as previously mentioned [42]. Protein oxidation and peptidyl methionine modification are also connected to the cellular protein modification process. In the case of protein oxidation, it has been reported that the reduction-oxidation stability is a key step in the modulation of bone cell function and the mineralization of tissues. This balance could be modified to change the activity in bone cells in the treatment of bone diseases [43]. Regarding the biological process, the lipid transport of the present study resulted in significant (p < 0.001) differences between the tip and the middle section (Figure 2). In addition to the mentioned role played by lipoproteins of the Wnt family in antler growth, these proteins may also be related to energy metabolism which is crucial for such a fast-growing tissue. Thus, there is a connection between fatty acid and glucose metabolism, contributing to energy homeostasis via lipoprotein lipase which plays a key role as a regulator of fatty acid transport through skeletal compartments [44].
Oxygen is essential for living organisms to address their energy metabolism needs but the presence of oxygen leads to ROS production. The inability of cells and organisms to counteract ROS during cellular metabolism leads to oxidative stress, particularly in the mitochondria, and a cycle of DNA damage, further impairment of ROS counteracting, greater oxidative stress and further cell damage occurs [23]. Indeed, the cellular redox imbalance were studied in connection with apoptosis, ageing and several pathological conditions, particularly cancer [23,45]. To restore homeostasis, organisms have a potent battery of cell endogenous antioxidants, e.g., superoxide dismutase (SOD), catalase (CAT) and glutathione peroxidase (GPX) that trigger a cascade of biological processes to block these free radicals. Indeed, glutathione helps to support antioxidant defense in cellular events such as DNA and protein synthesis, cell proliferation, signal transduction and immune response relevant to cancer diseases, heart attack, diabetes and other diseases [46]. The ROS activate the response of the antioxidant endogenous system acting synergically. For instance, SOD scavenging activity is increased in parallel with GPX and CAT. Indeed, the main function of SOD is to convert superoxide to hydrogen peroxide removed by GPX or CAT, meanwhile, the glutathione system is activated to protect protein thiols. In the present study, the pathways involving glutathione and SOD were altered from the middle section to the tip of the deer antler (Table 1; Figure 2). SOD activity certainly resulted in a significant difference in the middle section than the tip (FC = 1.85; Table 1). Concerning glutathione metabolism, two isoforms of GSH (glutathione transferase and glutathione S-transferase P) were significantly more abundant in each section. One isoform was more abundant in the middle section (FC = 3.12; Table 1), whereas the other isoform was more abundant in the tip section (FC= 0.55; Table 1). Dysfunctions of chondrocytes, as the unique cell in mature cartilage, are associated with mitochondria dysfunctions causing a redox imbalance [47].
On the other hand, heat shock proteins and other chaperones involved in protein folding and aggregation, as well as translocation reactions, are considered stress proteins. The rapid growth and reorganization of tissues of the deer antler could be largely due to these proteins. As can be observed in Table 1, the heat shock 70 kDa protein 5 was significantly more abundant in the tip of deer antler (FC = 0.55). This family of proteins is extensively studied and it has been reported that heat shock 70 kDa modulates numerous factors such as the cycle of cell division, growth factors, cell differentiation, tissue development or hormonal stimulation caused by stress conditions, among others [48].
Finally, the array of proteins related to blood metabolism and physiology in the middle part of the antler indicates that the mineralizing part of the antler is richly vascularized, as well as the importance of blood supply to bring metabolites needed for fast mineralization and tissue maturation. As shown in Figure 3, the highest concentrations of IGF-1 and IFN-γ in the tip of the deer antler in comparison to mid parts and the ribs confirmed that deer antler velvet has many active components involved in cell regeneration and inflammatory reaction. Hence, this finding has shown that the presence of IGF-1 and IFN-γ in each antler section compared to the ribs, is an example of the velvet antler active components contained in the velvet antler such as glycosaminoglycans, phospholipids, hormones, and growth factors (IGF-1, nerve growth factor and epidermal growth factor) as indicated by Chunjuan [49].

5. Conclusions

Major differences in the deer antler proteome were found between the tip and the middle section, and between the latter and ribs. In this regard, 76 proteins were detected as differentially abundant proteins for the first comparison, and 85 for the second. Those proteins define the differential properties of these two tissue locations in the velvet antler. Distinctive functions of these proteins were allocated from the functional enrichment analysis, highlighting the relevance of the oxidative stress among them. Indeed, protein oxidation, removal of superoxide radicals and glutathione metabolic process resulted in great distinction between the two sections. Additionally, alterations of proteins of redox regulation directly affected energetic and metabolic pathways suggesting a key role in this model of deer antler regeneration. Further research needs to be done in greater detail to understand the development of this tissue.

Author Contributions

Conceptualization, M.L.-P., J.M.L., T.L.-C., L.C. and D.F.; methodology, M.L.-P., F.J.P.-B., A.G. and M.-P.L.-G.; data curation, M.L.-P. and D.F.; writing—original draft preparation, M.L.-P., T.L.-C., L.C. and D.F.; writing—review and editing, all authors; funding acquisition, J.M.L. and T.L.-C. All authors have read and agreed to the published version of the manuscript.

Funding

This research was funded by the project SBPLY/19/180501/000115 from Conserjería de Educación, Cultura, y Deportes de Castilla-La Mancha awarded to T.L.-C., F.J.P.-B.,was supported by Plan Estatal de Política Científica y Técnica y de Innovación CNU/692/2019. J.M.L. and D.F. belong to the competitive reference research group, FunMeat (Axencia Galega de Innovación, GAIN-IN607A2019/01) and they are members of the HealthyMeat network, funded by CYTED (Ref. 119RT0568).

Institutional Review Board Statement

Not applicable.

Informed Consent Statement

Not applicable.

Data Availability Statement

Not applicable.

Acknowledgments

Special thanks to Susana Bravo (Proteomic Unit, Instituto de Investigaciones Sanitarias-IDIS) for the MS technical support. The authors wish to thank game estate owner Yolanda Fierro for kindly supplying the samples that allowed to perform this study.

Conflicts of Interest

The authors declare no conflict of interest.

Ethic Statement

Antler samples used in this study were selected from animals that were hunted to reduce population density (for game management purposes) in a deer private game state in Ciudad Real (Castilla la Mancha, Spain) according to existing regional hunting law legal regulations.

References

  1. Gaspar-López, E.; Landete-Castillejos, T.; Estevez, J.A.; Ceacero, F.; Gallego, L.; García, A.J. Biometrics, testosterone, cortisol and antler growth cycle in iberian red deer stags (Cervus elaphus hispanicus). Reprod. Domest. Anim. 2010, 45, 243–249. [Google Scholar] [CrossRef]
  2. Shi, H.; Yu, T.; Li, Z.; Lu, W.; Zhang, M.; Ye, J. Bone regeneration strategy inspired by the study of calcification behavior in deer antler. Mater. Sci. Eng. C 2015, 57, 67–76. [Google Scholar] [CrossRef] [PubMed]
  3. Landete-Castillejos, T.; Kierdorf, H.; Gomez, S.; Luna, S.; García, A.J.; Cappelli, J.; Pérez-Serrano, M.; Pérez-Barbería, J.; Gallego, L.; Kierdorf, U. Antlers—Evolution, development, structure, composition, and biomechanics of an outstanding type of bone. Bone 2019, 128, 115046. [Google Scholar] [CrossRef] [PubMed]
  4. Wang, Y.; Zhang, C.; Wang, N.; Li, Z.; Heller, R.; Liu, R.; Zhao, Y.; Han, J.; Pan, X.; Zheng, Z.; et al. Genetic basis of ruminant headgear and rapid antler regeneration. Science 2019, 364, eaav6335. [Google Scholar] [CrossRef] [PubMed]
  5. Chonco, L.; Landete-Castillejos, T.; Serrano-Heras, G.; Serrano, M.P.; Pérez-Barbería, F.J.; González-Armesto, C.; García, A.; de Cabo, C.; Lorenzo, J.M.; Li, C.; et al. Anti-tumour activity of deer growing antlers and its potential applications in the treatment of malignant gliomas. Sci. Rep. 2021, 11, 1–12. [Google Scholar] [CrossRef] [PubMed]
  6. Tang, Y.J.; Jeon, B.T.; Wang, Y.; Choi, E.J.; Kim, Y.S.; Hwang, J.W.; Park, P.J.; Moon, S.H.; Kim, E.K. First evidence that sika deer (Cervus nippon) velvet antler extract suppresses migration of human prostate cancer cells. Korean J. Food Sci. Anim. Resour. 2015, 35, 507–514. [Google Scholar] [CrossRef] [Green Version]
  7. Yang, H.; Wang, L.; Sun, H.; He, X.; Zhang, J.; Liu, F. Anticancer activity in vitro and biological safety evaluation in vivo of Sika deer antler protein. J. Food Biochem. 2017, 41, 1–8. [Google Scholar] [CrossRef]
  8. Fraser, A.; Haines, S.R.; Stuart, E.C.; Scandlyn, M.J.; Alexander, A.; Somers-Edgar, T.J.; Rosengren, R.J. Deer velvet supplementation decreases the grade and metastasis of azoxymethane-induced colon cancer in the male rat. Food Chem. Toxicol. 2010, 48, 1288–1292. [Google Scholar] [CrossRef]
  9. Hu, W.; Qi, L.; Tian, Y.H.; Hu, R.; Wu, L.; Meng, X.Y. Studies on the purification of polypeptide from sika antler plate and activities of antitumor. BMC Complement. Altern. Med. 2015, 15, 1–8. [Google Scholar] [CrossRef] [PubMed]
  10. Wu, F.; Li, H.; Jin, L.; Li, X.; Ma, Y.; You, J.; Li, S.; Xu, Y. Deer antler base as a traditional Chinese medicine: A review of its traditional uses, chemistry and pharmacology. J. Ethnopharmacol. 2013, 145, 403–415. [Google Scholar] [CrossRef]
  11. Sui, Z.; Sun, H.; Weng, Y.; Zhang, X.; Sun, M.; Sun, R.; Zhao, B.; Liang, Z.; Zhang, Y.; Li, C.; et al. Quantitative proteomics analysis of deer antlerogenic periosteal cells reveals potential bioactive factors in velvet antlers. J. Chromatogr. A 2020, 1609, 460496. [Google Scholar] [CrossRef] [PubMed]
  12. Su, H.; Tang, X.; Zhang, X.; Liu, L.; Jing, L.; Pan, D.; Sun, W.; He, H.; Yang, C.; Zhao, D.; et al. Comparative proteomics analysis reveals the difference during antler regeneration stage between red deer and sika deer. PeerJ 2019, 2019, 1–20. [Google Scholar] [CrossRef] [PubMed]
  13. Ding, Y.; Ko, S.C.; Moon, S.H.; Lee, S.H. Protective effects of novel antioxidant peptide purified from alcalase hydrolysate of velvet antler against oxidative stress in chang liver cells in vitro and in a zebrafish model in vivo. Int. J. Mol. Sci. 2019, 20, 5187. [Google Scholar] [CrossRef] [PubMed] [Green Version]
  14. Dong, Z.; Ba, H.; Zhang, W.; Coates, D.; Li, C. iTRAQ-based quantitative proteomic analysis of the potentiated and dormant antler stem cells. Int. J. Mol. Sci. 2016, 17, 1778. [Google Scholar] [CrossRef] [PubMed] [Green Version]
  15. Wang, D.; Berg, D.; Ba, H.; Sun, H.; Wang, Z.; Li, C. Deer antler stem cells are a novel type of cells that sustain full regeneration of a mammalian organ—Deer antler. Cell Death Dis. 2019, 10, 443. [Google Scholar] [CrossRef] [PubMed] [Green Version]
  16. Wang, D.; Ba, H.; Li, C.; Zhao, Q.; Li, C. Proteomic analysis of plasma membrane proteins of antler stem cells using label-free LC-MS/MS. Int. J. Mol. Sci. 2018, 19, 3477. [Google Scholar] [CrossRef] [PubMed] [Green Version]
  17. Dong, Z.; Haines, S.; Coates, D. Proteomic Profiling of Stem Cell Tissues during Regeneration of Deer Antler: A Model of Mammalian Organ Regeneration. J. Proteome Res. 2020, 19, 1760–1775. [Google Scholar] [CrossRef]
  18. Boletín Oficial del Estado. Ley 2/2018, de 15 de Marzo, por la que se Modifican la Ley 3/2015, de 5 de Marzo, de Caza de Castilla-La Mancha y Otras Normas en Materia Medioambiental y Fiscal; Agencia Estatal Boletín Oficial del Estado: Madrid, Spain, 2018. [Google Scholar]
  19. Pathan, M.; Keerthikumar, S.; Ang, C.S.; Gangoda, L.; Quek, C.Y.J.; Williamson, N.A.; Mouradov, D.; Sieber, O.M.; Simpson, R.J.; Salim, A.; et al. FunRich: An open access standalone functional enrichment and interaction network analysis tool. Proteomics 2015, 15, 2597–2601. [Google Scholar] [CrossRef] [PubMed]
  20. López-pedrouso, M.; Franco, D.; Serrano, M.P.; Maggiolino, A. A proteomic-based approach for the search of biomarkers in Iberian wild deer ( Cervus elaphus ) as indicators of meat quality. J. Proteomics 2019, 205, 103422. [Google Scholar] [CrossRef]
  21. Li, C.; Suttie, J.M.; Clark, D.E. Histological examination of antler regeneration in red deer (Cervus elaphus). Anat. Rec. Part A Discov. Mol. Cell. Evol. Biol. 2005, 282, 163–174. [Google Scholar] [CrossRef]
  22. Ba, H.; Wang, D.; Yau, T.O.; Shang, Y.; Li, C. Transcriptomic analysis of different tissue layers in antler growth Center in Sika Deer (Cervus nippon). BMC Genom. 2019, 20, 1–13. [Google Scholar] [CrossRef] [Green Version]
  23. Finkel, T.; Holbrook, N.J. Oxidants, Oxidative Stress and Biology of Ageing. Insight Rev. Artic. 2000, 408, 239–247. [Google Scholar] [CrossRef]
  24. Balogh, E.; Paragh, G.; Jeney, V. Influence of iron on bone homeostasis. Pharmaceuticals 2018, 11, 107. [Google Scholar] [CrossRef] [PubMed] [Green Version]
  25. Cesari, M.; Pahor, M.; Lauretani, F.; Penninx, B.W.H.J.; Bartali, B.; Russo, R.; Cherubini, A.; Woodman, R.; Bandinelli, S.; Guralnik, J.M.; et al. Bone density and hemoglobin levels in older persons: Results from the InCHIANTI study. Osteoporos. Int. 2005, 16, 691–699. [Google Scholar] [CrossRef] [Green Version]
  26. Golizeh, M.; Lee, K.; Ilchenko, S.; Ösme, A.; Bena, J.; Sadygov, R.G.; Kashyap, S.; Kasumov, T. Increased serotransferrin and ceruloplasmin turnover in diet-controlled patients with type 2 diabetes. Free Radic. Biol. Med. 2017, 113, 461–469. [Google Scholar] [CrossRef]
  27. Deng, M.; Zhang, W.; Tang, H.; Ye, Q.; Liao, Q.; Zhou, Y.; Wu, M.; Xiong, W.; Zheng, Y.; Guo, X.; et al. Lactotransferrin acts as a tumor suppressor in nasopharyngeal carcinoma by repressing AKT through multiple mechanisms. Oncogene 2013, 32, 4273–4283. [Google Scholar] [CrossRef] [Green Version]
  28. Mihara, E.; Hirai, H.; Yamamoto, H.; Tamura-Kawakami, K.; Matano, M.; Kikuchi, A.; Sato, T.; Takagi, J. Active and water-soluble form of lipidated wnt protein is maintained by a serum glycoprotein afamin/α-albumin. elife 2016, 5, 1–19. [Google Scholar] [CrossRef] [PubMed]
  29. Steger, D.J.; Grant, G.R.; Schupp, M.; Tomaru, T.; Lefterova, M.I.; Schug, J.; Manduchi, E.; Stoeckert, C.J.; Lazar, M.A. Propagation of adipogenic signals through an epigenomic transition state. Genes Dev. 2010, 24, 1035–1044. [Google Scholar] [CrossRef] [PubMed] [Green Version]
  30. Baker, J.; Liu, J.P.; Robertson, E.J.; Efstratiadis, A. Role of insulin-like growth factors in embryonic and postnatal growth. Cell 1993, 75, 73–82. [Google Scholar] [CrossRef]
  31. Sun, D.; Zhao, Y.Y.; Dai, S.P.; Fang, K.; Dong, L.Y.; Ding, Q. Cloning and analysis of human α-1B glycoprotein precursor gene: A novel member of human immunoglobulin superfamily. Acta Genet. Sin. 2002, 29, 299–302. [Google Scholar] [PubMed]
  32. Kreunin, P.; Zhao, J.; Rosser, C.; Urquidi, V.; Lubman, D.M.; Goodison, S. Bladder cancer associated glycoprotein signatures revealed by urinary proteomic profiling. J. Proteome Res. 2007, 6, 2631–2639. [Google Scholar] [CrossRef] [Green Version]
  33. Landete-Castillejos, T.; Estevez, J.A.; Cearero, F.; García, A.J.; Gallego, L. A review of factors affecting antler composition and mechanics Tomas. Front. Biosci. 2012, 4, 2328–2339. [Google Scholar] [CrossRef]
  34. Lee, K.S.; Cao, Y.; Witwicka, H.E.; Tom, S.; Tapscott, S.J.; Wang, E.H. RNA-binding protein muscleblind-like 3 (MBNL3) disrupts myocyte enhancer factor 2 (Mef2) β-exon splicing. J. Biol. Chem. 2010, 285, 33779–33787. [Google Scholar] [CrossRef] [PubMed] [Green Version]
  35. Yang, H.W.; Kim, H.D.; Kim, T.S.; Kim, J. Senescent Cells Differentially Translate Senescence-Related mRNAs Via Ribosome Heterogeneity. J. Gerontol. Ser. A Biol. Sci. Med. Sci. 2019, 74, 1015–1024. [Google Scholar] [CrossRef] [PubMed]
  36. Lim, J.; Grafe, I.; Alexander, S.; Lee, B. Genetic causes and mechanisms of Osteogenesis Imperfecta. Bone 2017, 102, 40–49. [Google Scholar] [CrossRef] [PubMed]
  37. Hu, P.; Wang, T.; Liu, H.; Xu, J.; Wang, L.; Zhao, P.; Xing, X. Full-length transcriptome and microRNA sequencing reveal the specific gene-regulation network of velvet antler in sika deer with extremely different velvet antler weight. Mol. Genet. Genom. 2019, 294, 431–443. [Google Scholar] [CrossRef] [PubMed]
  38. Gomez, S.; Garcia, A.J.; Luna, S.; Kierdorf, U.; Kierdorf, H.; Gallego, L.; Landete-Castillejos, T. Labeling studies on cortical bone formation in the antlers of red deer (Cervus elaphus). Bone 2013, 52, 506–515. [Google Scholar] [CrossRef] [PubMed]
  39. Borsy, A.; Podani, J.; Stéger, V.; Balla, B.; Horváth, A.; Kósa, J.P.; Gyurján, I.; Molnár, A.; Szabolcsi, Z.; Szabó, L.; et al. Identifying novel genes involved in both deer physiological and human pathological osteoporosis. Mol. Genet. Genom. 2009, 281, 301–313. [Google Scholar] [CrossRef] [PubMed]
  40. Baxter, B.J.; Andrews, R.N.; Barrell, G.K. Bone turnover associated with antler growth in red deer (Cervus elaphus). Anat. Rec. 1999, 256, 14–19. [Google Scholar] [CrossRef]
  41. Urs, S.; Harrington, A.; Liaw, L.; Small, D. Selective expression of an aP2/Fatty Acid Binding Protein4-Cre transgene in non-adipogenic tissues during embryonic development. Transgenic Res. 2006, 15, 647–653. [Google Scholar] [CrossRef]
  42. Wergedal, J.E.; Mohan, S.; Lundy, M.; Baylink, D.J. Skeletal growth factor and other growth factors known to be present in bone matrix stimulate proliferation and protein synthesis in human bone cells. J. Bone Miner. Res. 1990, 5, 179–186. [Google Scholar] [CrossRef] [PubMed]
  43. Wauquier, F.; Leotoing, L.; Coxam, V.; Guicheux, J.; Wittrant, Y. Oxidative stress in bone remodelling and disease. Trends Mol. Med. 2009, 15, 468–477. [Google Scholar] [CrossRef] [PubMed]
  44. Bartelt, A.; Koehne, T.; Tödter, K.; Reimer, R.; Müller, B.; Behler-Janbeck, F.; Heeren, J.; Scheja, L.; Niemeier, A. Quantification of bone fatty acid metabolism and its regulation by adipocyte lipoprotein lipase. Int. J. Mol. Sci. 2017, 18, 1264. [Google Scholar] [CrossRef] [PubMed]
  45. Poprac, P.; Jomova, K.; Simunkova, M.; Kollar, V.; Rhodes, C.J.; Valko, M. Targeting Free Radicals in Oxidative Stress-Related Human Diseases. Trends Pharmacol. Sci. 2017, 38, 592–607. [Google Scholar] [CrossRef] [PubMed]
  46. Wu, G.; Fang, Y.Z.; Yang, S.; Lupton, J.R.; Turner, N.D. Glutathione Metabolism and Its Implications for Health. J. Nutr. 2004, 134, 489–492. [Google Scholar] [CrossRef] [PubMed] [Green Version]
  47. Ruiz-Romero, C.; Calamia, V.; Mateos, J.; Carreira, V.; Martínez-Gomariz, M.; Fernández, M.; Blanco, F.J. Mitochondrial dysregulation of osteoarthritic human articular chondrocytes analyzed by proteomics: A decrease in mitochondrial superoxide dismutase points to a redox imbalance. Mol. Cell. Proteom. 2009, 8, 172–189. [Google Scholar] [CrossRef] [PubMed] [Green Version]
  48. Kiang, J.G.; Tsokos, G.C. Heat shock protein 70 kDa: Molecular biology, biochemistry, and physiology. Pharmacol. Ther. 1998, 80, 183–201. [Google Scholar] [CrossRef]
  49. Chunjuan, L.; Shouqin, Z.; Dongsheng, L.; Jianpeng, D. Detection and quantitation of insulin-like growth factor-1 in velvet antler by an enzyme-linked immunosorbent assay. In Proceedings of the 2011 International Conference on Consumer Electronics, Communications and Networks (CECNet), Xianning, China, 16–18 April 2011; pp. 1162–1168. [Google Scholar] [CrossRef]
Figure 1. Projection of the antler samples of Iberian red deer (Cervus elaphus) of the three locations (tip, middle and rib) in the plane defined by the first two principal components.
Biology 10 00679 g001
Figure 2. Functional enrichment analysis of differentially abundant proteins (expressed in percentage) of the antler samples of Iberian red deer (Cervus elaphus) of the two locations (tip and middle) using FunRich. The biological processes and molecular functions obtained were sorted by −log10 (p-value) and only the top 6 are displayed. The percentage of genes, p = 0.05 as reference and −log10 (p-value) are indicated in green, red and blue, respectively.
Biology 10 00679 g002aBiology 10 00679 g002b
Figure 3. (A) Concentration of IGF-1 in two sections of antlers and internal bone (rib) as a control. (B) Concentration of IFN-γ in two sections of antlers and internal bone (rib) as a control. Data are means ± standard error of the mean. p-value of the significant comparison against control (* p = 0.05–0.01, *** p ≤ 0.001).
Biology 10 00679 g003
Table 1. List of differential abundant proteins (mean value ± standard error of mean) of the antler samples of red deer (Cervus elaphus) from a native Iberian population of the two locations (tip and middle), gene names and fold change (FC) between both locations.
ItemsProtein NameGene NamesMiddle SectionTipFC
Mean ± SEMean ± SE
Hemoglobin subunit alphaHBA/SCN2A2,563,475.0 ± 869,235.6155,785.3 ± 39,216.016.46
Adult beta-globin 1HBB45,176,500.0 ± 16,757,107.73,050,606.7 ± 1,088,464.014.81
Adult beta-globin 2HBB13,515,916.7 ± 4,092,463.01,083,311.7 ± 331,202.812.48
Creatine kinase B-typeCKB311,250.0 ± 37,004.740,426.8 ± 3039.07.70
Alpha-2-macroglobulin (A2MG)A2M316,528.3 ± 77,031.052,790.2 ± 5947.16.00
Inter-alpha-trypsin inhibitor heavy chain H1ITIH1165,838.3 ± 53,177.330,431.5 ± 1875.75.45
Amiloride-sensitive amine oxidaseAOC139,327.2 ± 6441.89712.9 ± 1135.14.05
Carbonic anhydrase (CAH3)CA322,310.6 ± 5010.65560.7 ± 1178.04.01
Alkaline phosphatase (PPBN)ALPG15,993.0 ± 1618.54000.0 ± 467.94.00
Inter-alpha-trypsin inhibitor heavy chain H2ITIH287,390.0 ± 17,580.924,580.3 ± 2302.83.56
Peroxiredoxin-2PRDX237,583.5 ± 4204.311,079.8 ± 510.73.39
Apolipoprotein A-IIAPOA260,995.7 ± 16,710.018,302.5 ± 1743.93.33
Alpha-amylase 1AAMY1A22,315.3 ± 4160.56740.0 ± 955.13.31
Plasminogen (PLMN)PLG37,045.7 ± 9978.911,666.0 ± 644.53.18
Glutathione S-transferase Mu 1GSTM194,826.5 ± 25,325.830,432.3 ± 2409.73.12
Complement C3C3712,043.3 ± 109,393.3252,156.7 ± 27,537.12.82
Afamin (AFAM)AFM25,198.7 ± 5103.39541.6 ± 1423.62.64
Serpin 3-6Serpin378,931.7 ± 87,373.6145,784.2 ± 24,405.92.60
Mimecan (MIME)OGN55,036.5 ± 9328.621,511.8 ± 2205.42.56
Alpha-1B-glycoproteinA1BG2,213,076.7 ± 441,457.5866,086.7 ± 63,588.42.56
Fetuin-B (FETUB)Fetuin-B56,124.7 ± 8673.822,155.8 ± 2673.32.53
Alpha-2-antiplasmin (A2AP)SERPINF224,572.3 ± 4954.99877.7 ± 579.02.49
Complement factor B (CFAB)CFB90,554.5 ± 16,717.936,896.7 ± 2915.52.45
Heparin cofactor 2 (HEP2)SERPIND119,863.8 ± 3310.18067.4 ± 843.72.46
Retinol-binding protein 4 (RET4)RBP420,127.3 ± 4240.28274.5 ± 783.42.43
Annexin A2ANXA252,405.0 ± 7452.622,504.7 ± 1287.22.33
Beta-N-acetylhexosaminidaseHEXB4104.9 ± 607.51851.1 ± 250.12.22
LactotransferrinLTF1444,530.0 ± 231,686.6659,118.3 ± 34,072.72.19
Hemopexin (fragment)HPX173,172.2 ± 38,801.380,237.7 ± 9734.12.16
Antithrombin-III (ANT3)SERPINC164,056.0 ± 10,572.330,005.0 ± 1717.22.13
40S ribosomal protein S27a (RS27A)RPS27A78,794.3 ± 10,336.138,137.8 ± 4586.82.07
Apolipoprotein A-IAPOA14,144,766.7 ± 798,136.12,013,133.3 ± 167,607.12.06
Alpha-1-acid glycoprotein 1 (A1AG1)ORM195,798.0 ± 18,143.947,375.3 ± 3783.32.02
Hemopexin (HEMO)HPX346,240.0 ± 72,507.6172,841.7 ± 15,826.52.00
Actin-depolymerizing factorGSN78,246.3 ± 13,025.739,946.8 ± 1462.51.96
Serotransferrin (TRFE)TF2,125,016.7 ± 347,685.81,096,858.3 ± 76,391.01.94
Adenosylhomocysteinase (SAHH)AHCY9665.6 ± 765.95004.9 ± 1092.11.93
LumicanLUM206,390.0 ± 30,250.1109,842.0 ± 11,393.31.88
ATP synthase subunit beta (ATPB)ATP5F1B163,660.0 ± 11,615.087,713.2 ± 3889.41.87
Cu/Zn superoxide dismutase (SODC)SOD169,312.8 ± 7322.537,554.7 ± 3418.61.85
Peroxiredoxin-6PRDX688,053.3 ± 12,976.147,894.5 ± 2267.11.84
Cystatin-B (CSTB)Cystatin-B26,072.0 ± 4123.714,697.6 ± 1446.91.77
Transaldolase (TALDO)TALDO112,790.6 ± 1895.07283.0 ± 1154.71.76
Plastin-3PLS332,357.3 ± 3587.118,817.3 ± 869.41.72
Pyruvate kinase (KPYM)PKM171,291.7 ± 19,236.7264,250.0 ± 9462.00.65
L-lactate dehydrogenaseLDHB100,577.0 ± 9101.6155,815.0 ± 8110.50.65
Polyadenylate-binding protein (PABP2)PABPN15875.5 ± 1150.79190.6 ± 365.00.64
Chloride intracellular channel protein 1CLIC19348.2 ± 1694.414,520.7 ± 453.00.64
Heat shock 70kDa protein 5HSPA5186,508.3 ± 33,958.7301,630.0 ± 5751.10.62
Heterogeneous nuclear ribonucleoprotein MHNRNPM10,044.3 ± 1370.716,531.0 ± 530.70.61
Eukaryotic translation initiation factor 5A (IF5A1)EIF5A19,182.3 ± 3339.032,350.0 ± 3133.90.59
Aggrecan core protein (PGCA)ACAN49,556.0 ± 4794.485,088.7 ± 5985.10.58
Glutathione S-transferase PGSTP124,142.5 ± 2739.044,152.7 ± 8435.20.55
Peptidylprolyl isomerasePPWD13916.0 ± 800.87129.1 ± 562.90.55
Proteasome endopeptidase complex/PSBPSMB2137.7 ± 470.83933.2 ± 136.70.54
Olfactomedin-like protein 3 (OLFL3)OLFML39038.2 ± 1023.417,887.7 ± 2661.10.51
Putative ATP-dependent RNA helicaseDHX573944.2 ± 1136.77865.7 ± 679.40.50
Protein disulfide-isomerasePDIA6178,383.3 ± 22,517.8390,683.3 ± 12,154.90.46
CalponinCNN23543.7 ± 896.78039.1 ± 1697.60.44
Septin-7 (SEPT7)SEPTIN73874.0 ± 1053.99256.4 ± 506.50.42
Thrombospondin-1 (TSP1)THBS18282.2 ± 2059.120,655.8 ± 2272.90.40
Heterogeneous nuclear ribonucleoprotein (HNRPK)HNRNPK9548.3 ± 1725.524,761.2 ± 969.20.39
Collagen alpha-1(II) chain (CO2A1)COL2A126,222.3 ± 7333.067,945.7 ± 7406.70.39
Glucosidase 2 subunit beta (GLU2B)PRKCSH2971.2 ± 894.48639.6 ± 737.50.34
Protein disulfide-isomerase (fragment)PDIA6105,751.3 ± 16,292.9334,988.3 ± 8084.20.32
Heterogeneous nuclear ribonucleoproteins C1/C2HNRNPC1700.7 ± 405.76226.1 ± 350.60.27
Hyaluronan and proteoglycan link protein 1 (HPLN1)HAPLN163,678.3 ± 6588.1235,995.0 ± 14,162.80.27
Elongation factor 1-gamma (EF1G)EEF1G6767.1 ± 1803.825,447.8 ± 1352.10.27
60S acidic ribosomal protein P1 (RLA1)RPLP13699.7 ± 955.815,261.1 ± 1570.30.24
60S acidic ribosomal protein P2 (RLA2)RPLP28009.4 ± 1102.035,171.8 ± 3258.90.23
Ribosome-associated molecular chaperone SSB1SSB12193.3 ± 778.710,186.9 ± 346.40.22
Elongation factor 1-delta (EF1D)EEF1D6809.5 ± 1064.532,352.3 ± 928.90.21
Protein disulfide-isomerase A4PDIA415,204.7 ± 2296.077,964.3 ± 3747.70.20
Peptidyl-prolyl cis-trans isomerase (PIN4)PIN425,527.3 ± 9262.3132,480.8 ± 21,660.10.19
Hsc70-interacting protein (F10A1)ST132395.8 ± 725.314,398.3 ± 804.90.17
Y-box-binding protein 1 (YBOX1)YBX11189.9 ± 396.47032.0 ± 683.70.17
60S acidic ribosomal protein P0 (RLA0)RPLP01920.2 ± 265.312,717.7 ± 779.50.15
Endoplasmin (ENPL)HSP90B127,822.7 ± 4283.1243,358.3 ± 8040.50.11
Proteins overexpressed in middle section and tip of antler are indicated in the table by red and blue color, respectively.
Table 2. List of differential abundant proteins (mean value ± standard error of mean) of the antler samples (middle section) of red deer (Cervus elaphus) from a native Iberian population compared to rib, gene names and fold change (FC) between both locations.
Protein NameGene NamesRibMiddle Section
Mean ± SEMean ± SEFC
Collagen alpha-2(I) chain (CO1Aa)COL1A223,664,457.4 ± 4,097,670.2481,201.8 ± 110,505.649.17
Fatty acid-binding protein, adipocyteFABP4477,239.0 ± 58,119.240,306.7 ± 5080.511.84
40S ribosomal protein S12 29,511.2 ± 7966.92719.0 ± 682.710.85
Keratin, type II cytoskeletal 6AKRT6A340,515.4 ± 68,869.353,010.4 ± 16,401.46.42
Fructose-bisphosphate aldolaseALDOA515,078.4 ± 93,413.781,491.0 ± 7750.36.32
Carbonic anhydrase (CAH3)CA3128,113.8 ± 21,821.422,310.6 ± 5010.65.74
Cellular retinoic acid-binding protein 2CRABP214,697.1 ± 3304.02776.5 ± 616.75.29
Hsc70-interacting protein (F10A1)ST1312,672.4 ± 1992.22395.8 ± 725.35.28
Keratin, type I cytoskeletal 10KRT10360,962.0 ± 76,985.970,201.7 ± 19,902.15.14
Transaldolase (TALDO)TALDO160,475.7 ± 6149.712,790.6 ± 1895.04.72
Y-box-binding protein 1 (YBOX1)YBX15441.0 ± 1179.41189.9 ± 396.44.57
Annexin A2 (fragment)ANXA25372.1 ± 764.61182.3 ± 309.84.54
Heterogeneous nuclear ribonucleoproteins C1/C2HNRNPC7177.4 ± 1158.71700.7 ± 405.74.22
Alpha-amylase 1AAMY1A92,107.7 ± 12,024.122,315.3 ± 4160.54.13
Protein disulfide-isomerase A4PDIA461,477.6 ± 5982.715,204.7 ± 2296.04.04
40S ribosomal protein S27a (RS27A)RPS27A308,538.6 ± 23,001.678,794.3 ± 10,336.13.92
Glutathione S-transferase Mu 1GSTM1349,396.0 ± 39,083.394,826.5 ± 25,325.83.68
Glucose-6-phosphate isomeraseGPI56,018.1 ± 7541.415,638.1 ± 1216.33.58
Heterogeneous nuclear ribonucleoprotein K(HNRPK)HNRNPK33,963.0 ± 5938.79548.3 ± 1725.53.56
L-lactate dehydrogenaseLDHB339,487.1 ± 68,674.4100,577.0 ± 9101.63.38
Polyadenylate-binding protein (PABP2) (fragment)PABPN114,151.0 ± 3025.14320.8 ± 740.83.28
Olfactomedin-like protein 3 (OLFL3)OLFML328,187.8 ± 2177.89038.2 ± 1023.43.12
Polypyrimidine tract-binding protein 1PTBP112,884.6 ± 1449.84236.4 ± 382.53.04
Putative ATP-dependent RNA helicaseDHX5711,623.6 ± 2252.43944.2 ± 1136.72.95
TetranectinCLEC3B31,409.1 ± 5411.810,775.4 ± 2341.52.91
60S acidic ribosomal protein P0 (RLA0)RPLP05587.1 ± 730.01920.2 ± 265.32.91
Triosephosphate isomeraseTPI1548,662.6 ± 54,009.9192,349.8 ± 28.673,12.85
Ubiquitin-conjugating enzyme E2 variant 2UBE2V214,901.8 ± 2303.75305.7 ± 1703.42.81
6-phosphogluconate dehydrogenase decarboxylatingPGD30,659.1 ± 3472.510,972.5 ± 2533.02.79
Lupus La proteinSSB6042.3 ± 964.52193.3 ± 781.82.75
UDP-glucose 6-dehydrogenaseUGDH8707.4 ± 1631.53215.2 ± 674.12.71
Malate dehydrogenase, cytoplasmicMDH111,937.7 ± 2189.34467.4 ± 1815.32.67
DecorinDCN203,457.1 ± 19,766.678,507.4 ± 9628.32.59
Phosphoglycerate kinase 1PGK1102,757.0 ± 15,094.939,944.3 ± 3442.82.57
Peroxiredoxin-6PRDX6226,238.3 ± 16,359.388,053.3 ± 12,976.12.57
Cu/Zn superoxide dismutase (SODC)SOD1173,733.6 ± 23,314.969,312.8 ± 7322.52.51
BiglycanBGN100,093.6 ± 13,826.541,794.6 ± 5319,22.39
Elongation factor 1-gamma (EF1G)EEF1G15,255.3 ± 2163.96767.1 ± 1803.82.25
Glutathione S-transferase PGSTP154,208.3 ± 5030.524,142.5 ± 2739.02.25
Glucosidase 2 subunit beta (GLU2B)PRKCSH6611.3 ± 939.72971.2 ± 894.42.23
Chloride intracellular channel protein 1CLIC120,704.72 ± 3379.99348.2 ± 1694.42.21
Glutathione S-transferase P (fragment)GSTP142,414.8 ± 7016.719,194.5 ± 5.535.92.21
60S acidic ribosomal protein P2 (RLA2)RPLP217,289.1 ± 1634.28009.4 ± 1102.02.16
Alpha-2-HS-glycoproteinAHSG274,143.4 ± 36,049.6129,638.6 ± 29,231.72.11
TransgelinTAGLN84,419.6 ± 10,442.440,987.1 ± 5652.82.06
Transgelin (fragment)TAGLN37,823.7 ± 3877.118,390.6 ± 2628.02.06
CalponinCNN27285.9 ± 849.13543.7 ± 896.72.06
Polyadenylate-binding protein (PABP2)PABPN111,923.6 ± 887.05875.5 ± 1150.72.03
Phosphatidylethanolamine-binding protein 1PEBP117,399.2 ± 2682.08613.4 ± 1756.92.02
Fatty acid-binding protein 5FABP57163.9 ± 843.83625.2 ± 699.11.98
Heterogeneous nuclear ribonucleoprotein HHNRNPH131,298.3 ± 2793.216,102.7 ± 1632.71.94
Endoplasmin (ENPL)HSP90B151,370.1 ± 3589.427,822.7 ± 4283.11.85
LumicanLUM380,040.3 ± 43,044.1206,390.0 ± 30,250.11.84
Transitional endoplasmic reticulum ATPaseVCP68,467.5 ± 8692.539,195.5 ± 4453.91.75
Phosphatidylethanolamine-binding protein 1PEBP142,253.9 ± 5040.524,291.3 ± 4633.21.74
Peptidyl-prolyl cis-trans isomerase (PIN4)PIN4375,942.8 ± 29,644.925,527.3 ± 9262.31.61
UMP-CMP kinaseCMPK16599.5 ± 647.24105.2 ± 500.71.61
Pyruvate kinase (KPYM)PKM261,337.6 ± 27,813.7171,291.7 ± 19,236.71.53
Galectin 1LGALS149,839.4 ± 5621.576,707.49 ± 10,793.00.65
Nucleobindin-1NUCB124,434.2 ± 3012.538,920.5 ± 4924.80.63
Heparin cofactor 2 (HEP2)SERPIND111,873.5 ± 1969.719,863.8 ± 3310.10.60
Elongation factor 2EEF251,547.7 ± 4948.486,627.3 ± 12,626.10.60
Plastin-3PLS318,711.7 ± 2677.232,357.3 ± 3587.10.58
Heat shock protein 70 1AHSPA1A65,543.3 ± 8657.8114,598.05 ± 8998.60.57
Serotransferrin (TRFE)TF1,215,178.8 ± 193,911.22,125,016.7 ± 347,685.80.57
Inter-alpha-trypsin inhibitor heavy chain H2ITIH247,937.9 ± 5216.087,390.0 ± 17,580.90.55
Apolipoprotein A-IVAPOA445,231.5 ± 4775.785,435.1 ± 9548.50.53
Nucleoside diphosphate kinase mitochondrialNME467,760.2 ± 5520.7129,968.3 ± 14,280.80.52
Fibrinogen alpha chainFGA135,860.8 ± 21,986.1291,686.2 ± 55,713.20.47
VimentinVIM156,778.7 ± 17,997.7341,121.7 ± 67,935.60.46
HemopexinHPX79,373.2 ± 11,927.3173,172.2 ± 38,801.30.46
Afamin (AFAM)AFM10,596.6 ± 1972.325,198.7 ± 5103.30.42
Alpha-1B-glycoproteinA1BG878,594.0 ± 101,549.52,213,076.7 ± 441,457.50.40
Thioredoxin domain-containing protein 5TXNDC547,903.8 ± 6878.6121,210.10 ± 10,595.20.40
Eukaryotic translation initiation factor 5A (IF5A1)EIF5A7520.5 ± 1315.219,182.3 ± 3339.00.39
TransthyretinTTR98,470.6 ± 19,719.4251,207.1 ± 73,458.00.39
Apolipoprotein A-IAPOA11,599,381.1 ± 272,199.74,144,766.7 ± 798,136.10.39
Creatine kinase B-typeCKB119,883.7 ± 15,308.5311,250.0 ± 37,004.70.39
Amiloride-sensitive amine oxidaseAOC114,519.1 ± 3374.739,327.2 ± 6441.80.37
Hemoglobin subunit alphaHBA/SCN2A905,083.4 ± 296,103.92,563,475.0 ± 869.235.60.35
Antithrombin-III (ANT3)SERPINC122,535.4 ± 2287.564,056.0 ± 10,572.30.35
Apolipoprotein A-IIAPOA220,745.2 ± 5114.260,995.7 ± 16,710.00.34
Collagen alpha-1(I) chainCOL1A187,968.2 ± 11,426.9275,756.5 ± 54,450.20.32
Complement factor B (CFAB)CFB27,628.1 ± 3354.190,554.5 ± 16,717.90.31
Histidine-rich glycoproteinHRG46,388.9 ± 4259.7159,018.1 ± 45,430.20.29
AlbuminALB4,096,318.3 ± 713,885.619,510,270.2 ± 3,628,081.00.21
Plasminogen (PLMN)PLG7232.5 ± 2021.837,045.7 ± 9978.90.20
Complement C3C3131,933.9 ± 14,398.5712,043.3 ± 109,393.30.19
Proteins overexpressed in rib and middle section of antler are indicated in the table by green and red color, respectively.
Publisher’s Note: MDPI stays neutral with regard to jurisdictional claims in published maps and institutional affiliations.

