
FLAME: A Web Tool for Functional and Literature Enrichment Analysis of Multiple Gene Lists

 , , , and
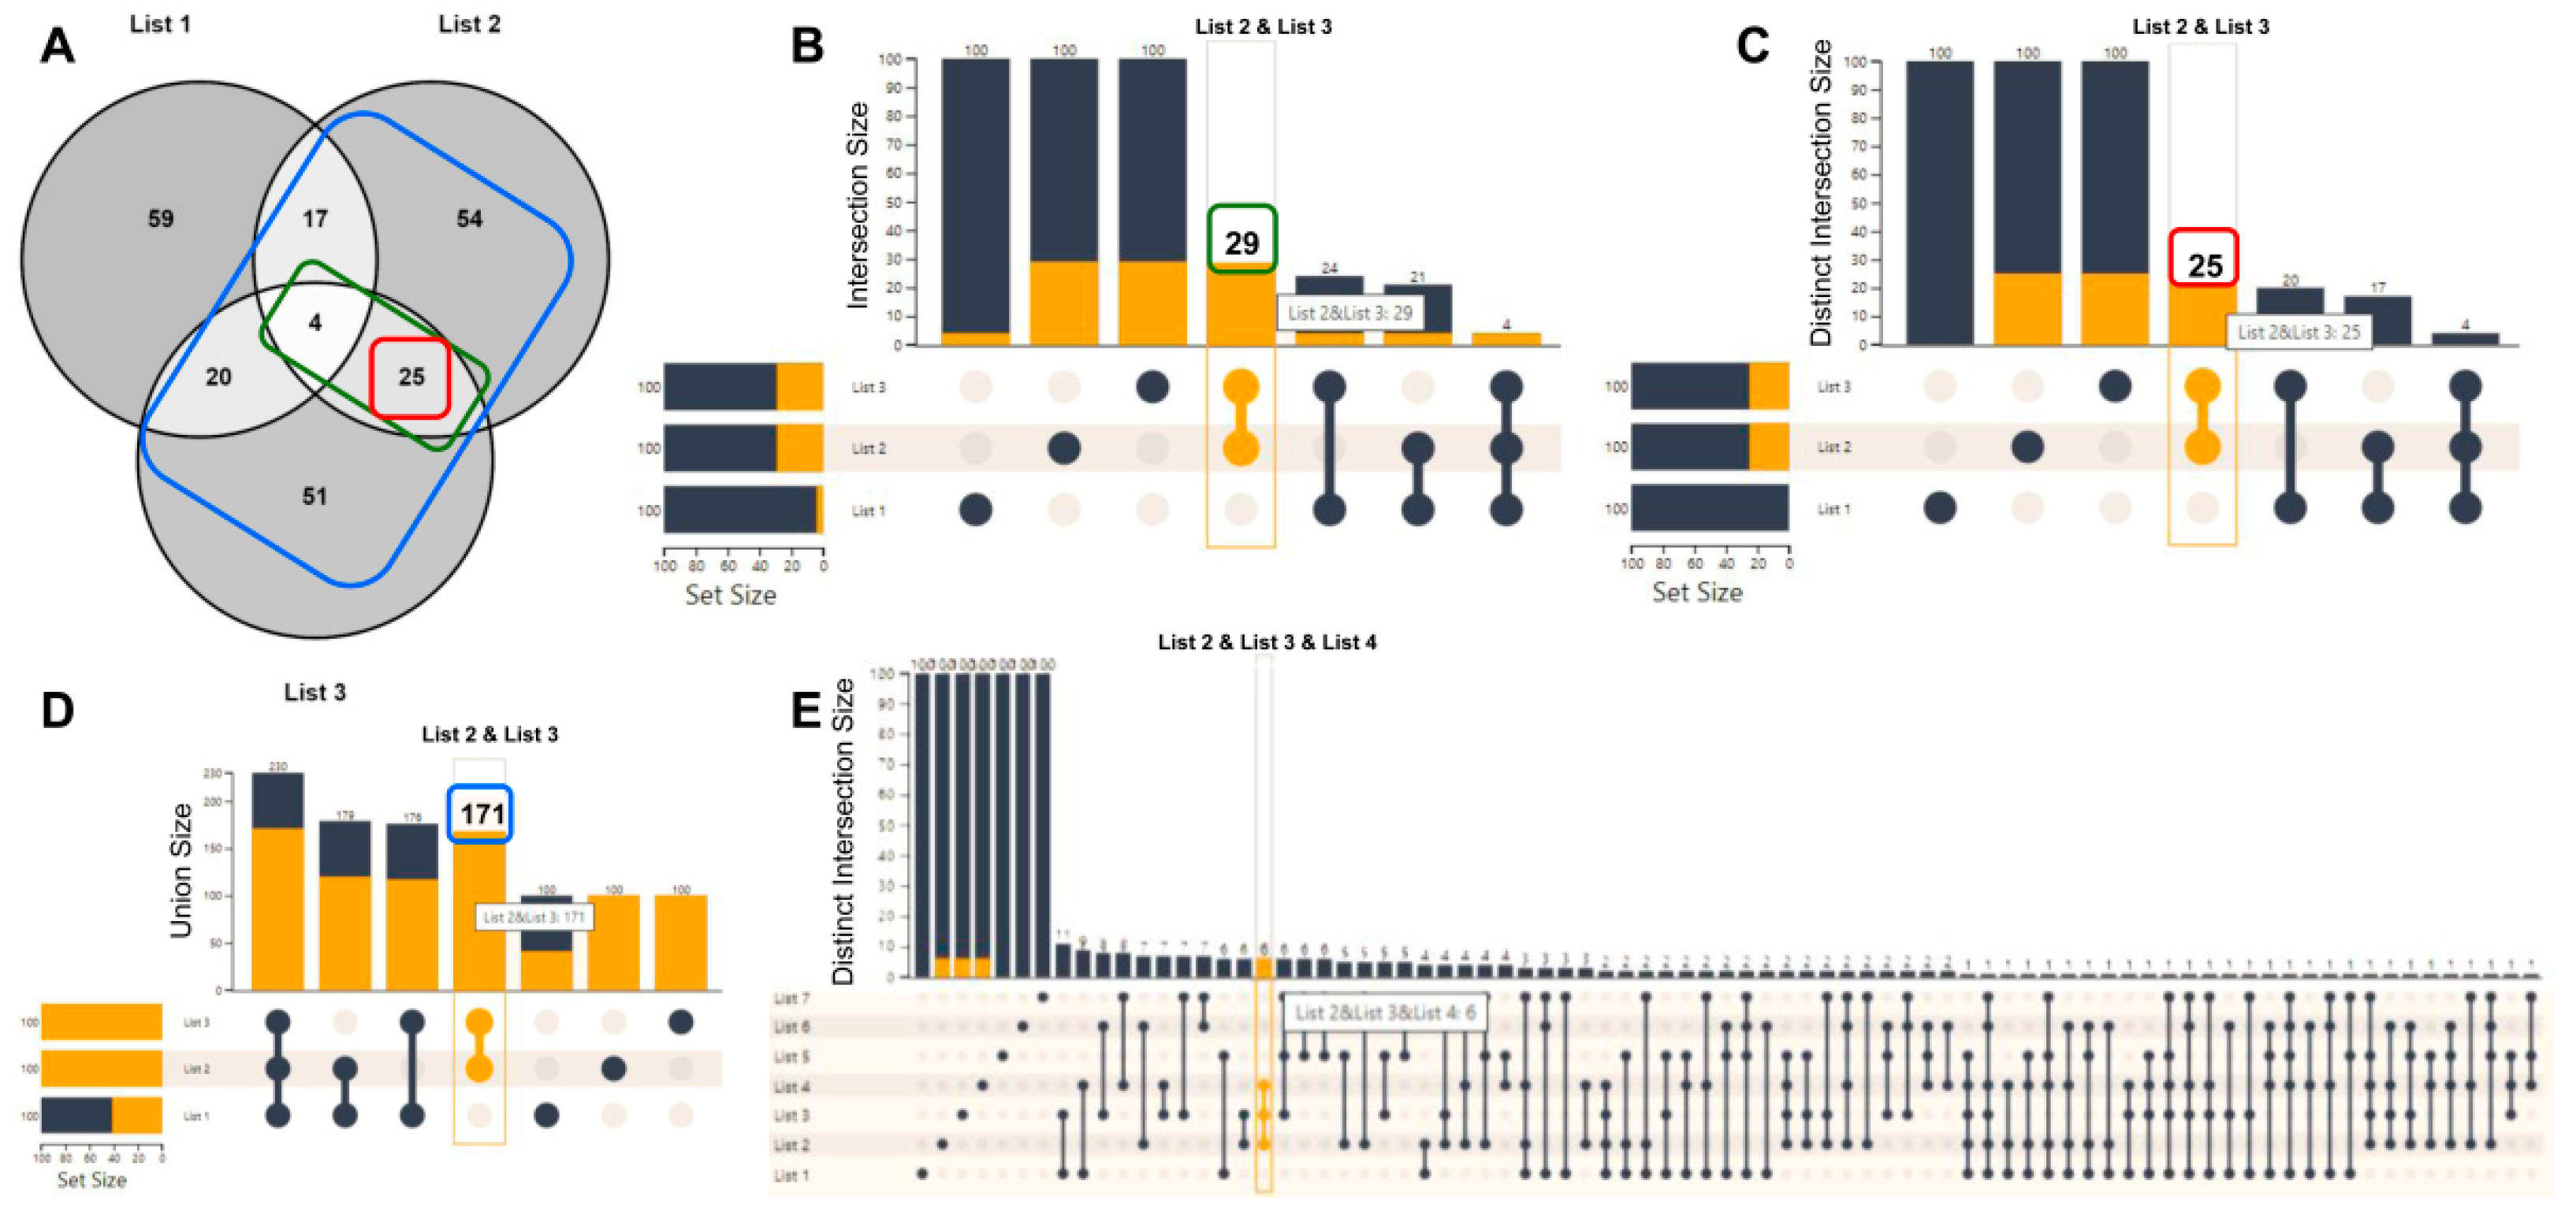
Abstract
:Simple Summary
Abstract
1. Introduction
2. Materials and Methods
2.1. Input
2.2. List Manipulation with the Use of UpSet Plots
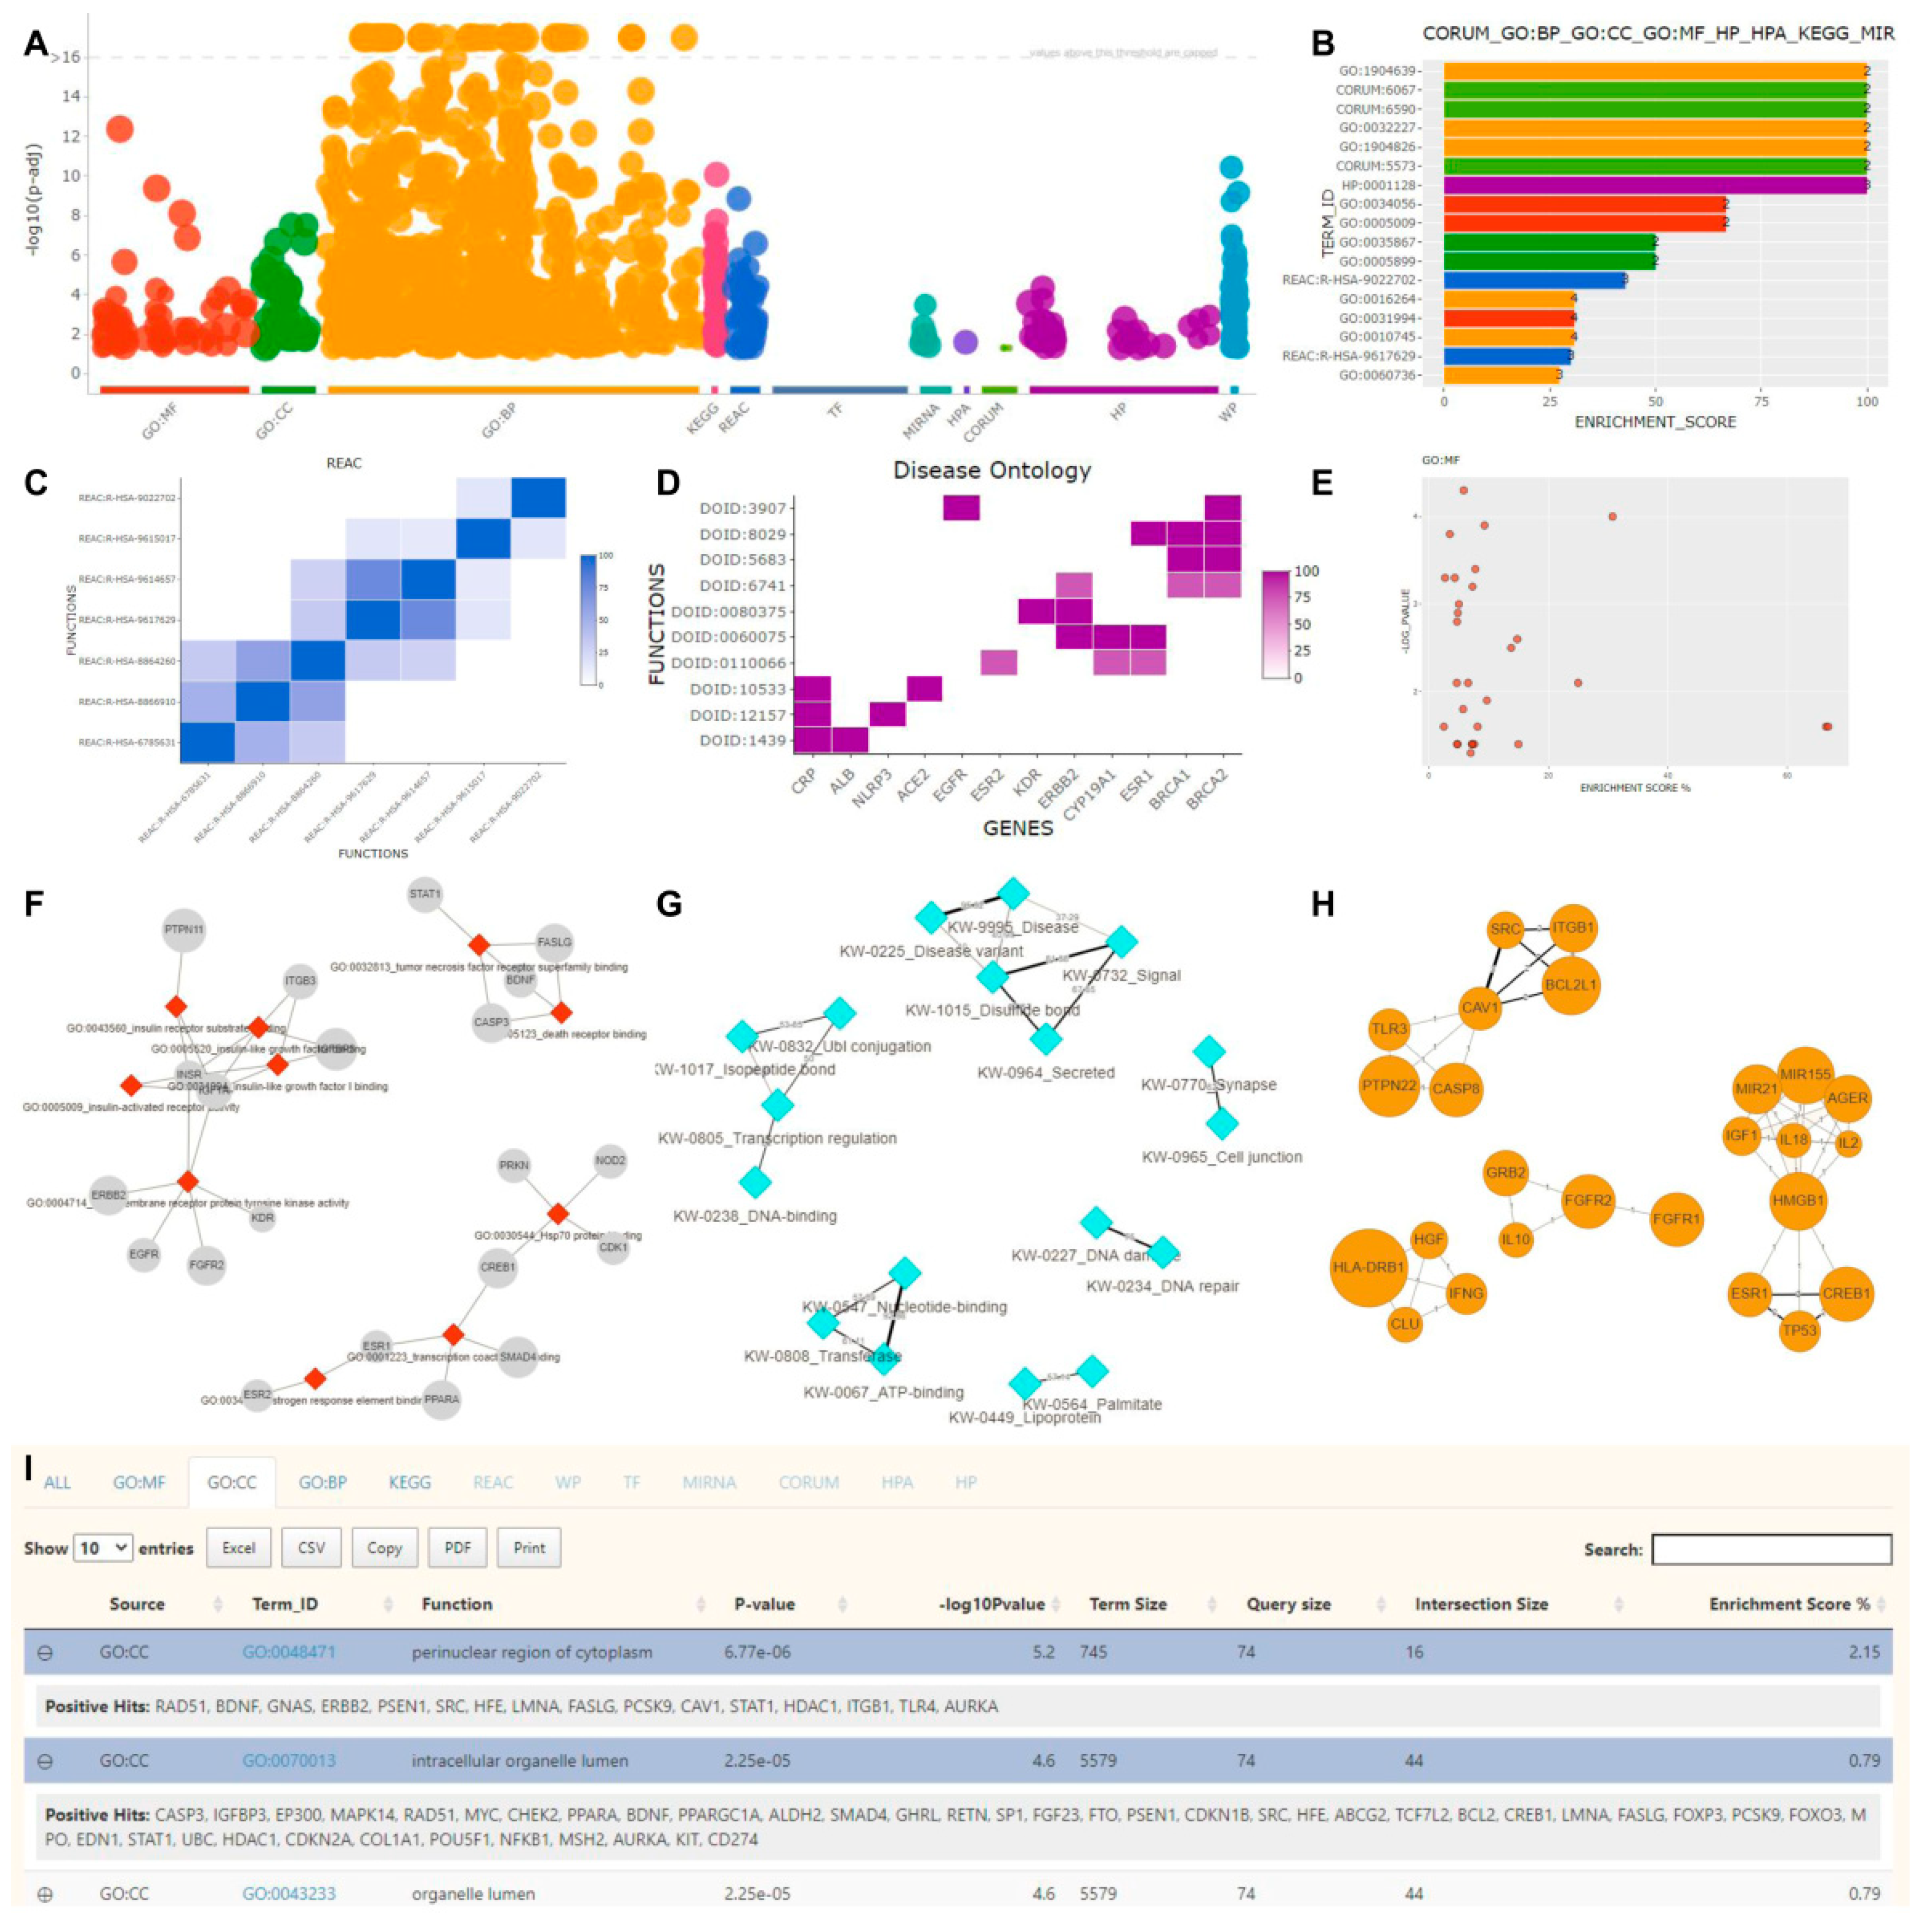
2.3. Functional Enrichment
2.4. Literature Enrichment
2.5. Protein–Protein Interaction Analysis
2.6. Visual Analytics and Interactive Visualization
2.7. Gene ID Conversion and Orthology Search
2.8. Implementation
2.9. Integration with Other Applications
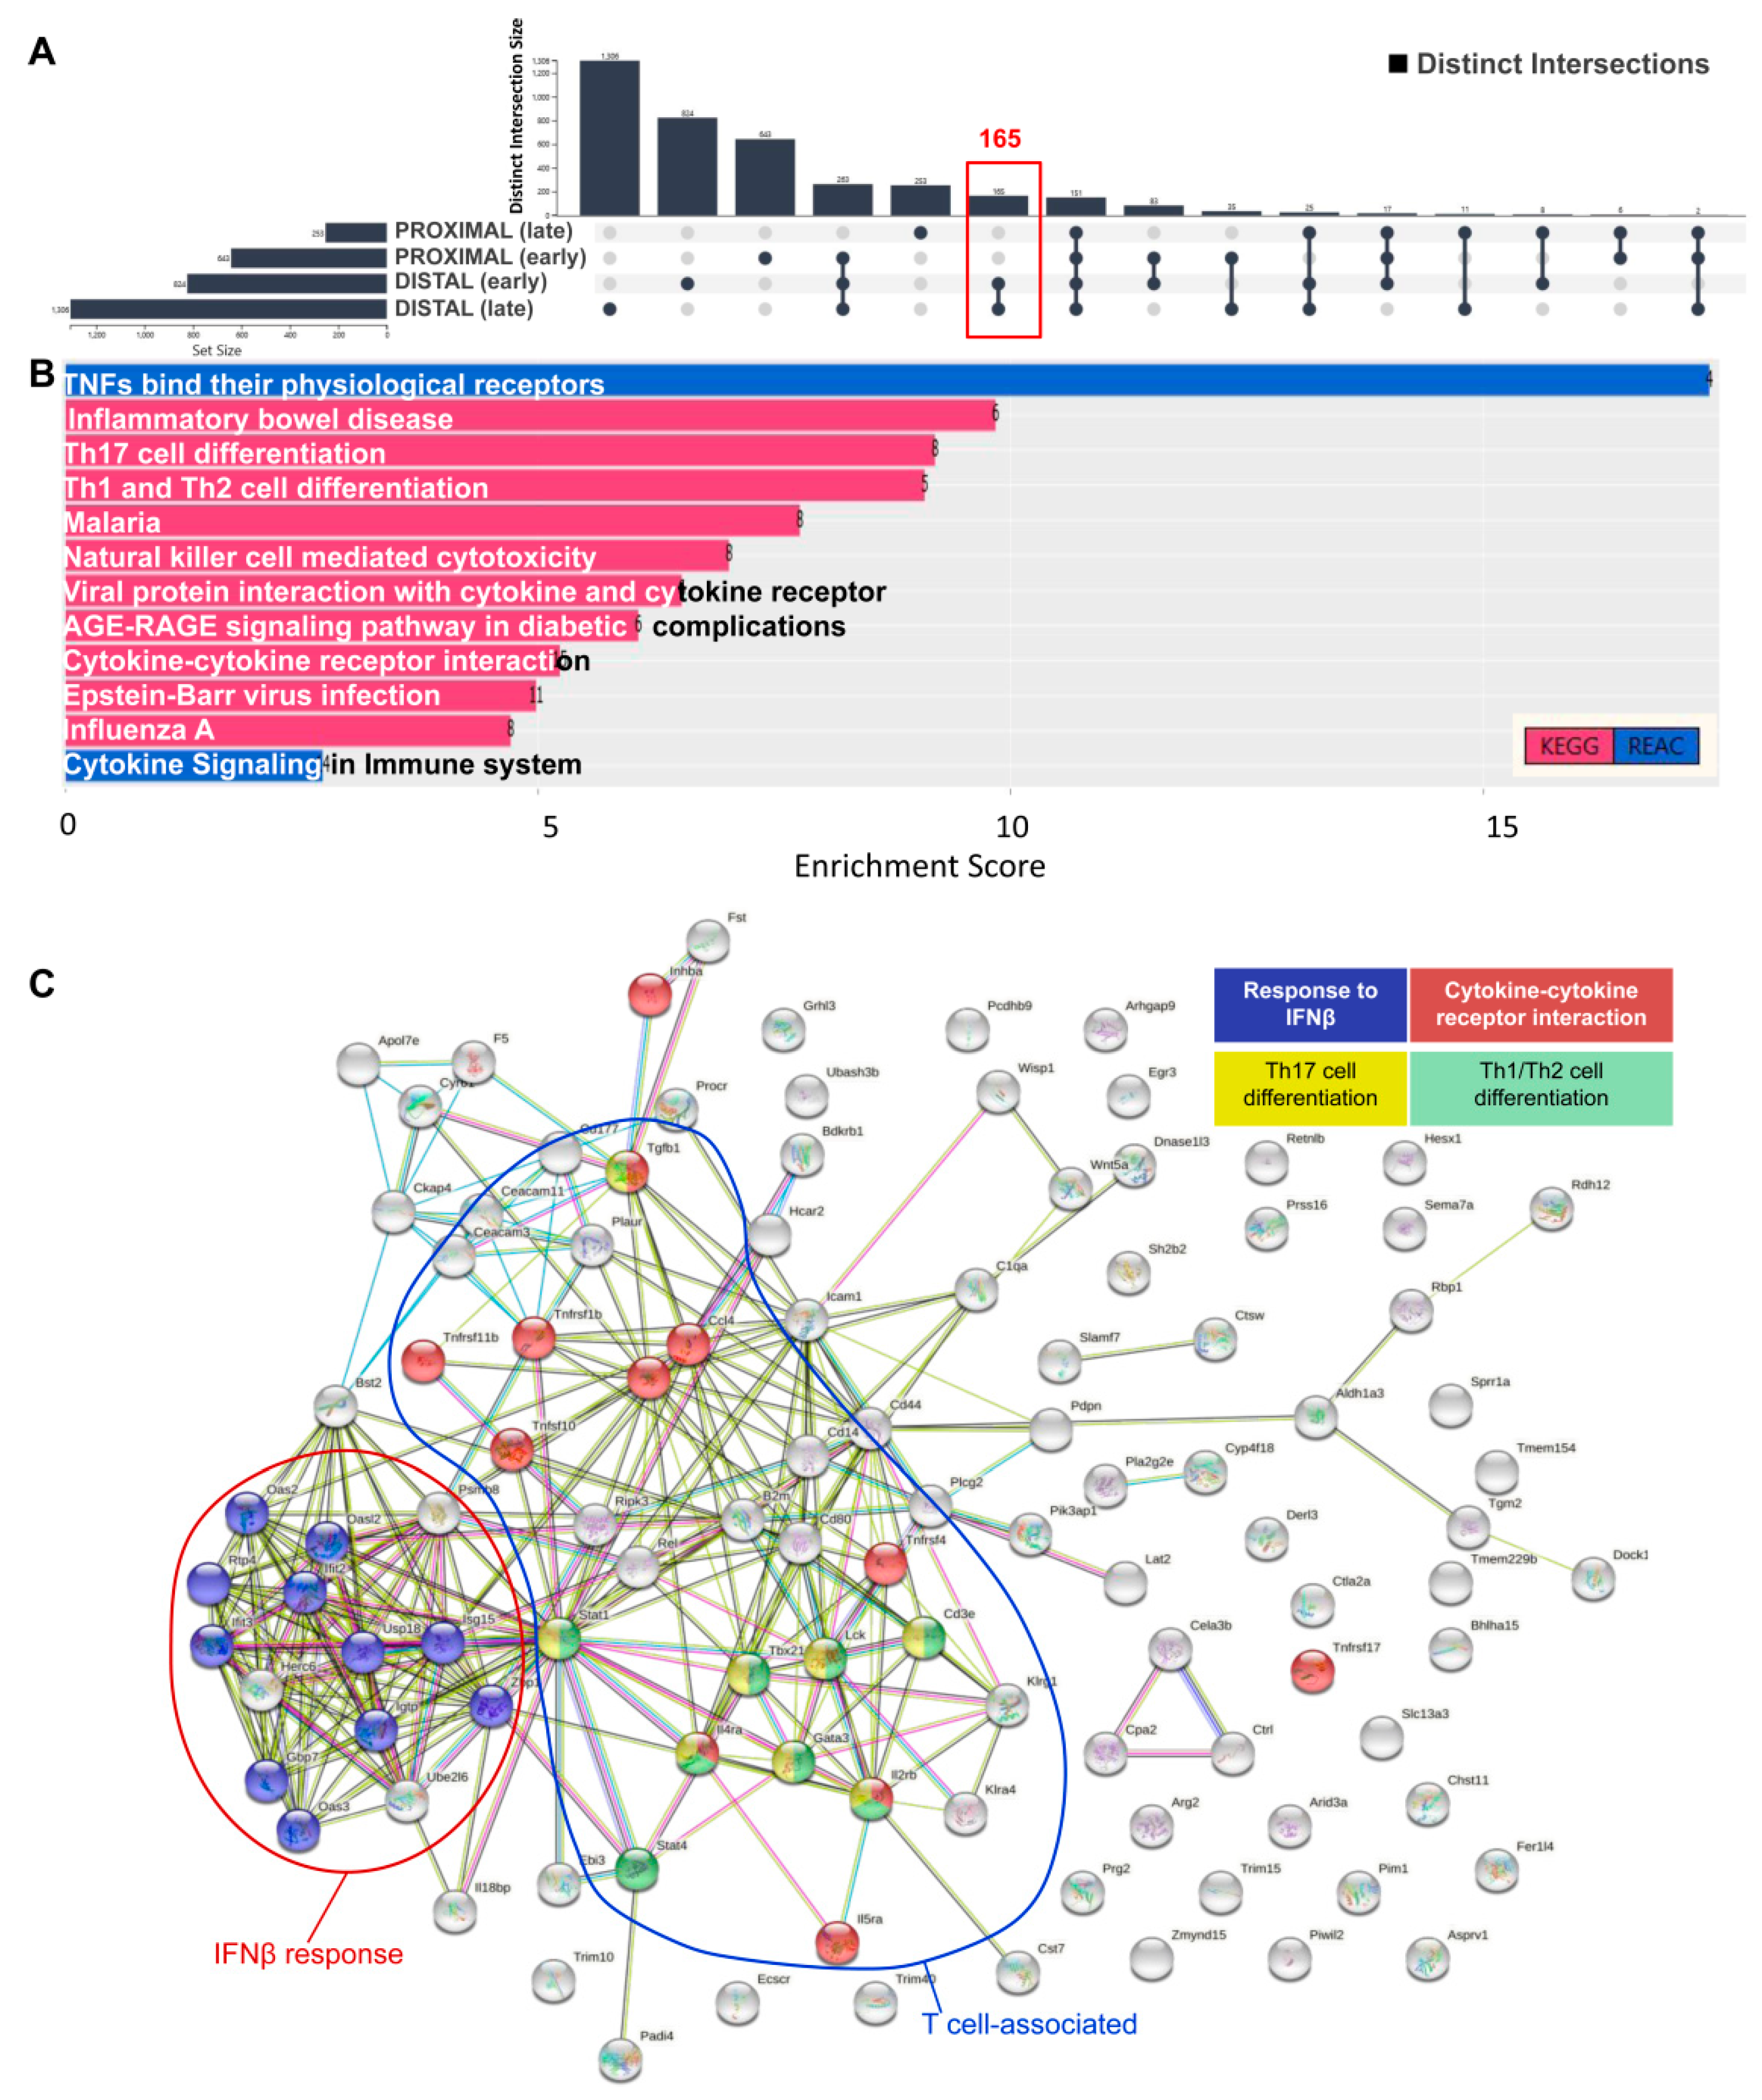
3. Results and Discussion
4. Conclusions
Supplementary Materials
Author Contributions
Funding
Institutional Review Board Statement
Informed Consent Statement
Data Availability Statement
Conflicts of Interest
References
- Maleki, F.; Ovens, K.; Hogan, D.J.; Kusalik, A.J. Gene Set Analysis: Challenges, Opportunities, and Future Research. Front. Genet. 2020, 11, 654. [Google Scholar] [CrossRef]
- Shi-Jing, L.; Fathiah-Muzaffar-Shah, F.; Saberi-Mohamad, M.; Moorthy, K.; Deris, S.; Zakaria, Z.; Napis, S. A Review on Bioinformatics Enrichment Analysis Tools Towards Functional Analysis of High Throughput Gene Set Data. Curr. Proteom. 2015, 12, 14–27. [Google Scholar] [CrossRef]
- Raudvere, U.; Kolberg, L.; Kuzmin, I.; Arak, T.; Adler, P.; Peterson, H.; Vilo, J. G:Profiler: A Web Server for Functional Enrichment Analysis and Conversions of Gene Lists (2019 Update). Nucleic Acids Res. 2019, 47, W191–W198. [Google Scholar] [CrossRef] [Green Version]
- Mi, H.; Muruganujan, A.; Casagrande, J.T.; Thomas, P.D. Large-Scale Gene Function Analysis with the PANTHER Classification System. Nat. Protoc. 2013, 8, 1551–1566. [Google Scholar] [CrossRef] [PubMed]
- Huang, D.W.; Sherman, B.T.; Lempicki, R.A. Systematic and Integrative Analysis of Large Gene Lists Using DAVID Bioinformatics Resources. Nat. Protoc. 2009, 4, 44–57. [Google Scholar] [CrossRef] [PubMed]
- Wang, J.; Vasaikar, S.; Shi, Z.; Greer, M.; Zhang, B. WebGestalt 2017: A More Comprehensive, Powerful, Flexible and Interactive Gene Set Enrichment Analysis Toolkit. Nucleic Acids Res. 2017, 45, W130–W137. [Google Scholar] [CrossRef] [PubMed]
- Chen, E.Y.; Tan, C.M.; Kou, Y.; Duan, Q.; Wang, Z.; Meirelles, G.V.; Clark, N.R.; Ma’ayan, A. Enrichr: Interactive and Collaborative HTML5 Gene List Enrichment Analysis Tool. BMC Bioinform. 2013, 14, 128. [Google Scholar] [CrossRef] [Green Version]
- Carbon, S.; Ireland, A.; Mungall, C.J.; Shu, S.; Marshall, B.; Lewis, S. AmiGO Hub, Web Presence Working Group AmiGO: Online Access to Ontology and Annotation Data. Bioinformatics 2009, 25, 288–289. [Google Scholar] [CrossRef]
- Subhash, S.; Kanduri, C. GeneSCF: A Real-Time Based Functional Enrichment Tool with Support for Multiple Organisms. BMC Bioinform. 2016, 17, 365. [Google Scholar] [CrossRef] [Green Version]
- Zhang, D.; Hu, Q.; Liu, X.; Zou, K.; Sarkodie, E.K.; Liu, X.; Gao, F. AllEnricher: A Comprehensive Gene Set Function Enrichment Tool for Both Model and Non-Model Species. BMC Bioinform. 2020, 21, 106. [Google Scholar] [CrossRef] [Green Version]
- Schölz, C.; Lyon, D.; Refsgaard, J.C.; Jensen, L.J.; Choudhary, C.; Weinert, B.T. Avoiding Abundance Bias in the Functional Annotation of Post-Translationally Modified Proteins. Nat. Methods 2015, 12, 1003–1004. [Google Scholar] [CrossRef]
- Bindea, G.; Mlecnik, B.; Hackl, H.; Charoentong, P.; Tosolini, M.; Kirilovsky, A.; Fridman, W.-H.; Pagès, F.; Trajanoski, Z.; Galon, J. ClueGO: A Cytoscape Plug-in to Decipher Functionally Grouped Gene Ontology and Pathway Annotation Networks. Bioinformatics 2009, 25, 1091–1093. [Google Scholar] [CrossRef] [Green Version]
- Zhou, Y.; Zhou, B.; Pache, L.; Chang, M.; Khodabakhshi, A.H.; Tanaseichuk, O.; Benner, C.; Chanda, S.K. Metascape Provides a Biologist-Oriented Resource for the Analysis of Systems-Level Datasets. Nat. Commun. 2019, 10, 1523. [Google Scholar] [CrossRef]
- Zúñiga-León, E.; Carrasco-Navarro, U.; Fierro, F. NeVOmics: An Enrichment Tool for Gene Ontology and Functional Network Analysis and Visualization of Data from OMICs Technologies. Genes 2018, 9, 569. [Google Scholar] [CrossRef] [PubMed] [Green Version]
- Subramanian, A.; Tamayo, P.; Mootha, V.K.; Mukherjee, S.; Ebert, B.L.; Gillette, M.A.; Paulovich, A.; Pomeroy, S.L.; Golub, T.R.; Lander, E.S.; et al. Gene Set Enrichment Analysis: A Knowledge-Based Approach for Interpreting Genome-Wide Expression Profiles. Proc. Natl. Acad. Sci. USA 2005, 102, 15545–15550. [Google Scholar] [CrossRef] [PubMed] [Green Version]
- Eden, E.; Navon, R.; Steinfeld, I.; Lipson, D.; Yakhini, Z. GOrilla: A Tool for Discovery and Visualization of Enriched GO Terms in Ranked Gene Lists. BMC Bioinform. 2009, 10, 48. [Google Scholar] [CrossRef] [PubMed] [Green Version]
- Weichselbaum, D.; Zagrovic, B.; Polyansky, A.A. Fuento: Functional Enrichment for Bioinformatics. Bioinformatics 2017, 33, 2604–2606. [Google Scholar] [CrossRef]
- Yousif, A.; Drou, N.; Rowe, J.; Khalfan, M.; Gunsalus, K.C. NASQAR: A Web-Based Platform for High-Throughput Sequencing Data Analysis and Visualization. BMC Bioinform. 2020, 21, 267. [Google Scholar] [CrossRef] [PubMed]
- Gene Ontology Consortium. The Gene Ontology (GO) Database and Informatics Resource. Nucleic Acids Res. 2004, 32, D258–D261. [Google Scholar] [CrossRef] [PubMed] [Green Version]
- Kanehisa, M.; Goto, S. KEGG: Kyoto Encyclopedia of Genes and Genomes. Nucleic Acids Res. 2000, 28, 27–30. [Google Scholar] [CrossRef]
- Okuda, S.; Yamada, T.; Hamajima, M.; Itoh, M.; Katayama, T.; Bork, P.; Goto, S.; Kanehisa, M. KEGG Atlas Mapping for Global Analysis of Metabolic Pathways. Nucleic Acids Res. 2008, 36, W423–W426. [Google Scholar] [CrossRef]
- Fabregat, A.; Jupe, S.; Matthews, L.; Sidiropoulos, K.; Gillespie, M.; Garapati, P.; Haw, R.; Jassal, B.; Korninger, F.; May, B.; et al. The Reactome Pathway Knowledgebase. Nucleic Acids Res. 2018, 46, D649–D655. [Google Scholar] [CrossRef] [PubMed]
- Slenter, D.N.; Kutmon, M.; Hanspers, K.; Riutta, A.; Windsor, J.; Nunes, N.; Mélius, J.; Cirillo, E.; Coort, S.L.; Digles, D.; et al. WikiPathways: A Multifaceted Pathway Database Bridging Metabolomics to Other Omics Research. Nucleic Acids Res. 2018, 46, D661–D667. [Google Scholar] [CrossRef]
- Szklarczyk, D.; Franceschini, A.; Wyder, S.; Forslund, K.; Heller, D.; Huerta-Cepas, J.; Simonovic, M.; Roth, A.; Santos, A.; Tsafou, K.P.; et al. STRING V10: Protein-Protein Interaction Networks, Integrated over the Tree of Life. Nucleic Acids Res. 2015, 43, D447–D452. [Google Scholar] [CrossRef] [PubMed]
- Giurgiu, M.; Reinhard, J.; Brauner, B.; Dunger-Kaltenbach, I.; Fobo, G.; Frishman, G.; Montrone, C.; Ruepp, A. CORUM: The Comprehensive Resource of Mammalian Protein Complexes-2019. Nucleic Acids Res. 2019, 47, D559–D563. [Google Scholar] [CrossRef] [PubMed] [Green Version]
- Uhlén, M.; Fagerberg, L.; Hallström, B.M.; Lindskog, C.; Oksvold, P.; Mardinoglu, A.; Sivertsson, Å.; Kampf, C.; Sjöstedt, E.; Asplund, A.; et al. Proteomics. Tissue-Based Map of the Human Proteome. Science 2015, 347, 1260419. [Google Scholar] [CrossRef]
- Matys, V.; Fricke, E.; Geffers, R.; Gössling, E.; Haubrock, M.; Hehl, R.; Hornischer, K.; Karas, D.; Kel, A.E.; Kel-Margoulis, O.V.; et al. TRANSFAC: Transcriptional Regulation, from Patterns to Profiles. Nucleic Acids Res. 2003, 31, 374–378. [Google Scholar] [CrossRef]
- Huang, H.-Y.; Lin, Y.-C.-D.; Li, J.; Huang, K.-Y.; Shrestha, S.; Hong, H.-C.; Tang, Y.; Chen, Y.-G.; Jin, C.-N.; Yu, Y.; et al. MiRTarBase 2020: Updates to the Experimentally Validated MicroRNA–Target Interaction Database. Nucleic Acids Res. 2019, gkz896. [Google Scholar] [CrossRef] [PubMed] [Green Version]
- Robinson, P.N.; Köhler, S.; Bauer, S.; Seelow, D.; Horn, D.; Mundlos, S. The Human Phenotype Ontology: A Tool for Annotating and Analyzing Human Hereditary Disease. Am. J. Hum. Genet. 2008, 83, 610–615. [Google Scholar] [CrossRef] [PubMed] [Green Version]
- UniProt Consortium, T. UniProt: The Universal Protein Knowledgebase. Nucleic Acids Res. 2018, 46, 2699. [Google Scholar] [CrossRef] [PubMed] [Green Version]
- Finn, R.D.; Coggill, P.; Eberhardt, R.Y.; Eddy, S.R.; Mistry, J.; Mitchell, A.L.; Potter, S.C.; Punta, M.; Qureshi, M.; Sangrador-Vegas, A.; et al. The Pfam Protein Families Database: Towards a More Sustainable Future. Nucleic Acids Res. 2016, 44, D279–D285. [Google Scholar] [CrossRef] [PubMed]
- Blum, M.; Chang, H.-Y.; Chuguransky, S.; Grego, T.; Kandasaamy, S.; Mitchell, A.; Nuka, G.; Paysan-Lafosse, T.; Qureshi, M.; Raj, S.; et al. The InterPro Protein Families and Domains Database: 20 Years On. Nucleic Acids Res. 2021, 49, D344–D354. [Google Scholar] [CrossRef] [PubMed]
- Pletscher-Frankild, S.; Pallejà, A.; Tsafou, K.; Binder, J.X.; Jensen, L.J. DISEASES: Text Mining and Data Integration of Disease-Gene Associations. Methods 2015, 74, 83–89. [Google Scholar] [CrossRef] [PubMed]
- Zerbino, D.R.; Achuthan, P.; Akanni, W.; Amode, M.R.; Barrell, D.; Bhai, J.; Billis, K.; Cummins, C.; Gall, A.; Girón, C.G.; et al. Ensembl 2018. Nucleic Acids Res. 2018, 46, D754–D761. [Google Scholar] [CrossRef] [PubMed]
- Baker, W. The EMBL Nucleotide Sequence Database. Nucleic Acids Res. 2000, 28, 19–23. [Google Scholar] [CrossRef] [PubMed] [Green Version]
- Gaulton, A.; Bellis, L.J.; Bento, A.P.; Chambers, J.; Davies, M.; Hersey, A.; Light, Y.; McGlinchey, S.; Michalovich, D.; Al-Lazikani, B.; et al. ChEMBL: A Large-Scale Bioactivity Database for Drug Discovery. Nucleic Acids Res. 2012, 40, D1100–D1107. [Google Scholar] [CrossRef] [Green Version]
- Hoffmann, R. A Wiki for the Life Sciences Where Authorship Matters. Nat. Genet. 2008, 40, 1047–1051. [Google Scholar] [CrossRef]
- O’Leary, N.A.; Wright, M.W.; Brister, J.R.; Ciufo, S.; Haddad, D.; McVeigh, R.; Rajput, B.; Robbertse, B.; Smith-White, B.; Ako-Adjei, D.; et al. Reference Sequence (RefSeq) Database at NCBI: Current Status, Taxonomic Expansion, and Functional Annotation. Nucleic Acids Res. 2016, 44, D733–D745. [Google Scholar] [CrossRef] [Green Version]
- Baltoumas, F.A.; Zafeiropoulou, S.; Karatzas, E.; Paragkamian, S.; Thanati, F.; Iliopoulos, I.; Eliopoulos, A.G.; Schneider, R.; Jensen, L.J.; Pafilis, E.; et al. OnTheFly 2.0: A Text.-Mining Web Application for Automated Biomedical Entity Recognition, Document Annotation, Network and Functional Enrichment Analysis. bioRxiv 2021. [Google Scholar] [CrossRef]
- Pafilis, E.; Buttigieg, P.L.; Ferrell, B.; Pereira, E.; Schnetzer, J.; Arvanitidis, C.; Jensen, L.J. EXTRACT: Interactive Extraction of Environment Metadata and Term Suggestion for Metagenomic Sample Annotation. Database 2016, 2016. [Google Scholar] [CrossRef] [Green Version]
- Pafilis, E.; Jensen, L.J. Real-Time Tagging of Biomedical Entities. bioRxiv 2016, 078469. [Google Scholar] [CrossRef]
- Koutrouli, M.; Hatzis, P.; Pavlopoulos, G.A. Exploring Networks in the STRING and Reactome Database. In Systems Medicine; Wolkenhauer, O., Ed.; Academic Press: Oxford, UK, 2021; pp. 507–520. ISBN 978-0-12-816078-7. [Google Scholar]
- Koutrouli, M.; Karatzas, E.; Paez-Espino, D.; Pavlopoulos, G.A. A Guide to Conquer the Biological Network Era Using Graph Theory. Front. Bioeng. Biotechnol. 2020, 8, 34. [Google Scholar] [CrossRef]
- Pavlopoulos, G.A.; Wegener, A.-L.; Schneider, R. A Survey of Visualization Tools for Biological Network Analysis. BioData Min. 2008, 1, 12. [Google Scholar] [CrossRef] [Green Version]
- O’Donoghue, S.I.; Gavin, A.-C.; Gehlenborg, N.; Goodsell, D.S.; Hériché, J.-K.; Nielsen, C.B.; North, C.; Olson, A.J.; Procter, J.B.; Shattuck, D.W.; et al. Visualizing Biological Data-Now and in the Future. Nat. Methods 2010, 7, S2–S4. [Google Scholar] [CrossRef]
- Kolberg, L.; Raudvere, U.; Kuzmin, I.; Vilo, J.; Peterson, H. Gprofiler2—An R Package for Gene List Functional Enrichment Analysis and Namespace Conversion Toolset g:Profiler. F1000Res 2020, 9. [Google Scholar] [CrossRef]
- Csardi, T.; Nepusz, T. The Igraph Software Package for Complex Network Research. InterJournal Complex. Syst. 2006, 1695, 1–9. [Google Scholar]
- Sievert, C. Interactive Web-Based Data Visualization with R, Plotly, and Shiny; CRC Press/Taylor and Francis Group: Boca Raton, FL, USA, 2020; ISBN 978-1-138-33149-5. [Google Scholar]
- Wickham, H. Ggplot2: Elegant Graphics for Data Analysis, Use R! 2nd ed.; Springer: Cham, Switzerland, 2016; ISBN 978-3-319-24277-4. [Google Scholar]
- Galili, T.; O’Callaghan, A.; Sidi, J.; Sievert, C. Heatmaply: An R Package for Creating Interactive Cluster Heatmaps for Online Publishing. Bioinformatics 2018, 34, 1600–1602. [Google Scholar] [CrossRef]
- Gkouskou, K.K.; Ioannou, M.; Pavlopoulos, G.A.; Georgila, K.; Siganou, A.; Nikolaidis, G.; Kanellis, D.C.; Moore, S.; Papadakis, K.A.; Kardassis, D.; et al. Apolipoprotein A-I Inhibits Experimental Colitis and Colitis-Propelled Carcinogenesis. Oncogene 2016, 35, 2496–2505. [Google Scholar] [CrossRef]
- Grivennikov, S.I. Inflammation and Colorectal Cancer: Colitis-Associated Neoplasia. Semin. Immunopathol. 2013, 35, 229–244. [Google Scholar] [CrossRef]
- Harbour, S.N.; Maynard, C.L.; Zindl, C.L.; Schoeb, T.R.; Weaver, C.T. Th17 Cells Give Rise to Th1 Cells That Are Required for the Pathogenesis of Colitis. Proc. Natl. Acad. Sci. USA 2015, 112, 7061–7066. [Google Scholar] [CrossRef] [PubMed] [Green Version]
- Perez, L.G.; Kempski, J.; McGee, H.M.; Pelzcar, P.; Agalioti, T.; Giannou, A.; Konczalla, L.; Brockmann, L.; Wahib, R.; Xu, H.; et al. TGF-β Signaling in Th17 Cells Promotes IL-22 Production and Colitis-Associated Colon Cancer. Nat. Commun. 2020, 11, 2608. [Google Scholar] [CrossRef] [PubMed]
- Dieleman, L.A.; Palmen, M.J.; Akol, H.; Bloemena, E.; Peña, A.S.; Meuwissen, S.G.; Van Rees, E.P. Chronic Experimental Colitis Induced by Dextran Sulphate Sodium (DSS) Is Characterized by Th1 and Th2 Cytokines. Clin. Exp. Immunol. 1998, 114, 385–391. [Google Scholar] [CrossRef]
- Osawa, E.; Nakajima, A.; Fujisawa, T.; Kawamura, Y.I.; Toyama-Sorimachi, N.; Nakagama, H.; Dohi, T. Predominant T Helper Type 2-Inflammatory Responses Promote Murine Colon Cancers. Int. J. Cancer 2006, 118, 2232–2236. [Google Scholar] [CrossRef] [PubMed]
- Vlantis, K.; Wullaert, A.; Polykratis, A.; Kondylis, V.; Dannappel, M.; Schwarzer, R.; Welz, P.; Corona, T.; Walczak, H.; Weih, F.; et al. NEMO Prevents RIP Kinase 1-Mediated Epithelial Cell Death and Chronic Intestinal Inflammation by NF-ΚB-Dependent and -Independent Functions. Immunity 2016, 44, 553–567. [Google Scholar] [CrossRef] [PubMed] [Green Version]
- McElrath, C.; Espinosa, V.; Lin, J.-D.; Peng, J.; Sridhar, R.; Dutta, O.; Tseng, H.-C.; Smirnov, S.V.; Risman, H.; Sandoval, M.J.; et al. Critical Role of Interferons in Gastrointestinal Injury Repair. Nat. Commun. 2021, 12, 2624. [Google Scholar] [CrossRef] [PubMed]
- Means, A.L.; Freeman, T.J.; Zhu, J.; Woodbury, L.G.; Marincola-Smith, P.; Wu, C.; Meyer, A.R.; Weaver, C.J.; Padmanabhan, C.; An, H.; et al. Epithelial Smad4 Deletion Up-Regulates Inflammation and Promotes Inflammation-Associated Cancer. Cell Mol. Gastroenterol. Hepatol. 2018, 6, 257–276. [Google Scholar] [CrossRef] [Green Version]
- Troncone, E.; Marafini, I.; Stolfi, C.; Monteleone, G. Transforming Growth Factor-Β1/Smad7 in Intestinal Immunity, Inflammation, and Cancer. Front. Immunol. 2018, 9, 1407. [Google Scholar] [CrossRef] [PubMed]


Publisher’s Note: MDPI stays neutral with regard to jurisdictional claims in published maps and institutional affiliations. |
© 2021 by the authors. Licensee MDPI, Basel, Switzerland. This article is an open access article distributed under the terms and conditions of the Creative Commons Attribution (CC BY) license (https://creativecommons.org/licenses/by/4.0/).
Share and Cite
Thanati, F.; Karatzas, E.; Baltoumas, F.A.; Stravopodis, D.J.; Eliopoulos, A.G.; Pavlopoulos, G.A. FLAME: A Web Tool for Functional and Literature Enrichment Analysis of Multiple Gene Lists. Biology 2021, 10, 665. https://doi.org/10.3390/biology10070665
Thanati F, Karatzas E, Baltoumas FA, Stravopodis DJ, Eliopoulos AG, Pavlopoulos GA. FLAME: A Web Tool for Functional and Literature Enrichment Analysis of Multiple Gene Lists. Biology. 2021; 10(7):665. https://doi.org/10.3390/biology10070665
Chicago/Turabian StyleThanati, Foteini, Evangelos Karatzas, Fotis A. Baltoumas, Dimitrios J. Stravopodis, Aristides G. Eliopoulos, and Georgios A. Pavlopoulos. 2021. "FLAME: A Web Tool for Functional and Literature Enrichment Analysis of Multiple Gene Lists" Biology 10, no. 7: 665. https://doi.org/10.3390/biology10070665