
Early Diagnosis of Alzheimer’s Disease Using Cerebral Catheter Angiogram Neuroimaging: A Novel Model Based on Deep Learning Approaches

 , , ,
, , ,  ,
,
Abstract
:1. Introduction
2. Background and Literature Review
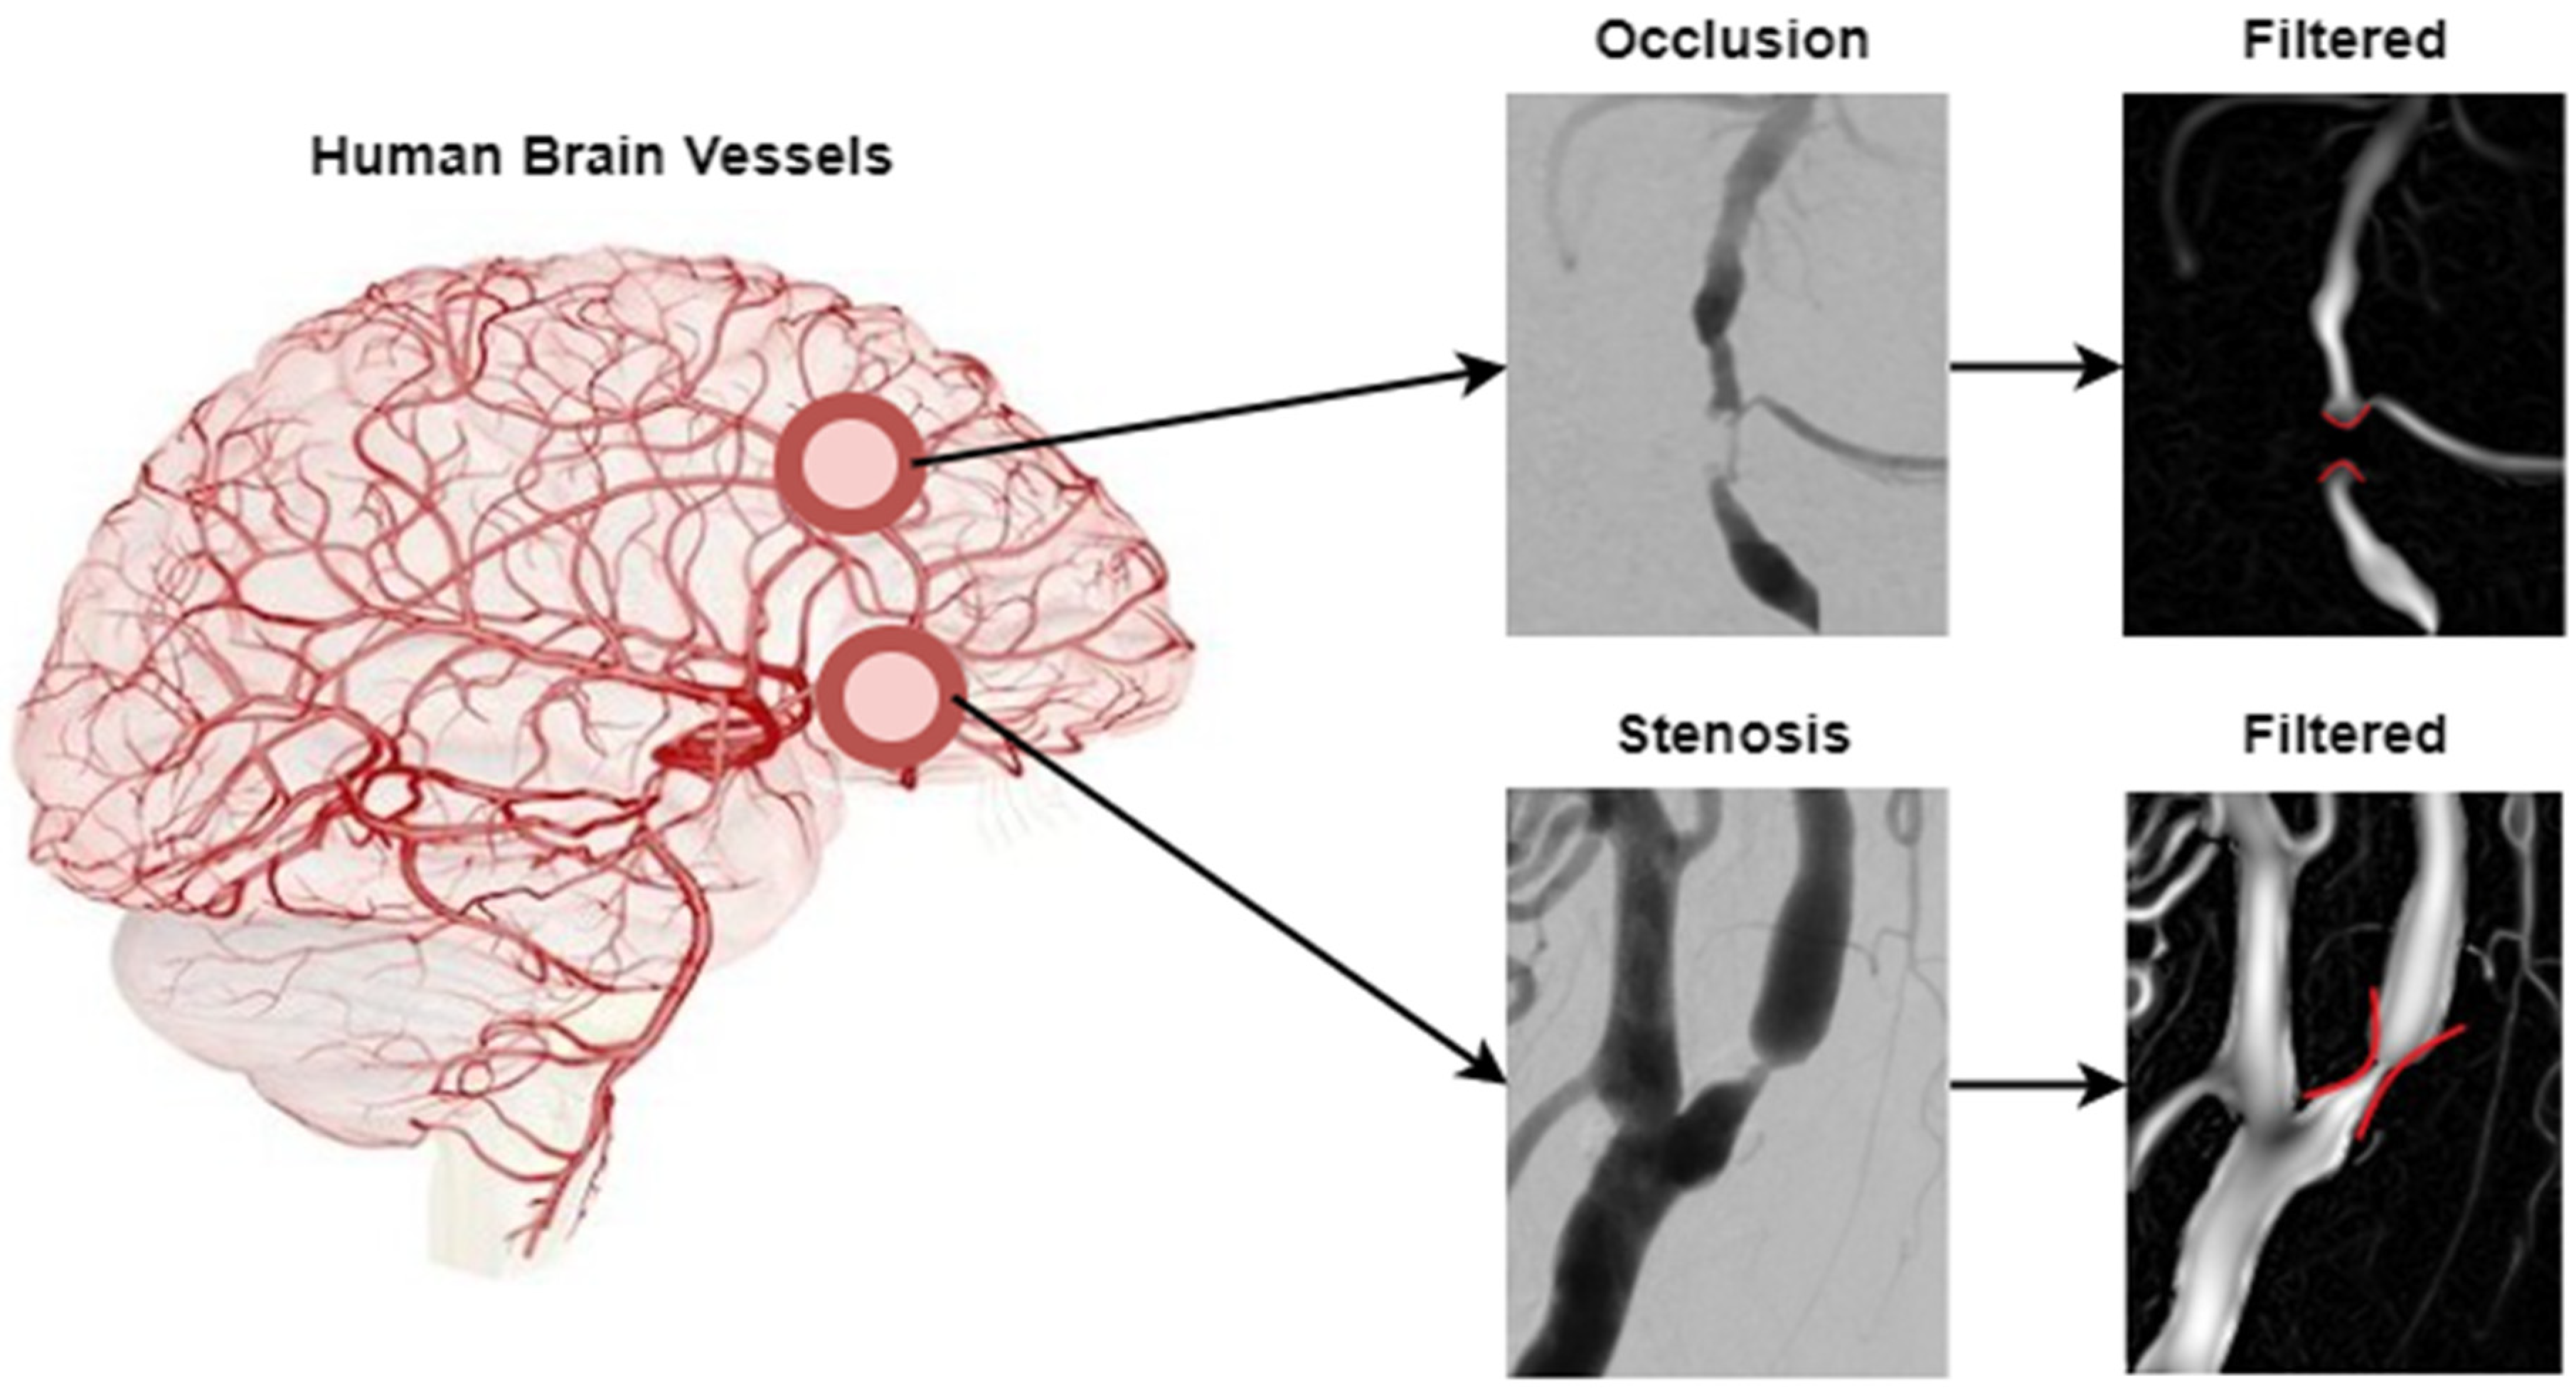
2.1. Background
2.2. Literature Review
2.2.1. Classical Machine Learning-Based Methods
2.2.2. Deep Learning-Based Methods
3. Methodology
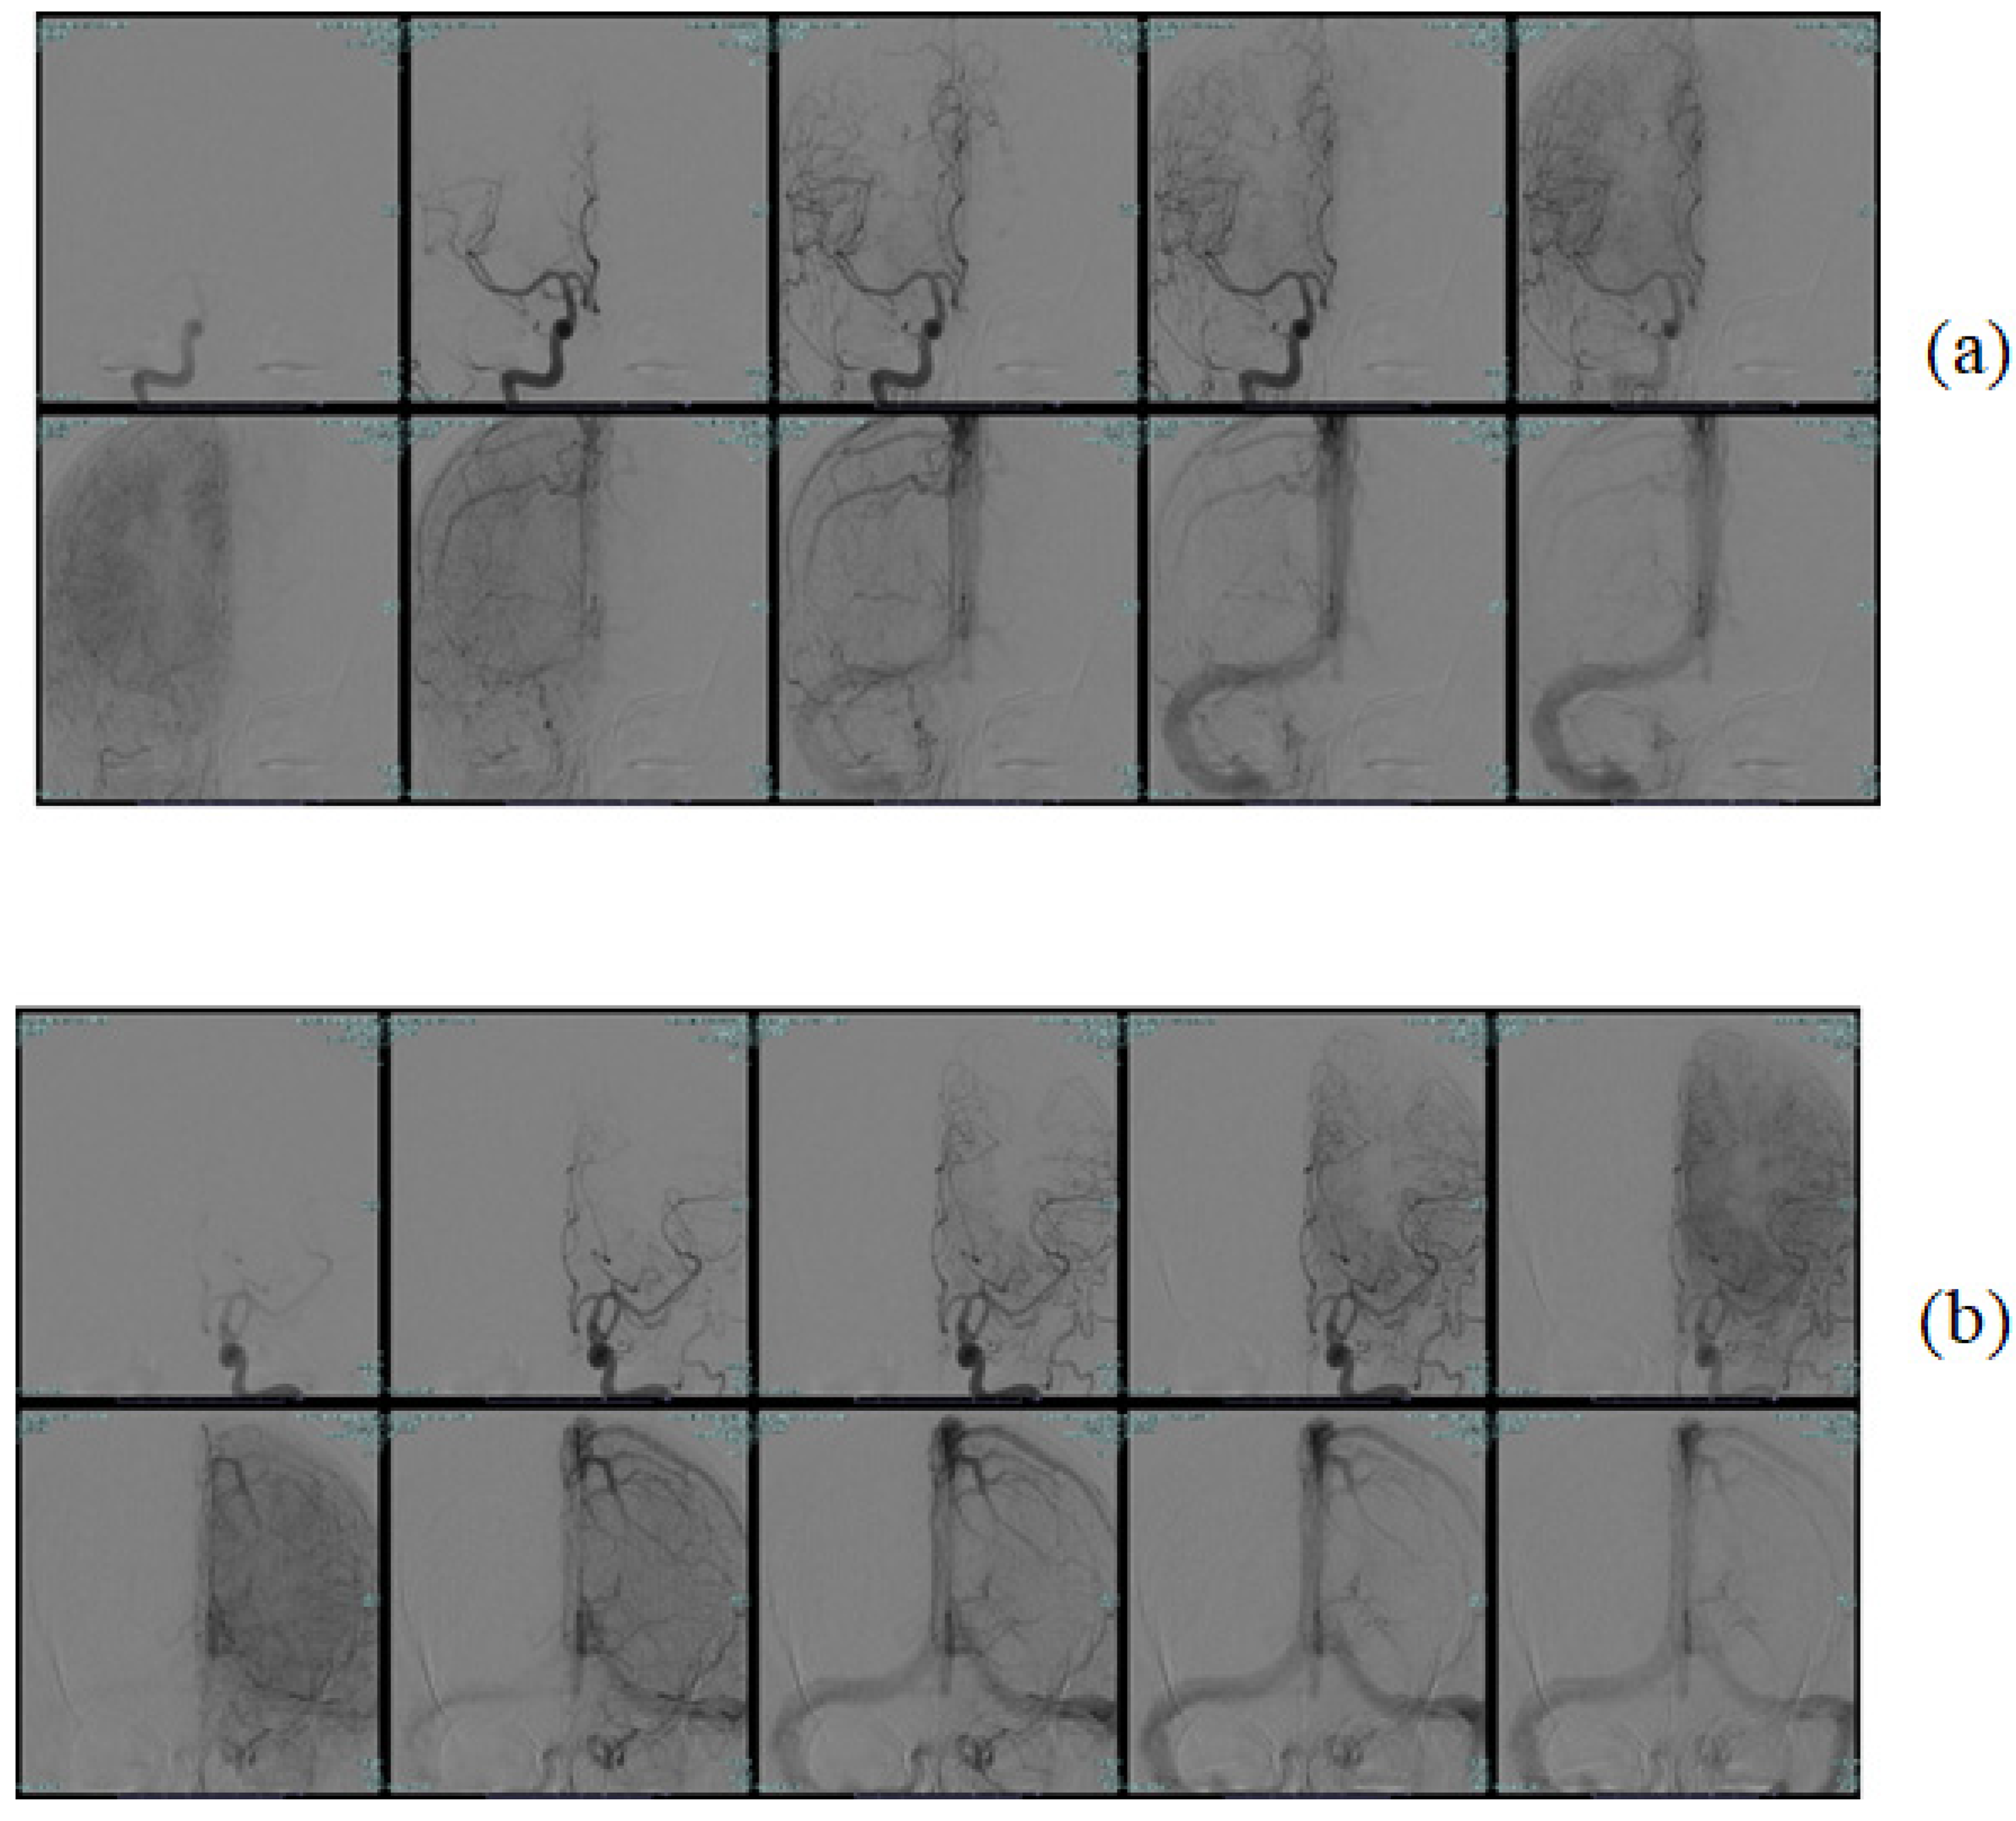
3.1. Dataset Used
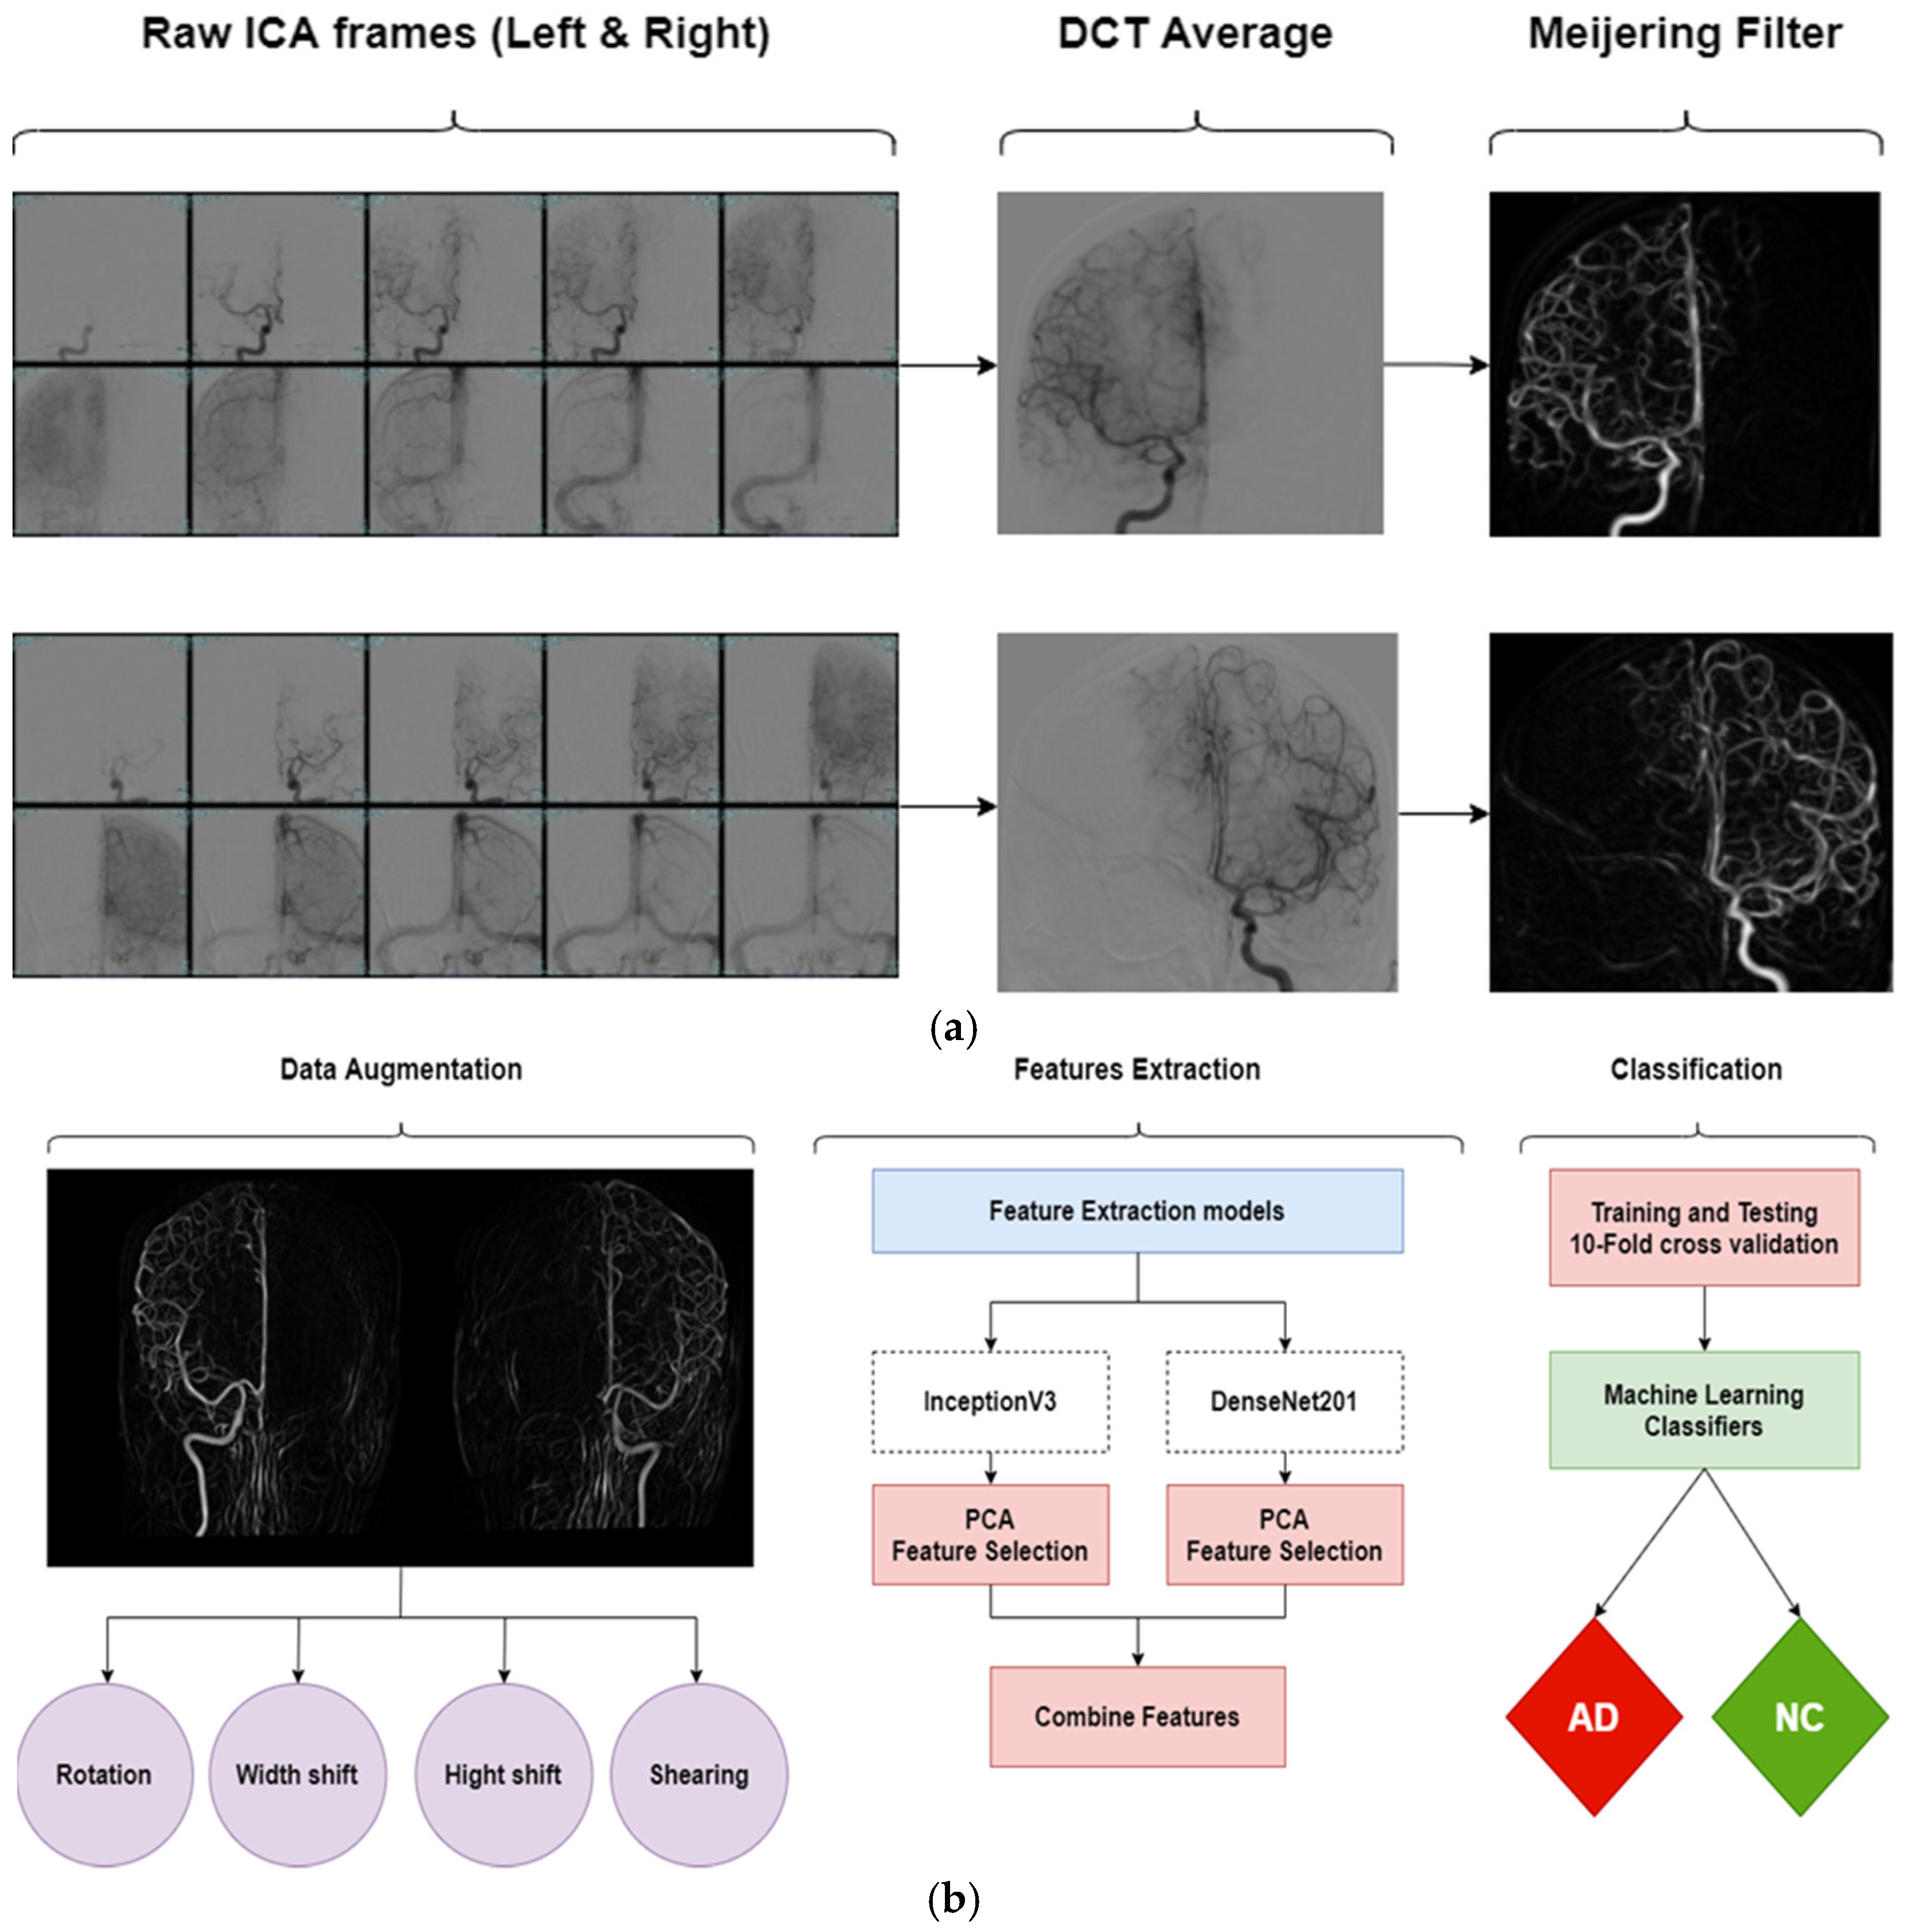
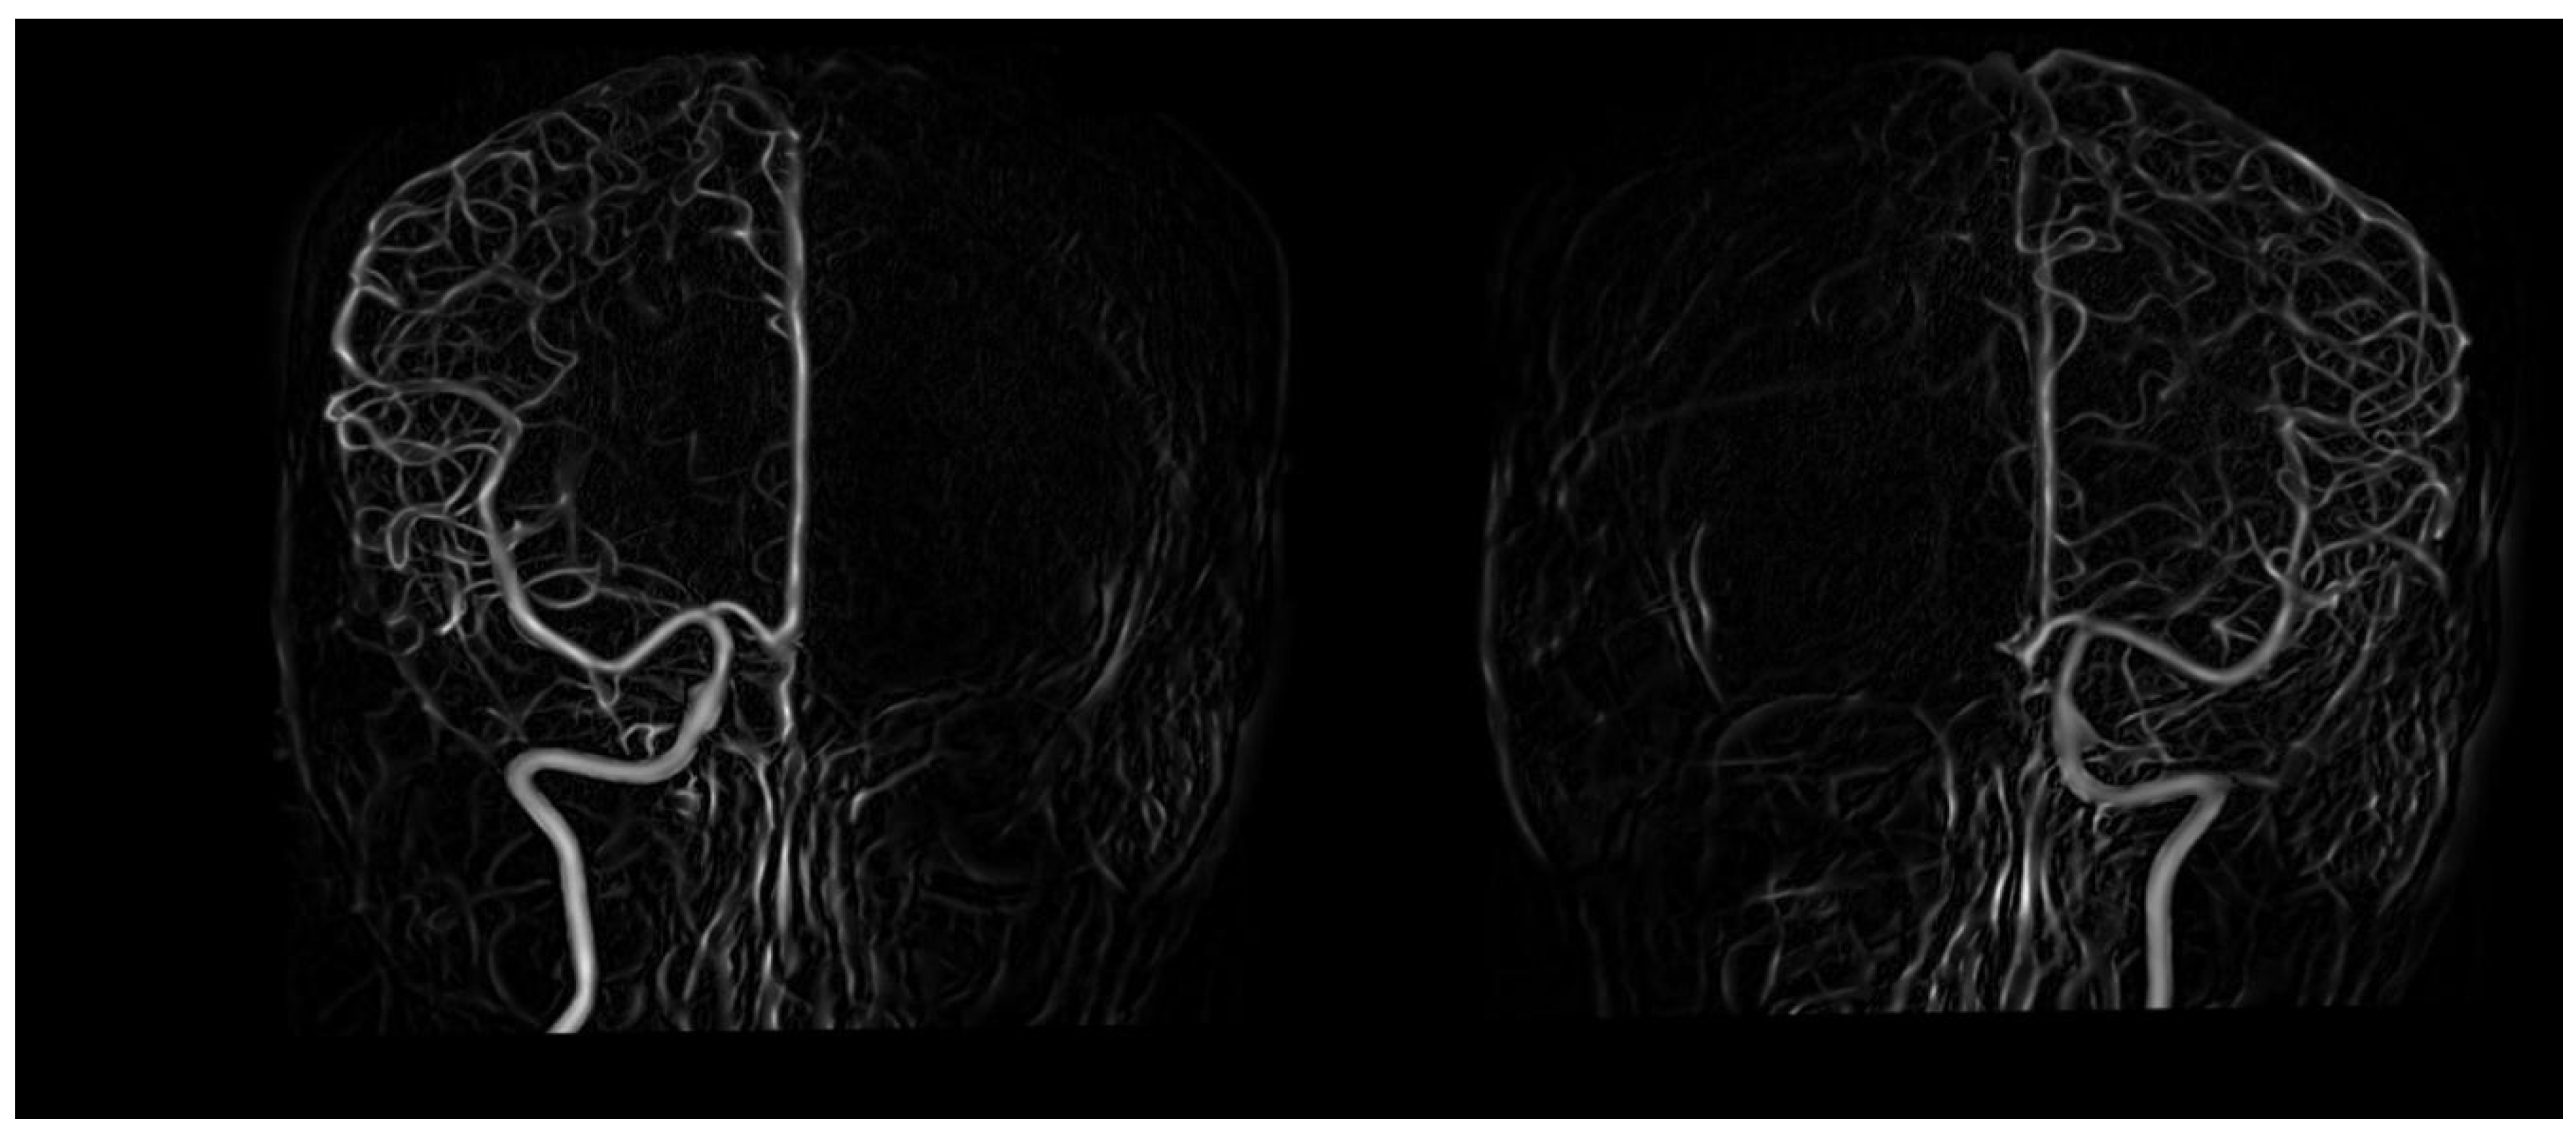
3.2. Preprocessing and Augmentation
3.3. Proposed Framework
- 1.
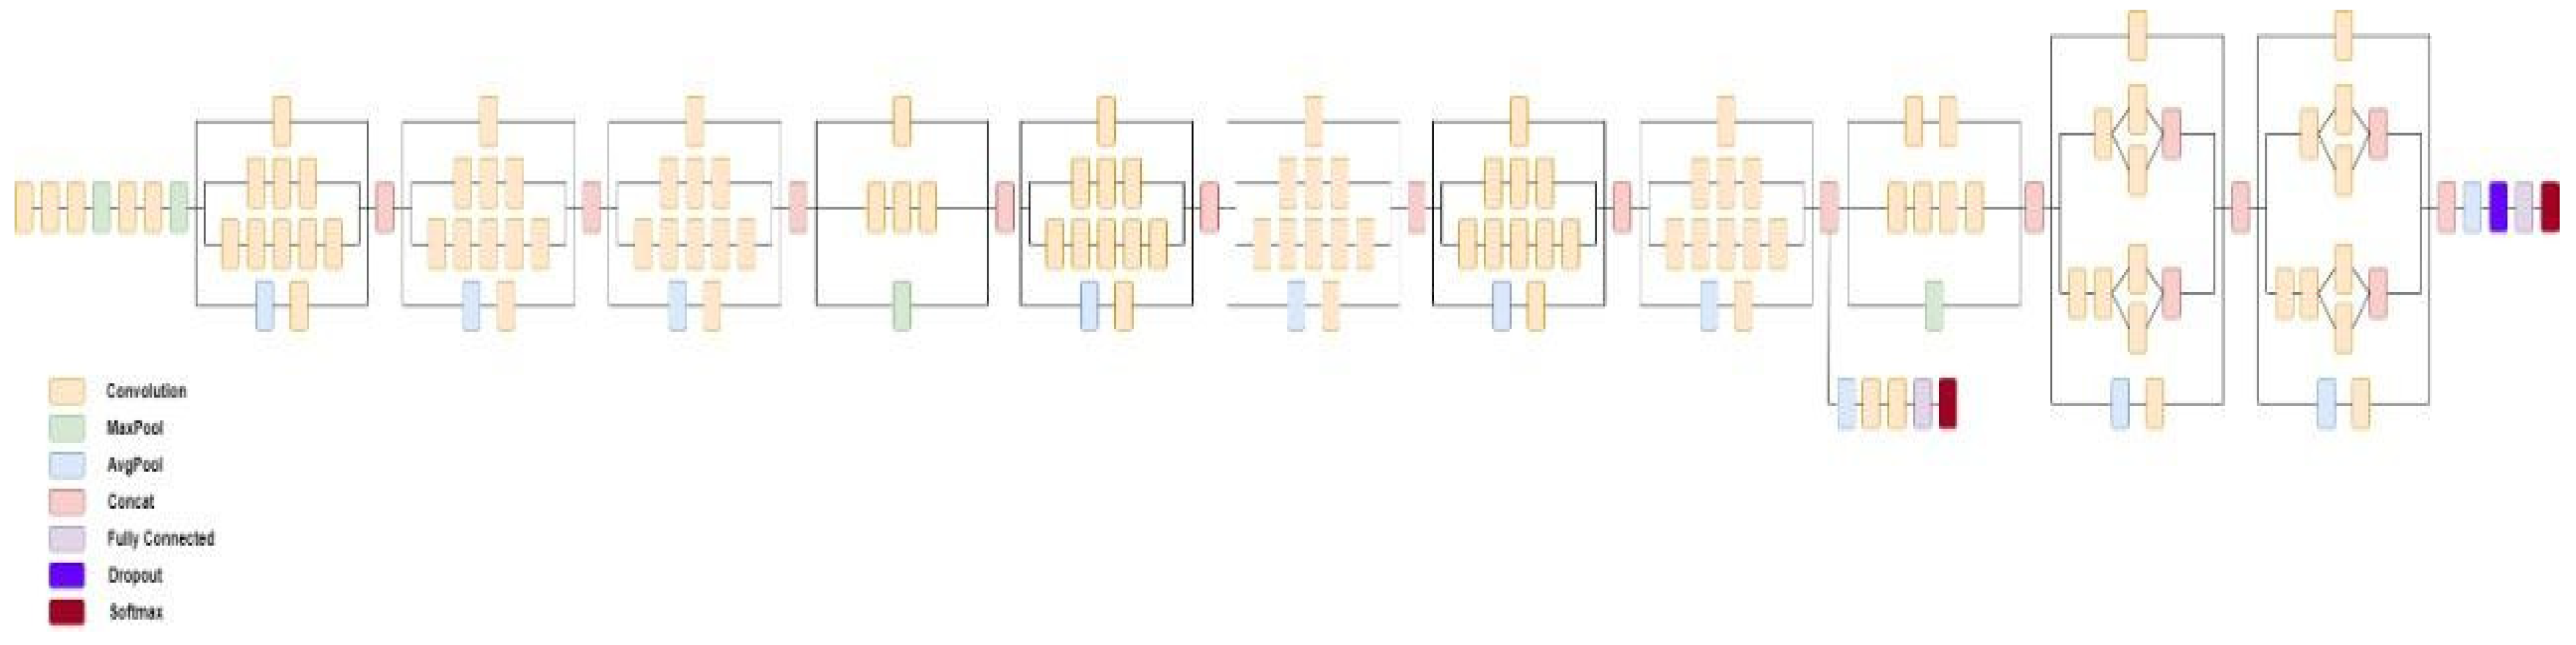
- InceptionV3: The third version of GoogleNet, a CNN architecture released in 2015 by Google [68]. It has won the ILSVRC championship in 2015 and improving the Top-1 performance by 15% using 92 MB of parameters. InceptionV3 uses 48 layers of neural networks with 23,851,784 parameters and 159 depth size. The network has an image input size of 299 × 299, and it has learned rich feature representations for a wide range of images. Figure 6 shows the main architecture of the InceptionV3 model.
- 2.
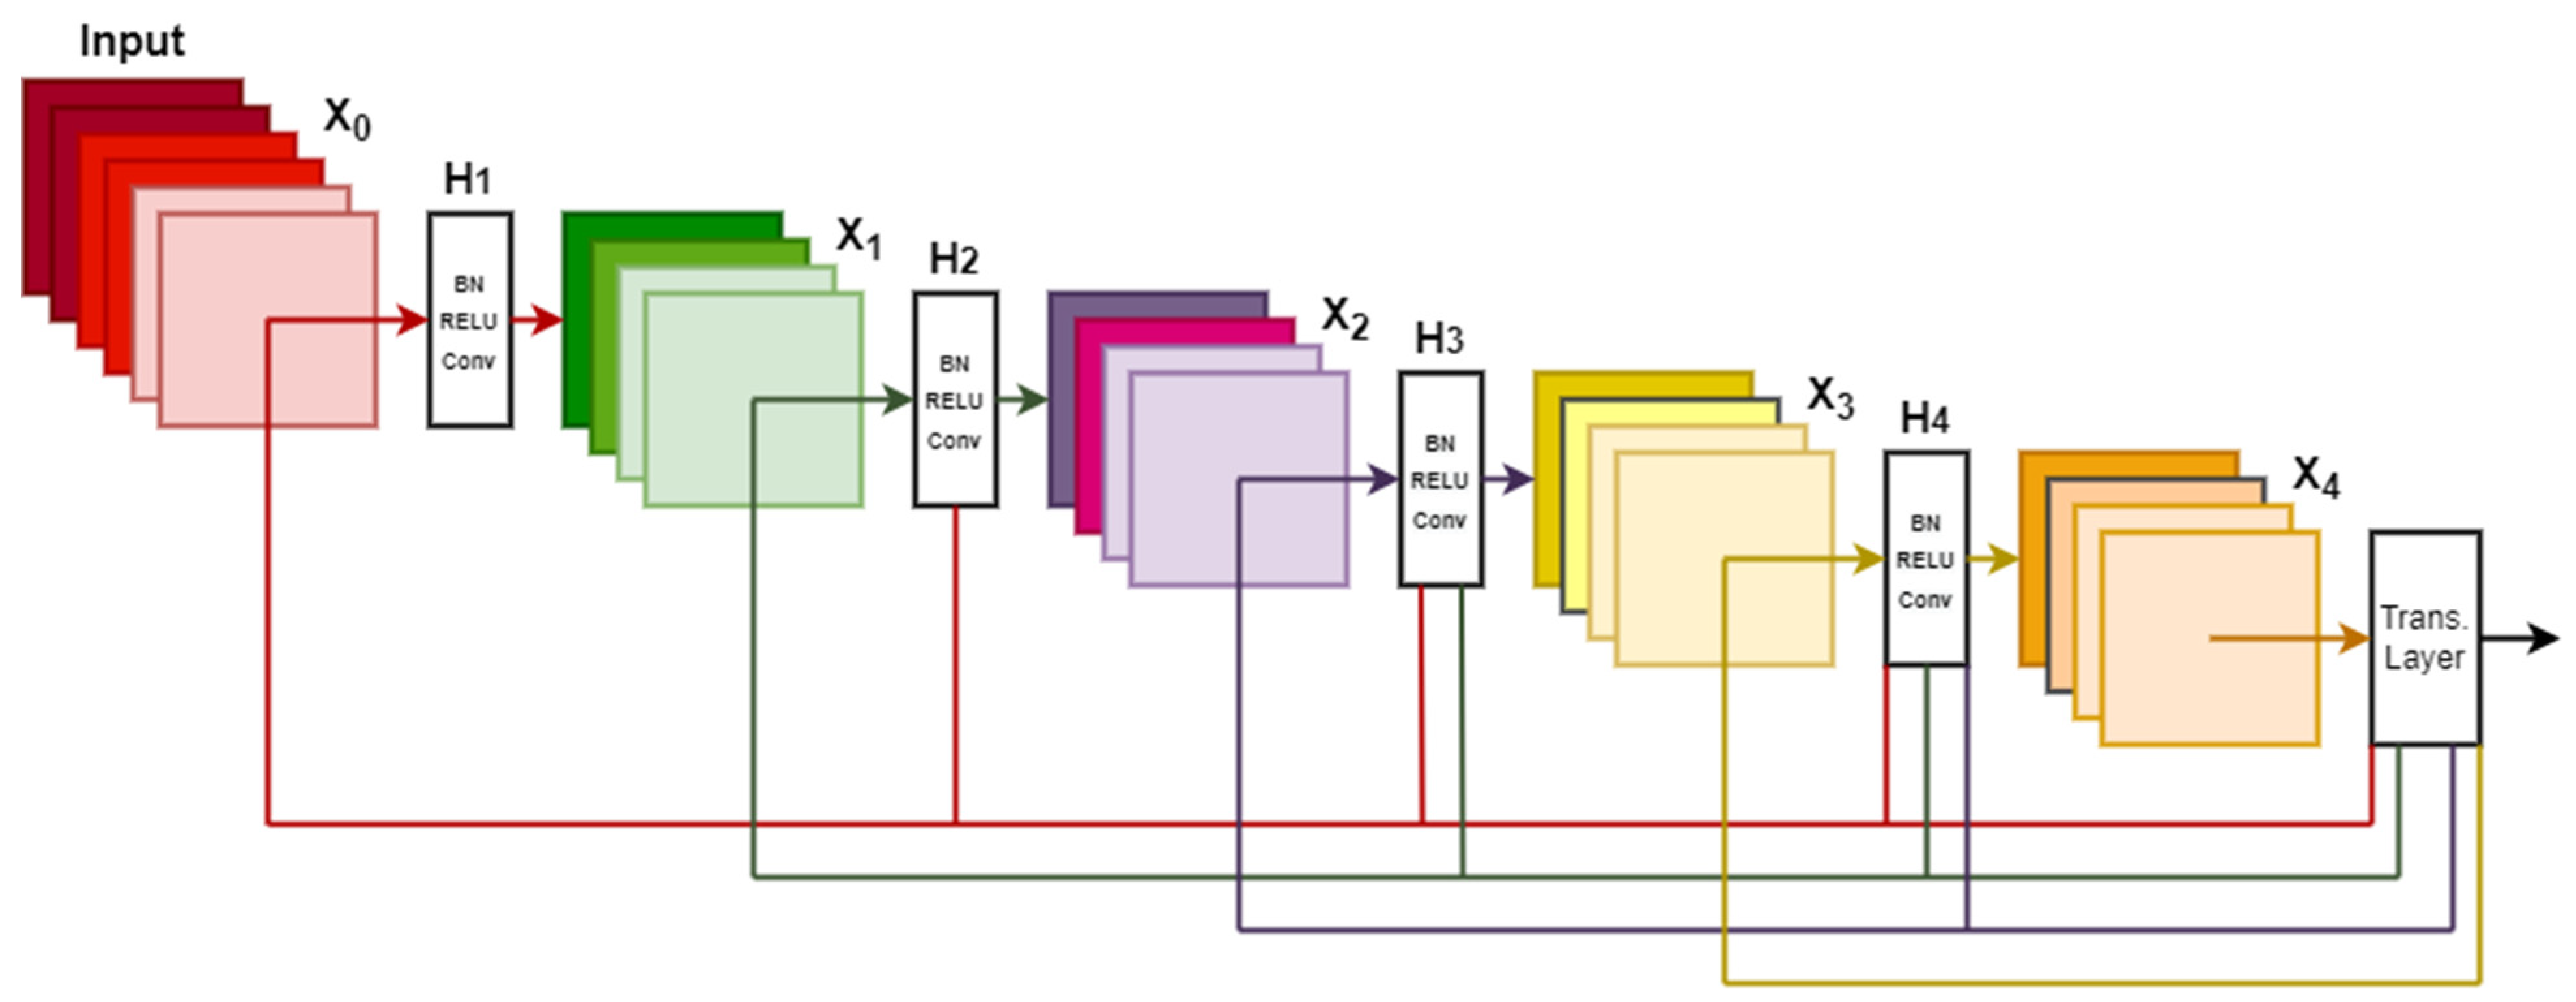
- DenseNet201: The third version of densely connected convolutional networks (DenseNet), a CNN architecture released in 2017 CVPR and jointly invented by Cornwell University, Tsinghua University, and Facebook AI Research (FAIR) [69,77]. It is improving the Top-1 performance by 77.3% using 80 MB of parameters. DenseNet-201 uses 201 layers of neural networks with 20,242,984 parameters. The network has an image input size of 224 × 224 and has learned rich feature representations for a wide range of images. Figure 7 shows the main architecture of the DenseNet201 model.
4. Experimental Results
4.1. Experiments
4.2. Results
4.3. Comparison with Previous Works
5. Conclusions and Future Work
Author Contributions
Funding
Institutional Review Board Statement
Informed Consent Statement
Data Availability Statement
Acknowledgments
Conflicts of Interest
References
- Leone, M.; Cecchini, A.P.; Mea, E.; Tullo, V.; Curone, M.; Bussone, G. Neuroimaging and pain: A window on the autonomic nervous system. Neurol. Sci. 2006, 27, s134–s137. [Google Scholar] [CrossRef]
- Camprodon, J.A.; Stern, T.A. Selecting neuroimaging techniques: A review for the clinician. Australas. Psychiatry 2013. [Google Scholar] [CrossRef] [Green Version]
- Zhang, Z.; Sejdić, E. Radiological images and machine learning: Trends, perspectives, and prospects. Comput. Biol. Med. 2019, 108, 354–370. [Google Scholar] [CrossRef] [PubMed] [Green Version]
- Taboada-Crispi, A.; Sahli, H.; Hernandez-Pacheco, D.; Falcon-Ruiz, A. Anomaly detection in medical image analysis. In Handbook of Research on Advanced Techniques in Diagnostic Imaging and Biomedical Applications; IGI Global: Hershey, PA, USA, 2009; pp. 426–446. [Google Scholar]
- Klöppel, S.; Abdulkadir, A.; Jack, C.R., Jr.; Koutsouleris, N.; Mourão-Miranda, J.; Vemuri, P. Diagnostic neuroimaging across diseases. Neuroimage 2012, 61, 457–463. [Google Scholar] [CrossRef] [Green Version]
- Bruffaerts, R. Machine learning in neurology: What neurologists can learn from machines and vice versa. J. Neurol. 2018, 265, 2745–2748. [Google Scholar] [CrossRef] [PubMed]
- Li, Q.; Cai, W.; Wang, X.; Zhou, Y.; Feng, D.D.; Chen, M. Medical image classification with convolutional neural network. In Proceedings of the 2014 13th International Conference on Control Automation Robotics & Vision IEEE (ICARCV), Singapore, 10–12 December 2014; pp. 844–848. [Google Scholar]
- Cortes-Canteli, M.; Iadecola, C. Alzheimer’s disease and vascular aging: JACC focus seminar. J. Am. Coll. Cardiol. 2020, 75, 942–951. [Google Scholar] [CrossRef] [PubMed]
- Korte, N.; Nortley, R.; Attwell, D. Cerebral blood flow decrease as an early pathological mechanism in Alzheimer’s disease. Acta Neuropathol. 2020, 40, 793–810. [Google Scholar] [CrossRef] [PubMed]
- Dai, W.; Lopez, O.L.; Carmichael, O.T.; Becker, J.T.; Kuller, L.H.; Gach, H.M. Mild Cognitive Impairment and Alzheimer Disease: Patterns of Altered Cerebral Blood Flow at MR Imaging. Radiology 2009, 250, 856–866. [Google Scholar] [CrossRef] [PubMed]
- Bennett, R.E.; Robbins, A.B.; Hu, M.; Cao, X.; Betensky, R.A.; Clark, T.; Das, S.; Hyman, B.T. Tau induces blood vessel abnormalities and angiogenesis-related gene expression in P301L transgenic mice and human Alzheimer’s disease. Proc. Natl. Acad. Sci. USA 2018, 115, E1289–E1298. [Google Scholar] [CrossRef] [PubMed] [Green Version]
- Decker, Y.; Müller, A.; Németh, E.; Schulz-Schaeffer, W.J.; Fatar, M.; Menger, M.D.; Liu, Y.; Fassbender, K. Analysis of the vasculature by immunohistochemistry in paraffin-embedded brains. Brain Struct. and Funct. 2018, 223, 1001–1015. [Google Scholar] [CrossRef]
- De Strooper, B.; Karran, E. The cellular phase of Alzheimer’s disease. Cell 2016, 164, 603–615. [Google Scholar] [CrossRef] [PubMed] [Green Version]
- Allioui, H.; Sadgal, M.; Elfazziki, A. Utilization of a convolutional method for Alzheimer disease diagnosis. Mach. Vis. Appl. 2020, 31, 25. [Google Scholar] [CrossRef]
- National Institute of Neurological, Communicative Disorders, Stroke. Office of Scientific and Health Reports. In The Dementias: Hope through research (No. 81); US Department of Health and Human Services, Public Health Service, National Institutes of Health: Bethesda, MD, USA, 1981. [Google Scholar]
- Duff, C. Dementia: Assessment, Management and Support for People Living with Dementia and their Carers. Available online: https://eprints.lincoln.ac.uk/id/eprint/38978/ (accessed on 29 November 2021).
- Ambrose, C.T. Alzheimer’s Disease: The Great Morbidity of the 21st Century. Am. Sci. 2013, 100, 194. [Google Scholar] [CrossRef]
- Livingston, G.; Huntley, J.; Sommerlad, A.; Ames, D.; Ballard, C.; Banerjee, S.; Brayne, C.; Burns, A.; Cohen-Mansfield, J.; Cooper, C.; et al. Dementia prevention, intervention, and care: 2020 report of the Lancet Commission. Lancet 2020, 396, 413–446. [Google Scholar] [CrossRef]
- Nichols, E.; Szoeke, C.E.; Vollset, S.E.; Abbasi, N.; Abd-Allah, F.; Abdela, J.; Aichour, M.T.E.; Akinyemi, R.O.; Alahdab, F.; Asgedom, S.W.; et al. Global, regional, and national burden of Alzheimer’s disease and other dementias, 1990–2016: A systematic analysis for the Global Burden of Disease Study 2016. Lancet Neurol. 2019, 18, 88–106. [Google Scholar] [CrossRef] [Green Version]
- Lancet, T. The Three Stages of Alzheimer’s Disease. Available online: https://www.thelancet.com/journals/lancet/article/PIIS0140-6736(20)32205-4/fulltext (accessed on 29 November 2021).
- Márquez, F.; Yassa, M.A. Neuroimaging Biomarkers for Alzheimer’s Disease. Mol. Neurodegener. 2019, 14, 21. [Google Scholar] [CrossRef] [PubMed] [Green Version]
- Alzheimer’s Association. 2018 Alzheimer’s disease facts and figures. Alzheimer’s Dement. 2018, 14, 367–429. [Google Scholar] [CrossRef]
- Veitch, D.P.; Weiner, M.W.; Aisen, P.S.; Beckett, L.A.; Cairns, N.J.; Green, R.C.; Harvey, D.; Jack, C.R., Jr.; Jagust, W.; Morris, J.C.; et al. Understanding disease progression and improving Alzheimer’s disease clinical trials: Recent highlights from the Alzheimer’s Disease Neuroimaging Initiative. Alzheimer’s Dement. 2019, 15, 106–152. [Google Scholar] [CrossRef]
- Kwong, R.Y.; Yucel, E.K. Computed Tomography Scan and Magnetic Resonance Imaging. Circulation 2003, 108, e104–e106. [Google Scholar] [CrossRef] [Green Version]
- Zhang, Y.; Londos, E.; Minthon, L.; Wattmo, C.; Liu, H.; Aspelin, P.; Wahlund, L.O. Usefulness of computed tomography linear measurements in diagnosing Alzheimer’s disease. Acta Radiol. 2008, 49, 91–97. [Google Scholar] [CrossRef] [PubMed]
- Van Beek, E.J.; Kuhl, C.; Anzai, Y.; Desmond, P.; Ehman, R.L.; Gong, Q.; Gold, G.; Gulani, V.; Hall-Craggs, M.; Leiner, T.; et al. Value of MRI in medicine: More than just another test? J. Magn. Reson. Imaging 2018, 49, e14–e25. [Google Scholar] [CrossRef] [PubMed]
- Silverman, D.H.; Small, G.W.; Chang, C.Y.; Lu, C.S.; de Aburto, M.A.K.; Chen, W.; Czernin, J.; Rapoport, S.I.; Pietrini, P.; Alexander, G.E.; et al. Positron emission tomography in evaluation of dementia: Regional brain metabolism and long-term outcome. Jama 2001, 286, 2120–2127. [Google Scholar] [CrossRef] [Green Version]
- Dougall, N.J.; Bruggink, S.; Ebmeier, K.P. Systematic Review of the Diagnostic Accuracy of 99mTc-HMPAO-SPECT in Dementia. Available online: https://www.ncbi.nlm.nih.gov/books/NBK70560/ (accessed on 29 November 2021).
- Dubois, B.; Feldman, H.H.; Jacova, C.; Hampel, H.; Molinuevo, J.L.; Blennow, K.; DeKosky, S.T.; Gauthier, S.; Selkoe, D.; Bateman, R.; et al. Advancing research diagnostic criteria for Alzheimer’s disease: The IWG-2 criteria. Lancet Neurol. 2014, 13, 614–629. [Google Scholar] [CrossRef]
- Frisoni, G.B.; Fox, N.C.; Clifford, R.J., Jr.; Scheltens, P.; Thompson, P. The clinical use of structural MRI in Alzheimer disease. Nat. Rev. Neurol. 2010, 6, 67–77. [Google Scholar] [CrossRef] [Green Version]
- Schwab, K.E.; Gailloud, P.; Wyse, G.; Tamargo, R.J. Limitations of magnetic resonance imaging and magnetic resonance angiography in the diagnosis of intracranial aneurysms. Neurosurgery 2008, 63, 29–35. [Google Scholar] [CrossRef]
- Ungvari, Z.; Tarantini, S.; Donato, A.J.; Galvan, V.; Csiszar, A. Mechanisms of Vascular Aging. Circ. Res. 2018, 123, 849–867. [Google Scholar] [CrossRef] [PubMed]
- Roher, A.E.; Esh, C.; Rahman, A.; Kokjohn, T.A.; Beach, T.G. Atherosclerosis of Cerebral Arteries in Alzheimer Disease. Stroke 2004, 35, 2623–2627. [Google Scholar] [CrossRef] [PubMed] [Green Version]
- Bullitt, E.; Zeng, D.; Mortamet, B.; Ghosh, A.; Aylward, S.R.; Lin, W.; Marks, B.L.; Smith, J.K. The effects of healthy aging on intracerebral blood vessels visualized by magnetic resonance angiography. Neurobiol. Aging 2010, 31, 290–300. [Google Scholar] [CrossRef] [Green Version]
- Abualigah, L.; Diabat, A.; Sumari, P.; Gandomi, A.H. A novel evolutionary arithmetic optimization algorithm for multilevel thresholding segmentation of covid-19 ct images. Processes 2021, 9, 1155. [Google Scholar] [CrossRef]
- Salmon, E.; Ir, C.B.; Hustinx, R. Pitfalls and Limitations of PET/CT in Brain Imaging. Semin. Nucl. Med. 2015, 45, 541–551. [Google Scholar] [CrossRef] [Green Version]
- Alzheimer’s Disease Neuroimaging Initiative (ADNI). Available online: http://adni.loni.usc.edu/ (accessed on 25 July 2021).
- Harvard Medical School Data. Available online: http://www.med.harvard.edu/AANLIB/ (accessed on 16 March 2021).
- Marcus, D.S.; Wang, T.H.; Parker, J.; Csernansky, J.G.; Morris, J.C.; Buckner, R.L. Open Access Series of Imaging Studies (OASIS): Cross-sectional MRI Data in Young, Middle Aged, Nondemented, and Demented Older Adults. J. Cogn. Neurosci. 2007, 19, 1498–1507. [Google Scholar] [CrossRef] [Green Version]
- Thambisetty, M.; Beasonheld, L.L.; An, Y.; Kraut, M.A.; Resnick, S.M. APOE ε4 Genotype and Longitudinal Changes in Cerebral Blood Flow in Normal Aging. Arch. Neurol. 2010, 67, 93–98. [Google Scholar] [CrossRef]
- Stergaard, L.; Aamand, R.; Gutiérrez-Jiménez, E.; Ho, Y.C.L.; Blicher, J.U.; Madsen, S.M.; Nagenthiraja, K.; Dalby, R.B.; Drasbek, K.R.; Møller, A.; et al. The capillary dysfunction hypothesis of Alzheimer’s disease. Neurobiol. Aging 2013, 34, 1018–1031. [Google Scholar] [CrossRef]
- Harvard Medical School. Carotid Artery Disease. 2021. Available online: https://www.health.harvard.edu/heartdisease/carotid-artery-disease-overview (accessed on 25 July 2021).
- Fazlollahi, A.; Calamante, F.; Liang, X.; Bourgeat, P.; Raniga, P.; Dore, V.; Fripp, J.; Ames, D.; Masters, C.L.; Rowe, C.C.; et al. Increased cerebral blood flow with increased amyloid burden in the preclinical phase of alzheimer’s disease. J. Magn. Reson. Imaging 2020, 51, 505–513. [Google Scholar] [CrossRef]
- Guo, Y.; Li, X.; Zhang, M.; Chen, N.; Wu, S.; Lei, J.; Wang, Z.; Wang, R.; Wang, J.; Liu, H. Age and brain region associated alterations of cerebral blood flow in early Alzheimer’s disease assessed in AβPPSWE/PS1ΔE9 transgenic mice using arterial spin labeling. Mol. Med. Rep. 2019, 19, 3045–3052. [Google Scholar] [CrossRef] [Green Version]
- Lin, S.; Jia, H.; Abualigah, L.; Altalhi, M. Enhanced Slime Mould Algorithm for Multilevel Thresholding Image Segmentation Using Entropy Measures. Entropy 2021, 23, 1700. [Google Scholar] [CrossRef]
- Alomari, O.A.; Khader, A.T.; Al-Betar, M.A.; Abualigah, L.M. Gene selection for cancer classification by combining minimum redundancy maximum relevancy and bat-inspired algorithm. Int. J. Data Min. Bioinform. 2017, 19, 32–51. [Google Scholar] [CrossRef]
- Shehab, M.; Daoud, M.S.; AlMimi, H.M.; Abualigah, L.M.; Khader, A.T. Hybridising cuckoo search algorithm for extracting the ODF maxima in spherical harmonic representation. Int. J. Bio-Inspired Comput. 2019, 14, 190–199. [Google Scholar] [CrossRef]
- Sawiris, N.; Venizelos, A.; Ouyang, B.; Lopes, D.; Chen, M. Current Utility of Diagnostic Catheter Cerebral Angiography. J. Stroke Cerebrovasc. Dis. 2014, 23, e145–e150. [Google Scholar] [CrossRef]
- Alakbarzade, V.; Pereira, A. Cerebral catheter angiography and its complications. Pr. Neurol. 2018, 18, 393–398. [Google Scholar] [CrossRef]
- Rathore, S.; Habes, M.; Iftikhar, M.A.; Shacklett, A.; Davatzikos, C. A review on neuroimaging-based classification studies and associated feature extraction methods for Alzheimer’s disease and its prodromal stages. NeuroImage 2017, 155, 530–548. [Google Scholar] [CrossRef]
- Samper-González, J.; Burgos, N.; Bottani, S.; Fontanella, S.; Lu, P.; Marcoux, A.; Routier, A.; Guillon, J.; Bacci, M.; Wen, J.; et al. Reproducible evaluation of classification methods in Alzheimer’s disease: Framework and application to MRI and PET data. NeuroImage 2018, 183, 504–521. [Google Scholar] [CrossRef] [Green Version]
- Lebedev, A.V.; Westman, E.; Van Westen, G.J.P.; Kramberger, M.G.; Lundervold, A.; Aarsland, D.; Soininen, H.; Kłoszewska, I.; Mecocci, P.; Tsolaki, M.; et al. Random Forest ensembles for detection and prediction of Alzheimer’s disease with a good between-cohort robustness. NeuroImage Clin. 2014, 6, 115–125. [Google Scholar] [CrossRef] [PubMed] [Green Version]
- Zhang, Y.; Wang, S. Detection of Alzheimer’s disease by displacement field and machine learning. PeerJ 2015, 3, e1251. [Google Scholar] [CrossRef] [Green Version]
- Beheshti, I.; Demirel, H.; Farokhian, F.; Yang, C.; Matsuda, H.; Alzheimer’s Disease Neuroimaging Initiative. Structural MRI-based detection of Alzheimer’s disease using feature ranking and classification error. Comput. Methods Programs Biomed. 2016, 137, 177–193. [Google Scholar] [CrossRef]
- Zhang, J.; Liu, M.; An, L.; Gao, Y.; Shen, D. Alzheimer’s disease diagnosis using landmark-based features from longitudinal structural MR images. IEEE J. Biomed. Health Inform. 2017, 21, 1607–1616. [Google Scholar] [CrossRef] [Green Version]
- Zeng, N.; Qiu, H.; Wang, Z.; Liu, W.; Zhang, H.; Li, Y. A new switching-delayed-PSO-based optimized SVM algorithm for diagnosis of Alzheimer’s disease. Neurocomputing 2018, 320, 195–202. [Google Scholar] [CrossRef]
- Koh, J.E.W.; Jahmunah, V.; Pham, T.H.; Oh, S.L.; Ciaccio, E.J.; Acharya, U.R.; Yeong, C.H.; Fabell, M.K.M.; Rahmat, K.; Vijayananthan, A.; et al. Automated detection of Alzheimer’s disease using bi-directional empirical model decomposition. Pattern Recognit. Lett. 2020, 135, 106–113. [Google Scholar] [CrossRef]
- Plis, S.M.; Hjelm, D.R.; Salakhutdinov, R.; Allen, E.A.; Bockholt, H.J.; Long, J.D.; Johnson, H.J.; Paulsen, J.S.; Turner, J.A.; Calhoun, V.D. Deep learning for neuroimaging: A validation study. Front. Neurosci. 2014, 8, 229. [Google Scholar] [CrossRef] [Green Version]
- LeCun, Y.; Bengio, Y.; Hinton, G. Deep learning. Nature 2015, 521, 436–444. [Google Scholar] [CrossRef]
- Liu, M.; Cheng, D.; Yan, W.; Alzheimer’s Disease Neuroimaging Initiative. Classification of Alzheimer’s Disease by Combination of Convolutional and Recurrent Neural Networks Using FDG-PET Images. Front. Aging Neurosci. 2018, 12, 35. [Google Scholar] [CrossRef] [PubMed] [Green Version]
- Ge, C.; Qu, Q.; Gu, I.Y.-H.; Jakola, A. Multi-stream multi-scale deep convolutional networks for Alzheimer’s disease detection using MR images. Neurocomputing 2019, 350, 60–69. [Google Scholar] [CrossRef]
- Bonaccorso, G. Machine Learning Algorithms; Packt Publishing Ltd.: Birmingham, UK, 2017. [Google Scholar]
- Basaia, S.; Agosta, F.; Wagner, L.; Canu, E.; Magnani, G.; Santangelo, R.; Filippi, M.; Alzheimer’s Disease Neuroimaging Initiative. Automated classification of Alzheimer’s disease and mild cognitive impairment using a single MRI and deep neural networks. NeuroImage: Clin. 2019, 21, 101645. [Google Scholar] [CrossRef] [PubMed]
- Pan, D.; Zeng, A.; Jia, L.; Huang, Y.; Frizzell, T.; Song, X. Early Detection of Alzheimer’s Disease Using Magnetic Resonance Imaging: A Novel Approach Combining Convolutional Neural Networks and Ensemble Learning. Front. Neurosci. 2020, 14, 259. [Google Scholar] [CrossRef] [PubMed]
- Feng, W.; Van Halm-Lutterodt, N.; Tang, H.; Mecum, A.; Mesregah, M.; Ma, Y.; Li, H.; Zhang, F.; Wu, Z.; Yao, E.; et al. Automated MRI-Based Deep Learning Model for Detection of Alzheimer’s Disease Process. Int. J. Neural Syst. 2020, 30, 2050032. [Google Scholar] [CrossRef]
- Li, W.; Lin, X.; Chen, X. Detecting Alzheimer’s disease Based on 4D fMRI: An exploration under deep learning framework. Neurocomputing 2020, 388, 280–287. [Google Scholar] [CrossRef]
- Liu, J.; Li, M.; Luo, Y.; Yang, S.; Li, W.; Bi, Y. Alzheimer’s disease detection using depthwise separable convolutional neural networks. Comput. Methods Programs Biomed. 2021, 203, 106032. [Google Scholar] [CrossRef]
- Chollet, F. Xception: Deep learning with depthwise separable convolutions. In Proceedings of the IEEE Conference on Computer Vision and Pattern Recognition, Honolulu, HI, USA, 21–26 July 2017; pp. 1251–1258. [Google Scholar]
- Train Your Own Image Classifier with Inception in TensorFlow, Google AI Blog, 09-Mar-2016. Available online: https://ai.googleblog.com/2016/03/train-your-ownimage-classifier-with.html. (accessed on 25 July 2021).
- Jeans, W.D. The development and use of digital subtraction angiography. Br. J. Radiol. 1990, 63, 161–168. [Google Scholar] [CrossRef] [PubMed]
- Chilcote, W.A.; Modic, M.T.; Pavlicek, W.A.; Little, J.R.; Furlan, A.J.; Duchesneau, P.M.; Weinstein, M.A. Digital subtraction angiography of the carotid arteries: A comparative study in 100 patients. Radiology 1981, 139, 287–295. [Google Scholar] [CrossRef]
- Yu, G.; Sapiro, G. DCT Image Denoising: A Simple and Effective Image Denoising Algorithm. Image Process. Line 2011, 1, 292–296. [Google Scholar] [CrossRef] [Green Version]
- Wang, A.; Yan, X.; Wei, Z. ImagePy: An open-source, Python-based and platform-independent software package for bioimage analysis. Bioinformatics 2018, 34, 3238–3240. [Google Scholar] [CrossRef] [Green Version]
- Miko?ajczyk, A.; Grochowski, M. Data augmentation for improving deep learning in image classification problem. In Proceedings of the International Interdisciplinary PhD Workshop (IIPhDW), Swinoujscie, Poland, 9–12 May 2018; pp. 117–122. [Google Scholar] [CrossRef]
- Indolia, S.; Goswami, A.; Mishra, S.; Asopa, P. Conceptual Understanding of Convolutional Neural Network- A Deep Learning Approach. Procedia Comput. Sci. 2018, 132, 679–688. [Google Scholar] [CrossRef]
- Zhang, G.; Kato, J.; Wang, Y.; Mase, K. How to initialize the CNN for small datasets: Extracting discriminative filters from pre-trained model. In Proceedings of the 2015 3rd IAPR Asian Conference on Pattern Recognition, IEEE (ACPR), Kuala Lumpur, Malaysia, 3–6 November 2015; pp. 479–483. [Google Scholar]
- Huang, G.; Liu, Z.; Van Der Maaten, L.; Weinberger, K.Q. Densely connected convolutional networks. In Proceedings of the IEEE Conference on Computer Vision and Pattern Recognition, Honolulu, HI, USA, 21–26 July 2017; pp. 4700–4708. [Google Scholar]
- Susmaga, R. Confusion matrix visualization. In Intelligent Information Processing and Web Mining; Springer: Berlin/Heidelberg, Germany, 2004; pp. 107–116. [Google Scholar]
- Fürnkranz, J.; Flach, P.A. An analysis of rule evaluation metrics. In Proceedings of the 20th International Conference on Machine Learning (ICML-03), Washington, DC, USA, 21–24 August 2003; pp. 202–209. [Google Scholar]


| Neuroimaging | Uses | Advantages | Disadvantages |
|---|---|---|---|
| CT | Determine brain atrophy | Short time study and high quality | Requires large radiation doses |
| SPECT | Determine Beta-amyloid deposition and neurofibrillary tangles | Well-supplied and has a low cost | Not able to differentiate between Alzheimer’s and other Dementia diseases |
| MRI | Analyze vital signs of neuronal loss | Distinguish between Alzheimer’s disease and other Dementia diseases | Very expensive and time-consuming |
| MRA | Evaluate age-related changes in the cerebral arteries | Detect dementia diseases | Difficult to evaluate small vessels |
| PET | Reveal tissues and organs functions | Evaluate brain amyloid | Erroneous interpretations |
| Database | PET | SPECT | MRI | CT |
|---|---|---|---|---|
| ADNI [37] | Yes | No | Yes | No |
| HMSD [38] | Yes | Yes | Yes | Yes |
| OASIS [39] | No | No | Yes | No |
| Diagnostic Type | Scans No. | Age [Range] | Gender (M/F) |
|---|---|---|---|
| Normal Controls | 27 | 47.9 ± 14.8 [8–66] | 15/12 |
| Alzheimer’s disease | 26 | 56.8 ± 7.3 [42–81] | 14/12 |
| Predicted Values | |||
|---|---|---|---|
| Negative | Positive | ||
| Actual values | Negative | TN | FP |
| Positive | FN | TP | |
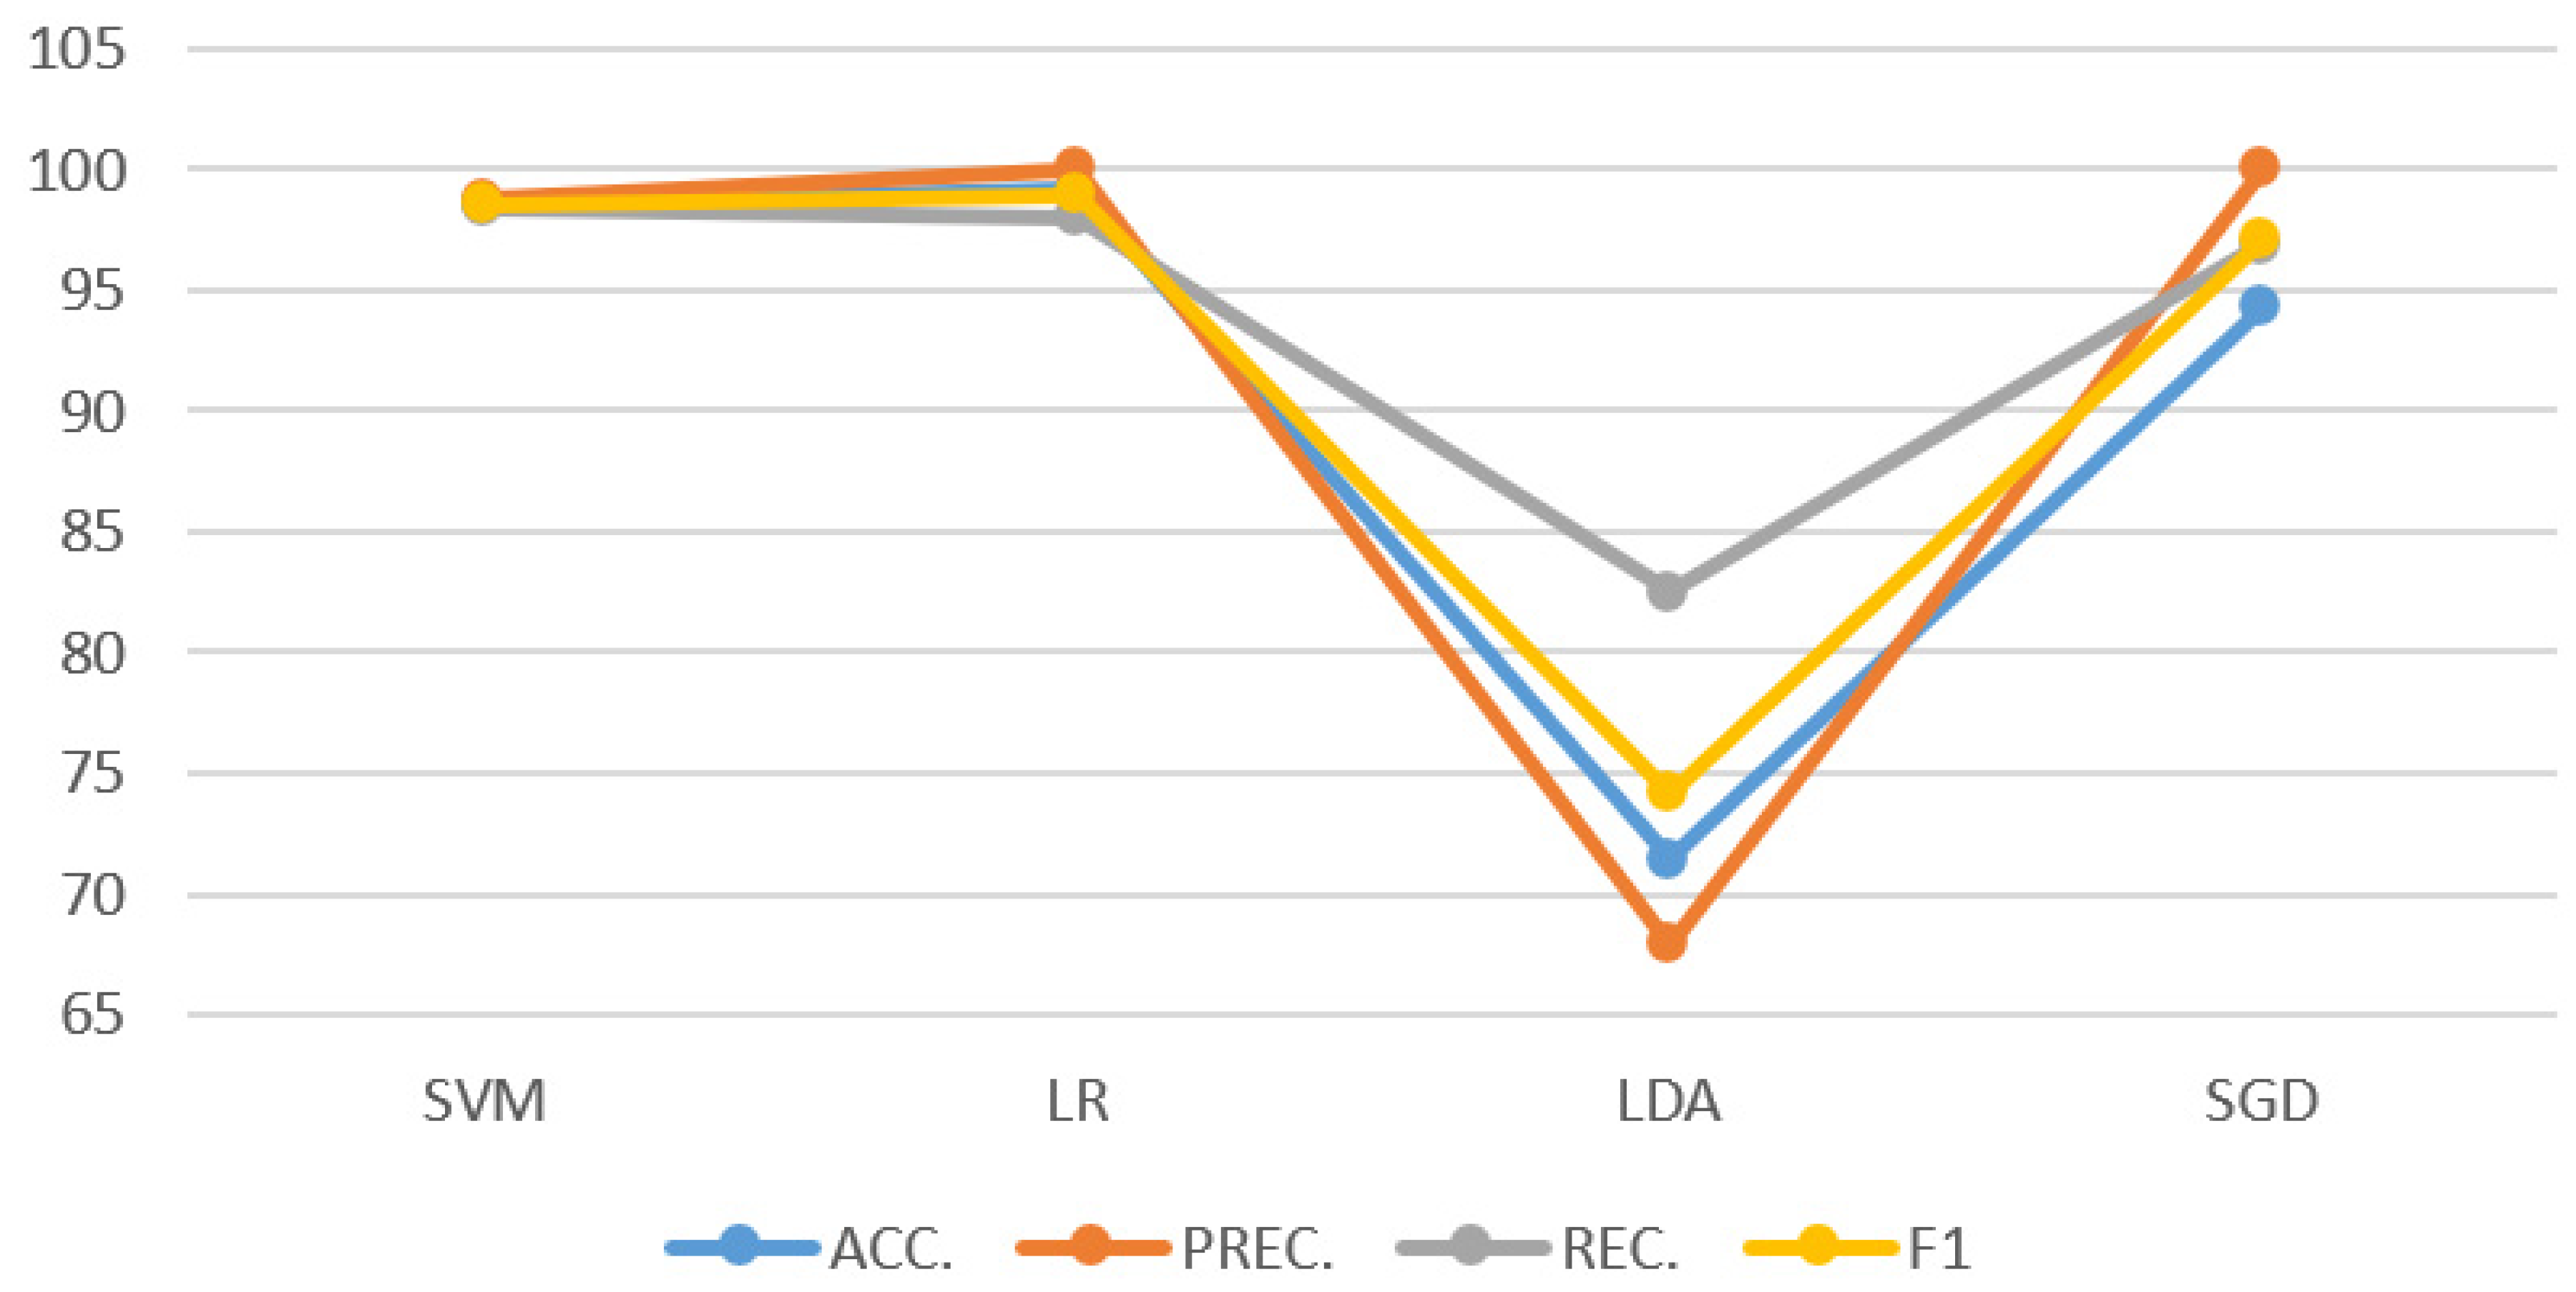
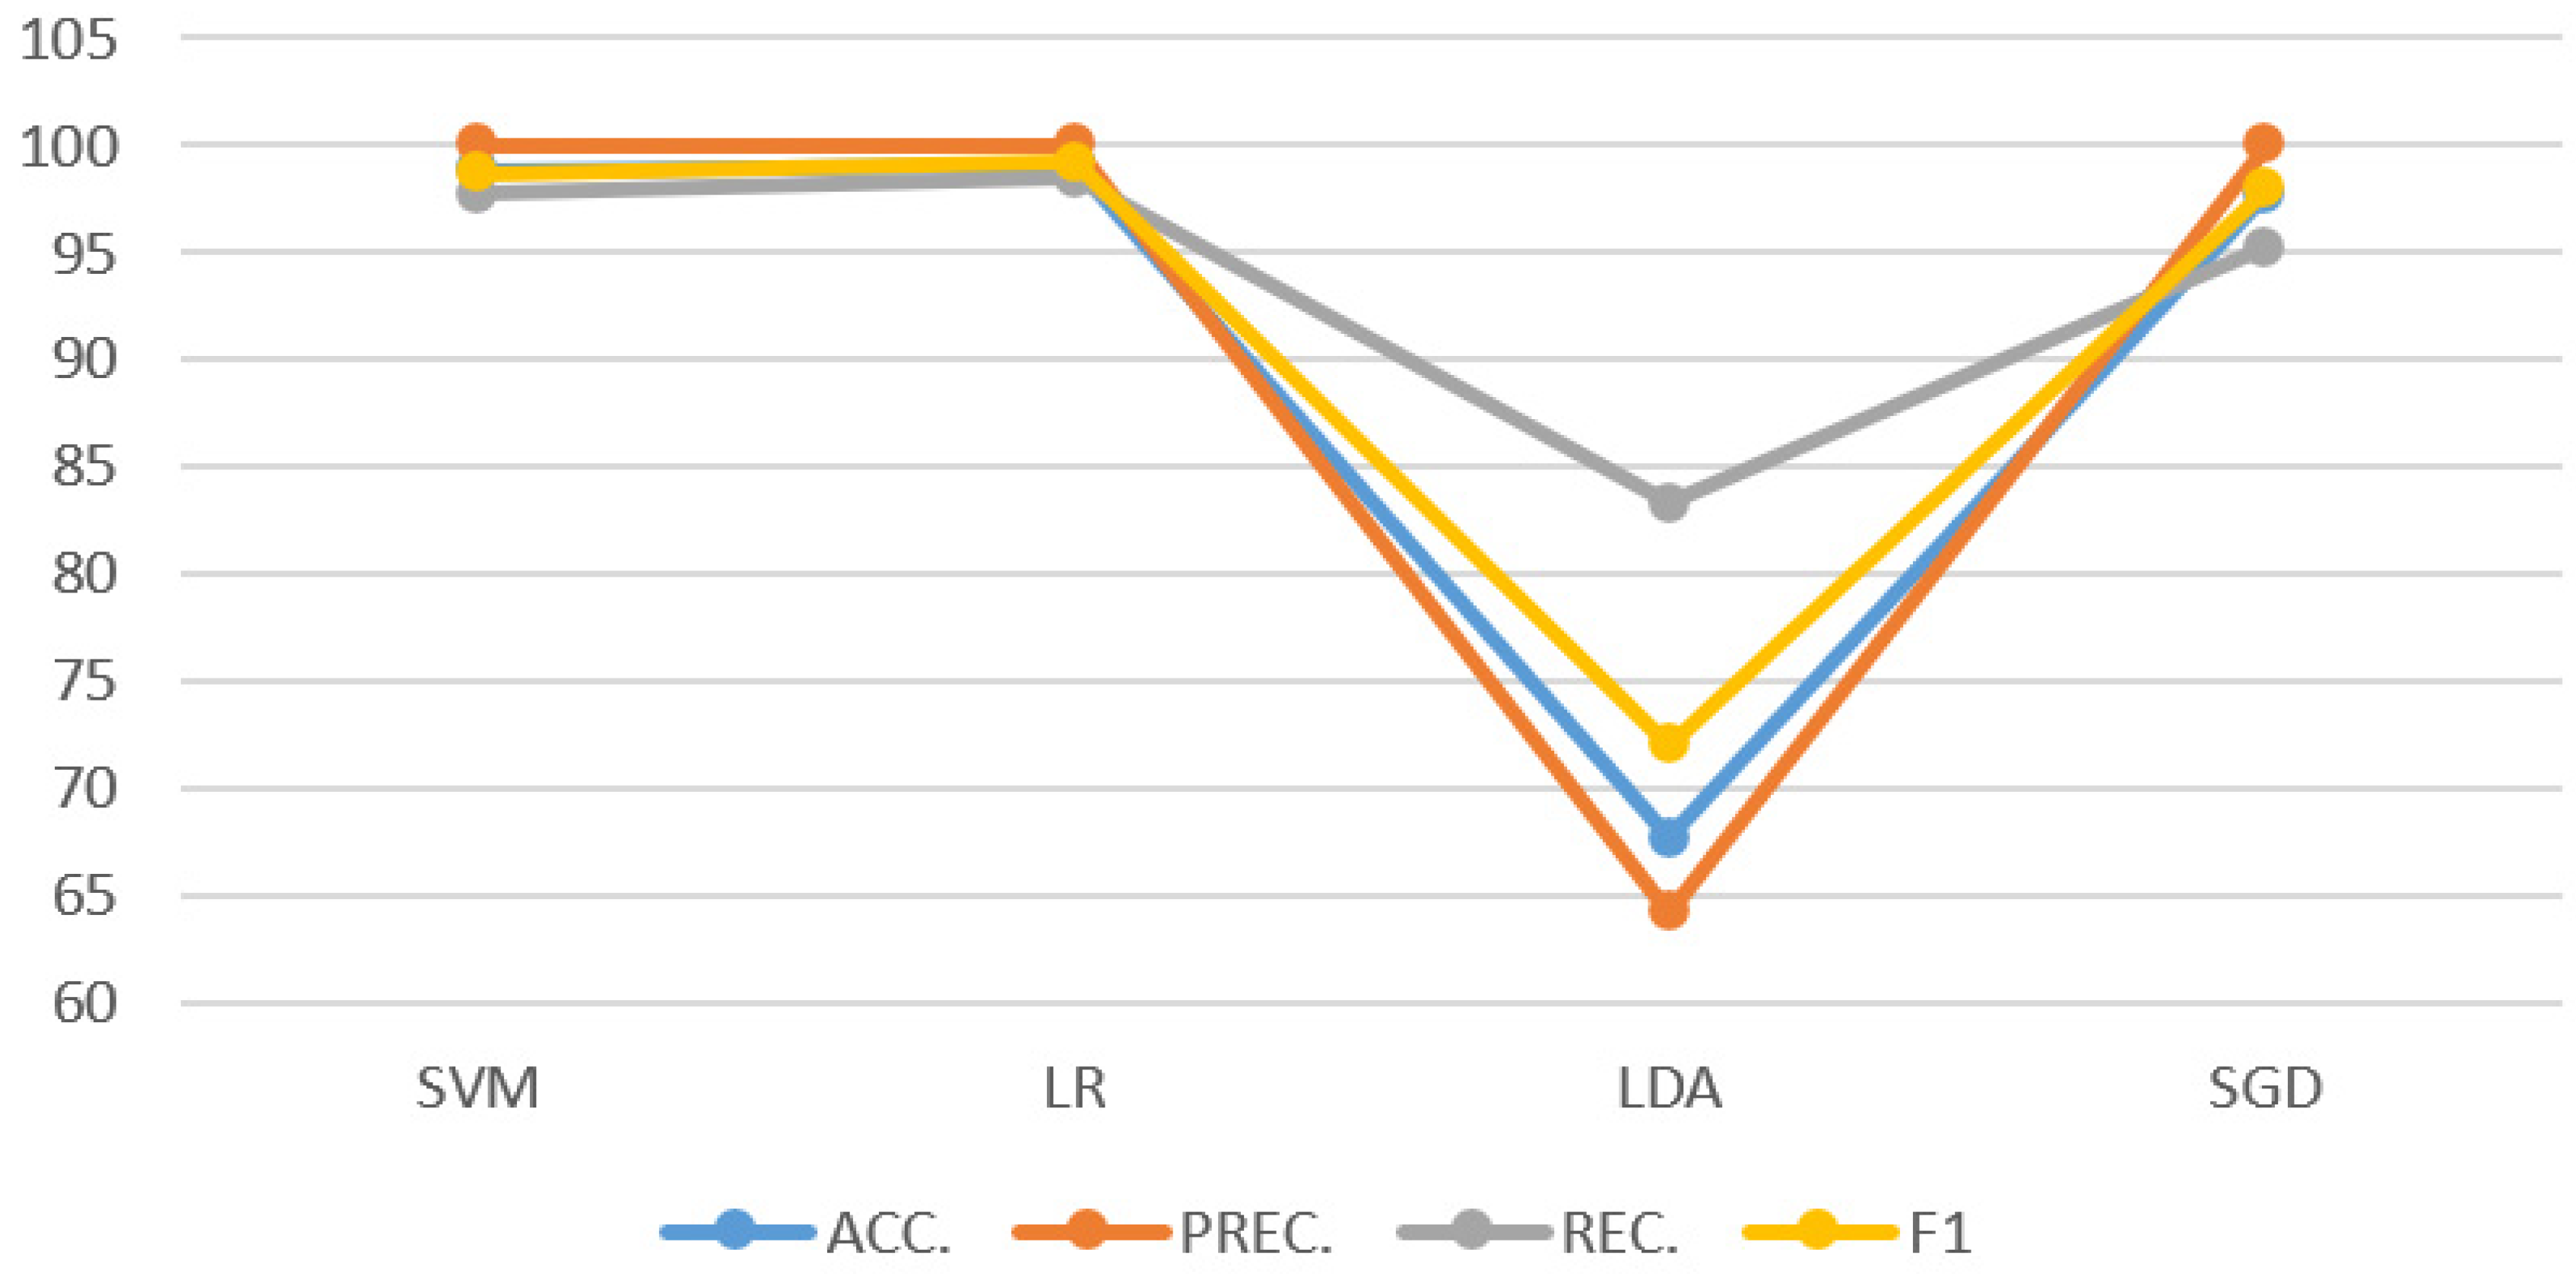
| Features Extractor | Classifier | ACC. | PREC. | REC. | F1 |
|---|---|---|---|---|---|
| DenseNet201 | SVM | 98.57 ± 0.23 | 98.75 ± 0.37 | 98.44 ± 0.32 | 98.52 ± 0.24 |
| LR | 99.14 ± 0.18 | 99.98 ± 0.01 | 98.00 ± 0.42 | 98.94 ± 0.22 | |
| LDA | 71.43 ± 0.59 | 67.91 ± 0.81 | 82.52 ± 1.02 | 74.14 ± 0.73 | |
| SGD | 94.29 ± 0.38 | 99.98 ± 0.01 | 96.89 ± 0.52 | 97.10 ± 0.33 | |
| InceptionV3 | SVM | 98.29 ± 0.22 | 99.98 ± 0.01 | 96.47 ± 0.46 | 98.14 ± 0.24 |
| LR | 98.00 ± 0.22 | 99.98 ± 0.01 | 96.03 ± 0.45 | 97.92 ± 0.23 | |
| LDA | 70.29 ± 0.69 | 65.85 ± 0.71 | 86.46 ± 0.10 | 74.32 ± 0.67 | |
| SGD | 96.00 ± 0.36 | 99.98 ± 0.01 | 95.34 ± 0.33 | 95.02 ± 0.49 | |
| InceptionV3 + DenseNet201 | SVM | 98.86 ± 0.19 | 99.98 ± 0.01 | 97.74 ± 0.43 | 98.67 ± 0.22 |
| LR | 99.14 ± 0.18 | 99.98 ± 0.01 | 98.44 ± 0.32 | 99.19 ± 0.17 | |
| LDA | 67.71 ± 0.66 | 64.20 ± 0.99 | 83.30 ± 0.97 | 72.01 ± 0.81 | |
| SGD | 97.71 ± 0.21 | 99.98 ± 0.01 | 95.22 ± 0.52 | 97.96 ± 0.33 |
| Study | Modality | Feature Extraction Method | Classifier | AD | NC | ACC. |
|---|---|---|---|---|---|---|
| Lebedev et al. [52] | Structural MRI | Surface-based registration | Random Forest | 185 | 225 | 90.30 |
| Zhang and Wang [53] | 3D-MRI | Displacement Field | Twin SVM | 28 | 98 | 92.70 |
| Beheshti et al. [54] | Structural MRI | Voxel-based feature extraction | SVM | 130 | 130 | 92.40 |
| Zhang et al. [55] | Structural MRI | Bag-of-words | SVM | 154 | 207 | 88.30 |
| Zeng et al. [56] | MRI | Anatomical Labeling | SDPSO-SVM-PCA | 92 | 82 | 71.20 |
| Koh et al. [57] | MRI | BE Mode Decomposition | SVM-Poly-1 | 55 | 110 | 93.90 |
| Liu et al. [60] | 3D-FDG-PET | 2D-CNN and BGRU | Softmax | 93 | 100 | 91.20 |
| Ge et al. [61] | 3D-MRI | 3D-mutliscale-CNN | XGBoost | 198 | 139 | 98.20 |
| Basaia et al. [6] | MRI | CNN | LR | 542 | 457 | 98.00 |
| Pan et al. [64] | MRI | 2D-CNN | Ensemble | 137 | 162 | 84.00 |
| Feng et al. [65] | 3D-MRI | 3D-CNN | SVM | 153 | 159 | 99.10 |
| Li et al. [66] | 4D-MRI | 3D-CNN and LSTM | Softmax | 116 | 174 | 97.30 |
| Liu et al. [67] | MRI | GoogleNet | Softmax | 30 | 332 | 93.00 |
| Proposed Research | DSA | InceptionV3 + DenseNet201 | LR | 13 | 27 | 99.14 |
Publisher’s Note: MDPI stays neutral with regard to jurisdictional claims in published maps and institutional affiliations. |
© 2021 by the authors. Licensee MDPI, Basel, Switzerland. This article is an open access article distributed under the terms and conditions of the Creative Commons Attribution (CC BY) license (https://creativecommons.org/licenses/by/4.0/).
Share and Cite
Gharaibeh, M.; Almahmoud, M.; Ali, M.Z.; Al-Badarneh, A.; El-Heis, M.; Abualigah, L.; Altalhi, M.; Alaiad, A.; Gandomi, A.H. Early Diagnosis of Alzheimer’s Disease Using Cerebral Catheter Angiogram Neuroimaging: A Novel Model Based on Deep Learning Approaches. Big Data Cogn. Comput. 2022, 6, 2. https://doi.org/10.3390/bdcc6010002
Gharaibeh M, Almahmoud M, Ali MZ, Al-Badarneh A, El-Heis M, Abualigah L, Altalhi M, Alaiad A, Gandomi AH. Early Diagnosis of Alzheimer’s Disease Using Cerebral Catheter Angiogram Neuroimaging: A Novel Model Based on Deep Learning Approaches. Big Data and Cognitive Computing. 2022; 6(1):2. https://doi.org/10.3390/bdcc6010002
Chicago/Turabian StyleGharaibeh, Maha, Mothanna Almahmoud, Mostafa Z. Ali, Amer Al-Badarneh, Mwaffaq El-Heis, Laith Abualigah, Maryam Altalhi, Ahmad Alaiad, and Amir H. Gandomi. 2022. "Early Diagnosis of Alzheimer’s Disease Using Cerebral Catheter Angiogram Neuroimaging: A Novel Model Based on Deep Learning Approaches" Big Data and Cognitive Computing 6, no. 1: 2. https://doi.org/10.3390/bdcc6010002