Article

The Effect of Electrode Thickness on the High-Current Discharge and Long-Term Cycle Performance of a Lithium-Ion Battery

1
National Key Laboratory of Science and Technology on High-Strength Structural Materials, Central South University, Changsha 410083, China
2
Jiangsu Co-Innovation Center of Efficient Processing and Utilization of Forest Resources, International Innovation Center for Forest Chemicals and Materials, College of Materials Science and Engineering, Nanjing Forestry University, Nanjing 210037, China
3
Institute of Materials Science and Devices, School of Materials Science and Engineering, Suzhou University of Science and Technology, Suzhou 215009, China
4
College of Metallurgy and Materials Engineering, Hunan University of Technology, Zhuzhou 412007, China
*
Authors to whom correspondence should be addressed.
Batteries 2022, 8(8), 101; https://doi.org/10.3390/batteries8080101
Submission received: 5 August 2022 / Revised: 15 August 2022 / Accepted: 19 August 2022 / Published: 21 August 2022
(This article belongs to the Special Issue Lithium-Ion Batteries and Beyond: Outlook on Present and Future)

Abstract

:
Six groups of electrodes with different thickness are prepared in the current study by using Li[Ni1/3Co1/3MN1/3]O2 as the active substance; the electrode thicknesses are 71.8, 65.4, 52.6, 39.3, 32.9, and 26.2 μm, respectively, with similar internal microstructures. The effect of electrode thickness on the discharge rate, pulse discharge, internal resistance, and long-term cycle life of a pouch cell are investigated. The results show that, with the decrease in the electrode thickness from 71.8 μm to 26.2 μm, the high-current-discharge performance of the cell gradually improves, the pulse-discharge power density under 50% SOC increases from 1561 W/Kg to 2691 W/Kg, the Rdis decreases from 8.70 mΩ to 3.34 mΩ, and the internal resistance decreases from 3.36 mΩ to 1.21 mΩ. In the long-term cycle-life test, the thinner the electrode thickness, the less the capacity fading of the cell; the internal resistance of the cell is observed with the increase in the cycle index.

1. Introduction

In recent years, with the development of intelligent transportation and the promotion of clean energy, the application of lithium-ion batteries in the field of new-energy vehicles and electrochemical energy storage has become a research hotspot for many scientists and engineers [1,2,3,4]. Lithium-ion batteries have excellent performance characteristics, such as high-energy density and high-power density, but different application scenarios have different requirements [5,6]. For example, a pure electric vehicle (BEV) requires the high-energy density of a lithium-ion battery, and a plug-in hybrid electric vehicle (PHEV) requires both high-energy and power densities. In addition, hybrid electric vehicles (HEVs) and the 48V micro-hybrid system (MHEV) require a high-current charge–discharge performance and the high-power density of lithium-ion batteries [7]. The demand for long-term energy-storage technology in the power grid requires high-energy density and a long service life for electrochemical energy-storage technology, such as lithium-ion batteries [8,9], while short-term high-frequency energy-storage technology requires a high-current charge–discharge performance and high-power density of a lithium-ion battery [10]. Therefore, it is important to develop appropriate energy-power performances for different application scenarios [11,12,13,14].
In order to further improve the performance of lithium-ion batteries, many researchers have conducted a lot of research on material preparation and modification [15,16,17,18,19,20,21,22], formula optimization [23,24], and electrode-structure design [25,26,27,28]. Zhang et al. [29] prepared Li[Ni1/3Co1/3MN1/3]O2 and LiFePO4 electrodes with different thicknesses. The research results show that the thicker the electrode, the higher its energy density, but its capacity declines more rapidly and its power density is lower. Denis et al. [30] studied the electrode parameters of an LiFePO4 battery, and the study showed that the influence of an increasing electrode thickness on a lithium-ion battery was mainly reflected in increasing the electrode impedance and decreasing the conduction rate of lithium ions in electrolytes. LiMn2O4 cells with different electrode thicknesses were also assembled to optimize the active material load, thus designing high-performance batteries [31]. Thunmana et al. [32] studied the effect of the electrode thickness of an Li4Ti5O12/LiMn2O4 battery on discharge performance, and the results show that when the discharge current density is increased, the discharge capacity related to the polarization in the electrolyte and electrode.
The examples of literature stated above show that the electrode structure parameters, such as electrode thickness and porosity, have important effects on the performance of a lithium-ion battery. In the current paper, the Li[Ni1/3Co1/3Mn1/3]O2 material is used to prepare a series of electrodes with the same porosity and different thicknesses. Meanwhile, a pouch cell is prepared. Combined with the high-current discharge and long-term cycle tests, the influence of electrode thickness on cell performance is analyzed. The research focuses on the rate performance of cells with electrode designs of different thicknesses and the cycle-life performance of cells with electrode designs of different thicknesses. It provides reference for the electrode-structure design of a lithium-ion battery with different performance requirements.

2. Materials and Methods
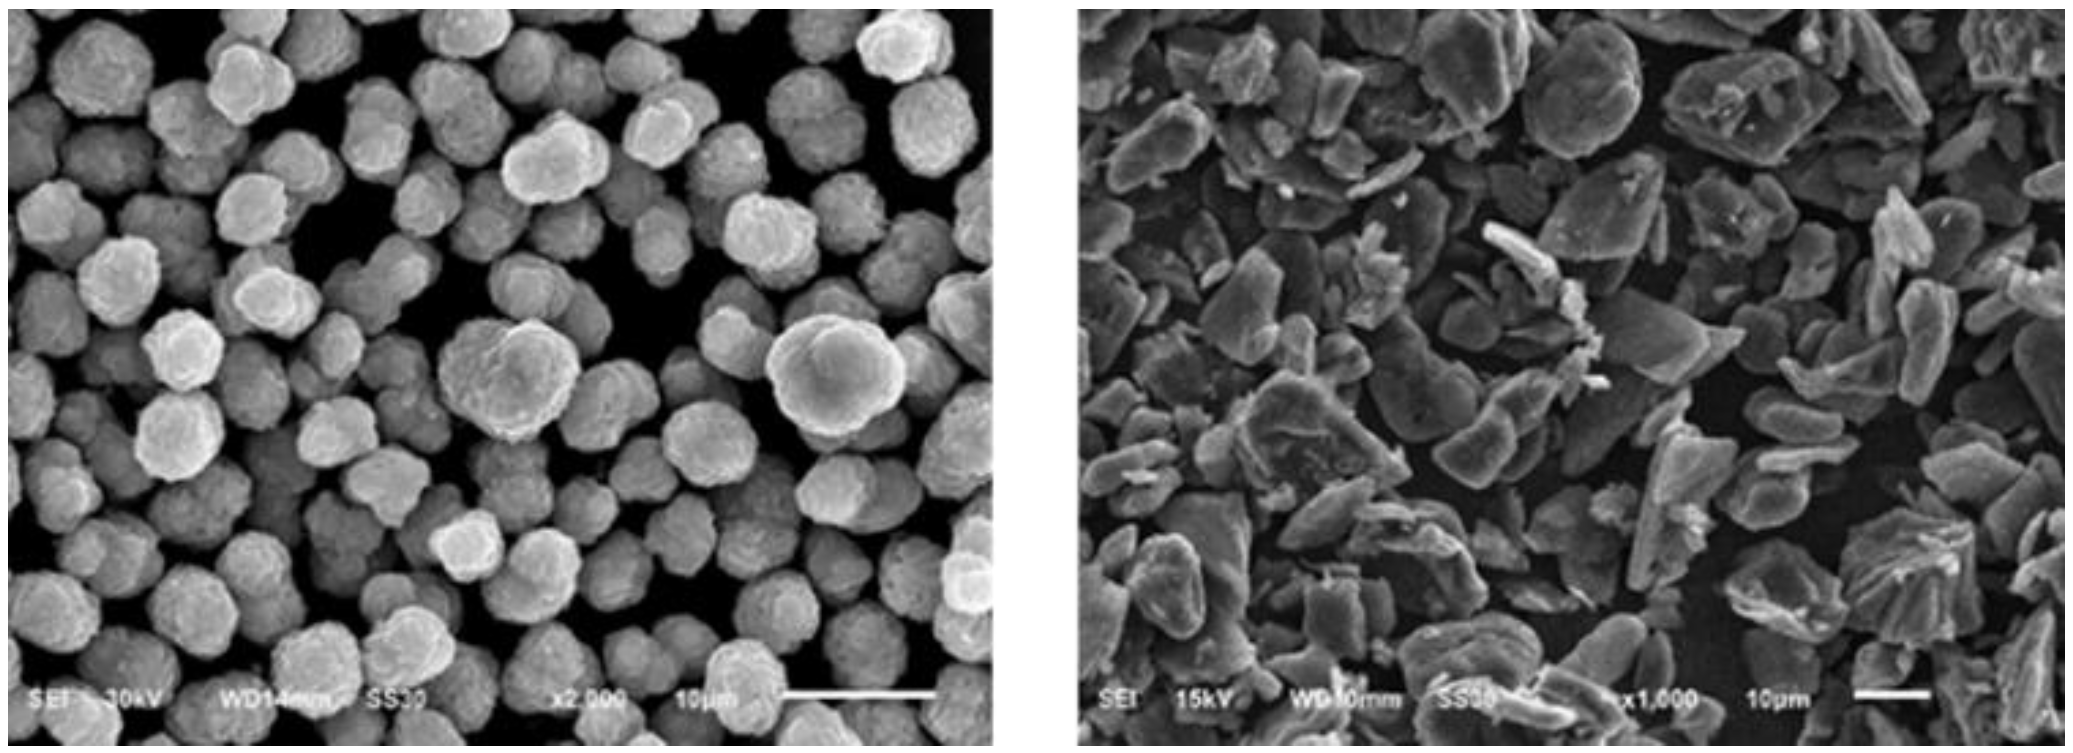
2.1. Materials

The cathode material used was SN1(Li[Ni1/3Co1/3Mn1/3]O2, Soudon New Energy Technology Co., Ltd., Xiangtan, China); we used secondary particles, the average particle size was 8 μm, and the BET specific surface area was 0.28 m2/g. The composite conductive agents, Super P-Li and CNT, built a rich conductive network; the binder used was PVDF (polyvinylidene fluoride). The negative active material used was artificial graphite (A8-5, BTR New Material Group Co., Ltd., Shenzhen, China), the average particle size was 15 μm, BET was 1.8 m2/g, the binder was SBR (styrene butadiene rubber), and the dispersant was CMC (carboxymethyl cellulose). The particle morphology of the cathode and anode materials are presented in Figure 1. The separator was PE coated with Al2O3; the thicknesses of the PE and ceramic coating were 16 and 4 μm, respectively. The electrolyte used was LiPF6 (1.2 mol/L) in EC/DEC/EMC (volume ratio: 1:1:1).

2.2. Preparation of Electrode

The cathode slurry was composed of 93 wt% active material SN1, 3 wt% PVDF binder dissolved in moderate NMP (N-methyl-2-pyrrolidone), and 4 wt% conductive agents (3% Super P-Li and 1%CNT). The slurry was spread onto cleaned Al foil using the transfer-coating technique to prepare the cathode plate followed by drying. Analogously, the well-proportioned anode slurry was manufactured with 94.8 wt% graphite, 2 wt% conductive agents, 1.2 wt% CMC, and 2 wt% SBR mixed in DI (deionized) water in the planetary mixer, which was spread onto cleaned Cu foil with the transfer-coating technique, and then dried. By adjusting the parameters of the coating machine, six groups of positive and negative electrode pieces with different coating weights were prepared. The roll squeezer was used to pressurize the cathode to increase the compaction density. Table 1 presents the true density of the material in the cathode.
The electrode consisted of a current collector and a uniformly mixed active material, conductive agent, and binder. The true density and weight ratio of each material were known, and the actual thickness of the electrode was measured. The porosity of the positive electrode was calculated according to Formula (1), as presented in Table 2; the porosity and compaction density of the six groups with different thicknesses were almost the same [33,34,35].
ε = 1 M a r e a l L × ( ω A M ρ A M + ω B ρ B + ω C A ρ C A )
ε is the porosity; ω is the amount of the material coated; ρ is the true density of the material, where AM represents the active material; B represents the binders (PVDF, SBR, and CMC); and CA represents the conductive agent.

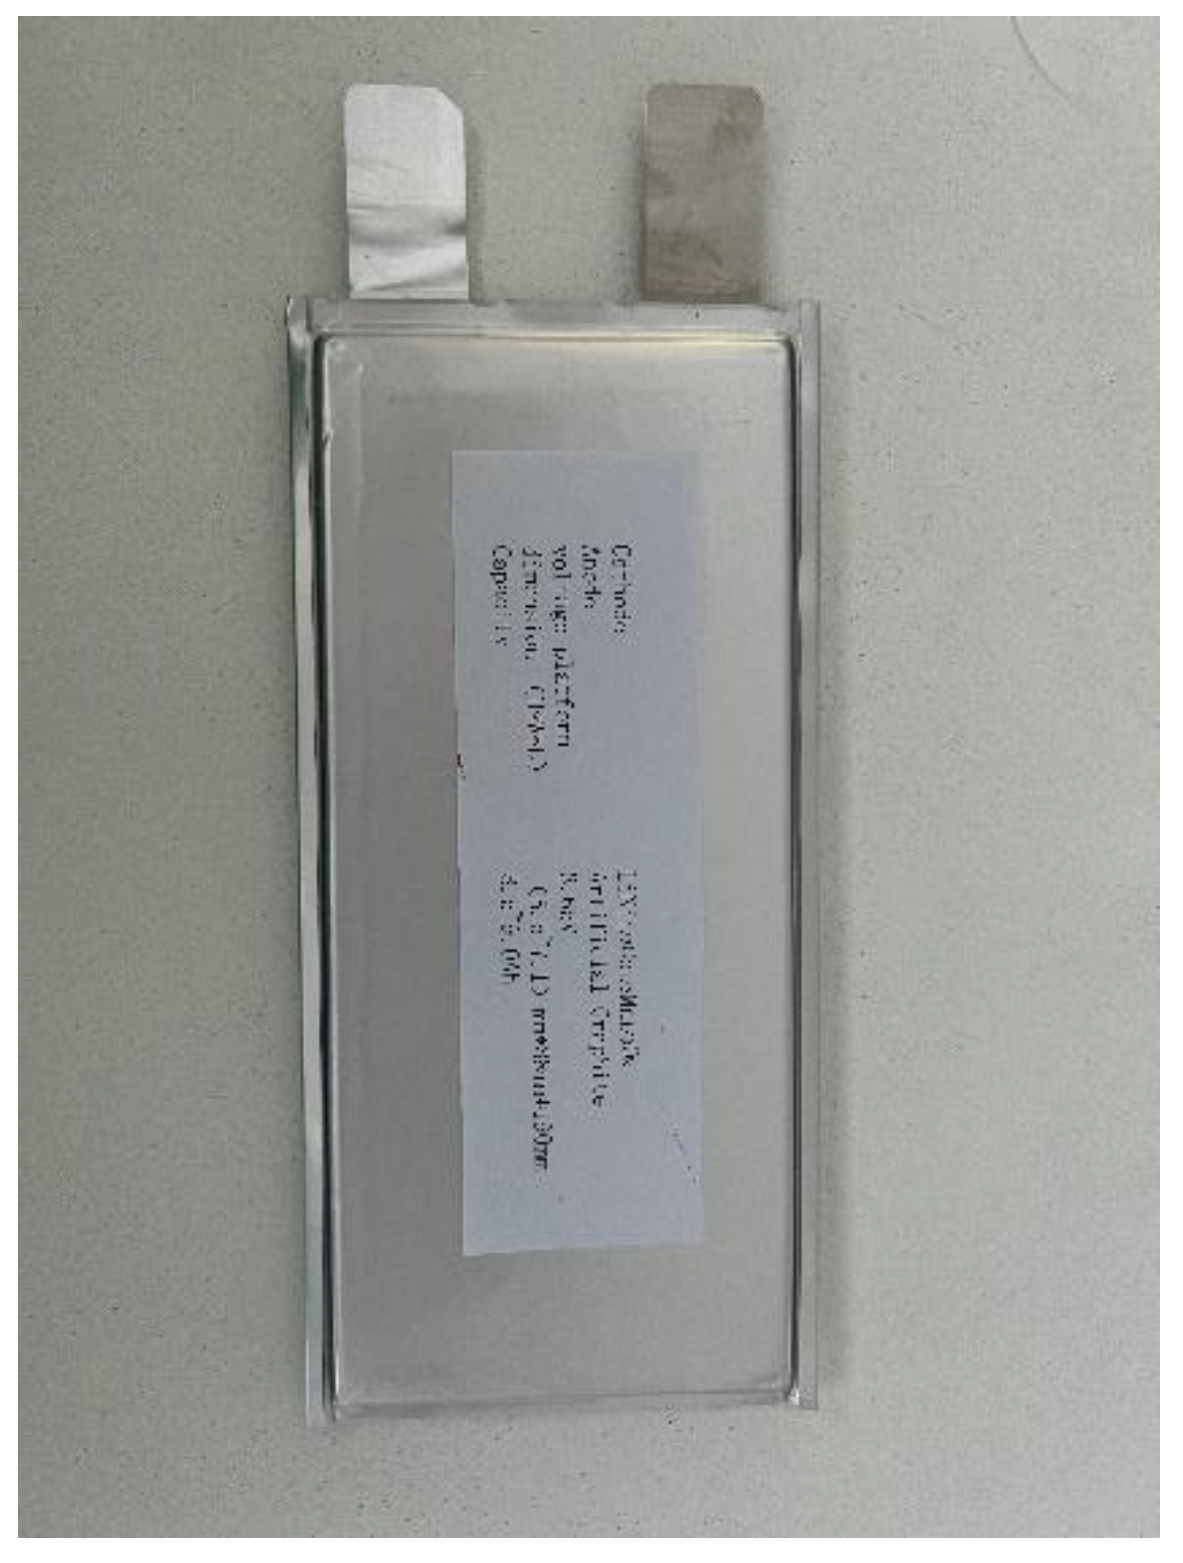
2.3. Preparation of Cell

The electrodes were die-cut into small electrode pieces; the effective areas were 77 × 176 cm2 and 79 × 179 cm2 for the cathode and anode plates, respectively. The capacity-balancing factor of the cathode and anode was 1:1.18. The anode piece, separator, and cathode piece were assembled into an electrode group by a laminating machine. Aluminum and nickel sheets were ultrasonically soldered to the negative and positive poles and controlled at 60 °C for 48 h in a vacuum. The electrolyte of the laminated cells sealed under vacuum within a dry chamber was 40 g (dew point temperature ≤ −50 °C). The pouch cells were sustained overnight at ambient temperature before formation and testing. The capacity of the pouch cell was about 8.5–9.0 Ah; the length and width of the pouch cell were 190 mm and 88 mm, respectively. Table 3 summarizes the size and relevant electrochemical performance data of the pouch cell. A physical view of the pouch cell is presented in Figure 2.

2.4. Characterization

The microscopic features of the cathode material were investigated using scanning electron microscopy (SEM, 250 FEG, FEI). The electrochemical characteristics of the discharge rate, pulse discharge, internal resistance, and long-term cycle-life measurements of the cells were obtained by a BTS05200C8-HP (Shenzhen Sinexcel Electric Co., Ltd., Shenzhen, China) cell test instrument under ambient temperature. Three charge–discharge cycles were performed under the current of 1 C as the initial activation. For the rate discharge/charge capability experiment, the cell was charged at a constant current of 1 C and then discharged under various currents varying from 1 C, 3 C, 5 C, 7 C, 10 C, 15 C, and 20 C. In the long-term cycle-life test, for electrode thicknesses of 71.8, 65.4, and 52.6 μm, a 1 C constant current was used for the charge–discharge cycle in the 2.8–4.2 V voltage window. For the electrode thicknesses of 39.3, 32.9, and 26.2 μm, a 3 C constant current was used for the charge–discharge cycle in the 2.8–4.1 V voltage window, and tested the internal resistance of the cell every 500 cycles.
The power performance experiment was employed with the HPPC technique within a 2.8–4.2 V range for the pouch cell. The characterization tis presentation in Figure 3, and the calculation formulas for he discharge pulse-power capability and internal resistance of the battery are as follows:
R d i s = Δ V d i s c h a r g e Δ I d i s c h a r g e = O C V V t 1 ( I t 1 I t 0 ) = O C V V t 1 I t 0 I t 1
DPPC = V M I N Δ ( O C V V M I N ) ÷ R d i s
The internal resistance of the battery during discharge is expressed by Rdis. The time at the beginning of discharge is represented by t0, and t1 is represented by the time after 10 s of discharge. The discharge pulse-power capability is abbreviated as DPPC. VMIN in the formula represents the upper and lower limits of the cell voltage, and OCV is the open-circuit voltage corresponding to SOC before discharge.

3. Experimental Results and Discussion
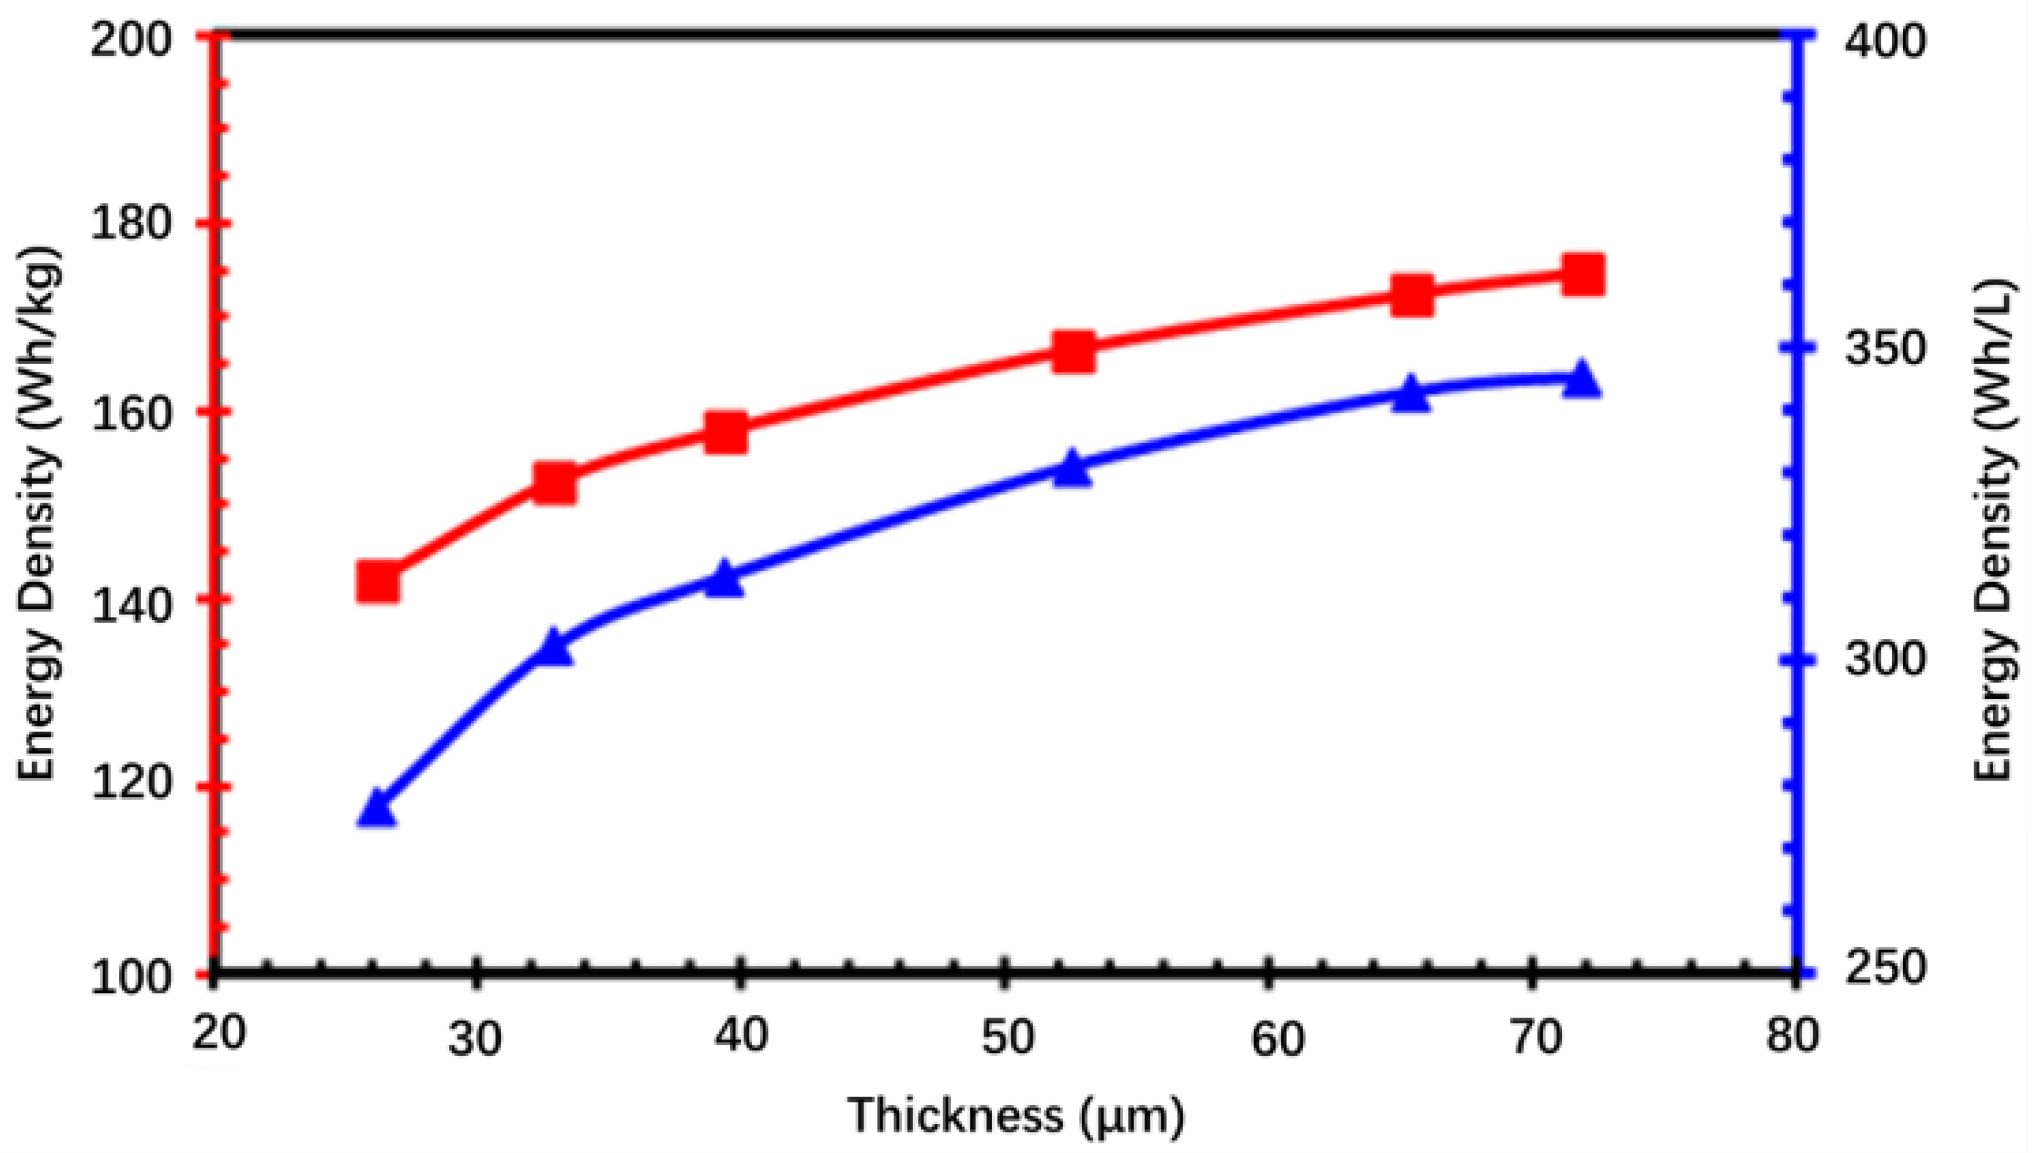
3.1. Energy Density

As presented in Table 3, the capacity of the cell is similar, and the thickness of the cell decreases with the increase in the electrode thickness. As presented in Figure 4, the energy density of the cell increases with the increase in electrode thickness, but the increased amplitude gradually decreases. The cells with different thicknesses have the same capacity and contain the same amount of active substance. The same active substance is evenly coated on the current collector. The smaller the unit-coating amount, the larger the corresponding coating area. The smaller the unit-coating amount, the smaller the electrode’s thickness. The thinner the electrode, the more electrode layers there are in the cell, as presented in Table 3, and the more current-collector layers are needed. As a result, the volume (thickness) and weight of the cell increase, so both the volume and mass energy densities decrease.

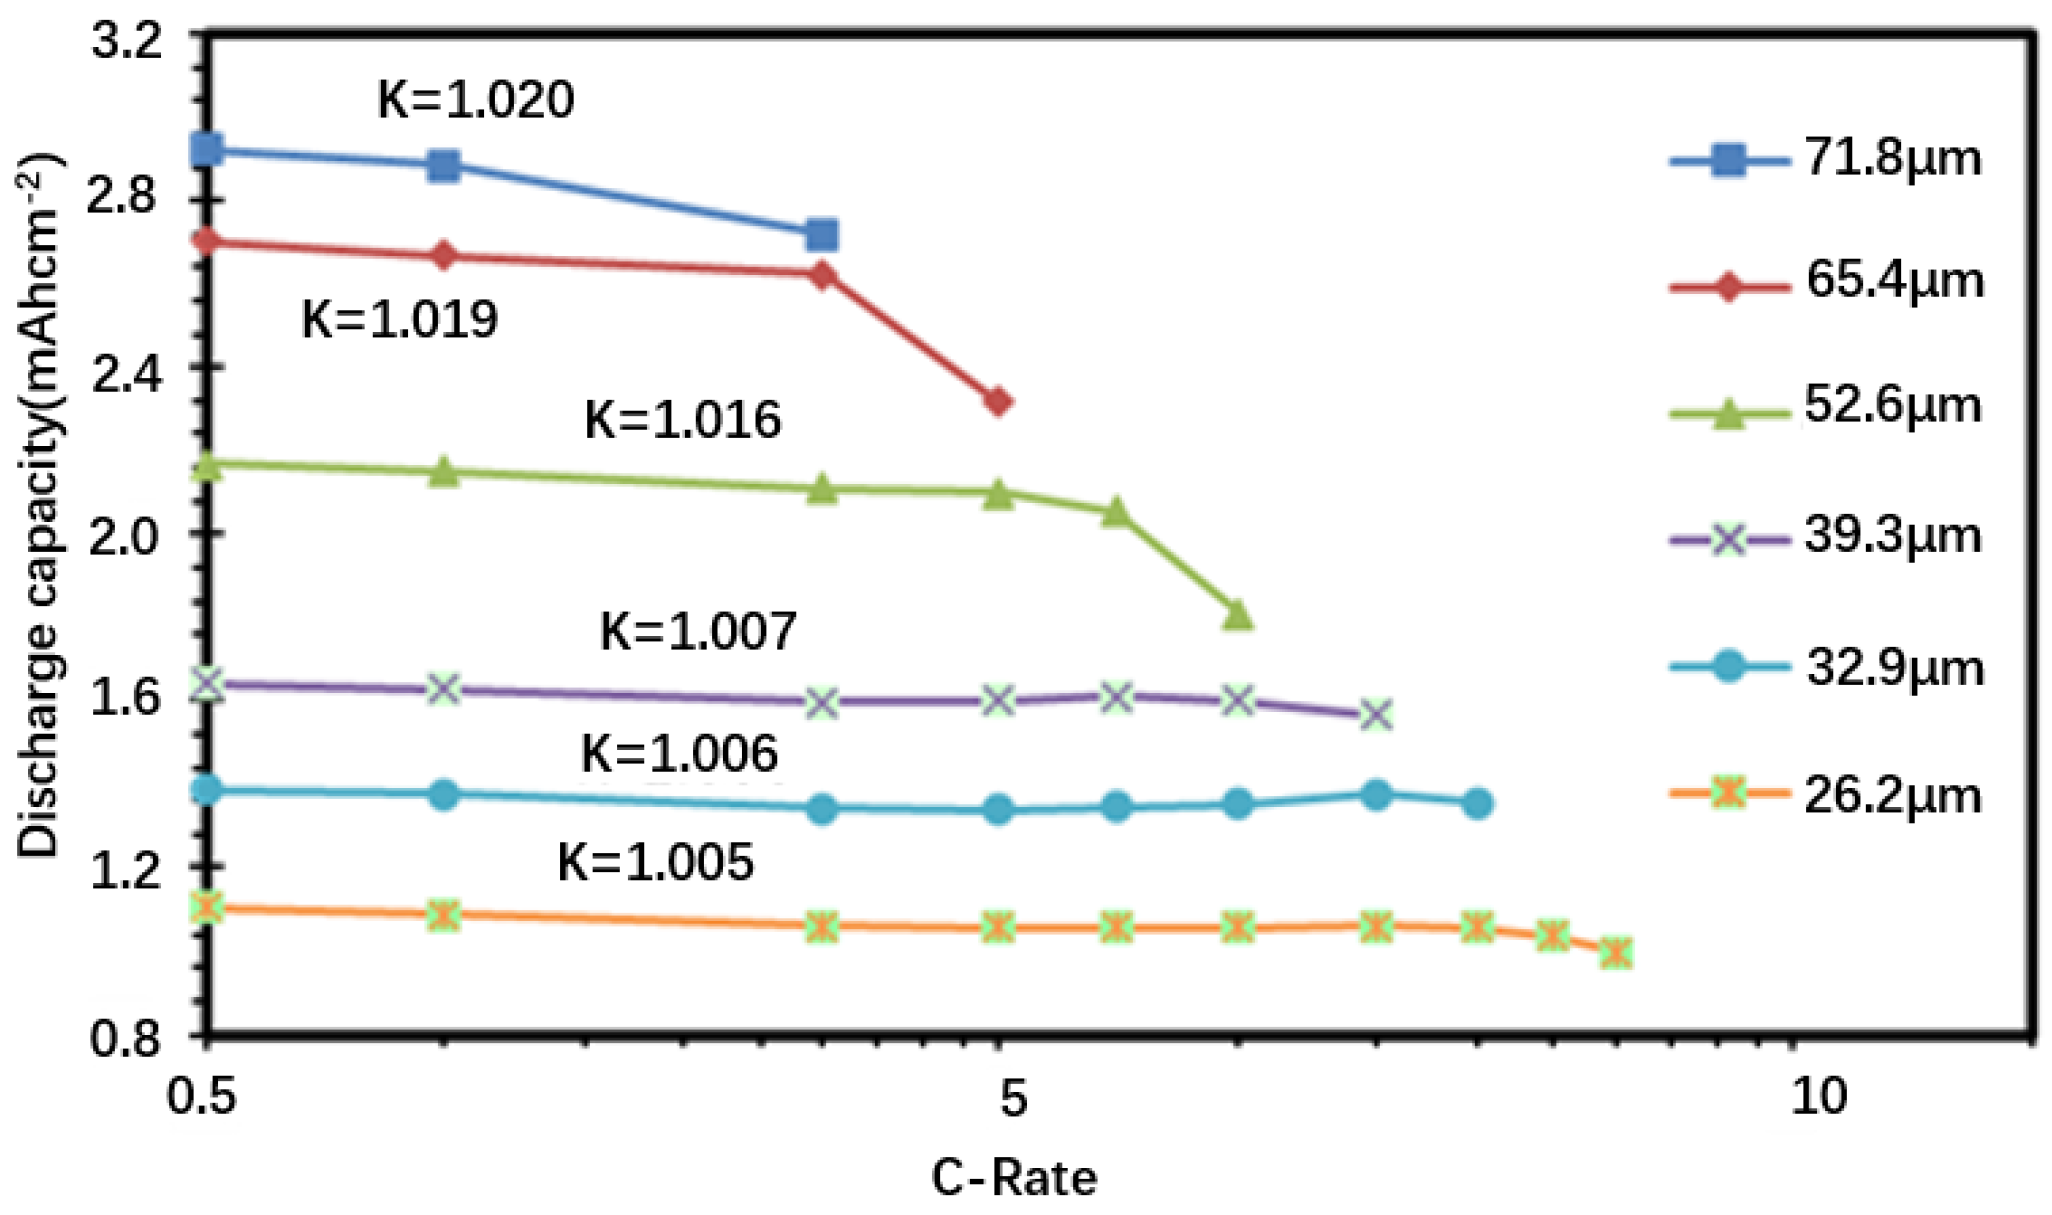
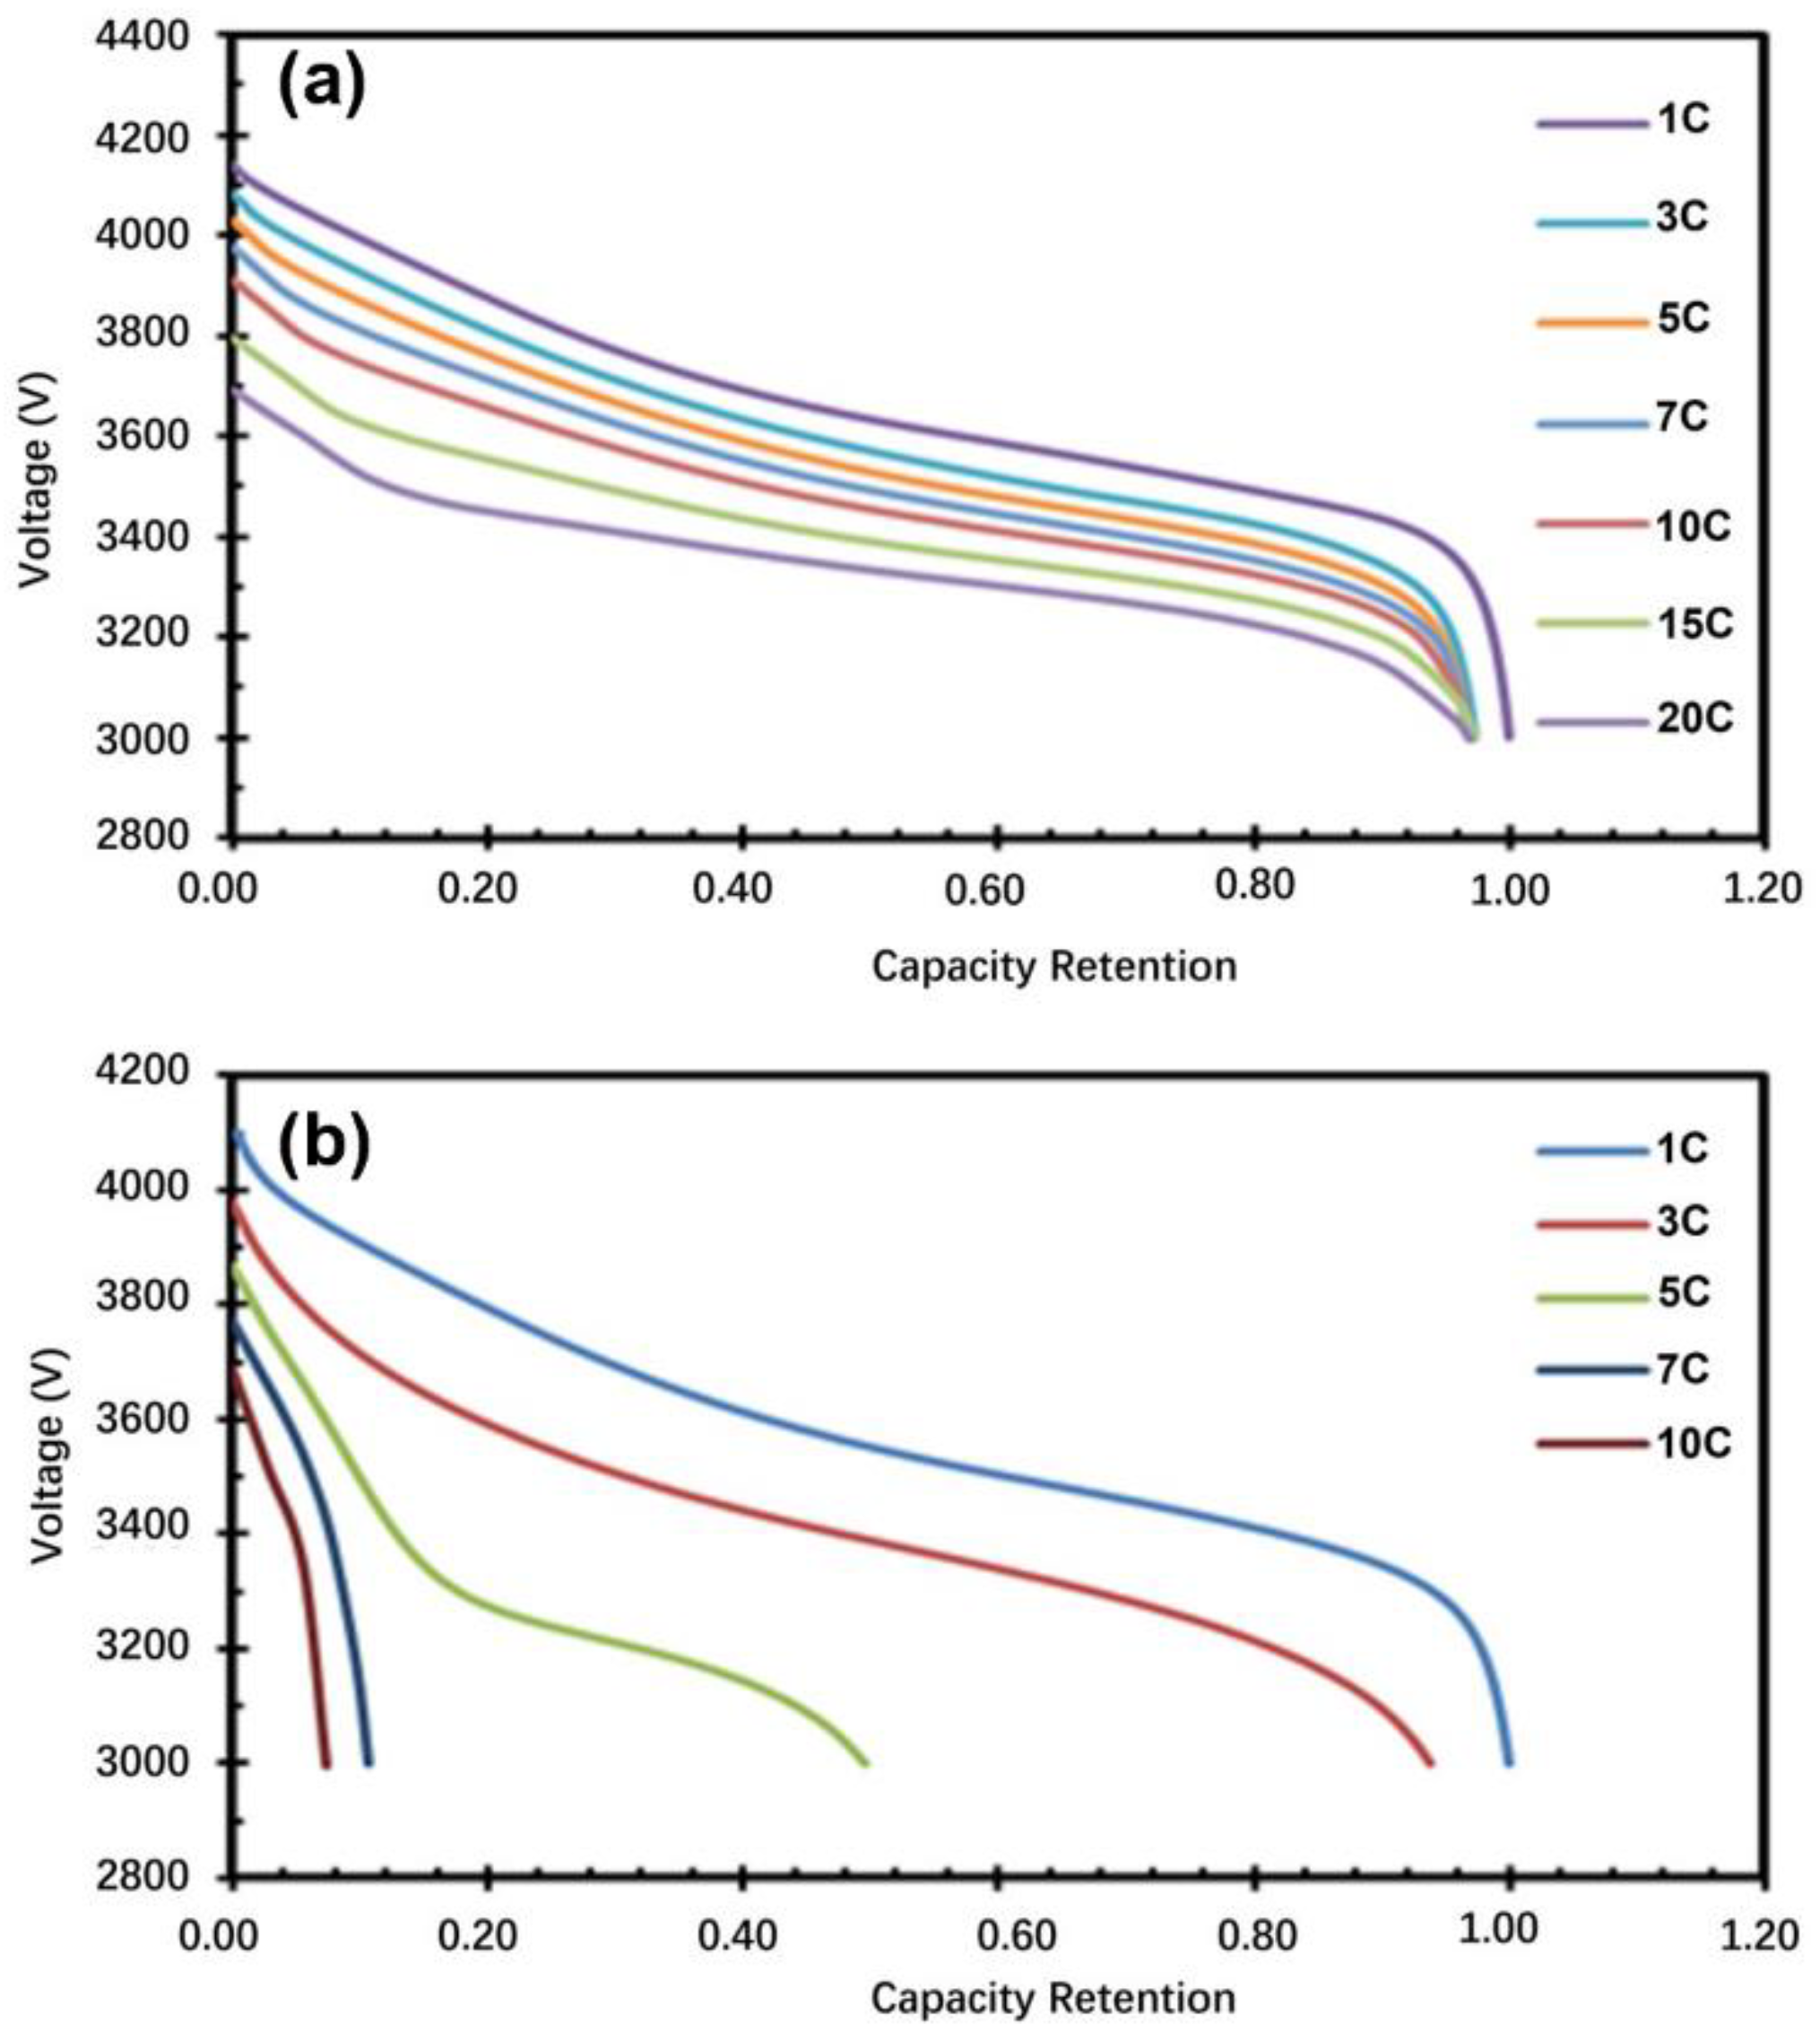
3.2. Discharge Performance (Continuous)

Figure 5 presents the capacities of the cells with different electrode thicknesses obtained from various discharge rates between 0.5 C and 30 C. The cell capacities at 0.5–5 C (except 71.8 μm) obeyed the Peukert law Q = ik × t, where Q is the capacity, k is the Peukert coefficient, and t is the nominal discharge time (in hours) for a specific C rate. The k values range from 1.020 to 1.005 for cells with different electrode thicknesses. Thinner electrodes have a K value close to 1, meaning the accessible capacity of the electrode is independent to the discharge rate [36,37].
Figure 6 presents the discharge curves of the cells prepared by electrodes with thicknesses of 71.8 μm and 26.2 μm at different discharge rates. Some researchers proposed the concept of the characteristic diffusion length of lithium ions [29]. When the discharge ratio is small, the electrode active layer thickness is less than the characteristic diffusion length of lithium ions, and the discharge capacity of the cell is consistent with the structure of the electrode. With the increase in the discharge rate, the characteristic diffusion length of the lithium ion increases. When the characteristic diffusion length is equal to the electrode thickness, the electrode can release almost all of the structure design. The discharge rate increases further, the characteristic diffusion length is less than the electrode’s thickness, and the discharge capacity of the cell is less than the design capacity. In Figure 6a, the thickness of the positive electrode of the cell is 26.2 μm and the discharge rate reaches 20 C, but almost all of the designed capacity can be released. In Figure 6b, the electrode thickness is 71.8 μm. When the discharge rate exceeds 3 C, part of the lithium ions cannot be completely released from the active particles, and the cell cannot release the designed capacity. It is worth mentioning that when the discharge rate is greater than a certain value, the discharge curve drops sharply, as presented in Figure 6b at 7 C discharge, which is caused by internal polarization of the cell. When there is a high concentration difference of lithium ions in the active substance particles during the discharge process, the solid-state diffusion of Li+ is the rate-controlling factor; the electrode potential instantly decreases to the cut-off voltage. Similar conclusions exist within the literature [38,39].
The transport of lithium ions in the electrode is related to the position of active substances in the electrode, electrode potential, diffusion length, and ion-diffusion coefficient, etc. The kinetics of any active point in the electrode is dependent on time and space [40,41,42].
Figure 7 presents the discharge curves of cells prepared with electrodes of different thicknesses discharged at a 5 C rate. The electrode thickness had a considerable influence on the discharge capacity of the cell. As the electrode thickness increased from 26.2 to 71.8 μm, the cell polarization (IR drop) increased obviously, and the initial discharge voltage changed from 4033 to 3880 mV. The platform of the discharge curve also decreased, which resulted from the increase in the polarization of the cell with the increase in the electrode’s thickness. The discharge curves with electrode thicknesses of 65.4 and 71.8 μm presented a significant capacity loss, which was mainly caused by the diffusion of lithium ions in the electrode. At the same discharge rate, the electrode thickness increased and exceeded the characteristic diffusion length of the lithium ions, resulting in the capacity not being fully released. In the discharge process, the greater the electrode’s thickness, the greater the lithium-ion’s transmission resistance, leading to a decrease in the discharge capacity of the cell [29].

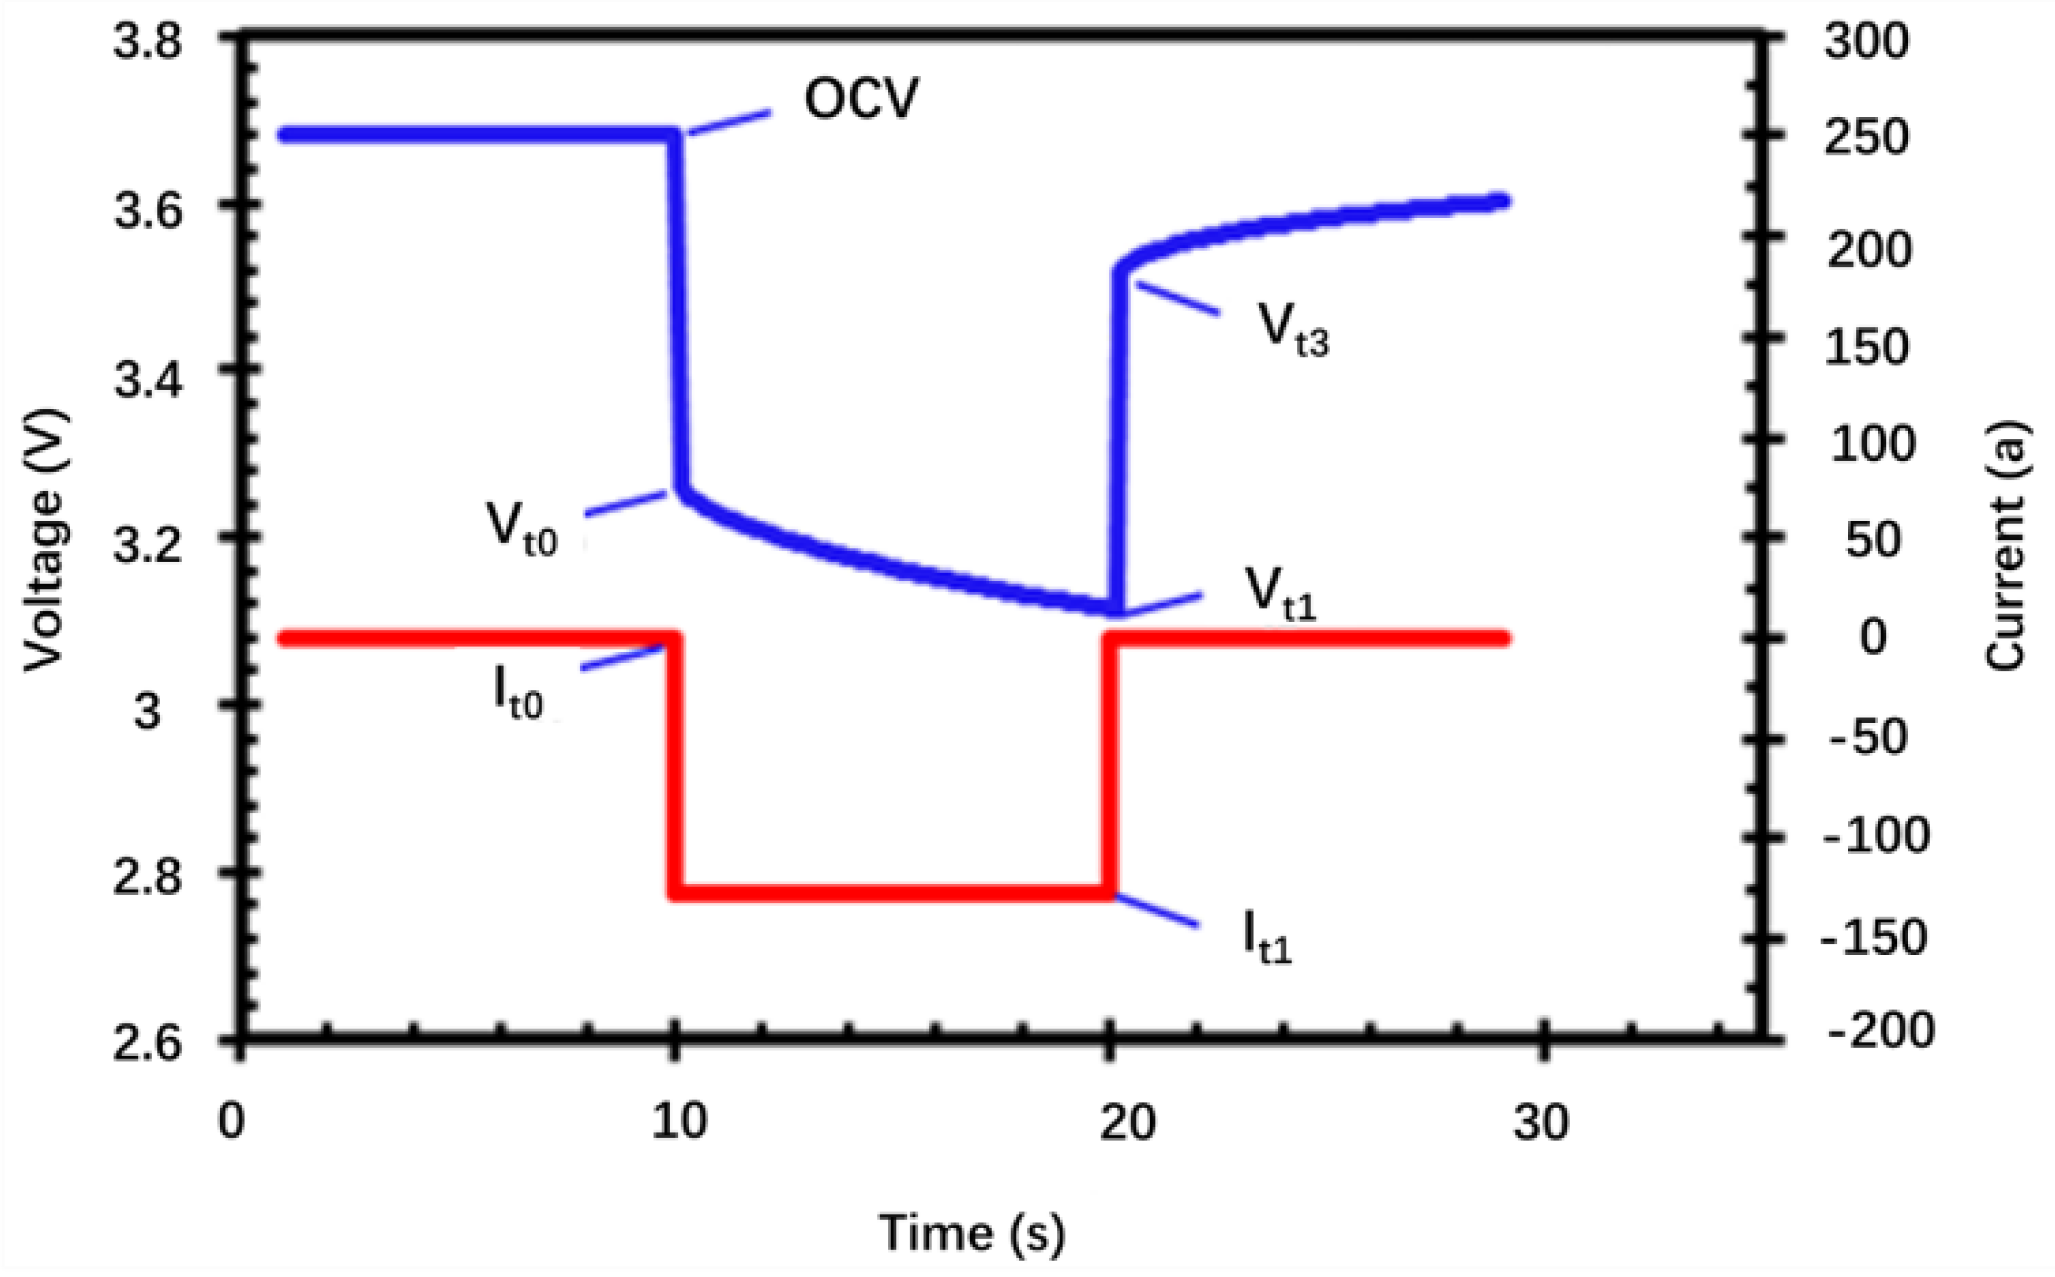
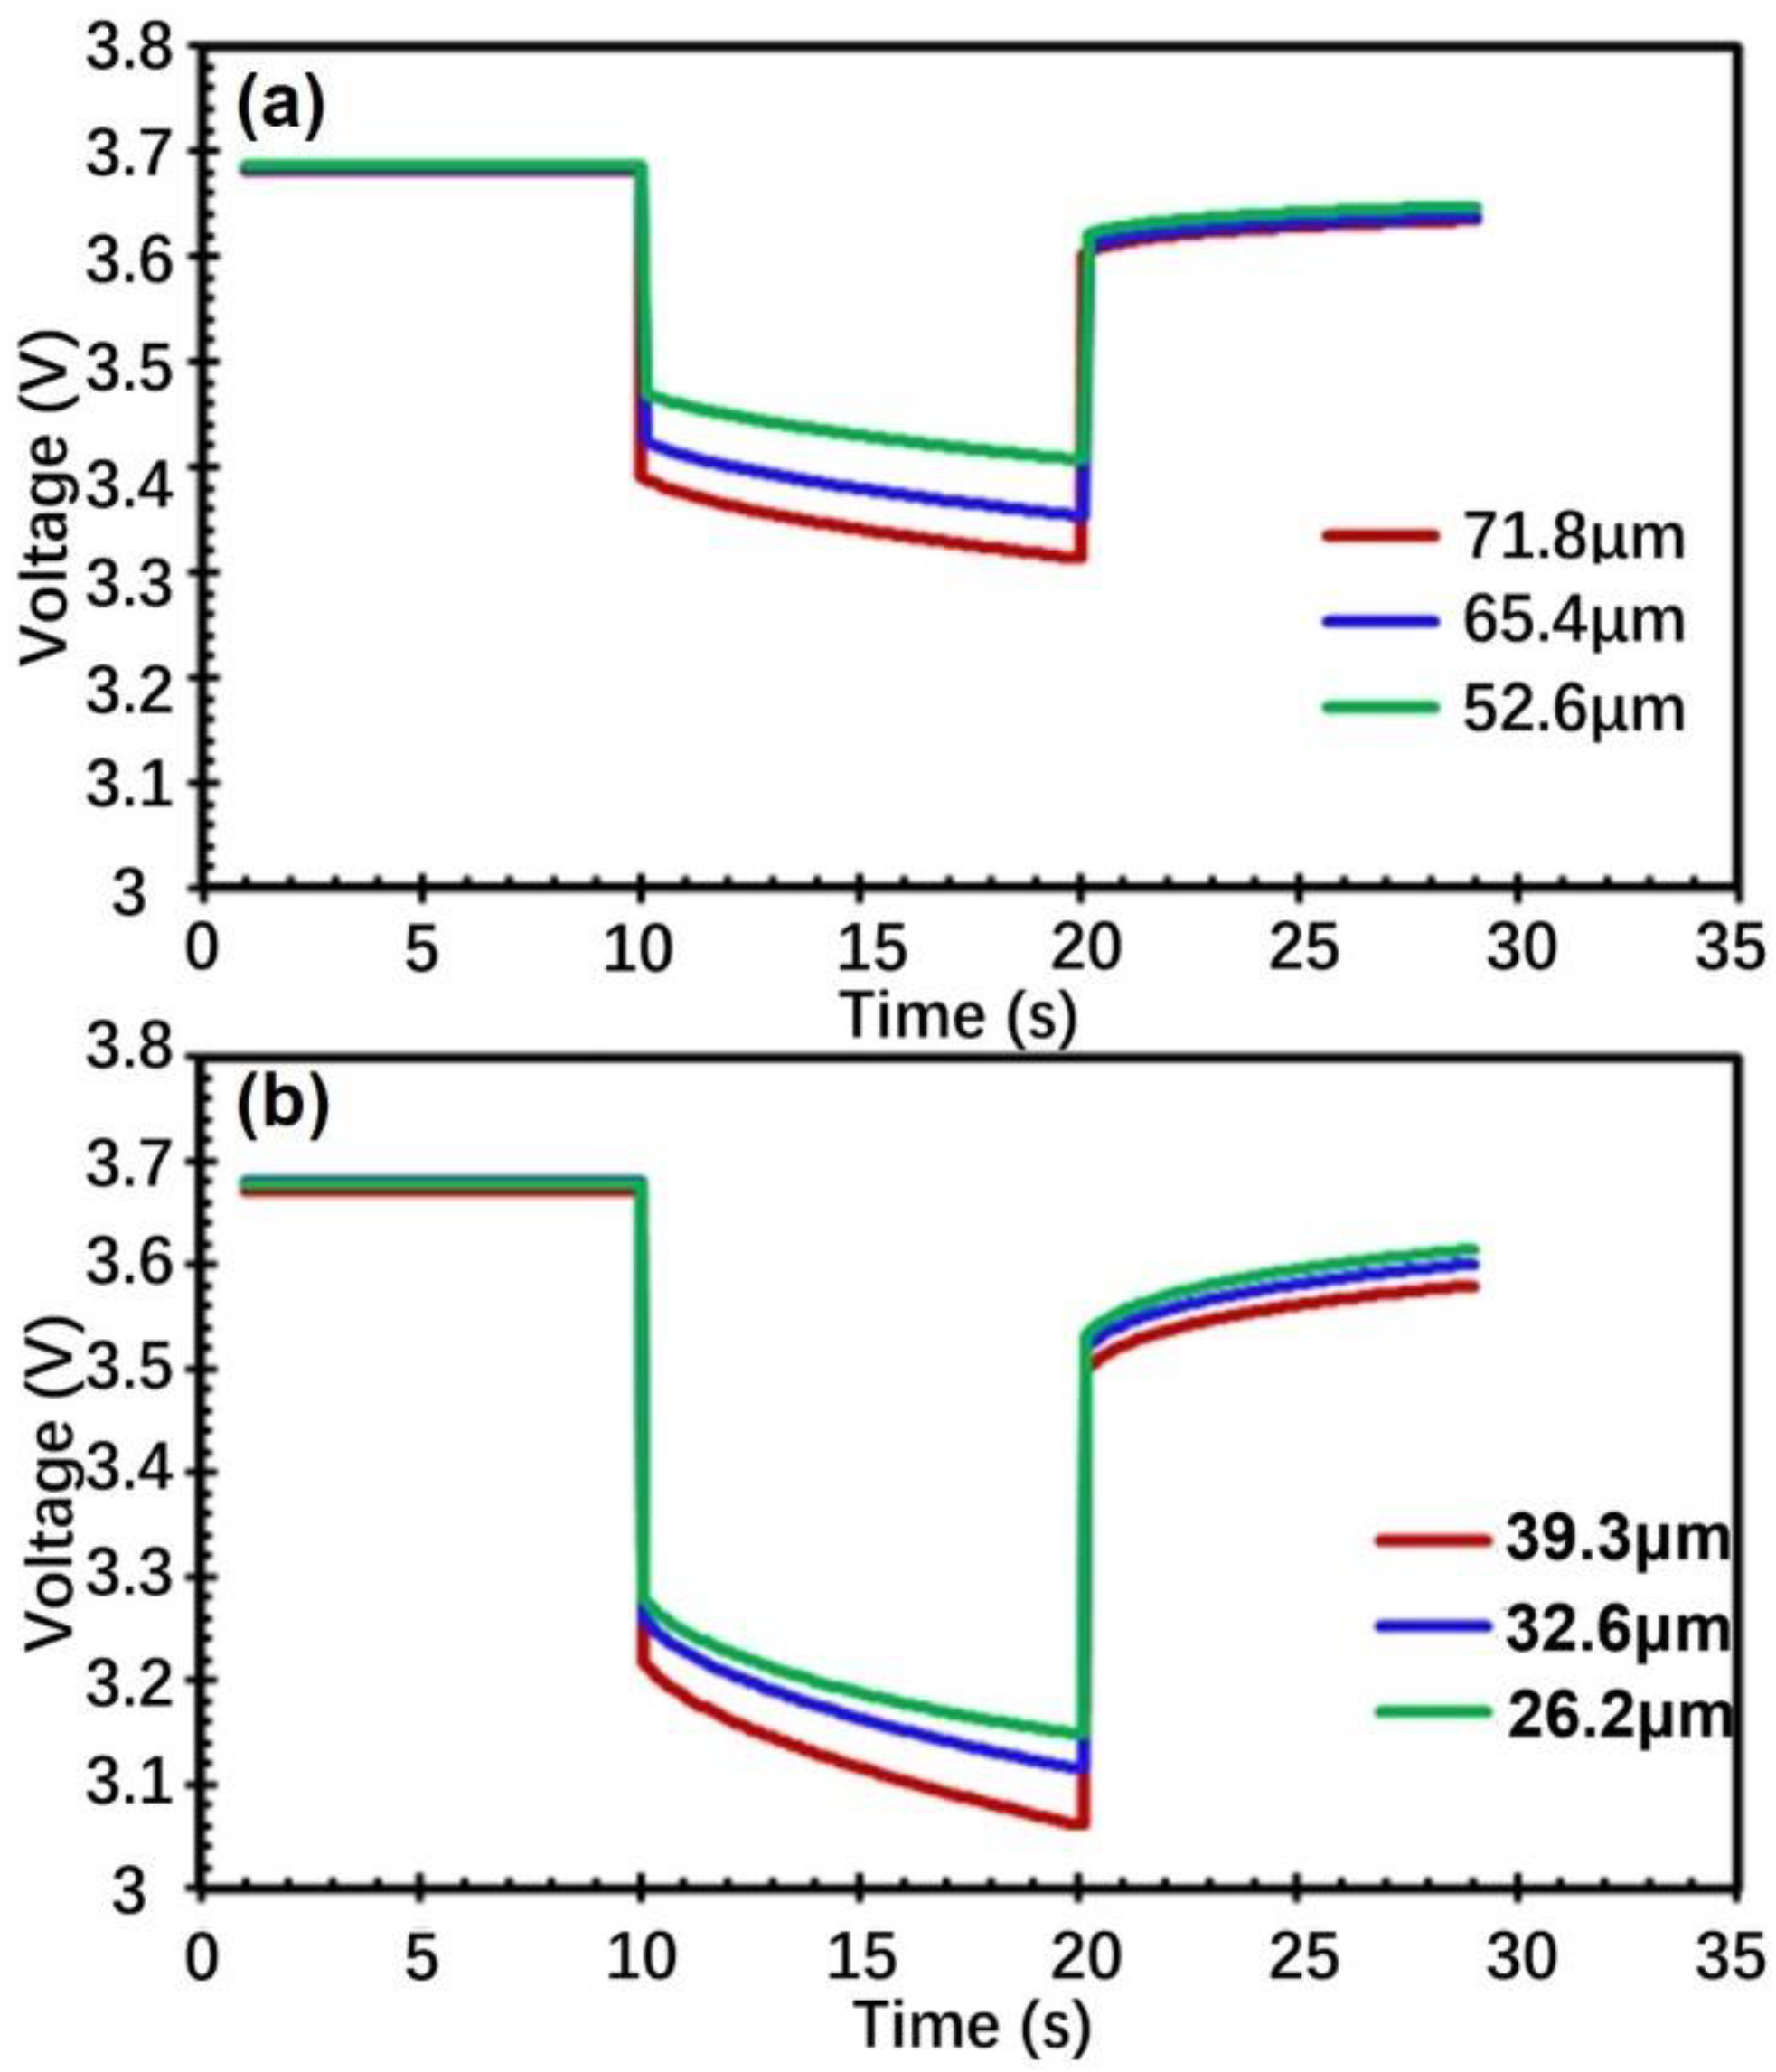
3.3. Discharge Performance (Pulse)

As we all know, the performance of lithium-ion batteries depends on the transport of electrons and ions through the electrodes, which is composed of a porous solid phase and an electrolyte that fills the pores [43]. The transport of electrons and ions is closely related to the electrode’s microstructure. ZHENG H. et al. [36] divided the transport of electrons and ions into several parts, and the transmission of each part had corresponding resistance values: (1) Re: electronic resistance of the electrode; (2) Rs: transport of Li ions in the electrolyte to the active material’s particle surface; (3) RSEI: diffusion of Li ions through the solid electrolyte interphase (SEI) film; (4) Rct: Li-ion charge transfers at the electrode/electrolyte interface; and (5) Rdiff: Li ion diffused within the bulk electrode.
From the perspective of polarization, scholars [44,45,46] decomposed the charging and discharging processes of lithium-ion batteries into inadequate contact between the materials in the electrodes, mass transport of species in the solid phase, and, in the electrolyte, the activation of electrochemical reactions.
According to the continuous-rate-discharge performance of the cell, 5 C was used for a 10 S pulse discharge of the cell with electrode thicknesses of 71.8, 65.4, and 52.6 μm, respectively, and 15 C was used for a 10 S pulse discharge of the cell with electrode thicknesses of 39.3, 32.9, and 26.2 μm, respectively, and to test the power and DC impedance of the cell. The voltage and current changes with time during the pulse-discharge test at 50% SOC are presented in Figure 7. The initial discharge voltage (OCV), instantaneous discharge voltage (Vt0), and discharge terminal voltage (Vt1) are presented in Table 4.
During the initial discharge, the capacity of the cell was almost the same, and the content of active substances was the same, so the electrochemical reaction’s overpotential can be considered unchanged at the same rate of discharge. The voltage sharply decreased due to the contact impedance and ohmic drop of lithium ions in the electrolyte. When the electrode formula, porosity, and microstructure were consistent, the electrode’s thickness increased. This was equivalent to series resistance, resulting in the contact impedance and transmission distance of lithium ions in the increased electrolyte. The ohmic drop of lithium ions in the electrolyte also increased [42]. As the electrode thickness in the cell increased, Vt0 decreased more dramatically. The same conclusion is presented in Figure 8a,b.
As presented in Figure 8, in the discharge process, on the surface of the active substance, Li ions in the electrolyte on the surface of positive active substance, close to the current collector, are more likely to be consumed without effective replenishment. Li ions in the electrolyte on the surface of the active substance, close to the membrane, can be rapidly supplied by the diffusion of Li ions from the counter electrode. This difference led to a concentration gradient of Li ions in the electrode, and with the increase in the electrode’s thickness, the concentration gradient of the Li ions in the electrode also increased, resulting in a increased polarization. The final expression was the inhomogeneity of SOC distribution in the direction of the thickness inside the electrode. It can be observed from Table 1 that under the same discharge rate, Vt0Vt1 increase with the increase in thickness [47].
It is worth mentioning that the reason why the electrode thickness of the cell presented in Figure 8b is small and the voltage change is greater than that presented in Figure 8a is that the pulse discharge rate increased three times.
The power density and DC internal resistance Rdis calculated according to Formulas (2) and (3) are presented in Table 5. The power density of the cell increased from 1813.2 Wh/Kg to 3204.3 Wh/Kg; DC internal resistance Rdis decreased from 7.50 mΩ to 3.34 mΩ as the thickness of the electrode decreased.

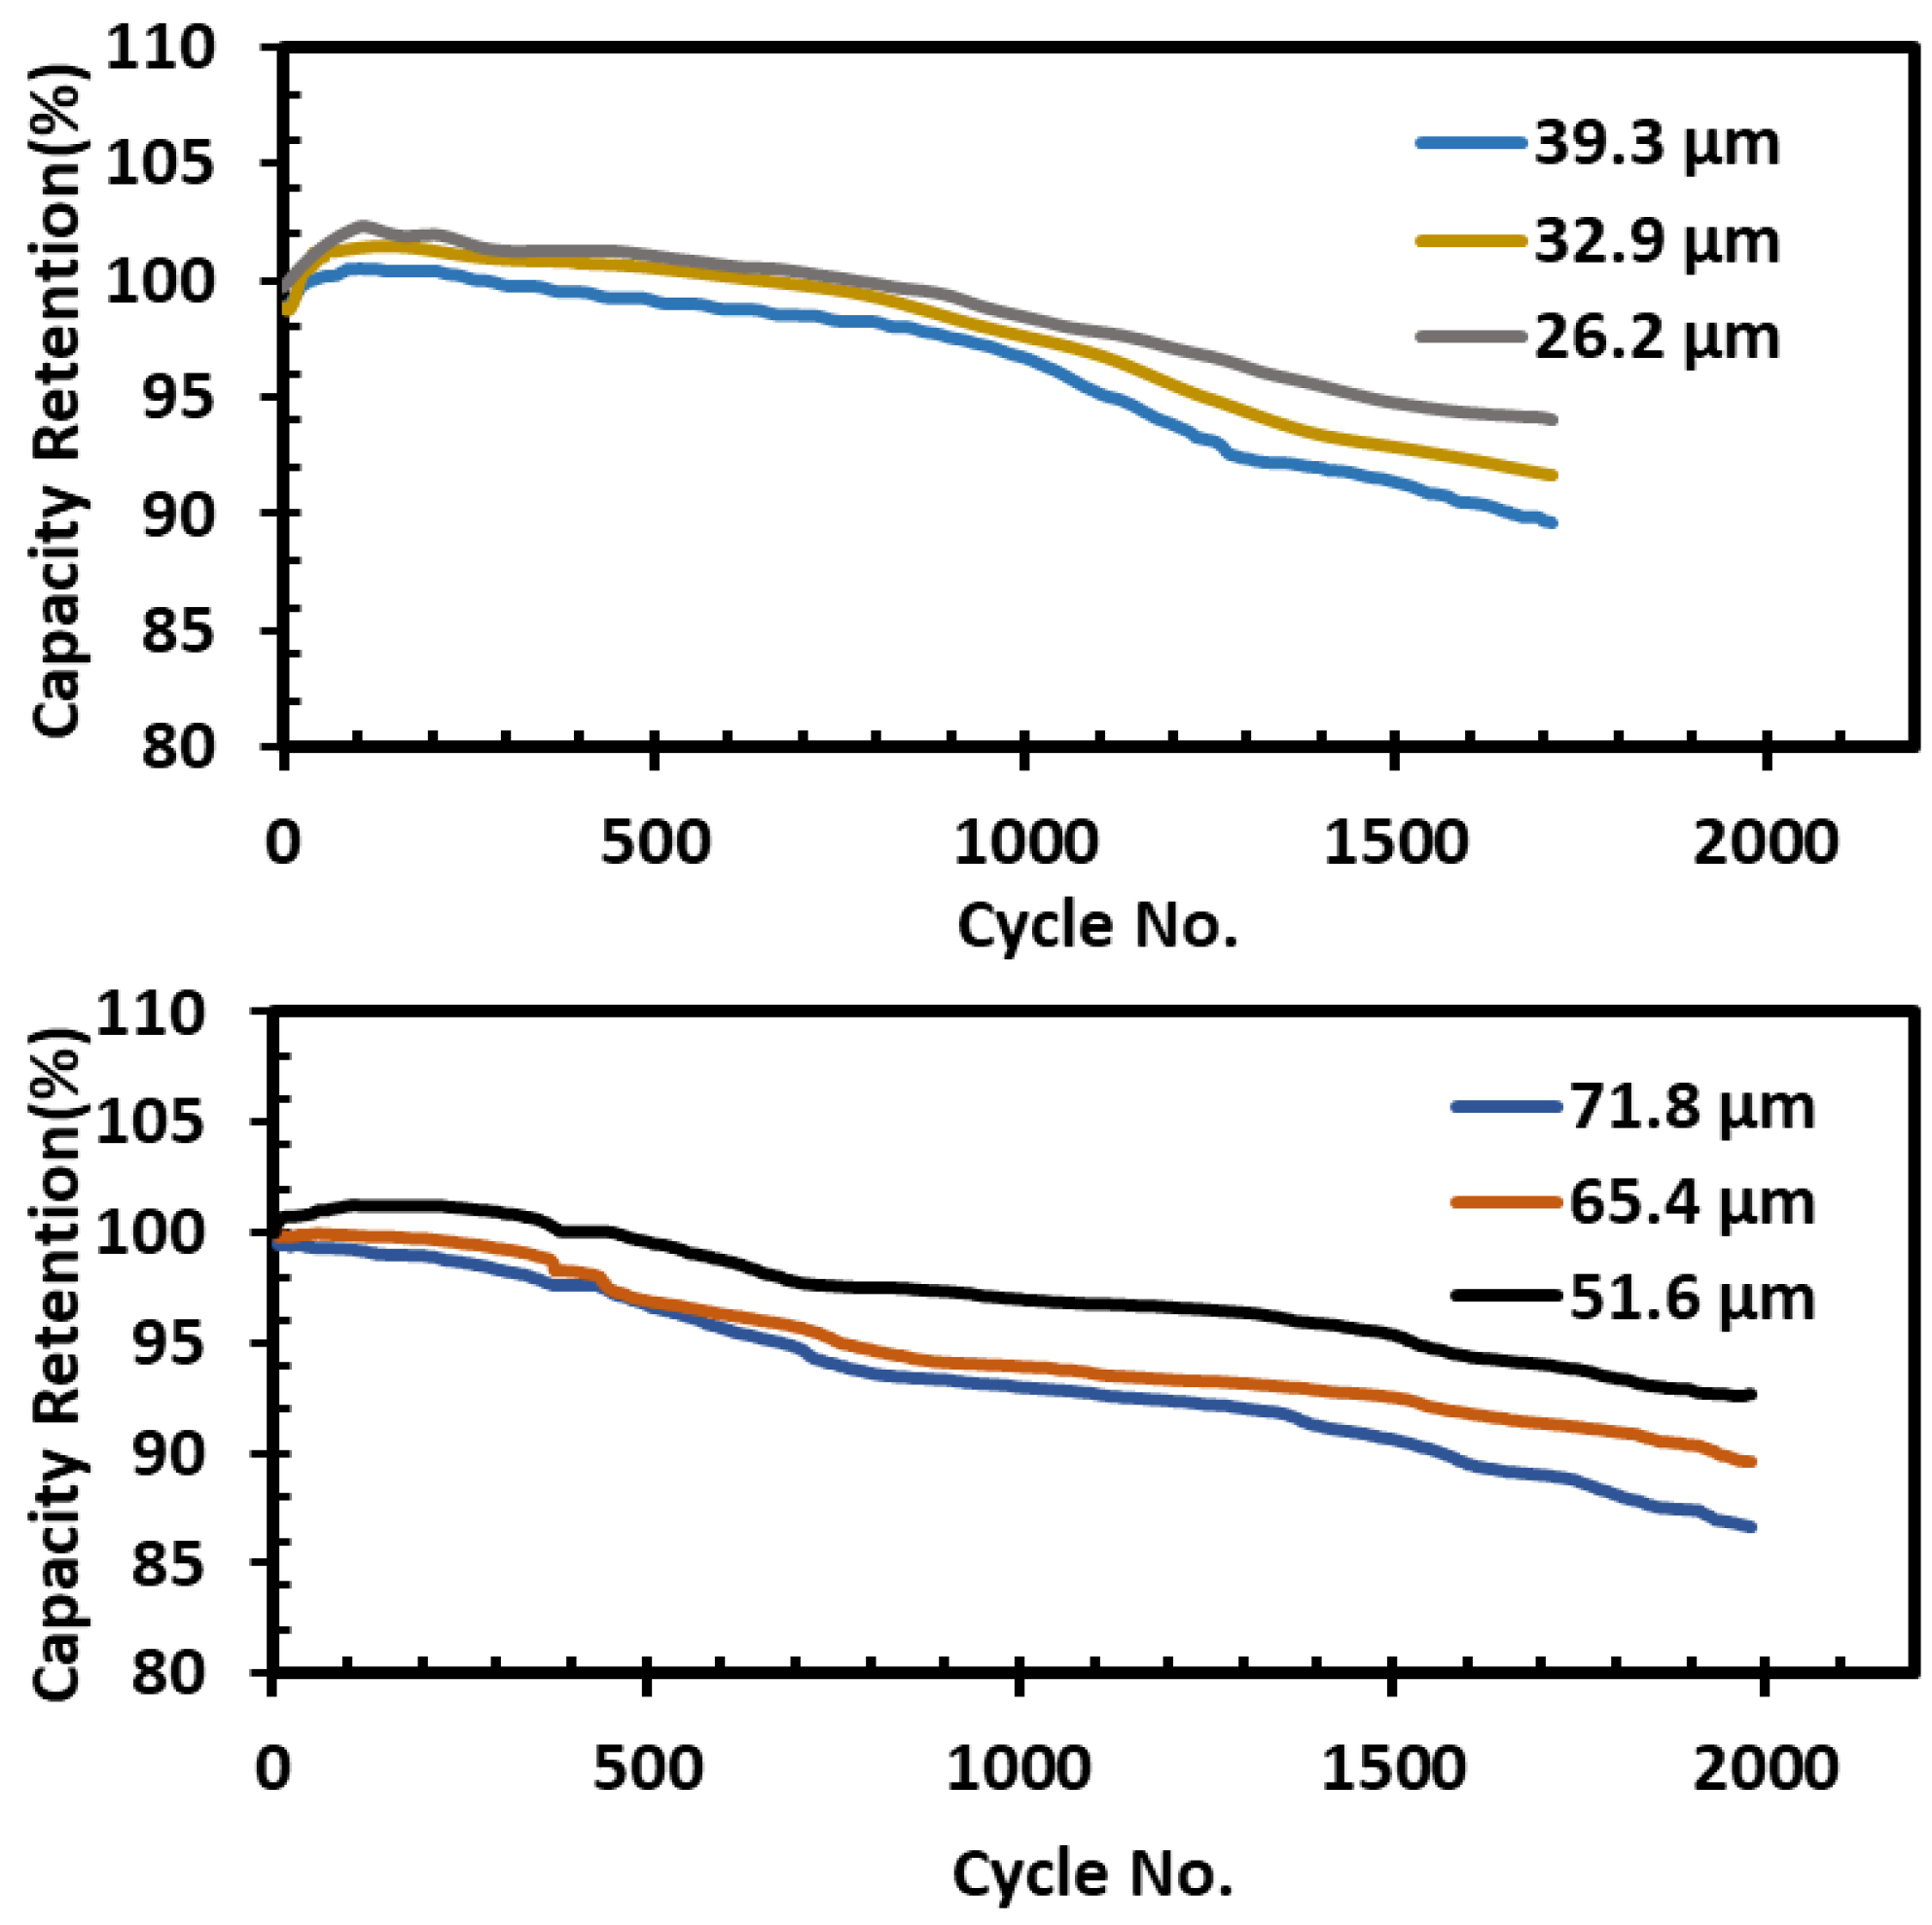
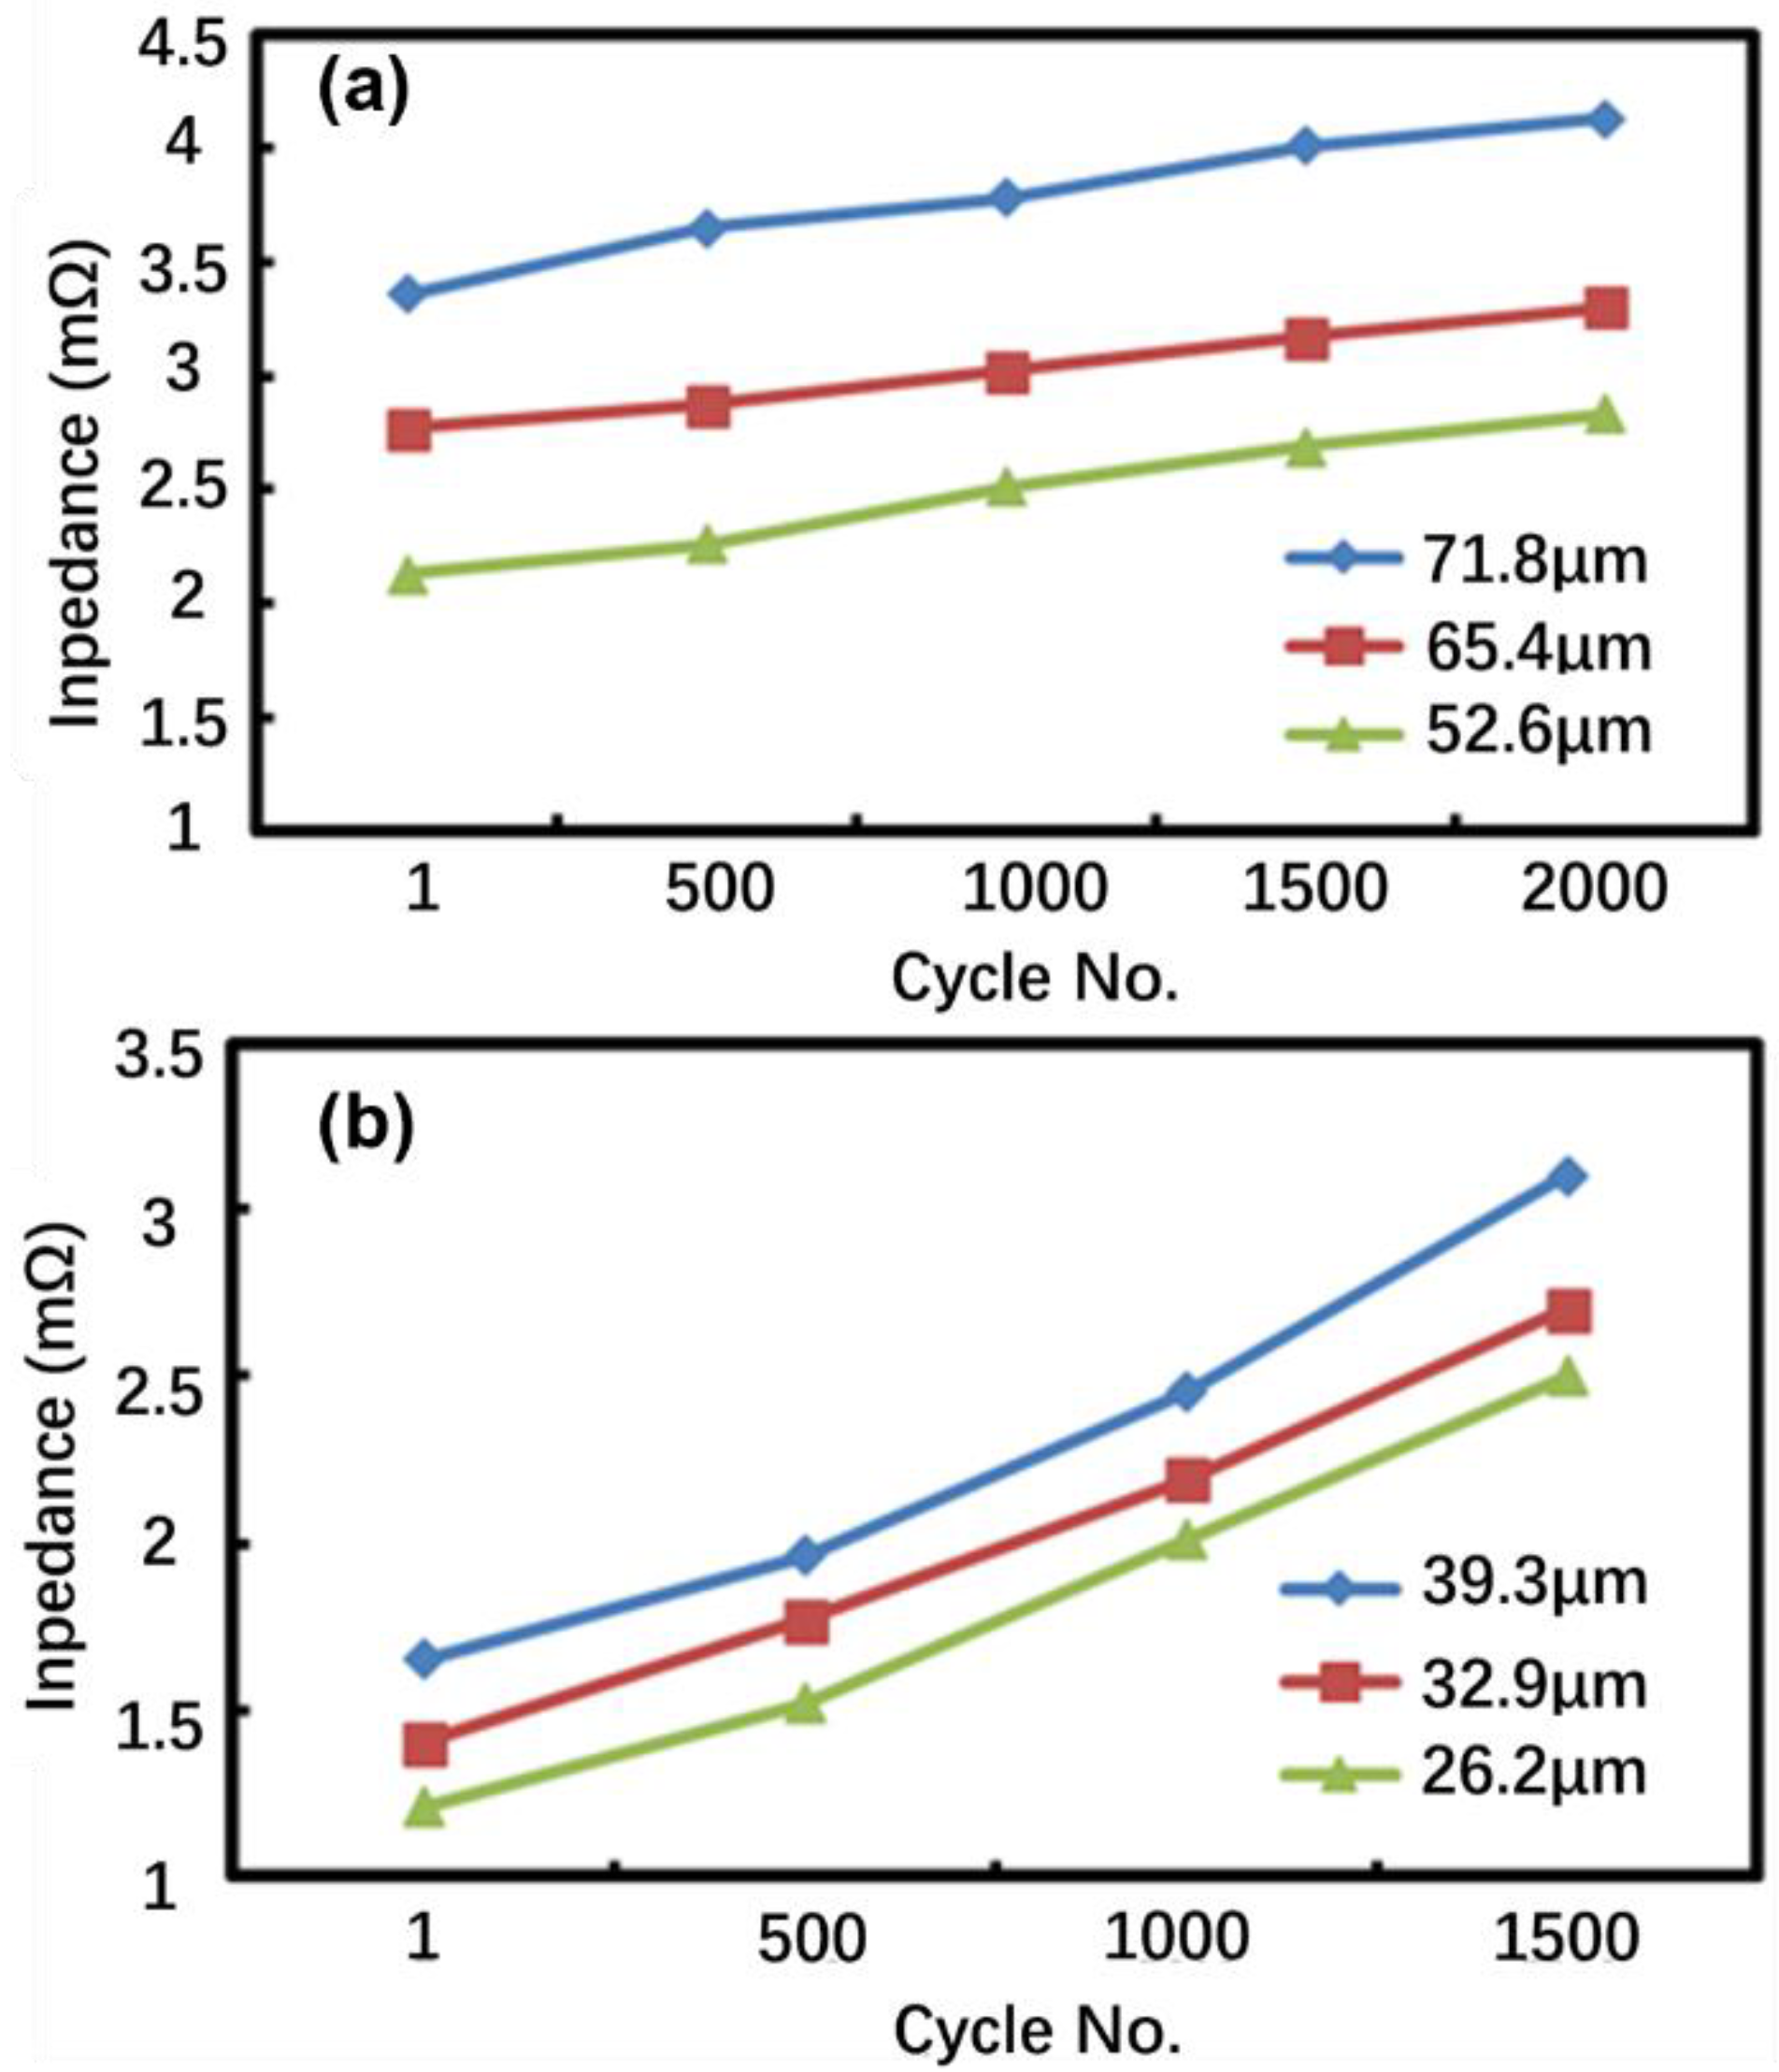
3.4. Long-Term Cycle Performance

The long-term cycling behavior of the full pouch cell with different electrode thicknesses was tested under different conditions. The 1 C charge and 1C discharge rates for the cell with electrode thicknesses of 71.8, 65.4, and 52.6 μm, with voltage windows of 2.8 V to 4.2 V, and 3 C charge and 3 C discharge rates for the cell with electrode thicknesses of 39.3, 32.9, and 26.2 μm, with voltage windows of 2.8 to 4.1 V were presented. Figure 9 presents the capacity fading of the cell during the long-term cycle. Following the long-term cycles, the capacity retention values of the cell, with electrode thicknesses of 71.8, 65.4, and 52.6 μm, were 85, 90, and 92%, respectively. The capacity retention values of the cell, with electrode thicknesses of 39.3, 32.9, and 26.2 μm, were 92, 93, and 94%, respectively. The cycle performance of the cell decreased with the increase in the electrode’s thickness.
The internal resistance of the cell was measured every 500 cycles. As shown in Figure 10, the internal resistance of the cell is a function of the cycle number. The internal resistance of the cell with difference electrode thicknesses displayed a similar trend, increasing with the number of cycles.
For the active substance in the electrode undergoing a volume expansion and contraction during the cycle, the volume change brought about a connection between the active layer and the current collector, and the particles in between the active layer became worse, and the contact impedance increased during the cycle [48]. After repeated charging and discharging, an inactive layer appeared on the surface of the active substance particles, resulting in a loss of capacity and an increase in the diffusion polarization of Li ion in the solid phase [49]. The CEI layer was generated on the surface of the active substance, which blocked the pores in the electrode plate, hindered the transport of Li ions, and increased the transport impedance of Li ions [29].
The SOC in the thickness direction of the electrode was not uniform, which was due to the diffusion polarization of the Li ion in the charging and discharging processes, and the non-uniformity expanded with the increase in the electrode’s thickness. Therefore, the increase in the electrode’s thickness led to a further deterioration of the above-mentioned situation, resulting in impedance increasing and the deterioration of the cycle performance of the cell [50].

4. Conclusions

The pouch cells with electrode thicknesses of 71.8, 65.4, 52.6, 39.3, 32.9, and 26.2 μm, with the same microstructure, were prepared and investigated in the current study. The electrode thickness had a significant effect on energy density, rate performance (continuous and pulse), and long-term cycle performance of the cell. The energy density of the cell was improved by increasing the electrode’s thickness. With the increase in the electrode’s thickness, the decrease in the rate capacity and voltage mainly occurred due to the diffusion of the lithium ions inside the electrode. The long-term cycling performance of the cell presented a higher capacity-fading rate for thicker electrodes. High-capacity fading is ascribed to the mechanical issue of the electrode and severe polarization at larger thickness, considering that all of the above factors, the rate performance (continuous and pulse), and the cycle-life performance of the cell had a strong correlation with the thickness of the electrode. The electrode structure design of the lithium-ion battery was critical for the different performance requirements, such as for batteries used for HEV, PHEV and EV.

Author Contributions

Formal analysis; Investigation; Methodology; Writing—original draft, D.L.; Data curation; Writing—original draft, Q.L.; Conceptualization; Supervision, C.Z.; Writing—review & editing, W.Z.; Data curation; Writing—review & editing, H.G.; Conceptualization; Supervision, S.J.; Supervision, Z.L. All authors have read and agreed to the published version of the manuscript.

Funding

This research was funded by the National Key Research and Development Program of China (Grant No. 2021YFB3703803), National Natural Science Foundation of China (Grant No. 52075555), Special Funds for the Con-struction of Innovative Provinces of Hunan Province (Grant No. 2021GK4035 and Grant No. 2020GK2063), and Natural Science Foundation of Hunan Province (Grant No. 2021JJ10057 and Grant No. 2020JJ4116) for their financial support.

Conflicts of Interest

The authors declare no conflict of interest.

References

  1. Fatima, H.; Zhong, Y.; Wu, H.; Shao, Z. Recent advances in functional oxides for high energy density sodium-ion batteries. Mater. Rep. Energy 2021, 1, 100022. [Google Scholar] [CrossRef]
  2. Yan, B.; Zheng, J.; Feng, L.; Chen, W.; Yang, W.; Dong, Y.; Jiang, S.; Zhang, Q.; He, S. All-cellulose-based high-rate performance solid-state supercapacitor enabled by nitrogen doping and porosity tuning. Diam. Relat. Mater. 2022, 128, 109238. [Google Scholar] [CrossRef]
  3. Chen, Y.; Zhang, Q.; Chi, M.; Guo, C.; Wang, S.; Min, D. Preparation and performance of different carbonized wood electrodes. J. For. Eng. 2022, 7, 127–135. [Google Scholar] [CrossRef]
  4. Han, Z.; Zhong, W.; Wang, K. Preparation and examination of nitrogen-doped bamboo porous carbon for supercapacitor materials. J. For. Eng. 2020, 5, 76–83. [Google Scholar] [CrossRef]
  5. Chen, S.; Jeong, S.R.; Tao, S. Key materials and future perspective for aqueous rechargeable lithium-ion batteries. Mater. Rep. Energy 2022, 2, 100096. [Google Scholar] [CrossRef]
  6. Yu, J.; Liu, S.; Duan, G.; Fang, H.; Hou, H. Dense and thin coating of gel polymer electrolyte on sulfur cathode toward high performance Li-sulfur battery. Compos. Commun. 2020, 19, 239–245. [Google Scholar] [CrossRef]
  7. Scrosati, B.; Garche, J.; Tillmetz, W. Advances in Battery Technologies for Electric Vehicles; Woodhead Publishing: Cambridge, UK, 2015. [Google Scholar]
  8. Yin, H.; Ji, S.; Gu, M.; Zhang, L.; Liu, J. Scalable synthesis of Li1.2 Mn0.54 Ni0.13 Co0.13 O2/LiNi0.5 Mn1.5 O4 sphere composites as stable and high capacity cathodes for Li-ion batteries. RSC Adv. 2015, 5, 84673–84679. [Google Scholar] [CrossRef]
  9. Liao, C.; Li, F.; Liu, J. Challenges and Modification Strategies of Ni-Rich Cathode Materials Operating at High-Voltage. Nanomaterials 2022, 12, 1888. [Google Scholar] [CrossRef]
  10. Pires, V.F.; Romero-Cadaval, E.; Vinnikov, D.; Roasto, I.; Martins, J. Power converter interfaces for electrochemical energy storage systems—A review. Energy Convers. Manag. 2014, 86, 453–475. [Google Scholar] [CrossRef]
  11. Zhang, Q.; Yan, B.; Feng, L.; Zheng, J.; You, B.; Chen, J.; Zhao, X.; Zhang, C.; Jiang, S.; He, S. Progress in the use of organic potassium salts for the synthesis of porous carbon nanomaterials: Microstructure engineering for advanced supercapacitors. Nanoscale 2022, 14, 8216–8244. [Google Scholar] [CrossRef]
  12. Zheng, J.; Yan, B.; Feng, L.; Zhang, Q.; Zhang, C.; Yang, W.; Han, J.; Jiang, S.; He, S. Potassium citrate assisted synthesis of hierarchical porous carbon materials for high performance supercapacitors. Diam. Relat. Mater. 2022, 128, 109247. [Google Scholar] [CrossRef]
  13. Qin, Y.; Liao, Y.; Liu, J.; Tian, C.; Xu, H.; Wu, Y. Research progress of wood-derived energy storage materials. J. For. Eng. 2021, 6, 100654. [Google Scholar] [CrossRef]
  14. Guo, W.; Guo, X.; Yang, L.; Wang, T.; Zhang, M.; Duan, G.; Liu, X.; Li, Y. Synthetic melanin facilitates MnO supercapacitors with high specific capacitance and wide operation potential window. Polymer 2021, 235, 124276. [Google Scholar] [CrossRef]
  15. Hyung-Joo, N.; Sungjune, Y.; Seung, Y.C.; Yang-Kook, S. Comparison of the structural and electrochemical properties of layered Li [NixCoyMnz] O2 (x = 1/3, 0.5, 0.6, 0.7, 0.8 and 0.85) cathode material for lithium-ion batteries. J. Power Sources 2013, 233, 121–130. [Google Scholar]
  16. Zhang, M.J.; Hu, X.; Li, M.; Duan, Y.; Yang, L.; Yin, C.; Ge, M.; Xiao, X.; Lee, W.K.; Ko, J.Y.P. Cooling Induced Surface Reconstruction during Synthesis of High-Ni Layered Oxides. Adv. Energy Mater. 2019, 9, 1901915. [Google Scholar] [CrossRef]
  17. Ryu, H.-H.; Park, K.-J.; Yoon, C.S.; Sun, Y.-K. Capacity fading of Ni-rich Li [NixCoyMn1–x–y] O2 (0.6 ≤ x ≤ 0.95) cathodes for high-energy-density lithium-ion batteries: Bulk or surface degradation? Chem. Mater. 2018, 30, 1155–1163. [Google Scholar] [CrossRef]
  18. Kim, U.-H.; Myung, S.-T.; Yoon, C.S.; Sun, Y.-K. Extending the battery life using an Al-doped Li [Ni0.76Co0.09Mn0.15]O2 cathode with concentration gradients for lithium ion batteries. ACS Energy Lett. 2017, 2, 1848–1854. [Google Scholar] [CrossRef]
  19. Araki, K.; Taguchi, N.; Sakaebe, H.; Tatsumi, K.; Ogumi, Z. Electrochemical properties of LiNi1/3Co1/3Mn1/3O2 cathode material modified by coating with Al2O3 nanoparticles. J. Power Sources 2014, 269, 236–243. [Google Scholar] [CrossRef]
  20. Li, F.; Liu, Z.; Shen, J.; Xu, X.; Zeng, L.; Zhang, B.; Zhu, H.; Liu, Q.; Liu, J.; Zhu, M. A nanorod-like Ni-rich layered cathode with enhanced Li+ diffusion pathways for high-performance lithium-ion batteries. J. Mater. Chem. A 2021, 9, 2830–2839. [Google Scholar] [CrossRef]
  21. Li, F.; Liu, Z.; Shen, J.; Xu, X.; Zeng, L.; Li, Y.; Zhang, D.; Zuo, S.; Liu, J. Ni-rich layered oxide with preferred orientation (110) plane as a stable cathode material for high-energy lithium-ion batteries. Nanomaterials 2020, 10, 2495. [Google Scholar] [CrossRef] [PubMed]
  22. Feng, L.; Yan, B.; Zheng, J.; Chen, J.; Wei, R.; Jiang, S.; Yang, W.; Zhang, Q.; He, S. Soybean protein-derived N, O co-doped porous carbon sheets for supercapacitor applications. New J. Chem. 2022, 46, 10844–10853. [Google Scholar] [CrossRef]
  23. Indrikova, M.; Grunwald, S.; Golks, F.; Netz, A.; Westphal, B.; Kwade, A. The morphology of battery electrodes with the focus of the conductive additives paths. J. Electrochem. Soc. 2015, 162, A2021. [Google Scholar] [CrossRef]
  24. Jin, Z.; Yang, L.; Shi, S.; Wang, T.; Duan, G.; Liu, X.; Li, Y. Flexible Polydopamine Bioelectronics. Adv. Funct. Mater. 2021, 31, 2103391. [Google Scholar] [CrossRef]
  25. Yang, L.; Guo, X.; Jin, Z.; Guo, W.; Duan, G.; Liu, X.; Li, Y. Emergence of melanin-inspired supercapacitors. Nano Today 2021, 37, 101075. [Google Scholar] [CrossRef]
  26. Han, X.; Xiao, G.; Wang, Y.; Chen, X.; Duan, G.; Wu, Y.; Gong, X.; Wang, H. Design and fabrication of conductive polymer hydrogels and their applications in flexible supercapacitors. J. Mater. Chem. A 2020, 8, 23059–23095. [Google Scholar] [CrossRef]
  27. Wang, Y.; Zhang, L.; Hou, H.; Xu, W.; Duan, G.; He, S.; Liu, K.; Jiang, S. Recent progress in carbon-based materials for supercapacitor electrodes: A review. J. Mater. Sci. 2021, 56, 173–200. [Google Scholar] [CrossRef]
  28. Chen, J.; Xiao, G.; Duan, G.; Wu, Y.; Zhao, X.; Gong, X. Structural design of carbon dots/porous materials composites and their applications. Chem. Eng. J. 2021, 421, 127743. [Google Scholar] [CrossRef]
  29. Zheng, H.; Li, J.; Song, X.; Liu, G.; Battaglia, V.S. A comprehensive understanding of electrode thickness effects on the electrochemical performances of Li-ion battery cathodes. Electrochim. Acta 2012, 71, 258–265. [Google Scholar] [CrossRef]
  30. Denis, Y.; Donoue, K.; Inoue, T.; Fujimoto, M.; Fujitani, S. Effect of electrode parameters on LiFePO4 cathodes. J. Electrochem. Soc. 2006, 153, A835. [Google Scholar]
  31. Hamankiewicz, B.; Michalska, M.; Krajewski, M.; Ziolkowska, D.; Lipinska, L.; Korona, K.; Kaminska, M.; Czerwinski, A. The effect of electrode thickness on electrochemical performance of LiMn2O4 cathode synthesized by modified sol–gel method. Solid State Ion. 2014, 262, 9–13. [Google Scholar] [CrossRef]
  32. Thunman, M.; Marquardt, K.; Hahn, R.; Kober, D.; Goerke, O.; Schubert, H. Discharge performance dependence on electrode thickness for li4ti5o12/limn2o4 cells for application in wafer-integrated microbatteries. Ecs Trans. 2012, 41, 147. [Google Scholar] [CrossRef]
  33. Heubner, C.; Nickol, A.; Seeba, J.; Reuber, S.; Junker, N.; Wolter, M.; Schneider, M.; Michaelis, A. Understanding thickness and porosity effects on the electrochemical performance of LiNi0.6Co0.2Mn0.2O2-based cathodes for high energy Li-ion batteries. J. Power Sources 2019, 419, 119–126. [Google Scholar] [CrossRef]
  34. Kraytsberg, A.; Ein-Eli, Y. Conveying Advanced Li-ion Battery Materials into Practice The Impact of Electrode Slurry Preparation Skills. Adv. Energy Mater. 2016, 6, 1600655. [Google Scholar] [CrossRef]
  35. Parikh, D.; Christensen, T.; Li, J. Correlating the influence of porosity, tortuosity, and mass loading on the energy density of LiNi0.6Mn0.2Co0.2O2 cathodes under extreme fast charging (XFC) conditions. J. Power Sources 2020, 474, 228601. [Google Scholar] [CrossRef]
  36. Dubarry, M.; Liaw, B.Y. Identify capacity fading mechanism in a commercial LiFePO4 cell. J. Power Sources 2009, 194, 541–549. [Google Scholar] [CrossRef]
  37. Dubarry, M.; Truchot, C.; Cugnet, M.; Liaw, B.Y.; Gering, K.; Sazhin, S.; Jamison, D.; Michelbacher, C. Evaluation of commercial lithium-ion cells based on composite positive electrode for plug-in hybrid electric vehicle applications. Part I: Initial characterizations. J. Power Sources 2011, 196, 10328–10335. [Google Scholar] [CrossRef]
  38. Ding, C.; Meng, Q.; Wang, L.; Chen, C. Synthesis, structure, and electrochemical characteristics of LiNi1/3Co1/3Mn1/3O2 prepared by thermal polymerization. Mater. Res. Bull. 2009, 44, 492–498. [Google Scholar] [CrossRef]
  39. Lee, J.-W.; Lee, J.-H.; Viet, T.T.; Lee, J.-Y.; Kim, J.-S.; Lee, C.-H. Synthesis of LiNi1/3Co1/3Mn1/3O2 cathode materials by using a supercritical water method in a batch reactor. Electrochim. Acta 2010, 55, 3015–3021. [Google Scholar] [CrossRef]
  40. Tran, T.; Feikert, J.; Pekala, R.; Kinoshita, K. Rate effect on lithium-ion graphite electrode performance. J. Appl. Electrochem. 1996, 26, 1161–1167. [Google Scholar] [CrossRef]
  41. Garcia-Belmonte, G. Effect of electrode morphology on the diffusion length of the doping process of electronically conducting polypyrrole films. Electrochem. Commun. 2003, 5, 236–240. [Google Scholar] [CrossRef]
  42. Bisquert, J.; Vikhrenko, V.S. Analysis of the kinetics of ion intercalation. Two state model describing the coupling of solid state ion diffusion and ion binding processes. Electrochim. Acta 2002, 47, 3977–3988. [Google Scholar] [CrossRef]
  43. Pouraghajan, F.; Thompson, A.I.; Hunter, E.E.; Mazzeo, B.; Christensen, J.; Subbaraman, R.; Wray, M.; Wheeler, D. The effects of cycling on ionic and electronic conductivities of Li–ion battery electrodes. J. Power Sources 2021, 492, 229636. [Google Scholar] [CrossRef]
  44. Nyman, A.; Zavalis, T.G.; Elger, R.; Behm, M.; Lindbergh, G. Analysis of the polarization in a Li-ion battery cell by numerical simulations. J. Electrochem. Soc. 2010, 157, A1236. [Google Scholar] [CrossRef]
  45. Wang, M.; Li, J.; He, X.; Wu, H.; Wan, C. The effect of local current density on electrode design for lithium-ion batteries. J. Power Sources 2012, 207, 127–133. [Google Scholar] [CrossRef]
  46. Jiang, F.; Peng, P. Elucidating the performance limitations of lithium-ion batteries due to species and charge transport through five characteristic parameters. Sci. Rep. 2016, 6, 32639. [Google Scholar] [CrossRef] [Green Version]
  47. Lain, M.J.; Kendrick, E. Understanding the limitations of lithium ion batteries at high rates. J. Power Sources 2021, 493, 229690. [Google Scholar] [CrossRef]
  48. Park, J.; Lu, W.; Sastry, A.M. Numerical simulation of stress evolution in lithium manganese dioxide particles due to coupled phase transition and intercalation. J. Electrochem. Soc. 2010, 158, A201. [Google Scholar] [CrossRef]
  49. Remmlinger, J.; Buchholz, M.; Meiler, M.; Bernreuter, P.; Dietmayer, K. State-of-health monitoring of lithium-ion batteries in electric vehicles by on-board internal resistance estimation. J. Power Sources 2011, 196, 5357–5363. [Google Scholar] [CrossRef]
  50. Kim, H.; Oh, S.K.; Lee, J.; Doo, S.W.; Kim, Y.; Lee, K.T. Failure mode of thick cathodes for li-ion batteries: Variation of state-of-charge along the electrode thickness direction. Electrochim. Acta 2021, 370, 137743. [Google Scholar] [CrossRef]
Figure 1. SEM images of cathode material SN1 and anode material A8-5. Scale bar = 10 μm.
Batteries 08 00101 g001
Figure 2. Physical view of the pouch cell.
Batteries 08 00101 g002
Figure 3. Pulse−power characterization profile.
Batteries 08 00101 g003
Figure 4. Relationship between electrode thickness and energy density.
Batteries 08 00101 g004
Figure 5. Peukert curves of cells with different electrode thicknesses.
Batteries 08 00101 g005
Figure 6. Discharge curves at different rates: (a) electrode thickness of 26.2 μm; (b) electrode thickness of 71.8 μm.
Batteries 08 00101 g006
Figure 7. Comparison of discharge curves for the NCM electrode at the rate of 5 C.
Batteries 08 00101 g007
Figure 8. Pulse discharge curves for cells with different electrode thicknesses at 50% SOC: (a) 5 C discharge for 10 S; (b) 15 C discharge for 10 S.
Batteries 08 00101 g008
Figure 9. Long-term cycle performance of cell with different electrode thicknesses.
Batteries 08 00101 g009
Figure 10. Relation between electrode thickness and AC internal resistance of pouch cell. (a) The electrode thickness of the cell is 71.8 μm, 65.4 μm and 52.6 μm, respectively, (b) The electrode thickness of the cell is 39.3 μm, 32.9 μm and 26.2 μm, respectively.
Batteries 08 00101 g010
Table 1. True density of substance in the positive electrode.
ComponentsTrue Density (kg/m3)
Al2700
Li[Ni1/3Co1/3Mn1/3]O24651
Carbon black1800
CNT2100
PVDF1710
Table 2. Physical parameters of the positive electrode.
Electrode Thickness (μm)Coated Weight (mg/cm2)Compaction Density (g/cm3)Porosity
71.821.93.0527.1%
65.420.03.0527.1%
52.616.03.0427.3%
39.311.93.0427.4%
32.910.03.0527.1%
26.28.03.0427.4%
Table 3. Size and basic performance information of pouch cell.
Electrode thickness (μm)71.865.452.639.332.926.2
Cell thickness (mm)5.55.65.86.26.57.1
Positive\negative electrode layers11\1212\1315\1420\2124\2530\31
capacity@1C, 25 °C (Ah)8.78.88.88.99.09.0
Internal resistance (mΩ)3.32.72.11.61.41.2
Weight of the cell (g)181.9183.3192.9205.7215.4231.1
Energy density (Wh/kg)174.6175.2166.5157.9152.5142.1
Energy density (Wh/L)345.4343331.2313.4302.3276.7
Table 4. The voltage change of the cell during pulse discharge.
Electrode Thickness (μm)OCVVt0OCV-Vt0Vt1Vt0Vt1OCV-Vt1
71.83.6823.3920.2903.3140.0780.368
65.43.6833.4260.2573.3540.0720.329
52.63.6873.470.2173.4070.0640.281
39.33.6733.2170.4563.0610.1560.612
32.93.6803.2590.4213.1150.1440.565
26.23.6783.2790.3993.1480.1310.53
Table 5. The power density and DC internal resistance Rdis of the cell.
Electrode Thickness (μm)Power Density (W/Kg)Rdis (mΩ)
71.81813.27.50
65.42009.76.72
52.62455.85.26
39.32938.04.04
32.93200.63.58
26.23204.33.34
Publisher’s Note: MDPI stays neutral with regard to jurisdictional claims in published maps and institutional affiliations.

