

Low-Computational Model to Predict Individual Temperatures of Cells within Battery Modules
by
 , , and
Ali Abbas
1,2,
Nassim Rizoug
1,
Rochdi Trigui
2,*,
Eduardo Redondo-Iglesias
2 and
and
Serge Pelissier
2 1
Laboratoire des Systèmes et Energies Embarqués pour les Transports, École Supérieure des Techniques Aéronautiques et de Construction Automobile (ESTACA), 53000 Laval, France
2
Univ Eiffel, Univ Lyon, ENTPE, LICIT-ECO7, 69675 Lyon, France
*
Author to whom correspondence should be addressed.
Batteries 2024, 10(3), 98; https://doi.org/10.3390/batteries10030098
Submission received: 23 January 2024
/
Revised: 26 February 2024
/
Accepted: 5 March 2024
/
Published: 12 March 2024
(This article belongs to the Special Issue Towards a Smarter Battery Management System)
Abstract
:Predicting the operating temperature of lithium-ion battery during different cycles is important when it comes to the safety and efficiency of electric vehicles. In this regard, it is vital to adopt a suitable modeling approach to analyze the thermal performance of a battery. In this paper, the temperature of lithium-ion NMC pouch battery has been investigated. A new formulation of lumped model based on the thermal resistance network is proposed. Unlike previous models that treated the battery as a single entity, the proposed model introduces a more detailed analysis by incorporating thermal interactions between individual cells and tabs within a single cell scenario, while also considering interactions between cells and insulators or gaps, located between the cells, within the module case. This enhancement allows for the precise prediction of temperature variations across different cells implemented within the battery module. In order to evaluate the accuracy of the prediction, a three-dimensional finite element model was adopted as a reference. The study was performed first on a single cell, then on modules composed of several cells connected in series, during different operating conditions. A comprehensive comparison between both models was conducted. The analysis focused on two main aspects, the accuracy of temperature predictions and the computational time required. Notably, the developed lumped model showed a significant capability to estimate cell temperatures within the modules. The thermal results revealed close agreement with the values predicted by the finite element model, while needing significantly lower computational time. For instance, while the finite element model took almost 21 h to predict the battery temperature during consecutive charge/discharge cycles of a 10-cell module, the developed lumped model predicted the temperature within seconds, with a maximum difference of 0.42 °C.
1. Introduction
Recently, the demands for automotive field electrification have been growing significantly to avoid dangerous tailpipe emissions and reduce oil consumption [1,2,3]. Compared to other technologies of batteries, such as lead acid and nickel metal hydride, lithium-ion (Li-ion) batteries are considered as the preferred energy storage system for electric vehicles, due to their high specific power and energy, low self-discharge, and high life span [4]. However, this technology has its limitations when it comes to performance and safety. An acceptable operating temperature for Li-ion batteries is usually between −20 °C and 60 °C [5]. Functioning at values of temperature outside the mentioned range accelerates the degradation of the battery and could lead to thermal runaway [6]. In addition, the non-uniform distribution of the temperature within the battery pack increases its aging. Thus, it is highly recommended to keep a thermal gradient between the cells, of the module or pack, of less than 5 °C to extend the expected life duration of the battery [7,8]. It is therefore crucial to design an efficient battery thermal management system to control the battery temperature. In this regard, an accurate knowledge of Li-ion battery and a thermal modeling of its behavior are required to guarantee a proper design of the battery, so it can operate safely during different operating conditions [9].
Mainly, the thermal modeling of Li-ion batteries has been performed with the assistance of two approaches: finite element models and lumped models. Starting with the finite element models, these models are capable of predicting the spatial distribution of the temperature within the battery. This capability makes them suitable when it comes to designing thermal management systems. Many studies have investigated the thermal behavior of different types of Li-ion batteries under several operating cycles while using finite element thermal models coupled with electric models. Ugur has conducted a thermal modeling of a prismatic LiMn2O4 cell using a three-dimensional (3D) thermal model based on the finite element approach coupled with the New, Tiedman, Gu, and Kim (NTGK) formulation for the heat generation calculation [10,11,12]. The author examined the effect of the ambient temperature, depth of discharge (DOD), discharge rate, and the heat convection coefficient on the thermal profile. Liu et al. [13] numerically studied the thermal behavior of a cylindrical 21700 NMC lithium-ion battery at various discharge rates. The pseudo two dimensional P2D [14] approach, which takes into account the processes occurring inside the battery due to the transfer and insertion of lithium ions, was adopted to estimate the heat source. The model was validated experimentally. Hamisi et al. [15] predicted the temperature profiles of a cylindrical 18650 LiCoO2 battery under overcharge conditions using the finite element approach, and the model was experimentally validated. The finite element model was also employed to investigate the thermal behavior of modules and packs of batteries. For instance, Liu et al. [16] investigated numerically and experimentally the transient temperature profile of a module of lithium-ion polymer battery using the 3D finite element model (FEM), and the results predicted were in good agreement with the experimental data. The validated model was then extended to study the thermal behavior of a whole battery pack, and an air-cooling thermal management system has been proposed to reduce the temperature of the cells. Zhang et al. [17] performed a thermal analysis of 24 prismatic Li-ion cells connected in series and parallel by adopting the same approach as [16], and the authors [17] also suggested a suitable cooling strategy while using water as the cooling fluid instead of air.
Despite the quality of the finite element modeling in terms of precision and its ability of identifying several zones of temperature inside the cell and module, this approach demands an important calculation time, especially when modeling battery packs are coupled with cooling systems. Moreover, during the iterative process, for instance, the optimization of size, architecture, or control, a long calculation time can be very punishing. Thus, many studies have focused on developing simple lumped thermal resistance models, in which the temperature of the cell and the heat transfer occurring between the core of the battery and its surface and the atmosphere are represented by nodes and resistances. In this scenario, the number of computational nodes per body is reduced compared to that of the numerical model; thus, the simulation time required to solve the thermal models will reduce as well. The simplicity of these models makes them a fitting choice for simulating complex systems including Li-ion batteries. For instance, Forgez et al. [18] estimated the internal temperature of a cylindrical LiFePO4 cell, and while developing a lumped thermal model, the predicted temperatures were validated with experimental measurements. Bryden et al. [9] adopted the same thermal model proposed by [18], but instead of measuring the internal temperature, the authors of [9] monitored the surface temperature. Nevertheless, the authors of [9,18] have conducted their study only on a 1D scale. Damay et al. [19] modeled the thermal behavior of a prismatic LiFePO4 lithium-ion battery while employing a three-dimensional lumped model, which was validated experimentally with a 1 °C precision. Akbarzadeh et al. [20] investigated the thermal profile of a high-energy prismatic NMC battery, in which two models were developed, a 3D lumped thermal model for the cell level that takes into account the conduction and convection in all directions, and a numerical 3D model using the finite element method to simulate the thermal performance of a module composed of 12 cells, and the two models were then validated experimentally during discharge cycles. However, the simple lumped model was not extended to the battery module scale. Regarding the module level, Jiang et al. [21] developed a rapid approach for thermal runaway propagation predictions for a battery pack based on analytical lumped thermal resistance network. Abbas et al. [22] studied the thermal behavior of a battery module during a sequence of WLTP cycles followed by fast recharge phase, where it was noticed that the temperature increased the most during the fast recharge phase.
Despite the numerous studies performed on the thermal behavior of Li-ion battery using finite element models and lumped models, only one paper, in our knowledge, has conducted a comparative analysis between the two approaches in terms of temperature prediction and time consumption. This study was carried out by Herrera et al. [23], where the authors performed a thermal examination on a cylindrical 26650 LiCoO2 cell using a 3D finite element thermal model and a thermal 1D lumped model, and the temperatures predicted by the models were compared with experimental data. It was found that the finite element thermal model has the lowest temperature error at low discharge rates, and nevertheless, it is more time consuming compared to the other model. However, the authors of [23] only examined the behavior of a single cell, and no studies of battery module case were conducted.
The present paper investigates the thermal behavior of an NMC pouch battery. A simple 3D approach, based on the thermal resistance network, was proposed. This approach has a target to predict the temperature of the Li-ion battery for different cases, either single cell or module, and during different operating conditions. The study was first performed on a single cell, and then on a module composed of several cells connected in series while considering the generated heat inside each cell and the heat transfer between the cells and the ambient. The objective of this study is to simplify the thermal modeling of Li-ion battery at both cell and module scales. Thus, a thermal model based on the finite element approach, serving as a reference model, was presented. A comparative study between both the proposed model and the reference FEM, in terms of temperature prediction, was conducted, allowing to pass from the complex time-consuming model, already validated by previous studies, to a simpler and computationally low-cost model, while preserving a good precision in the battery’s temperature prediction. The contribution of this study is to propose a low-computational model to predict individual cells temperatures within battery modules in order to include it in further studies as design or management optimization.
This paper is divided as follows: Section 2 provides the theoretical background and details of the modeling procedure. Section 3 presents the results obtained by the two models, and a comparison of both the models is also provided in this Section. Finally, Section 4 provides the conclusions of this study.
2. Modeling Procedure
2.1. Modeling Overview
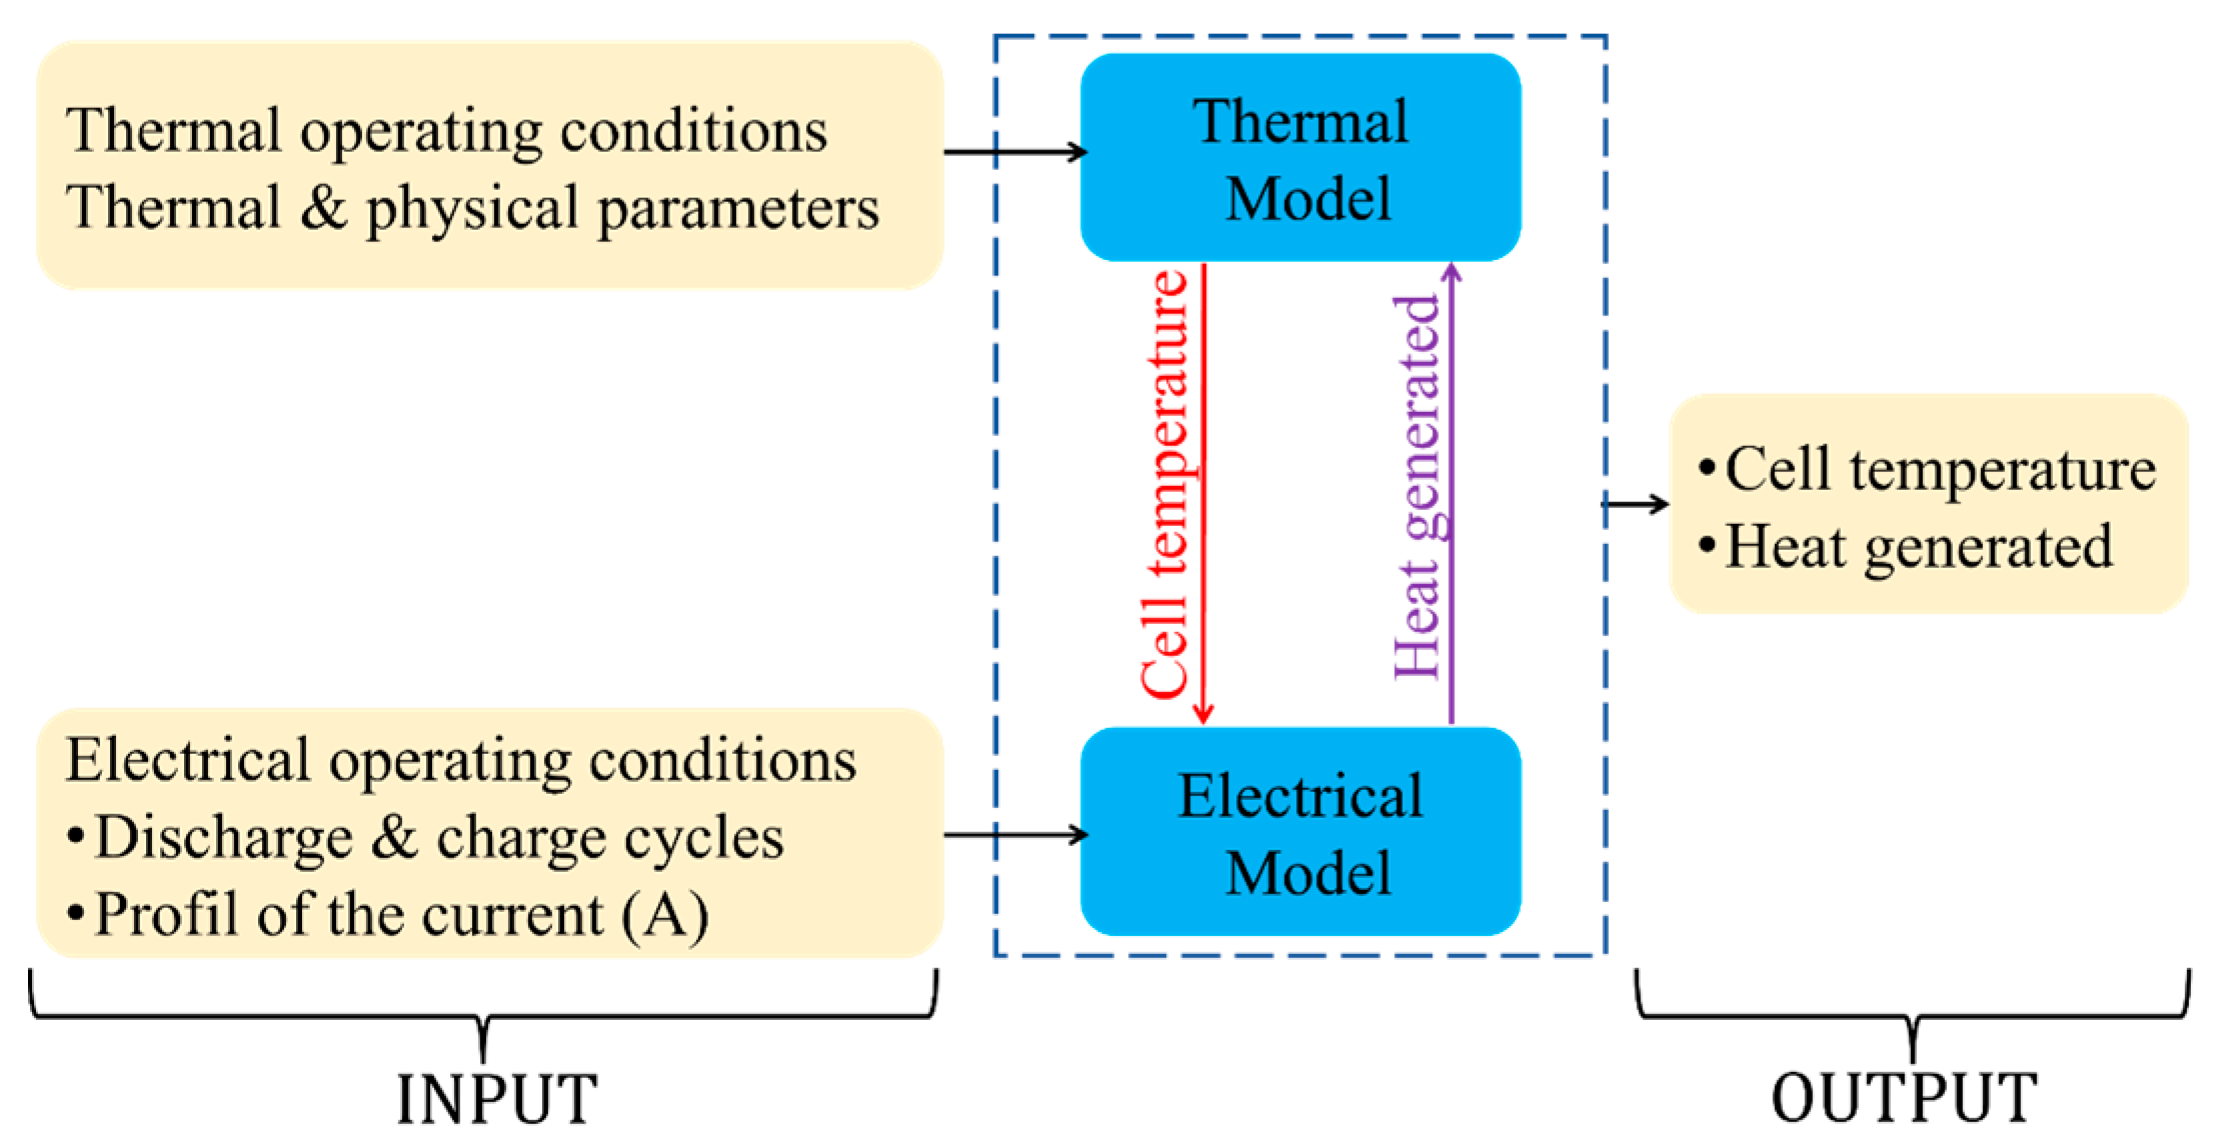
Figure 1 illustrates the global modeling scheme adopted to study the thermal performance of the battery. Two essential fields were combined, i.e., thermal and electrical models. Both models are inputted with input parameters that illustrate the operating conditions of the battery as well the thermal and physical parameters of the battery itself. An electro-thermal coupling was established to predict the heat generated and the temperature of the battery. Regarding the modeling procedure, the following methodology is considered:
- In order to evaluate the heat source, the current profile, applied on the battery during the operating cycles, is employed as the input value of the electrical model.
- The estimated heat source is then used as an input, with other significant parameters, of the thermal model, to predict the temperature of the battery.
- In order to include the thermal impact on the electrical resistance, and thus on the heat generated, the temperature predicted is re-inputted into the electrical model.
2.2. Cell Specifications and Design
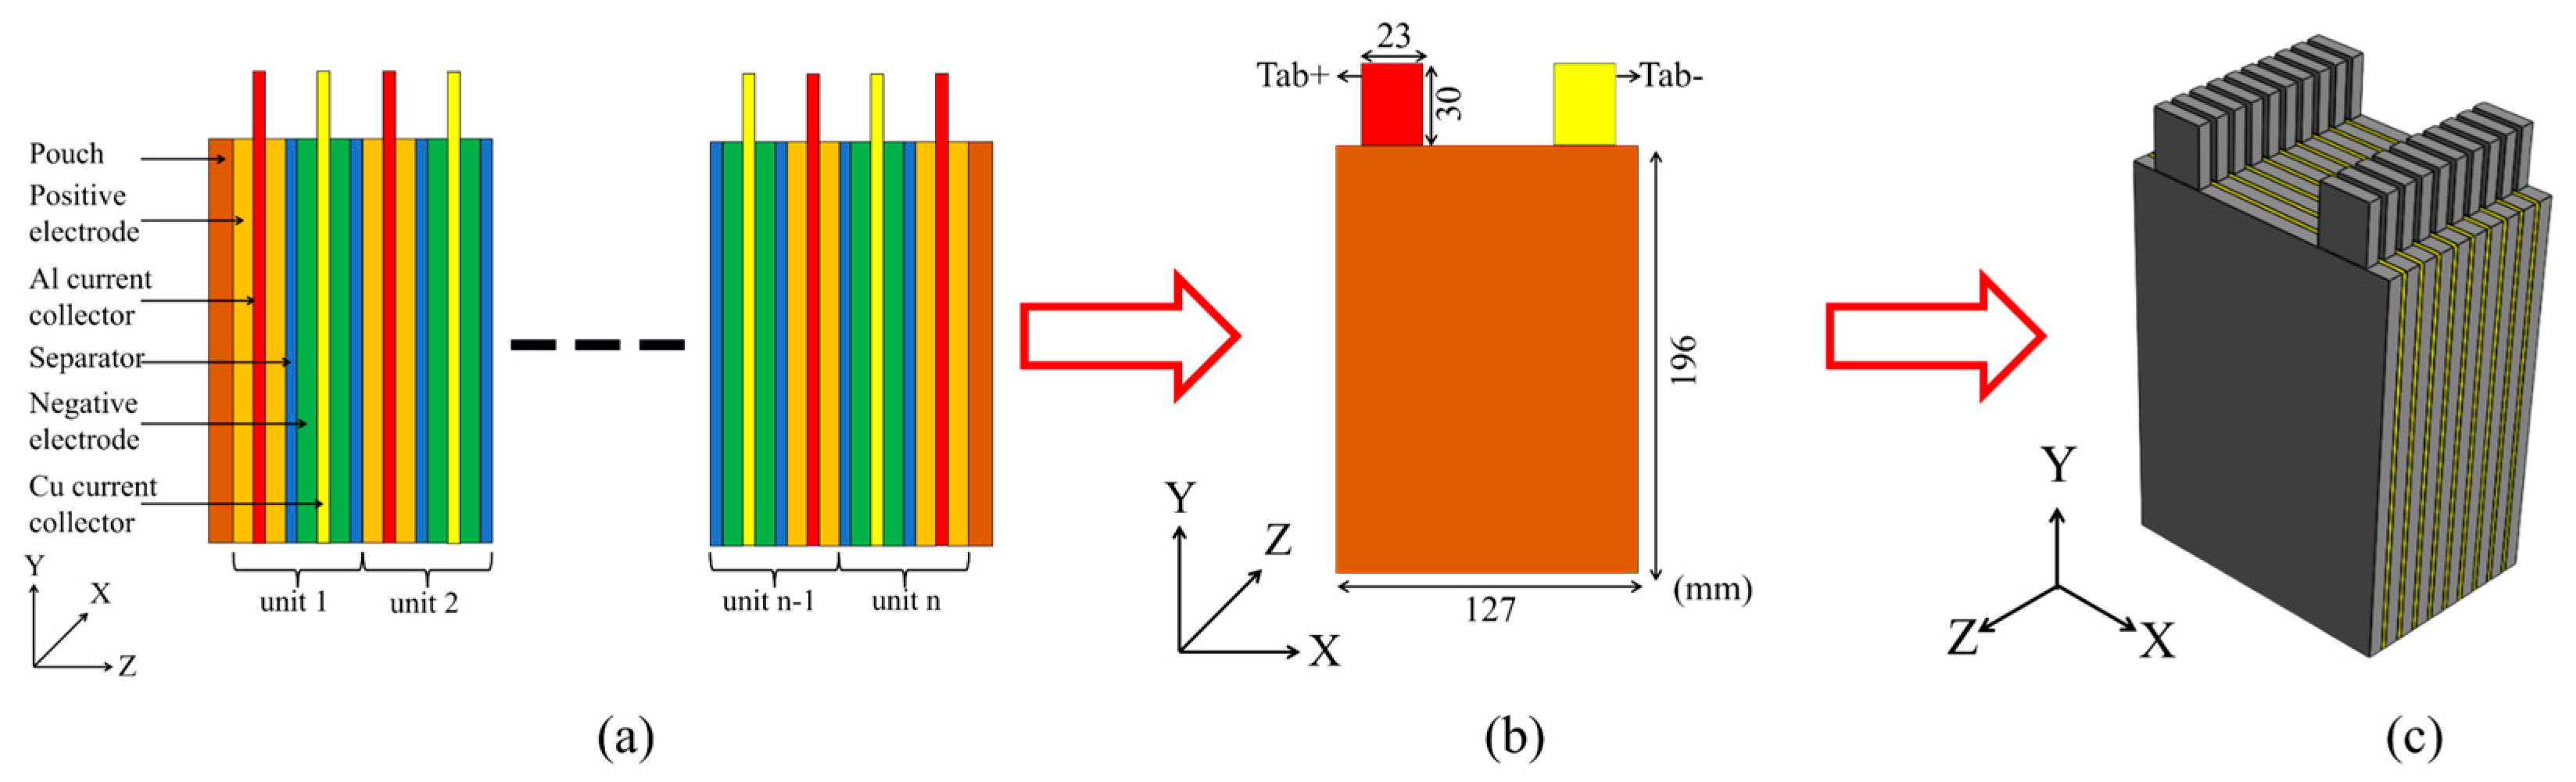
The battery modeled in this study is an NMC/graphite Li-ion pouch cell. Aluminum (Al) and copper (Cu) are the materials of the positive and negative tabs, respectively. The specification and dimensions of the studied battery are shown in Table A1 in Appendix A and in Figure 2b.
The challenge of the Li-ion battery modeling is linked to its internal structure. For instance, the active cell is composed of several layers, and each layer has different properties, which makes the modeling complicated. In order to deal with this physical complexity, the active cell is modeled as an equivalent material that combines multiple units, and each of these units is composed of different layers. In this regard, three solid bodies, i.e., the cell and the two tabs, were considered in the thermal investigations. Figure 2a shows the assembly of the NMC pouch’s active cell in the thickness direction (z-axis), where each unit combines the layers of electrodes, current collectors, and separators. The whole sum of units is covered by a pouch case. The design of a battery module composed of 10 cells connected in series is presented in Figure 2c. The creation of the geometry of cell and tabs was carried out in the commercial software, SolidWorks® 2019 SP2.0.
2.3. Electrical Model: Newman, Tiedman, Gu, and Kim Formulation (NTGK)
According to Gu et al. [24], the current applied to the battery is related to its voltage with respect to the following algebraic equation:
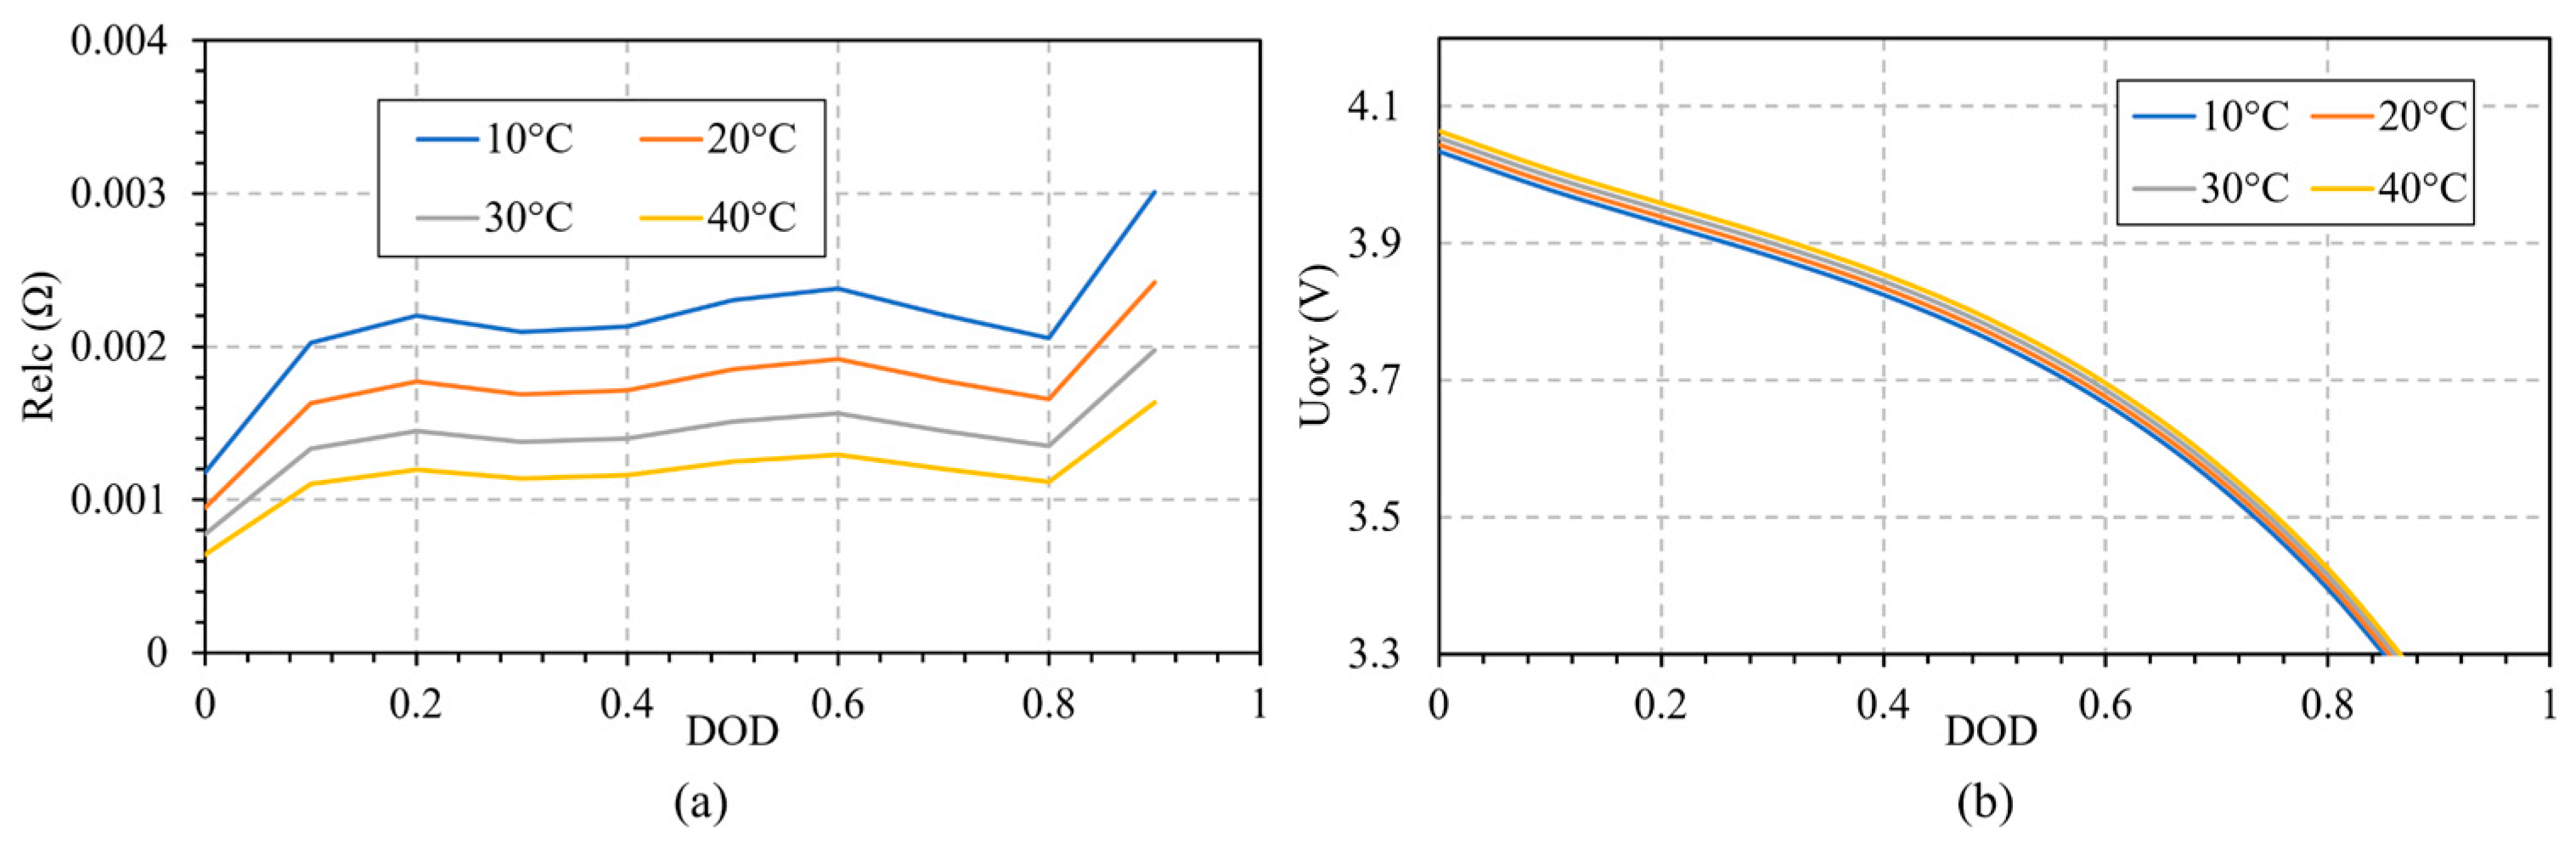
where I is the electrical current applied on the battery cell in A, and Ucell denotes its voltage in V. UOCV and Relc, the two functional parameters of the NTGK model, represent the open circuit voltage of the battery in V and its electrical resistance in Ω, respectively. Both terms were determined experimentally, while applying discharge cycles at different rates to the battery, and they were found to be dependent on the depth of discharge (DOD) and T the cell temperature [24,25]. The equations of the electrical parameters of the NTGK model and the depth of discharge are illustrated as follows:
The constants a and b represent the fitting parameters to illustrate the influence of DOD on UOCV and Relc. In order to determine these parameters, the experimental voltage data during different constant-current discharge rates and at various DODs have been recorded [24,26]. A linear dependency between the cell voltage and the discharge current applied for various DODs has been observed, as shown in Equation (1), where UOCV depicts the intersection of the (V-I) curve with the voltage axis, and Relc represents the curve slope. A polynomial dependency between the NTGK functional parameters and the DOD has been considered, where a and b are determined by curve fitting the data of UOCV and Relc with the polynomial expression illustrated in Equations (2) and (3). Tref is the reference temperature in K. ω1 and ω2 are constants used to fit the effect of temperature on the electrical parameters of the battery, and they are determined based on Nernst and Arrhenius Laws [27,28]. The plots of UOCV and Relc versus the DOD and at different temperatures are shown in Figure 3. The values of the fitting parameters used in this study are illustrated in Table A2 of Appendix A [11,25].
Regarding the heat source, some previous studies have shown that the reversible entropic term has a relevant influence on the calculation of the heat generated by the battery [29,30]. Other studies have shown that the effect of this term is dominated by the irreversible ohmic heat source; thus, neglecting the reversible term would not significantly affect the precision of the thermal calculations [18,31]. Since the target of the paper is to simplify the thermal finite element model and analytical model, and due to the lack of information regarding the entropic reversible term, it is considered that the heat, Qirr in W, is only due to an irreversible process. However, the authors will include the entropic term in future investigations while conducting experimental tests. Consequently, we used the following equation:
Qirr = I2 × Relc
Noteworthily, the same constants and fitting parameters employed to determine the influence of DOD and temperature on the NTGK parameters were used in both FEM and lumped thermal model.
2.4. Thermal Model: Finite Element 3D Model (Reference Model)
The transient temperature distribution in the battery cell is illustrated by the following three-dimensional energy balance differential equation:
where the expression on the left denotes the heat accumulated in the battery, while the two expressions on the right represent the heat dissipated by conduction, through all direction, and the heat generated by the battery during operating conditions, respectively. T = T (x, y, z) is the three-dimensional temperature distribution, t is the time, and Vcell is the volume of the cell in m3. ρ, Cp, and λ illustrate the physical and thermal parameters of the cell, and they represent the density in kg/m3, the specific heat capacity in J/kg K, and the thermal conductivity in W/m K, respectively. These parameters were estimated based on the properties of the layers that the NMC cell was composed of, shown in Table A3 in Appendix A [32], and can be calculated by utilizing the following equations [33]:
where is the thickness in m. The index ‘i’ refers to the layers that make up the cell. The in-plane thermal conductivities, λx and λy, are identical and computed based on Equation (9), while the through-plane thermal conductivity λz, in the thickness direction, is calculated based on Equation (10).
Thermal exchanges between the battery and its surroundings were also taken into account, with due consideration given to convection heat transfer, while the contribution of radiation was neglected. Thus, the boundary conditions at the surface of the battery are illustrated by the following equation:
qconv = h A (Ts − Ta)
In the above equation, h refers to the convection heat transfer in W/m2 K, A and Ts represent the area in m2 and the temperature of the surface at which the convection heat transfer occurs, and Ta is the ambient temperature. The heat transfer equations and the convective boundary conditions illustrated previously were also applied on the tabs but without including the heat source term.
Concerning the case of the module, the cells were considered connected in series. For simplicity, the electrical losses due to the connections between the tabs of the cells are ignored, and the thermal exchanges through conduction between the tabs and busbars are neglected as well. These assumptions are considered for both models. Regarding the spacing between the cells, a gap of 2 mm thickness was considered in both the finite element and the lumped model. These gaps were defined as solid bodies composed of aerogel [34], exchanging heat by conduction with neighbor cells and by convection with the atmosphere. Known for its low thermal conductivity, the aerogel is considered to be a thermal insulator and is adopted in the Li-ion battery applications to prevent the thermal runaway propagation within the cells inside the module or the pack [35]. In the current study, a natural heat convection mode with an h value of 5 W/m2 K similar to that of [17,36] is considered.
2.5. Thermal Model: Lumped 3D Thermal Resistance Model
The developed 3D lumped thermal model is illustrated in detail in this Section. Compared to the reference model, its simplification was perfomed on the thermal field, and a simple approach to solve the heat transfer equation of the battery was adopted. In this approach, the temperature of each body, cell, and tab and aerogel gaps for the module case and the heat exchange occurring between all concerned bodies were taken into consideration and modeled.
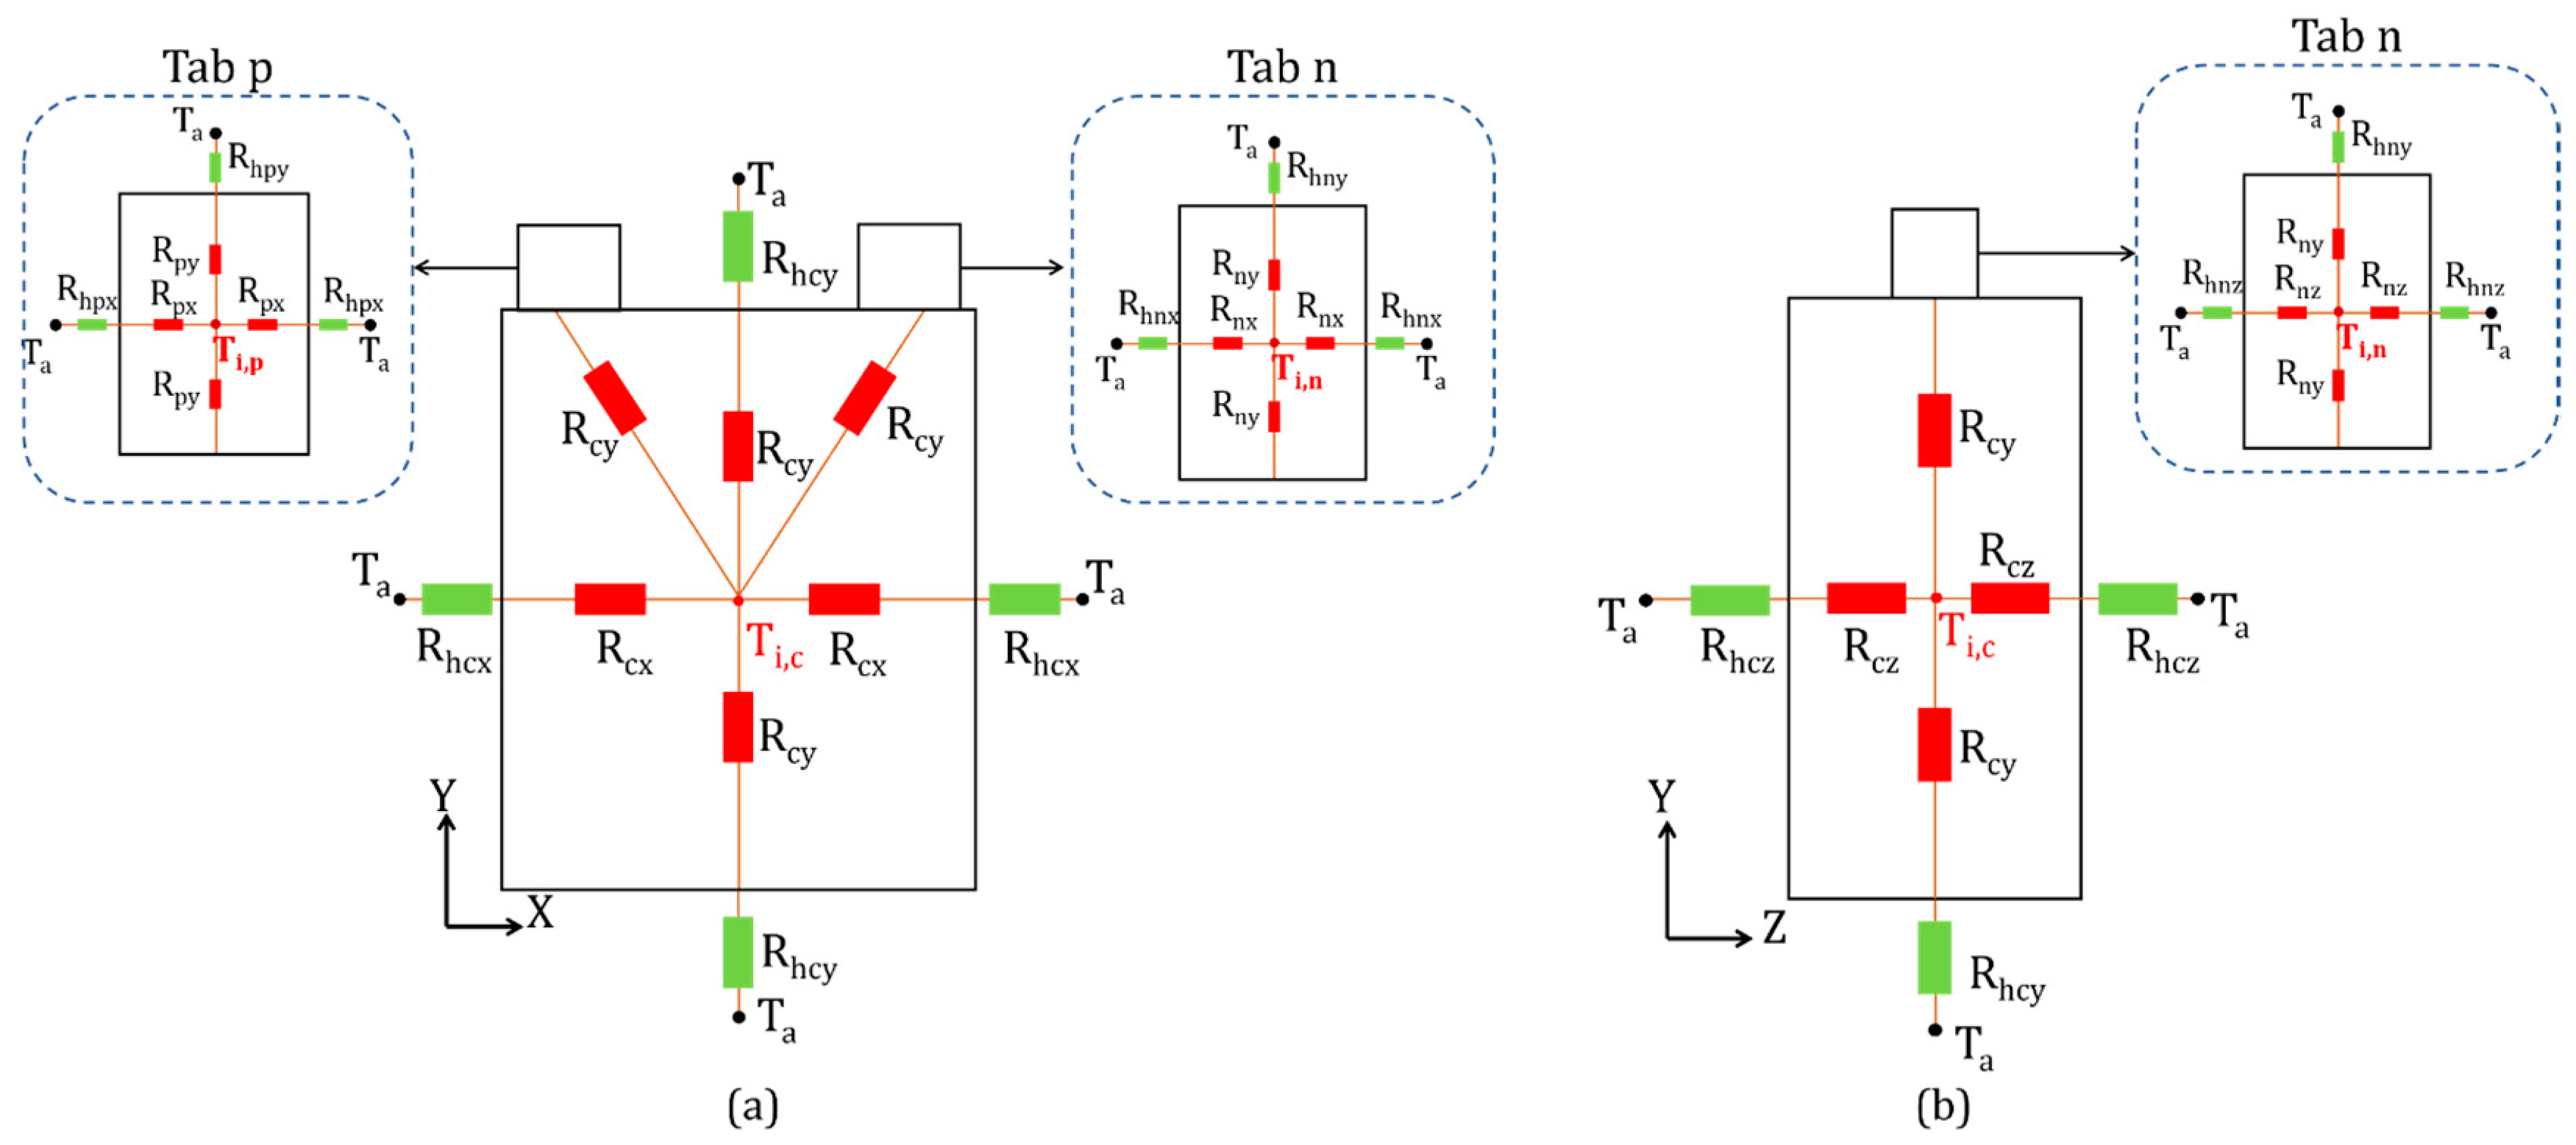
The schematic of the 3D lumped thermal network of the NMC Li-ion cell and tabs in [x–y] and [z–y] axes is shown in Figure 4. As previously mentioned, the cells and terminals of the battery are considered as independent blocks, and each of which is composed of one node located at its center that illustrates its internal temperature and of external nodes that represent the environmental temperature. The internal temperatures of the three blocks, i.e., cell and positive and negative tabs, are denoted by Ti,c, Ti,p, and Ti,n, respectively, while the ambient temperature is represented by the nodes Ta. The heat capacity and mass of each body are assumed to be located at the core node of the corresponding bodies. With regard to the heat, it is generated by the cell and then transferred by conduction to its faces and dissipated by convection to the ambient. A part of the heat is transmitted to the core of each tab by conduction along the y-axis, which in turn, is transferred by conduction to the faces of the latter, and then dissipated to the atmosphere. The red colored thermal resistance (Rc) represents the heat transfer by conduction, while the green colored thermal resistance (Rh) depicts the heat dissipation by convection. The selection of the node placements was influenced by the analysis of other studies concerning the analytical modeling of batteries using thermal resistance network models [9,18,19,20,21,22,23,37]. Moreover, the preliminary results of temperature contour predicted by the finite element model, which is represented later in the Results Section, indicated that the majority of the heat is located between the central and lower sections of the battery, with a thermal discrepancy lower than 0.7 °C, which led us to infer that the node that represents the internal temperature of the cell is located in its center.
The thermal energy heat balance equations of the three bodies of the Li-ion NMC battery for the single cell case are illustrated in Table 1 with Equations (12)–(14), respectively. The density, the specific heat capacity, and the volume of each block, presented in the equations below, are determined previously based on the data available in Table A1 and Table A3 of the Appendix A. The thermal resistances by conduction and convection employed in the heat equations were defined for each body, and in the three directions, with respect to the equations illustrated in Table A5 of Appendix A, where the thermal conductivities of the cell in x, y, and z directions were determined by using the data available in Table A3 of Appendix A and by applying Equations (9) and (10). In terms of the thermal conductivities of the tabs and the insulation layers, they were directly extracted from Table A3 and Table A4 of Appendix A since the bodies are composed of one material. L is the distance crossed by the heat in m, and S is the normal area in m2. The positive and negative tabs have the same dimensions; thus, the same values of external resistances are shown in Table A5.
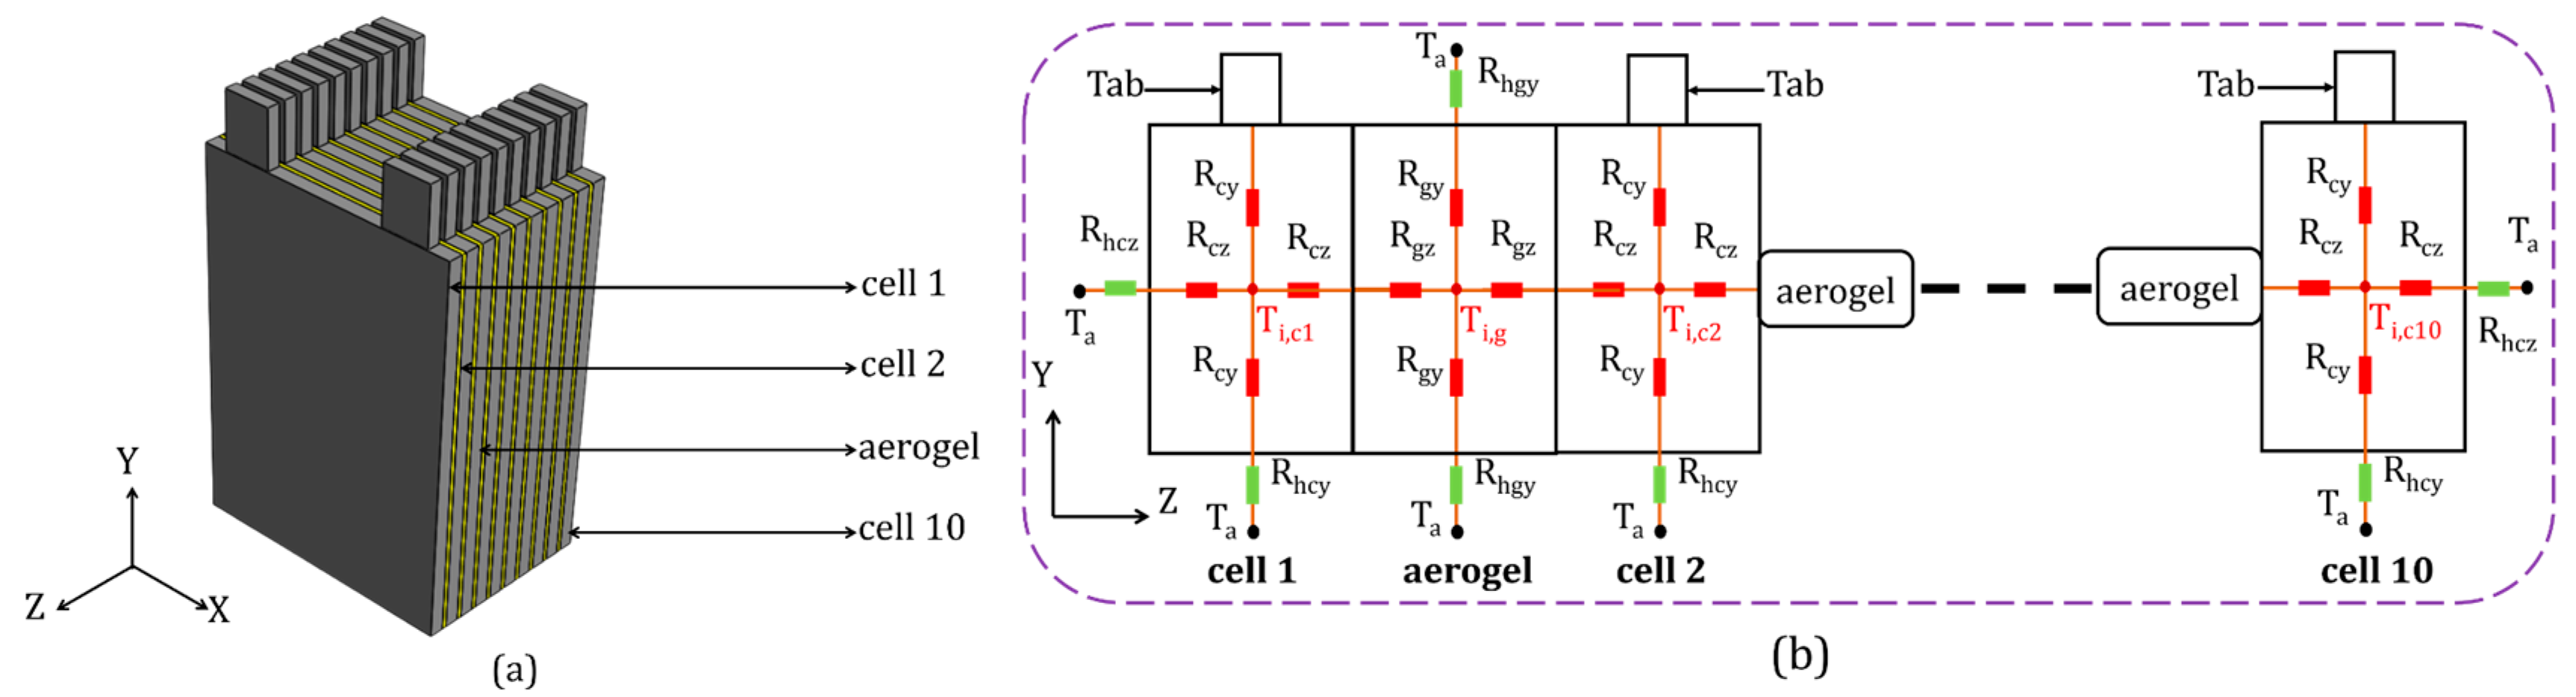
The design of the 10-cell modules with the aerogel layers, colored in yellow, between the cells is presented in Figure 5a. The schematic of the thermal resistance network of the cells 1, 2, and 10 and the aerogel sheets inside the module of 10 cells is illustrated in Figure 5b. The cells have been classified, according to their location, into two categories.
The external cells of the module, cell 1 and cell 10, have one face in the z direction exposed to the ambient, at which heat is dissipated by convection, while the opposite face, via the same axis, is linked to the aerogel sheet, where heat is transferred by conduction. On the other hand, the internal cells (2, 3, 4, 5, 6, 7, 8, 9) have both of their faces in the z direction surrounded by insulation layers, and the convection thermal exchange with the ambient is limited to x and y directions only. Thus, the heat transfer equations of the external cells are illustrated in Table 1 with Equations (13)–(15), while the internal cells thermal behavior are represented by Equations (13), (14), and (16). In these equations, Ti,g represents the internal temperature of the aerogel sheet, and the subscripts ‘next’ and ‘previous’ refer to the layers surrounding the cells in both sides with respect to the z-axis. The schematic of the thermal resistance network of the aerogel insulation pads in the [x–y] and [z–y] axes is illustrated in Figure 5b. The insulation sheets exchange heat by conduction with their neighbor cells and by convection with their environmental surroundings. The heat equation of the aerogel layers is shown in Table 1 via Equation (17), where Ti,c(previous) and Ti,c(next) represent the internal temperature of the cells surrounding the aerogel sheets on both sides. The properties of the aerogel material [34] are listed in Table A4 of Appendix A.
3. Results and Discussions
3.1. Discharge Cycles
3.1.1. Single-Cell Simulation
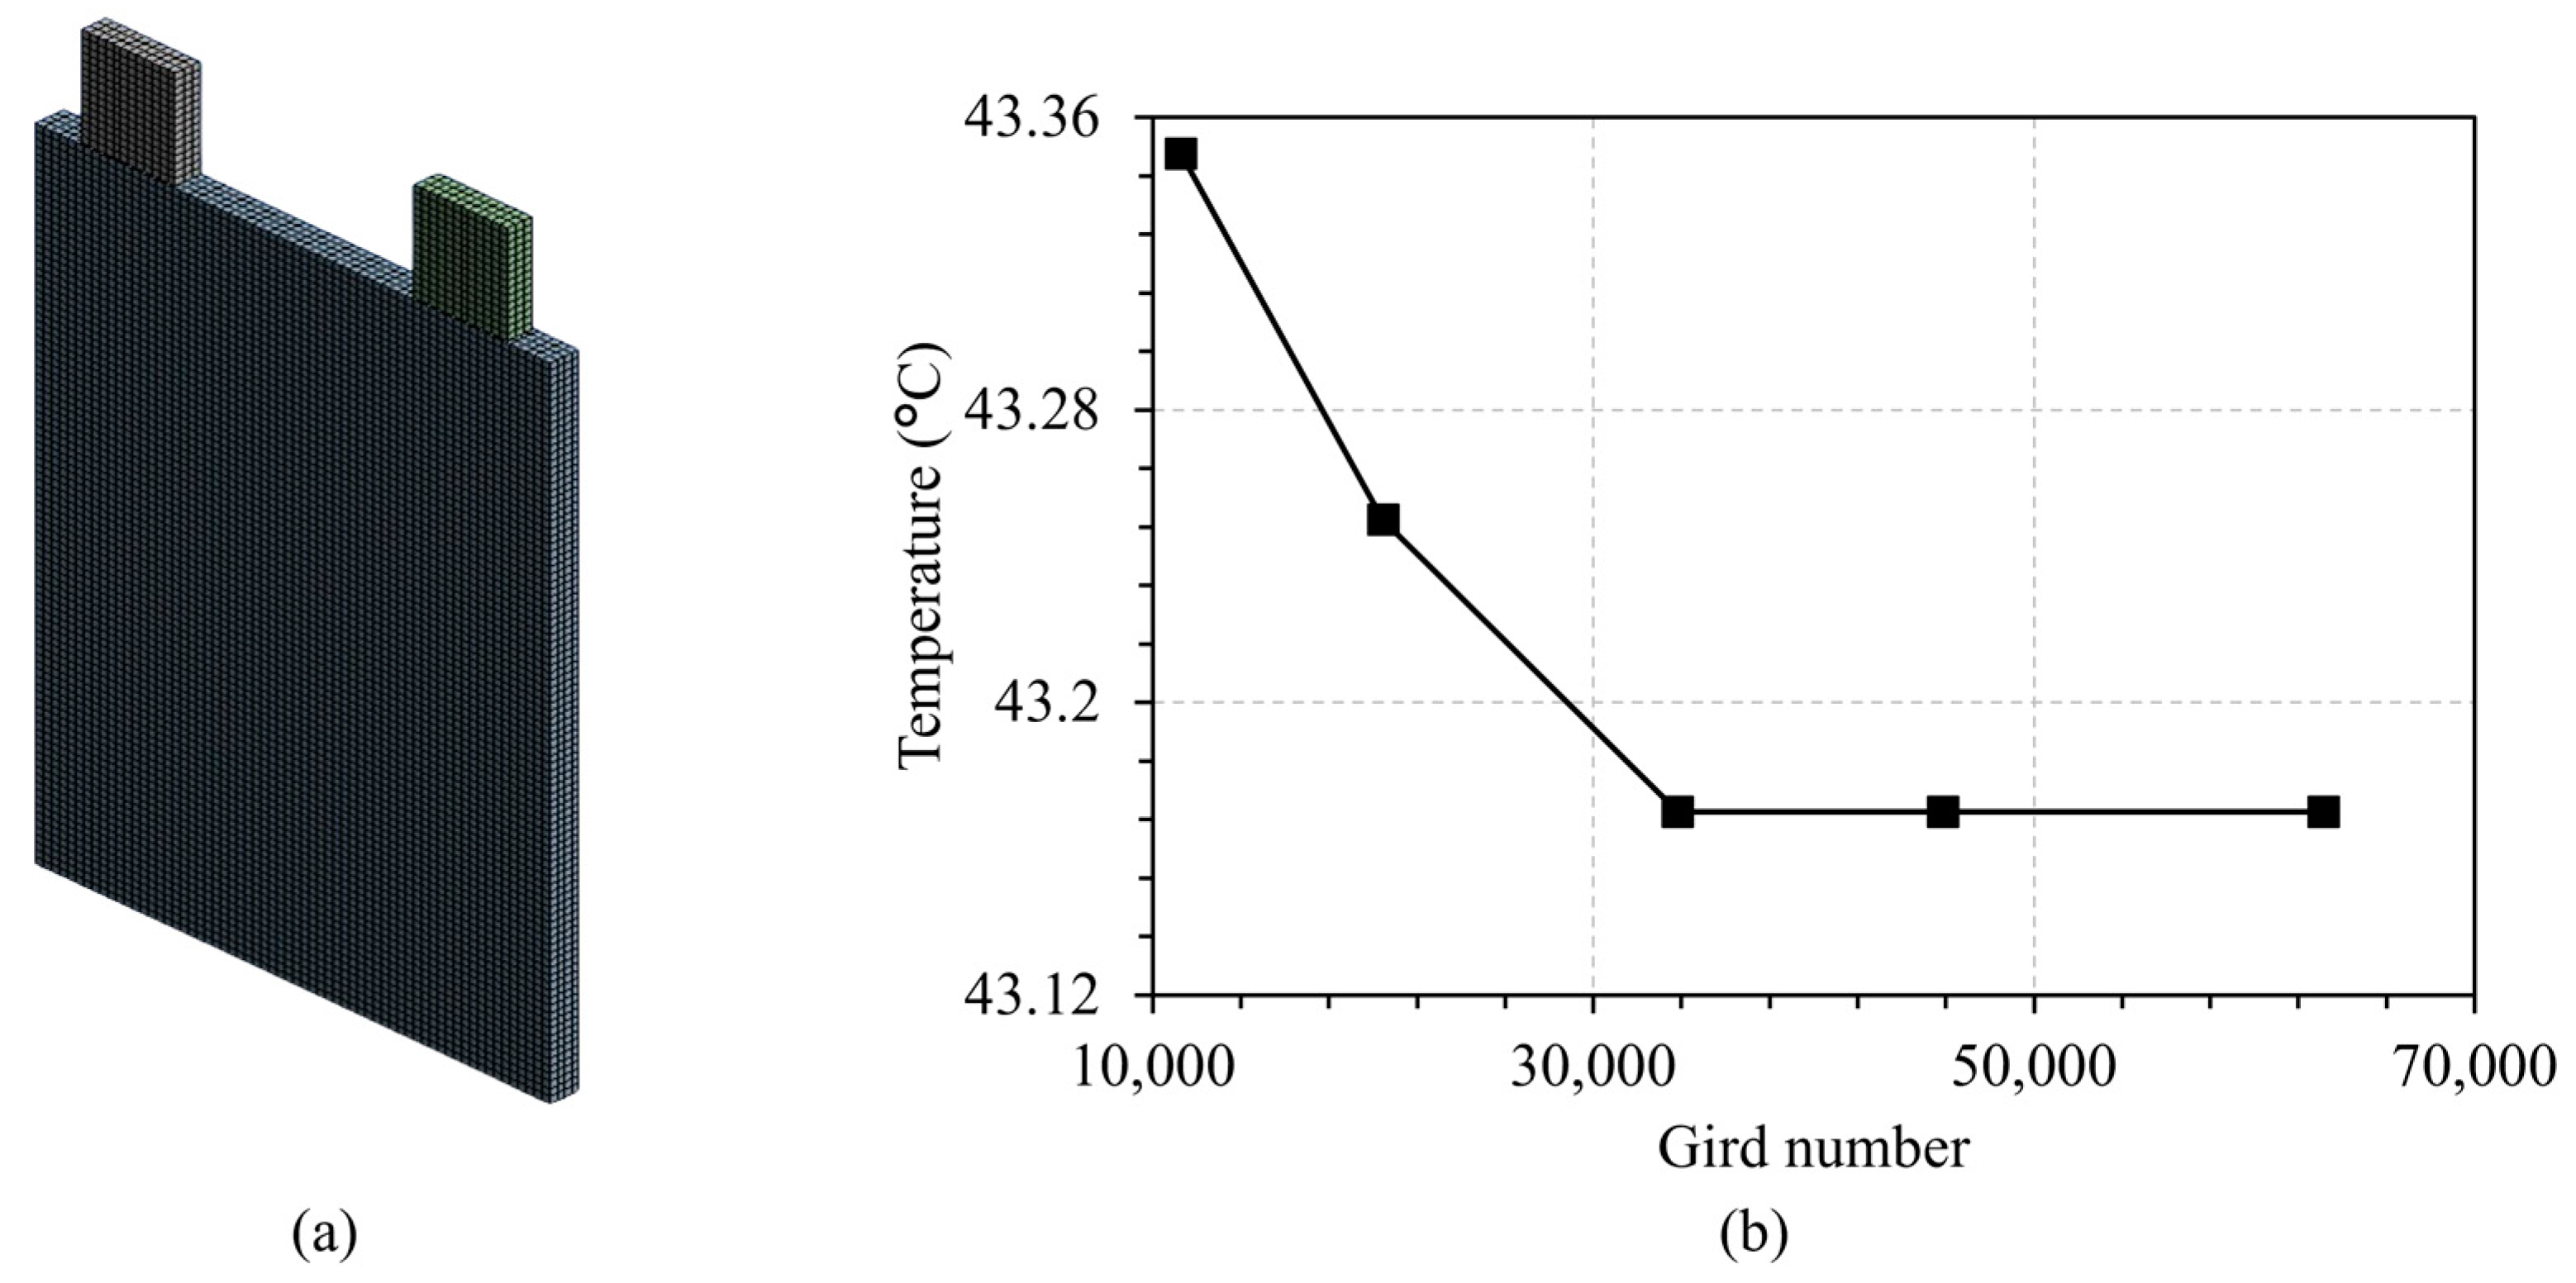
In this Section, the thermal behavior of a single NMC pouch cell during constant discharge cycles was studied by adopting the two models that have been already illustrated. Five values of discharge rates were applied on the battery cell (1C, 2C, 3C, and 4C, and 5C:1C means a current discharging the cell in 1 h, for instance, 1C is 5 A for a 5 Ah battery). The environmental temperature is set at 27 °C (300 K). Natural convection boundary conditions, with a heat coefficient of 5 W/m2 K, are applied to all the faces exposed to air. Both ambient temperature and convection coefficient are considered the same in all the studied cases (cell, module, constant discharge cycles, and periodic cycles). In terms of the finite element modeling, the solid bodies created in Solidworks® 2019 SP2.0 were imported to the software ANSYS Workbench® 2021 R1, where a hexahedral structure mesh was executed, through the meshing tool, with a grid number of 33,839. This number was obtained by running a 5C discharge cycle simulation of the single cell with different number of grids, and the value at which the maximum battery’s temperature at the end of the simulation was seen converging was chosen, as shown in Figure 6. Once the meshing was performed, the model was solved with ANSYS Fluent [38] by applying all the thermal, physical, and boundary conditions.
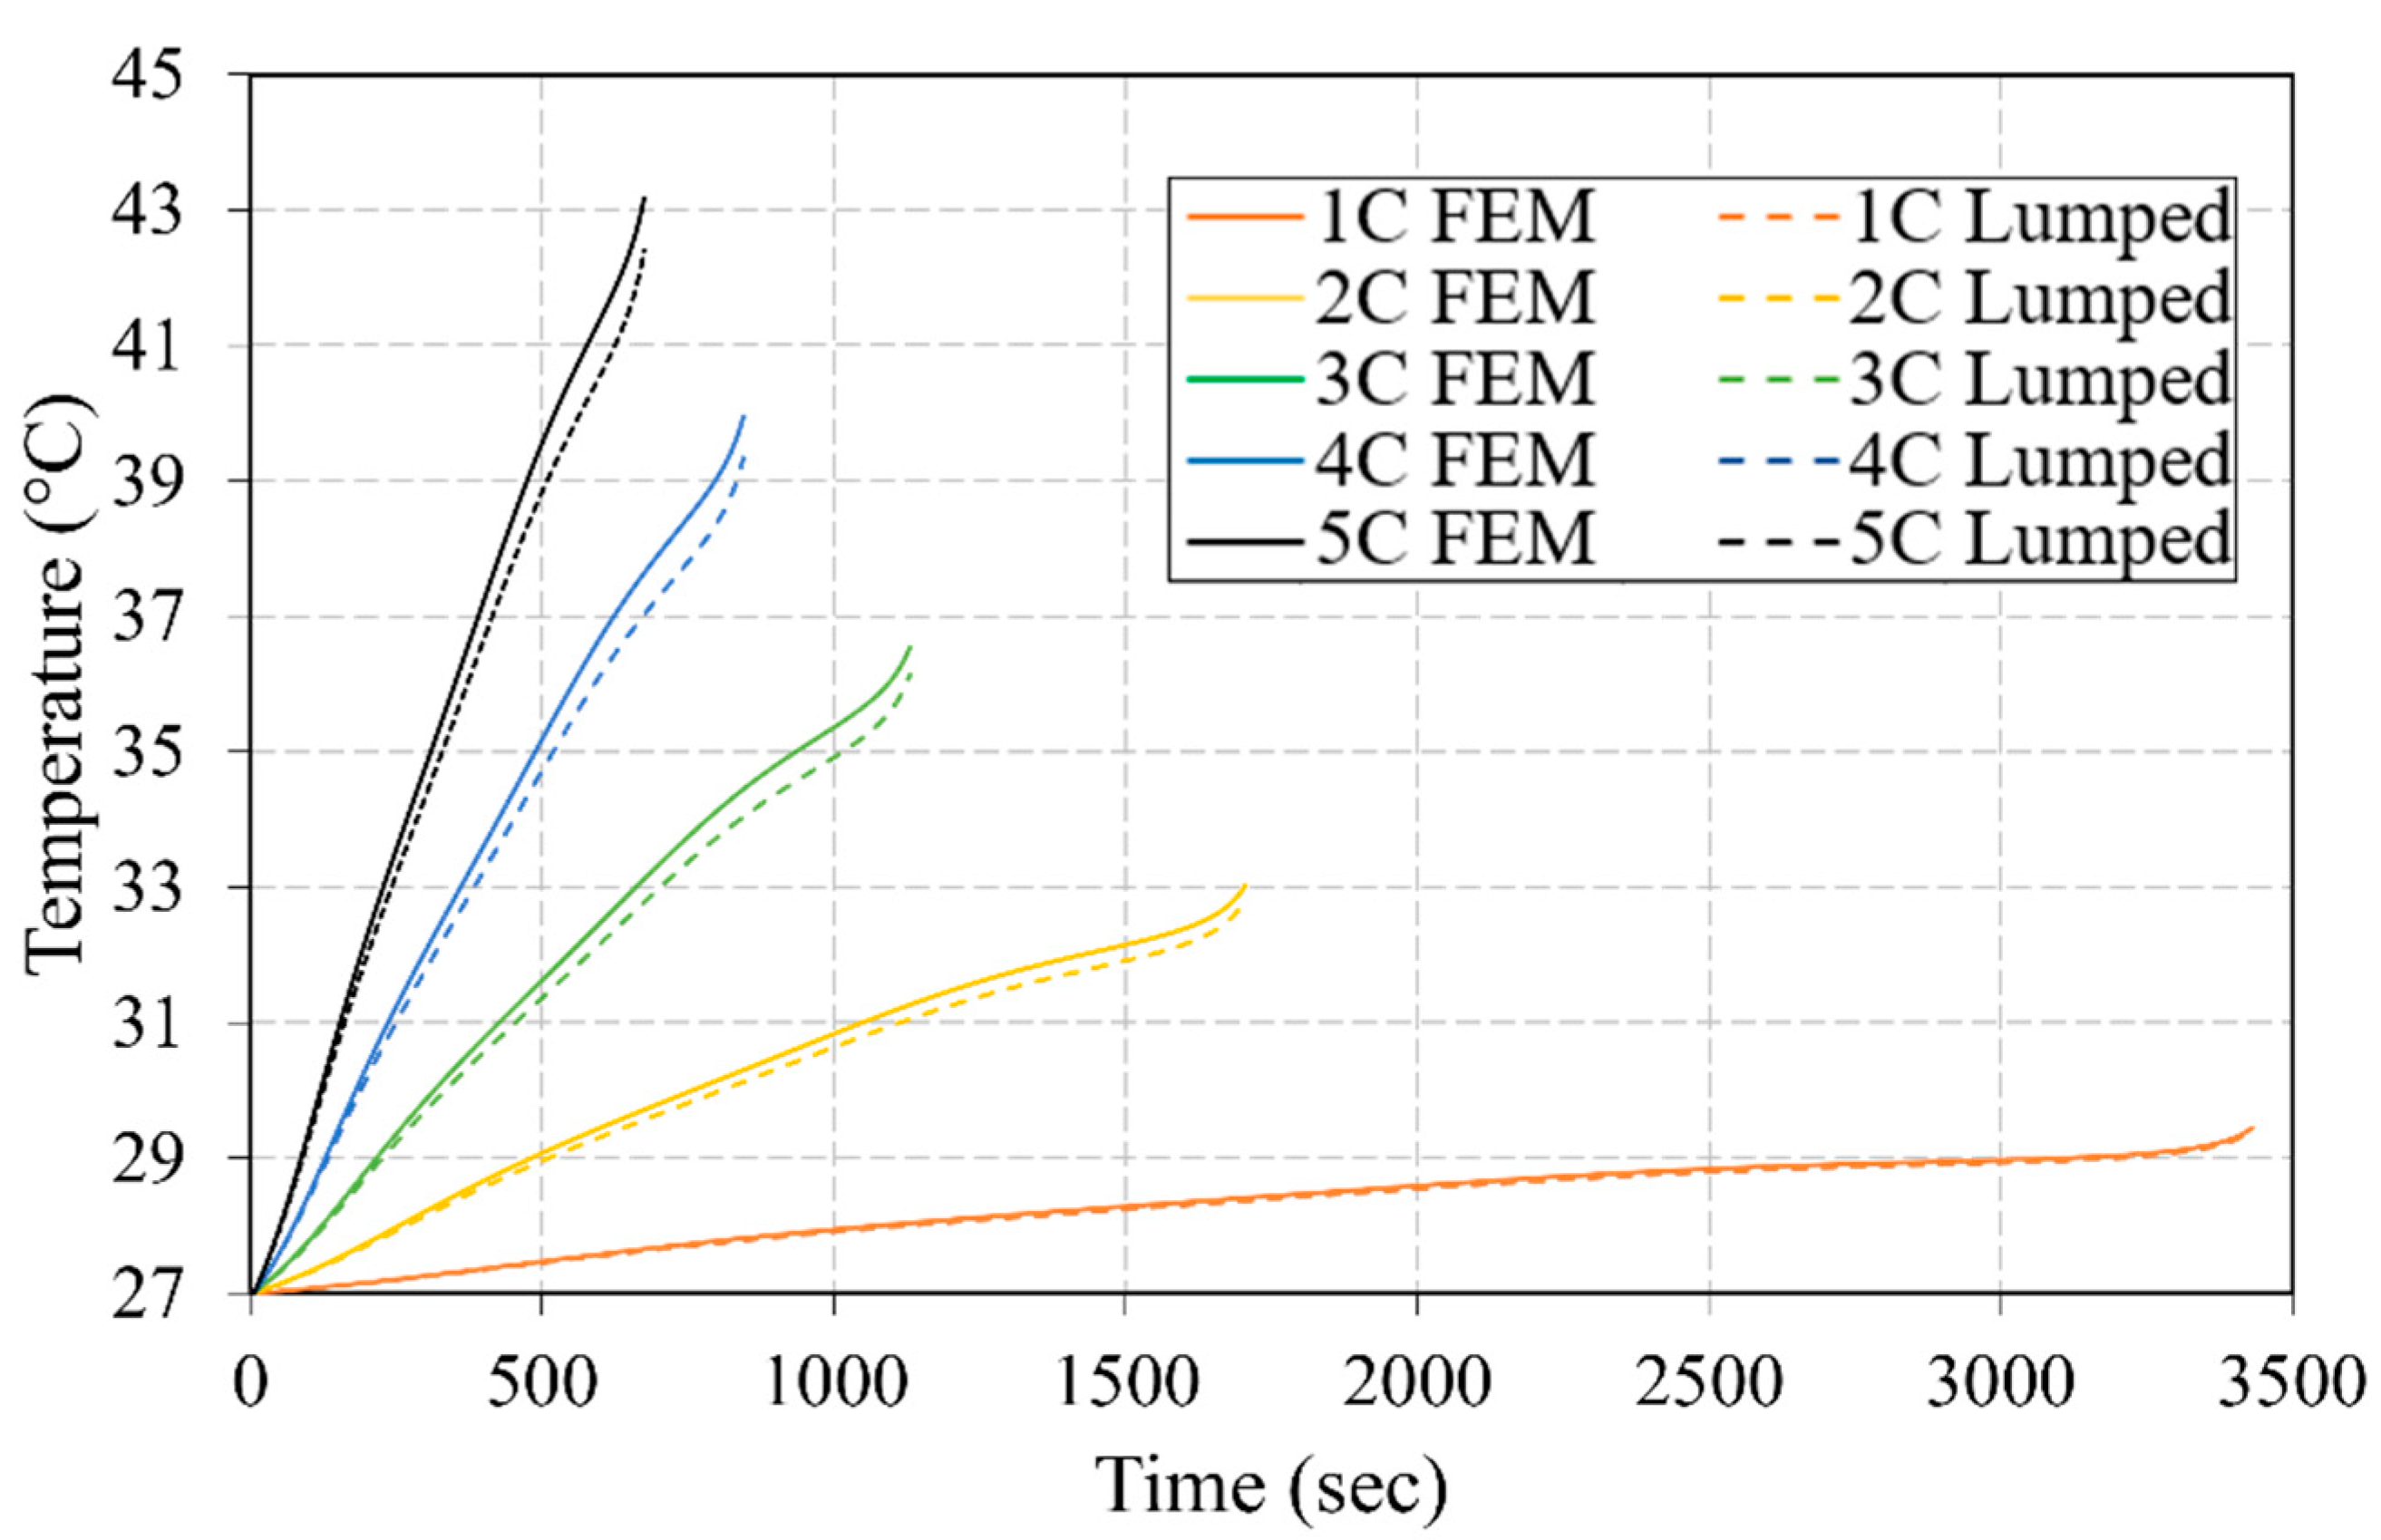
The lumped model was developed and solved in MATLAB [39] by applying Runge Kutta fourth order method to the heat equations. The discharge constant current cycle simulations for both models were carried out with a step time of 1 s and until the battery was fully discharged. The thermal profiles of the Li-ion NMC cell during the five discharge cycles obtained by the two models are illustrated in Figure 7. Close predicted values of the cell temperature during the operating phases are obtained by the two modeling approaches. In both models, the maximum temperature was seen dependent on the C-rate. For instance, each time the C-rate applied increased, the temperature also increased. The thermal profiles obtained by the two models were observed to diverge with time and with the rise in the applied discharge rate. However, this discrepancy remained acceptable as the maximum absolute error between the finite element and lumped models was obtained at the end of constant 5C discharge cycle, with a value of 0.5 °C. Another significant factor that should be taken into consideration when comparing both models is the needed calculation time. The FEM required much longer computational time compared to that of the lumped model. For instance, under a discharge current rate of 1C, the FEM took approximately 6 h to finish the calculations, while the lumped model finished the calculations in approximately 3 s, with a maximum temperature difference of less than 0.1 °C.
It is worth mentioning that all the simulations, i.e., finite element and lumped model, for both cells and modules were executed using the same standard CPU (2.3 GHZ, 16 GB RAM, 4 cores), and during the simulations, no other operations were performed on the computer. The simulations for each scenario (single cell or module) were repeated three times, and the average calculation time was determined.
3.1.2. Module Simulation
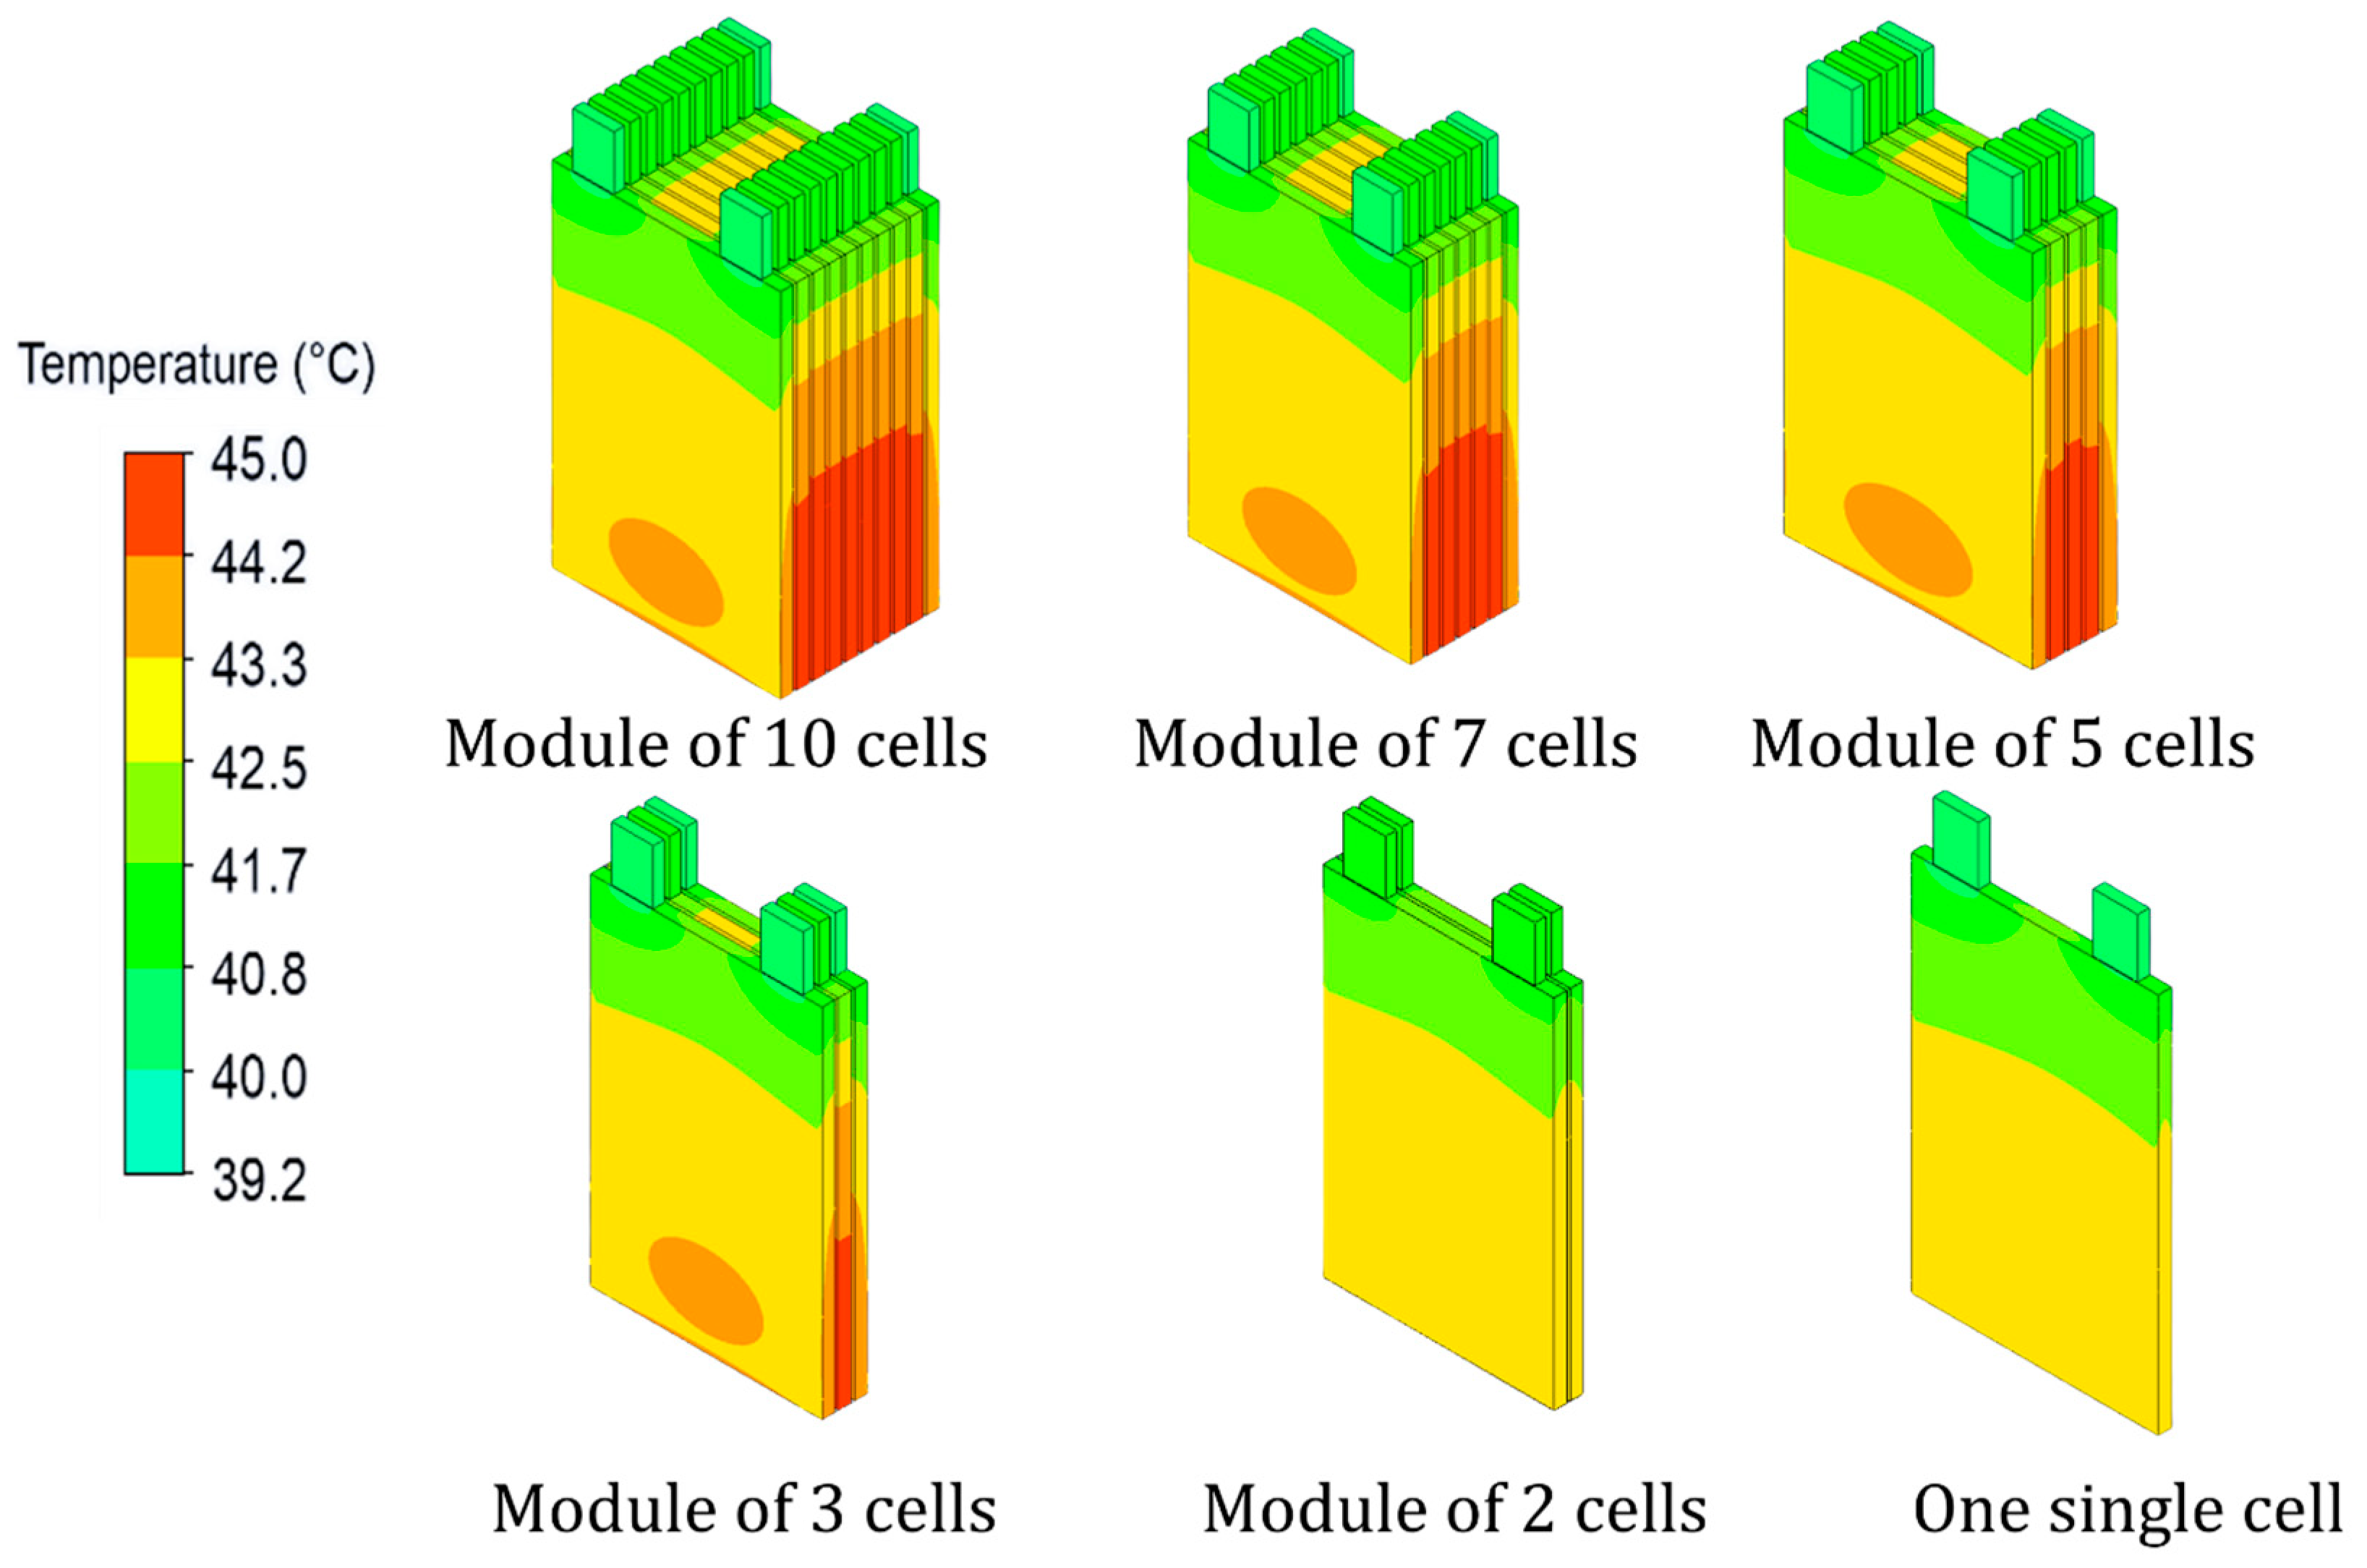
Secondly, the thermal behavior of modules of cells connected in series was investigated. The study was performed on several modules, with each having a different number of cells. For the FEM, the number of grids for modules of 2, 3, 5, 7, and 10 were set to 39,560, 42,147, 64,464, 67,986, and 106,032, respectively. The contours in Figure 8 illustrate the spatial temperature distribution of the cells for the cases of a single cell and modules composed of 2, 3, 5, 7, and 10 cells at the end of a constant discharge cycle of 5C obtained by the FEM. Compared to the single cell case, the maximum temperature of the 3-cell module, at the end of 5C discharge cycle, is increased by 1.5 °C approximately. We can also notice a temperature discrepancy within the cells in both cases, single cell and battery module, with the lower section exhibiting higher temperatures than the upper part. This phenomenon is attributed to the presence of tabs. In the upper part, the two tabs directly attached to the cell play a significant role as effective thermal pathways for heat especially with their high thermal conductivity and small dimensions compared to the cell body (higher surface-to-volume ratio). Thus, the heat generated from the battery is dissipated in a higher and faster manner from the cell to the tabs than to the environmental surroundings. This leads to lower temperatures in the upper part of the battery and in the tabs compared to the overall cell temperature. Regarding the module case, a symmetrical thermal profile of the cells within the modules can be noticed while passing from a module of 3 cells to a module of 10 cells, with the heat mainly accumulated in the middle of the modules, where the cells are less exposed to air compared to the external cells, since they are surrounded by insulation layers on both sides. Thus, in the absence of a cooling system that could break the symmetry, monitoring the temperature of half the module or pack instead of the whole assembly should be enough. Furthermore, we observed in the module cases that the hot spots were concentrated mainly in the thickness direction of the intermediate cells. In addition to having less surface exposed to the ambient and direct contact with the low thermal conductivity insulators on both sides, this phenomenon can be attributed to the thermal properties of the battery. For instance, the through-plane thermal conductivity of the cell (conductivity in the thickness direction) is much lower to its in-plane thermal conductivity, refer Table A5 of Appendix A. Therefore, the heat generated by the intermediate cells may have difficulty in dissipating away from the cells in a fast and efficient manner. Noteworthily, due to the high number of computational nodes, the finite element model is capable of predicting a temperature contour of the battery cell, in which the different zones of temperature within the cell can be identified. However, in the developed analytical model, this is currently not possible, since it operates on the basis of one node per battery component (cell, tabs, or insulator).
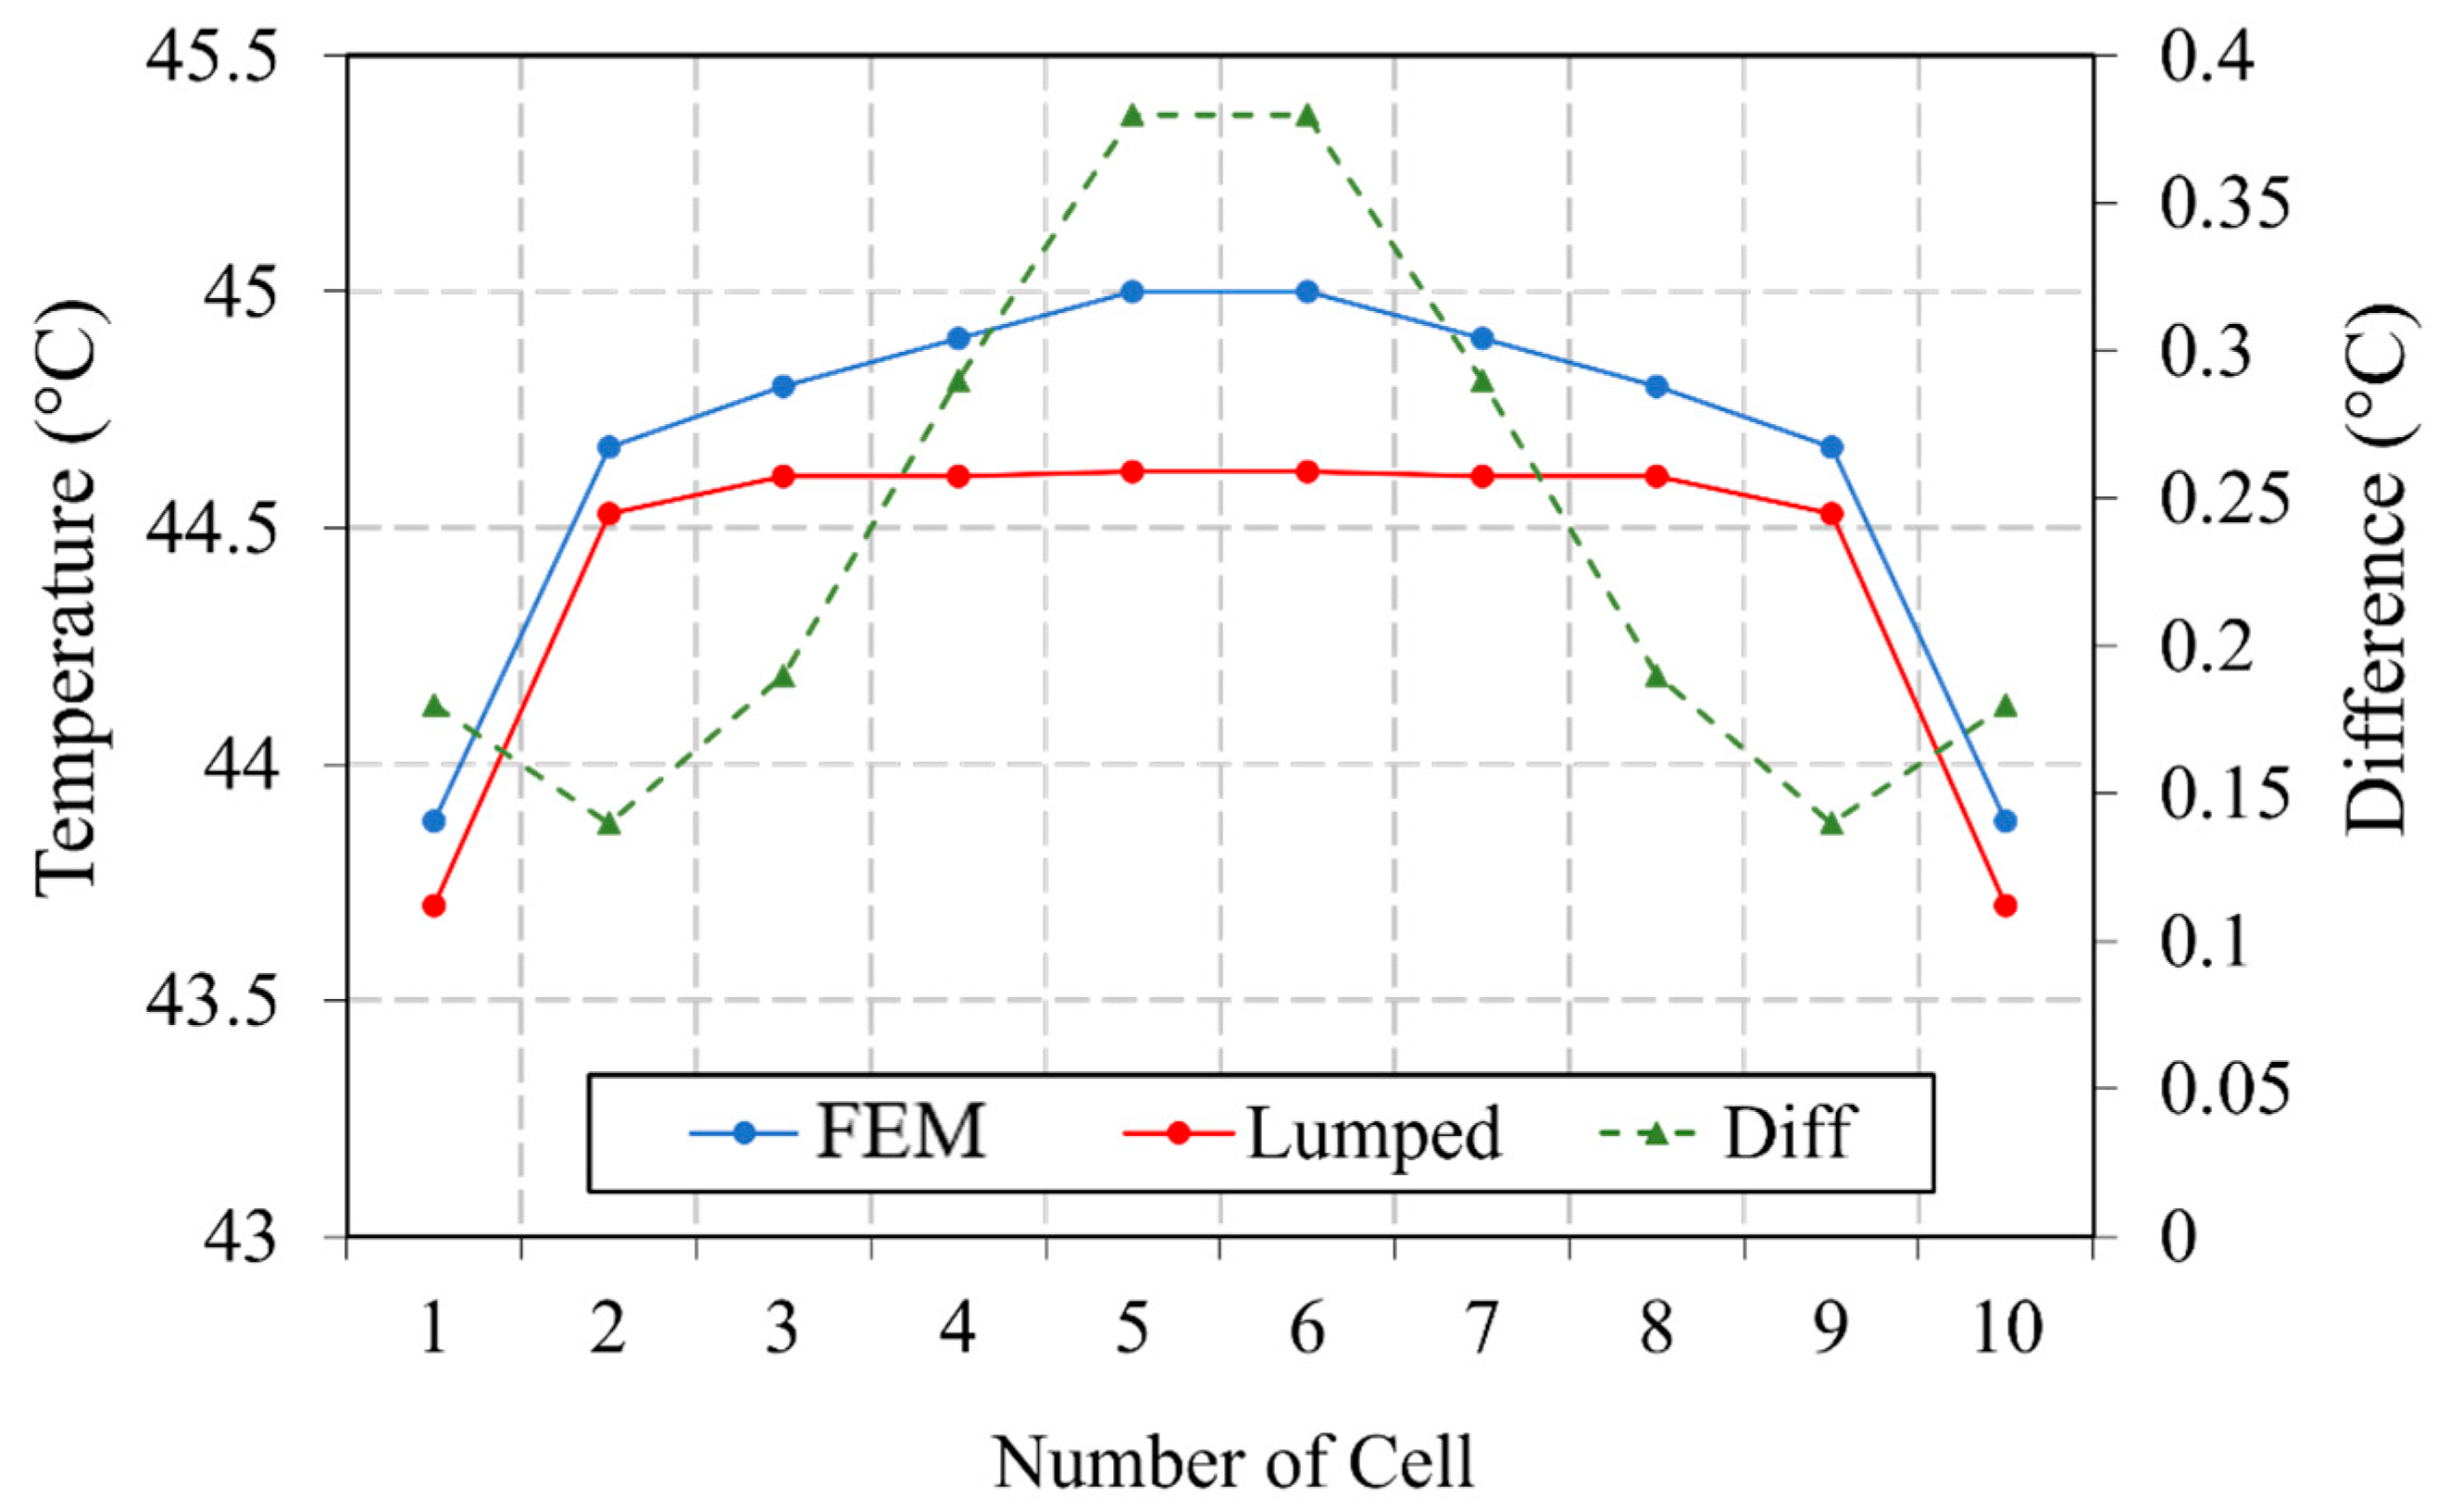
Figure 9 illustrates the maximum temperatures of the cells inside the module of 10 cells estimated by the FEM and the developed lumped model at the end of 5C discharge cycle. Same as the case of a single cell, the simulations for both models were performed with a 1 s step size. An acceptable discrepancy between the two models can be noticed, with a maximum error of approximately 0.4 °C achieved by cell numbers 5 and 6. Same as the FEM, a symmetrical thermal profile was also predicted by the lumped model, with the internally accumulated heat. However, the predicted temperature by the lumped model within the middle cells is more uniform. For instance, cell numbers 3, 4, 5, 6, 7, and 8 achieved almost same temperature (44.6 °C) at the end of the 5C discharge cycle. Noteworthily, the FEM required almost 5 h to predict the temperature, while the lumped model predicted the temperature within 3 s.
3.2. Periodic Cycles (Charge/Discharge)
3.2.1. Single-Cell Simulation
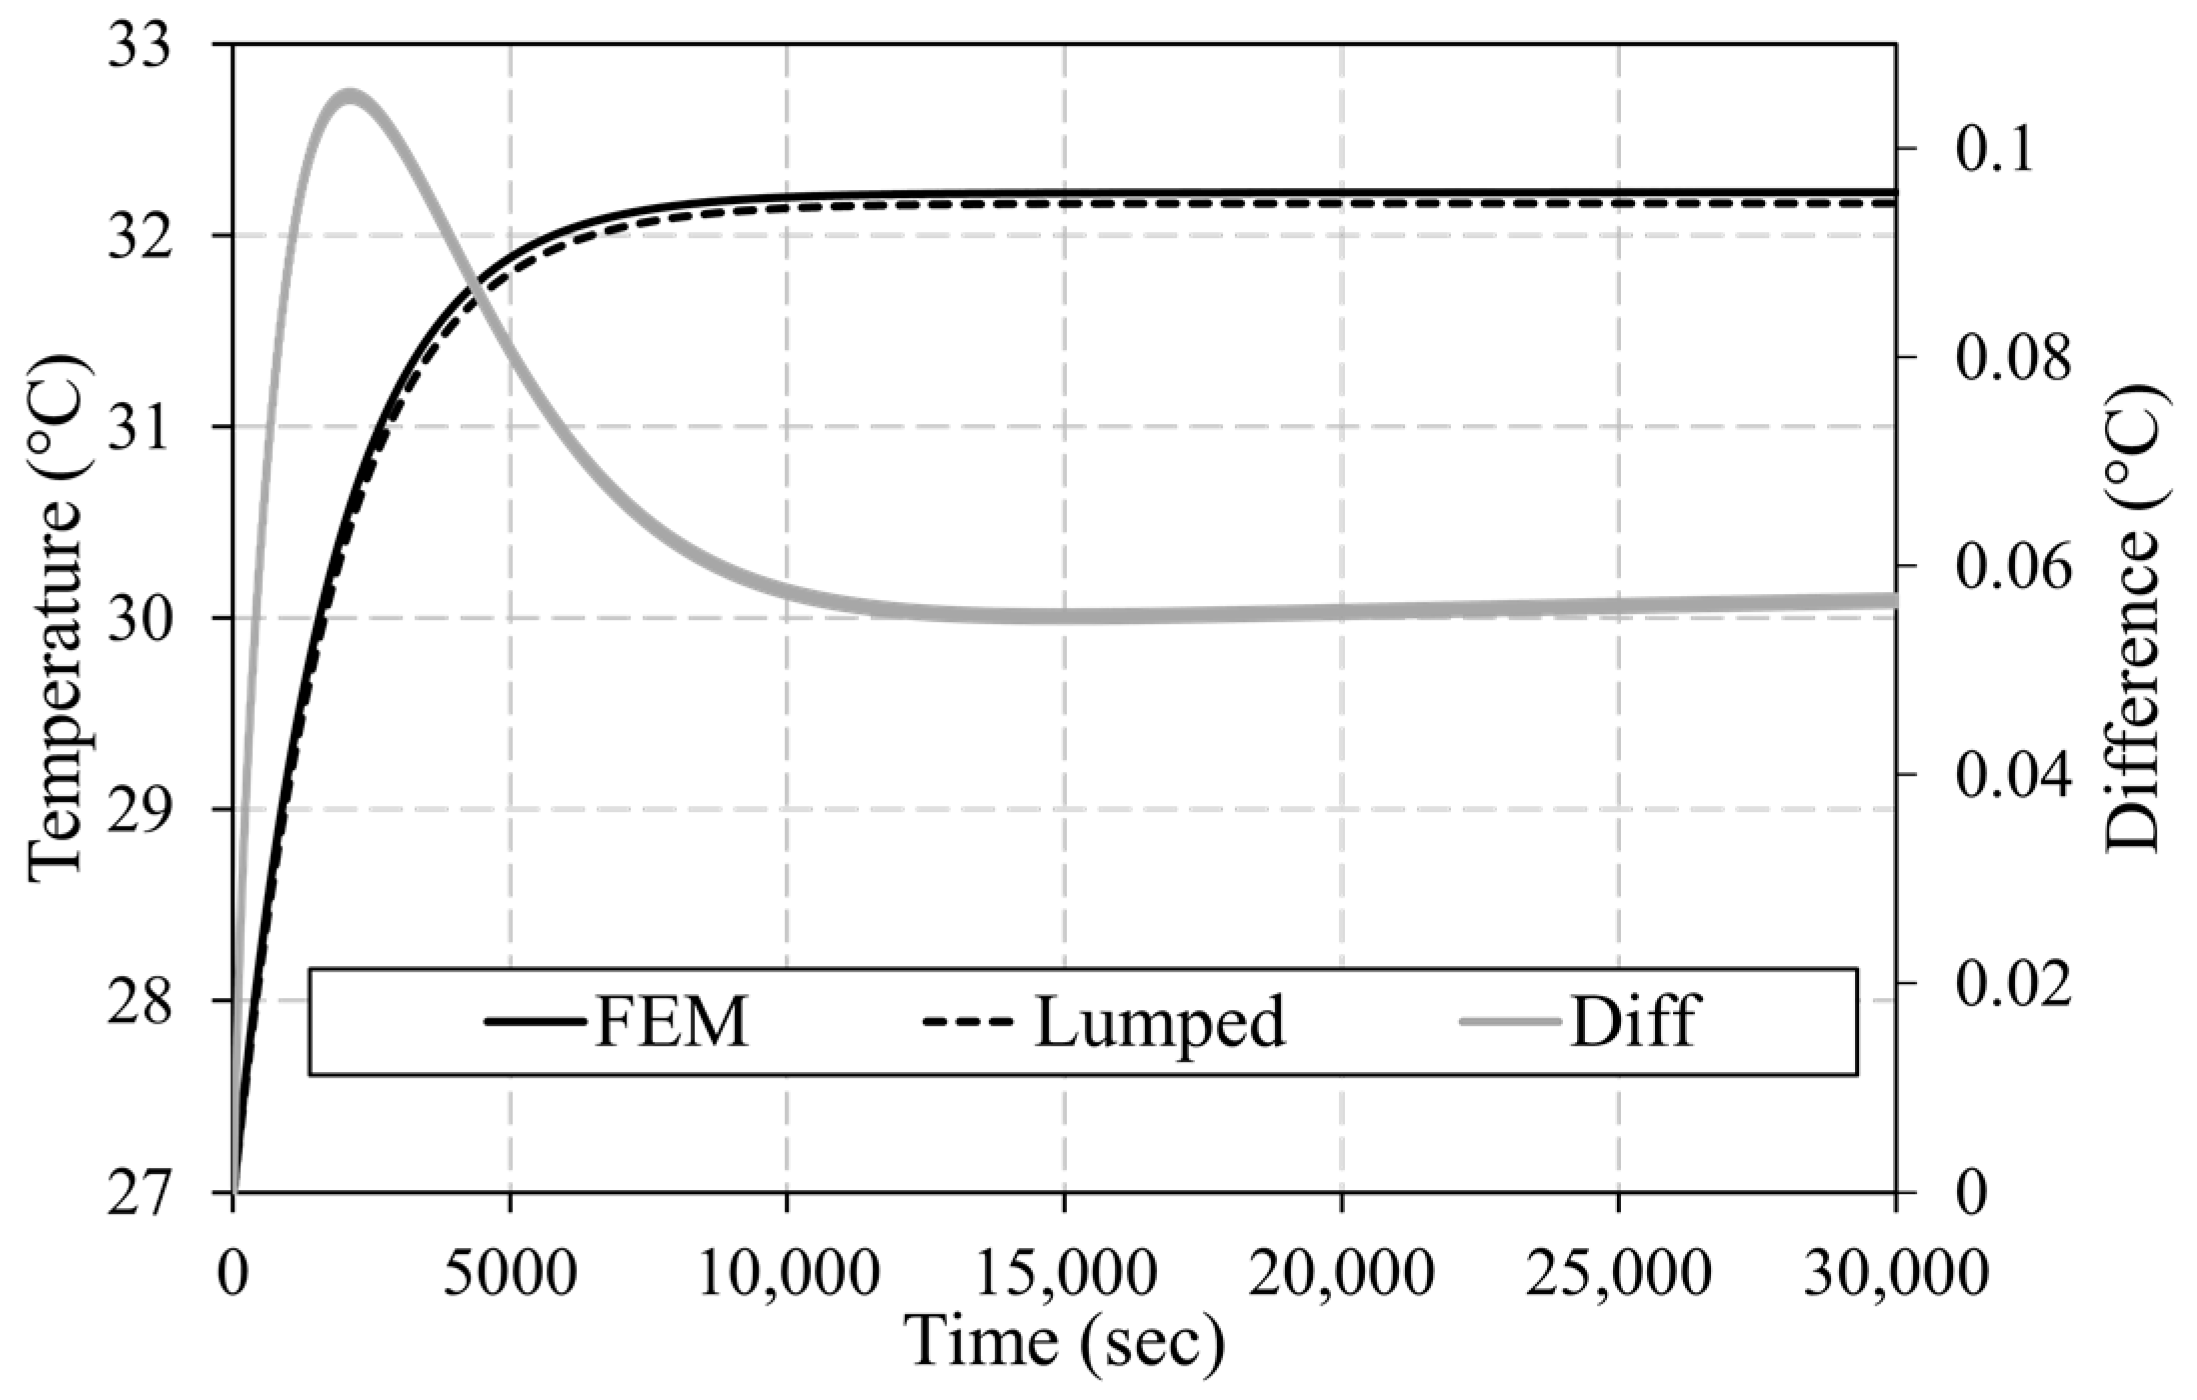
We have observed in the previous Sections that the developed 3D lumped model showed similarity in terms of temperature prediction compared to the reference FEM for the cases of single cell and module with an acceptable error and a low computational time. However, the comparative investigation was conducted only during transient thermal phases of the NMC batteries, where no steady state was achieved for the temperature of the battery. In order to reach a thermal steady state, periodic, consecutive charge/discharge cycles, with a duration of 5 s each and a C-rate of 2C, were applied on the Li-ion pouch’s NMC cell and module. Unlike the previous scenarios, the simulations were carried out with a step size of 5 s, since using a 1 s step time required a very long computational time, especially if the consecutive cycles were applied for a period of 30,000 s. In the current paper, the effect of the time step of the simulation chosen for the thermal effect was not investigated; however, including this study in future research might be beneficial. The value of 2C was only employed for the purpose of comparison between the two modeling approaches. Figure 10 illustrates the maximum temperature evolution of a single cell obtained by the two models during consecutive periodic 2C cycles. Both models showed similar profiles, with the cell achieving its thermal steady state after about 9000 s. The temperature difference was observed to increase with time, during the transient phase, until a maximum value of almost 0.12 °C was achieved. However, this value decreased until the steady state was achieved and remained constant at about 0.06 °C. In terms of the time required to solve the two models, the lumped model predicted the temperature in almost 3.5 s, unlike the FEM that took almost 9 h.
3.2.2. Module Simulation
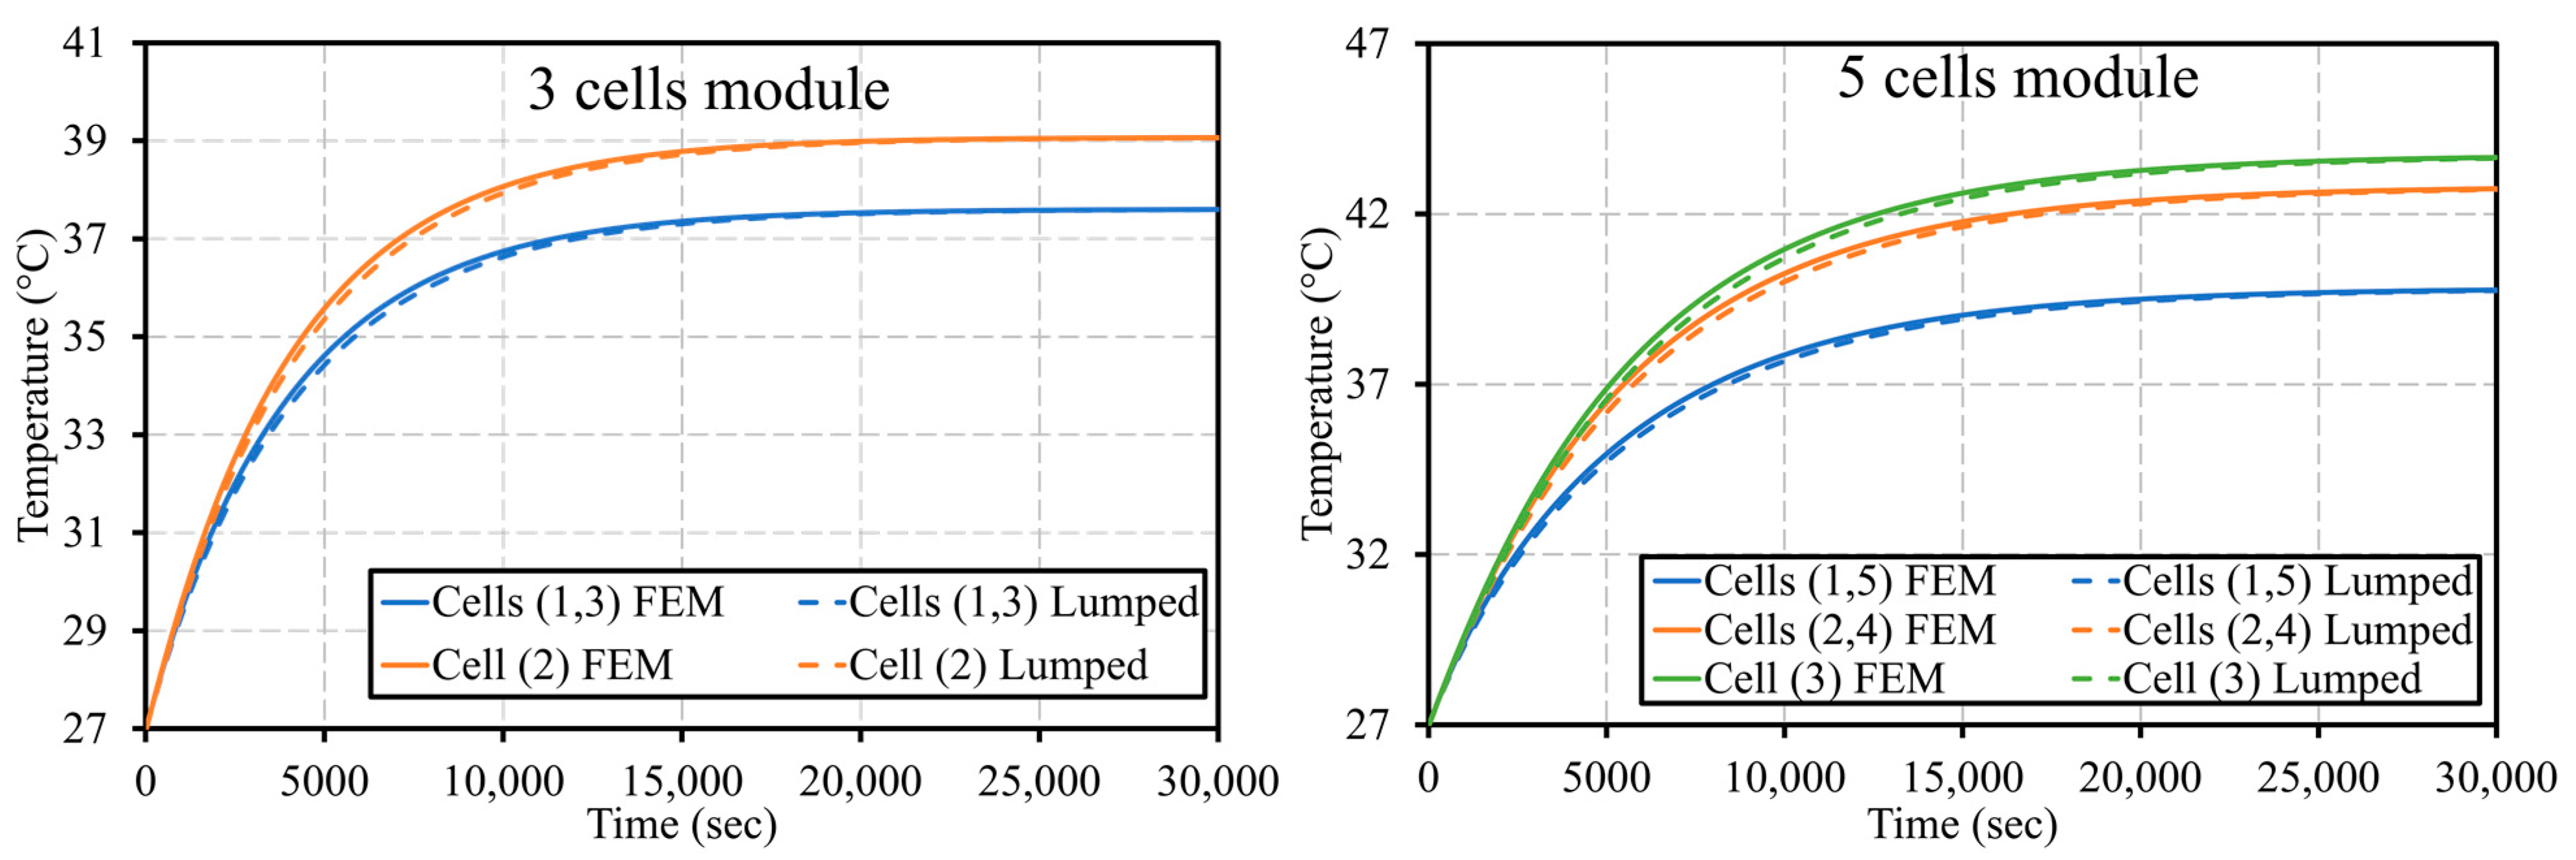
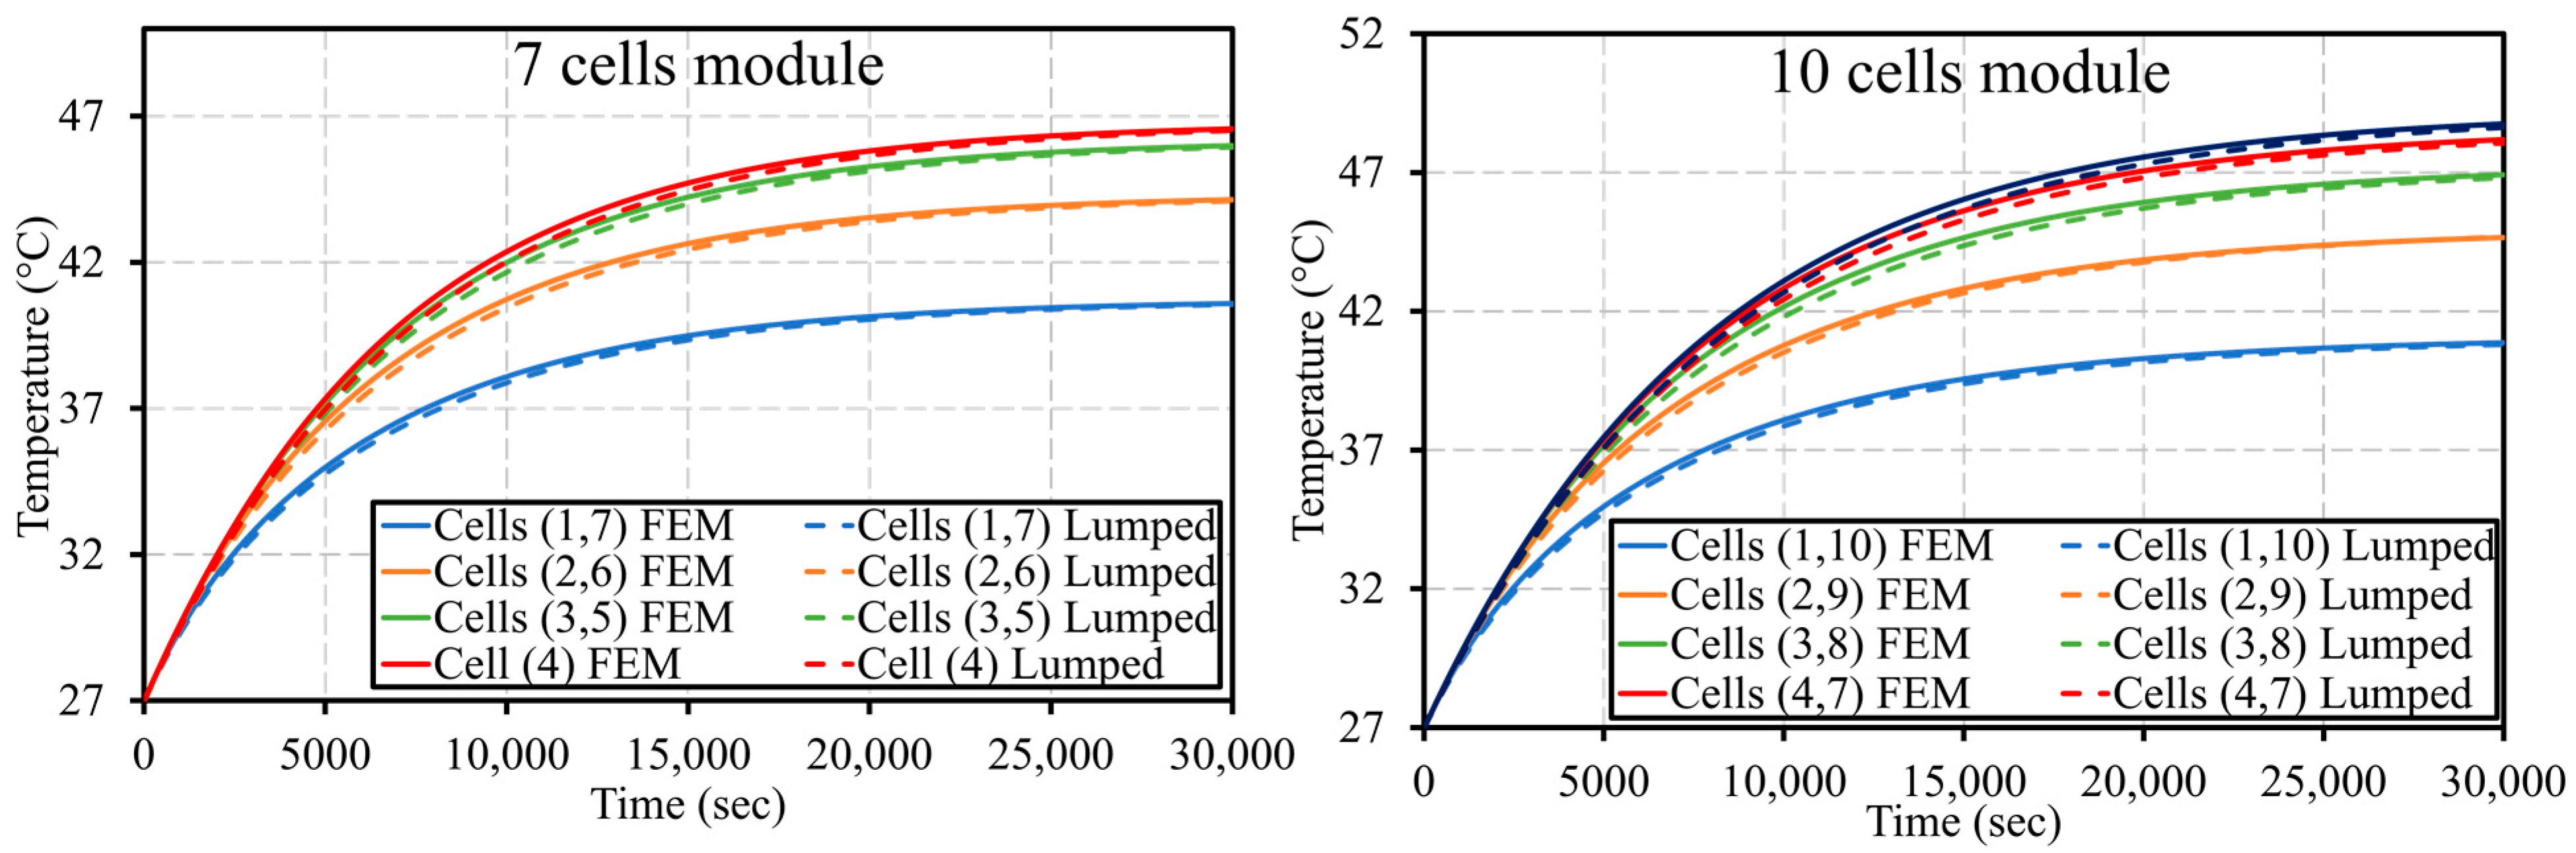
The thermal profiles of the modules composed of 3, 5, 7, and 10 cells during 2C periodic cycles are also investigated in this Section and are illustrated in Figure 11. Since a symmetrical profile of the cell temperature within the module was already observed in Figure 8 and Figure 9, the graphs in Figure 11 depict only the temperature evolution of half of the module. In the four cases, the middle cells were heating up more than the external ones. However, their temperatures remained within the admissible range. The graphs show that the maximum temperature achieved by the module and the thermal gradient between the cells were rising with the number of cells implemented in the module. For instance, the maximum temperature of a 3-cell module is 39 °C with a thermal gradient of 1.5 °C, while the 10-cell module reached a maximum value of 48 °C, with higher temperature differences between the cells. The significant thermal gradients are caused by the aerogel sheets implemented between the cells. These layers act as thermal insulators since they have very low thermal conductivity. On the one hand, the usage of aerogel sheets is recommended since it prevents the transfer of fire within the cells in the case in which one cell catches fire. On the other hand, a thermal management system must be implemented, along with the aerogel sheets, to control and decrease the temperature of the cells. It can be also noticed from the graphs that the time required to reach the steady state increases with the number of the cells. For instance, the 3-cell module reached its thermal steady state in almost 15,000 s, while this value increased to 25,000 s for the 5-cell module. For the 7- and 10-cell modules, no steady state was achieved by the cells during the 30,000 s cycling.
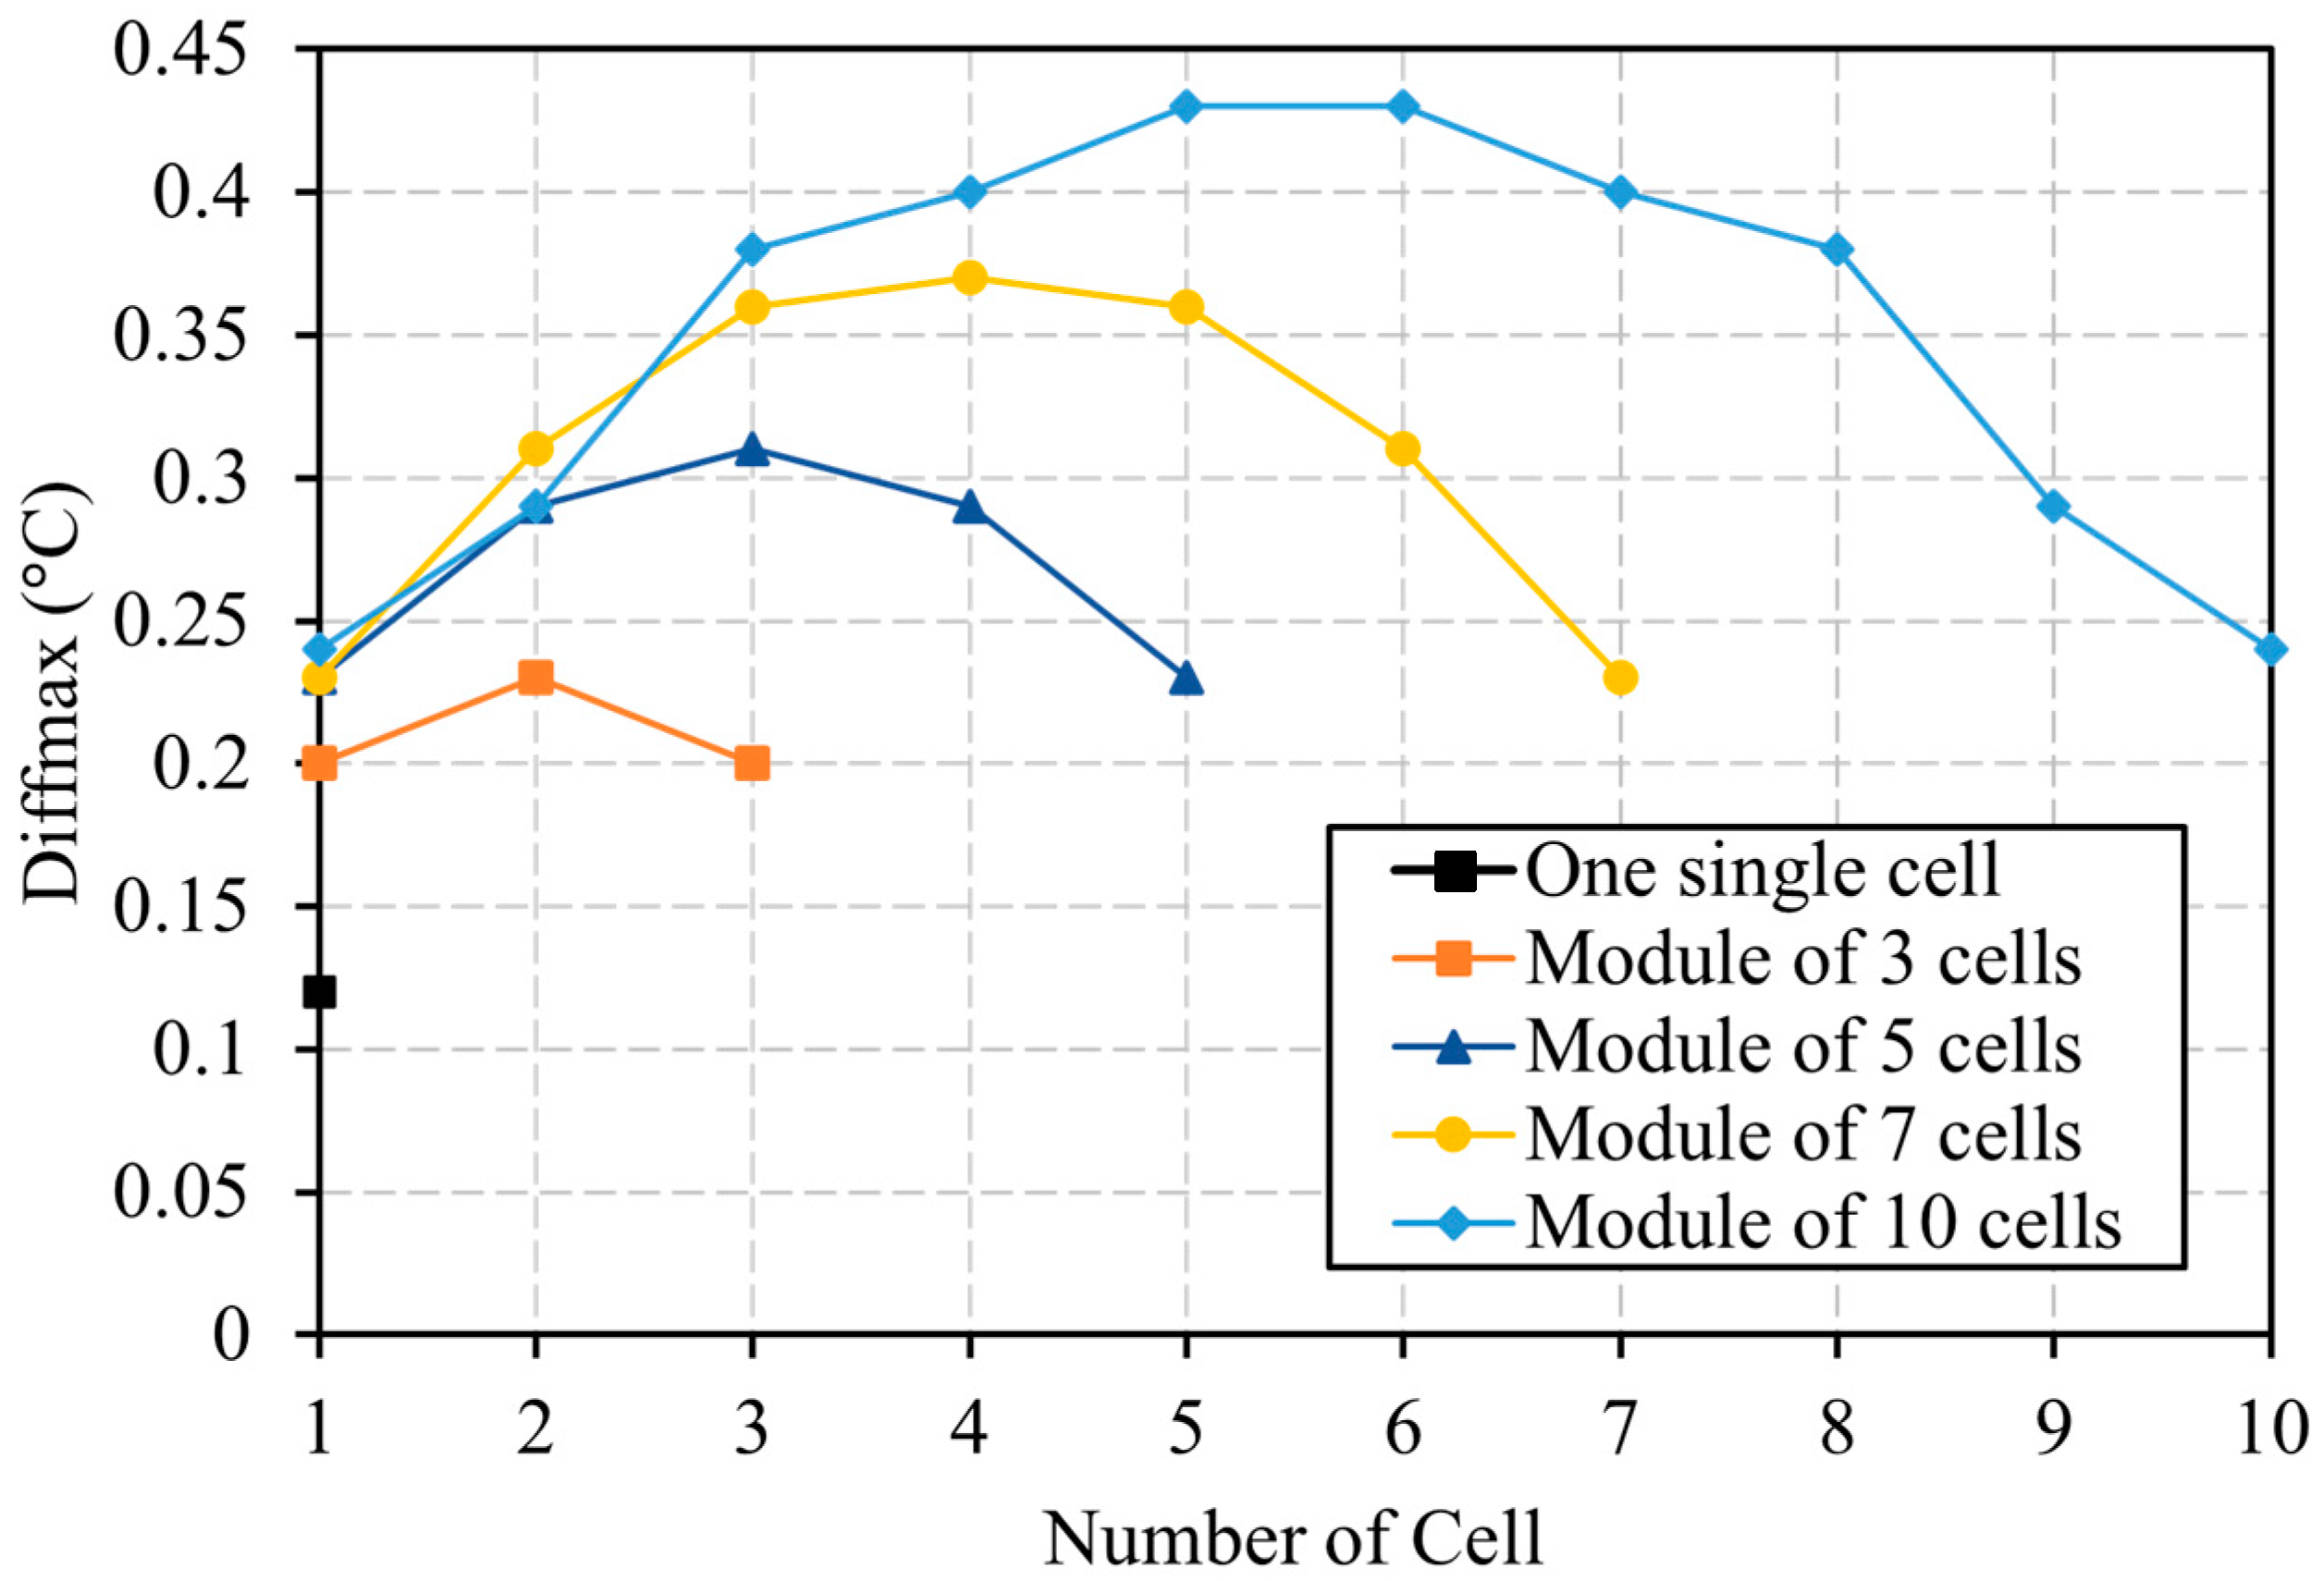
In order to assess the difference between the two models, the maximum difference, Diffmax, of the temperature obtained by both models during the 2C periodic charge/discharge cycles is depicted in Figure 12. The values of Diffmax look very promising, and we can notice that there is almost a consistency in the maximum temperature discrepancy with the number of cells. For instance, a maximum Diffmax for a module of 10 cells is equal to 0.42 °C, which is very close to the maximum Diffmax of a 3-cell module of 0.2 °C. We also observed that the maximum difference between both models was reached for the internal cells. However, it is important to mention that the modeling of the 10-cell module using the FEM took almost 21 h, which is significantly high compared to that of the developed lumped model, which required approximately 6 s to predict the temperature evolution.
4. Conclusions
In this paper, the thermal performance of a pouch Li-ion NMC battery was investigated. A 3D lumped modeling approach based on the thermal resistance network was developed and solved in MATLAB. Unlike the previous analytical models that consider the cell as a single node, the developed model considers three essential nodes for the single cell case (cell and the two tabs) and four in the case of the module by adding the aerogel or any other material in the gaps between the cells.
The aim of this study is to reduce the complexity regarding the thermal modeling of batteries. Thus, the developed lumped model was compared to a finite element model that was used as a reference model. The study was performed on two levels, i.e., single cell and module, where modules were composed of different number of cells (from 3 to 10). The simulation profiles consisted of two scenarios: constant discharge cycles and periodic consecutive charge/discharge cycles. A comparative analysis between the two models in terms of temperature prediction and time required was established.
The developed lumped model is simple and adaptable to both cases, i.e., single cell and modules with variable number of cells, and it is capable of estimating the temperature of the cells based only on the current profile utilized during the operating cycles.
The lumped model showed promising results, with a very low temperature difference compared to the FEM. The major advantage of the lumped model is the simulation time needed to solve the heat equations. For instance, the FEM required hours to predict the temperature of the battery especially during the periodic cycles of the module composed of 10 cells (21 h), while the lumped model predicted the temperature within seconds and with an acceptable accuracy.
In future studies, the models illustrated in this paper will be enhanced so they can accurately reflect the thermal and electrical behaviors of lithium-ion batteries in real use conditions. Thus, experimental tests will be conducted to allow more accurate modeling and to validate the adopted models.
Electrically, the experimental tests will aim to improve the electrical model that will be adopted by introducing the entropic part into the heat generation part and considering the voltage drop due to the charge transfer and diffusion process along with the ohmic resistance.
In the thermal sense, the tests will help us to characterize the battery and to determine the different thermal parameters required to be inputted into our thermal models. The effect of connections between the cables and tabs will also be included.
The final objective is to obtain a low-computational model that can be implemented in the battery thermal management system of shared electric vehicles by giving due consideration to the battery degradation.
Author Contributions
Conceptualization, A.A., N.R., R.T., E.R.-I. and S.P.; methodology, A.A., N.R., R.T., E.R.-I. and S.P.; software, A.A.; validation, A.A., N.R., R.T., E.R.-I. and S.P.; investigation, A.A., N.R., R.T., E.R.-I. and S.P.; writing—original draft preparation, A.A., R.T.; writing—review and editing, A.A., N.R., R.T., E.R.-I. and S.P.; supervision, N.R., R.T., E.R.-I. and S.P.; funding acquisition, N.R., R.T., E.R.-I. and S.P. All authors have read and agreed to the published version of the manuscript.
Funding
This research received no external funding.
Data Availability Statement
Data of all the parameters used in this research, are available in the Appendix A.
Conflicts of Interest
The authors declare no conflict of interest.
Nomenclature
| A | surface area exposed to air [m2] | S | normal area [m2] |
| a, b | constants used in the fits | t | time [s] |
| Cnom | nominal Capacity [Ah] | T | temperature [K] |
| Cp | specific heat capacity [J/kg K] | Ta | ambient temperature [K] |
| DOD | depth of discharge | Ti,c | cell internal temperature [K] |
| h | heat Transfer coefficient [W m2/K] | Ti,g | gap internal temperature [K] |
| I | current [A] | Ti,p | positive tab internal temperature [K] |
| L | length [m] | Ti,n | negative tab internal temperature [K] |
| qconv | convection heat flux [W] | Tref | reference temperature [K] |
| Qirr | irreversible heat generated [W] | Ts | surface temperature [K] |
| Relc | electrical resistance [Ω] | Ucell | cell voltage [V] |
| Rc | heat transfer resistance inside the cell [K/W] | UOCV | open circuit voltage [V] |
| Rhc | heat transfer resistance outside the cell [K/W] | V | volume [m3] |
| Rg | heat transfer resistance inside the insulator [K/W] | x, y, z | coordinates components [m] |
| Rhg | heat transfer resistance outside the insulator [K/W] | ω1, ω2 | constants used in the fits |
| Rhn | heat transfer resistance outside the negative tab [K/W] | ρ | density [Kg/m3] |
| Rhp | heat transfer resistance outside the positive tab [K/W] | λ | thermal conductivity [W.m/K] |
| Rn | heat transfer resistance inside the negative tab [K/W] | δ | thickness [m] |
| Rp | heat transfer resistance inside the positive tab [K/W] |
Appendix A. Tables

Table A1.
Characteristics of the NMC pouch battery.
| Characteristics | Value |
|---|---|
| Cell format | Pouch |
| Cell chemistry | NMC/Graphite |
| Cell dimensions | 196 × 127 × 7 mm |
| Tabs dimensions | 30 × 23 × 6 mm |
| Nominal capacity | 14.6 Ah |
| Nominal voltage | 3.65 V |
| Charge cut-off voltage | 4.2 V |
| Discharge cut-off voltage | 2.9 V |
Table A2.
The NTGK fitting parameters.
| Parameter | Coefficient | |||||
|---|---|---|---|---|---|---|
| Uocv | a0 4.12 | a1 −0.804 | a2 1.075 | a3 −1.177 | a4 0 | a5 0 |
| Relc | b0 86 × 10−5 | b1 −11 × 10−5 | b2 19 × 10−6 | b3 −73 × 10−7 | b4 63 × 10−7 | b5 15 × 10−6 |
| ω1 | 94 × 10−4 | |||||
| ω2 | 1800 | |||||
Table A3.
Thermal and physical properties of the layers of the Li-ion cell [32].
Table A3.
Thermal and physical properties of the layers of the Li-ion cell [32].
| Field | δ | ρ | Cp | λ | σ |
|---|---|---|---|---|---|
| Al | 0.357 × 10⁻³ | 2702 | 903 | 238 | 378 × 105 |
| NMC | 2.38 × 10⁻³ | 2895 | 1270 | 1.58 | 13.9 |
| Separator | 0.9 × 10⁻³ | 1017 | 1978 | 0.34 | -- |
| Cu | 0.215 × 10⁻³ | 8933 | 385 | 398 | 596 × 105 |
| Graphite | 2.84 × 10⁻³ | 1555 | 1437 | 1.04 | 100 |
| Pouch | 0.324 × 10⁻³ | 1150 | 1900 | 16 | -- |
Table A4.
Thermal and physical parameters of the insulation layer made of aerogel [34].
Table A4.
Thermal and physical parameters of the insulation layer made of aerogel [34].
| Parameters | Value |
|---|---|
| δ | 0.002 mm |
| ρ | 195 kg/m3 |
| Cp | 1800 J/kg K |
| λ | 0.002 W/m K |
Table A5.
Thermal resistances.
| Resistance | Equation | Symbolization and Definition | Values of the Parameters in the Equations | ||
|---|---|---|---|---|---|
| Conductive resistance | Rc = L/2λS | Rcx: Resistance in the cell x-axis | L = 0.127 m | λ = 25.4 W/m K | S = 1.37 × 10⁻³ m2 |
| Rcy: Resistance in the cell y-axis | L = 0.196 m | λ = 25.4 W/m K | S = 8.89 × 10⁻⁴ m2 | ||
| Rcz: Resistance in the cell z-axis | L = 0.007 m | λ = 0.79 W/m K | S = 2.49 × 10⁻² m2 | ||
| Rpx: Resistance in the positive tab x-axis | L = 0.023 m | λ = 238 W/m K | S = 1.84 × 10⁻⁴ m2 | ||
| Rpy: Resistance in the positive tab y-axis | L = 0.03 m | λ = 238 W/m K | S = 1.38 × 10⁻⁴ m2 | ||
| Rpz: Resistance in the positive tab z-axis | L = 0.006 m | λ = 238 W/m K | S = 6.9 × 10⁻⁴ m2 | ||
| Rnx: Resistance in the negative tab x-axis | L = 0.023 m | λ = 398 W/m K | S = 1.84 × 10⁻⁴ m2 | ||
| Rny: Resistance in the negative tab y-axis | L = 0.03 m | λ = 398 W/m K | S = 1.38 × 10⁻⁴ m2 | ||
| Rnz: Resistance in the negative tab z-axis | L = 0.006 m | λ = 398 W/m K | S = 6.9 × 10⁻⁴ m2 | ||
| Rgx: Resistance in the aerogel x-axis | L = 0.127 m | λ = 2 × 10⁻³ W/m K | S = 392 × 10−6 m2 | ||
| Rgy: Resistance in the aerogel y-axis | L = 0.196 m | λ = 2 × 10⁻³ W/m K | S = 254 × 10−6 m2 | ||
| Rgz: Resistance in the aerogel z-axis | L = 0.002 m | λ = 2 × 10⁻³ W/m K | S = 249 × 10−4 m2 | ||
| Convective resistance | Rh = 1/hS | Rhcx: Resistance cell/ambient x-axis | h = 5 W/m2 K | S = 1.37 × 10⁻³ m2 | |
| Rhcy: Resistance cell/ambient y-axis | h = 5 W/m2 K | S = 8.89 × 10⁻⁴ m2 | |||
| Rhcz: Resistance cell/ambient z-axis | h = 5 W/m2 K | S = 2.49 × 10⁻² m2 | |||
| Rhpx, Rhnx: Resistances tabs/ambient x-axis | h = 5 W/m2 K | S = 1.84 × 10⁻⁴ m2 | |||
| Rhpy, Rhny: Resistances tabs/ambient y-axis | h = 5 W/m2 K | S = 1.38 × 10⁻⁴ m2 | |||
| Rhpz, Rhnz: Resistance tabs/ambient z-axis | h = 5 W/m2 K | S = 6.9 × 10⁻⁴ m2 | |||
| Rhgx: Resistance aerogel/ambient x-axis | h = 5 W/m2 K | S = 3.92 × 10⁻⁴ m2 | |||
| Rhgy: Resistance aerogel/ambient y-axis | h = 5 W/m2 K | S = 2.54 × 10⁻⁴ m2 | |||
References
- Pan, D.; Guo, H.; Tang, S.; Li, X.; Wang, Z.; Peng, W.; Wang, J.; Yan, G. Evaluating the accuracy of electro-thermal coupling model in lithium-ion battery via altering internal resistance acquisition methods. J. Power Sources 2020, 463, 228174. [Google Scholar] [CrossRef]
- Raijmakers, L.; Danilov, D.; Eichel, R.-A.; Notten, P. A review on various temperature-indication methods for Li-ion batteries. Appl. Energy 2019, 240, 918–945. [Google Scholar] [CrossRef]
- Hassini, M.; Redondo-Iglesias, E.; Venet, P. Second-Life Batteries Modeling for Performance Tracking in a Mobile Charging Station. World Electr. Veh. J. 2023, 14, 94. [Google Scholar] [CrossRef]
- Liu, J.; Yadav, S.; Salman, M.; Chavan, S.; Kim, S.C. Review of thermal coupled battery models and parameter identification for lithium-ion battery heat generation in EV battery thermal management system. Int. J. Heat Mass Transf. 2024, 218, 124748. [Google Scholar] [CrossRef]
- Ma, S.; Jiang, M.; Tao, P.; Song, C.; Wu, J.; Wang, J.; Deng, T.; Shang, W. Temperature effect and thermal impact in lithium-ion batteries: A review. Prog. Nat. Sci. 2018, 28, 653–666. [Google Scholar] [CrossRef]
- Wu, Y.; Keil, P.; Schuster, S.F.; Jossen, A. Impact of Temperature and Discharge Rate on the Aging of a LiCoO2/LiNi0.8Co0.15Al0.05O2Lithium-Ion Pouch Cell. J. Electrochem. Soc. 2017, 164, A1438–A1445. [Google Scholar] [CrossRef]
- Olabi, A.; Maghrabie, H.M.; Adhari, O.H.K.; Sayed, E.T.; Yousef, B.A.; Salameh, T.; Kamil, M.; Abdelkareem, M.A. Battery thermal management systems: Recent progress and challenges. Int. J. Thermofluids 2022, 15, 100171. [Google Scholar] [CrossRef]
- Yang, T.; Yang, N.; Zhang, X.; Li, G. Investigation of the thermal performance of axial-flow air cooling for the lithium-ion battery pack. Int. J. Therm. Sci. 2016, 108, 132–144. [Google Scholar] [CrossRef]
- Bryden, T.S.; Dimitrov, B.; Hilton, G.; de León, C.P.; Bugryniec, P.; Brown, S.; Cumming, D.; Cruden, A. Methodology to determine the heat capacity of lithium-ion cells. J. Power Sources 2018, 395, 369–378. [Google Scholar] [CrossRef]
- Morali, U. A numerical and statistical implementation of a thermal model for a lithium-ion battery. Energy 2021, 240, 122486. [Google Scholar] [CrossRef]
- Kwon, K.H.; Shin, C.B.; Kang, T.H.; Kim, C.-S. A two-dimensional modeling of a lithium-polymer battery. J. Power Sources 2006, 163, 151–157. [Google Scholar] [CrossRef]
- Kim, G.-H.; Smith, K.; Lee, K.-J.; Santhanagopalan, S.; Pesaran, A. Multi-Domain Modeling of Lithium-Ion Batteries Encompassing Multi-Physics in Varied Length Scales. J. Electrochem. Soc. 2011, 158, A955–A969. [Google Scholar] [CrossRef]
- Liu, J.; Chavan, S.; Kim, S.-C. Investigation of the Electrochemical and Thermal Characteristics of NCM811-21700 Cylindrical Lithium-Ion Battery: A Numerical Study and Model Validation. Energies 2023, 16, 6407. [Google Scholar] [CrossRef]
- Jokar, A.; Rajabloo, B.; Désilets, M.; Lacroix, M. Review of simplified Pseudo-two-Dimensional models of lithium-ion batteries. J. Power Sources 2016, 327, 44–55. [Google Scholar] [CrossRef]
- Hamisi, C.M.; Chombo, P.V.; Laoonual, Y.; Wongwises, S. An Electrothermal Model to Predict Thermal Characteristics of Lithium-Ion Battery under Overcharge Condition. Energies 2022, 15, 2284. [Google Scholar] [CrossRef]
- Liu, Y.; Liao, Y.G.; Lai, M.-C. Transient Temperature Distributions on Lithium-Ion Polymer SLI Battery. Vehicles 2019, 1, 127–137. [Google Scholar] [CrossRef]
- Zhang, H.; Li, C.; Zhang, R.; Lin, Y.; Fang, H. Thermal analysis of a 6s4p Lithium-ion battery pack cooled by cold plates based on a multi-domain modeling framework. Appl. Therm. Eng. 2020, 173, 115216. [Google Scholar] [CrossRef]
- Forgez, C.; Do, D.V.; Friedrich, G.; Morcrette, M.; Delacourt, C. Thermal modeling of a cylindrical LiFePO4/graphite lithium-ion battery. J. Power Sources 2010, 195, 2961–2968. [Google Scholar] [CrossRef]
- Damay, N.; Forgez, C.; Bichat, M.-P.; Friedrich, G. Thermal modeling of large prismatic LiFePO4/graphite battery. Coupled thermal and heat generation models for characterization and simulation. J. Power Sources 2017, 283, 37–45. [Google Scholar] [CrossRef]
- Akbarzadeh, M.; Kalogiannis, T.; Jaguemont, J.; He, J.; Jin, L.; Berecibar, M.; Van Mierlo, J. Thermal modeling of a high-energy prismatic lithium-ion battery cell and module based on a new thermal characterization methodology. J. Energy Storage 2020, 32, 101707. [Google Scholar] [CrossRef]
- Jiang, Z.; Qu, Z.; Zhang, J.; Rao, Z. Rapid prediction method for thermal runaway propagation in battery pack based on lumped thermal resistance network and electric circuit analogy. Appl. Energy 2020, 268, 115007. [Google Scholar] [CrossRef]
- Abbas, A.; Rizoug, N.; Trigui, R.; Redondo-Iglesias, E.; Pelissier, S. Simulation of the Thermal Behavior of NMC Module under Different Electrical Scenarios. In Proceedings of the 2023 IEEE Vehicle Power and Propulsion Conference (VPPC), Milan, Italy, 23–27 October 2023; pp. 1–6. [Google Scholar]
- Paccha-Herrera, E.; Calderón-Muñoz, W.R.; Orchard, M.; Jaramillo, F.; Medjaher, K. Thermal Modeling Approaches for a LiCoO2 Lithium-ion Battery—A Comparative Study with Experimental Validation. Batteries 2020, 6, 40. [Google Scholar] [CrossRef]
- Gu, H. Mathematical Analysis of a Zn/NiOOH Cell. J. Electrochem. Soc. 1983, 130, 1459–1464. [Google Scholar] [CrossRef]
- Kim, U.S.; Yi, J.; Shin, C.B.; Han, T.; Park, S. Modeling the Dependence of the Discharge Behavior of a Lithium-Ion Battery on the Environmental Temperature. J. Electrochem. Soc. 2011, 158, A611. [Google Scholar] [CrossRef]
- Immonen, E.; Hurri, J. Incremental thermo-electric CFD modeling of a high-energy Lithium-Titanate Oxide battery cell in different temperatures: A comparative study. Appl. Therm. Eng. 2021, 197, 117260. [Google Scholar] [CrossRef]
- Chacko, S.; Chung, Y.M. Thermal modelling of Li-ion polymer battery for electric vehicle drive cycles. J. Power Sources 2012, 213, 296–303. [Google Scholar] [CrossRef]
- Liu, X.; Ai, W.; Marlow, M.N.; Patel, Y.; Wu, B. The effect of cell-to-cell variations and thermal gradients on the performance and degradation of lithium-ion battery packs. Appl. Energy 2019, 248, 489–499. [Google Scholar] [CrossRef]
- Ziat, K.; Louahlia, H.; Petrone, R.; Gualous, H.; Schaetzel, P. Experimental investigation on the impact of the battery charging/discharging current ratio on the operating temperature and heat generation. Int. J. Energy Res. 2021, 45, 16754–16768. [Google Scholar] [CrossRef]
- Viswanathan, V.V.; Choi, D.; Wang, D.; Xu, W.; Towne, S.; Williford, R.E.; Zhang, J.-G.; Liu, J.; Yang, Z. Effect of entropy change of lithium intercalation in cathodes and anodes on Li-ion battery thermal management. J. Power Sources 2010, 195, 3720–3729. [Google Scholar] [CrossRef]
- Smith, K.; Wang, C.-Y. Power and thermal characterization of a lithium-ion battery pack for hybrid-electric vehicles. J. Power Sources 2006, 160, 662–673. [Google Scholar] [CrossRef]
- Taheri, P.; Yazdanpour, M.; Bahrami, M. Transient three-dimensional thermal model for batteries with thin electrodes. J. Power Sources 2013, 243, 280–289. [Google Scholar] [CrossRef]
- Chen, S.; Wan, C.; Wang, Y. Thermal analysis of lithium-ion batteries. J. Power Sources 2005, 140, 111–124. [Google Scholar] [CrossRef]
- Frackowiak, E.; Béguin, F. Carbon materials for the electrochemical storage of energy in capacitors. Carbon 2001, 39, 937–950. [Google Scholar] [CrossRef]
- Yang, X.; Duan, Y.; Feng, X.; Chen, T.; Xu, C.; Rui, X.; Ouyang, M.; Lu, L.; Han, X.; Ren, D.; et al. An Experimental Study on Preventing Thermal Runaway Propagation in Lithium-Ion Battery Module Using Aerogel and Liquid Cooling Plate Together. Fire Technol. 2020, 56, 2579–2602. [Google Scholar] [CrossRef]
- Bejan, A. Convection Heat Transfer; John Wiley & Sons: New York, NY, USA, 2013. [Google Scholar]
- Rizk, R.; Louahlia, H.; Gualous, H.; Schaetzel, P. Experimental analysis and transient thermal modelling of a high capacity prismatic lithium-ion battery. Int. Commun. Heat Mass Transf. 2018, 94, 115–125. [Google Scholar] [CrossRef]
- ANSYS Inc. ANSYS Fluent Theory Guide (Release 2021 R1); ANSYS Inc.: Canonsburg, PA, USA, 2021. [Google Scholar]
- The MathWorks, Inc. MATLAB Version:9.9.0 (R2020b). 2020. Available online: https://www.mathworks.com (accessed on 1 April 2022).
Figure 1.
Adopted modeling scheme.

Figure 2.
NMC cell’s internal structure (a), the dimensions of the cell (b), and the design of a 10-cell module battery (c).
Figure 2.
NMC cell’s internal structure (a), the dimensions of the cell (b), and the design of a 10-cell module battery (c).

Figure 3.
Values of Relc (Ω) (a), and UOCV (V) (b) versus DOD at different ambient temperatures.

Figure 4.
The schematic of the 3D thermal network model for the NMC Li-ion cell and tabs in the [x–y] axis (a) and the [z–y] axis (b).
Figure 4.
The schematic of the 3D thermal network model for the NMC Li-ion cell and tabs in the [x–y] axis (a) and the [z–y] axis (b).

Figure 5.
Schematic of the 10-cell module (a) and the thermal resistance network (b).

Figure 6.
The mesh model of a single battery (a), and the influence of the gird number on the maximum cell temperature during 5C discharge rate (b).
Figure 6.
The mesh model of a single battery (a), and the influence of the gird number on the maximum cell temperature during 5C discharge rate (b).

Figure 7.
Maximum cell temperature evolution during discharge cycles obtained by FEM and lumped model.
Figure 7.
Maximum cell temperature evolution during discharge cycles obtained by FEM and lumped model.

Figure 8.
Temperature contour of single cell and modules at the end of the 5C discharge cycle obtained by the FEM.
Figure 8.
Temperature contour of single cell and modules at the end of the 5C discharge cycle obtained by the FEM.

Figure 9.
Maximum cell temperature in the 10-cell module at the end of 5C discharge cycle obtained by the FEM and the lumped model.
Figure 9.
Maximum cell temperature in the 10-cell module at the end of 5C discharge cycle obtained by the FEM and the lumped model.

Figure 10.
Maximum temperature evolution during periodic 2C cycles of one cell obtained by the FEM and the lumped model.
Figure 10.
Maximum temperature evolution during periodic 2C cycles of one cell obtained by the FEM and the lumped model.

Figure 11.
Maximum temperature evolution of 3-, 5-, 7-, and 10-cell modules during periodic cycles 2C obtained by the lumped model and the FEM.
Figure 11.
Maximum temperature evolution of 3-, 5-, 7-, and 10-cell modules during periodic cycles 2C obtained by the lumped model and the FEM.


Figure 12.
Maximum cell temperature difference between the lumped model and the FEM for one single cell and 3-, 5-, 7-, and 10-cell modules during the 2C periodic cycles.
Figure 12.
Maximum cell temperature difference between the lumped model and the FEM for one single cell and 3-, 5-, 7-, and 10-cell modules during the 2C periodic cycles.

Table 1.
Thermal equations of the lumped model.
| Thermal Equations | Case | |
|---|---|---|
| (ρ)cell = Qirr − 2[ + + ] − [ + ] | (12) | Cell in single cell |
| (ρ)Al = −2[ + ] − + | (13) | Tab p in single cell or battery module |
| (ρ)Cu = −2[ + ] − + | (14) | Tab n in single cell or battery module |
| (ρ)cell = Qirr − 2[ + ] − − [ − [ + ] | (15) | External cell in battery module |
| (ρ)cell = Qirr − 2[+] − [ − [ − [ + ] | (16) | Internal cell in battery module |
| (ρ)gap = −2[ + ] + [ + [ | (17) | Aerogel layer in battery module |
Disclaimer/Publisher’s Note: The statements, opinions and data contained in all publications are solely those of the individual author(s) and contributor(s) and not of MDPI and/or the editor(s). MDPI and/or the editor(s) disclaim responsibility for any injury to people or property resulting from any ideas, methods, instructions or products referred to in the content. |
© 2024 by the authors. Licensee MDPI, Basel, Switzerland. This article is an open access article distributed under the terms and conditions of the Creative Commons Attribution (CC BY) license (https://creativecommons.org/licenses/by/4.0/).
Share and Cite
MDPI and ACS Style
Abbas, A.; Rizoug, N.; Trigui, R.; Redondo-Iglesias, E.; Pelissier, S. Low-Computational Model to Predict Individual Temperatures of Cells within Battery Modules. Batteries 2024, 10, 98. https://doi.org/10.3390/batteries10030098
AMA Style
Abbas A, Rizoug N, Trigui R, Redondo-Iglesias E, Pelissier S. Low-Computational Model to Predict Individual Temperatures of Cells within Battery Modules. Batteries. 2024; 10(3):98. https://doi.org/10.3390/batteries10030098
Chicago/Turabian StyleAbbas, Ali, Nassim Rizoug, Rochdi Trigui, Eduardo Redondo-Iglesias, and Serge Pelissier. 2024. "Low-Computational Model to Predict Individual Temperatures of Cells within Battery Modules" Batteries 10, no. 3: 98. https://doi.org/10.3390/batteries10030098
Note that from the first issue of 2016, this journal uses article numbers instead of page numbers. See further details here.