
A WRF Simulation of an Episode of Contrails Covering the Entire Sky


1
Department of Physics—Universitat Politècnica de Catalunya—BarcelonaTech, Barcelona 08034, Spain
2
Institute of Space Studies of Catalonia (IEEC–UPC), Barcelona 08034, Spain
*
Author to whom correspondence should be addressed.
Atmosphere 2016, 7(7), 95; https://doi.org/10.3390/atmos7070095
Submission received: 30 May 2016
/
Revised: 27 June 2016
/
Accepted: 12 July 2016
/
Published: 20 July 2016
(This article belongs to the Special Issue Advances in Clouds and Precipitation)
Abstract
:On 21 September 2012 the entire sky was covered by contrails over the Gulf of Lyon (NW of the Mediterranean basin). These clouds were well recorded by ground observers as well as by Meteosat imagery. The atmospheric characteristics at the levels where these anthropic clouds formed are analyzed by performing a WRF simulation in the area where Meteosat recorded contrail clouds. According to the vertical profiles of temperature and the relative humidity respect to the ice (RHI), the environmental condition favors that the water vapor exhaust emitted by the aircraft engines reaches the deposition point and form crystal clouds, which spread out because the temperature remained below 230 K and the RHI was higher than 70% during the whole episode.
1. Introduction
In a pioneer study about the condensation trails of aircraft, [1] defined the term contrail as clouds that form when a mixture of warm, unsaturated, engine exhaust gases and cold ambient air reaches saturation with respect to water, forming liquid drops, which quickly freeze. The ambient air mixes with the exhaust gas, the absolute humidity of which decreases directly proportional to the decreases in its temperature [2]. If the environment is saturated with respect to the ice, the ice particles forming the contrail can grow and the contrail spreads out, covering a large area in the sky. Temperature and humidity play a key role in spreading out contrails [3]. This author, by using numerical simulations, found that, in order to guarantee persistency of contrails, the air needs to have a relative humidity of 70% with respect to the ice (here after, RHI). Additionally, at a given relative humidity, the ice crystal’s growth rate increases with increasing temperature. The authors of [4] found an exponential increase of the lifetime of contrails with the increase of humidity. A dry environment prevents the contrails from spreading out. In [5], the authors argued that contrails require a special thermodynamic state of the atmosphere: low temperatures (lower that 230 K) at around 250 hPa (around 9.500 m). According to [6], in the initial growth stage of an ice particle, a contrail rapidly evaporate (around tens of second) if the air is dry. However, contrail growths will continue and spread out in an environment saturated respect to the ice, and eventually it may transform into cirrus clouds [7,8,9].
Ice clouds in the upper troposphere cover around 20%–30% of global surface [10], playing an important role in the earth’s radiation budget. Contrails are contributing to increase the coverage of ice crystal around the Earth. Due to the large increase of the number of aircraft flights since the last decades, and consequently the increase of formation of contrails in the upper-troposphere covering the Earth, it is interesting to analyze the contribution of aviation emissions in the earths radiation budget. The evaluation of the effects of contrails over the climate on Earth is complex [11]. These authors found that cirrus resulting from contrails contribute to a tropospheric warming of 0.2–0.3 C per decade. During the period 1975–1994, the observed trend is 0.27 C per decade. Over the United States and Europe a positive forcing of 0.1–0.2 W·m is estimated, with a 0.5%–2% of the average cover. These authors projected an aircraft scenario for 2050 over Europe of a forcing of 1.5 W·m, and globally coverage of 0.5% and radiative forcing of 0.05 W·m. The authors of [12] analysed the global radiative forcing from contrails, finding that radiative forcing of contrails cirrus is about nine times larger than contrails forming a line–shape alone. For these reason it is interesting to study if a state of the art mesoscale model is able to reproduce the weather conditions that induce the formation of contrails.
The aim of this paper is to analyse the temperature and humidity conditions involved in the episode of 21 September 2011, when the whole sky was covered exclusively by contrails during several hours over the gulf of Lyon. Version 3.3 of the Weather Research and Forecast-Advanced Research WRF (WRF-ARW) model is used for analysing the environmental temperature and humidity over the region of contrails recorded by Meteosat. Previous works [13] used MM5 mesoscale model to study aircraft contrails formation over Alaska. They used the model for obtaining air temperature and humidity at several layers, and apply algorithms to describe the adiabatic mixing of aircraft exhaust with the environment. Some bias was observed in humidity at low layers in comparing with data provided by radiosondes. In [14], the authors investigated the impact of contrails and contrails induced cirrus clouds on regional energy and water cycles over the western United States. They used WRF model with 18 km of horizontal resolution introducing an improved formulation to parameterize optical properties of ice clouds and contrails.
2. Methodology
2.1. Observations
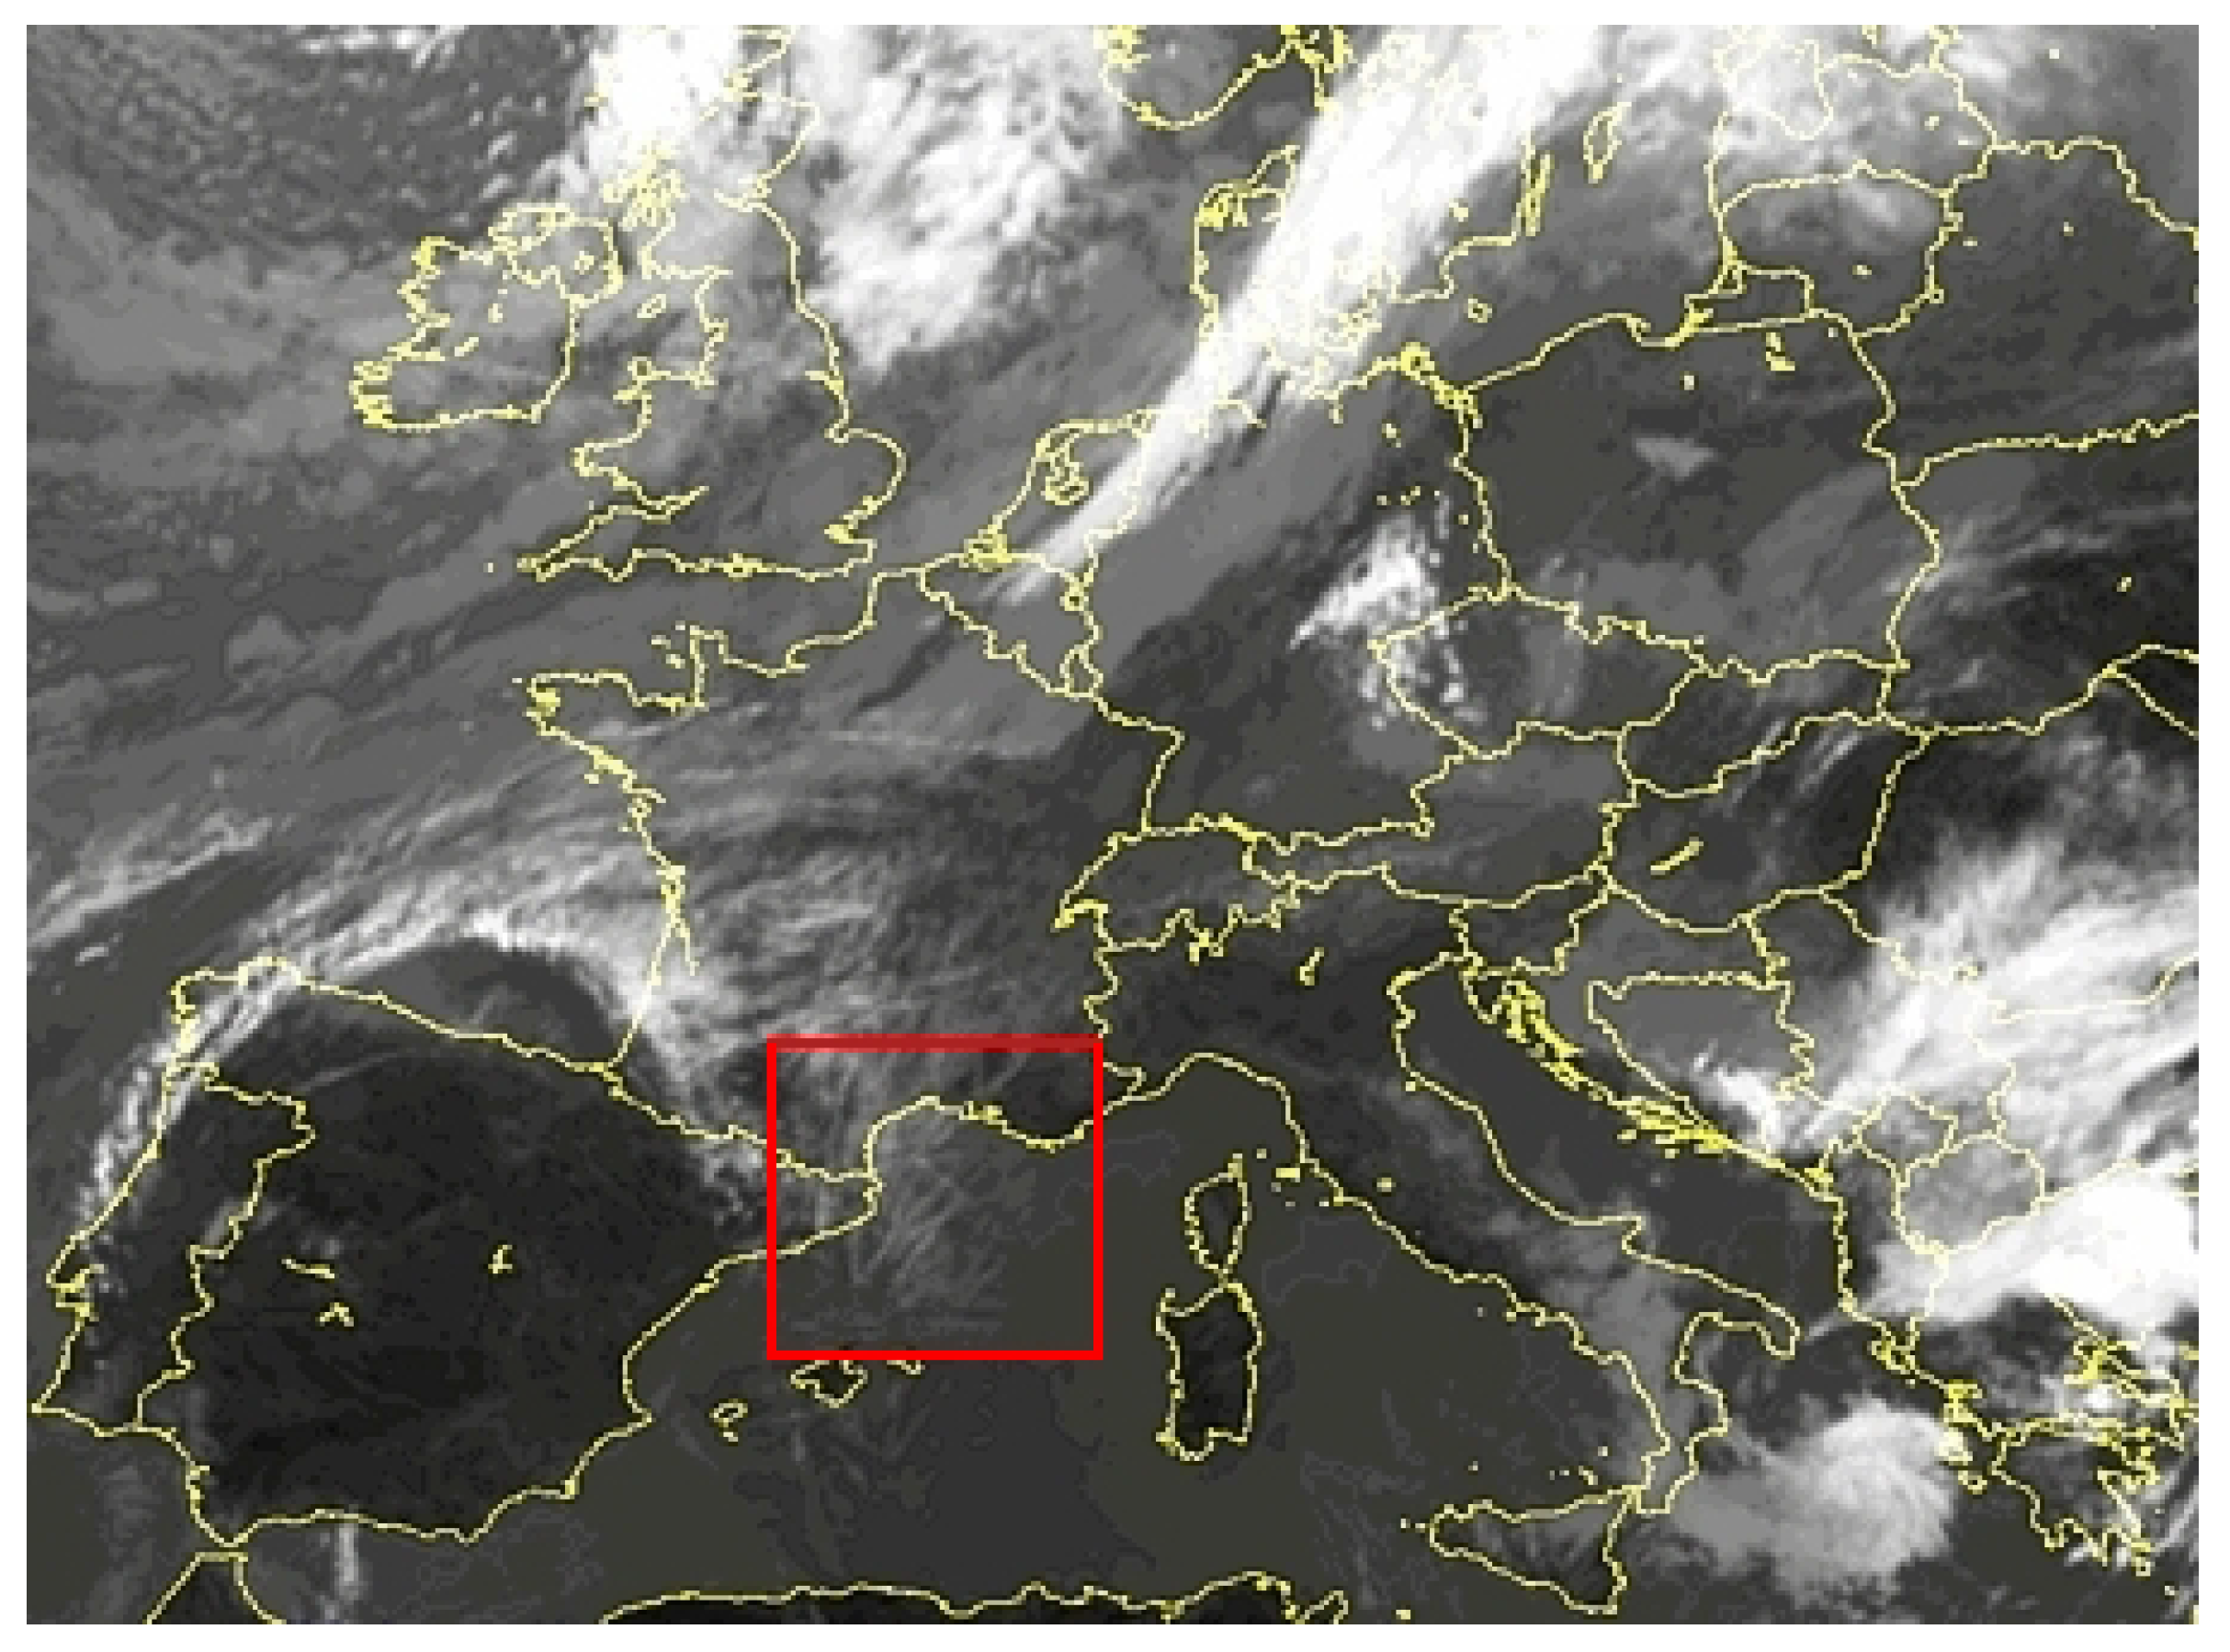
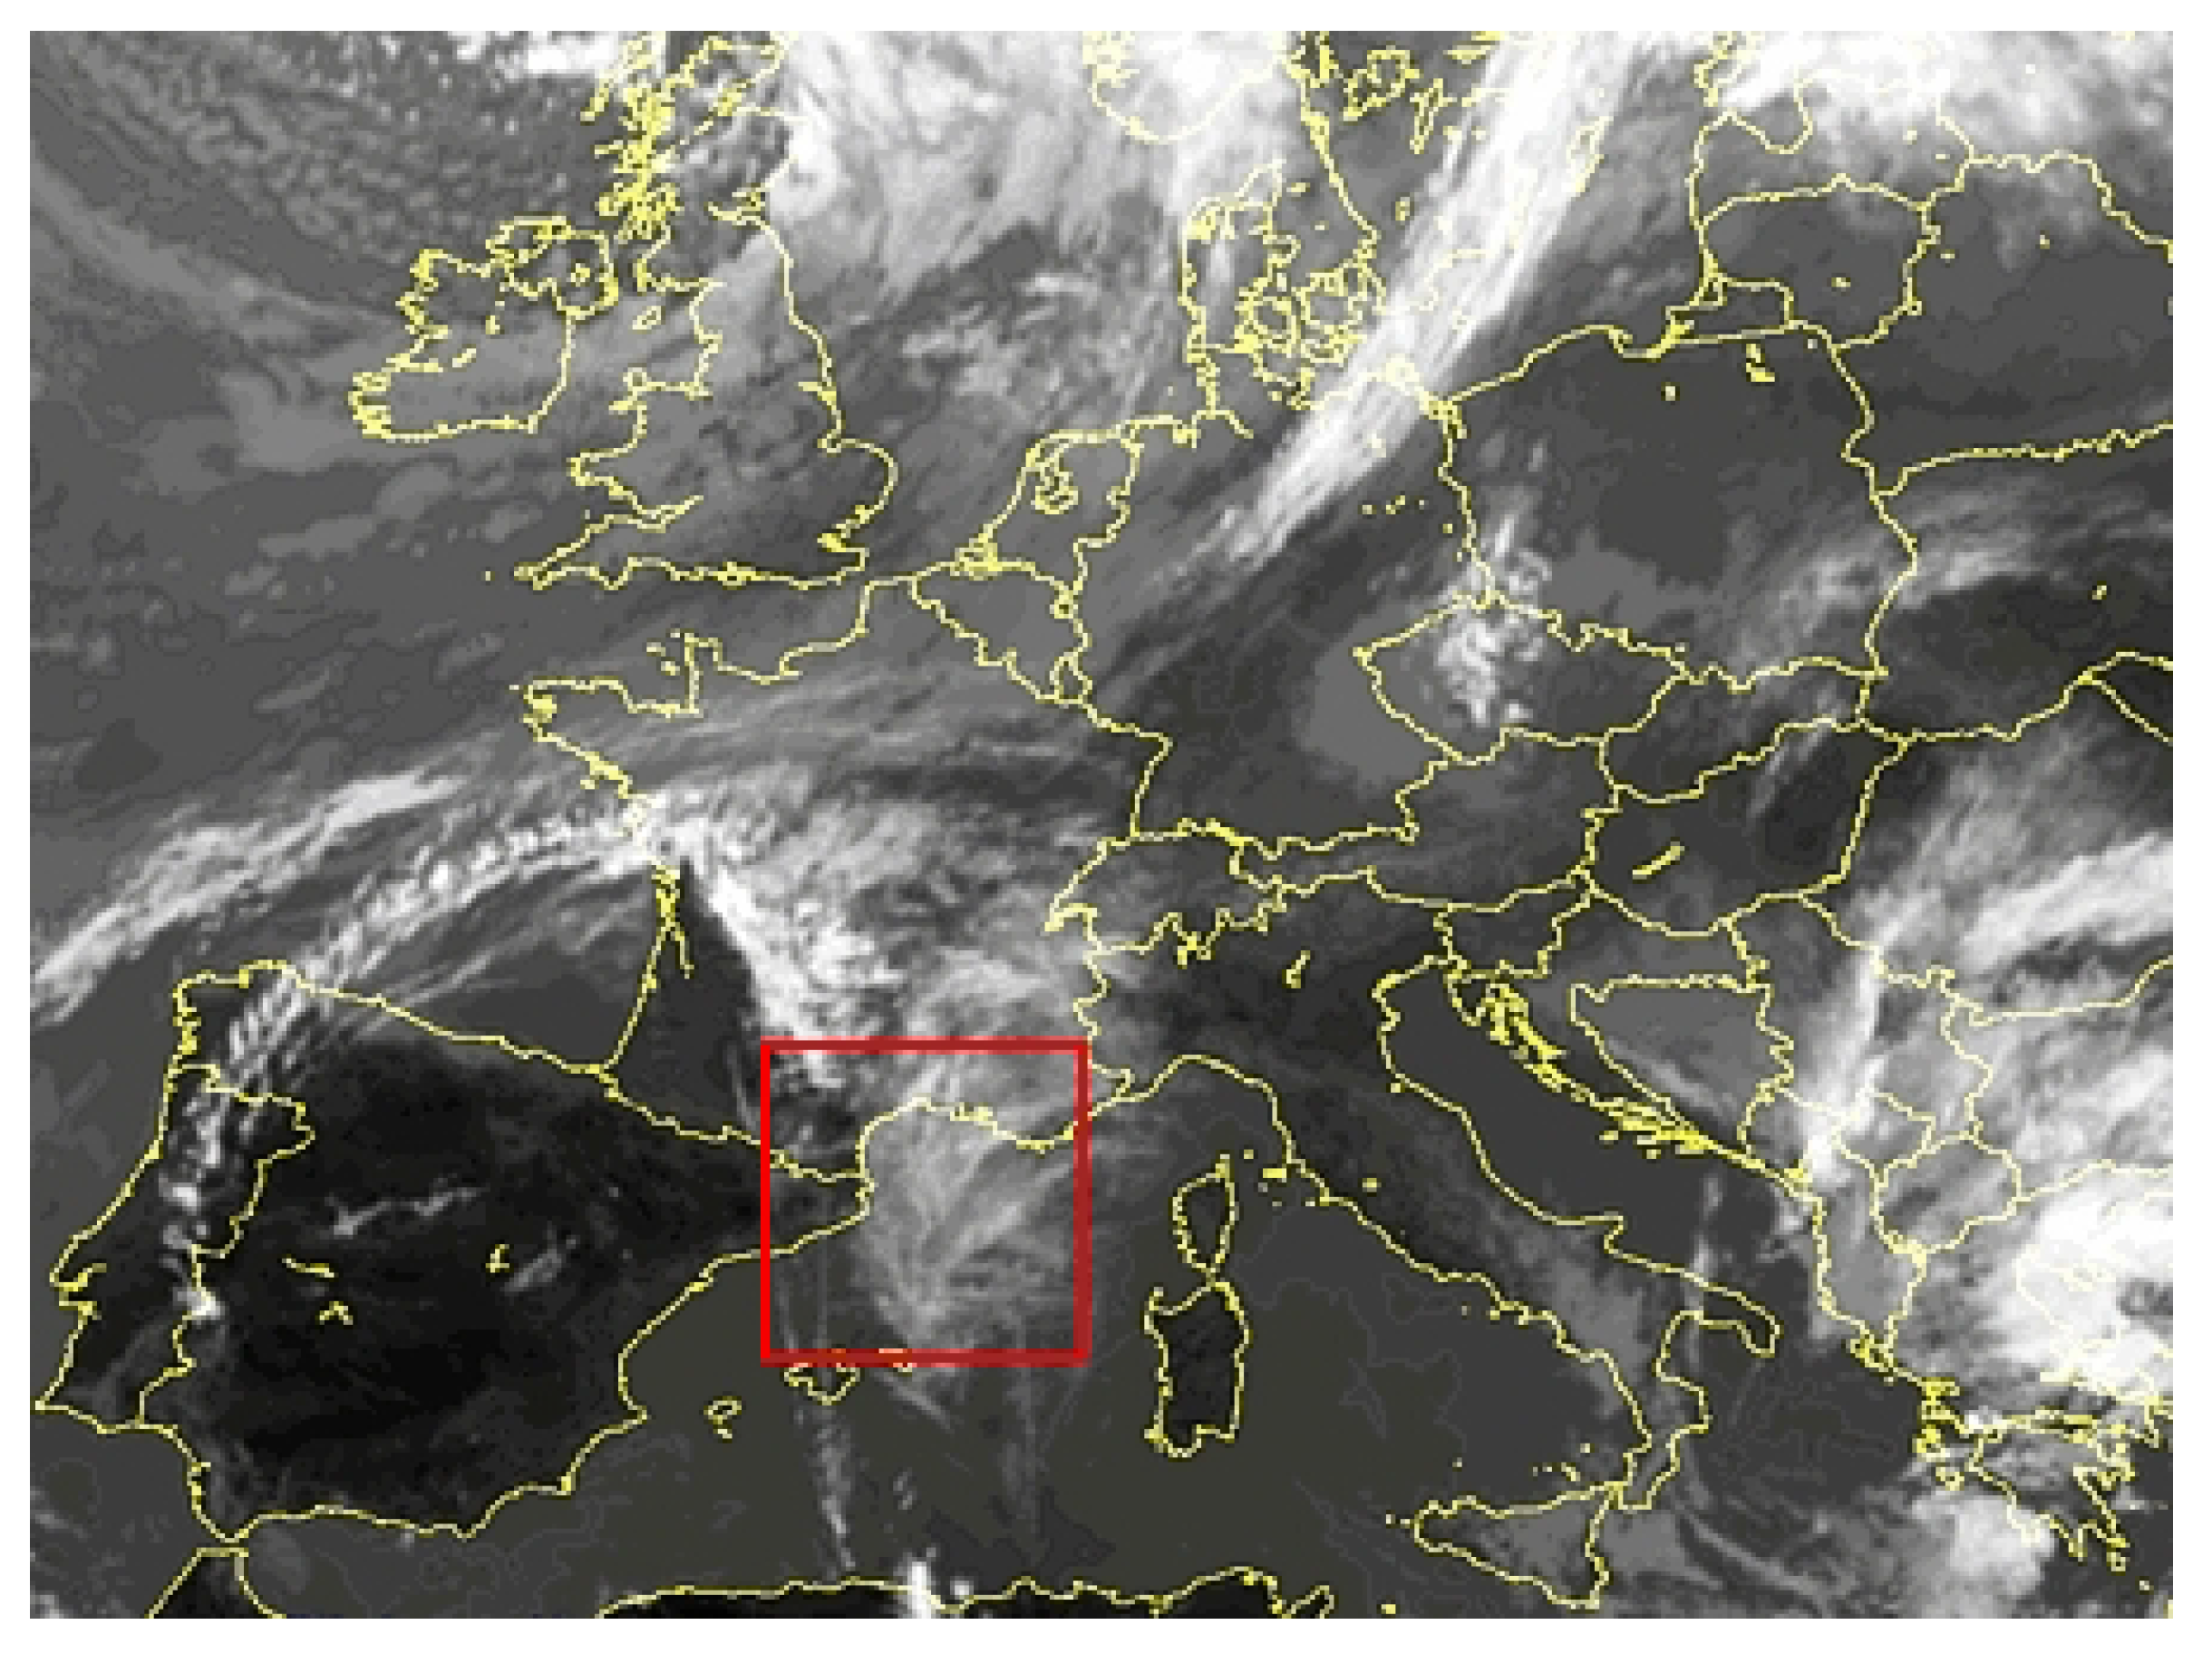
An episode of contrails spreading and covering the entire sky for several hours (approximately from 09:00 to 17:00 UTC) was observed over the Northeast of the Iberian Peninsula and the Gulf of Lyon on 21 September 2011. Figure 1 shows the image recorded by the IR channel of the Meteosat at 11:00 and 14:00 UTC. The black dashed square indicates the area in which these contrails can be observed.
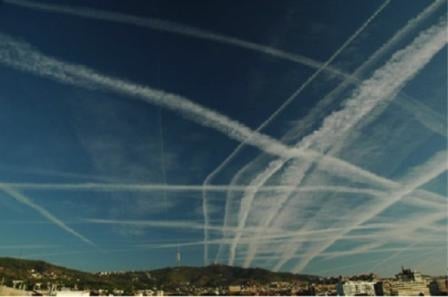
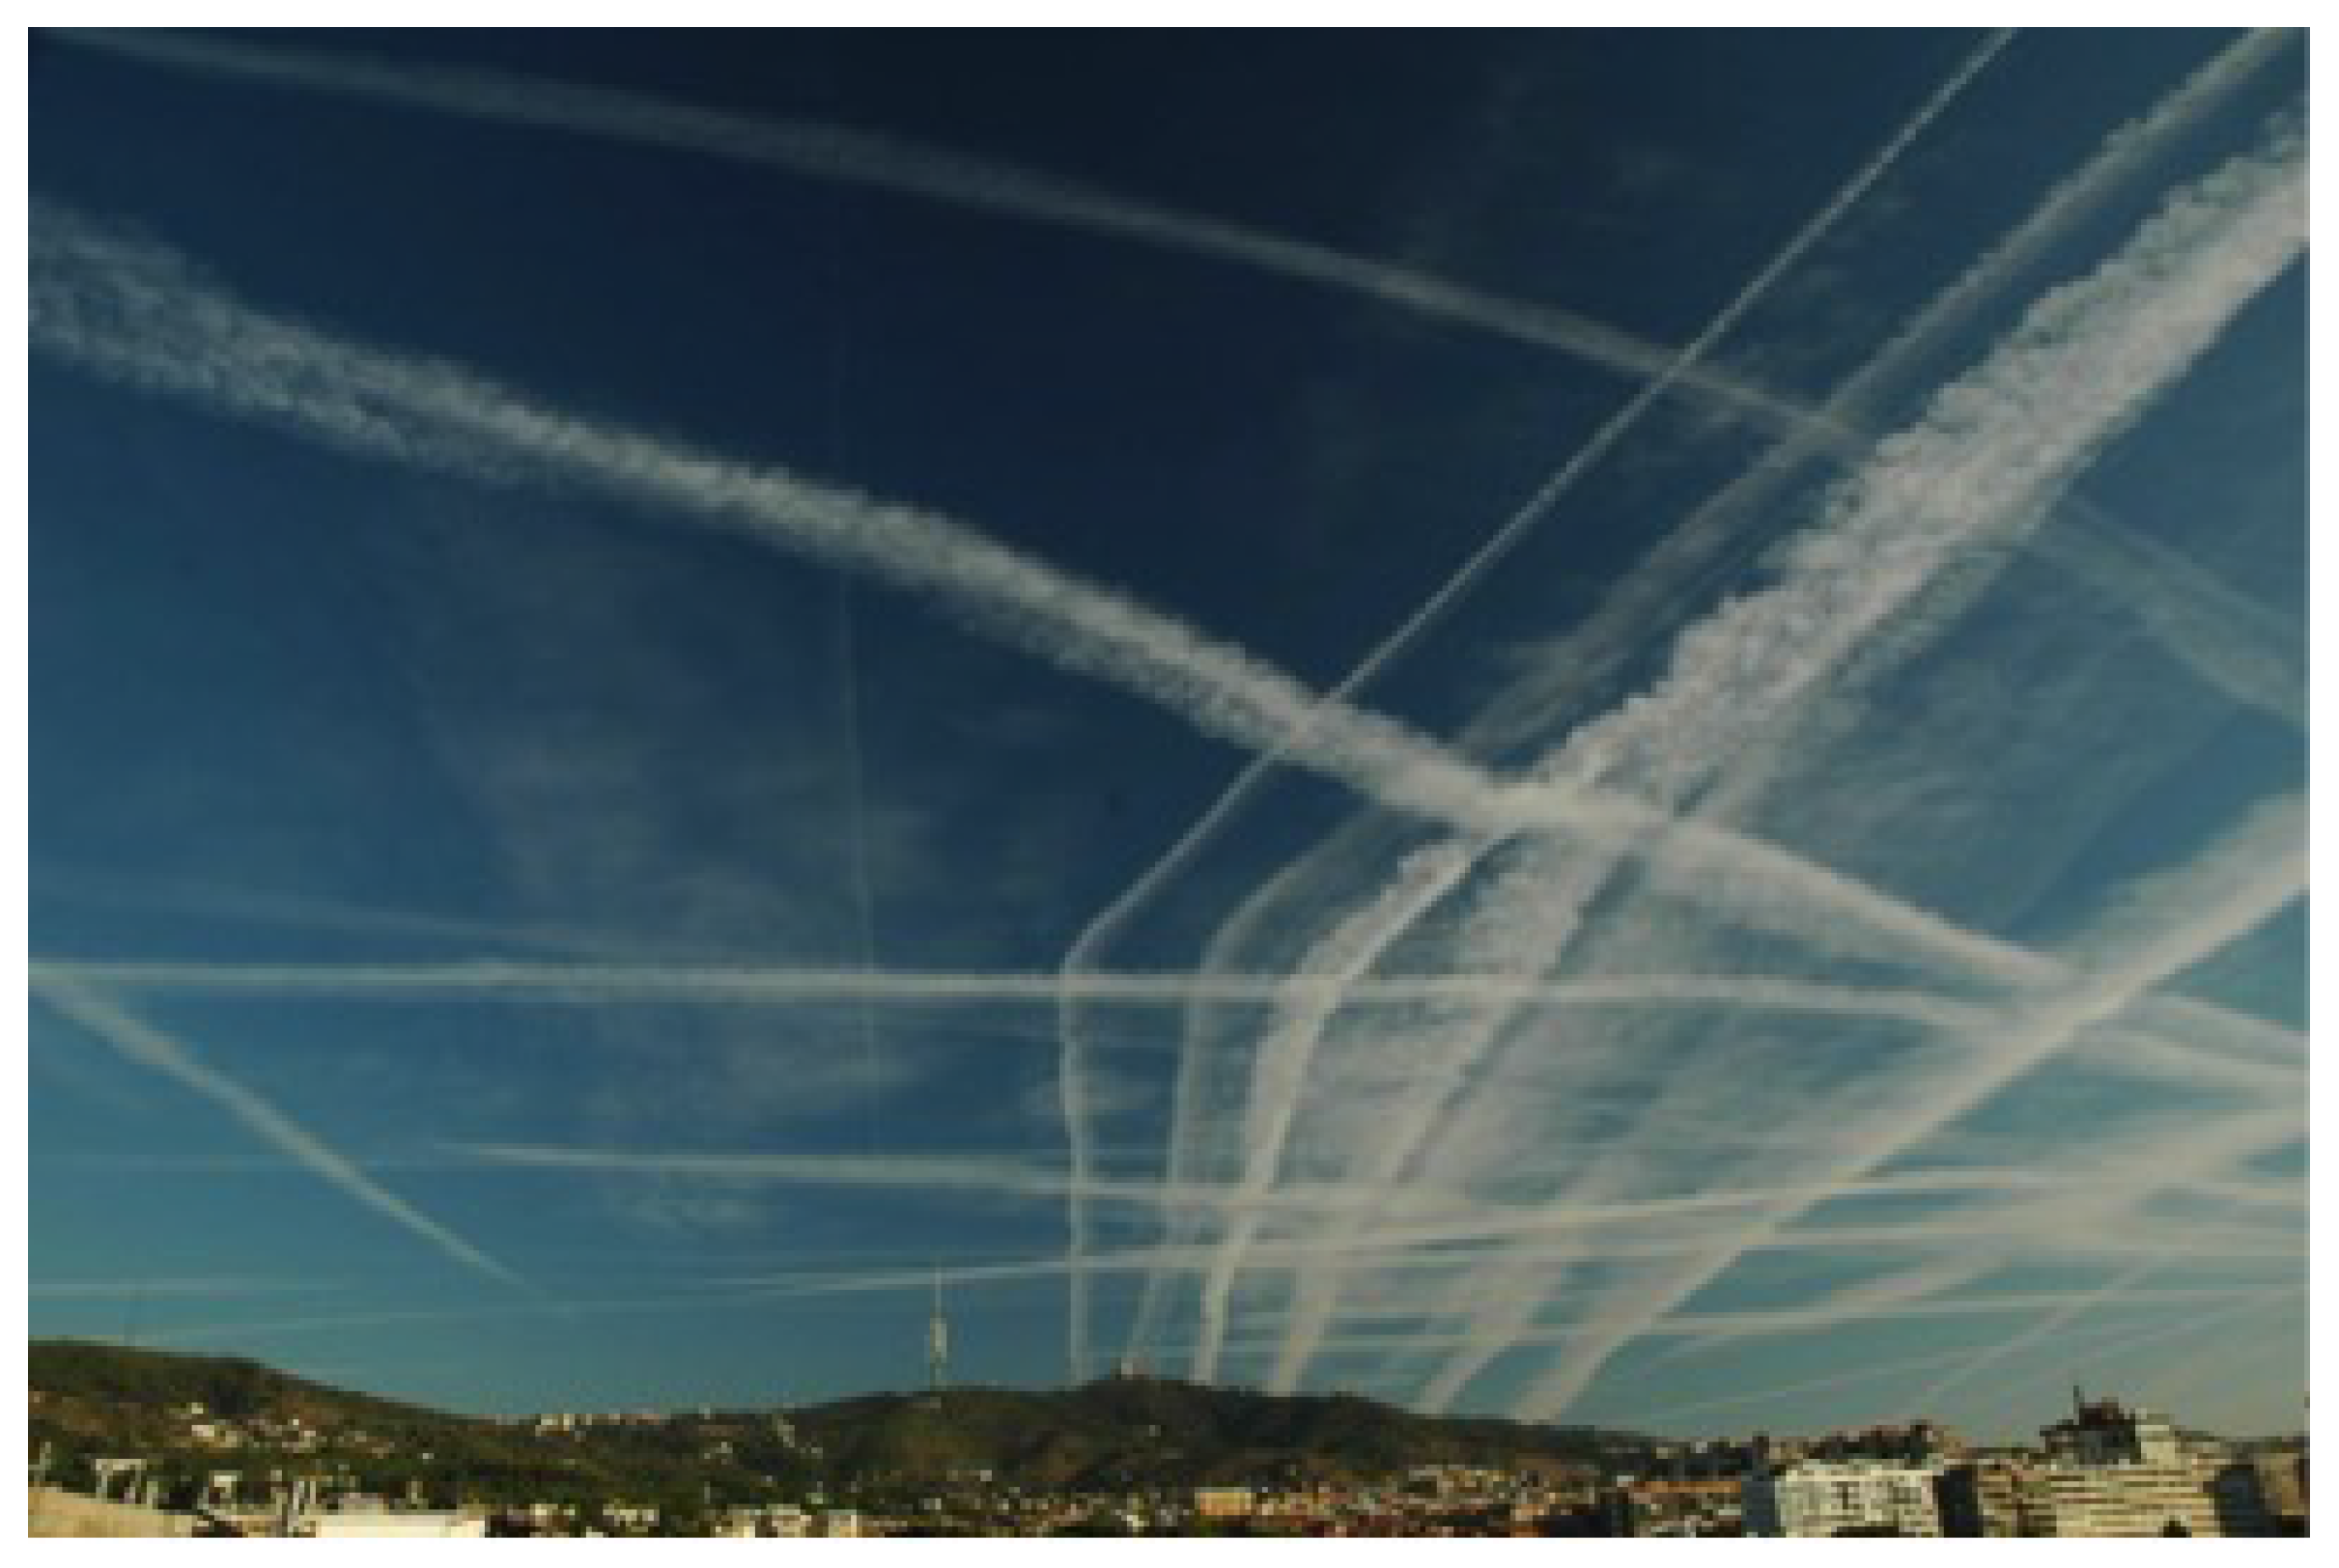
These contrails were also observed from the ground at different places. Figure 2 shows the sky over Barcelona on 21 September 2011 at 11:00 UTC, where contrails can be clearly observed.
2.2. Synoptic Conditions
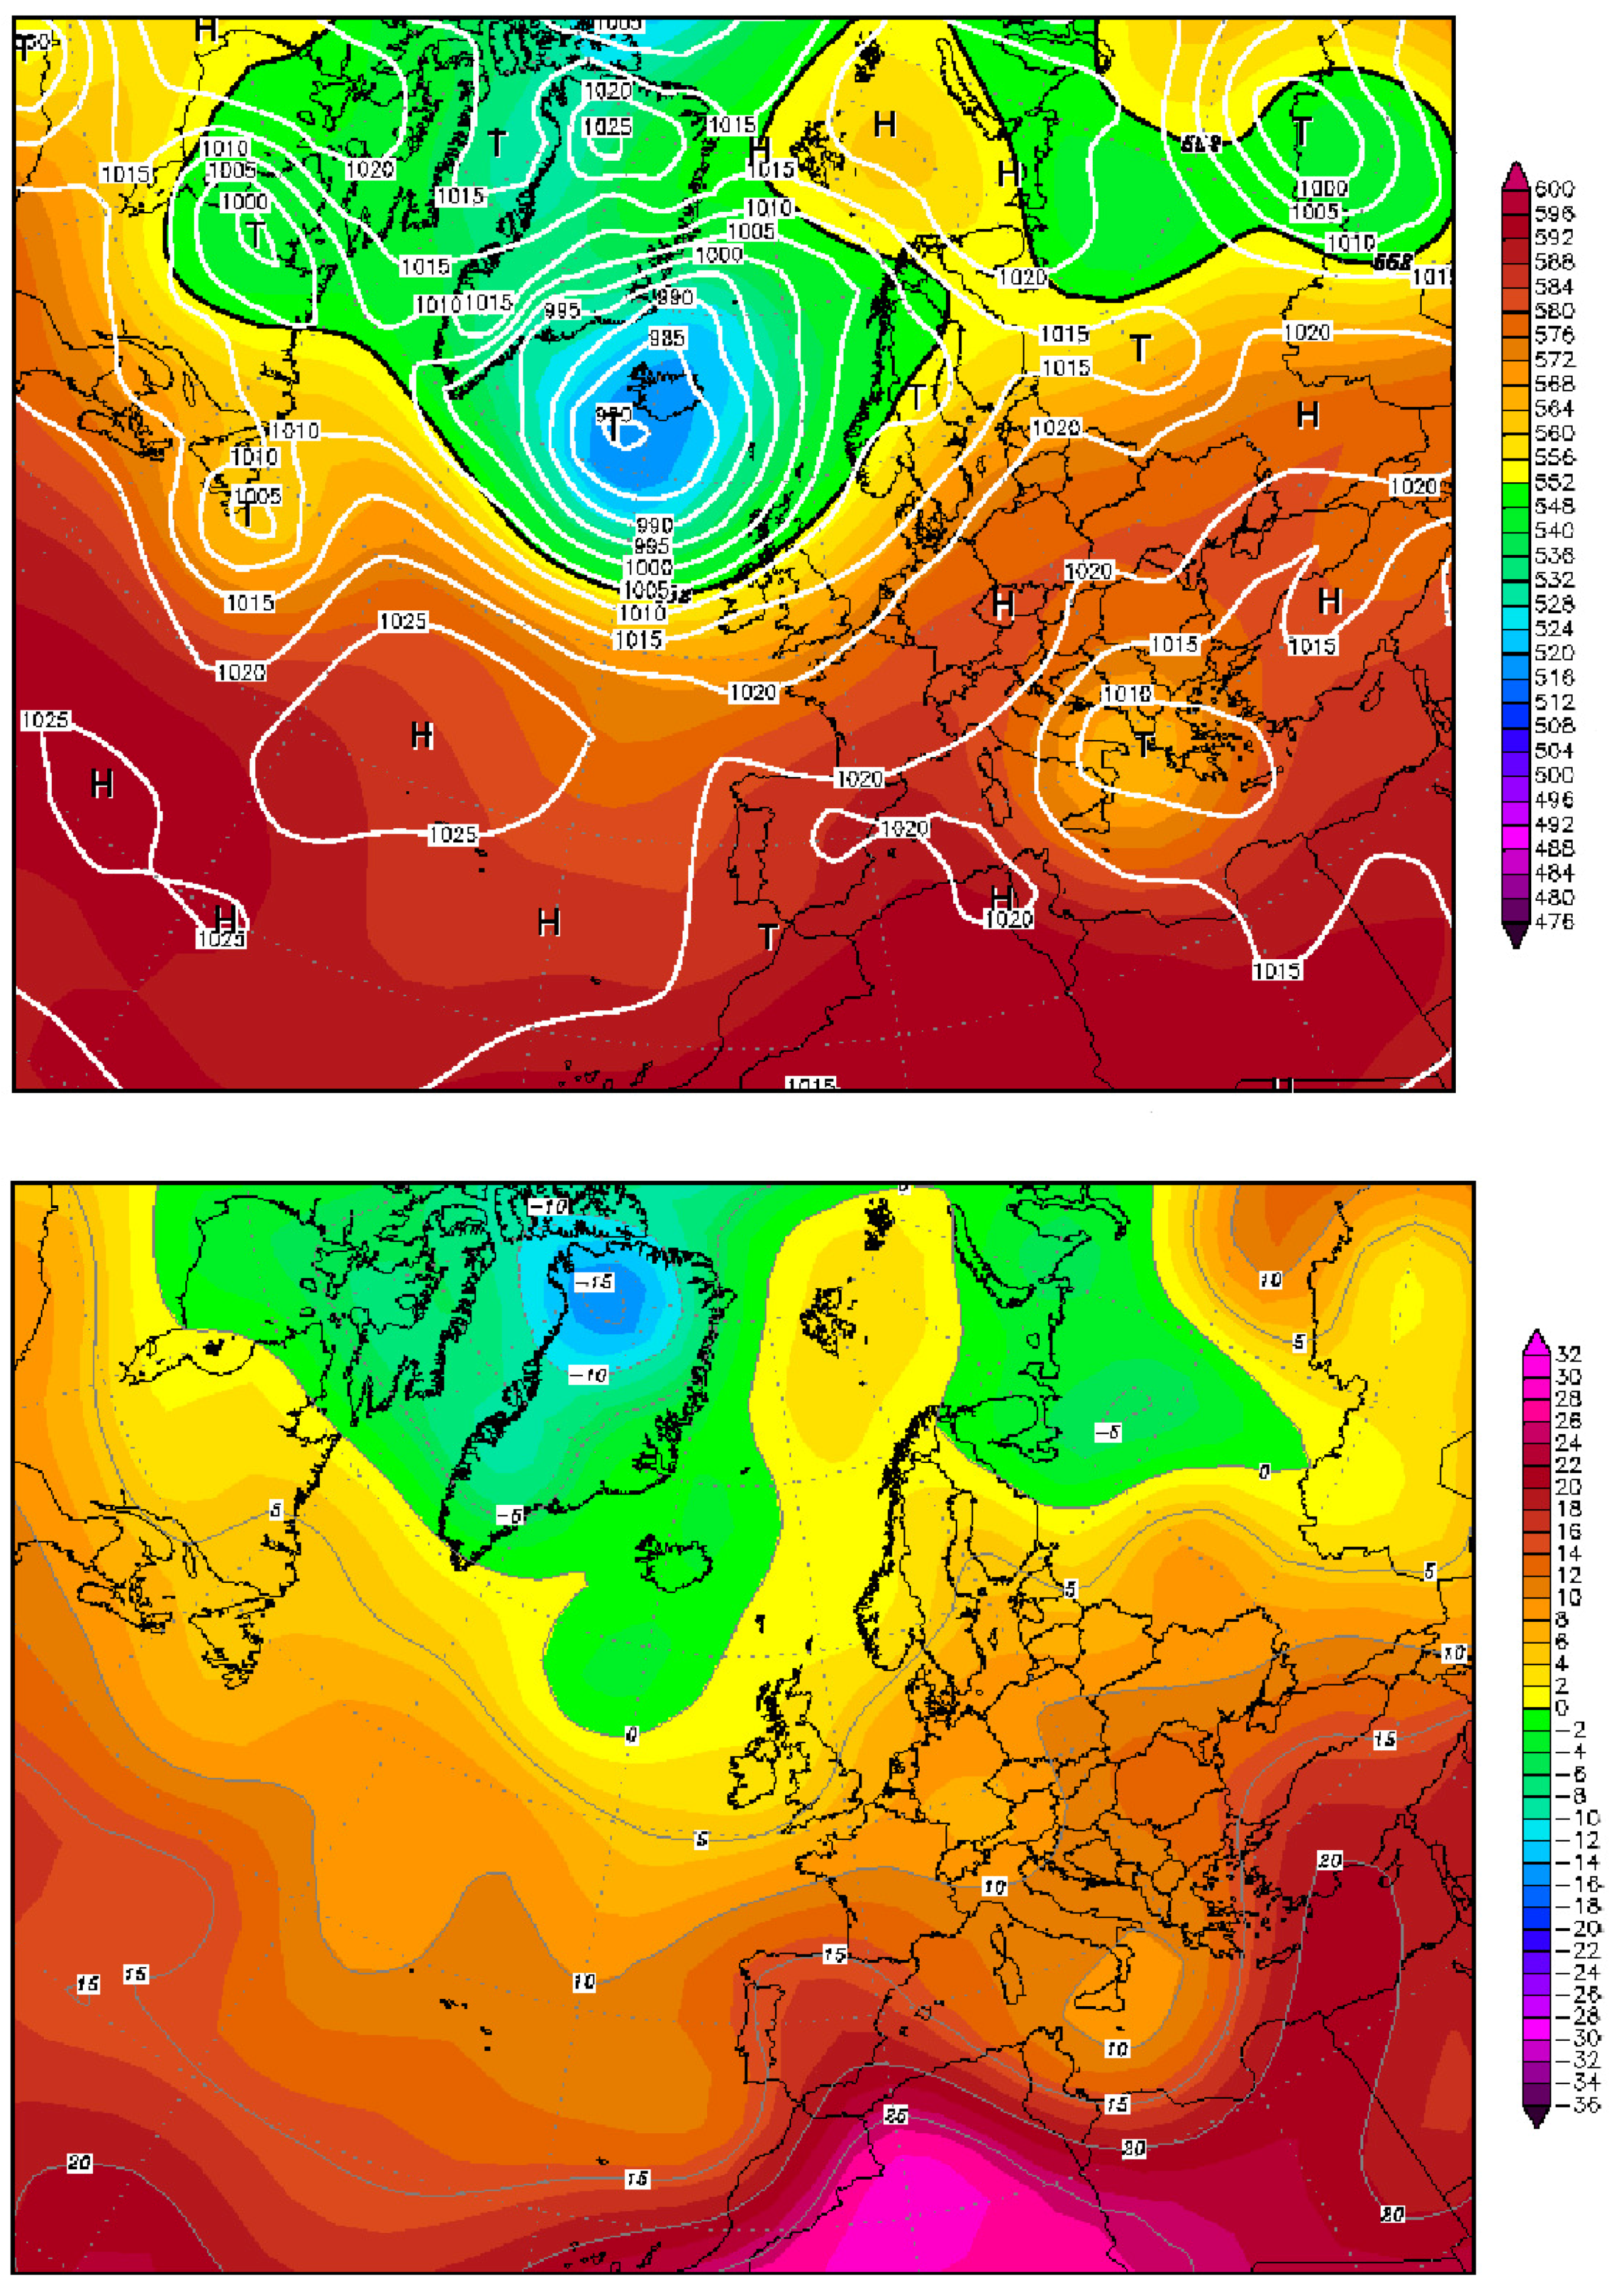
The synoptic situation at 500 hPa and 850 hPa at 00:00 UTC on 21 September 2011 is shown in Figure 3. At 500 hPa (Figure 3, upper panel), a weak warm ridge from North Africa affected the whole western Mediterranean basin, including the Gulf of Lyon, where contrails cirrus formed. This warm ridge is observed also at 850 hPa (Figure 3, lower panel), having temperature between 10 and 15 C over the Gulf of Lyon. At sea level, a low pressure was located over the Ionian Sea, in the Southeast of Italy, with 1010 hPa, and a high pressure over Germany, with 1020 hPa (Figure 3, upper panel). Between them, a northeast flow occurred over the area of the Gulf of Lyon.
2.3. WRF Set-Up
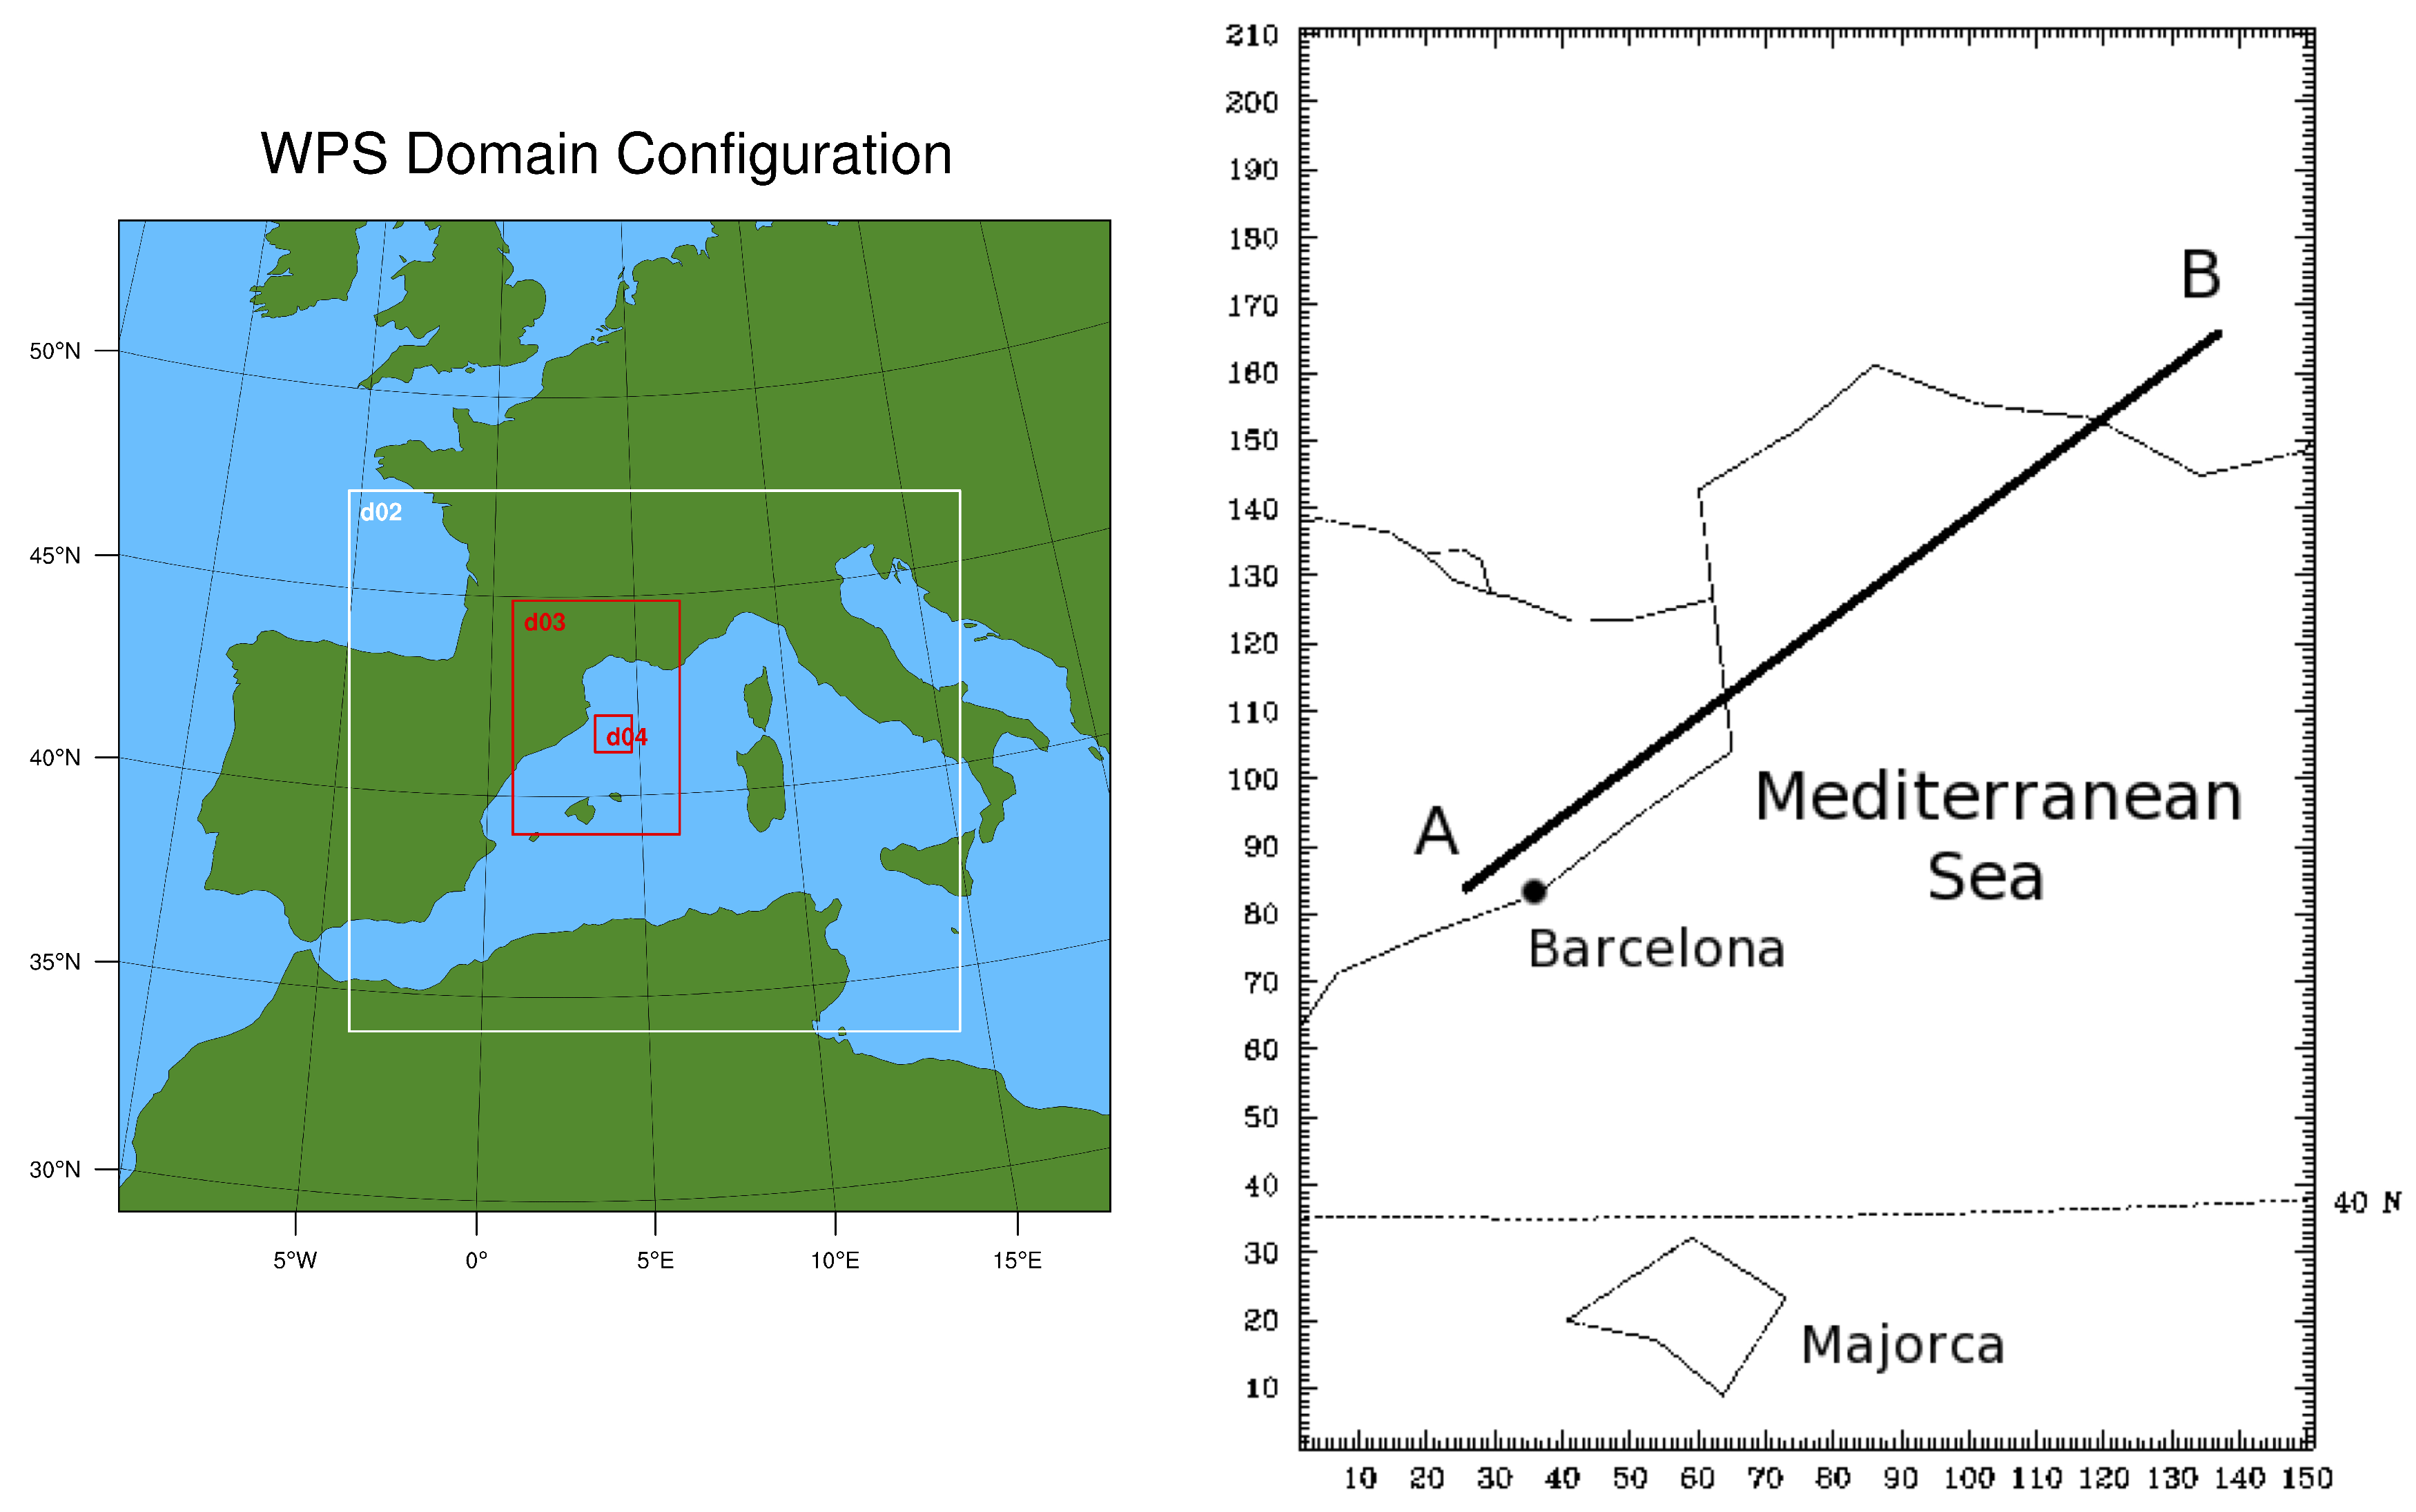
In order to analyze the atmospheric conditions during the episode of high density of contrails, version 3.3 of the Advanced Research WRF–ARW model [15] is used to obtain the vertical profiles of temperature and humidity in the area where the satellite image shows a large density of contrails. WRF model is a compressible non-hydrostatic finite differences model. In the simulation, four nested domains (see Figure 4) are defined, with 27, 9, 3 and 1 km of horizontal resolution. In the vertical direction 42η—vertical levels have been defined. The smaller domain is centered over the sea in front of the northeast of the Iberian Peninsula, and covers 100 × 100 km. The schemes used are as follows. For the PBL parameterisation, MRF scheme is used [16], RRTM scheme for longwave radiation [17], MM5 shortwave scheme for shortwave radiation [18] and WSM scheme for the microphysics parameterisation [19]. No cumulus parameterisation is used for the smallest domain because the horizontal resolution is lower than 3 km. The initial and boundary conditions were updated every 6 hours with information obtained from the operational ECMWF model.
3. Results
Comertial panes, during the cruising phase, use to fly around FL 300 (30.000 ft, approximately 9.100 m), but this height depends on weather conditions and type of aircraft. In addition, Lamquin, N. et al. [20] identified the altitude 8.500–9.500 m as a layer favourable for contrail’s formation. Particularly over the studied region, Keckhut, P. et al. [21] observed frequently thin cirrus over South France that can be associated with the air traffic over this area. Thus, we focus our analysis in a layer around 9.500 m height.
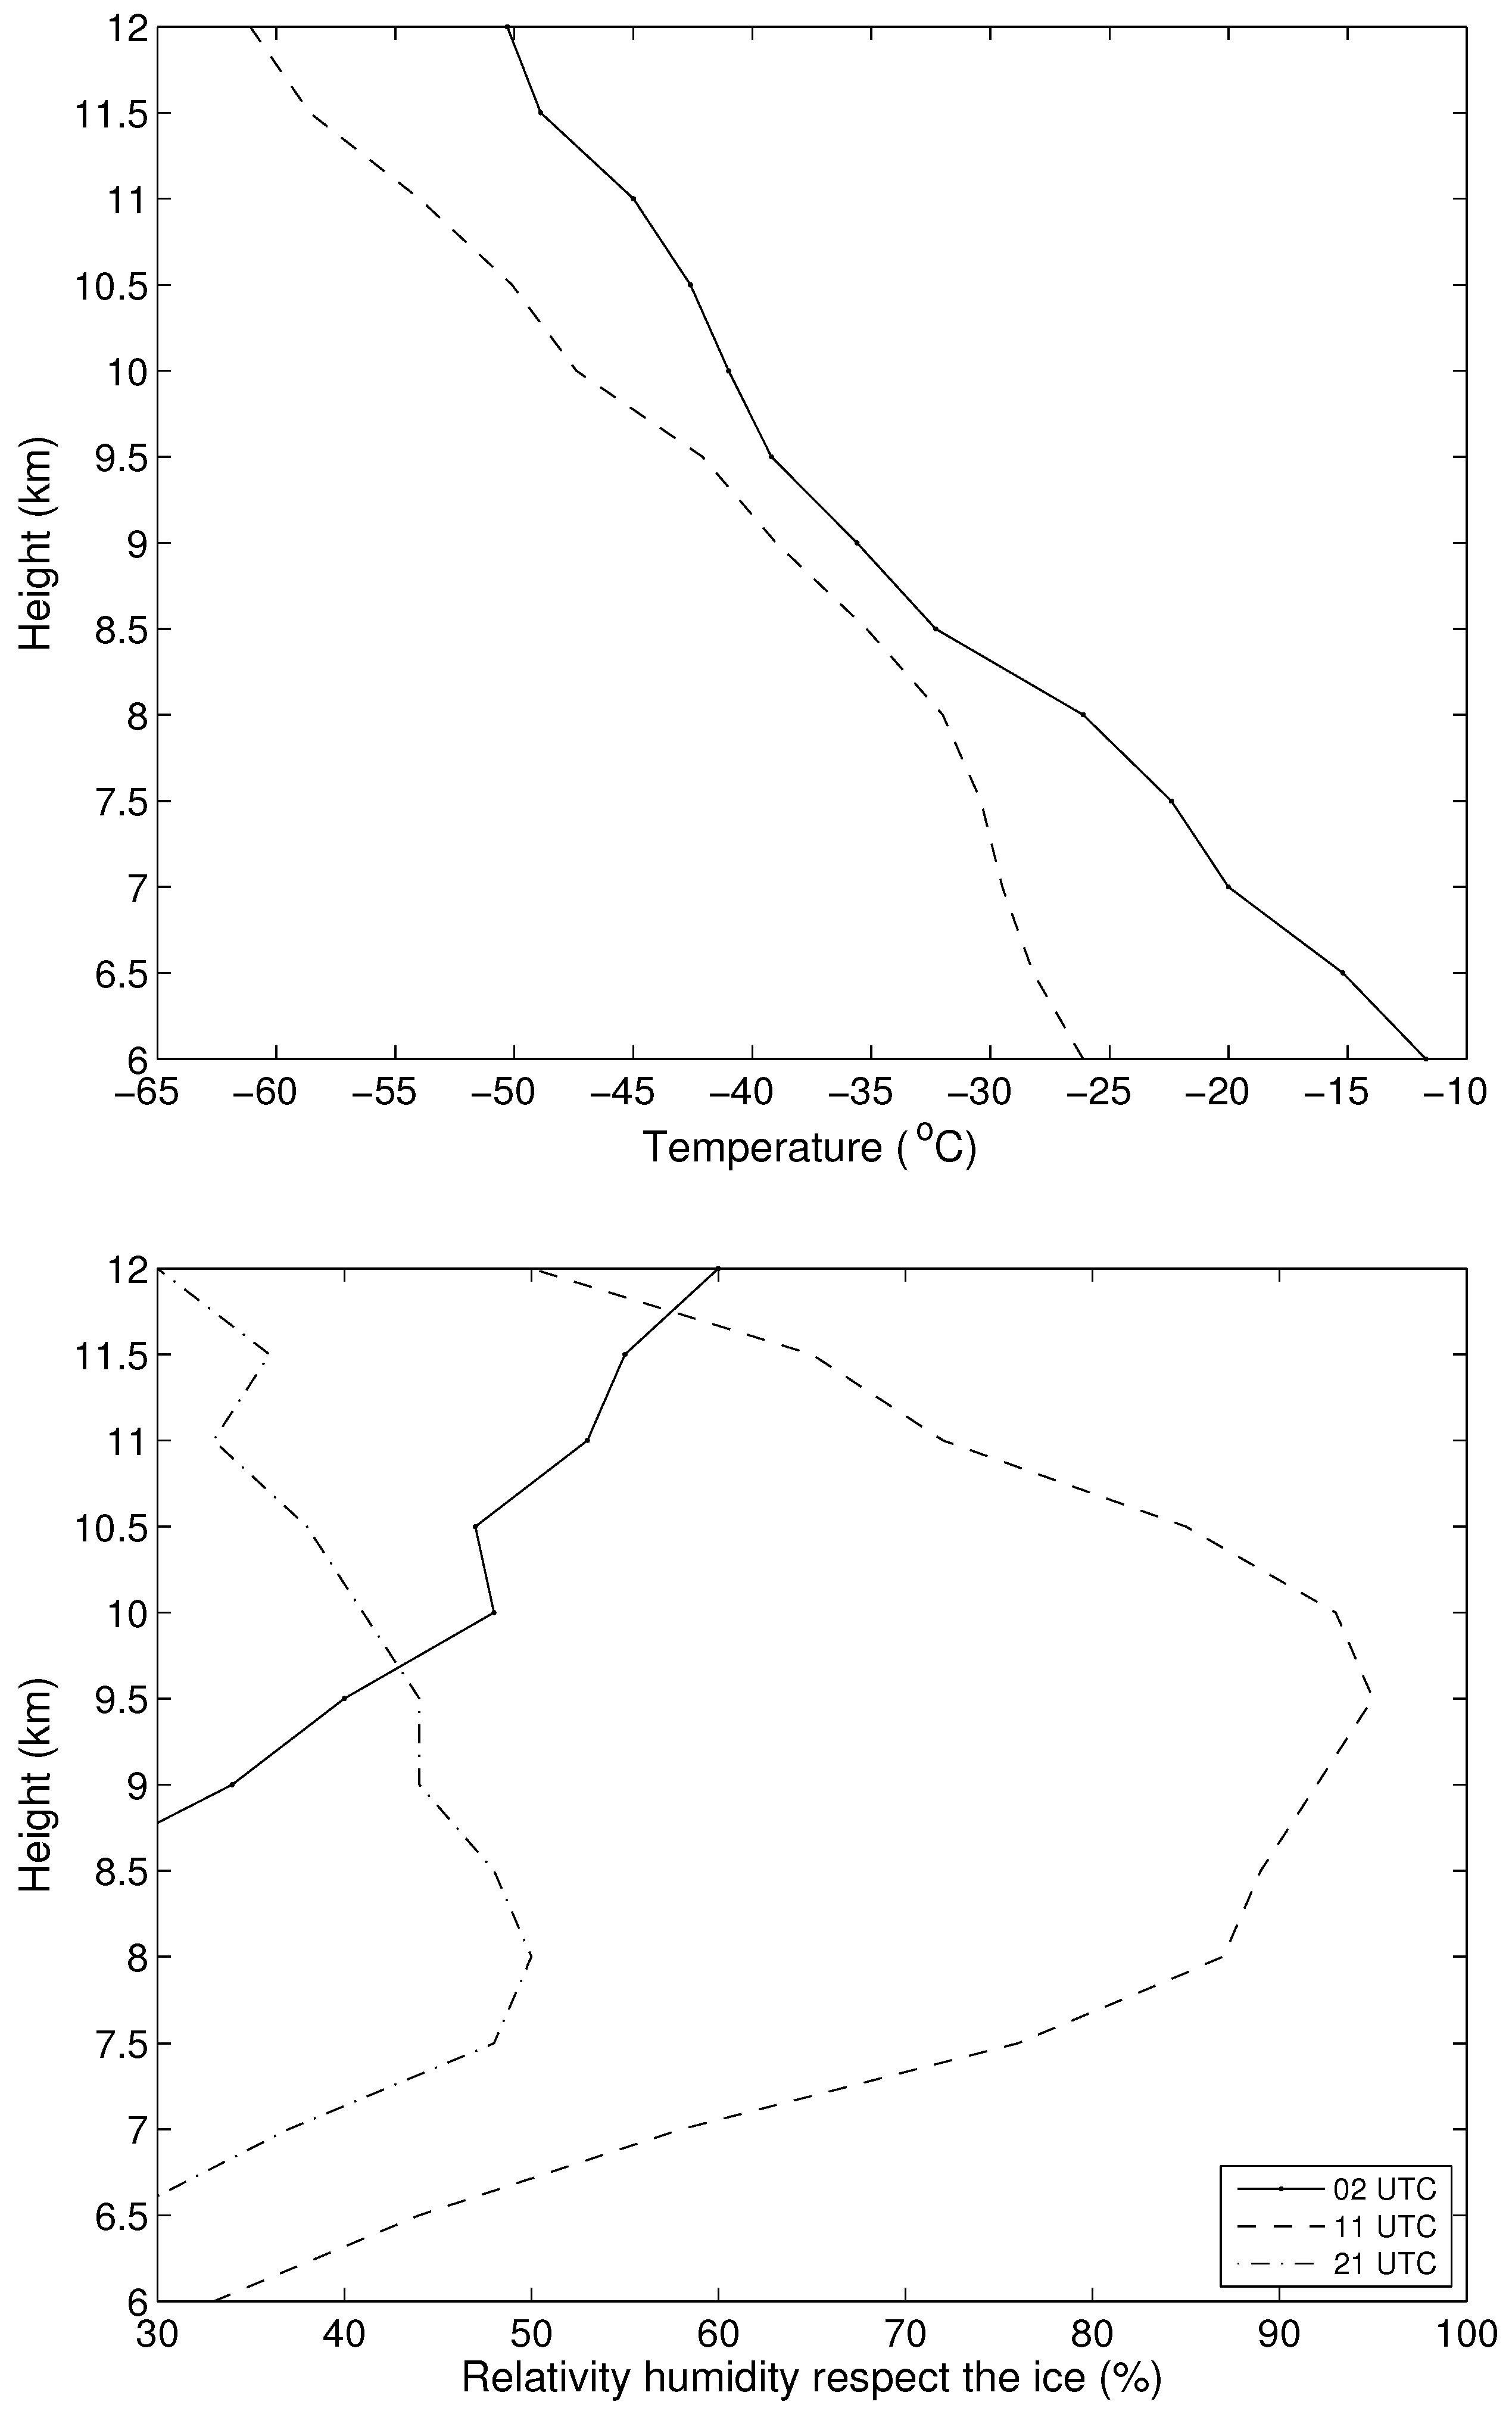
Figure 5 shows (upper panel) the temperature and the dew point temperature in the layer 6.000–12.000 m at the central point of domain 4. According to the simulation between 8.500 and 9.500 m, the difference between the air temperature and the dew point temperature is small, around 3–4 C. Below and above this layer this thermal difference increases. Consequently, an increase of water vapor due to an aircraft turbine exhaust within this layer may produce deposition of the air and cloud can form. The maximum RHI (lower panel in Figure 5) is also simulated near this thin layer at 02:00, 11:00 and 21:00 UTC. Between 9.000 and 10.000 m RHI is higher than 90% at 11:00 UTC. Around 9.500 m, maximum values of RHI higher than 90% are simulated. Above and below this layer the simulated RHI decreases. Vertical profiles of RHI at 02:00 and 21:00 UTC show dry environmental conditions, which induces contrails dissipation.
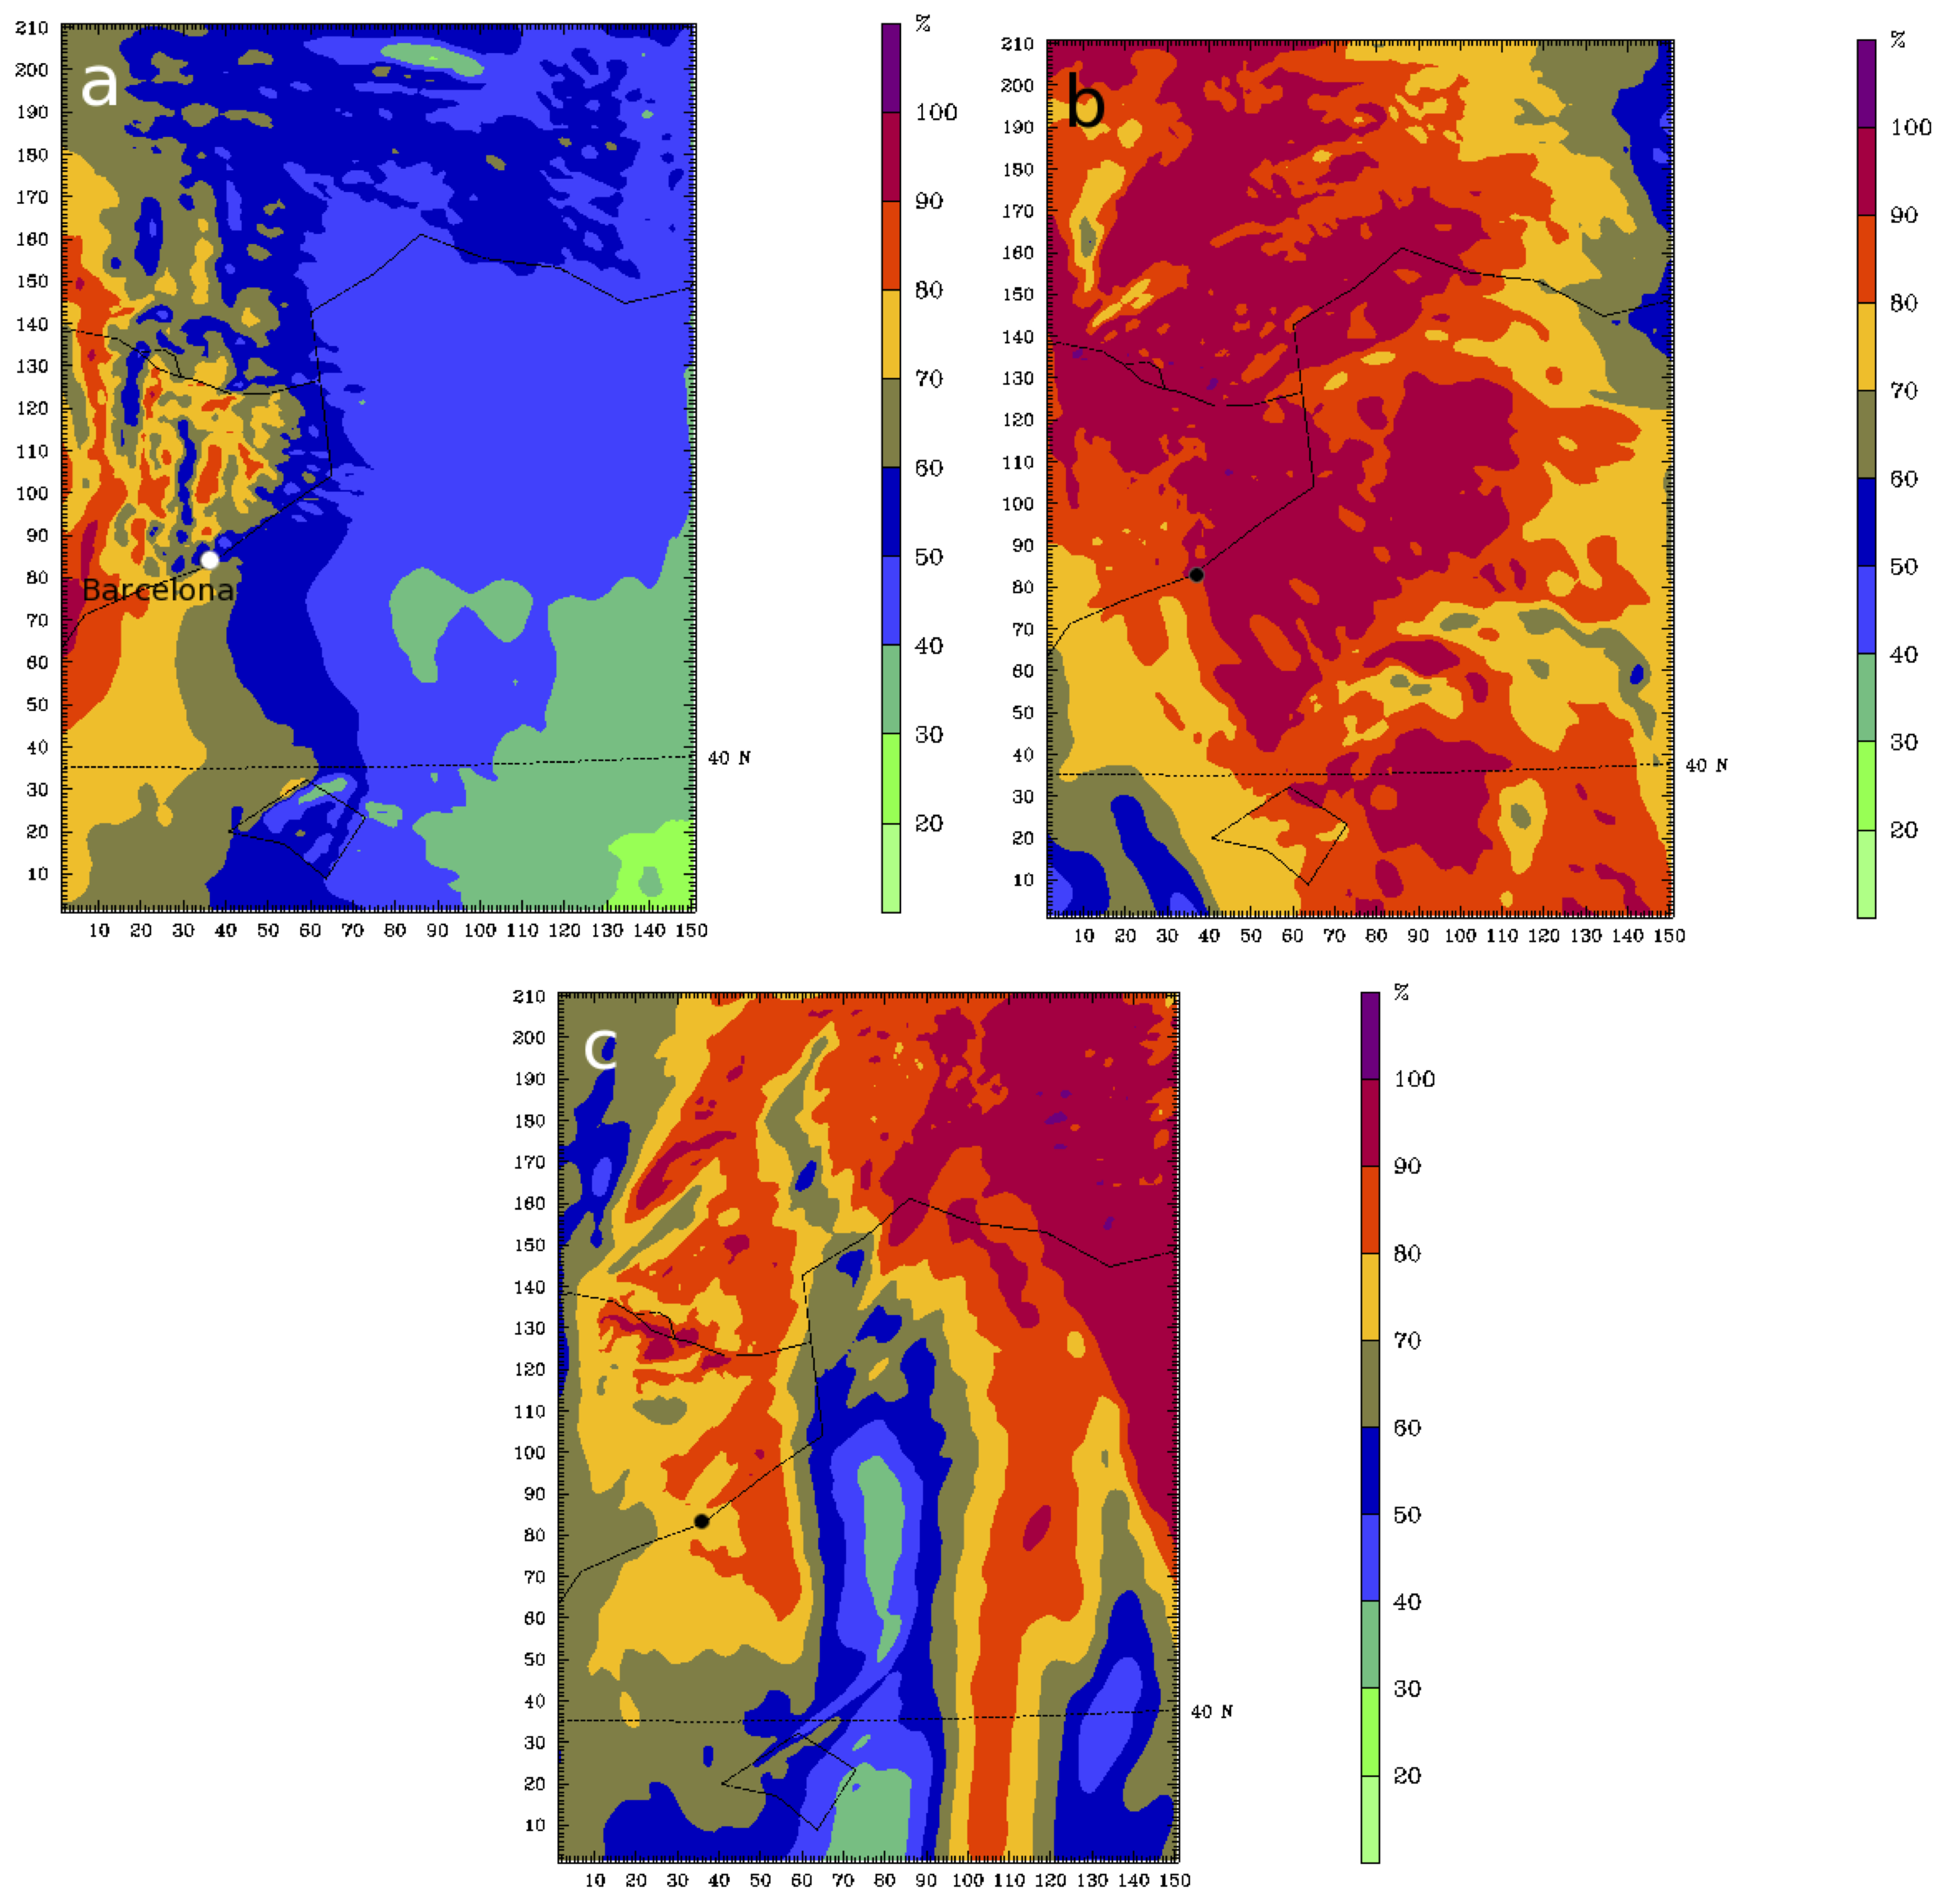
According to the vertical profiles shown in Figure 5, it seems that optimal values of temperature and humidity for contrail formation exist around 9.500 m. Figure 6 shows the horizontal cross sections of RHI at 9.500 m in domain 3, at 02:00, 11:00 and 21:00 UTC. The temperature at this height remained quite constant, around −45 C during this period (not shown). At 02:00 UTC dry conditions are simulated at this height, with values around 40%–50% over the gulf of Lyon. At 11:00 UTC, ground observers and satellite (Figure 1 and Figure 2) recorded contrails extending over the gulf of Lyon. According to the simulation, Figure 6b shows values of RHI higher than 90% are observed at 9.500 m covering a large area over the gulf of Lyon. At 21:00 UTC, RHI decreases over this area. Only an area with values of RHI lower than 30% exists over the Gulf.
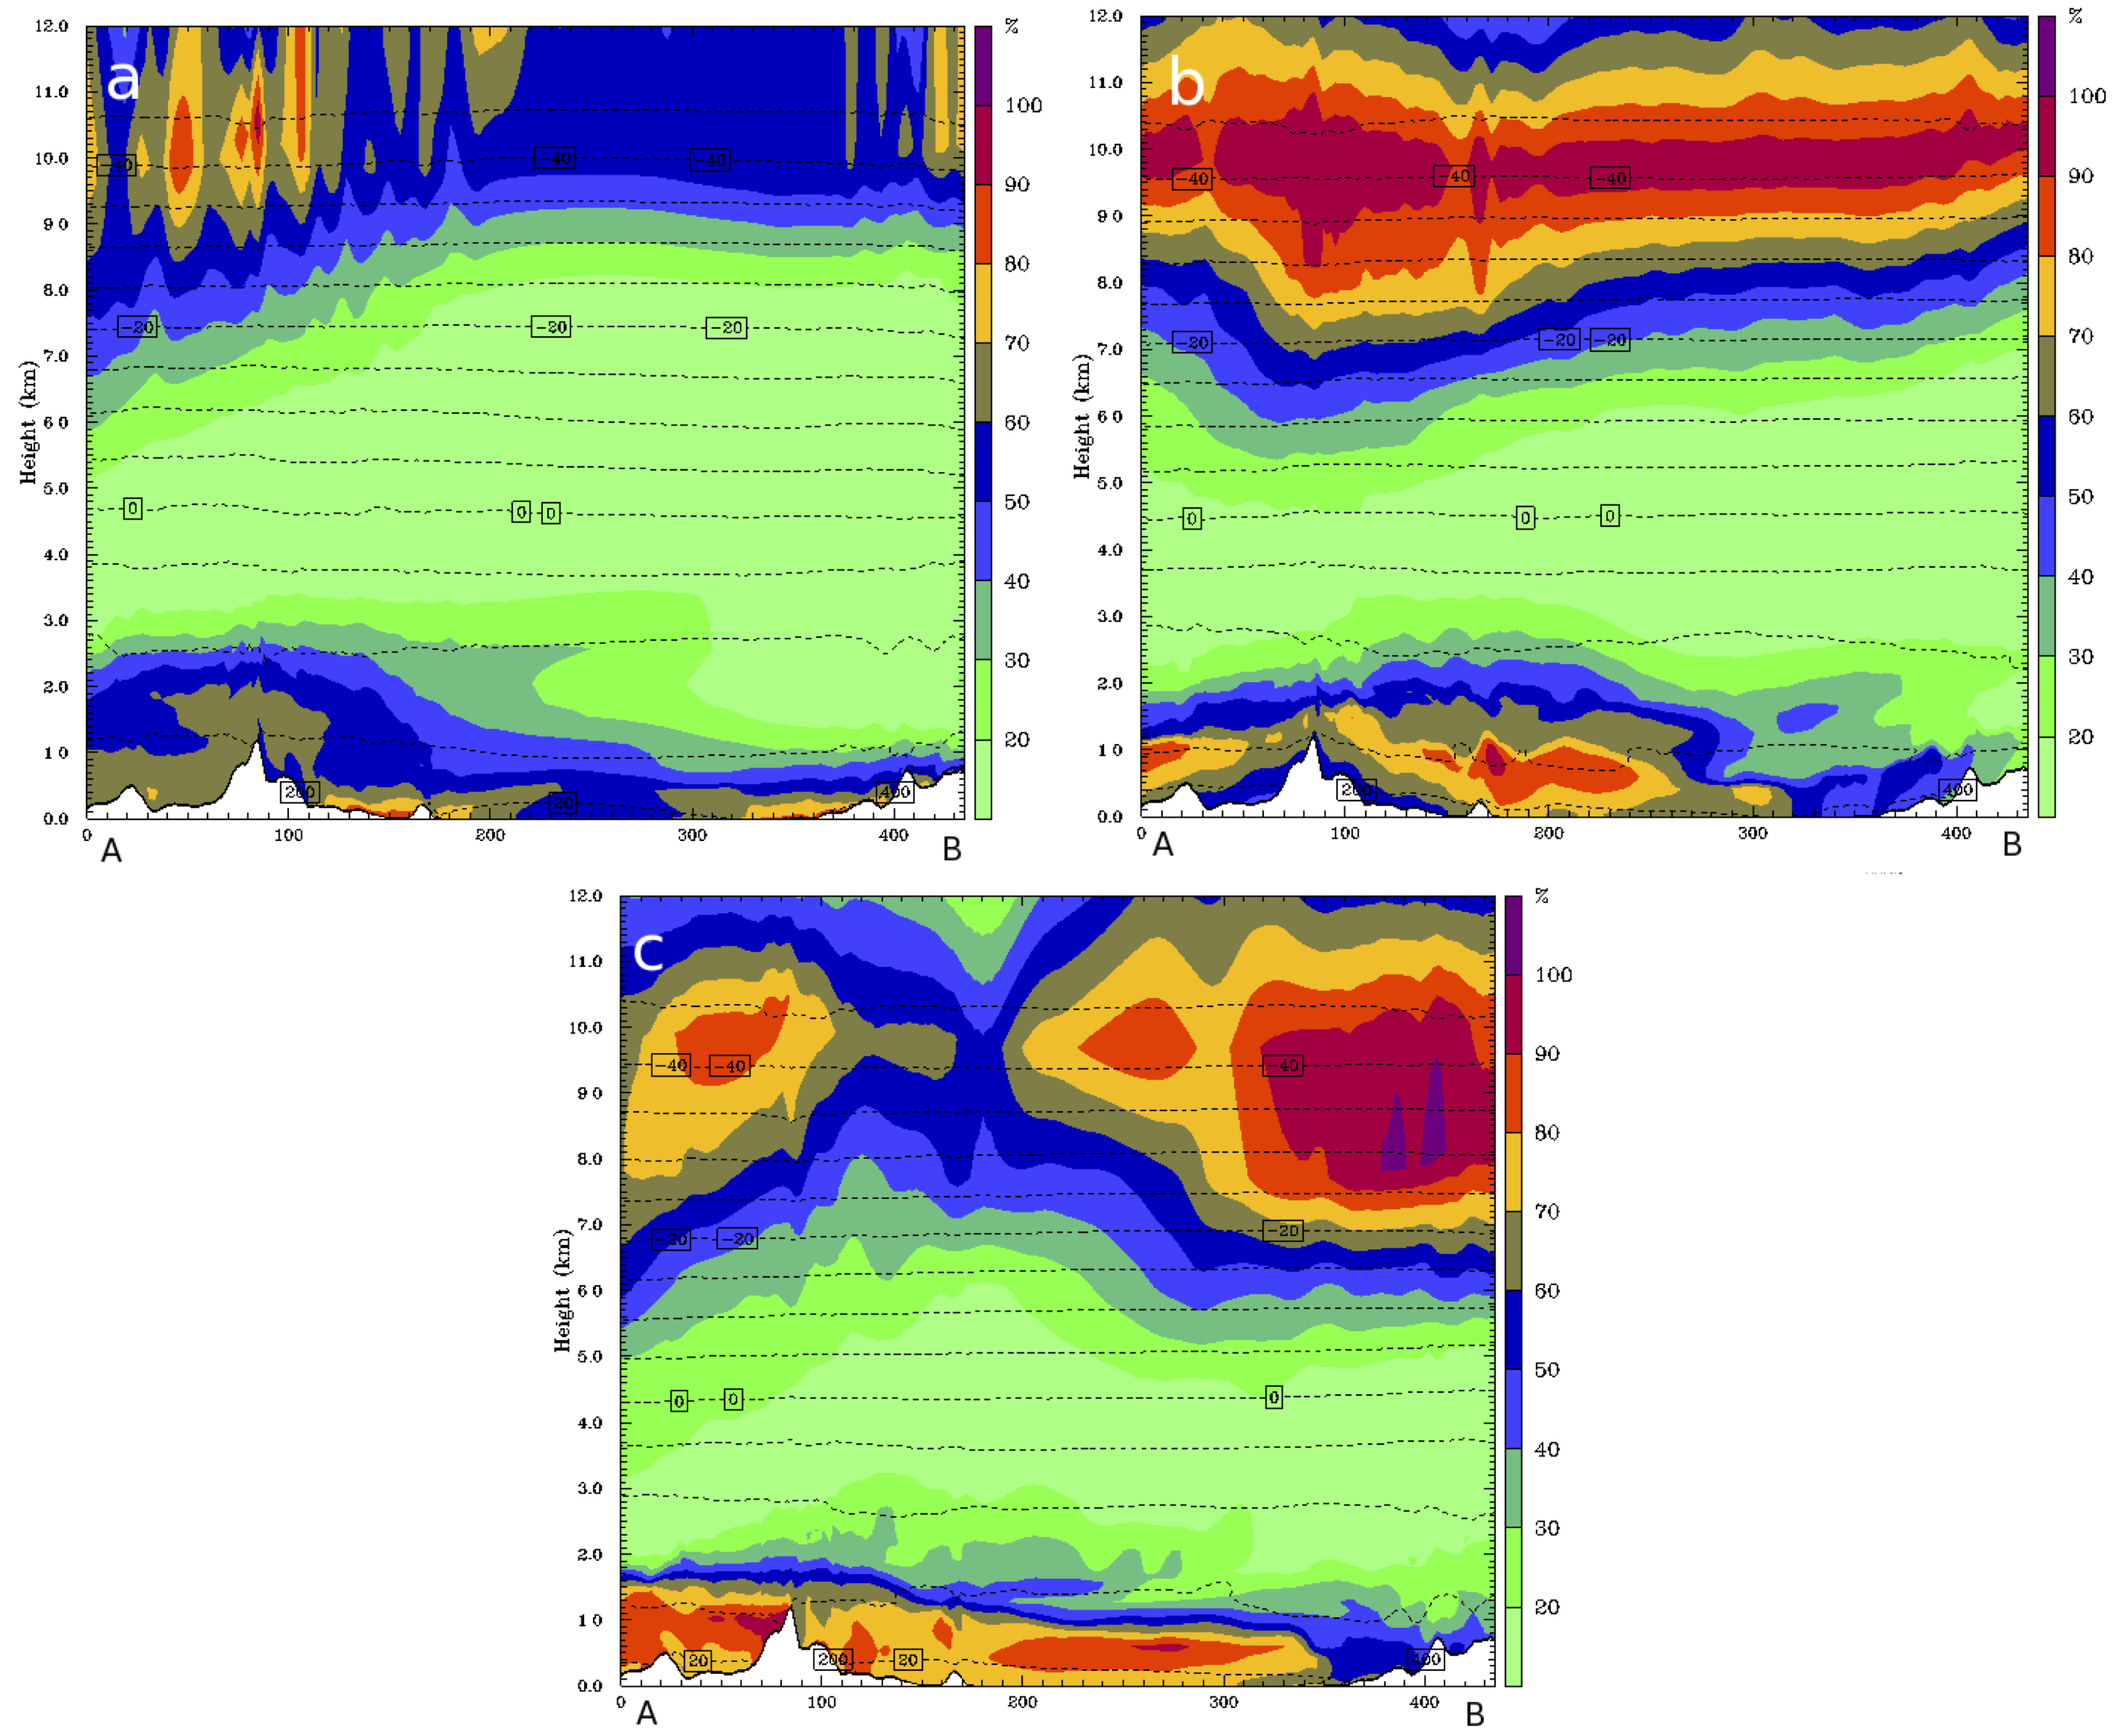
Figure 7 shows the vertical cross section of RHI and air temperature in domain 3 along the line AB shown in lower panel of Figure 4, at 02:00, 11:00 and 21 UTC on 21 September 2011. At 02:00 UTC the upper atmosphere shows low values of RHI over the gulf of Lyon. In the layer between 9.000 and 10.000 m dry conditions are simulated, with values of RHI around 40%–60% and temperature around −30 and −40 C. At 11:00 UTC, RHI reaches values higher than 90% around 9.500 m, with temperature around −40 C. At 21:00 UTC, RHI decreases over the Gulf of Lyon.
4. Conclusions
By using version 3.3 of the WRF–ARW mesoscale model, temperature, dew point temperature and RHI have been analyzed over the Gulf of Lyon during an episode of high contrail’s density to study the ability of the model for reproducing weather conditions during contrail formation.
According to the simulation, the small difference between the air temperature and the dew point temperature occurred in a layer between 8.500 and 10.000 m, around noon. At these hours Meteosat recorded the largest extension of contrail cirrus over the Gulf of Lyon. Particularly, at 11:00 UTC the vertical profile of RHI shows maximum values, higher than 90% and temperature lower than −40 C at 9.500 m. In the layers above and below this height, RHI decreases. Around this height, the increase of water vapor due to the exhaustion of the turbine engines could be enough to reach the deposition point. This height is the usual cruise flight height over an international airport during the cruising phase.
The values of temperature and RHI obtained from simulation are in agreement with those values needed to develop contrails to contrail cirrus found by some authors: the temperature should be lower than 230 K [5] and the RHI higher than 70% [3]. These values are needed to spread out contrails and transform them into remaining contrail cirrus. The simulation shows that RHI higher than 70% and temperature lower than −30 C are found between 7.500 and 10.000 m at 11:00 UTC. However, at 02:00 UTC and 21:00 UTC, despite the temperature being constant, the RHI decreases below 70%, not helping contrail formation.
Acknowledgments
The numerical simulations were performed by using the resources of the Supercomputing Center of Catalonia (CSUC). The authors were partially financed by the Spanish MINECO project CGL2012-37416-CO4-03. The authors are also grateful to EUMETSAT for the Meteosat images. The ERA Interim images are acquired from www.wetterzentrale.de. Picture on Figure 2 is courtesy of Jeronimo Lorente.
Author Contributions
Jordi Mazon conceived the idea, designed and performed the numerical simulations, and wrote the paper. David Pino provided the data for the simulations and contributed to analyse the results and to write the paper.
Conflicts of Interest
The authors declare no conflict of interest.
References
- Appleman, H. The formation of exhaust condensation trails by jet aircraft. Bull. Am. Meteorol. Soc. 1953, 34, 14–20. [Google Scholar]
- Iribarne, J.V.; Godson, W.L. Atmospheric thermodynamics. Q. J. R. Meteorol. Soc. 1982, 108, 734–735. [Google Scholar]
- Gierens, K.M. Numerical simulations of persistent contrails. J. Atmos. Sci. 1996, 53, 3333–3348. [Google Scholar] [CrossRef]
- Boin, M.; Levnok, L. Numerical simulation of the life time of contrails. In Impact of Emissions from Aircraft and Spacecraft upon the Atmosphere, Proceedings of an international scientific colloquium, Cologne, Germany, 18–20 April 1994; Schumann, U., Wurzel, D., Eds.; DLR-Mitteilung 94-06, Deutsches Zentrum fur Luft- und Raumfahrt: Oberpfaffenhofen and Cologne, Germany; pp. 82–87.
- Schumann, U. On conditions for contrails formation from aircraft exhaust. Meteorol. Z. 1996, 5, 4–23. [Google Scholar]
- Karcher, B.; Biermann, P.; Schumann, U. The initial composition of jet condensation trails. J. Atmos. Sci. 1996, 53, 3066–3083. [Google Scholar] [CrossRef]
- Schumann, U.; Wending, P. Air Traffic and the Environmental—Background, Tendencies and Potential Global Atmospheric Effects; Springer–Verlag: Berlin/Heidelberg, Germany, 1990; p. 245. [Google Scholar]
- Minnis, P.; Young, D.F.; Garber, D.P.; Nguyen, I.; Smith, L.; Palikonda, R. Transformation of contrails into cirrus during SUCCES. Geophys. Res. Lett. 1998, 25, 1157–1160. [Google Scholar] [CrossRef]
- Mannstein, H.; Meyer, R.; Wending, P. Operational detection of contrails from NOAA–AVHRR–data. Int. Remote Sens. 1999, 20, 1641–1660. [Google Scholar] [CrossRef]
- Schröder, F.; Kärcher, B.; Duroure, C.; Ström, J.; Petzold, A.; Gayet, J.F.; Strauss, B.; Wendling, P.; Borrmann, S. On the transition of contrails into cirrus clouds. J. Atmos. Sci. 2000, 57, 464–480. [Google Scholar] [CrossRef]
- Minnis, P.; Ayers, J.; Palikonda, R.; Phan, D. Contrails, cirrus trends, and climate. J. Clim. 2004, 17, 1672–1685. [Google Scholar] [CrossRef]
- Burkhardt, U.; Kärcher, B. Global radiative forcing from contrail cirrus. Nat. Clim. Chang. 2011, 1, 54–58. [Google Scholar] [CrossRef]
- Stuefer, M.; Meng, X.; Wendler, G. MM5 contrail forecasting in Alaska. Mon. Weather Rev. 2005, 133, 3517–3526. [Google Scholar] [CrossRef]
- Liou, K.; Ou, S.S.; Kim, J.; Gu, Y.; Yang, P.; Friedl, R.R. Climate effects of contrails cirrus over the western United States: A regional climate model investigation. AGU Fall meeting Abstracts. Available online: https://jifresse.ucla.edu/research/publications-presentations/2009agu-liou.pdf (accessed on 16 July 2016).
- Skamarock, W.C.; Klemp, J.B.; Dudhia, J.; Gill, D.O.; Barker, D.M.; Duda, M.; Huang, X.Y.; Powers, J.G. A Description of the Advanced Research WRF Version 3; Technical Report TN–475+STR; NCAR: Boulder, CO, USA, 2008. [Google Scholar]
- Hong, S.H.; Pan, H.L. Nonlocal boundary layer vertical diffusion in a medium-range forecast model. Mon. Weather Rev. 1996, 124, 2322–2339. [Google Scholar] [CrossRef]
- Mlawer, E.; Tubman, S.J.; Brown, P.D.; Iacono, M.J.; Clough, S.A. Radiative transfer for inhomogeneus atmospheres: RRTM, a validated correlated–k model for the long wave. J. Geophys. Res. 1997, 102, 663–682. [Google Scholar]
- Dudhia, J. Numerical study of convection observed during the winter monsoon experiment using a mesoscale two-dimanesional model. J. Atmos. Sci. 1989, 46, 3077–3107. [Google Scholar] [CrossRef]
- Hong, S.; Dudhia, J.; Chen, S. A revised approach to ice microphysical processes for the bulk parameterization of clouds and precipitation. Mon. Weather Rev. 2004, 132, 103–120. [Google Scholar] [CrossRef]
- Lamquin, N.; Stubenrauch, C.J.; Greens, K.; Burkhardt, U.; Smit, H. A global climatology of upper-tropospheric ice supersaturation occurrence inferred from the Atmospheric Infrared Sounder calibrated by MOZAIC. Atmos. Chem. Phys. 2012, 12, 381–405. [Google Scholar] [CrossRef] [Green Version]
- Keckhut, P.; Borchi, F.; Bekki, S.; Hauchecorne, A.; Silaouina, M. Cirrus classification at mid-latitude from systematic liar observations. J. Appl. Meteorol. Climatol. 2006, 45, 249–258. [Google Scholar] [CrossRef]
Figure 1.
Meteosat images recorded in the IR channel at 11:00 (upper panel) and 14:00 UTC (lower panel) on 21 September 2011. The red square indicates the area where contrails are observed.
Figure 1.
Meteosat images recorded in the IR channel at 11:00 (upper panel) and 14:00 UTC (lower panel) on 21 September 2011. The red square indicates the area where contrails are observed.


Figure 2.
Contrails covering the sky photographed over Barcelona on 21 September 2011 around 11 UTC.
Figure 2.
Contrails covering the sky photographed over Barcelona on 21 September 2011 around 11 UTC.

Figure 3.
ERA Interim reanalysis of geopotential height at 500 hPa (upper panel) and temperature at 850 hPa (lower panel) at 00:00 on 21 September 2011. The color bar in the upper panel shows the scale of the geopotential height, in decameters; in the lower panel the color bar shows the scale of air temperature, in C

Figure 4.
Left panel, domains defined in WRF simulation. The simulated vertical profiles of temperature, dew point temperature and RHI are analyzed at the center point of the smallest domain (42.8 N, 4.7 E); Right panel shows the domain 3, where the unit tick mark is 1 km. The line AB indicates the direction of the vertical cross sections used for the vertical analysis of RHI.

Figure 5.
Simulated vertical profiles of air temperature—solid line—and dew point temperature at 11:00 UTC—dashed line—(upper panel) and RHI (lower panel) at 02:00 (closed line), 11:00 (dashed line) and 21:00 UTC (short dashed line) in the middle of the small domain on 21 September 2011.
Figure 5.
Simulated vertical profiles of air temperature—solid line—and dew point temperature at 11:00 UTC—dashed line—(upper panel) and RHI (lower panel) at 02:00 (closed line), 11:00 (dashed line) and 21:00 UTC (short dashed line) in the middle of the small domain on 21 September 2011.

Figure 6.
Horizontal cross section of RHI at 9.500 m height in domain 3 at (a) 02:00 (b) 11:00 and (c) 21:00 UTC on 21 September 2011. The black dot indicates the location of Barcelona city, where the picture shown in Figure 2 was taken.
Figure 6.
Horizontal cross section of RHI at 9.500 m height in domain 3 at (a) 02:00 (b) 11:00 and (c) 21:00 UTC on 21 September 2011. The black dot indicates the location of Barcelona city, where the picture shown in Figure 2 was taken.

Figure 7.
Vertical cross section along the line AB shown in Figure 4 (lower panel), of RHI (in %, color contour) and temperature (in C, dashed lines) in domain 3 at (a) 02:00, (b) 11:00 and (c) 21:00 UTC on 21 September 2011. The scale of the horizontal axis is in km.
Figure 7.
Vertical cross section along the line AB shown in Figure 4 (lower panel), of RHI (in %, color contour) and temperature (in C, dashed lines) in domain 3 at (a) 02:00, (b) 11:00 and (c) 21:00 UTC on 21 September 2011. The scale of the horizontal axis is in km.

© 2016 by the authors; licensee MDPI, Basel, Switzerland. This article is an open access article distributed under the terms and conditions of the Creative Commons Attribution (CC-BY) license (http://creativecommons.org/licenses/by/4.0/).
Share and Cite
MDPI and ACS Style
Mazon, J.; Pino, D. A WRF Simulation of an Episode of Contrails Covering the Entire Sky. Atmosphere 2016, 7, 95. https://doi.org/10.3390/atmos7070095
AMA Style
Mazon J, Pino D. A WRF Simulation of an Episode of Contrails Covering the Entire Sky. Atmosphere. 2016; 7(7):95. https://doi.org/10.3390/atmos7070095
Chicago/Turabian StyleMazon, Jordi, and David Pino. 2016. "A WRF Simulation of an Episode of Contrails Covering the Entire Sky" Atmosphere 7, no. 7: 95. https://doi.org/10.3390/atmos7070095
Note that from the first issue of 2016, this journal uses article numbers instead of page numbers. See further details here.