
Testing Filter-Based Air Cleaners with Surrogate Particles for Viruses and Exhaled Droplets


Institut für Energie- und Umwelttechnik e.V. (IUTA), 47229 Duisburg, Germany
*
Author to whom correspondence should be addressed.
Atmosphere 2022, 13(10), 1538; https://doi.org/10.3390/atmos13101538
Submission received: 30 August 2022
/
Revised: 15 September 2022
/
Accepted: 16 September 2022
/
Published: 20 September 2022
(This article belongs to the Special Issue Research on Indoor Air Cleaners for Particulate, Microbiological and Gaseous Pollutants)
Abstract
:Indoor air cleaners can contribute to reducing infection risks by the filtration of virus-carrying droplets. There are various national standards to test indoor air cleaners that determine the clean air delivery rate (CADR), but typically only as a size-integrated value for particles > 0.3 μm. Thus, a test method using potassium chloride (KCl) and paraffin as surrogate particles in the size range of viruses and exhaled droplets was developed. We show that air cleaners with fibrous and electrostatic filters are generally capable of reducing the airborne particle concentrations. However, for electret filters, the performance can strongly degrade over time by being loaded with particles. By comparing filters with different efficiencies in the same air cleaner, we demonstrate that the use of high-efficiency filters can be even at the expense of the cleaning efficacy. We developed a mathematical model to estimate the inhaled dose of viruses and show that the combination of natural venting and an air cleaner can lead to a substantial reduction of the infection risk.
1. Introduction
Humans constantly release droplets of lung-lining fluid, saliva, or mucus from their respiratory tract, which can potentially contain viruses [1]. The size range of the exhaled particles can cover several orders of magnitude [2]: sneezing and coughing essentially produces coarse particles with diameters of more than 100 µm [3,4]. Because of their large size, they settle relatively quickly to the ground, but can cause direct infections if the distance to an infectious person is too small [5]. Particles produced when speaking or singing are smaller, with diameters from around 1 µm to 2 µm [6]. Moreover, during normal breathing, small concentrations of particles in the size range from ≤0.2 µm to 0.4 µm are constantly produced [7,8,9]. During respiratory infections, the emission rates can significantly increase [10]. The particle sizes mentioned here refer to freshly exhaled particles, which still have a high water content due to the high relative humidity in the respiratory tract. In undersaturated ambient air, the liquid evaporates so that the particles shrink on the time scale from milliseconds to seconds [11]. The exact evaporation rate depends on the particle size, temperature, and relative humidity [12,13]. The remaining particles can have in minimum the size of an individual virus, but typically the droplets shrink to only between 20% and 50% of the original diameter since the molecules dissolved in the liquid can solidify and bind the residual water if they are hygroscopic [14]. The range of particles, from the size of individual viruses to virus-laden droplets of a few micrometers in size, can remain in the airborne state for a long time, accumulate indoors, and be transported over longer distances by convection, and thus lead to infections on larger time and length scales [15].
For this reason, air cleaners are considered as an additional means for minimizing the risk of infection, especially for rooms in which regular venting is not possible [16,17]. Air cleaners are mobile devices that can be positioned anywhere in a room. They have a fan that draws in the room air, passes it through one or more filters, and releases the cleaned air back into the room. With regard to infectious aerosols, they have the same effect as venting with clean outside air, in that they lower or keep the particle concentration low over time [18]. Air cleaners have become increasingly popular in recent years as household appliances. In addition, during the COVID-19 pandemic, larger air cleaners have come onto the market, e.g., for classrooms, restaurants, or open-plan offices.
Most air cleaners on the market contain fibrous particle filters, which are usually made of nonwovens that are capable of filtering small particles including viruses, bacteria, or exhaled droplets with very high efficiency [19,20]. Household air cleaners often make use of electret filters, whose fibers are electrostatically charged during the manufacturing process [21,22]. A large proportion of airborne particles carry a natural electric charge and can thus be removed from the air with increased efficiency using electrostatically enhanced filtration compared to purely mechanical filtration. However, uncharged particles are also polarized by the spatially inhomogeneous electric field surrounding the fibers and thus are increasingly filtered without increasing the pressure drop [21]. Although electret filters typically reach a high initial filtration efficiency, it is known that they can drastically degrade with time due to the exposure to particles [23,24], organic solvents [25,26], or air humidity [27,28]. This effect also concerns mobile air cleaners, as shown in previous studies [29,30].
Larger air cleaners developed during the COVID-19 pandemic often make use of HEPA (High Efficiency Particulate Air) H13 or H14 filters in accordance with EN 1822 or ISO 29463, with a minimum filter efficiency of at least 99.95%. According to the named standards, this efficiency has to be achieved with electrically neutral, i.e., if necessary discharged, filters. As a denser or thicker filter medium is required to achieve a higher mechanical filtration efficiency, those filters have a higher pressure drop than electret filters. Besides air cleaners using fibrous filters, there are also air cleaners with electrostatic precipitators (ESP). In those, the particles are electrostatically charged by ions produced in a corona discharge and in the following are deposited on plates under high voltage [31]. As the filtration of particles only depends the particle size, but not on whether the particles are biologically active or not, all appliances with fibrous or electrostatic filters can be tested with nonbiological surrogate particles covering the appropriate size range. However, there also other types of air cleaners using UV-C irradiation, plasma, or ozone to inactivate microorganisms without depositing them in a filter. For such technologies, the methods developed here are not suitable.
For filtering air cleaners, the Clean Air Delivery Rate (CADR) is usually used to evaluate their effectiveness. The CADR indicates how many cubic meters of cleaned air the air cleaner provides per hour and ideally corresponds to the product of filter efficiency and flow rate. There are various national testing standards for measuring the CADR in a standardized way. The most common are the Chinese GB/T 18801-2015 and the US American ANSI/AHAM AC-1-2020. The new international test standard ISO/IEC 63086 is currently under development. To determine the CADR, the air cleaner is placed in a test chamber and a test aerosol is introduced until a certain starting concentration is reached. After homogeneous mixing has been achieved, the exponential decrease in concentration is measured over time with the air cleaner running. A decay curve of the particle concentration without the air cleaner serves as a reference in order to separate the natural deposition from that caused by the air cleaner. The CADR is calculated as the product of the difference between the two decay rates with and without the air cleaner and the volume V of the test chamber:
Often, cigarette smoke is used as a test aerosol. At first glance, cigarette smoke particles have little in common with exhaled droplets, but the previously discussed relevant particle size range for viruses and virus-laden droplets is roughly covered [32]. In addition, the previously mentioned particle separation mechanisms depend only on the (equivalent) size and possibly the charge of the particles, but not on their aggregate state. To a first approximation, it can therefore be expected that the standard tests will also provide an estimate for the separation of exhaled droplets.
However, the method has two disadvantages: Firstly, whereas the measurements are commonly carried out with size-resolving aerosol spectrometers, the data evaluation according to the standards only provides a size-integrated result over a wide size range. Strictly speaking, the CADR determined is therefore only valid for the size distribution of the test aerosol used, due to the particle size dependence of the filtration efficiency. It can thus only to a limited extent be transferred to other aerosols. In order to obtain information independent of the test aerosol, it makes more sense to determine the CADR in a size-resolved manner. The second disadvantage is that the size range < 0.3 µm is not covered. The reason for this is that, according to the standards, only optical particle counters are used, whose lower detection limit is constrained by the scattered light intensity, which decreases sharply with the particle diameter. However, the size range close to single airborne viruses is of particular interest for air cleaners since the liquid phase of exhaled droplets quickly evaporates and the residual particles can remain in the room for a longer period of time before reaching the air cleaner.
Therefore, a test method was developed which determines the CADR in the size range of exhaled droplets in a size-dependent manner down to the average size of SARS-CoV-2. To investigate the aging effect of electret filters, the method was applied in the initial state and after aging with the smoke of 100 cigarettes. Mathematical modeling of typical scenarios shows the benefit of an air cleaner in combination with venting on reducing the risk for infection transmission.
2. Materials and Methods
All CADR measurements were performed in a test chamber according to GB/T 18801-2015, which is schematically shown in Figure 1. The internal dimensions of the chamber are 3.45 m × 3.40 m × 2.50 m, corresponding to an interior volume of 29.3 m³. The walls of the test chamber were lined with an antistatic foil to minimize the electrostatic particle losses. To remove the particles that were present before the measurements, a second mobile air cleaner with a known high efficiency was initially operated in the test chamber. Prior to each test and in accordance with the standard, the temperature was set to (25 ± 3) °C with an air conditioner and the relative humidity was adjusted with a portable humidifier to (50 ± 10) %RH. During the actual CADR measurements, the additional air cleaner, the air conditioner, and the humidifier were turned off. Only a fan on the floor of the chamber was running, as required by the air cleaner test standard, to homogeneously distribute the test aerosol in the chamber. Sampling was performed by extracting a small flow from the chamber to the measuring instruments. The sampling point was located 0.50 m from the wall and 1.20 m above the floor in accordance with GB/T 18801-2015. The air cleaner was placed in the center of the test chamber. Air cleaners with a height larger than 0.70 m were placed directly on the floor, whereas smaller air cleaners were placed on a table with 0.70 m height, as required by GB/T 18801-2015.
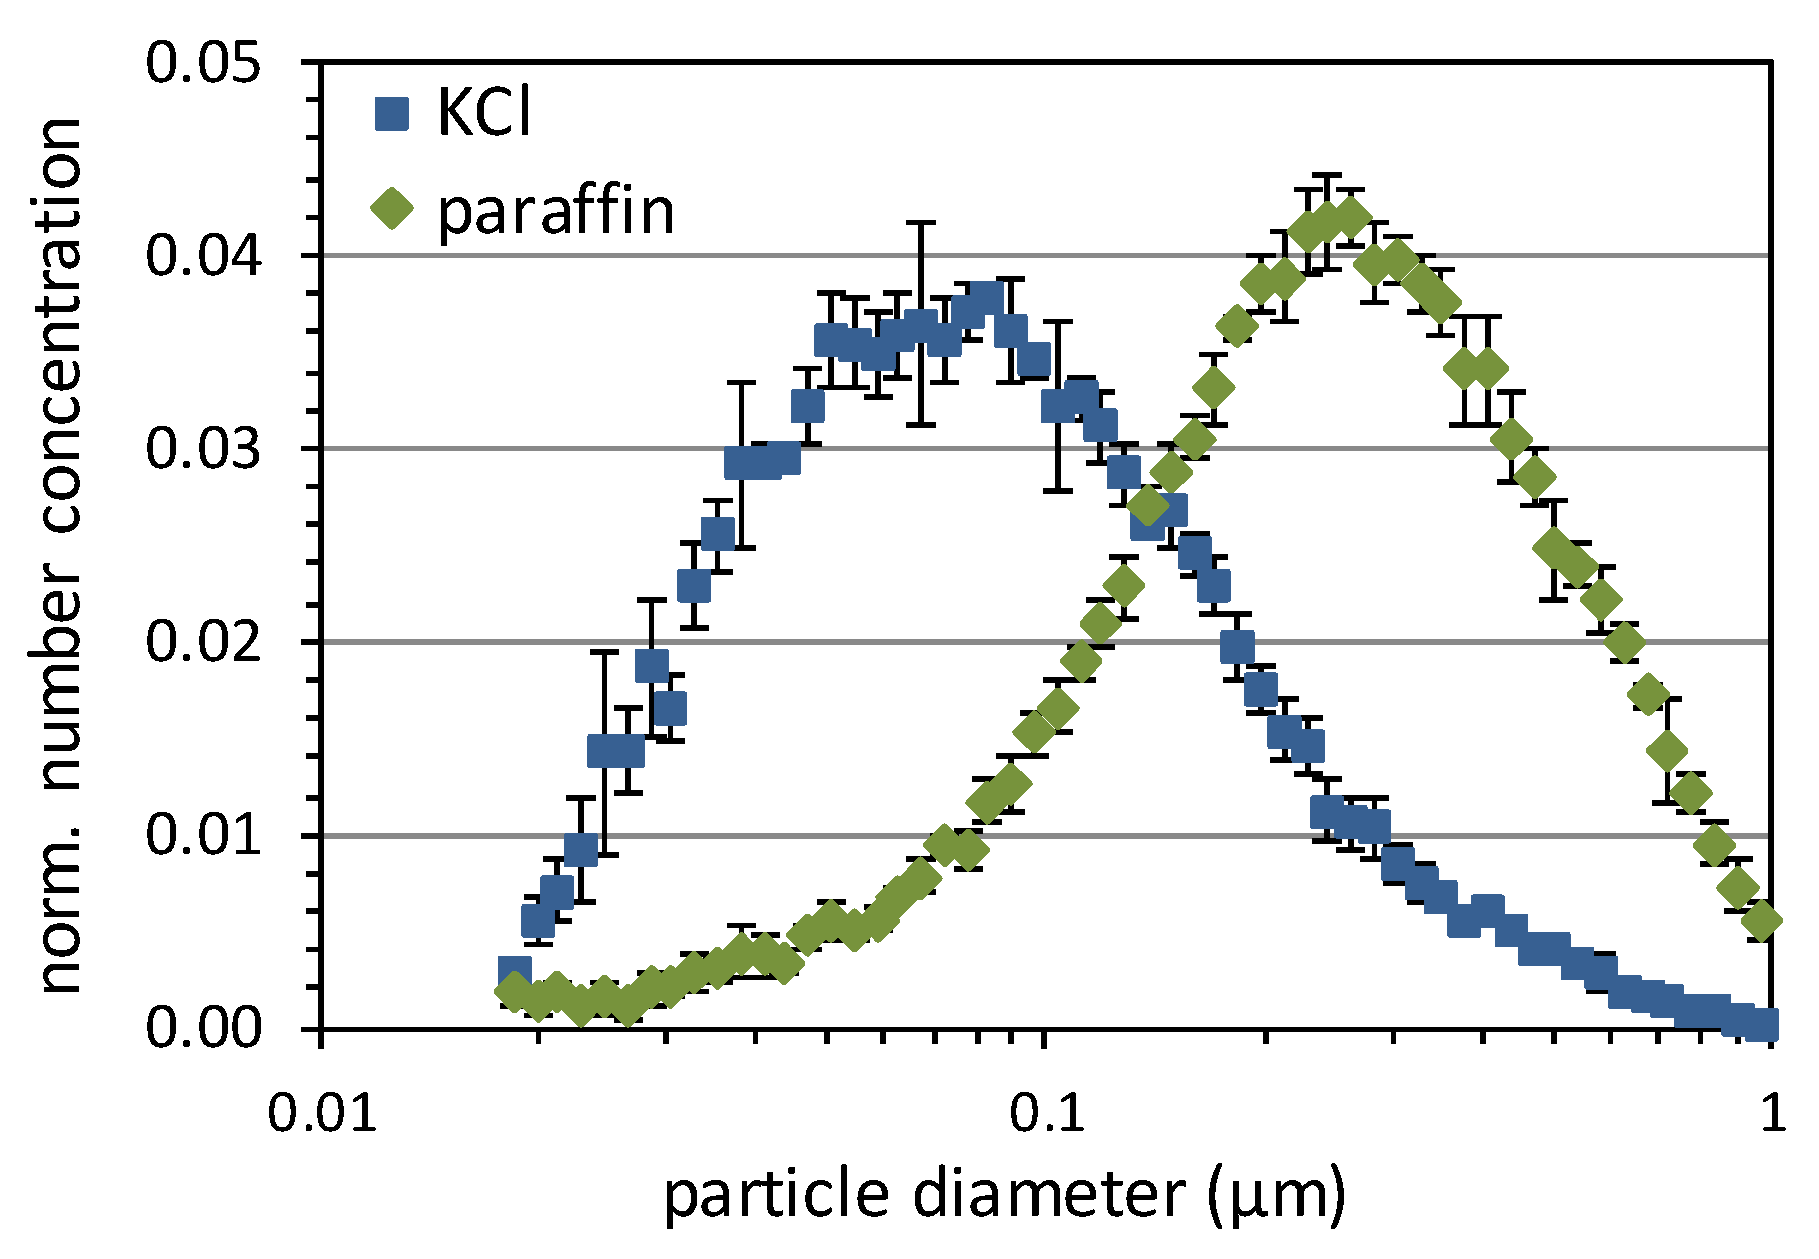
Two different test aerosols were used to cover the relevant size range of viruses and small exhaled droplets: a polydisperse potassium chloride (KCl) aerosol was generated from an aqueous KCl solution (100 g KCl per liter of de-ionized water) using an atomizer (Palas AGK 2000, Palas, Karlsruhe, Germany) and dried by dilution with compressed air. The size distribution measured with a Scanning Mobility Particle Sizer (SMPS, TSI 3936, TSI, Shoreview, MN, USA), consisting of a long differential mobility analyzer (DMA, TSI 3080/3081) and a butanol-based ultrafine condensation particle counter (CPC, TSI 3776). As shown in Figure 2, the KCl particles have a modal diameter of about 0.08 µm. Paraffin, which is also used for testing respirators according to EN 149, was chosen as the second test aerosol. The liquid aggregate state and the spherical shape represent the morphology of exhaled droplets in a good approximation. In contrast to the exhaled droplets, the paraffin particles do not evaporate due to their low vapor pressure so that their size is stable throughout the experiment. The paraffin droplets were dispersed using another atomizer (Palas AGF 2.0). The size distribution measured with the SMPS is also shown in Figure 2. The paraffin aerosol covers the range between about 0.1 µm and 1 µm, with a modal diameter of about 0.3 µm.
Unlike cigarette smoke, both KCl and paraffin are not carcinogenic and can be dispersed easily and very reproducibly with commercially available atomizers. In contrast, for cigarette smoke, the exact burning conditions have a strong influence on the particle properties and concentrations [30]. In addition, the materials are inexpensive and not subject to import restrictions, which is advantageous especially in view of the current development of an international test standard for air cleaners.
An SMPS would not be suitable for measuring dynamic processes such as a decay curve, since it takes ≥1 min for the measurement of a size distribution and requires it to be stable. Thus, only a monodisperse fraction at the average size of individual SARS-CoV-2 viruses of 0.12 µm [33,34] was classified from the polydisperse aerosol using the combination of DMA and CPC described above. The size range from 0.2 µm to 10 µm was measured with an optical aerosol spectrometer (OPC, Palas welas® digital 3000), while an aerodynamic particle size spectrometer (APS, TSI 3321) was used for particle diameters from 0.5 µm to 20 µm. We note that the three measurement techniques determine different equivalent diameters: while the DMA classifies according to the electrical mobility diameter, the OPC determines the optical equivalent diameter. The APS in contrast measures the aerodynamic particle diameter. However, for the sake of simplicity, the general term particle diameter will be used in the following.
For the actual CADR test, the air in the test chamber was first cleaned and the boundary conditions for the temperature and humidity were set. The test aerosol was fed into the test chamber through an antistatic hose until the initial concentration was reached. After a waiting period of 5 min to achieve homogeneous mixing, the measurement of the natural decay curve began without operating the air cleaner for 30 min, followed by another 30 min of operating the air cleaner at the highest level. We note that no specific neutralization of the particles was carried out. It is known that aerosol particles generated from liquid solutions can deviate in their charge state from the bipolar equilibrium directly after generation [35,36]. However, the long residence time of 35 min before switching on the air cleaner in a typical indoor environment with about 1000 naturally present ions per cm3 [37] leads to a value of about 2.1 × 106 cm−3s for the product of ion concentration and residence time. This can be regarded as sufficient for an almost complete neutralization in the particle size range considered here [38]. In line with that, additional neutralization was previously shown to have only a minor impact on the filtration efficiency for salt and oil aerosols [39].
To age the air cleaner filters, the air cleaners were exposed to the smoke of 100 3R4F research cigarettes [40] in a 3 m³ stainless steel box according to the method described in GB/T 18801-2015. The box contains a perforated metal plate (125 mm diameter) with 50 cigarettes, which is connected to a pump to continuously suck air through the cigarettes. The 50 cigarettes were simultaneously lighted while the air cleaner was running. After 45 min, a next set of 50 cigarettes was burned without opening the chamber in between. After another 45 min, the air cleaner was switched off to carry out a second CADR test in the 29.3 m³ chamber.
3. Results and Discussion
3.1. Comparison of the Test Aerosols
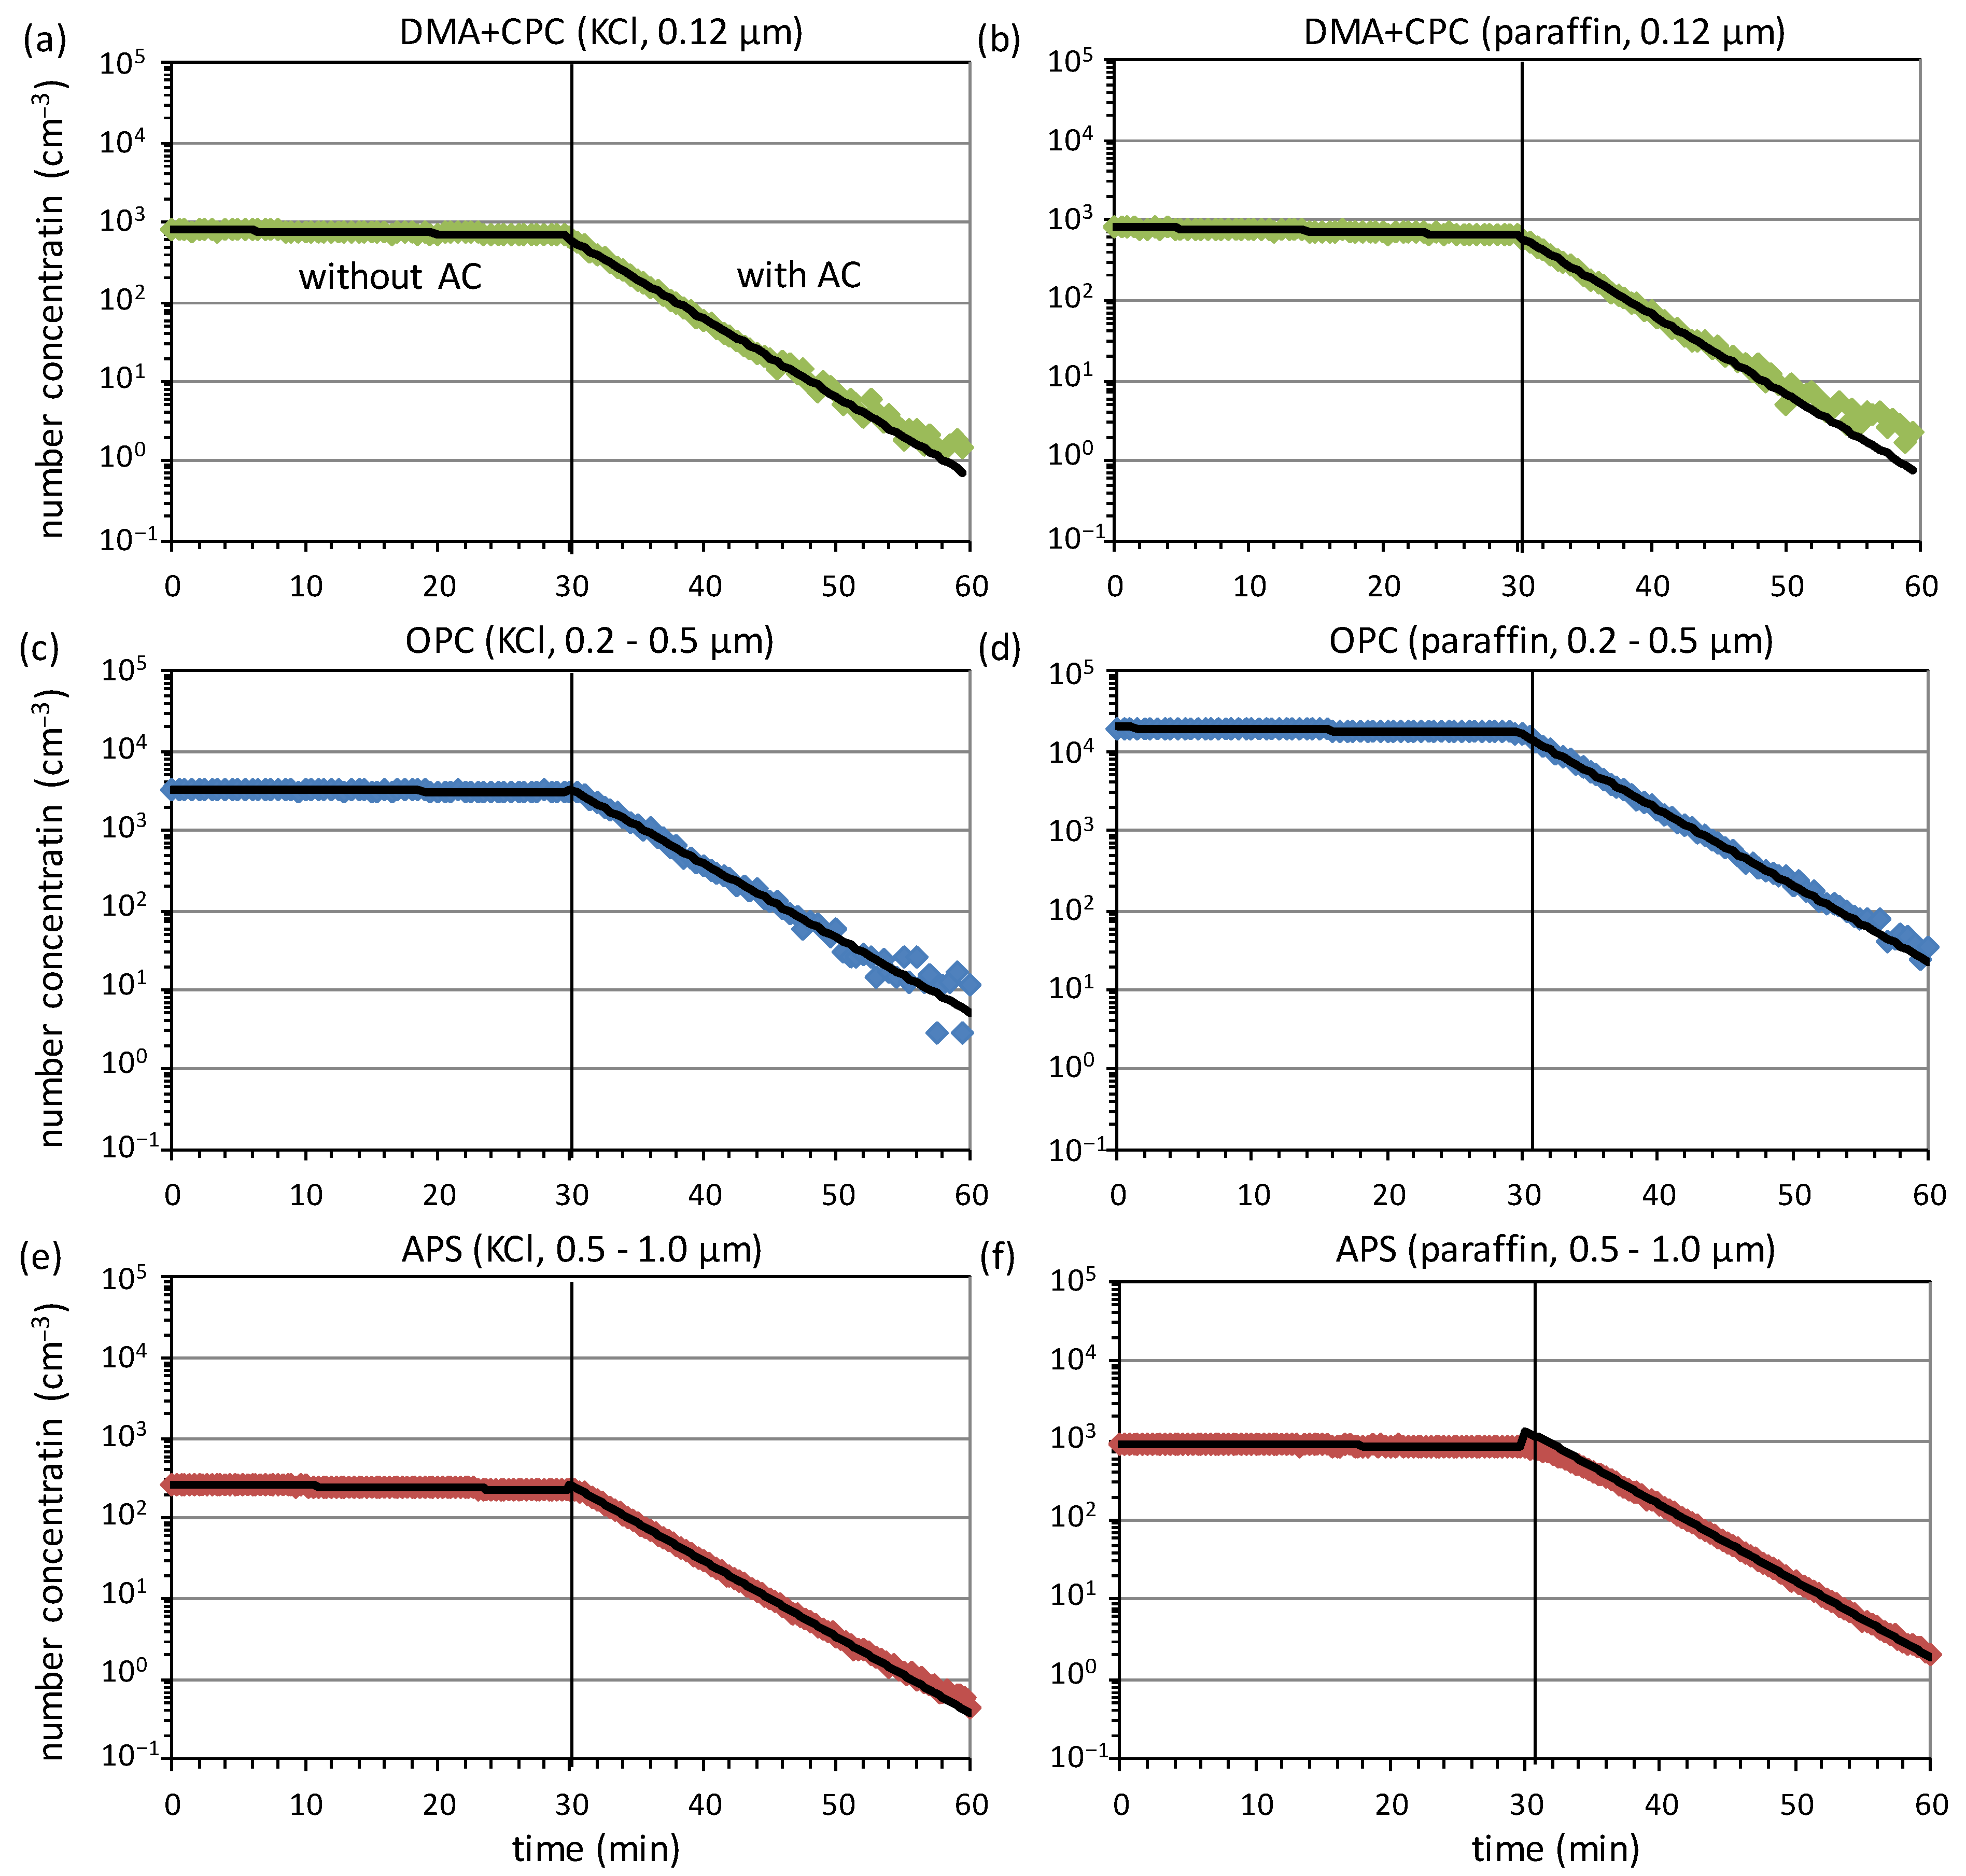
In order to discuss the advantages and disadvantages of the two test aerosols, exemplary decay curves for a commercial air cleaner based on the ESP technology are shown in Figure 3. All tests were performed, as described in Section 2, with KCl and paraffin. The first row of Figure 3 shows the decay curves for the 0.12 µm fraction classified with a DMA and counted with a CPC. The CPC sampled one data point per second, which were averaged afterwards to one data point per 30 s to reduce the statistical noise. The initial concentration of about 1000 cm−3 was comparable for both aerosols, as the particle size of 0.12 µm is located in between the maxima of the size distributions for KCl and paraffin (see Figure 2). When the concentration falls below about 10 cm−3, the scatter of the data noticeably increases. Furthermore, the data starts to slightly deviate from the ideal exponential model. This is presumably due to the presence of faint particle sources not included in the regression model (e.g., infiltration from outside of the test chamber through small leaks). These are negligible for high concentrations, but become more relevant at low concentrations. These data were not taken into account for fitting, as they would lead to an underestimation of the slope in the exponential decay regime and thus the CADR.
In the second row of Figure 3, data measured with the OPC in the size range from 0.2 µm to 0.5 µm are shown. The data were sampled as 30 s averages. In line with the size distributions shown in Figure 2, the initial concentration of paraffin droplets is about a factor of six higher in this size range than for KCl. Moreover, the data slightly deviate from the ideal exponential decay at low concentrations towards the end of the measurement and were not included in the fit. The last row of Figure 3 finally shows the decay of the total concentration in the size range from 0.5 µm to 1.0 µm measured with the APS as 20 s averages. As already observed for the OPC, the initial concentration is higher for the larger droplets compared to the KCl particles. However, this has no substantial effect on the counting statistics, as the APS analyses a high flow rate of 1 l/min and is thus capable to measure even the low concentrations of particles larger than 1 µm between about 1 cm−3 and 50 cm−3 with a high signal-to-noise ratio. Only at very low concentrations below about 1 cm−3, a slight deviation from the exponential model is seen for KCl.
For the APS measurements with paraffin shown in Figure 3f, an artifact occurs in the decay curves: After switching on the air cleaner, the decay curve does not (almost) instantaneously change its slope from to , but slowly approaches the larger slope within several minutes. This behavior was often observed for paraffin, but neither occurred for KCl as the test aerosol nor for the measurements with the DMA+CPC combination or an OPC. Up to now, no reasonable explanation for this artifact could be found. Consequently, the first 10 min after switching on the air cleaner were excluded from fitting in order not to underestimate the slope of the decay curves in the exponential decay regime.
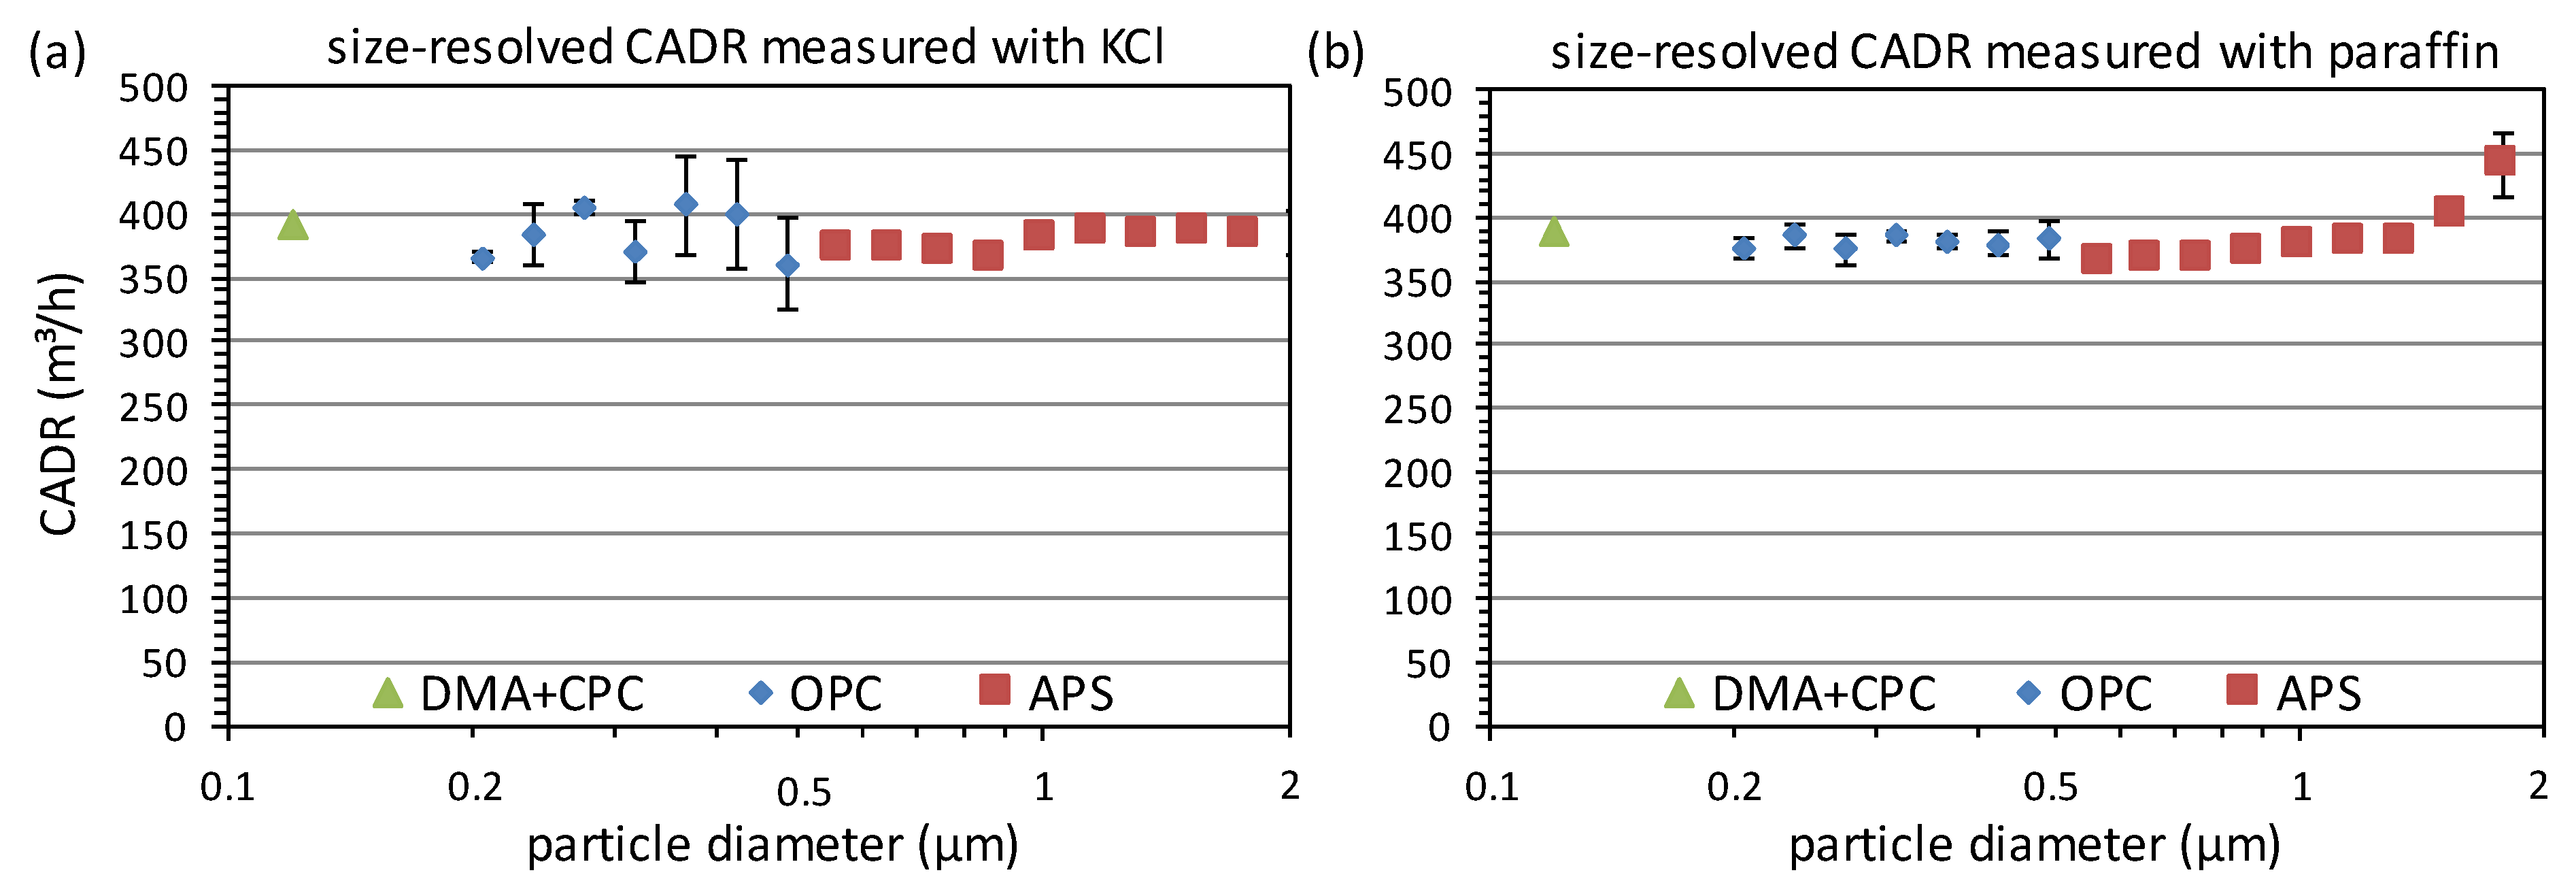
The size-dependent CADR for KCl and paraffin derived by fitting the decay curves in the individual size bins is shown in Figure 4. As there were, especially for larger particles, low particle counts in the individual size channels leading to statistical fluctuations, the number of classes was reduced from 64 to 16 per size decade for the OPC and from 32 to 16 per decade for the APS. The error bars indicate the standard deviation of the concentration in the combined classes as a measure of the characteristic scatter. Overall, the test shows that the air cleaner is capable of removing particles in the size range of individual viruses and virus-laden droplets. The low particle size dependence is an indicator that the filtration efficiency is high, although it cannot be exactly determined without knowing the flow rate of the air cleaner.
At 0.12 µm, the determined CADR with both aerosols is in excellent agreement with a deviation below 1%. This is usually also the case for the investigated air cleaners with electret filters, which is in strong contrast to the testing of respirators with electret filter media. There, often substantially lower filtration efficiencies are found for oil compared to salt aerosols [41]. This can be attributed to the partial discharging of the electret filter by the oil during the test, while salt shows only a negligible discharging effect on short time scales [39,42]. However, the loading with paraffin in a respirator test under the continuous dosing of particles is substantially higher than in a CADR test, where only the initial concentration, which is much lower than in a respirator test, has to be removed from the test chamber. Thus, discharging effects do not seem to be relevant in the latter case.
Although both aerosols are shown to be suitable for the DMA+CPC method, KCl has the advantage that the classification takes places on the right flank of the size distribution, which minimizes the fraction of multicharged particles in the monomobile aerosol [43]. For paraffin, the results contain also a certain contribution from larger multicharged particles, which have the same electrical mobility as the singly charged particles of the wanted size and can have an influence on the CADR due to the size dependence of the fractional filtration efficiency.
Moreover, for the OPC measurements, the CADR values determined with KCl and paraffin are in good agreement, but the scatter of the size-resolved CADR is higher in the case of KCl. This is caused by the considerably lower particle concentrations in the individual size channels. Although the OPC is in principle capable of measuring particles up to 10 µm, there were not sufficient particles above about 0.5 µm to derive exponential decay curves with sufficient statistical accuracy. This is not a problem for the APS due to the higher analyzed flow, so that here a size-dependent CADR up to about 2 µm could be derived. Below 1 µm, the CADR for KCl and paraffin is in good agreement, but for larger particles, a strong increase in the CADR is observed in the case of paraffin. This can presumably be attributed to artifacts by deformation of the droplets during the acceleration or deposition in the nozzle of the APS. Such effects are known from the literature for liquid aerosol particles [44,45] and can lead to a significant decrease in the counting efficiency [46]. Therefore, the size range considered for paraffin should be restricted to an upper limit of 1 µm.
3.2. Influence of the Filter Class
In larger air cleaners developed during the COVID-19 pandemic, often high-efficiency filters of classes H13 or H14 according to EN 1822 are used. The choice is typically explained to be in line with the recommendations for high safety laboratories dealing with pathogenic substances. However, single-pass ventilation systems of such labs differ considerably from air cleaners operated in recirculation mode. The consequences of transferring this recommendation to air cleaners is discussed here for an example. As explained earlier, the decisive criterion for an air cleaner is not the filter efficiency alone, but always the combination with sufficient air flow. For example, an H13 filter with 99.95% minimum collection efficiency can achieve the same CADR as an E11 filter with 95% minimum collection efficiency at a flow rate that is about 5% higher. However, since the pressure drop of an H13 filter can be twice as high as for an E11 filter [47], about twice as much electrical energy is required for the operation of the air cleaner. Moreover, a considerably louder fan noise must be accepted. Especially the latter can strongly lower the acceptance of air cleaners in occupied rooms [48,49]. When using an H14 filter with a minimum efficiency of 99.995%, this balance is even less favorable. Thus, the use of H13 and H14 filters is neither advantageous in terms of performance nor economically or energetically meaningful.
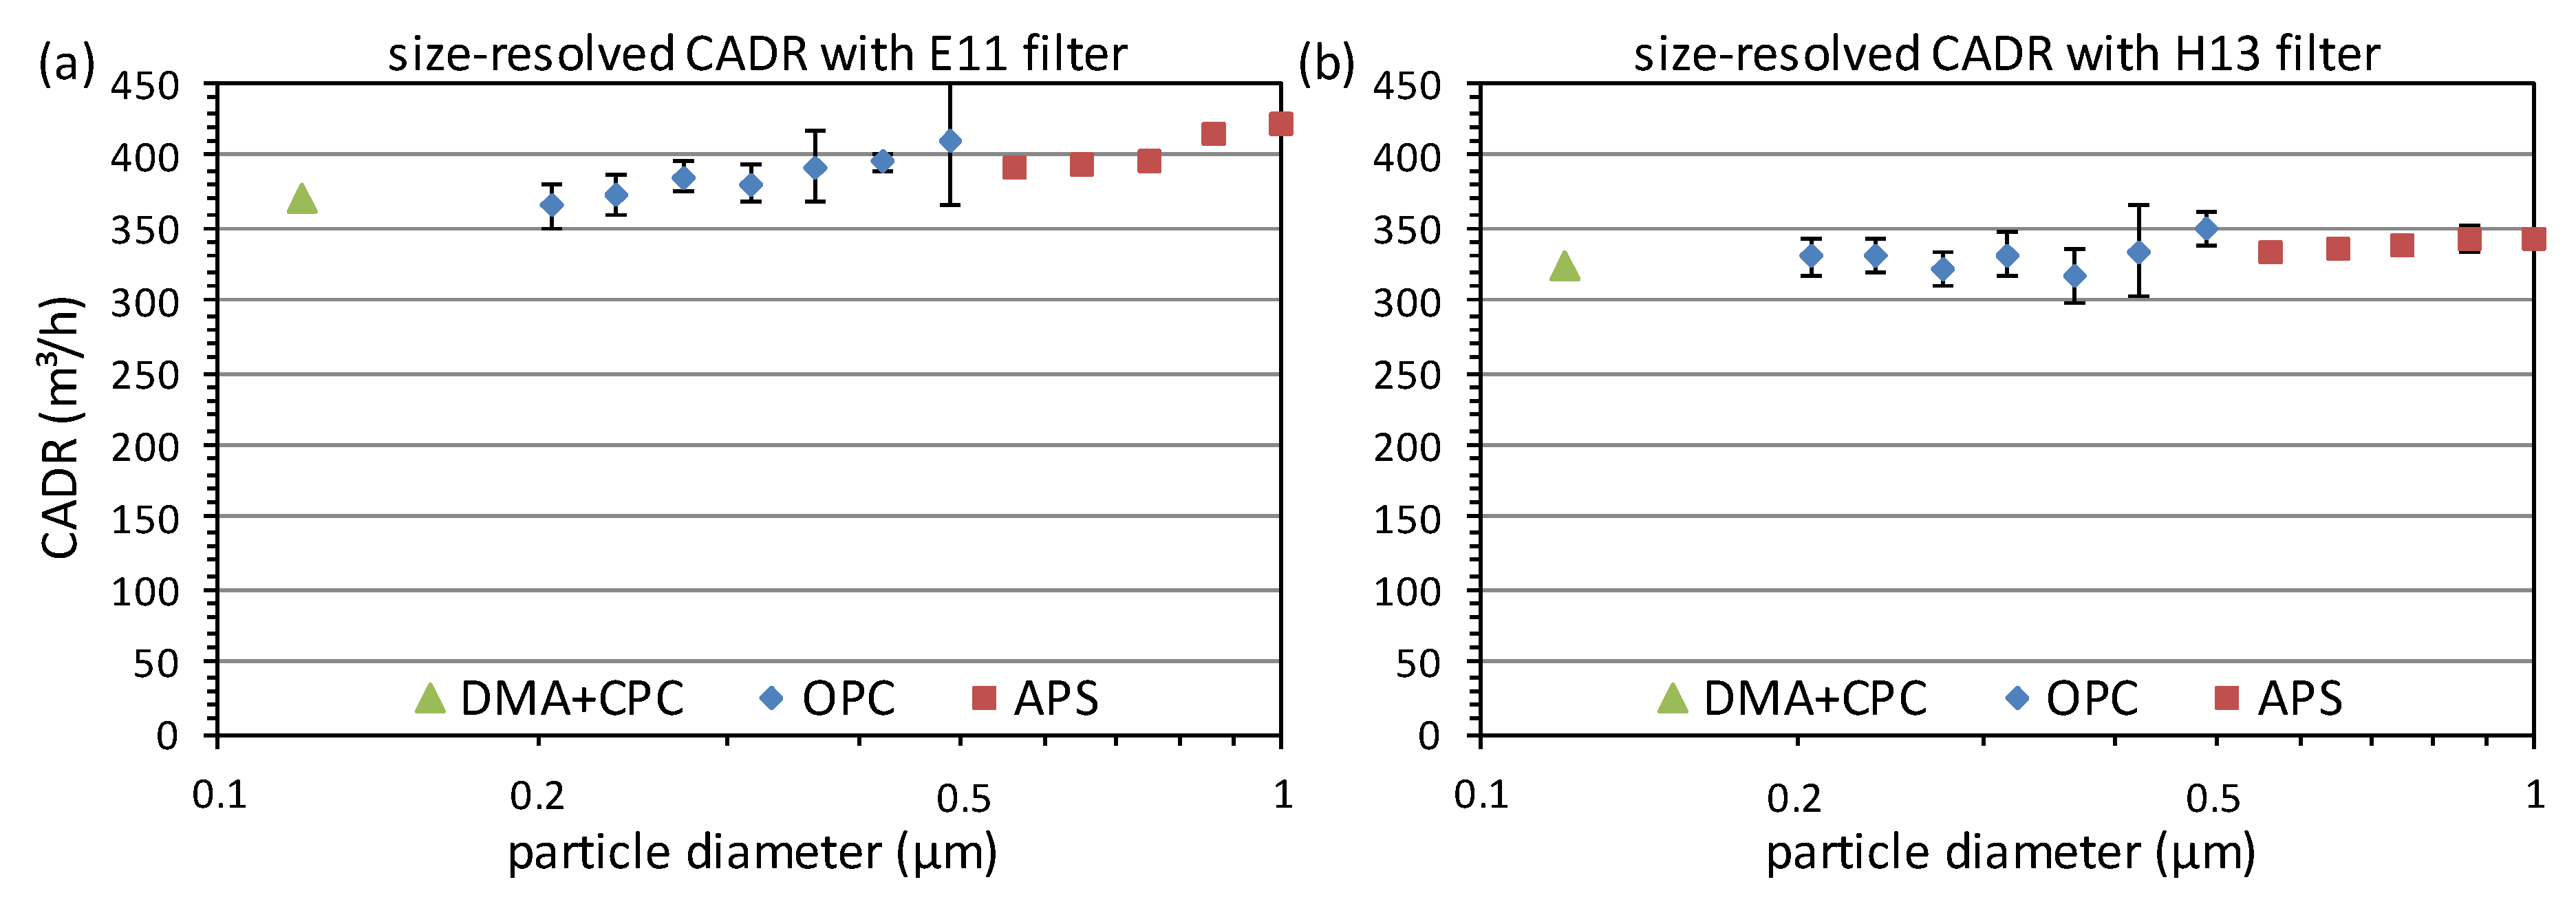
For similar reasons, it is neither recommended to retrofit existing air cleaners with high-efficiency filters, since the reduction in the flow rate due to the higher pressure drop typically exceeds the small gain in filtration efficiency. Eventually, the CADR may even decrease despite the higher filtration efficiency [50]. This is also visible in the example shown in Figure 5. Here, the same air cleaner was tested with paraffin for two different filters, which were of class E11 and H13 according to EN 1822 (information provided by the manufacturer). In both cases, the air cleaner was operated at the maximum possible flow rate. For the E11 filter, the CADR reaches its minimum of about 380 m³/h for the size of the individual viruses and increases to about 420 m³/h at 1 µm. We note that the relative increase in the CADR of about 10% is larger than the maximum expected 5% for an E11 filter with at least a 95% removal efficiency at the most penetrating particles size (MPPS). The reason for this is unclear but could be because the filter class specified by the filter manufacturer refers to a different flow rate than was used in the air cleaner. For the H13 filter, the CADR is reduced by about 50 m³/h over the whole size range, which can be attributed to a reduction in the flow due to the higher pressure drop. Consequently, the filter with the higher efficiency therefore even caused a reduction in the cleaning performance.
As a further argument, it is often stated that only the use of H13 or H14 filters ensures a sufficient long-term stability. It is true that the test according to EN 1822 or ISO 29463 requires a test of the discharged media for electret filters to ensure that the efficiency does not fall below the value determined in the standard test over time. However, the same already applies to filter classes E10 to E12 or filters tested according to ISO 16890. The use of H13/H14 filters is therefore a sufficient, but not a necessary criterion for excluding a rapid degradation in efficiency.
3.3. Effect of Aging with Cigarette Smoke
To address the change in performance under loading the filter with particles, eight commercially available air cleaners with comparable characteristics were chosen: all of them were typical household appliances of similar size (height between 0.40 m and 0.75 m) and similar cleaning performance (nominal CADR between 300 m³/h and 500 m³/h). They were equipped with either flat or cylindrical fibrous filters, for which the manufactures claimed filtration efficiencies of 99.9% or higher for different particle sizes. However, none of them referred to a testing standard that requires the discharging of the filters before measuring the filtration efficiency, such as EN 1822 or ISO 16890. Thus, it is probable that the high initial filtration efficiency is reached by the use of electrostatic effects. The aim was to investigate how far the appliances, which have a similar initial performance according to the manufacturers, differ after exposure to the same amount of cigarette smoke particles.
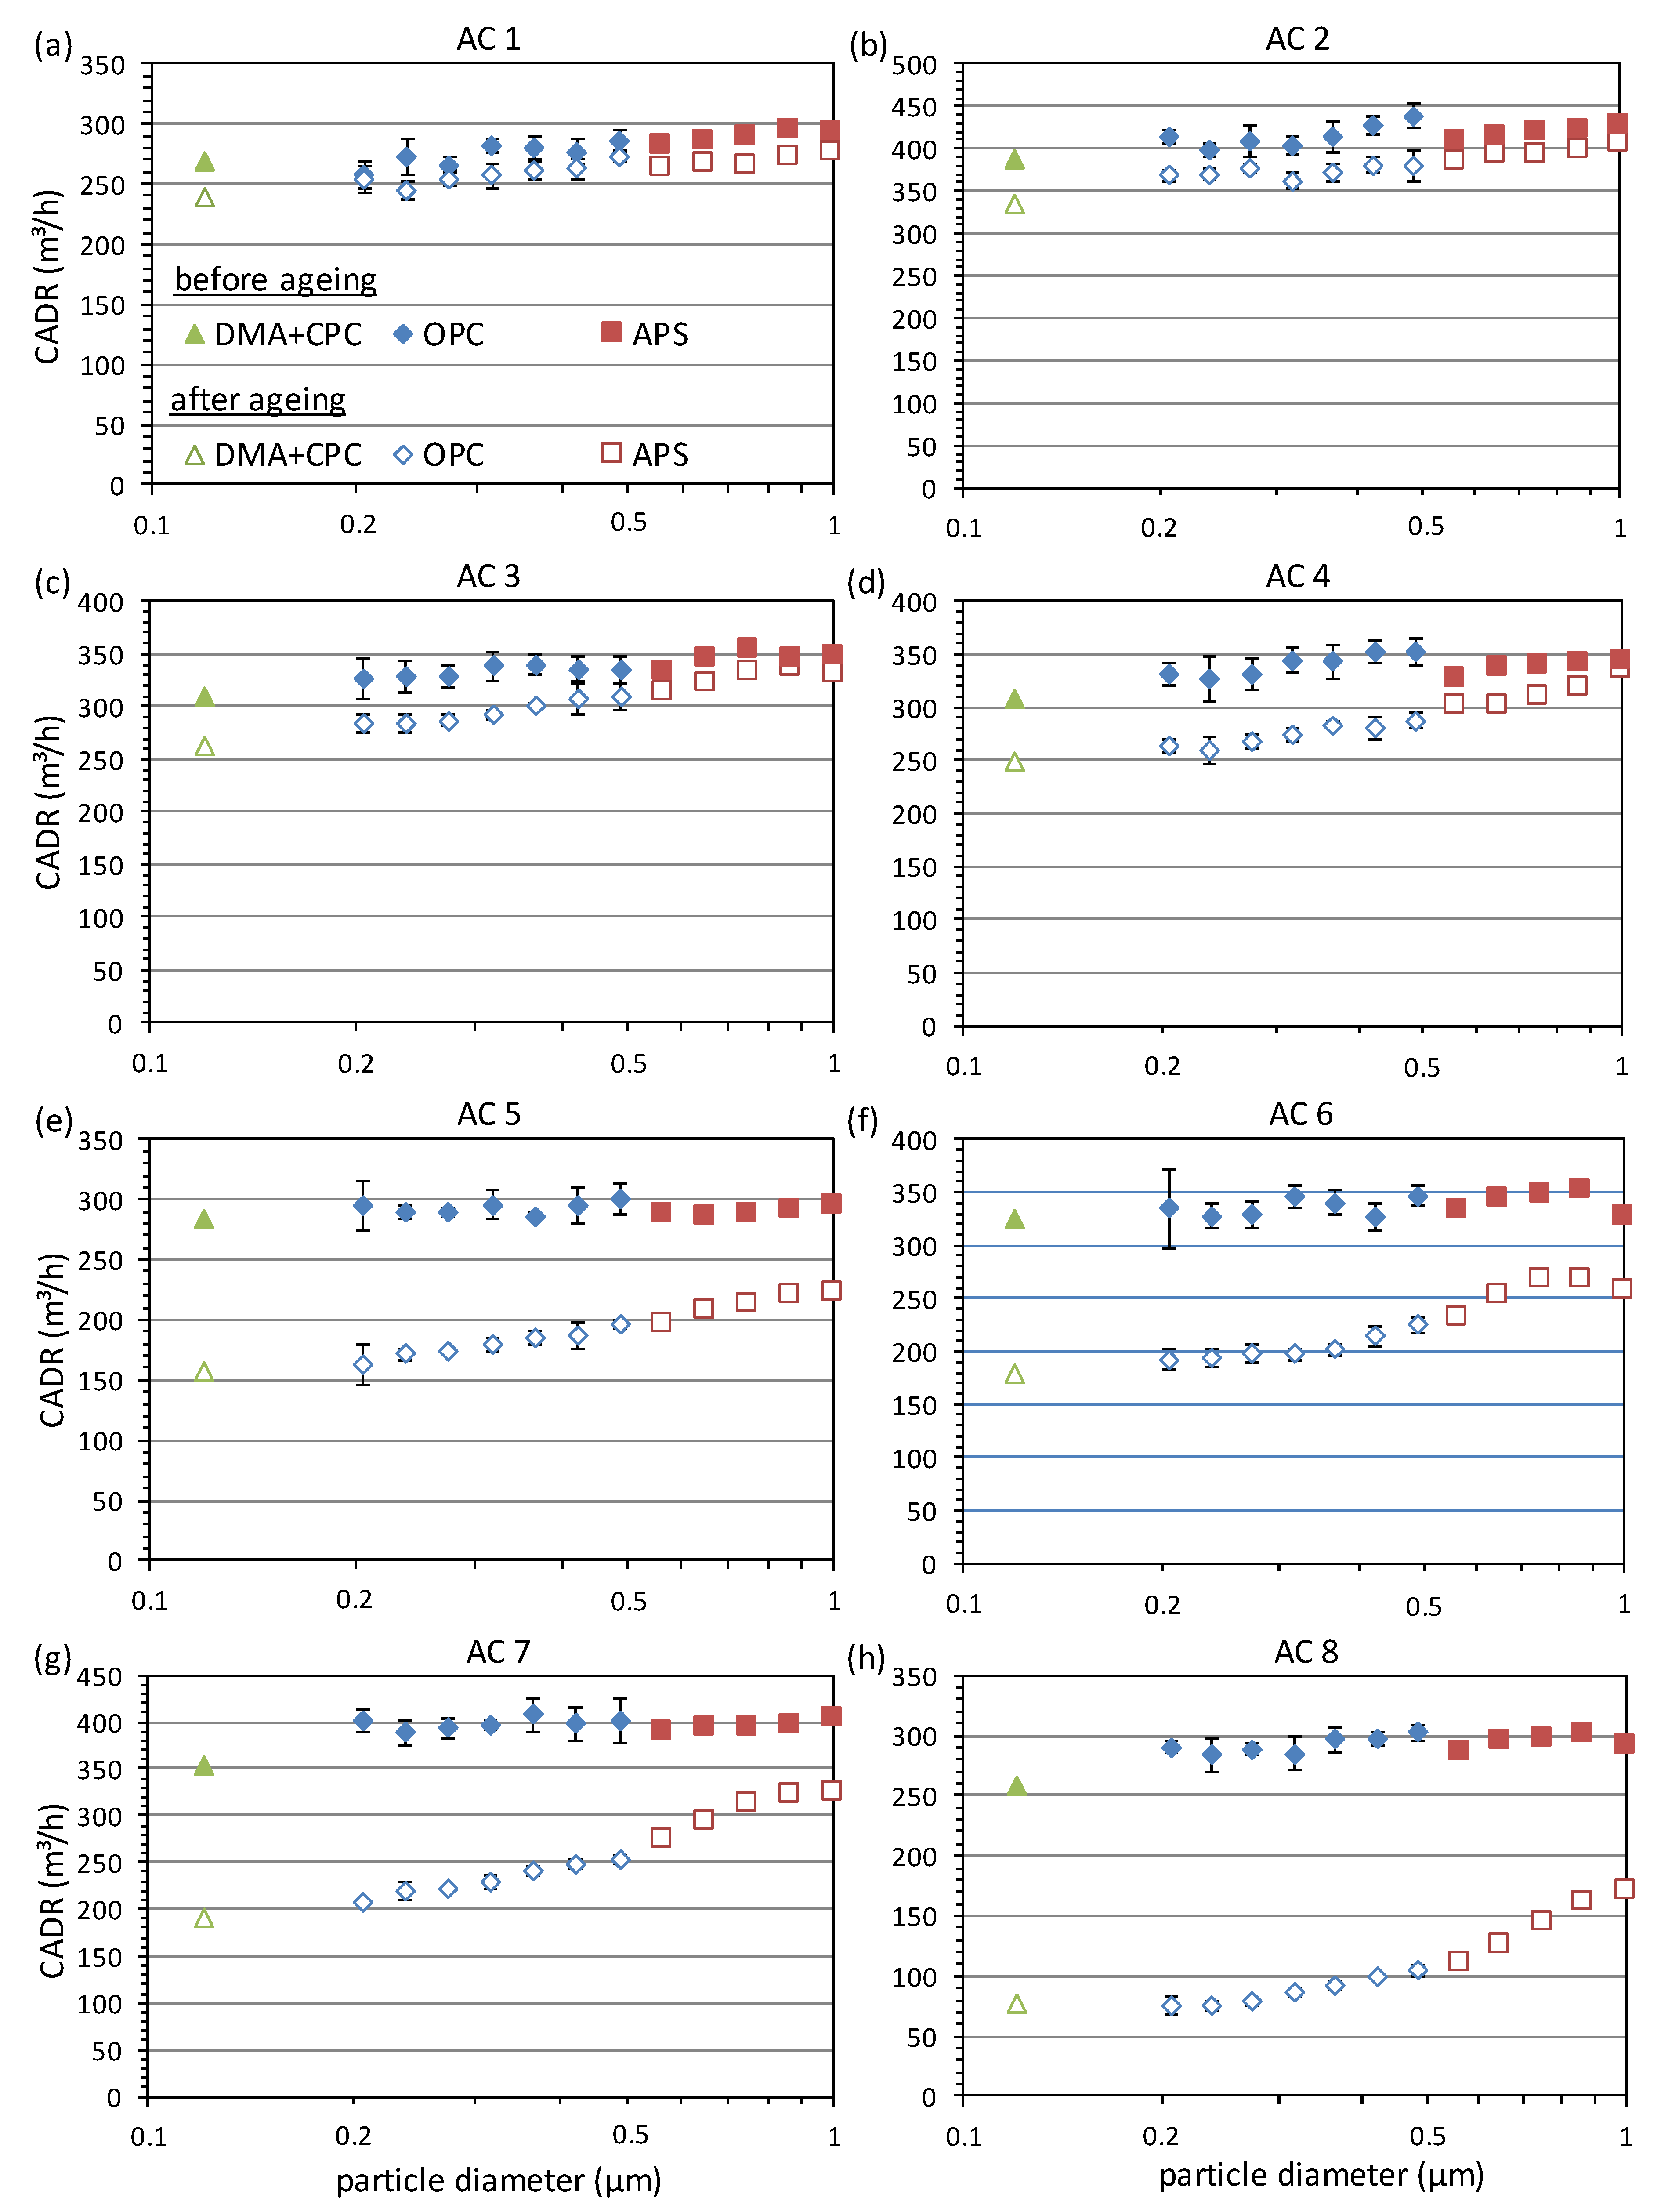
Therefore, first the CADR was tested with paraffin in the pristine state, as described in Section 2. The size-dependent CADR curves are shown as filled symbols in Figure 6. In the following, the air cleaners were exposed to the smoke of 100 cigarettes in a 3 m³ chamber according to the method described in Section 2. The emitted mass of particles was previously determined to be about 30 mg per cigarette by weighing of loaded filters. This corresponds to a total loading of each air cleaner with about 3000 mg cigarette smoke. According to GB/T 18801-2015, air cleaners that still have a CADR of at least 50% of the initial value after loading with 3000 mg cigarette smoke reach at least the lowest cumulative clean mass (CCM) category P1. To set this in relation to a realistic user scenario, the following estimation was made: The average indoor PM2.5 concentration in houses without strong particle sources and low outdoor air pollution is typically in the order of 10 µg/m³ [51]. Assuming this concentration, 8 h operation of the air cleaner per day at an average CADR of 350 m³/h leads to a loading with 3000 mg in about 3.5 months. We note that the real loading might extremely vary for different user scenarios, and the aging effect depends on the type of particles as well as the presence of additional gaseous pollutants. However, the estimation shows that the chosen amount of cigarettes is in a realistic range since manufacturers typically recommend exchanging the filters after several months.
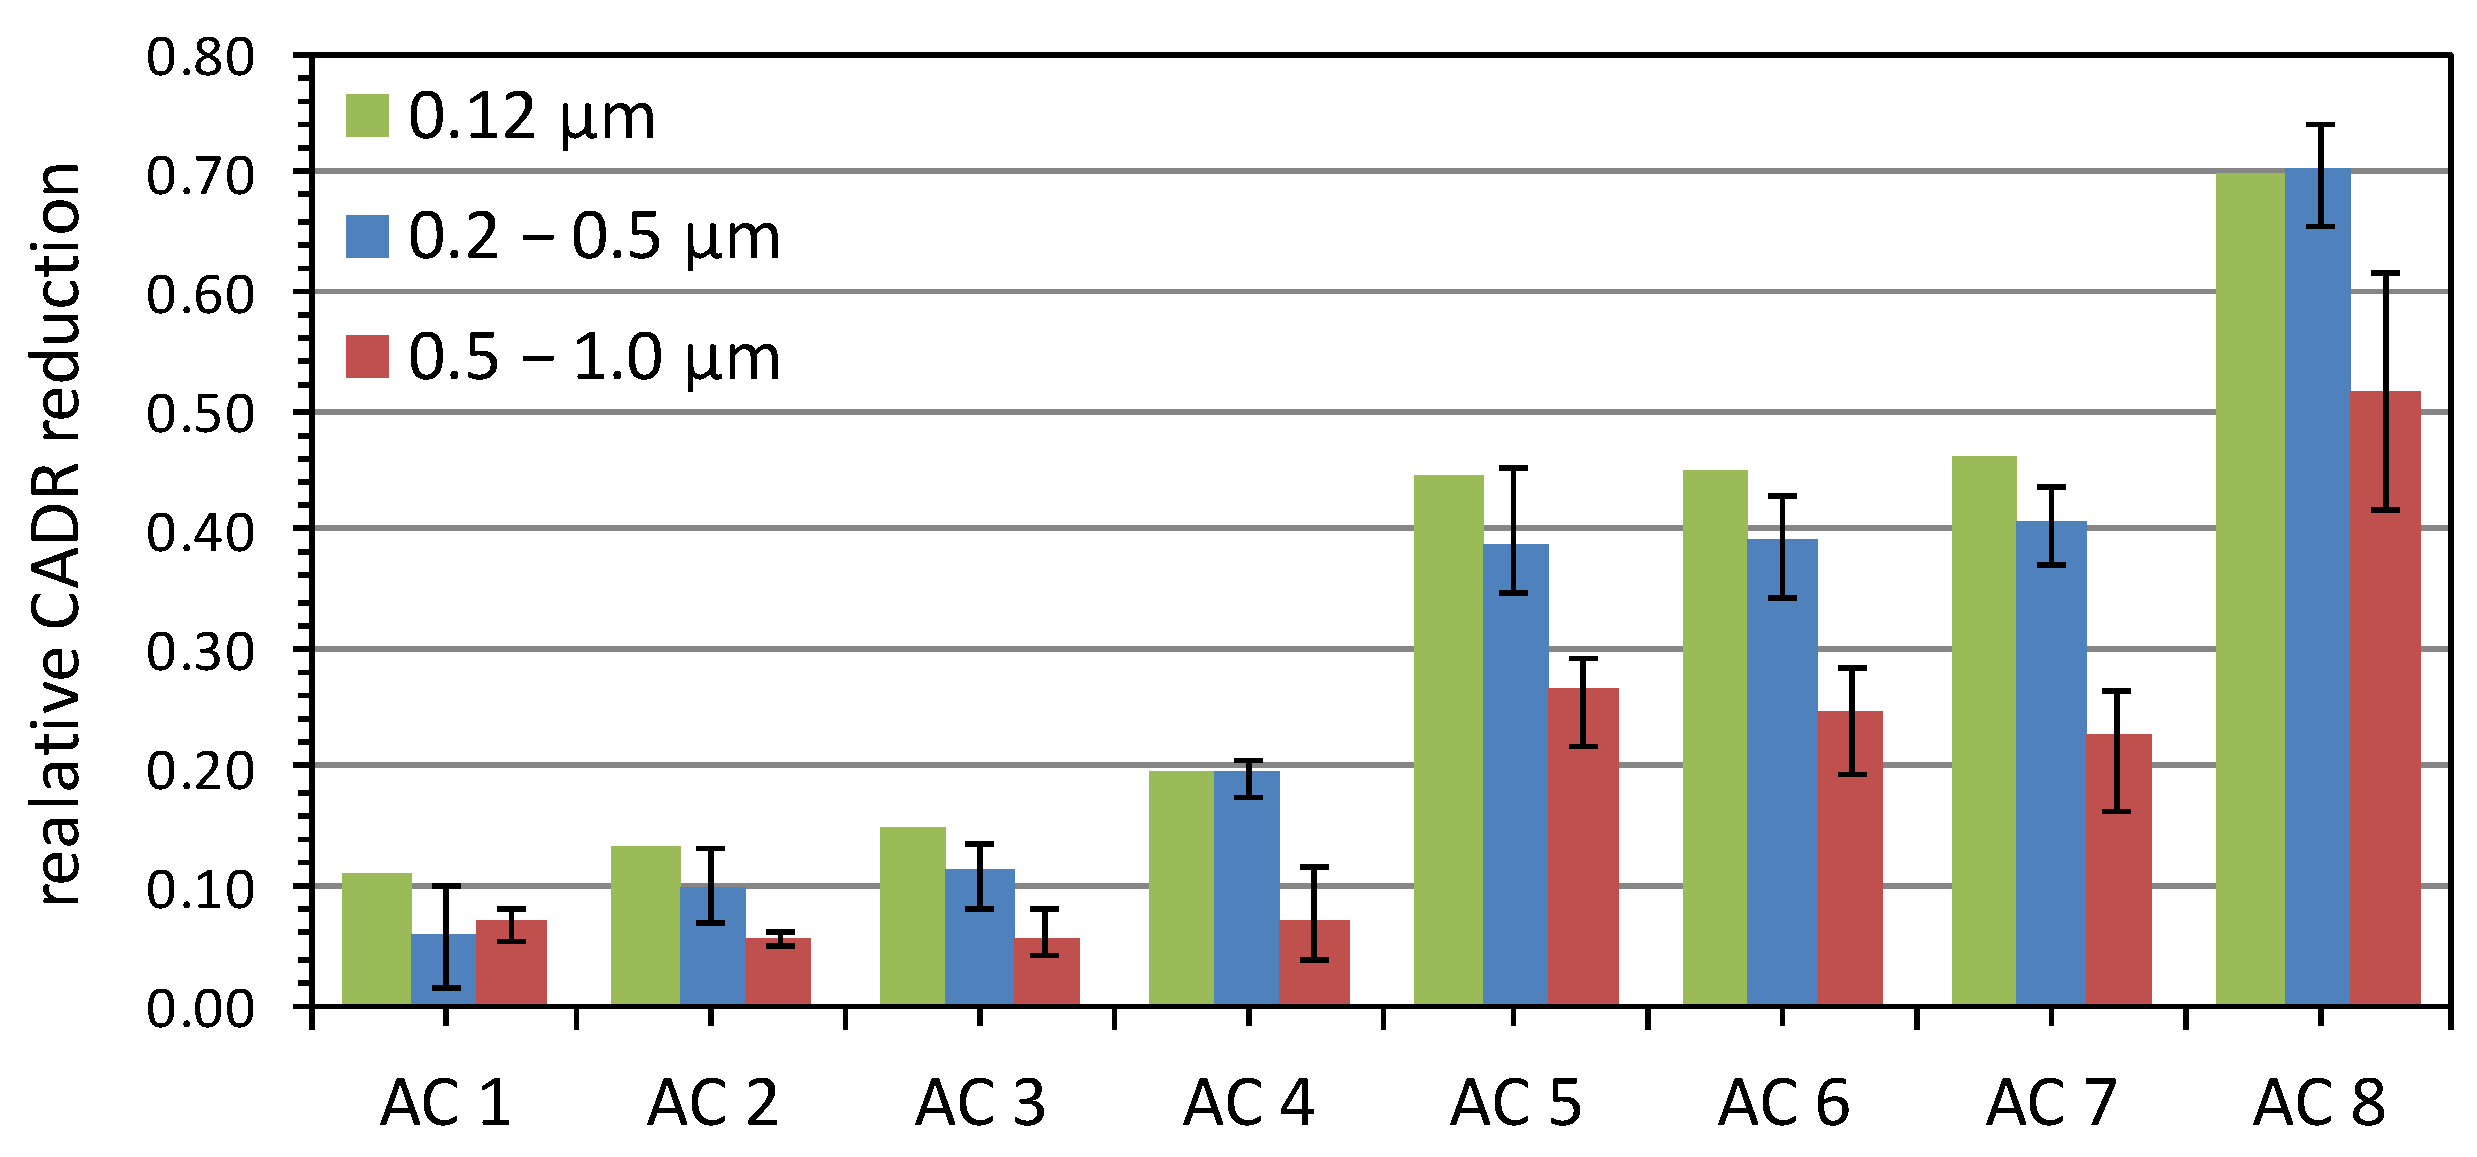
The CADR results after the aging with 100 cigarettes are shown as open symbols in Figure 6. The eight appliances were ordered by increasing aging effect. For the first two appliances in Figure 6a,b, the relative reduction in CADR is only around 10%, whereas it is considerably higher for the other appliances, up to about 70% for air cleaner 8 in Figure 6h. The average relative reduction of the CADR for the three different size ranges is summarized in Figure 7. The error bars represent the minimum and maximum relative reduction in the corresponding size range to indicate that the reduction is a continuous function of the particle size. The results show that the aging effect can differ by more than a factor of seven for the investigated commercial air cleaners.
The degradation of the CADR can in principle result from two effects. On the one hand, the flow rate can be reduced by an increase of the pressure drop while the filter is loaded with particles. On the other hand, the filtration efficiency can decrease by discharging for the electret filters. We argue that the effect on the flow rate is negligible here for two reasons: Firstly, it was previously shown for a similar air cleaner that the pressure drop increase is negligible even after loading with up to 400 cigarettes and the filtration efficiency approaches the same state as after discharging the filters with isopropyl alcohol (IPA) [30]. This is in line with other studies indicating the predominance of discharging compared to clogging for cigarette smoke [52,53,54]. Secondly, a reduced flow rate would lead in the first approximation to a reduction of the CADR independent of the particle size, whereas here we observe a strong size dependence, with the aging effect being more pronounced for the smallest particles. This is because, in this size range, the electrophoresis plays a dominant role compared to diffusion, interception, and impaction. Consequently, the discharging of the filter has a strong effect on the total efficiency. In contrast, for larger particles, the electrical mobility is reduced, whereas the contribution of interception and impaction increases, so that the discharging of the filter has a lower effect. This shows that the current testing standards considering only particles >0.3 µm underestimate the overall aging effect by neglecting the smaller particles. Those are, on the one hand, more relevant for the far-field transmission of infections, and, on the other hand, known to be associated with higher negative health impacts in general [55].
4. Modeling of Different Scenarios
The effect of an air cleaner can be described within the framework of a simple balance model [56]. An essential prerequisite is the assumption that the room air is ideally mixed. For typical volumes and geometries of inhabited rooms and the time scales of minutes to hours considered here, this assumption is usually justified to a good approximation [57,58]. Especially the steady air mixing by the air cleaner itself ensures a strong homogenization and makes the formation of extensive stagnation zones unlikely [59]. However, this approximation might not apply in the immediate vicinity of an aerosol source. Mathematically, the model can be described by an inhomogeneous linear differential equation of the first order:
Here, denotes the particle concentration in a room with volume as a function of time . It can be expressed in different metrics, such as number, surface area, or mass. In the following, we focus on a number-based approach, which is most relevant for estimating, e.g., infection risks. The temporal change of the concentration is proportional to the different sink and source terms. The sources are summarized as , which has the dimension of a rate and thus indicates how many particles or viruses are emitted in a given unit of time. Sources can generally be either located indoors (e.g., cooking, candles, smoking, resuspension, etc.) or result from the infiltration of particles from outdoors. In the context of modeling infection risks, we understand the source to be the exhalation of virus-laden droplets by an infectious person. We assume that the rate at which droplets are emitted is constant on the relevant time scales. This is certainly true for particles emitted almost continuously during normal breathing (leaving aside the inhalation–exhalation cycle) or sustained talking or singing. However, for discrete events, such as coughing or sneezing, the model reaches its limits.
In addition to the source terms, there are sink terms that lead to a reduction of the particle concentration over time. Those are summarized in a decay rate , which can consist of different individual contributions:
- The particle concentration can be reduced due to natural deposition, mainly caused by diffusion, sedimentation, electrophoresis, or thermophoresis. Those factors are summarized in the decay rate . In a number-based metric, agglomeration can also contribute to the decay rate, but it is rather negligible at typical indoor concentrations.
- For the case of microbiological particles such as viruses, natural inactivation over time can occur. This is expressed by the decay rate .
- There can be a venting rate caused by the unintended leakage of the room, intended opening of a window, or operation of an HVAC system.
- If an air cleaner is present, it causes an additional decay rate , which is related to the CADR via
In contrast to the source terms, which are independent of the concentration in the room, the sink is always proportional to the current concentration . In the following, Equation (2) will be solved for a typical scenario with an infectious person continuously emitting virus-laden droplets at a constant rate. Additionally, an initial concentration is assumed. As the general solution of the differential equation, we get
The equation shows that the concentration starting from the initial value asymptotically approaches a steady state concentration
for . The steady state concentration is proportional to the source strength , and inversely proportional to the volume and the decay rate . It is noteworthy that for the exclusive operation of an air cleaner, cancels out in Equation (5), meaning that the equilibrium concentration is independent of the room volume.
For another person in the room inhaling the virus-laden droplets with a respiratory rate , the inhaled dose can be calculated as
assuming that all droplets are deposited in the respiratory tract. Thus, the dose is essentially proportional to the equilibrium concentration , the inhaled flow rate , and the residence time in the room. The second summand takes into account that the concentration initially differs from the equilibrium concentration. It becomes insignificant for . Additionally, the dose already inhaled at has to be added.
Equations (4) and (6) contain all the necessary information. By inserting the room volume, source strength, and decay rates, the concentration and dose can be calculated for any scenario. However, for the sake of illustration, a special case shall be discussed here. For this purpose, we consider a room with a volume of 40 m³, representing a typical living room (16 m² floor area with 2.50 m ceiling height). At least two persons—one infectious and one susceptible—occupy the room. It is assumed that the susceptible person inhales 9 l air per minute, which is an average value for low activities such as breathing while sitting, standing, or talking [60]. As reference scenario, we assume three natural sinks:
- The limited lifetime of airborne SARS-CoV-2 with a half-life of approximately 1.1 h [61]. This corresponds to a decay rate of kinac = ln(2)/1.1 h = 0.6 h−1.
- A leak rate of 0.5 h−1 through windows, doors, and other openings, which is a typical value for European houses [62].
- The natural deposition of particles, which the testing standards GB/T 18801-2015 and ANSI/AHAM AC-1-2020 assume as 0.2 h−l in the submicron size range.
These three contributions sum up to a natural reduction rate of 1.3 h−1. The source strength is the most complicated factor to estimate, as the emission rate of exhaled viruses can strongly depend on the type of virus, the personal disposition of the infectious person, and the course of the disease. As an example, we use a value from a study investigating COVID-19 patients shortly before discharge from the hospital showing comparably low virus emission rates of about 1000 viruses per minute [63]. It has been reported that there are individuals—so-called superemitters—who exhale up to 100,000 viruses per minute, or even more in individual cases, especially in the early stages of the disease [10]. Moreover, the value can constantly change with the occurrence of new variants of the virus. However, the source strength only has influence on the absolute concentrations and does not influence the relative comparison between different scenarios.
We compare the reference scenario with only natural decay factors to two situations with the additional mitigation measures: First, the group of people opens a window every 20 min for 5 min, which was a typical recommendation during the pandemic. It is assumed that the venting causes four air changes per hour (ACH). This means that the venting shall work as efficiently as it is often required for air cleaners (see, e.g., VDI-EE 4300 Blatt 14). In a second scenario, we additionally assume the continuous operation of an air cleaner with the same effective air exchange rate of 4 ACH. For the 40 m³ room, this corresponds to a CADR of 160 m³/h. Table 1 summarizes all parameters used for the modeling.
Figure 8a shows the corresponding concentration curves for the different scenarios. Without any mitigation measures, the concentration of airborne viruses reaches a relatively high stable concentration of around 1100 m−3, determined by the natural deposition and inactivation factors. This leads to the largest inhaled dose of about 780 viruses at the end of the scenario. By opening the windows every 20 min for 5 min, the concentration follows a sawtooth profile that finally oscillates between about 560 m−3 and 710 m−3. After 120 min, the inhaled dose reaches a final value of about 550 viruses, which is about 30% lower than in the scenario without venting. Additional operation of the air cleaner leads to an even lower stable state concentration at around 280 m−3. The additional opening of the window leads only to a small further temporary reduction of the concentration to a minimum of about 200 m−3. In this scenario, the inhaled concentration at the end is about 240 viruses, which about 70% lower than in the scenario without mitigation measures. We note that Curtius et al. found a similar range for the reduction of the inhaled dose of viruses by the additional operation of an air cleaner also in scenarios based on different assumptions [17].
To estimate the effect on the risk for an infection, the minimum number of viruses that must be inhaled to trigger an infection is the most important factor. It is expressed by the ID50 value, which indicates the number of virus particles at which there is a 50% probability of an infection occurring. This parameter is not yet known in detail for SARS-CoV-2, in particular because controlled studies with volunteers are not possible due to the lack of treatment options for the infection. However, current studies suggest values of approximately 200 to 1500 virus particles required to cause infection with 50% probability [64,65]. This is also within the range of the better-studied value of 280 for SARS-CoV-1 [66].
Although the details of the model rely on many assumptions and should be considered with care, the following conclusions can be drawn: For the case of a relatively low emission rate of 1000 viruses per minute, the operation of an adequately sized air cleaner can potentially push the dose below the ID50 value. However, for higher emission rates due to increased breathing, personal disposition, multiple infectious individuals, or prolonged dwell times, it can be quickly exceeded. If there is a superemitter in the room that emits much higher concentrations, even a large-dimension air cleaner will not help to push the concentrations into the targeted range. Consequently, air cleaners can never serve as the sole protective measure but make substantial contribution to reducing the risk of infection.
5. Conclusions
It was shown that air cleaners with fibrous and ESP filters are generally capable of removing individual viruses and virus-laden droplets from the air. The cleaning efficacy can be tested with both KCl particles and paraffin droplets as surrogates for viruses. The combination of different measurement techniques allows a size-dependent determination of the CADR. In the size range around individual viruses, both test aerosols are suitable, while in the intermediate size range from 0.2 µm to 0.5 µm, the counting statistics are better for paraffin than for KCl, as it can be generated in higher concentrations in the same amount of time. For the larger particles from 0.5 µm to 1.0 µm, KCl is more suitable, since the solid particles do not show measurement artifacts that occur for liquid paraffin droplets.
The decisive measure for evaluating the cleaning efficacy is not the filter efficiency, but the CADR as product of the filter efficiency and flow rate. Consequently, the use of highly efficient H13 or H14 filters in air cleaners is not advantageous. The increased pressure drop can either reduce the flow rate or increase the power consumption and noise without a positive influence on the cleaning efficacy. We have shown for air cleaners with electret filters that the reduction in the CADR after aging with the smoke of 100 cigarettes can differ by more than a factor of seven depending on the charge stability of the filters. Thus, it is crucial to provide the consumer information on the long-term stability of the air cleaner, which is only exceptionally the case up to now. The optimal choice of an air cleaner for a given scenario should thus not only take into consideration the CADR, but also factors such as the power consumption, long-term stability of the filter, and noise emissions. For larger rooms, it may be favorable to use two smaller devices rather than a single larger one.
Modeling of different scenarios, including natural venting and an air cleaner, shows that the combination of both leads to the highest reduction of the inhaled concentration of viruses. The largest benefit of the air cleaner compared to natural venting is that it can be operated continuously, independent of the weather conditions (heat, frost, rain, or wind) and potential street noise. Furthermore, it is also effective in removing pollutants that penetrate from the outside, such as traffic-related particles or pollen. On the other side, the venting prohibits the accumulation of CO2 and other gases from indoor sources in the room, which cannot be achieved by the exclusive operation of an air cleaner. An alternative that combines both advantages are ventilation systems which supply filtered fresh air, which are, however, rare in existing buildings and can be retrofitted only with large effort and costs compared to the installation of a mobile air cleaner. Thus, a well thought-through combination of natural venting and a mobile air cleaner is a meaningful contribution to minimizing infection risks, and its efficacy can be tested using the methods presented here.
Author Contributions
Conceptualization, S.S.; methodology, S.S. and K.S.; validation, S.S. and K.S.; formal analysis, S.S.; investigation, A.C. and A.B.S.; writing—original draft preparation, S.S.; writing—review and editing, K.S. and C.A.; visualization, S.S.; supervision, C.A. All authors have read and agreed to the published version of the manuscript.
Funding
This research received no external funding.
Data Availability Statement
Not applicable.
Acknowledgments
The authors acknowledge ProActiveAir GmbH for providing the ESP air cleaner used for illustrating the comparison between the two test aerosols. Hauser Umwelt-Service GmbH is acknowledged for providing the air cleaner with E11 and H13 filters. To avoid a ranking of commercial products, the air cleaners used for the aging tests are presented anonymously.
Conflicts of Interest
The authors declare no conflict of interest.
References
- Stelzer-Braid, S.; Oliver, B.G.; Blazey, A.J.; Argent, E.; Newsome, T.P.; Rawlinson, W.D.; Tovey, E.R. Exhalation of respiratory viruses by breathing, coughing, and talking. J. Med. Virol. 2009, 81, 1674–1679. [Google Scholar] [CrossRef] [PubMed]
- Papineni, R.S.; Rosenthal, F.S. The size distribution of droplets in the exhaled breath of healthy human subjects. J. Aerosol Med. 1997, 10, 105–116. [Google Scholar] [CrossRef] [PubMed]
- Xie, X.; Li, Y.S.H.; Liu, L. Exhaled droplets due to talking and coughing. J. R. Soc. Interface 2009, 6, 703–714. [Google Scholar] [CrossRef]
- Han, Z.Y.; Weng, W.G.; Huang, Q.Y. Characterizations of particle size distribution of the droplets exhaled by sneeze. J. R. Soc. Interface 2013, 10, 20130560. [Google Scholar] [CrossRef] [PubMed]
- Position Paper of the Gesellschaft für Aerosolforschung on Understanding the Role of Aerosol Particles in SARS-CoV-2 Infection. Available online: https://www.info.gaef.de/position-paper (accessed on 30 August 2022).
- Asadi, S.; Wexler, A.; Barreda, C.C.S.; Bouvier, N.; Ristenpart, W. Aerosol emission and superemission during human speech increase with voice loudness. Sci. Rep. 2019, 9, 2348. [Google Scholar] [CrossRef]
- Haslbeck, K.; Schwarz, K.; Hohlfeld, J.; Seume, J.; Koch, W. Submicron droplet formation in the human lung. J. Aerosol Sci. 2010, 41, 429–438. [Google Scholar] [CrossRef]
- Schwarz, K.; Biller, H.; Windt, H.; Koch, W.; Hohlfeld, J. Characterization of exhaled particles from the healthy human lung-a systematic analysis in relation to pulmonary function variables. J. Aerosol Med. Pulm. Drug Deliv. 2010, 23, 371–379. [Google Scholar] [CrossRef]
- Scheuch, G. Breathing is enough: For the spread of influenza virus and SARS-CoV-2 by breathing only. J. Aerosol Med. Pulm. Drug Deliv. 2020, 33, 230–234. [Google Scholar] [CrossRef]
- Ma, J.; Qi, X.; Chen, H.; Li, X.; Zhang, Z.; Wang, H.; Sun, L.; Zhang, L.; Guo, J.; Morawska, L.; et al. Coronavirus Disease 2019 Patients in Earlier Stages Exhaled Millions of Severe Acute Respiratory Syndrome Coronavirus 2 Per Hour. Clin. Infect. Dis. 2021, 72, e652–e654. [Google Scholar] [CrossRef]
- Wells, W. On Air-borne Infection. Study II. Droplets and Droplet Nuclei. Am. J. Hyg. 1934, 20, 611–618. [Google Scholar]
- Parienta, D.; Morawska, L.; Johnson, G.; Ristovski, Z.; Hargreaves, M.; Mengersen, K.; Corbett, S.; Chao, C.; Li, Y.; Katoshevski, D. Theoretical analysis of the motion and evaporation of exhaled respiratory droplets of mixed composition. J. Aerosol Sci. 2011, 42, 1–10. [Google Scholar] [CrossRef] [Green Version]
- Marr, L.; Tang, J.; van Mullekom, J.; Lakdawala, S. Mechanistic insights into the effect of humidity on airborne influenza virus survival, transmission and incidence. J. R. Soc. Interface 2019, 16, 20180298. [Google Scholar] [CrossRef] [PubMed]
- Nordsiek, F.; Bodenschatz, E.; Bagheri, G. Risk assessment for airborne disease transmission by poly-pathogen aerosols. PLoS ONE 2020, 16, e0248004. [Google Scholar] [CrossRef] [PubMed]
- Nazaroff, W.W. Indoor aerosol science aspects of SARS-CoV-2 transmission. Indoor Air 2022, 32, e12970. [Google Scholar] [CrossRef] [PubMed]
- Morawska, L.; Tang, J.; Bahnfleth, W.; Bluyssen, P.; Boerstra, A.; Buonanno, G.; Cao, J.; Dancer, S.; Floto, A.; Franchimon, F.; et al. How can airborne transmission of COVID-19 indoors be minimised? Environ. Int. 2020, 142, 105832. [Google Scholar] [CrossRef]
- Curtius, J.; Granzin, M.; Schrod, J. Testing mobile air purifiers in a school classroom: Reducing the airborne transmission risk for SARS-CoV-2. Aerosol Sci. Technol. 2021, 55, 586–599. [Google Scholar] [CrossRef]
- Ciuzas, D.; Prasauskas, T.; Krugly, E.; Jurelionis, A.; Seduikyte, L.; Martucevicius, D. Indoor air quality management by combined ventilation and air cleaning: An experimental study. Aerosol Air Qual. Res. 2016, 16, 2550–2559. [Google Scholar] [CrossRef]
- Wang, C.; Otani, Y. Removal of nanoparticles from gas streams by fibrous filters: A review. Ind. Eng. Chem. Res. 2013, 52, 5–17. [Google Scholar] [CrossRef]
- Todea, A.; Schmidt, F.; Schuldt, T.; Asbach, C. Development of a method to determine the fractional efficiency of full scale HVAC and HEPA filter cassettes for nanoparticles >3.5 nm. Atmosphere 2020, 11, 1191. [Google Scholar] [CrossRef]
- Wang, S.-C. Electrostatic forces in fibrous filters—A review. Powder Technol. 2001, 118, 166–170. [Google Scholar] [CrossRef]
- Thakur, R.; Da, D.; Das, A. Electret Air Filters. Sep. Purif. Rev. 2013, 42, 87–129. [Google Scholar] [CrossRef]
- Walsh, D.C.; Stenhouse, J.I.T. Clogging of an electrically active fibrous filter material: Experimental results and two-dimensional simulations. Powder Technol. 1997, 93, 63–75. [Google Scholar] [CrossRef]
- Ji, J.H.; Bae, G.N.; Kang, S.H.; Hwang, J. Effect of particle loading on the collection performance of an electret cabin air filter for submicron aerosols. J. Aerosol. Sci. 2003, 34, 1493–1504. [Google Scholar] [CrossRef]
- Choi, H.J.; Park, E.S.; Kim, J.U.; Kim, S.H.; Lee, M.H. Experimental study on charge decay of electret filter due to organic solvent exposure. Aerosol Sci. Technol. 2015, 49, 977–983. [Google Scholar] [CrossRef]
- Kerner, M.; Schmidt, K.; Schumacher, S.; Asbach, C.; Antonyuk, S. Electret filters—from the influence of discharging methods to optimization potential. Atmosphere 2021, 12, 65. [Google Scholar] [CrossRef]
- Motyl, E.; Lowkis, B. Effect of air humidity on charge decay and lifetime of PP electret nonwovens. Fibres Text. East. Eur. 2006, 14, 39–42. [Google Scholar]
- Wang, Y.; Lin, Z.; Zhang, W. Comparison of effects of particle charging, media characteristics, humidity and aerosols on loading performance of electret media. Build. Environ. 2020, 179, 106962. [Google Scholar] [CrossRef]
- Finger, H.; Schneiderwind, U.; Asbach, C. Bewertung mobiler Raumluftreinigungsgeräte. Gefahrst.–Reinh. Luft 2015, 75, 497. [Google Scholar]
- Schumacher, S.; Spiegelhoff, D.; Schneiderwind, U.; Finger, H.; Asbach, C. Performance of new and artificially aged electret filters in indoor air cleaners. Chem. Eng. Technol. 2018, 41, 27–34. [Google Scholar] [CrossRef]
- Afshari, A.; Ekberg, L.; Forejt, L.; Mo, J.; Rahimi, S.; Siegel, J.; Chen, W.; Wargocki, P.; Zuraimi, S.; Zhang, J. Electrostatic precipitators as an indoor air cleaner—A literature review. Sustainability 2020, 12, 8774. [Google Scholar] [CrossRef]
- Sahu, S.K.; Tiwari, M.; Bhangare, R.C.; Pandit, G.G. Particle size distribution of mainstream and exhaled cigarette smoke and predictive deposition in human respiratory tract. Aerosol Air Qual. Res. 2013, 13, 324–332. [Google Scholar] [CrossRef]
- Kaniyala Melanthota, S.; Banik, S.; Chakraborty, I.; Pallen, S.; Gopal, D.; Chakrabarti, S.; Mazumder, S. Elucidating the microscopic and computational techniques to study the structure and pathology of SARS-CoVs. Micros. Res. Tech. 2020, 83, 1623–1638. [Google Scholar] [CrossRef] [PubMed]
- O’Leary, V.B.; Dolly, O.J.; Höschl, C.; Černa, M.; Ovsepian, S.V. Unpacking pandora from its box: Deciphering the molecular basis of the SARS-CoV-2 coronavirus. Int. J. Mol. Sci. 2020, 22, 386. [Google Scholar] [CrossRef]
- Forsyth, B.; Liu, B.Y.; Romay, F.J. Particle charge distribution measurement for commonly generated laboratory aerosols. Aerosol Sci. Technol. 1998, 28, 489–501. [Google Scholar] [CrossRef]
- Tsai, C.J.; Lin, J.S.; Deshpande, C.G.; Liu, L.C. Electrostatic charge measurement and charge neutralization of fine aerosol particles during the generation process. Part. Part. Syst. Charact. 2005, 22, 293–298. [Google Scholar] [CrossRef]
- Wallner, P.; Kundi, M.; Panny, M.; Tappler, P.; Hutter, H.P. Exposure to air ions in indoor environments: Experimental study with healthy adults. Int. J. Environ. Res. Public Health 2015, 12, 14301–14311. [Google Scholar] [CrossRef]
- Liu, B.Y.; Pui, D.Y. Electrical neutralization of aerosols. J. Aerosol Sci. 1974, 5, 465–472. [Google Scholar] [CrossRef]
- Schumacher, S.; Jasti, R.; Kerner, M.; Antonyuk, S.; Asbach, C. Ursachenanalyse zum Einfluss des Prüfaerosols auf die Abscheideeffizienz von Elektretfiltern. Gefahrst.–Reinh. Luft 2019, 79, 435–442. [Google Scholar] [CrossRef]
- Jaccard, G.; Djoko, D.T.; Korneliou, A.; Stabbert, R.; Belushkin, M.; Esposito, M. Mainstream smoke constituents and in vitro toxicity comparative analysis of 3R4F and 1R6F reference cigarettes. Toxicol. Rep. 2019, 6, 222–231. [Google Scholar] [CrossRef]
- Rengasamy, S.; Zhuang, Z.; Niezgoda, G.; Walbert, G.; Lawrence, R.; Boutin, B.; Hudnall, J.; Monagham, W.P.; Bergman, M.; Miller, C.; et al. A comparison of total inward leakage measured using sodium chloride (NaCl) and corn oil aerosol methods for air-purifying respirators. J. Occup. Environ. Hyg. 2018, 15, 616–627. [Google Scholar] [CrossRef]
- Schumacher, S.; Jasti, R.; Asbach, C. Einfluss von Entladungsmethode und Aerosolmaterial auf die Abscheideeffizienz von Elektretfiltern. Gefahrst. –Reinh. Luft 2018, 78, 316–322. [Google Scholar]
- Rogak, S.; Flagan, R. Bipolar Diffusion Charging of Spheres and Agglomerate Aerosol Particles. J. Aerosol Sci. 1992, 23, 693–710. [Google Scholar] [CrossRef]
- Chen, B.T.; Cheng, Y.S.; Yeh, H.C. A study of density effect and droplet deformation in the TSI aerodynamic particle sizer. Aerosol Sci. Technol. 1990, 12, 278–285. [Google Scholar] [CrossRef]
- Baron, P.; Deye, G.J.; Martinez, A.B.; Jones, E.N.; Bennett, J.S. Size shifts in measurements of droplets with the aerodynamic particle sizer and the aerosizer. Aerosol Sci. Technol. 2008, 42, 201–209. [Google Scholar] [CrossRef]
- Volckens, J.; Peters, T.M. Counting and particle transmission efficiency of the aerodynamic particle sizer. J. Aerosol Sci. 2005, 36, 1400–1408. [Google Scholar] [CrossRef]
- Jeon, W.; Lee, B.; Yun, H.; Kim, J.; Kang, S.; Seo, Y. Characterization of pressure drop through two-stage particulate air filters. Sci. Technol. Built Environ. 2020, 26, 835–843. [Google Scholar] [CrossRef]
- Pei, J.; Dong, C.; Liu, J. Operating behavior and corresponding performance of portable air cleaners in residential buildings, China. Build. Environ. 2019, 147, 473–481. [Google Scholar] [CrossRef]
- Bluyssen, P.M.; Ortiz, M.; Zhang, D. The effect of a mobile HEPA filter system on ‘infectious’ aerosols, sound and air velocity in the SenseLab. Build. Environ. 2021, 188, 107475. [Google Scholar] [CrossRef]
- Kim, J.; Lee, M. Effect of filter collection efficiency on the clean air delivery rate in an air cleaner. Indoor Air 2021, 3, 745. [Google Scholar] [CrossRef]
- Wichmann, J.; Lind, T.; Nilsson, M.M.; Bellander, T. PM2.5, soot and NO2 indoor–outdoor relationships at homes, pre-schools and schools in Stockholm, Sweden. Atmos. Environ. 2010, 44, 4536–4544. [Google Scholar] [CrossRef]
- Lehtimäki, M.; Heinonen, K. Reliability of electret filters. Build. Environ. 1994, 29, 353–355. [Google Scholar] [CrossRef]
- Pei, J.; Dai, W.; Li, H.; Liu, J. Laboratory and field investigation of portable air cleaners’ long-term performance for particle removal. Build. Environ. 2020, 181, 107100. [Google Scholar] [CrossRef]
- Heo, K.J.; Lee, G.D.; Doh, S.J.; Jung, J.H. Effect of cigarette smoke on the lifetime of electret air filters. Sci. Total Environ. 2022, 807, 150754. [Google Scholar] [CrossRef]
- Ohlwein, S.; Kappeler, R.; Kutlar Joss, M.; Künzli, N.; Hoffmann, B. Health effects of ultrafine particles: A systematic literature review update of epidemiological evidence. Int. J. Public Health 2019, 64, 547–559. [Google Scholar] [CrossRef] [PubMed]
- Schumacher, S.; Schmid, H.-J.; Asbach, C. Effektivität von Luftreinigern zur Reduzierung des COVID-19-Infektionsrisikos. Gefahrst.–Reinh. Luft 2021, 81, 16–28. [Google Scholar] [CrossRef]
- Shaughnessy, R.J.; Sextro, R.G. What is an effective portable air cleaning device? A review. J. Occup. Environ. Hyg. 2006, 3, 169–181. [Google Scholar] [CrossRef]
- Küpper, M.; Asbach, C.; Schneiderwind, U.; Finger, H.; Spiegelhoff, D.; Schumacher, S. Testing of an indoor air cleaner for particulate pollutants under realistic conditions in an office room. Aerosol Air Qual. Res. 2019, 19, 1655–1665. [Google Scholar] [CrossRef]
- Szabadi, J.; Meyer, J.; Lehmann, M.; Dittler, A. Simultaneous temporal, spatial and size-resolved measurements of aerosol particles in closed indoor environments applying mobile filters in various use-cases. J. Aerosol Sci. 2022, 160, 105906. [Google Scholar] [CrossRef]
- Kriegel, M.; Buchholz, U.; Gastmeier, P.; Bischoff, P.; Abdelgawad, I.; Hartmann, A. Predicted infection risk for aerosol transmission of sars-COV-2. medRxiv 2020. [Google Scholar] [CrossRef]
- Van Doremalen, N.; Bushmaker, T.; Morris, D.H.; Holbrook, M.G.; Gamble, A.; Williamson, B.N.; Tamin, A.; Harcourt, J.L.; Thornburg, N.J.; Gerber, S.I.; et al. Aerosol and surface stability of SARS-CoV-2 as compared with SARS-CoV-1. N. Engl. J. Med. 2020, 382, 1564–1567. [Google Scholar] [CrossRef]
- Dimitroulopoulou, C. Ventilation in European dwellings: A review. Build. Environ. 2012, 47, 109–125. [Google Scholar] [CrossRef]
- Zhou, L.; Yao, M.; Zhang, X.; Hu, B.; Li, X.; Chen, H.; Zhang, L.; Liu, Y.; Sun, B.; Jiang, Y.; et al. Breath-, air-and surface-borne SARS-CoV-2 in hospitals. J. Aerosol Sci. 2021, 152, 105693. [Google Scholar] [CrossRef] [PubMed]
- Gale, P. Thermodynamic equilibrium dose-response models for MERS-CoV infection reveal a potential protective role of human lung mucus but not for SARS-CoV-2. Microb. Risk Anal. 2021, 16, 100140. [Google Scholar] [CrossRef] [PubMed]
- Prentiss, M.; Chu, A.; Berggren, K.K. Finding the infectious dose for COVID-19 by applying an airborne-transmission model to superspreader events. PLoS ONE 2022, 17, e0265816. [Google Scholar] [CrossRef] [PubMed]
- Watanabe, T.; Bartrand, T.A.; Weir, M.H.; Omura, T.; Haas, C.N. Development of a dose-response model for SARS coronavirus. Risk Anal. Int. J. 2010, 30, 1129–1138. [Google Scholar]
Figure 1.
Schematic of the CADR test chamber.

Figure 2.
Number size distributions of the KCl and paraffin test aerosols normalized to the total number concentration. The data were measured with an SMPS. Error bars indicate the standard deviation between five consecutive scans.
Figure 2.
Number size distributions of the KCl and paraffin test aerosols normalized to the total number concentration. The data were measured with an SMPS. Error bars indicate the standard deviation between five consecutive scans.

Figure 3.
Decay curves of two measurements with KCl (a,c,e) and paraffin (b,d,f) for three different particle sizes (top, middle, bottom) represented on a logarithmic concentration scale. The air cleaner (AC) was switched on after 30 min in both cases. Black lines are exponential regressions to the data in the exponential decay regimes.

Figure 4.
Size-dependent CADR derived from the decay curves in Figure 3 with KCl particles (a) and paraffin droplets (b).
Figure 4.
Size-dependent CADR derived from the decay curves in Figure 3 with KCl particles (a) and paraffin droplets (b).

Figure 5.
Size-dependent CADR measured with paraffin for the same air cleaner with two different filters of classes E11 (a) and H13 (b).
Figure 5.
Size-dependent CADR measured with paraffin for the same air cleaner with two different filters of classes E11 (a) and H13 (b).

Figure 6.
Size-dependent CADR measured with paraffin for eight different air cleaners (AC) (a–h) before (filled symbols) and after (open symbols) exposure to the smoke of 100 cigarettes.
Figure 6.
Size-dependent CADR measured with paraffin for eight different air cleaners (AC) (a–h) before (filled symbols) and after (open symbols) exposure to the smoke of 100 cigarettes.

Figure 7.
Reduction of the initial CADR of eight different air cleaners (AC) for three different particle size ranges. Error bars indicate the minimum and maximum reduction in the respective size range.
Figure 7.
Reduction of the initial CADR of eight different air cleaners (AC) for three different particle size ranges. Error bars indicate the minimum and maximum reduction in the respective size range.

Figure 8.
Airborne concentration of viruses (a) and dose inhaled by a susceptible person (b) modeled for three different scenarios. The detailed assumptions are given in the text.
Figure 8.
Airborne concentration of viruses (a) and dose inhaled by a susceptible person (b) modeled for three different scenarios. The detailed assumptions are given in the text.


Table 1.
Parameters used for modeling the concentrations and inhaled doses in Figure 8.
Table 1.
Parameters used for modeling the concentrations and inhaled doses in Figure 8.
| Parameter | |||||||
|---|---|---|---|---|---|---|---|
| value | 1000 min−1 | 40 m³ | 0.2 h−1 | 0.6 h−1 | 0.5 / 4.5 h−1 * | 0.0 / 4.0 h−1 ** | 9 L/min |
* values without/with venting, ** values without/with air cleaner.
Publisher’s Note: MDPI stays neutral with regard to jurisdictional claims in published maps and institutional affiliations. |
© 2022 by the authors. Licensee MDPI, Basel, Switzerland. This article is an open access article distributed under the terms and conditions of the Creative Commons Attribution (CC BY) license (https://creativecommons.org/licenses/by/4.0/).
Share and Cite
MDPI and ACS Style
Schumacher, S.; Banda Sanchez, A.; Caspari, A.; Staack, K.; Asbach, C. Testing Filter-Based Air Cleaners with Surrogate Particles for Viruses and Exhaled Droplets. Atmosphere 2022, 13, 1538. https://doi.org/10.3390/atmos13101538
AMA Style
Schumacher S, Banda Sanchez A, Caspari A, Staack K, Asbach C. Testing Filter-Based Air Cleaners with Surrogate Particles for Viruses and Exhaled Droplets. Atmosphere. 2022; 13(10):1538. https://doi.org/10.3390/atmos13101538
Chicago/Turabian StyleSchumacher, Stefan, Arantxa Banda Sanchez, Anna Caspari, Katharina Staack, and Christof Asbach. 2022. "Testing Filter-Based Air Cleaners with Surrogate Particles for Viruses and Exhaled Droplets" Atmosphere 13, no. 10: 1538. https://doi.org/10.3390/atmos13101538
Note that from the first issue of 2016, this journal uses article numbers instead of page numbers. See further details here.